
Global Mercury Project
Project EG/GLO/01/G34:
Removal of Barriers to Introduction of Cleaner Artisanal Gold Mining and Extraction Technologies
Technical Report:
A Social-health Perspective of the Miners in Talawaan
and Galangan, Indonesia, 2003
Dr. dr. Rachmadhi Purwana SKM
National Consultant
Sept. 2003
Acknowledgements
The survey involved a number of persons, including staff from the three organizing
institutes, i.e., the Ministry of Energy and Mineral Resources Republic of Indonesia and
United Nations Industrial Development Organization (UNIDO) and the University of
Indonesia, Faculty of Public Health. Those who are directly engaged in the process of
implementing the survey include also local staff of the Office of Energy and Mineral
Resources, Ministry of Energy and Mineral Resources at Manado, North Sulawesi and at
Palangkaraya, Central Kalimantan.
Let me convey my sincerest thanks to those who had in their capacity supported and
helped me in implementing the survey, they are:
:
- The Dean, Faculty of Public Health, University of Indonesia
- Mr. Masayoshi Matshushita, Representative of the United Nations Industrial
Development Organization (UNIDO) for Indonesia
- Dr. Thamrin Sihite, Head of Planning and Foreign Cooperation Bureau, Ministry
of Energy and Mineral Resources Republic of Indonesia
- Drs. Amal R Ginting, PGrad. Dipl. PhD, Planning and Foreign Cooperation
Bureau, Ministry of Energy and Mineral Resources Republic of Indonesia
- Mr. Nahruddin Alie, Programme Officer, the United Nations Industrial
Development Organization (UNIDO), Indonesia
- Local staff of the Office of Energy and Mineral Resources, Ministry of Energy
and Mineral Resources at Manado, North Sulawesi and at Palangkaraya, Central
Kalimantan
- Dr.-Ing. Christian Beinhoff, Project Manager, Cleaner Production and
Environmental Management Branch Programme Development and Technical
Cooperation Division United Nations Industrial Development Organization
(UNIDO)
- Dr. Marcello M. Veiga, Global Mercury Project, Coordination Unit, Vienna,
Austria
I also extend my deepest appreciation to those who had lent a hand to work on the survey
in the field. Last but not the least; let me convey my earnest indebtedness to the
community of miners who were willing to cooperate in making the survey a successful
endeavor.
Dr.dr. Rachmadhi Purwana SKM
Depok, May 30, 2003
i
Executive Summary
The objective of this study was to explore the social- and economic-status and awareness
of the small-scale gold-miners about the harm and danger of using mercury in gold-
mining. This study was in line with the forthcoming comprehensive survey on health
issues of mercury in gold-mining. The study was organized by a coordinative work of the
Department of Energy and Mineral Resources Republic of Indonesia and the United
Nations Industrial Development Organization (UNIDO) with the assistance of the
University of Indonesia, Faculty of Public Health.
The study took place in two islands of Indonesia, the Kalimantan Island and the Sulawesi
Island at the Galangan (Hampalit) Village, Central Kalimantan and in the Talawaan
Village, North Sulawesi from April to May 2003. The Talawaan mining ground is an
underground mining and the Galangan mining area is an alluvial mining type. The two
places are widely occupied by the so called `mining community' a group of miners and
gold collectors with no noticeable legal rights to do the mining business.
A brief survey among the mining community uncovered some information about
sociological structure including the daily activities of the miners, the family, and related
back-ground of their existence in the mining business.
Characteristics of the mining community in the two places (Talawaan and Galangan) are
distinctly different. The mining community at Talawaan is living in groups under shelters
at the mining area without family members being involved while each of the member of
the mining community at Galangan are living in the mining area with their family in their
simple homes with limited provision of basic sanitation facilities. Besides, the group at
Galangan has a longer experience in mining business than that of Talawaan.
In both places, the variety of foods they consumed is meager. Instant noodle, vegetables,
and rice are the most relied on foods for the miners in Galangan. Water supply in
Galangan is mainly from pools of water formed by rain that accumulates in abandoned
mining craters. Other choice of water supply is rain-water and dug-well. The abandoned
mining craters also function as excreta disposal facility. In Talawaan, water for daily use
is obtained primarily from dug-wells, while the main facilities for excreta disposal are
bushes and forest or the rivers and dug-pits. Foods for the mining community in
Talawaan include rice, fish, vegetables, dried fish, instant noodle, and milk.
Dealing with mercury, the miners in Talawaan primary tasks are digging and excavating
ores from underground. They do not directly work with mercury, since amalgamation
process takes place in centers for sluicing operated by gold-collectors. On the other hand,
the miners in Galangan operate sluice-boxes in the mining (dredging) sites and they work
directly with mercury. Besides, the families of the miners in Galangan are potentially
exposed to mercury due to the storage of mercury at their homes. Nevertheless, disposals
of excess mercury both in Galangan and Talawaan create a health and environmental
threat to the community in the vicinity of the mining area.
ii
Table of Content
ACKNOWLEDGEMENTS ..........................................................................................................................I
EXECUTIVE SUMMARY ......................................................................................................................... II
1. Introduction .............................................................................................................................................. 1
2. Talawaan, North Sulawesi ....................................................................................................................... 1
The Mining Site ......................................................................................................................................... 2
A.
Demographic Information (Bio-data).......................................................................................... 4
B.
Household Structure .................................................................................................................... 5
C.
Socio-economic Life ................................................................................................................... 6
D.
Artisanal Mining Information.................................................................................................... 10
E.
Equipment and Inputs................................................................................................................ 11
F.
Property Ownership................................................................................................................... 12
G.
Decision Making on Income and Expenditure .......................................................................... 12
H.
Market ....................................................................................................................................... 12
I.
Training ..................................................................................................................................... 13
J.
Attitude toward Improvement of Mining Technology .............................................................. 14
3. Galangan, Central Kalimantan ............................................................................................................. 15
The Mining Site ....................................................................................................................................... 16
A. Demographic Information (Biodata)................................................................................................... 18
B. Household Structure............................................................................................................................ 22
C. Socio-Economic Life .......................................................................................................................... 24
D. Artisanal Mining Information ............................................................................................................. 28
E. Equipment and Inputs.......................................................................................................................... 29
F. Property Ownership............................................................................................................................. 30
G. Decision Making on Income and Expenditure.................................................................................... 31
H. Market................................................................................................................................................. 32
I. Training ................................................................................................................................................ 33
J. Attitude towards Improvement of Mining Technology........................................................................ 35
4. Conclusion............................................................................................................................................... 36
iii
1. Introduction
The present survey is a preliminary study for a project on the Removal of
Barriers to the Introduction of Cleaner Artisanal Gold Mining Extraction Technologies
run in several countries including, Laos, Indonesia, Brazil, Sudan, Tanzania, and
Zimbabwe. Two sites were selected in Indonesia, the Galangan (Ampalit) in Central
Kalimantan and Talawaan in North Sulawesi.
The two places have seen the intensive small scale mining activities with uncontrolled
disposal of mercury to the environment. In light of the mobile nature of the miners, these
mining activities are important economic factors in the areas and in 2001 as many as
4700 miners and 150 sluicing units from the adjacent Tatelu village were operating in the
Talawaan gold mining site. In the report of 2003 the figures are reduced to 1200 miners
and 58 sluicing units (Report from the Tatelu village office, 2003). Meanwhile, the
Galangan gold mining site has no up to date record of the total miners in the area. An
approximately 12,000 illegal gold miners have been active since the 70s, according to a
recent report (Veiga, Back-to-office Mission-report, UNIDO 2003).
A total of 400 miner-community members from the two sites are sampled in this survey
to explore a collection of data of their family characteristics, basic sanitation of their
homes, mining activities, and some social economic issues. Despite some similarity of
the small scale mining operations in the two sites, the Galangan and the Talawaan show
different characteristics of miner-community working in the two different sites.
For practical reason, in this study the miner-community are presented in two groups, first
as miners, a group of men that mainly rely their work on manual labor and use simple
methods in digging and/or crushing the ore and some do also the sluicing and burning of
the amalgam. Sluicing, and/or burning the amalgam are mostly done by the collectors, the
second group in the miner-community that provides equipments and capital for mining,
collects the gold, and/or collects the amalgam. Collectors may have their sluicing place at
the mining sites or just do the burning of amalgam at their shops outside the mining sites.
2. Talawaan, North Sulawesi
Talawaan is the name of a village in the subdistrict Dimembe, North Sulawesi, Indonesia.
The name stems from the name of a river, the Talawaan River that runs through six other
villages. The village Talawaan is adjacent to the Samratulangi airport near Manado, the
capital city of North Sulawesi Province. According to a report in 2002, the village covers
an area of 14,000 hectares with a population of 3817 inhabitants. The area is a watershed
area for the Talawaan River and 2 other rivers. The Talawaan watershed is primarily
dominated by agriculture and plantation including the rice-field, coconut, cinnamon, and
nutmeg. Downstream areas are dominated by fresh-water fisheries. The watershed area
also accommodates dug-wells for the source of water for the people. This is the place
where the gold mining activity is found.
Of the 200 respondents that are chosen in Talawaan, 182 are miners and 18 are collectors.
Factors around their daily life are studied including their level of educations, dietary
feature, and other social life. Since the miners and collectors in Talawaan are living in
1
groups right over the pits of mining sites no figure of their family is obtained. Other
factors among the miners are practically similar to those among the collectors.
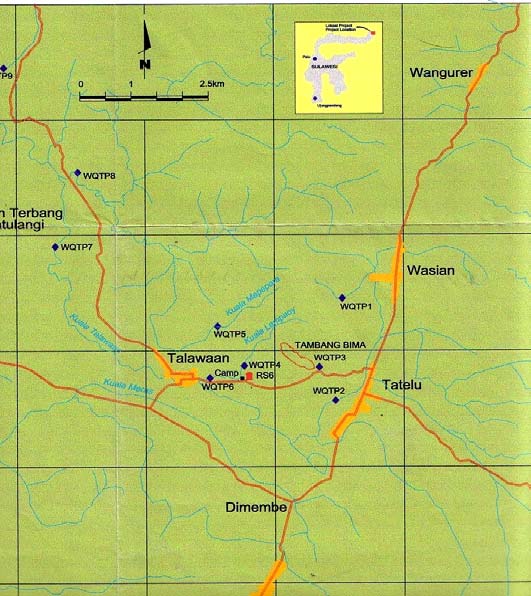
Figure 2-1 The Talawaan Gold Mining Area, 2003
(Source: PT. Tambang Tondano Nusajaya)
The Mining Site
The Talawaan mining site is located in a forest on an approximately 12 hectares stretch of
high-land. Since the spread of story about the presence of gold ore in the area of Tatelu,
by miners of a mining company, since 1998 the operation of the so called people's
mining activity began to flourish in Wasian, Taelu, Tatelu Rondor, Tatelu Warukapas,
Talawaan, Kolongan, and Tetey villages. This is even so due to the close proximity of the
mining area of the company to the paddy field and agricultural areas of the villages. In
the year 2000, 200 units of mining operated in the whole area. This growth of people's
mining activity raises a negative response from local inhabitants that cultivate fisheries
and fruits plantations. The government tried to control the area by restricting the mining
area not closer than 700 meters from the rivers or springs and the villages, but the mining
activity operates uncontrollably. In 2002, the Board for Environmental Impact Control
recorded 3 units of mining points owned by local inhabitants operating in the Talawaan
mining site. At that time at least 100 miners were known working in those places.
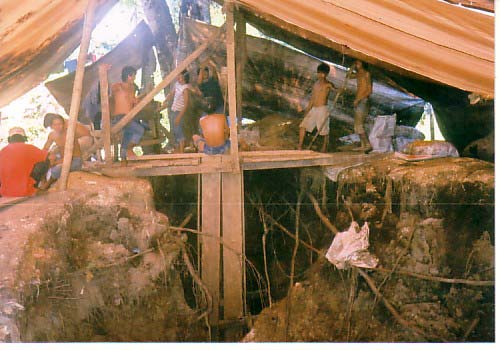
The gold mining site in Talawaan is an underground mining type and is carried out in pits
dug all over the area. A group of men work as a team of approximately 10 persons in
each pit under a shelter built over it. These are the miners. All of the miners are from
local and surrounding areas in Sulawesi. They also do manual crushing of ore taken from
2
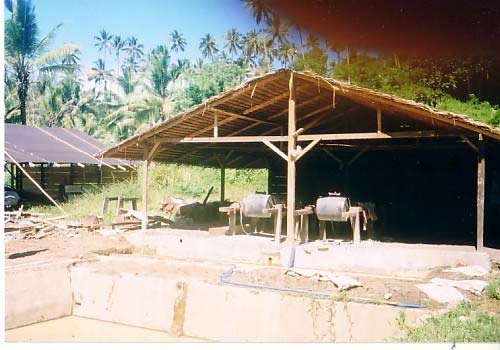
the pit under the shelter. Bags of crude-crushed-ore are sent to sluicing places nearby
where 8 to 12 tumblers powered by generators at each of the sluicing places crush the
crude ore into a finer sand that later is cleaned with mercury to extract gold by the
operators of the tumblers. Water for sluicing is taken from the adjacent creeks and rivers
that run in the vicinity.
Figure 2-2 Activity in a Pit under a Shelter, Talawaan 2003
Figure 2-3 Tumblers in a Sluicing Place, Talawaan, 2003
The cleaning of the finer sand, now called `tailing', is repeated several times (around 7
times) to extract further the remaining gold before it is dump into the creeks that
ultimately run into the Talawaan River.
After the process of amalgamation, to separate gold from mercury, the amalgam will then
be burned either at the site for sluicing where the tumblers operate or at other place by
collectors that have their own shop in the vicinity. At the sluicing site, the whole
operation of amalgam smelting and cleaning of ore are done by men that otherwise
operate the tumblers.
3
A. Demographic Information (Bio-data)
Groups of miners, all male, work in shifts under team leaders. Every team forms a group
of miners working a whole day in an underground hole under a shelter. A group of
miners work for a capital provider (collector) that rents the land sites and provides
operational equipments and facilities on the shared-based production of gold with the
team of miners. As has been mentioned before, some of them also operate sluicing site
and receive ores from their team of miners or from other groups of miners. Fights and
drunks in the area have been reported quite frequently. Fights between the groups are
primarily due to the conflicting of interests on the mining spots.
Age
The miners are young, most of them are 22 years old and half of them are less than 26
years old. On average, their age is approximately 27 years ranging from the youngest of
17 years to the oldest of 56 years. The age average of the collectors is more than 32 years
ranging from the youngest of 21 years to the oldest of 50 years.
Marital Status
They do not reveal their marriage status and in the mining area they live in a group where
all male miners flock together under their shelters and sleep in rows, shoulders to
shoulders. They are either reluctant to speak about their family in their home-villages or
they are just not married. Most of the collectors also live alone in the mining site, only
one of them lives with his family of three persons.
Education
About half of the miners (53.3 %) are educated up to the level of secondary-school and
28.3 % are from the primary-school. Some 18.3 % of the miners have been educated up
to the high-school level. Among the collectors, 44.4 % reach the level of education of
secondary school, 27.8 % high school, and 27.8 % primary school.
Levels of Education of the Miners
(Talawaan, 2003)
Level of Education of the Collectors
60
(Talawaan, 2003)
50
10
40
8
30
6
20
4
10
rcent
cy
e
2
P
0
primary school
high school
equen
Fr
0
secondary school
missing
primary school
secondary school
high school
Levels of Education
Level of education
Figure 2-4 Levels of Education
Some of the miners start working in mining since 1979, but most of them start in 2003. In
the period from 1999 to 2003, 74.0 % of the miners and 76.5 % of the collectors start
their mining business. Their places of origin are villages around the Talawaan mining site
or from other parts of Sulawesi Island. No miners or collectors come from outside
Sulawesi.
4
Table 2-1 Demographic Information of the Miners and Collectors (Talawaan, 2003)
Miners Collectors
Frequency
Percent
Frequency
Percent
N
180
18
Age Distribution (year)
Missing
2
0
Mean
27.11
32.11
Median
26.00
30.50
Mode
22
28
Std.
Deviation
7.18
7.32
Minimum
17
21
Maximum
56
50
Levels of Education
Primary-school
51
28.3
5
27.8
Secondary-school
96
53.3
8
44.4
High-school
33
18.3
5
27.8
Total
180
100.0
18
100.0
Missing
2
0
Work in Mining since
1979--83
6
3.3
2
11.8
1984--88
4
2.2
0
0.0
1989--93
12
6.6
1
5.9
1994--98
25
13.8
1
5.9
1999--03
134
74.0
13
76.5
Total
181
100.0
17
100.0
Missing
1
1
B. Household Structure
Uses of the House
Merely cooking and resting are done in the shelter by 96.2 % of the miners and 94.4 % of
the collectors. The shelters are also used for mercury storage besides cooking, resting,
and washing by 1.8 % of the miner and 5.6 % of the collectors.
Hygiene and Sanitation
The miners and collectors lives in barracks-like shelters; made of tarpaulin with no
partitions, no decent standard home facilities, or specific provision of basic sanitation.
Various facilities for excreta disposal are used in the area, including bush and forest,
lawn, dug-pit, creeks, rivers, and water-sealed latrine. Of all, 53.0% of the miners and
50.0 % of the collectors do it at the bush or sometimes at the forest, dug-pit, and/or
creeks. The dug pits facilitate 18.2 % of the miners and 22.2 % of the collectors for
excreta disposal. Rivers are also used for excreta disposal. Of the miners, 20.1 % prefer
either the Talawaan River or the Tatelu River other than the water-sealed latrine, dug pit,
and/or lawn. Only 8.7 % of the miners and 5.6 % of the collectors really use the water-
sealed latrine for their excreta disposal.
5
Table 2-2 Household Structure of the Mining Community in Talawaan, 2003
Miners
Collectors
Frequency Percent
Frequency Percent
N
182
18
Uses of the house
Rest (sleep), cooking, bath/wash
174
96.2
17
94.4
Amalgam burning, mercury storage
7
3.8
1
5.6
Missing
1
.
0
Hygiene and sanitation (adults)
Water-sealed
latrine
14
8.7
1
5.6
Dug-pit
and
other
33
18.2
4
22.2
Bush and forest and other
96
53.0
9
50.0
Rivers (Talawaan and Tatelu river)
38
20.1
4
22.2
Missing
1
0
C. Socio-economic Life
Earnings
The capital providers or collectors have sluicing places and receive sacks of ore either
from the group of miners they organized or from other relatively free-lance groups of
miners. There is scarce difference of earnings between the collectors and miners, but no
miner informs an earning of more than 2 million rupiahs a month. Out of 17 collectors,
12 persons (70.6 %) earn between half to one million rupiahs every month and 53.7% of
the miners earn the same. Among the miners, 40.7 % earn from Rp 300,000 to Rp500,000
every month.
Expenditure
On average, the main expenditure of the mining community is for food. The miners pay
an average of Rp 170,000 and the collectors Rp 862,500 a month for food. Basically,
food for the miners is supplied by the collectors.
Besides food, the collectors also spend Rp 500,000 for rent and Rp 200,000 a month for
servants. Other expenditure includes clothing, transport, fuel, and medical purposes. A
total average of Rp 372,428.57 is spent by the miners and Rp 1,641,250.00 by the
collectors every month.
6
Table 2- 3 Earning and Expenditure of the Mining Community in Talawaan, 2003
Miners
Collectors
Frequency Percent
Frequency Percent
N
182
18
Earnings/month
Less than Rp 300,000
6
3.4
1
5.9
Rp300,000-500,000
72
40.7
3
17.6
Rp500,000-
1million
95
53.7
12
70.6
Rp 1- 2 million
4
2.3
0
0.0
More than Rp 2 million
0
0.0
1
5.9
Total
177 100.0
17 100.0
Missing
5
1
Average main expenditure per month (Rupiah)
Food
170,000.00
862,500.00
Water
0.00
0.00
School
0.00
0.00
Rent
0.00
500,000.00
Clothing
60,000.00
0.00
Transportation
32,428.57
40,000.00
Fuel
60,000.00
0.00
Servants
0.00
200,000.00
Illness/medicine
50,000.00
38,750.00
Total
372,428.57
1,641,250.00
Water-supply and Water Fetching
Besides the dug-wells, Tatelu River is also used for washing, bathing, and other domestic
purposes. Water for daily use is mainly taken from dug-wells by 98.4% of the miners and
by 94.4 % of the collectors. Two minor sources of water for drinking are rain and spring
waters. It seems that the quality of the water is quite acceptable to the respondents. All
the collectors (100.0%) and most of the miners (98.9 %) use the water for drinking
without doing any water treatment. Water is fetched by 93.8 % of the miners and 83.3 %
of the collectors; the rest of water fetching is done by servants.
Food
The staple food for the mining community in Talawaan is rice, and it is taken every day.
Other than rice, fish is the main source of protein for the miners and collectors. Fish is
taken every day by the collectors and only 3 days in a week by the miners. Most of the
collectors and the miners do not take meat, eggs, and fruits as part of their diet. Both the
collectors and miners take vegetables every day in a week for their diet. At least two
days in a week, most of the collectors and the miners consume dried fish, while instant
noodle is taken by most of the collectors for two days in a week. Milk is consumed by
most of the collectors and miners once a week.
Source of Energy
For fuel, fire-wood is used primarily by both groups. Up to 79.1% of the miners and
83.3% of the collectors use fire wood for cooking and/or boiling water. Others use
alternate fueling of fire wood and kerosene (13.2% of the miners and 5.6 % of the
collectors) and only 6.6 % of the miners (11.1 % of the collectors) use only kerosene.
7
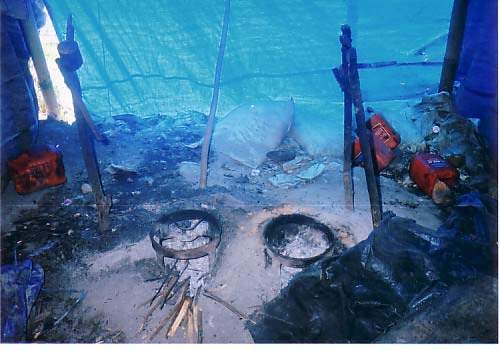
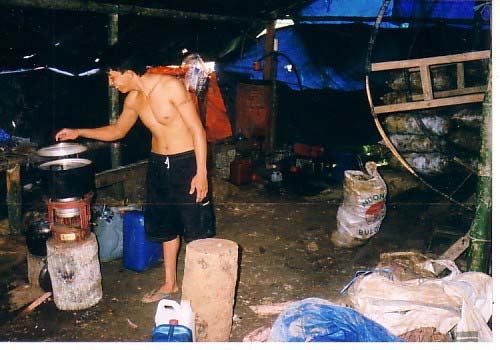
Figure 2-5 Fire-wood Stove at the Mining Site Talawaan, 2003
For lighting, the majority of the community uses the generator. Of the miners 87.8 % use
this facility and so are 94.4 % of the collectors. Kerosene lamp is an alternative of
lighting for 11.6 % of the miners and 5.6 % of the collectors.
Figure 2-6 Kerosene Stove at a Mining Site Talawaan, 2003
Source of General Information
For general information, radio is the most favored mean of information for the mining
community in the mining site of Talawaan. Of them, 63.7% of the miners and 61.1 % of
the collectors say that radio is their most important mean of information. Other sources of
information are newspaper, TV, and/or community leader while 16.5% of the miners and
16.7 % of the collectors say that they do not have any source of information.
8
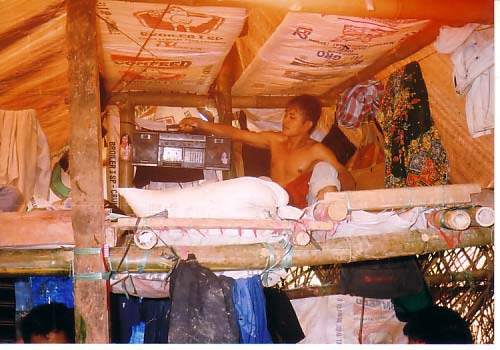
Figure 2-7 A Miner and His Radio, Talawaan, 2003
Table 2- 4 Basic Needs and Information Source of the Mining Community in Talawaan, 2003
Miners
Collectors
Frequency Percent
Frequency Percent
N
182
18
Source of water for...
Domestic use
Dug-well
179
98.4
17
94.4
Rain-water,
dug-well
1
.5
1
5.6
Spring-water
2
1.1
1.1
100.0
Bath/wash
Dug-well
148
82.7
15
83.3
Tatelu
river
27
15.1
1
5.6
Creek
4
2.2
2
11.1
Total
179
100.0
18
100.0
Missing
3
0
Sluicing
None
150
82.4
17
94.4
Tatelu
river
31
17.0
1
5.6
Dug-well
1
0.5
Source of clean water supply
dug-well
180
98.9
17
94.4
spring-water
2
1.1
1
5.6
Treatment of drinking water resources
No
treatment
180
98.9
18
100.0
Sedimentation
2
1.1
0
0.0
Water fetching
Miners/collectors
165
93.8
15
83.3
Servants
11
6.3
3
16.7
Total
176
100.0
18
100.0
Missing
6
0
Diet (days/per week, mode)
Rice
7
7
Fish
3
7
Meat
0
0
Vegetables
7
7
Dried
fish
2
2
Eggs
0
0
Milk
1
1
9
Fruits
0
0
Instant
noodle
0
2
Missing
0
1
Lighting
Kerosene
lamp
21
11.6
1
5.6
Gas
lamp
1
0.6
0
0.0
Generator
159
87.8
17
94.4
Missing
1
0
Fuel for cooking
fire-wood
144
79.6
15
83.3
charcoal
1
0.6
0
0.0
kerosene
12
6.6
2
11.1
fire-wood,
kerosene
24
13.3
1
5.6
Missing
1
0
Information Media
None
30
16.5
3
16.7
Radio
116
63.7
11
61.1
Radio,
TV
6
3.3
1
5.6
Newspaper and/or radio
28
15.4
3
16.7
Community leader & radio
2
1.1
0
0.0
D. Artisanal Mining Information
Working Schedule
The miners work in shifts for 24 hours a day; on average the miners and the collectors
work more than 6 hours a day. The minimum they work is 4 hours a day and the miners
work a maximum of 12 hours while the collectors work a maximum of 8 hours a day.
Mining Association
Mining for the miners and collectors is an occupation of their own choice. They do their
daily work for a period of time in a year. The length of stay in the mining site is highly
variable. During the planting seasons they will go back to their hometown to work in the
plantation either picking the clover or tilling the paddy fields. Except the collective type
of work, in the Talawaan mining site no Mining Association is organized for the mining
community. Support in term of food, mining equipments, generators, and medical
facilities are given by the collectors. Every group that works in a mining hole has one
person as their leader who may also act as a mediator to the collectors in collecting ore
and sharing the profits. No member of the family or other relatives is involved in the
mining work.
Table 2 � 5 Artisanal Mining Information, Talawaan 2003
Miners
Collectors
Working time hour/day
N
178
18
Missing
4
0
Mean
6.29
6.17
Median
6.00
6.00
Mode
6
6
Std.
Deviation
1.16
1.04
Minimum
4
4
Maximum
12
8
10
E. Equipment and Inputs
Mercury
Mercury used for amalgamation is bought from the shops. In doing their daily activities
both the miners and the collectors declare that they do not face serious problem except
some minor difficulty in sluicing, uncertain income, and safety or blackmailing.
Table 2- 6 Equipment and Inputs (Talawaan, 2003)
Miners
Collectors
Frequency Percent Frequency
Percent
N
182
100.0
18
100.0
Source of mercury
Shop
10 100.0
18
100.0
Missing
172
0
Problems in work
None
179
98.4
18
100.0
Sluicing
1
0.5
0
0.0
Blackmail, high risk, safety
1
0.5
0
0.0
Uncertain
income
1
0.5
0
0.0
Effects of mercury on health
Do not know
82
45.1
9
50.0
Respiratory
disease
52
28.6
5
27.8
Skin disease, itch
19
10.4
2
11.1
Mix (skin, hair, respiratory, sight, and/or poisoning)
29
15.9
2
11.1
Effects of mercury on the environment
Do not know
76
41.8
6
33.3
Damaging
the
plants
73
40.1
7
38.9
Soil, sewage, (water) pollution
26
14.3
5
27.8
Mix (plant, soil, water pollution, and/or fish)
7
3.8
0
0.0
Sources of Mercury Information
Just
know
91
50.0
11
61.1
Brochures
7
3.8
0
0.0
Friends
31
17.0
3
16.7
Newspaper
27
14.8
0
0.0
Personal
experience
25
13.7
4
22.2
TV
1
0.5
0
0.0
Health and Environmental Issues
Awareness of the health effect of mercury among the miners varies. Nearly half of them
(45.1%) admit that they do not know what form of damage mercury will do to their
health. The rest have only scanty knowledge that mercury may afflict respiratory system,
skin, eye, hair, or simply causing illness and poisoning.
Mercury Effect towards the environment is also not very popular among the miners.
Approximately half of the miners (41.8 %) state they do not know that mercury has any
effect on the environment. The other half of respondents has scarce knowledge that
mercury may damage plant, water, soil, and fish.
11
Information sources for the miners about mercury are indistinct. Half of the respondents
(50.0%) claim that they just indifferently know (hear-say) about the mercury effects on
health and the environment. Others say that they just know it from brochures (3.8%),
friends (17.0%), newspaper (14.8%), personal experience (13.7%), or television (0.5%).
The collectors also do not think much about mercury effect on health as well as
environment. Fifty percent of them do not know the effect of mercury on health and
33.3% do not know the effect of mercury on the environment. Their knowledge about
mercury effect on health and environment is limited to the ill effects on respiratory tract,
skin, hair, sight, plants, soil, fish, and water. For the collectors, their sources of
information about mercury are vague. They claim that they just know it (61.1 %), or from
their own experience working with mercury (22.2 %) or from friends (16.7 %).
F. Property Ownership
Both the collectors and the miners declare that they do not own the gold pits. With their
present job at the mining site, they are denied of the ownership of livestock, house, farm
equipments, even vehicles.
G. Decision Making on Income and Expenditure
Family expenditure is decided by the 4.0 % of the wives among the miners and 5.6 % of
the wives among the collectors. The rest, the miners and the collectors decide their own
income and expenditure.
Table 2 � 7 Decision Making on Income and Expenditure, Talawaan 2003
Decision-maker on family expenditure
Frequency Percent
Frequency Percent
Respondents
168
96.0
17
94.4
Wife
7
4.0
1
5.6
Total
175
100.0
18
100.0
Missing
7
0
H. Market
Gold Market
All gold produced is sold to the collectors, except one miner that sell gold directly to a
shop. By and large no difficulty is encountered by both the miners and collectors in
selling gold. A minor problem of transportation is mentioned by one miner.
Job Preference
Not all have any particular plan for their future job other than what they have been doing
just now. Only 41.6 % of the miners have a plan to change the present job to other job
namely, their previous job or the alternative job than mining. Most preferred alternative
job for the miners is farming (77.1 %). Commerce and construction are other job
alternatives for 11.2 % of the miners. Of the collectors, 77.8 % do not plan of changing
job and in case that the mining is stopped 88.9 % of them plan to go back to farming and
the rest will have commerce as their job of choice. Most of the miners and all the
collectors admit that they like working in the gold mining. In general, gold mining is only
an alternative job other than their work in the home villages for the miners.
12
Table 2- 8 Market Scheme at Talawaan, 2003
Miners
Collectors
Frequency
Percent
Frequency
Percent
N
182
18
Gold sold to/collected by...
Collector
104
99.0
14
100.0
Shop
1
1.0
0
0.0
Total
105
100.0
14
100.0
Missing
77
4
Problem in selling gold
None
181
99.5
18
100.0
Transportation
1
0.5
0
0.0
Total
182
100.0
18
100.0
Plan of changing job
No plan of changing job
101
58.4
14
77.8
Planning to change job
78
41.6
4
22.2
Total
179
100.0
18
100.0
Missing
3
0
Job alternatives
Do not know
16
8.9
0
0.0
Other mining group/agent
4
2.2
0
0.0
Commerce, construction (carpenter)
20
11.2
2
11.1
Farming
138
77.1
16
88.9
Back to home-land
1
.6
0
0.0
Total
179
100.0
18
100.00
Missing
3
0
Partiality towards gold mining
Dislike
2
1.1
0
0.0
Like
179
98.9
18
100.0
Total
181
100.0
18
100.0
Missing
1
0
I.
Training
Only 2.2 % of the miners admit that they have been trained in mining. The rest, both the
miners and collectors have had no training in mining. Nevertheless, no specific benefit of
training is declared by the respondents and no information of whom has given the
training. Most of the miners and collectors do not show particular interest in training.
Only 2.2 % of the miners mention about the need for training in mining but without any
recommendation to improve the training.
Comments on license, taxation show that the miners and collectors do not care about the
topics. Most of them declare that they do not know about license and taxation. Regarding
hygiene and sanitation, 52.2 % of the miners and 27.8 % of the collectors stated that they
do not know or without any comments on the subjects. However, 46.2 % of the miners
and 66.7 % of the collectors express their concern about hygiene and sanitation. Only
1.6% of the miners and 5.6 % of the collectors are indifferent towards hygiene and
sanitation issues. Nevertheless, pollution issue has got a little attention among the miners
and collectors. Many of the miners (96.2 %) and the collectors (83.3 %) admit that either
they do not know about pollution or just do not have any comment on the issue.
13
Table 2- 9 Training and General Knowledge, Talawaan 2003
Miners
Collectors
Frequency
Percent
Frequency
Percent
N
182
18
Training in mining
no
178
97.8
18
100.0
Yes
4
2.2
0
0.0
Recommendation to improve training
None
178
97.8
18
100.0
Need
for
training
4
2.2
0
0.0
Comments on
License
Do not know/no comment
181
99.5
18
100.0
Concern
1
0.5
0
0.0
Taxation
Do not know/no comment
180
98.9
18
100.0
Concern
2
1.1
0
0.0
Hygiene and sanitation
Do not know/no comment
95
52.2
5
27.8
Indifferent
3
1.6
1
5.6
Concern
84
46.2
12
66.7
Pollution
Do not know/no comment
175
96.2
15
83.3
Indifferent
1
0.5
0
0.0
Concern
3
1.6
2
11.1
Against
3
1.6
1
5.6
J.
Attitude toward Improvement of Mining Technology
Improvement of mining technology issue is readily accepted by 50.0 % of the collectors
and 41.2 % of the miners. Up to 70.3 % of the miners and 72.2 % of the collectors are
willing to learn the new technology. Only 12.6 % of the miners refuse to learn the new
technology.
Demonstration is a form of training preferred by 54.1 % of the miners and 66.7 % of the
collectors. A mix of demonstration and short training is chosen by 35.9 % of the miners
and 33.3 % of the collectors.
Regarding problem that may arise with the new technology, 74.7 % of the miners and
55.6 % of the collectors are certain of not having any problem while 17.0 % of the miners
and 33.3 % of the collectors are worried about the application of or their inexperience in
the new technology. Only 2.2 % of the miners and 11.1 % of the collectors anticipate the
problem of using new equipments.
14
Table 2- 10. Attitude towards Improvement of Mining Technology, Talawaan 2003
Miners
Collectors
Frequency
Percent Frequency
Percent
N
182
18
Comments on Improved Technology
No
comment
92
50.5
9
50.0
Indifferent
15
8.2
0
0.0
Good, accept, interested
75
41.2
9
50.0
Willingness to learn
No
23
12.6
0
0.0
Yes
128
70.3
13
72.2
Indifferent
31
17.0
5
27.8
Form of training
Do not know
11
6.1
0
0.0
Short training
7
3.9
0
0.0
Demonstration
98
54.1
12
66.7
Demo + short training
65
35.9
6
33.3
Total
181
100.0
18
100.0
Missing
1
Problem anticipated in new technology
None
136
74.7
10
55.6
Do not know
11
6.0
0
0.0
Application/inexperience
31
17.0
6
33.3
Use of new equipments
4
2.2
2
11.1
3. Galangan, Central Kalimantan
Galangan or Hampalit Village lies in the Katingan Hilir Subdistrict, District of Katingan,
Central Kalimantan, in Kalimantan Island. The District covers an area of 17,500
kilometers square, where a population of 8056 people or 2172 households dwells in the
Hampalit Village (office of the Hampalit Village, 2003). Agriculture and plantation
dominate the place with, rice, coconut, pepper, clove, rubber, coffee, and variety of other
crops.
15
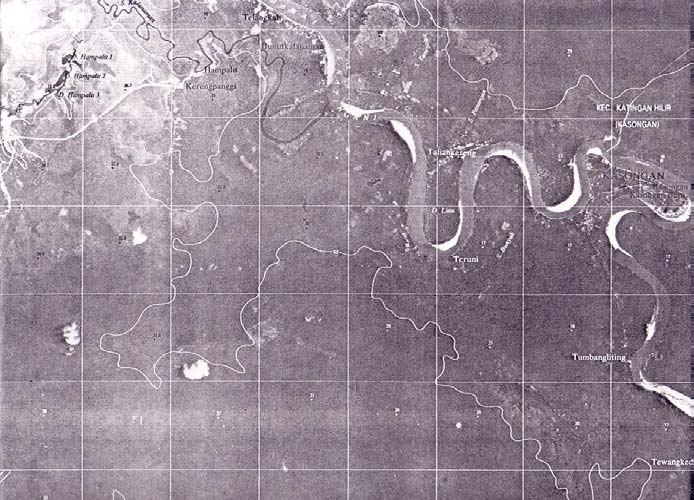
Figure 3-1 Map of Galangan (Hampalit). Central Kalimantan, 2003
Based on the Report in 2002, the Katingan Hilir Subdistrict accommodates 4,648
households with 8,849 male and 8,205 female inhabitants. The district Katingan occupies
11 sub-districts covering a total of 33,143 numbers of house-holds with 120,694
inhabitants (Report of the Bupati of Katingan, 2002).
Table 3-1 Distribution of House-holds by Sub districts in the District of Katingan, 2003
Sub-districts
Number of
Inhabitants
house-hold
male
female
Total
1. Katingan
Kuala
8696
12609
11387
23996
2. Mendawai
1998
4012
3153
7165
3. Kamipang
1676
3341
3135
6476
4. Tasik
Payawan
1553
3084
2836
5920
5. Katingan
Hilir
4648
8849
8205
17054
6. Twg. S. Garing
2183
4452
4157
8609
7. Pulau
Malan
1614
3185
3172
6357
8. Katingan
Tengah
4447
9600
8424
18024
9. Sanaman-Mantikel
2968
6437
5895
12332
10. Marikit
1336
2795
2626
5421
11. Katingan
Hulu
2024
4716
4624
9340
Total
33143
63080
57614
120694
Source: Report of the Bupati of Katingan, 2002
The Mining Site
The Galangan or Hampalit mining site is an alluvial gold mining type. Mining is carried
out in a sandy area among gravels and rocks where man-made craters are spread all over
the place. At present, approximately 500 units are operating in the place with 2500
persons involve in the mining business (Ginting, 2003). The place lies approximately 100
km from the Palangkaraya city, the capital of Central Kalimantan. The nearest place to
16
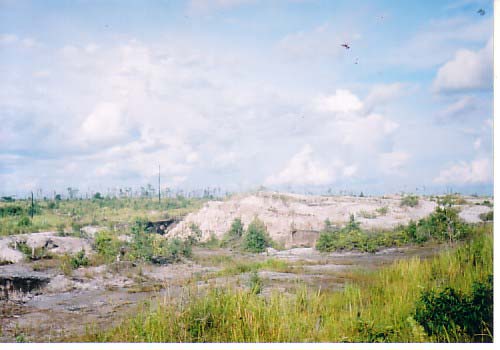
the mining site is Kereng Pangi, a small town for around 10,000 inhabitants that lies
around 7 km from Galangan (Veiga, Back-to-office Mission-report, 2003).
Every day in each of the crater, a group of 4 � 5 men work as a team of miners in a
hollow ground they make under the open air. Mud, sand, gravels, and rocks in the crater
are dredged with jet of water pumped by a diesel pump. They also do manual crushing of
ore at the site. Their working schedule is relatively stable. All the mining activity is done
during the day with no shift-work during the night. The miners and collectors are
available for survey after their working hours. Nights at the Galangan mining site are
tough time when gambling, drinking, prostitution, and fighting take over.
Figure 3-2 The Galangan Gold Mining Area, 2003
17
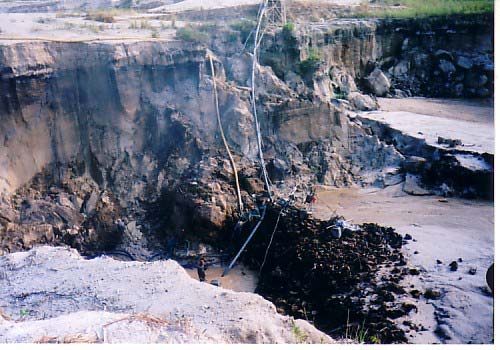
Figure 3- 3 Dredging in a Gold-mine Crater, Galangan 2003
A. Demographic Information (Biodata)
Age
All the head of the household interviewed are male; they incorporate the collectors and
miners. The collectors are mostly mature; they are on average 35 years old, ranging from
the youngest of 20 years to the oldest of 55 years. Most of the miners are 25 years old,
ranging from the youngest 17 to the oldest 60 years.
Age of husband/respondent (miners)
Age of husband/respondent (collectors)
Galangan 2003
Galangan 2003
80
20
60
40
10
c
y 20
y
enc
quen
r
e
r
equ
F
0
F
0
17 - 26 year 27 - 36 year 37 - 46 year 47 - 56 year 57 - year
17 - 26 year
27 - 36 year
37 - 46 year
47 - 56 year
age of husband/respondent
age of husband/respondent
Figure 3 � 4 Age of the Head of the Family
Marital Status
Of the miners, 19.0 % claim that they live with no wife and of the collectors 25.6 %
claim the same. Of all, 3.8 % of the miners' wives and 16.7 % of collector's wives are
pregnant. One family (2.4 %) of the collectors and 7 families (4.5 %) of the miners have a
baby at their homes.
Number of Children
Most of the collectors and the miners have a three-person family-size. The maximum
family-size of the miners is 10 persons and the collectors' is 8 persons. Some of the
collectors and the miners have children aged less than 3 years and 5 years; one, two, or
up to three children in a family.
18
Highest Level of Education
About half of the collectors (45.2%) are of the level of primary-school and 14.3 % are
from the secondary-school. Approximately one third of the collectors (38.1 %) of the
collectors get the high-school level of education. The majority of the miners (64.5%) get
the primary-school level of education. Only 27.6 % are from the secondary-school.
Education of the Gold Col ectors
Education of the Workers
Galangan, 2003
Galangan, 2003
30
120
100
20
80
60
y 10
y 40
enc
enc 20
r
equ
r
equ
F
0
F
0
primary school
high school
none
secondary school
academy
secondary school
academy
primary school
high school
Levels of education
Levels of education
Figure 3 � 5 Levels of Education
The levels of education of the miners' spouse are primary-school (72.5 %), Secondary-
school (24.8 %), and High-school (2.8 %). Compared to the worker's, the spouses of the
gold collector are more evenly distributed in term of education. Their levels of education
are primary-school (38.2 %), secondary-school (35.3 %), and high-school (26.5 %).
Formal education scheme for the children at the mining site of Galangan varies from the
level of primary-school, secondary-school, and high-school. Among the collectors, there
is one child that has a higher-education.
Length of Stay and Place of Origin
The miners and collectors of Galangan are quite well experienced in mining. Some of
them have been working in mining business since 1993 and most of them start their
career at the Galangan site since 2002, a year that reflects a beginning of significant
increase of mining activity at that place.
Unlike the mining community in Talawaan, who comes from the surrounding areas, the
mining community in Galangan includes villagers from local provinces of the
surrounding areas of Kalimantan (51.5 %) and migrants from Jawa and Sulawesi Islands.
Of the miners, there are 52.6 % miners from outside Kalimantan and 47.4 % miners from
places in Kalimantan working in the mining site of Hampalit. Among the collectors, most
of them (66.7 %) are from Kalimantan, only 33.3 % of the collectors are from outside
Kalimantan.
19
Starting Year of Work in Mining
Galangan, 2003
50
40
30
20
y
10
r
equenc
F
0
1993
1995
1996
1997
1998
1999
2000
2001
2002
2003
work in mining since.. (year)
Figure 3- 6 Starting Years of Work
Table 3-2 Demographic Information of the Collectors and Miners (Galangan, 2003)
Collectors
Miners
Frequency
Percent
Frequency
Percent
N
42
157
Age Distribution (husbands, year)
Mean
34.95
31.71
Median
35.00
30.00
Mode
35
25
Std.
Deviation
7.78
7.97
Minimum
20
17
Maximum
55
60
Missing
0
1
Range
17 - 26 year
6
14.3
44
28.2
27 - 36 year
19
45.2
75
48.1
37 - 46 year
14
33.3
27
17.3
47 - 56 year
3
7.1
6
3.8
57 � 60 year
0
0.0
4
2.6
Total
42
100.0
156
100.0
Missing
0
1
Family:
Children under 3yrs
none
35
83.3
129
82.7
1
child
7
16.7
26
16.7
2
children
0
0.0
1
0.6
Total
42
100.0
156
100.0
Missing
0
1
Children under 5yrs
None
33
78.6
121
77.6
1
child
8
19.0
30
19.2
2
children
0
0.0
4
2.6
3
children
1
2.4
1
0.6
Total
42
100.0
156
100.0
Missing
0
1
Levels of Education
Husbands
None
0
0.0
1
0.7
20
Primary-school
19
45.2
98
64.5
Secondary-school
6
14.3
42
27.6
High-school
16
38.1
10
6.6
Academy
1
2.4
1
0.7
Total
42
100.0
152
100.0
Missing
0
5
Wives
Primary-school
13
38.2
79
72.5
Secondary-school
12
35.3
27
24.8
High-school
9
26.5
3
2.8
Total
34
100.0
109
100.0
Missing
8
48
1st child
None
10
40.0
58
73.4
Primary-school
8
32.0
16
20.3
Secondary-school
4
16.0
4
5.1
High-school
2
8.0
1
1.3
Higher-education
1
4.0
0
0.0
Total
25
100.0
79
100.0
Missing
17
78
2nd child
None
6
14.3
16
69.6
Primary-school
6
40.0
6
26.1
Secondary-school
1
6.7
0
0.0
High-school
2
13.3
1
4.3
Total
15
100.0
23
100.0
Missing
27
134
3rd child
None
2
28.6
2
40.0
Primary-school
3
42.9
3
60.0
Secondary-school
2
28.6
0
0.0
Total
7
100.0
5
100.0
Missing
35
152
4th child
None
1
25.0
1
50.0
Primary-school
2
50.0
1
50.0
Secondary-school
1
25.0
0
0.0
Total
4
100.0
2
100.0
Missing
38
155
Family-size (persons)
Mean
3.38
2.92
Median
3.00
3.00
Mode
3
3
Std.
Deviation
1.72
1.52
Minimum
1
1
Maximum
8
10
Missing
0
1
Pregnancy
No
mother/wife
8
19.0
40
25.6
Pregnant
7
16.7
6
3.8
Not
pregnant
27
64.3
110
70.5
Total
42
100.0
156
100.0
21
Missing
0
1
Total babies
None
41
97.6
149
95.5
1
baby
1
2.4
7
4.5
Total
42
100.0
156
100.0
Missing
0
1
Work in mining since... (year)
1993 -- 1998
21
13.4
1999 -- 2003
135
86.6
Total
156
100.0
Missing
0
1
Place of origin
Kalimantan
28
66.7
74
47.4
Outside
Kalimantan
14
33.3
82
52.6
Total
42
100.0
156
100.0
Missing
0
1
B. Household Structure
The living pattern of the mining community in Galangan is different from that in
Talawaan. While the Talawaan mining community lives apart from their family, most of
the mining community in the Galangan mining site lives with their family either at homes
away from their working place or right at the mining locations.
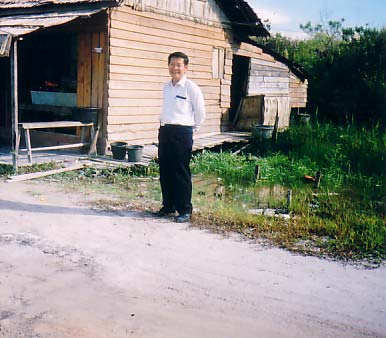
Figure 3 � 7 A house at the Galangan mining site, 2003
Place of Living
Only 26.6 % of the miners and 12.2 % of the collectors claim that they stay at the mining
site. A majority of the mining community choose to live with their family at homes
located in various distances from the mining locations. On average, the miner's homes
are closer to the mining sites than those of the collectors'. The average distance of the
miner's homes is 391 meters with a maximum of 2 kilometers and the average distance of
the collector's homes is 4.592 kilometers with a maximum of 25 kilometers from the
mining sites. Of all, most of the mining community lives at the distance of 100 meters
from the mining sites.
22
Home-Mining Site Distance (Miners)
Home-Mining Site Distance (Collectors)
Galangan (Hampalit). 2003
Galangan (Hampalit), 2003
40
8
30
6
20
4
10
2
equency
equency
Fr
0
Fr 0
.1
.2
.3
.4
.5
1.0
1.2
1.5
2.0
.1
.2
.5
1.0
1.5
3.0
4.0
9.0
10.0
25.0
home-mine distance (km)
home-mine distance (km)
Figure 3-8 Distance of the Mining Site from Place of Living
Uses of the House
The use of some of these houses is for mercury storage and amalgam burning which
causes a potential problem of mercury exposure to the family. Besides functioned as a
place for daily activities (rest/sleep, cooking, and washing) and for children, 81.0 % of
the collectors' house and 48.7 % of the miners' house also serve as places to store
mercury and/or amalgam burning.
Hygiene and Sanitation
Provision of basic sanitation is also poor. Most of excreta disposal of the adults (73.5 %)
and children (78.3 %) among the miners are done at abandoned craters which are filled
by rain water. Bushes, forests, lawns, and rivers are substitute places for excreta
disposal. Besides bushes, forests, and rivers, abandoned craters for excreta disposal are
also used by adults (40.5 %) and children (25.8 %) among the collectors. However, the
main facility for excreta disposal among the collectors is water-sealed latrines. Water-
sealed latrines are used by 50.0 % of adults and 61.3 % of children of this group. None of
the adults and children of the collectors use the lawn for excreta disposal.
Table 3 � 3 House-hold Structure of the Collectors and Miners in Galangan Mining Site, 2003
Collectors
Miners
Characteristics Frequency Percent Frequency Percent
N
42
157
Place of living
Home
36
87.8
113
73.4
Mining-spot
5
12.2
41
26.6
Total
41
100.0
154
100.0
Missing
1
3
Home-Mining site distance (km)
N
36
113
Missing
6
44
Mean
4.592
.391
Median
3.500
.200
Mode
0.1
0.1
Std.
Deviation
5.303
.437
Minimum
0.1
0.1
Maximum
25.0
2.0
Home use for:
Rest (sleep), cooking, bath/wash
8
19.0
95
51.3
23
Children
Mercury storage and other daily
34
81.0
60
48.7
activities
Total
42
100.0
155
100.0
Missing
0
2
Excreta disposal
Adults
Water-sealed
latrine
21
50.0
0
0.0
Abandoned
crater
17
40.5
112
72.3
Bush/forest
2
4.8
39
25.1
Lawn
0
0.0
2
1.3
River
2
4.8
2
1.3
Total
42
100.0
155
100.0
Missing
0
2
Children
Water-sealed
latrine
19 61.3
0
0.0
Abandoned
crater
8
25.8
72
78.3
Bush/forest
2
6.5 17
18.4
Lawn
0
0.0 2
2.2
River
2
6.5 1
1.1
Total
31 100.0
92
100.0
Missing
11
65
C. Socio-Economic Life
Earning
There is a distinct difference of earnings between the collectors and the miners. Out of 41
collectors interviewed, 25 collectors (61.0 %) claim income of more than 2 million rupiah
every month, while 58.4 % of the miners earn between 500,000 and 1 million rupiah
every month. Among the collectors none has an earning in a month less than 500,000
rupiah, but earnings less than 300,000 rupiah in a month is found among the miners.
Expenditure
The main expenditure of the family of the mining community in Galangan is for food.
Among the miners, 72.3 % of the expenditure is for food while the collectors spend 76.5
% of the expenditure for food.
Water-supply
The use of abandoned craters for excreta disposal poses a potential health problem.
Besides rain water and water from the river, 57.6 % of the miners collect water for
drinking and daily use from the abandoned craters. Water from abandoned craters is
also used by 19.1% of the collectors.
Nevertheless, there are alternatives of water sources in the Galangan gold mining site.
Dug-wells and rivers are also used for water supply source by 21.5 % of the miners and
21.4 % of the collectors. Commercially available bottled water is also used alternately
with other means of water supply by 20.3 % of the miners and 28.6 % of the collectors.
24
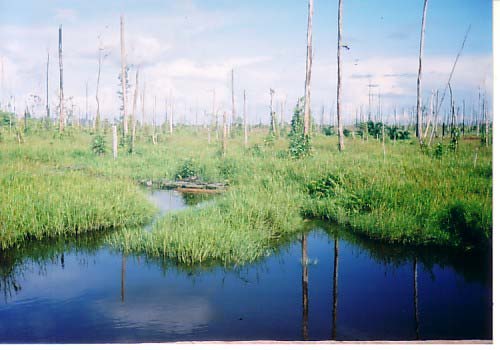
Figure 3 � 9 Abandoned Mining Crater used as a Source of Water-supply, Galangan, 2003
Regarding water quality, 78.0 % of the collectors and 78.8 % of the miners are aware of
the poor quality of the water supply. They claim that the water is not as clear as it
should be. Sedimentation of water is done by 65.9 % of the collectors and 71.8 % of the
miners. Some even go on to the treatment of water with sand filtration and coagulation.
In relation to the water quality, boiling water before its consumption is considered a
necessity among the mining community in Galangan. All respondents say that they boil
the water for drinking.
Water Fetching
The sources of water are not significantly distant from the dwellings. Usually, fathers
take the responsibility of fetching the water. Among the collectors, water fetching is done
by 35.9 % of fathers, while among the miners the task is done by 46.8 % of fathers.
Mothers take part in water fetching in 17.9 % of the collectors. Some of the water
fetching also involves boys, girls, and/or servants.
Food
Most frequent foods consumed by the miners are vegetables, instant noodle, and rice
(staple food). Other choice of foods taken by the miners and their family are fish and
dried fish. Meat, milk, egg, and fruits are scarcely consumed. Among the collectors, most
frequent foods consumed are fish, vegetables, dried fish, eggs, milk and rice. Meat is
eaten scarcely while fruits and instant-noodle are not favorite foods.
Source of Energy
Source of energy for the household is meant for cooking and lighting. Fuel for cooking
varies in Galangan. For cooking, kerosene is the main fuel besides fire wood and
charcoal. Kerosene is used by 88.1 % of the collectors and 47.4 % of the miners. Fuel
alternative is fire-wood taken from the surrounding places. An alternate use of fire-wood
and kerosene for fuel is done by 30.1 % of the miners and 7.1 % of the collectors. Fire-
wood alone is used by 19.9 % of the miners. Other types of fuel for cooking are charcoal
and gas.
25
For lighting, kerosene lamp is the most favored lighting among the miners and electric
generators is the most favored among the collectors. Kerosene lamps are used by 57.7 %
of the miners and generators are used by 61.9 % of the collectors. Among the miners,
14.7 % use pressured kerosene lamp for lighting.
Source of General Information
For general information and communications, community leader and/or radio, TV, and
newspaper play a dominant role for the collectors and miners in the community. Among
the collectors, 58.5 % claim that their main source of information and communication are
community leader. In the miners group, 58.7 % of them claim community leaders as
their source of information and communications. Radio is also a potential source of
information (18.1 %). But, another 18.1 % of the miners claim that they have no source
of information.
Table 3 � 4 Socio-economic Life of the Collectors and Miners at Galangan, 2003
Socio-economic Characteristics
Collectors
Miners
Frequency
Percent
Frequency
Percent
N
42
157
Earning/month
less than Rp 300,000
0
0.0
3
1.9
Rp300,000-500,000
0
0.0
16
10.4
Rp500,000-
1million
4
9.8
90
58.4
Rp 1- 2 million
12
29.3
31
20.1
more than Rp 2 million
25
61.0
14
9.1
Total
41
100.0
154
100.0
Missing
1
3
Average main expenditure/month (Rupiah)
Food
1,905,142.86
76.5 423,065.69
72.3
Water
77,857.14
3.1
0
0.0
School
30,000.00
1.2
5,802.92
1.0
Transportation
200,000.00
8.0
62,992.70
10.8
Fuel
197,142.86
7.9
69,514.71
11.9
Illness/medicine
81,428.57
3.3
23,649.64
4.0
Total
2,491,571.43
100.0 585.025.66
100.0
Missing
7
20
Source for drinking-water
Abandoned crater and/or rain, river
8
19.1
90
57.6
Dug-well and/or rain, river, abandoned
9
21.4
33
21.5
Crater
Rain,
water-pump
9
21.4
1
0.6
Bottled-water and/or rain, river,
12
28.6
32
20.3
abandoned crater,
dug-well
Tap
and/or
water-pump
4
9.5
0
0.0
Total
42
100.0
156
100.0
Missing
0
1
Drinking-water needs clearance
No
9
22.0
33
21.2
Yes
32
78.0
123
78.8
Total
41
100.0
156
100.0
Missing
1
1
Treatment of Drinking water Resources
No
treatment
7
17.1
33
21.2
Sedimentation
27
65.9
112
71.8
26
Sediment
with
sand-filtration
1
2.4
0
0.0
Coagulant
with/without
sedimentation
6
14.6
11
7.1
Total
41
100.0
156
100.0
Missing
1
1
Water fetching
Father
14
35.9
72
46.8
Mother
7
17.9
0
0.0
Father and/or mother
7
17.9
43
27.9
Boys and/or girls, father, mother, servants
11
28.3
39
25.3
Total
39
100.0
154
100.0
Missing
3
3
Diet (days/per week, mode)
Fish
7
2
Meat
1
0
Vegetable
7
7
Dried
fish
7
3
Egg
7
0
Milk
7
0
Fruits
0
0
Instant
noodle
0
7
Rice
7
7
Fuel for cooking
Kerosene
37
88.1
74
47.4
Fire-wood,
kerosene
3
7.1
47
30.1
Fire-wood
0
0.0
31
19.9
Charcoal,
kerosene
1
2.4
2
1.3
Charcoal
0
0.0
1
0.6
Gas,
kerosene
1
2.4
0
0.0
None
0
0.0
1
0.6
Total
42
100.0
156
100.0
Missing
0
1
Lighting
Kerosene
lamp
8
19.0
90
57.7
Pressured kerosene lamp
4
9.5
23
14.7
Kerosene & pressured kerosene lamp
0
0.0
3
1.9
Liquid Pressured Gas lamp
0
0.0
1
0.6
Generator
26
61.9
19
12.2
Generator & kerosene lamp
4
9.5
20
12.8
Total
42
100.0
156
100.0
Missing
0
1
Source of Information/Communication
Community leader and other
24
58.5
91
58.7
Radio and other
8
19.5
36
23.2
TV and other
7
17.1
0
0.0
Handphone and other
2
4.9
0
0.0
None
0
0.0
28
18.1
Total
41
100.0
155
100.0
Missing
1
2
27
D. Artisanal Mining Information
Working Schedule
On average, the miners work at the mining site about 7 hours a day. They do not work at
night. They start the work in the morning until evening. Some of the miners may work
only for two hours and some up to 9 hours in a day while the collectors work at least for 6
hours with a maximum of 10 hours a day. In the evening they return home.
Mining Association
With the exception of some miners that are motivated by their relative and the capital
provider, 93.5 % of the miners and all the collectors have chosen the mining business by
their own. Additionally, they do not belong to any Mining Association since no such
association exists in the site. Hence no support whatsoever is given them by any
association. Every group that works in a mining crater has one person as the leader or
collector. The collectors collect the gold amalgam (bullion) and sell it to the gold shops in
the town of Kereng Pangi and/or Kasongan.
In their daily activity, some member of their family are involved in the mining business
including wife and son or daughter (5.7 % of the miners and 5.0 % of the collectors), son
(2.5 % of the miners), relative (31.2 % of the miners and 5.0 % of the collectors), and
seasonal employers (8.3 % of the miners and 7.5 % of the collectors). On the other hand,
51.6 % of the miners and 82.5 % of the collectors work by their own.
Table 3 � 5 Artisanal Mining Information of the Collectors and Miners of Galangan, 2003
Collectors
Miners
Frequency Percent Frequency Percent
N
42
157
Working hours/day
Mean
7.13
7.18
Median
6.50
8.00
Mode
6
8
Std.
Deviation
1.28
1.71
Minimum
6
2
Maximum
10
9
Total
40
145
Missing 2
12
Motivation to work in mining
Self-decision
40
100.0
145
93.5
Relative
0
0.0
9
5.8
Equipment
owner
0
0.0
1
0.6
Total
40
100.0
155
100.0
Missing 2
2
Persons employed/working in the enterprise
Nobody
33
82.5
81
51.6
Wife and/or son, daughter
2
5.0
9
5.7
Son
0
0.0
4
2.5
Relative
2
5.0
49
31.2
Seasonal
employment
3
7.5
13
8.3
Total
40
100.0
156
99.4
Missing
2
1
28
E. Equipment and Inputs
Mercury
Miners obtain mercury primarily from the collectors (74.5 %) or shops (25.5 %) in the
vicinity. In doing their daily activities most of the miners claim that they do not face any
problem. Some of the miners complain of equipment (10.4 %), uncertain level of income
(7.8%), change of mine locations and/or some other problems (10.4 %). For the
collectors, 69.0 % of them do not have any problem in their work, 26.2 % feel the
problem of uncertainty income and 4.8 % have the problem of capital and cost.
Health and Environmental Issues
Awareness of the danger of mercury seems very low among the miners. Up to 86.5 % of
them do not know the danger of mercury on health. Also, 82.8 % of the miners do not
aware of the effect of mercury on environment. Other miners are aware of scarce
information about mercury causing illness and poisoning besides ill-effect on blood, skin,
eye, and hair. To the environment they also know that mercury may damage plants and
pollute water.
Information on Mercury
The existing source of information on mercury is not effective for the miners. Most of
the miners (82.7 %) stated indifferently that they just know about all those effects of
mercury on health and environment. Information about mercury also comes from
brochures, friends, personal experience, TV, nurse, and village authority.
Table 3 � 6 Equipment and Inputs of the Miners (Galangan, 2003)
Collectors
Miners
Frequency
Percent
Frequency
Percent
N
42
157
Problems in work
None
29
69.0
110
71.4
Equipment
0
0.0
16
10.4
Change of location etc.*
0
0.0
16
10.4
Uncertain
income
11
26.2
12
7.8
Capital,
cost
2
4.8
0
0.0
Total
42
100.0
154
100.0
Missing
0
3
Effects on Health
Do not know
36
87.8
135
86.5
Blood,
hair
1
2.4
1
.6
Skin disease, itch
0
0.0
2
1.3
Eye
damage
0
0.0
1
.6
Illness,
poisoning
4
9.8
17
10.9
Total
41
100.0
156
100.0
Missing
1
1
Effects on the Environment
Do not know
40
97.6
130
83.3
Damaging
the
plants
0
0.0
16
10.3
Sewage, (water) pollution
1
2.4
10
6.4
Total
41
100.0
156
100.0
Missing
1
1
Source of Mercury Information
Nobody
34
82.9
129
82.7
29
Brochures
1
2.4
3
1.9
Friends
1
2.4
15
9.6
Personal
experience
1
2.4
2
1.3
TV
0
0.0
4
2.6
Nurse
1
2.4
1
.6
Village
authority
3
7.3
2
1.3
Total
41
100.0
156
100.0
Missing
1
1
* including cost, water, high-risk, black-mailing, health, transport, technical know-how, engine trouble, and/or change of
location
F. Property Ownership
Gold Pit
Among the miners, 71.0 % claim that they rent the gold pit they work on and among the
collectors 23.1 % claim the same. On the other hand, 30.8 % of the collectors and 1.4 %
of the miners claim the gold pit as their own property, 2.6 % of the collectors and 0.7 %
of the miners claim they hold the license to work on the gold pit, but 26.8 % of the
collectors and 43.6 % of the miners admit they do not own the gold pit.
Livestock
The majority of the mining community in Galangan does not own any livestock. Up to
97.4% of the collectors and 90.5 % of the miners claim that they do not own any
livestock.
House
Of the miners, 78.8 % of them own their houses while 89.7 % of the collectors also own
their houses. Only 5.1 % of the collectors and 8.0 % of the miners claim that they rent
their houses and 5.1 % of the collectors and 13.1 % of the miners claim that they just live
in their present houses without any proof of ownership.
Farm Equipments and Vehicle
Farm equipments are claimed as their personal property only by 10.2 % of the collectors
and 2.6 % of the miners. The rest stated that they do not have any farm equipments.
Regarding vehicles, 74.4 % of the collectors have motor vehicles for their own use but
only 24.1 % of the miners claim the same.
30
Table 3-7 Property Ownership, Galangan 2003
Collectors
Miners
Ownership of:
Frequency Percent
Frequency Percent
N
42
157
Gold -pit
None
17
43.6
37
26.8
Rent
9
23.1
98
71.0
License
1
2.6
1
0.7
Own/property
12
30.8
2
1.4
Total
39
100.0
138
100.0
Missing
3
19
Livestock
None
38
97.4
124
90.5
Own/property
1
2.6
13
9.5
Total
39
100.0
137
100.0
Missing
3
20
House
None
2
5.1
18
13.1
Rent
2
5.1
11
8.0
Own/property
35
89.7
108
78.8
Total
39
100.0
137
100.0
Missing
3
20
Farm equipment
None
38
97.4
123
89.8
Own/property
1
2.6
14
10.2
Total
39
100.0
137
100.0
Missing
3
20
Vehicle
None
10
25.6
104
75.9
Own/property
29
74.4
33
24.1
Total
39
100.0
137
100.0
Missing
3
20
G. Decision Making on Income and Expenditure
Not all about income and expenditure are decided by the husband alone. Only 43.8 % the
husband among the miners and 48.8 % among the collectors decide by themselves about
income and family expenditure. In some family of the miners, decision about income and
expenditure may be done together with the wife (29.4 %), or together with the wife and
the elderly (5.2 %). In other family this decision is made only by the wife (18.3 %) or
together with the elderly (2.6 %) or by the husband and the elderly (0.7%). These figures
are not so much different in the group of the collectors. Decision about income and
expenditure may be done together with the wife (19.5 %), or together with the wife and
the elderly (2.4 %). In other family of the collectors this decision is made by the wife
alone (22.0 %) or together with the elderly (2.4 %) or by the husband and the elderly
(4.9%).
31
Table 3-8 Decision-making on Family Income and Expenditure, Galangan Mining Site 2003
Collectors
Miners
Frequency
Percent
Frequency
Percent
Husband 20
48.8
67
43.8
Wife
9
22.0
28
18.3
Husband and wife
8
19.5
45
29.4
Husband and elderly
2
4.9
1
0.7
Wife and elderly
1
2.4
4
2.6
Elderly, husband, and wife
1
2.4
8
5.2
Total 41
100.0
153
100.0
Missing
1
4
N
42
157
H. Market
Gold Selling and Problems
All the collectors claim that they sell the gold to the shops while 97.7 % of the miners do
the same. In selling gold 74.8 % of the miners and 87.8 % of the collectors do not face
any problem; minor problem seen by the miners and collectors include the price, the long
distance of the place to sell the gold, and the difficulty of transportation.
Job Preference
Out of all respondents, 62.2 % of the miners and 53.7 % of the collectors do not plan to
change their present job for other job. Most of the miners and the collectors like their
present job in mining. In case that the mining business stops, job alternatives chosen by
the miners include commerce and carpenter (36.5 %), farming (7.0 %), or finding other
mining group (3.2 %). As for the collectors, commerce is the alternative job for 48.8 % of
them. Most of the miners (53.2 %) and 51.2 % of the collectors do not know what other
job is waiting for them; a suggestion that they have no alternative other than the mining
business.
Table 3-9. Market Scheme at Galangan, 2003
Collectors
Miners
Frequency
Percent
Frequency
Percent
N
42
157
Gold sold to/collected by...
Shop
27
100.0
130
97.7
Collector/group
leader
0
0.0
3
2.3
Total
27
100.0
133
100.0
Missing
15
24
Problem in selling gold
None
36
87.8
116
74.8
Transportation
1
2.4
8
5.2
Long
distant
0
0.0
1
.6
Price
4
9.8
30
19.4
Total
41
100.0
155
100.0
Missing
1
2
Plan of changing job
No plan of changing job
22
53.7
97
62.2
Planning to change job
19
46.3
59
37.8
Total
41
100.0
156
100.0
Missing
1
1
32
Job alternatives
Do not know
21
51.2
83
53.2
Other mining group/collector
0
0.0
5
3.2
Commerce
and/or
carpenter*
20
48.8
57
36.5
Farming
0
0.0
11
7.0
Total
41
100.0
156
100.0
Missing
1
1
Partiality towards gold mining
Dislike
1
2.4
8
5.1
Like
40
97.6
148
94.9
Total
41
100.0
156
100.0
Missing
1
1
* Only commerce for the collectors
I. Training
No miners and collector have been trained in mining. Therefore, it is not surprising that
84.5 % of the miners and 80.0 % of the collectors have no recommendation to improve
any training in mining while 15.5 % of the miners and 20.0% of the collectors express
their need in training.
33
Table 3-10. Training and General Knowledge, Galangan 2003
Collectors
Miners
Frequency
Percent
Frequency Percent
N
42
157
Training in mining
No
40
100.0
155 100.0
Yes
0
0.0
0
0.0
Total
40
100.0
155 100.0
Missing
2 2
Recommendation to improve training
None
32
80.0
131
84.5
Need
for
training
8
20.0
24
15.5
Total
40
100.0
155 100.0
Missing
2 4.8
2
Comments on
License
Do not know/no comment
3
7.5
69
44.5
indifferent
0
0.0
1
0.6
Concern
37
92.5
85
54.8
Total
40
100.0
155 100.0
Missing
2 2
Taxation
Do not know/no comment
3
7.5
83
53.5
Concern
37
92.5
72
46.5
Total
40
100.0
155 100.0
Missing
2 2
Hygiene and sanitation
Do not know/no comment
4
10.0
48
31.0
Indifferent
0
0.0
20
12.9
Concern
36
90.0
87
56.1
Total
40
100.0
155 100.0
Missing
2 2
Pollution
Do not know/no comment
16
40.0
120
77.9
Indifferent
1
2.5
0
0.0
Concern
0
0.0
3
1.9
Against
23
57.5
31
20.1
Total
40
100.0
154 100.0
Missing
2 3
Licensing and taxation are well concerned by 92.5 % of the collectors. Among the
miners, 54.8 % of them do concern about licensing but 44.5 % do not know about the
issue. About hygiene and sanitation, 56.1 % of the miners and 90.0 % of the collectors
stated that they concern about the subjects. However, 31.0 % of the miners and 10.0 % of
the collectors say that they do not know about hygiene and sanitation while 12.9 % of the
miners are indifferent. Regarding pollution, 77.9 % of the miners and 40.0 % of the
collectors say that they do not know about the issue but 20.1 % of the miners and 57.5%
34
of the collectors are against pollution and only 2.5 % of the collectors are indifferent
towards the pollution issue.
J. Attitude towards Improvement of Mining Technology
Despite some indifferent and no-comment response, 62.5 % of the collectors and 46.5 %
of the miners are interested in the improvement of mining technology issue. No comment
response is seen among 52.3 % of the miners and 37.5 % of the collectors, while only 1.3
% of the miners are indifferent. Willingness to learn is expressed by 49.7% of the miners
and 62.5 % of the collectors while 49.7 % of the miners and 30.0 % of the collectors are
indifferent in learning a new technology. Only 0.6 % of the miners and 7.5 % of the
collectors refuse to learn the new technology.
Regarding method of learning, 44.5 % of the miners and 55.0 % of the collectors choose
the method of demonstration combine with short training while 43.2 % of the miners and
7.5 % of the collectors prefer demonstration and 5.2 % of the miners choose short
training only. However, 7.1 % of the miners and 37.5 % of the collectors do not know
what method fit for their learning the new method.
With the introduction of the new technology, 69.7 % of the miners and 75.0 % of the
collectors are confident of not having any problem while only 9.0 % of the miners and
22.5 % of the collectors are concern about the application of or their inexperience in the
new technology. Others are worried about cost and the use of a new equipment or just do
not know whether there will be any problem in using the new technology,
Table 3-11. Attitude towards Improvement of Mining Technology, Galangan 2003
Miners
Collectors
Frequency
Percent
Frequency
Percent
N
157
42
Comments on Improved Technology
No
comment
81
52.3
15
37.5
Indifferent
2
1.3
0
0.0
Good, accept, interested
72
46.5
25
62.5
Total
155
100.0
40
100.0
Missing
2
2
Willingness to learn
No
1
0.6
3
7.5
Yes
77
49.7
25
62.5
Indifferent
77
49.7
12
30.0
Total
155
100.0
40
100.0
Missing
2
2
Form of training
Do not know
11
7.1
15
37.5
Short training
8
5.2
0
0.0
Demonstration
67
43.2
3
7.5
Demo + short training
69
44.5
22
55.0
Total
155
100.0
40
100.0
Missing
2
2
Problem anticipated in new technology
None
108
69.7
30
75.0
Do not know
22
14.2
0
0.0
35
Application/inexperience
14
9.0
9
22.5
Use of new equipments
2
1.3
0
0.0
Cost
9
5.8
1
2.5
Total
155
100.0
40
100.0
Missing
2
2
4. Conclusion
The social characteristics of the mining community in Talawaan are different from the
mining community in Galangan. All of the miners and collectors in Talawaan are from
local villages in North Sulawesi while those in the Galangan mining site are from local
provinces and surrounding areas of Kalimantan or migrants from Jawa.
Family life as a unit of family is more obvious in the mining community of Galangan
than that of the Talawaan. Most of the time, the Talawaan miners and collectors work and
stay together with their coworkers in the mining site under shelters that cover the mining
pits, while the mining community in Galangan stay with their family in their own homes.
In both places, the miners have a rather limited standard of living with poor basic-
sanitation provisions.
In relation to their work, the Talawaan miners are mostly newcomers compared the
Galangan miners. In their daily work, the Talawaan mining community does not directly
work with mercury while the Galangan miners do their amalgamation at the mining sites.
These miners inhale mercury fume released from the burning of amalgam.
Therefore, two potential health risks among the mining community in the two sites are
identified; they are the risk of communicable disease spread among the mining
community and the risk of mercury contamination both for the mining community as well
as the community of the surrounding area. Both risks are related to the environmental
factors and human behaviour. Regarding the introduction of a new technology, both the
Galangan and Talawaan mining community show their interest in the new technology of
mining.
36