UNITED NATIONS INDUSTRIAL DEVELOPMENT ORGANIZATION
US/GHA/02/006- Assistance in Assessing and
Reducing Mercury Pollution Emanating from Alluvial
Gold Mining in Ghana - Phase II
Final Report
(December 2003)
Project Manager: Ch. BEINHOFF (PTC/PEM) - UNIDOŁ Vienna
CONTENT
Three sections constitute this report :
General
Introduction
pp. 1-8
Part I - Health Assessment and Survey Proposals.
pp. 1-20
(+ appendix A-I)
Part II - Assessment of Mercury Releases to
the Environment and Proposal for
Monitoring these Releases.
pp. 1-33
(+ appendix A-B)
(72 p.)
UNITED NATIONS INDUSTRIAL DEVELOPMENT ORGANIZATION
US/GHA/02/006- Assistance in Assessing and Reducing Mercury
Pollution Emanating from Alluvial Gold Mining in Ghana - Phase II
General Introduction
Andrķ RAMBAUD(1) , Claude CASELLAS(1), Florence PORTET(2), Marc BABUT (3),
Samuel O.SACKEY (4), Nii-Ayi ANKRAH (5), Ransford SEKYI(6), Collins A. SACKEY (7),
Martine POTIN-GAUTIER (8), Sylvaine TELLIER (8), William BANNERMAN (8,9)
(1) Universitķ Montpellier I, Dķpartement Sciences de l'Environnement & Santķ publique, FRANCE
(2) Service de Neurologie Ł Centre Hospitalo-Universitaire de Montpellier, FRANCE
(3) Cemagref, Groupement de Lyon, UR Biologie des EcosystĶmes Aquatiques, FRANCE
(4) Disease Control Unit , Ministry of Health; Accra, GHANA
(5) Noguchi Memorial Institute for Medical Research ; Accra, GHANA
(6) Environmental Protection Agency, GHANA
(7) Minerals Commission, Tarkwa District Centre, GHANA
(8) Universitķ de Pau & des Pays de l'Adour, Lab. Chimie analytique bioinorganique et environnement,
FRANCE
(9) Kwame Nkrumah University of Science & Technology, Chemistry Department, Kumasi, GHANA
Project Manager: Ch. BEINHOFF (PTC/PEM) - UNIDOŁ Vienna
CONTENT
Content .............................................................................................................. 2
Index of Figures................................................................................................... 2
I.
INTRODUCTION ...................................................................................... 3
II.
OBJECTIVES OF THE STUDY ..................................................................... 6
III.
ASSESSMENT METHODOLOGY................................................................... 7
IV.
REFERENCES ............................................................................................. 8
INDEX OF FIGURES
Figure 1 : SELECTED ALLUVIAL MINING AREA: JAPA SITE (phase 2): ....................................................................... 4
Figure 2 Ł Map of JAPA town and its surroundings (scale 1/10 000).................................................................................. 5
Figure 3 - Mercury diffusion pathways in Gyapa................................................................................................................... 7
3 / 3
I. INTRODUCTION
In the year 2000, a study of the human and environmental impacts of artisanal gold mining at
a pilot site was carried out at Dumasi (Ghana, Western Region) (Rambaud et al., Babut et al.,
2001). This pilot site is among others characterised by a typical process, based on solid rocks
brought back to the village, then crushed, and afterwards treated by gravity concentration and
amalgamation. Therefore, it appeared difficult to extrapolate the conclusions to regions where
the typical process is different, in particular when based on alluvium digging. Following the
presentation of the findings and conclusions in April 2001, it was thus decided to carry out a
second phase study focusing on an alluvial area.
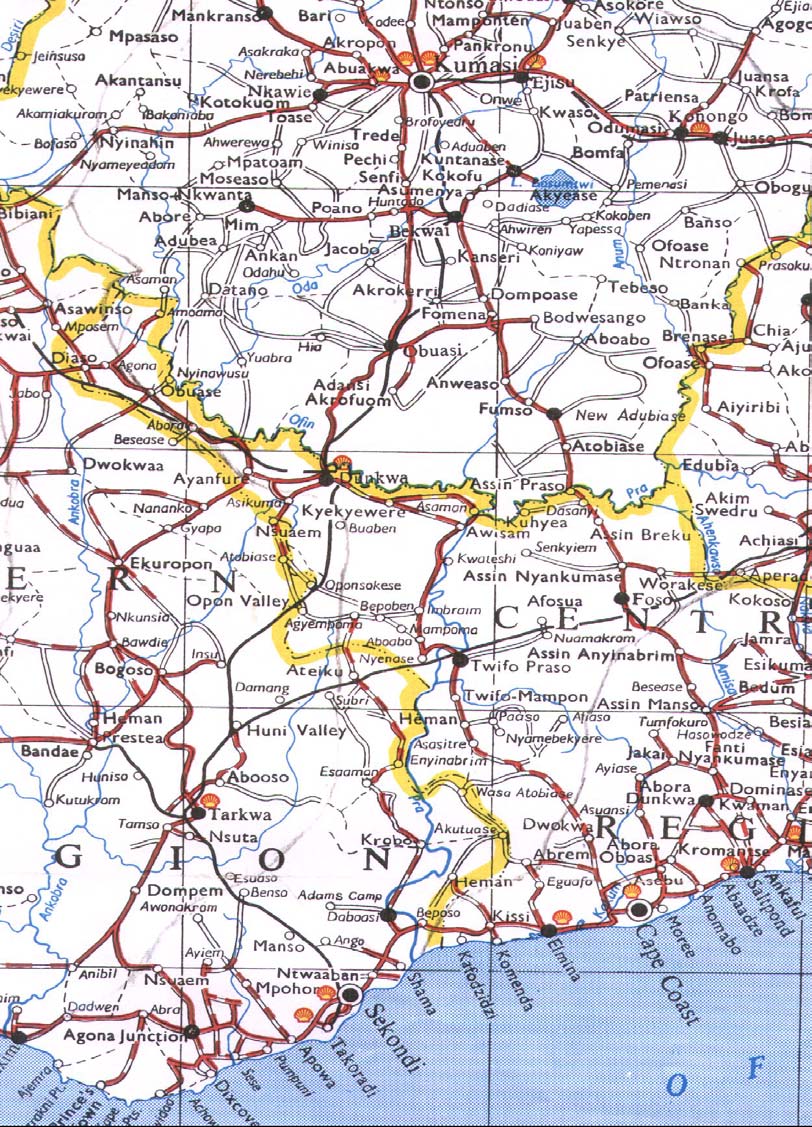
The site of Gyapa (Western Region) was selected on several criteria: year-long exploitation,
accessibility, cooperation of the population. It is located about 70 km from Tarkwa, on the
road to Dunkwa (figure 1). The village is built on a plateau (alt. 450m) overhanging two
different river stretches. The Yaya River is flowing on the northern side of the plateau, while
the Akoma Kofi River originates on the eastern side of the village, and flows to the south.
Digging sites are located throughout the area, either along the Yaya River or its tributaries
such as the Buosim River, or other rivers such as the Subin River (figure 2).
Gold washers dig large pits in the alluvium and/or floodplains along the river. They wash the
cobbles and gravels on sluice boxes, where they collect either gold nuggets or powder
concentrate gathered on hemp tissues. This concentrate is further processed by amalgamation.
This work will present the human and environmental studies in two parts (Parts I
and II respectively). The objectives and general methodology being the base of the
project, they will be presented succinctly in the following section. The detailed
methodology, results and conclusions are developed in the specific parts.
US/GHA/02/006 ŁFinal Report; General Introduction- December 2003
4 / 4
Duma
Figure 1 : SELECTED ALLUVIAL MINING AREA: JAPA SITE (phase 2):
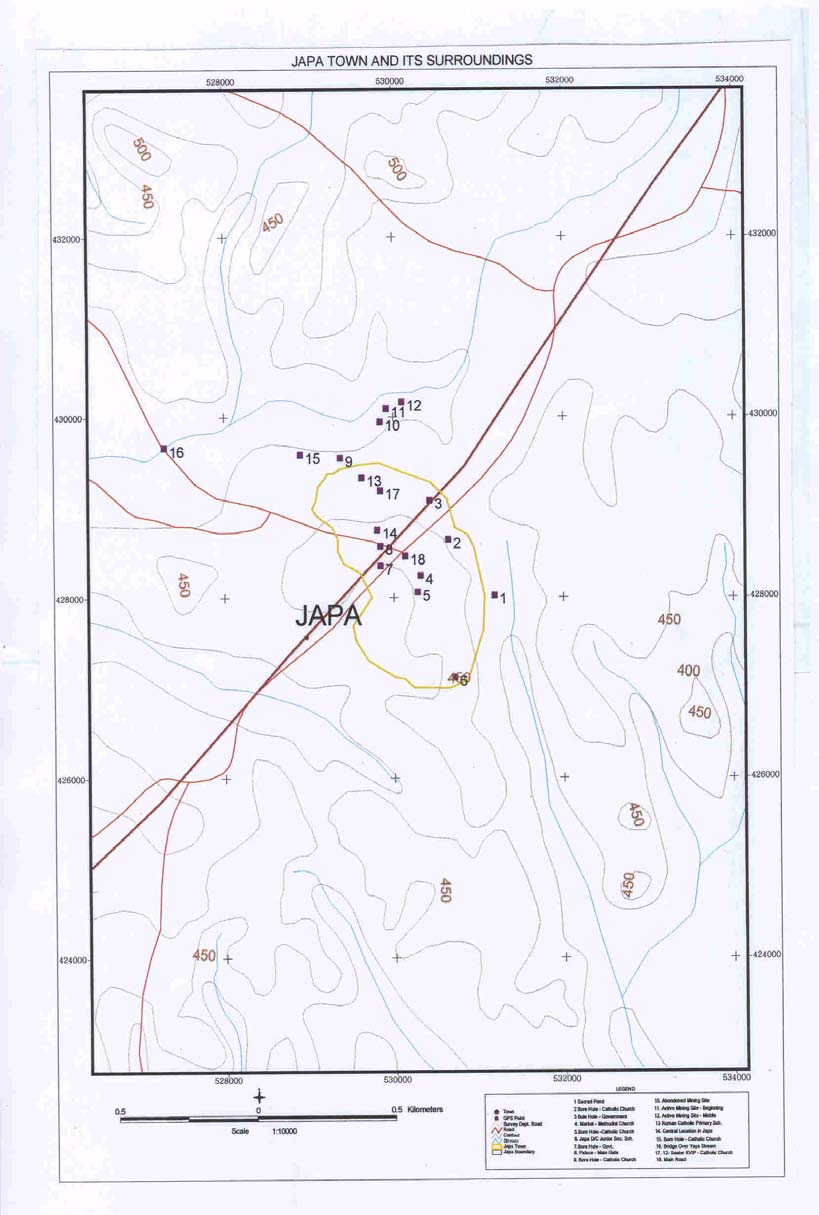
Name: Japa or Gyapa (Taboo day = Thursday). Accessibility: Easy, located on Tarkwa to Dunkwa trunk Road.
Population: more than 2000 (according to the district electoral officer). Watershed: about 300 Water bodies: One
seasonal stream (Yaya) passes through the operational areas. It flows into the Mamire stream which eventually
joins the Ankobra River. Operations: Typical alluvial operations with sluice box for concentration and the
amalgamation process for gold extraction Japa is a known artisanal mining area, with operations dating back to
pre-regularisation period (1989). Japa has most of the desirable characteristics that we are looking for. Although
the operations go down considerably during the dry season, most of the operators are said to come from the town
and its surrounding villages and can be reached when needed
US/GHA/02/006 ŁFinal Report; General Introduction- December 2003
5 / 5
Dunkwa
Yaya R.
Main Road
Akoma Kofi
Wassa Akropong
Figure 2 Ł Map of JAPA town and its surroundings (scale 1/10 000)
.
US/GHA/02/006 ŁFinal Report; General Introduction- December 2003
6 / 6
II. OBJECTIVES OF THE STUDY
The study's objectives, as expressed in the terms of reference of the missions, were:
To meet officials of Government and mining related institutions, discuss present
situation of the environment and health in gold mining areas;
To coordinate field work with Small Scale Mining Unit, EPA, MHO and French
Embassy.
To execute medical and biological sampling programme in cooperation with
Government and team members. Take hair, urine and blood samples according to the
state of the art in clinical studies.
To interview population on general health conditions and indication of symptoms of
mercury poisoning.
To cooperate with Ministry of Health and other team members in checking health
conditions of directly exposed and non directly exposed members of mining
population.
To perform clinical neurological examination.
To develop standardised examination protocol with counterparts.
To investigate situation of the environment around an alluvial gold mining site, and
take samples where pollution can be assumed. Specifically, assess the nature and
extent of the mercury pollution in a selected river system and adjacent (agricultural)
sites.
To discuss all the issues related to the objective of introducing and setting up a
monitoring system for continuous water quality assessment.
Two French-Ghanaian missions were organized in September and October 2003 on the
alluvial site of Gyapa. Human and environmental samples (see Back-to-Office-Mission
Reports ) were transported in France for analysis.
Mission one (14 Ł 29 September 2002), concerned human study and was performed
by three French experts (Claude CASELLAS, Florence PORTET and Andrķ
RAMBAUD) and four Ghanaian experts (Samuel O.SACKEY, Nii-Ayi ANKRAH,
Collins A. SACKEY).
Mission two (07-19 October 2002) concerned environmental study and was performed
by a French expert (Marc BABUT) and two Ghanaian experts (Ransford SEKYI and
Collins SACKEY). Other collaborative inputs by: Moses KPEBU, EPA TARKWA
office; William BANNERMAN, Universities of PAU (France) and KUMASI
(Ghana); Martine POTIN-GAUTIER, University of PAU.
Human and environmental samples were processed and analysed in the "Laboratoire de
Chimie analytique bioinorganique & environnement" (LCABIE) in Pau University (Martine
POTIN-GAUTIER, Sylvaine TELLIER, Patrice YVARS, William BANNERMAN) with the
participation of David ROSAIN (University Montpellier I - DSESP).
US/GHA/02/006 ŁFinal Report; General Introduction- December 2003
7 / 7
III. ASSESSMENT METHODOLOGY
According to the sociologist study done prior the current assessment (Tsekpo, 2002), the
amalgamation process is done in Gyapa either close to the sluice boxes or in the village. In the
latter case, the concentrate is brought back to the village with water. This means that two
separate contamination pathways can be distinguished and should be accounted for in the
sampling strategy: (i) release of mercury in the pits, at the amalgam washing / squeezing
and/or burning steps; (ii) diffusion by evaporation and further deposition on soil in the village.
Moreover, soils will be washed during the rainy season, and runoff will transport
contaminated soil particles. These particles could then contaminate other soils, and return to
the river system. These pathways and the kind of samples collected around Gyapa are shown
on the diagram at figure 3.
Digging +
concentration
Human exposure
Amalgamation
Blood, urine, hair
Washing +
squeezing
Water
Sediment
Biota (fish)
Downstream transport
Sediment
Biota (fish)
Soil
Runoff
Soil
Roots (cocoyam)
Roasting
Atmosphere
Leaves
Washing +
squeezing
Amalgamation
Figure 3 - Mercury diffusion pathways in Gyapa (Grey boxes designate the types of
samples collected at various step of the contamination and diffusion process).
US/GHA/02/006 ŁFinal Report; General Introduction- December 2003
8 / 8
Therefore, according to our comprehension of the diffusion pathways in Gyapa area (figure
3), the sampling program focussed for humans on blood, urine and hair and for the
environment on sediments, fishes, soils and roots of selected vegetables. Sediments should be
seen here either as a sink of mercury or as a signature along transport pathways.
IV. REFERENCES
Reports for UNIDO: Assistance in Assessing and Reducing Mercury Pollution Emanating
from Artisanal Gold Mining in Ghana - Phase I US/GHA/99/128 -
- Part I Ł General introduction and assessment of human health (A. RAMBAUD , C. CASELLAS, S.
O.SACKEY, N.A. ANKRAH, C. A. SACKEY M. POTIN-GAUTIER, S.TELLIER, W. BANNERMAN & M. BABUT )
- Part II - Conduct of surveys on river systems & overall conclusions (M. BABUT, R.SEKYI, M.
POTIN-GAUTIER & S. TELLIER, W.BANNERMAN Claude CASELLAS & A. RAMBAUD )
CASELLAS C. , PORTET F., RAMBAUD A., Back-to-Office-Mission - Report (2002-
10-24) Accra (Ghana) and artisanal alluvial mining site of Japa-Wasa; 14 Ł 29 Sept.2002
BABUT M., Back-to-Office-Mission - Report (2002-10-24) Accra (Ghana); Gyapa,
Ankobra estuary (Western Region), Kumasi, 07-19 October 2002
RAMBAUD A, CASELLAS C., SACKEY S.O, ANKRAH N.A., SACKEY C. A.,
POTIN-GAUTIER M., TELLIER S., BANNERMAN W, CLAON S. .& BEINHOFF C..
Mercury exposure in an artisanal mining community in Ghana Ł 6th ICMGP, Minamata,
Japan, October 2001, 14-18
BABUT M., SEKYI R., RAMBAUD A., POTIN-GAUTIER M., TELLIER S.,
BANNERMAN W. &. BEINHOFF C. Assessement of Environmental impacts due to
mercury used in Artisanal Gold Mining in Ghana 6th ICMGP, Minamata, Japan, October
2001, 14-18
BABUT M., SEKYI R., RAMBAUD A., POTIN-GAUTIER M., TELLIER S.,
BANNERMAN W. &. BEINHOFF C Orientations for improving the environmental
management of small-scale gold mining in Ghana: a case study of Dumasi JOURNAL OF
CLEANER PRODUCTION 11 (2003) 215-221
TSEKPO A., Socio-economic Profile of Japa. Report for UNIDO, Accra Ł Ghana;
August 2002
US/GHA/02/006 ŁFinal Report; General Introduction- December 2003
Assistance in assessing and reducing Mercury pollution
emanating from alluvial gold mining in GHANA Ł Phase II
US/GHA/02/006
Part I : Health Assessment and Survey Proposals
Andrķ Rambaud , Claude Casellas, Florence Portet,
Samuel O.Sackey , Nii-Ayi Ankrah , Collins A. Sackey
Martine Potin-Gautier, Sylvaine Tellier.
Project Manager: Ch. BEINHOFF (PTC/PEM)
United Nations Industrial Development Organisation Ł Vienna
2/2
Contents
Part I : Health Assessment and Survey Proposals....................................................................... 1
Abbreviations ......................................................................................................................... 3
Index of Tables ...................................................................................................................... 3
Index of Figures ..................................................................................................................... 3
1
DATA COLLECTION........................................................................................................... 4
1.1
Social and occupational questionnaire ......................................................................... 4
1.2
Cohort recruitment and biological samples collection .................................................... 5
2
PREPARATION OF SAMPLING MATERIAL ........................................................................... 5
2.1
Washing Procedures for Bottles and Sampling Materials ............................................... 6
2.2
Sample preservation................................................................................................... 6
2.3
Sample transport........................................................................................................ 6
3
EXPERIMENTAL................................................................................................................. 7
3.1
Sample Treatment...................................................................................................... 7
3.1.1 Blood...................................................................................................................... 7
3.1.2 Urine ...................................................................................................................... 7
3.1.3 Hair........................................................................................................................ 7
3.2
Analytical determinations............................................................................................ 7
3.2.1 Atomic Fluorescence Detection................................................................................. 7
3.2.2 Creatinine in urine ("Jaffķ Method" : Kinetic test without deproteinisation) ................. 8
3.2.3 QC / QA.................................................................................................................. 8
4
RESULTS & DISCUSSION................................................................................................... 8
4.1
Social and occupational data....................................................................................... 8
4.2
Health perception......................................................................................................10
4.3
Exposure assessment ................................................................................................11
4.3.1 Human-biomonitoring (HBM) values for mercury ()..................................................11
4.3.2 Mercury in blood, urine and hair samples.................................................................12
4.3.3 Classification of mercury body burden. ....................................................................12
4.4
Clinical examination...................................................................................................14
5
STRATEGY AND CONCLUSIONS........................................................................................15
6
References.......................................................................................................................17
APPENDIX ................................................................................................................................20
APPENDIX A : ANALYTICAL RESULTS OF HUMAN SAMPLES :.................................20
APPENDIX B : PROPOSALS FOR SOCIOLOGIST STUDY: ........................................20
US/GHA/02/006 ŁFinal Report; Part I: Health Assessment and Survey Proposals - December 2003
3/3
Abbreviations
EPA
Environmental Protection Agency
FE-SC
French Embassy (Service of Cultural Affairs)
MoH
Ministry of Health
SMMO
Small Scale Mining Office (Mineral Commission)
PMMC
Precious Minerals Marketing Corporation
Index of Tables
Table 1: Relationship by Sex within Households in Japa .......................................................................................................5
Table 2 : Mercury threshold values according to Drasch et al. ...........................................................................................12
Table 3 - Summary of mercury exposure in the investigated population .............................................................................12
Table 4: Classes of mercury body burden. ............................................................................................................................13
Index of Figures
Figure 1- Age distribution (in percent) ....................................................................................................................................4
Figure 2: Alternative activity of galamseys .............................................................................................................................8
Figure 3- Age distribution in the cohort , F, M..............................................................................................................9
Figure 4: Part of migrants in Gyapa community ....................................................................................................................9
Figure 5 -Written signature on the consentment statement and level of education.............................................................10
Figure 6 - Percent of persons declaring health problems.....................................................................................................11
Figue 7: Mercury body burden classes for galamsey community ........................................................................................13
Figure 8 Galamseys overall neurological signs....................................................................................................................14
Figure 9 Body burden classes for persons having neurological disorders........................................................................14
Figure 10: Classes 3 and 4 body burden in the galamsey sample with neurological disorders or without any clinical defects
..................................................................................................................................................................................................15
US/GHA/02/006 ŁFinal Report; Part I: Health Assessment and Survey Proposals - December 2003
4/4
1 DATA COLLECTION
1.1
Social and occupational questionnaire
The questionnaire, and the associated clinical examination procedure, were adapted from a similar study,
which was done in Mindanao island (Philippines) under UNIDO auspices. This strategy was deliberately
adopted in the previous study (phase I- Dumasi site), to allow a comparison between the different
situations. A few modifications were introduced in one hand to take into account the specificity of the
Ghanaian context and culture compared to the Philippine context and on the other hand to study the
neurological effects of mercury thoroughly compared to the previous study in Ghana. The questionnaire is
presented in appendix B.
The questioned people were recruited by the sociologist, and have to explicitly consent to participate in the
study. Two hundred and sixty seven volunteers were selected by the sociologist.
The sociological study was performed two months before the human health study by Anthony TSEKPO
(2002). It concerned the socio-economic profile of Gyapa. Several important informations are given in this
report; we will extract the general age repartition of the population and the households composition
(figures 1 and table 1).
For a total population of 2046 individuals (1079 Male and 967 Female)
%50
45
40
35
30
Male
25
20
Female
15
10
5
0
0 t
1
2
2
30
3
4
4
5
Age
o
5
0
5
5
0
5
0
15
to
t
to
t
t
to
to
t
19
o
o
o
o
24
2
4
4
54
9
34
39
4
9
Source: 2000 Population and Housing Census, GSS
Figure 1- Age distribution (in percent)
US/GHA/02/006 ŁFinal Report; Part I: Health Assessment and Survey Proposals - December 2003
5/5
RELATIONSHIP
Total
Male
Female
Total
2,046
1,079
967
Head
401
298
103
Temporary Head
21
5
16
Spouse 196
8
188
Child 809
428
381
Parent/Parent in law
18
3
15
Son/daughter in law
24
5
19
Grandchild 136
60
76
Other relative
415
255
160
Non relative
26
17
9
Source: 2000 Population and Housing Census, GSS
Table 1: Relationship by Sex within Households in Japa
1.2
Cohort recruitment and biological samples collection
The study was performed on 160 individuals recruited among the 267 volunteers (106 individuals did not
come) and 20 were recruited during the field study. In the total the study concerned 180 individuals.
Total numbers of samples collected were as follows:
180 samples of blood (1 to 2 replicates of 4ml in EDTA-coated vials).
179 samples of spontaneous urine (1 to 2 tubes of 50 ml).
125 Creatinin determination
193 samples of hair (including 16 children): for three individuals, the quantities were very small, according
to the "cranium shaved " fashion of the men.
101 hair samples from health centres in the same region of the studied site.
2 PREPARATION OF SAMPLING MATERIAL
Ultra-clean sampling procedures, handling, and preparations are of utmost important if precise and exact
results are required in the analysis of mercury in environmental and biological. The materials and vessels to
be used for the sampling were therefore washed and preserved under very strict protocol. Polyethylene
gloves are worn at all times during washing and handling. All the washings are done in polyethylene baths
reserved only for the purpose and are kept under a fume chamber in a clean room at all times. Washing and
washing solutions prepared from Milli-Q de-ionised water.
US/GHA/02/006 ŁFinal Report; Part I: Health Assessment and Survey Proposals - December 2003
6/6
2.1
Washing Procedures for Bottles and Sampling Materials
New materials are washed as follows
They are placed in 10% solution of RBS detergent for 24 hours
rinsed with tap water and then with Milli-Q water
immersed in a 10% (v/v) HNO3 bath and heated in an ultrasonic bath for 1 hour (or 24 hours without
ultrasonic bath) .
rinsed with Milli-Q water
immersed in a 10% (v/v) HCl bath and heated in an ultrasonic bath for 1 hour (or 24 hours without ultrasonic
bath) .
rinsed with Milli-Q water
immersed in Milli-Q water and placed in an ultrasonic bath for 30 minutes
dried at about 70░C in a clean oven specially reserved for the purpose.
After drying all materials are placed individually in double zip-lock bags and kept in a cupboard or in an
air-tight container until their use required for use.
With only slight modifications this forms the basis of washing protocol for most laboratory wares used.
Washing of used materials begin with washing in hot tap water before immersion into the RBS detergent
solution.
2.2 Sample
preservation
Only high quality reagents are used (e.g. Ultrapur HCl).
Urine samples are kept frozen until analysis.
Blood samples are kept frozen until analysis
Hair are kept in their secured sachets at ambient temperature until analysis
2.3
Sample transport
All samples, sealed in double zip-lock bags, and sometimes tied together with magnetic tapes are
transported in pre-cooled ice-chests filled with frozen ice packs. Suspected highly contaminated samples
are kept separately from less contaminated ones
Samples are shipped by air, often accompanied by the investigator, to avoid mishandling by traffic officials.
As much as possible overnight flights are used, most samples remain frozen this way.
US/GHA/02/006 ŁFinal Report; Part I: Health Assessment and Survey Proposals - December 2003
7/7
3 EXPERIMENTAL
3.1 Sample
Treatment
3.1.1 Blood
300 ĄL of blood is transferred into a polypropylene sample tube. 3 mL of aqua regia is added. They are then
agitated at 420 rpm until complete dissolution. On dilution the solutions became cloudy and this necessitates
centrifuging before CV-AFS analysis of the supernatant liquid.
3.1.2 Urine
When the urine samples are frozen they are no more homogenous solutions when they are de-frozen. Some
colloidal solids are collected at the base of the container tubes. Attempts to re-dissolve the solids into solution was
impossible if one had to preserve the integrity of the samples.
The urine samples were therefore centrifuged and the solid and liquid portions were separated and treated
respectively as follows:
Solid portion: They are dried in an oven at 50░C overnight. 3ml aqua regia were added and agitated on a
shaker until complete dissolution. Volumes in the other of 100uL are taken and diluted with the reagent
blank for CV-AFS analysis.
Ę Liquid portion: 1 ml of urine is accurately measured and transferred into 25 ml volumetric flasks and
diluted to the mark with `dilute aqua regia.
3.1.3 Hair
Between 20 mg and 50 mg of the hair samples were weighed in a beaker and then transferred in a polypropylene
bottle in order to avoid weight errors introduced by electrostatic forces between the samples and the walls of the
polypropylene containers). A 3mL volume of aqua regia is added. The propylene bottle is corked and is placed on a
shaker to agitate overnight. Then the solutions was diluted wiith deionised water in a 25 mL volumetric flask.
3.2 Analytical
determinations
3.2.1 Atomic Fluorescence Detection
The pre-treatment procedures described earlier ensures that all mercury is present in solution as Hg2+. Total
mercury is determined by the cold vapour Ł atomic fluorescence technique (CV Ł AFS) using the continuous flow
approach. The procedure involves an online reduction of Hg2+ to Hg0 vapour by SnCl2. Typically, the reductant is
5%m/v SnCl2 in 15%HCl. The mercury vapour is swept by argon as carrier gas to the AFS detector (Merlin PSA
10.023).
Various sample matrices are analysed using reagent blanks which are basically in the same chemical media as the
analyte in the respective sample solutions. Measurements were controlled by the Touchstone « control software.
Typical gas flow conditions include:
Carrier gas flow (Argon)
0,30 Ł 0,45 L/minute
Drier gas flow (Argon)
2,5 Ł 3,0 L/minute
Sheath Flow (Argon)
0,30 Ł 4,5 L/minute
US/GHA/02/006 ŁFinal Report; Part I: Health Assessment and Survey Proposals - December 2003
8/8
3.2.2 Creatinine in urine ("Jaffķ Method" : Kinetic test without deproteinisation)
Creatinine in an alkaline picrate solution forms a colored orange-red complex. The delta absorbance at
fixed times during conversion is proportional to the concentration of Creatinine in the sample.
The reagents and the standard are ready-to-use and stable up to the end of the indicated month of
expiry, if contamination is avoided and stored at 2 Ł 25 ░C.
- R1: Sodium Hydroxide 0.16 mol/l
- R2: Pikric acid 4.0 mmol/l
- Standard: 2 mg/dl (177 Ąmol/l)
- Specimen : dilute urine 1 + 49 with distillated water
Normal range
- Urine: 1000 - 1500 mg/24 h
- Creatinine clearance; Men: 98 Ł 156 ml/min; Women: 95 Ł 160 ml/min
3.2.3 QC / QA
Precision and recovery measurements were performed with reference materials (reference materials: Seronorm
trace element urine FE1114, Seronorm trace element 404107y whole blood, IAEA 086 hair). Analysis of blanks
were done for field variability, digestion/extraction performance and reagents quality. Precision and recovery were
evaluated and detections limits were determined.
4 RESULTS & DISCUSSION
4.1
Social and occupational data
180 adults (1) were recruited, including 116 men and 64 women. 149 declared to be galamseys (100 men
and 49 women). Most of the galamseys are partial time because of the seasonality of the alluvial mining
specificity (activity can be performed between May and October). Their alternative activity is shown in the
figure 2.
Galamsey full
Farmer
Trader
Other
Figure 2: Alternative activity of galamseys
1 Children (<15 years) were not selected for ethical reasons and difficulties in obtaining parents' consentment
US/GHA/02/006 ŁFinal Report; Part I: Health Assessment and Survey Proposals - December 2003
9/9
Non-galamsey population was considered as a possible control, and was deliberately limited to 31
individuals. The population is rather young (Figure 3 ).
Total studied sample and Galamsey age repartition
Number 25
2 0
Mean = 33.7
MeanM = 33.7
1 5
M
F
MeanF = 32.9
1 0
Median = 30.5
5
0
< 2 0
2 0 - 2 5
2 5 - 3 0
3 0 - 3 5
3 5 - 4 0
4 0 - 4 5
4 5 - 5 0
5 0 - 5 5
> 5 5
Number 20
Mean = 32.5 1 5
MeanM = 33
M
1 0
F
MeanF = 32
5
Median = 30
0
< 2 0
2 0 -2 5
2 5 -3 0
3 0 -3 5
3 5 -4 0
4 0 -4 5
4 5 -5 0
5 0 -5 5
> 5 5
G A L A M S E Y
Figure 3- Age distribution in the cohort , F, M
The repartition between migrants and natives shows that half of them are natives (figure 4). In all classes
women reprent 1/3rd of the total.
Number
200
150
F
100
M
50
0
General
Natives
Galamsey
Natives
pop
pop
Gal
Figure 4: Part of migrants in Gyapa community
The overall population is rather poor, and consumes few tobacco and alcohol. The food is mainly
composed of tuber, completed by fish (1 time a day); meat and milk are rarely consumed.
Most of the women are illiterate (Figure 5)
US/GHA/02/006 ŁFinal Report; Part I: Health Assessment and Survey Proposals - December 2003


10/10
Written signature on the consentment statement
Number
100
80
M
60
F
40
20
0
Signature
No signature signature
%70
60
50
40
M
30
F
20
10
0
No
Basic secondary
technical
education
Figure 5 -Written signature on the consentment statement and level of education
4.2
Health perception
40% of male sample Ł galamseys or not - claimed to have health problems; this ratio was slightly higher in the
female sub-group, but in this case galamseys declared more health problems (Figure 6) Most of the declared
pathologies were related to the skin area. 90% of the people, being galamsey or not, do not declare or declare
slight metallic taste and salivation problems. Nevertheless 20% of the people claimed to have tremors and 65%
have sleep disorders.
US/GHA/02/006 ŁFinal Report; Part I: Health Assessment and Survey Proposals - December 2003
11/11
%
80
Galamsey
60
M
40
F
20
0
Health Pb
No health Pb
Total sample
Main declared problems (Pb) are related to
skin, malaria, kidney and repiratory system.
Figure 6 - Percent of persons declaring health problems
4.3 Exposure
assessment
4.3.1 Human-biomonitoring (HBM) values for mercury (Drasch et al.-2001)
The HBM-values are assessed by toxicological considerations. The HBM I was set to be a `check value' -
this means an elevated mercury concentration in blood or urine, above which the source of the Hg-burden
should be sought and, as far as possible, eliminated. However, even when exceeding this HBM I value, the
authors claimed that a health risk is not to be expected. In contrast to this, the (higher) HBM II value is an
`intervention value'. For blood or urine levels above HBM II, especially for a longer time, adverse health
effects cannot be excluded, therefore interventions are necessary. On the one hand the source should be
found and reduced urgently; a medical check for possible symptoms should be performed.
Other toxicologically founded limits are occupational threshold limits. Such limits are established for
mercury, e.g. in France and the USA (biological exposure indices BEIs) or Germany (BAT value). For a
better comparison with the HBM-values which, to our knowledge, are only established in Germany the
German BAT-values for metallic and inorganic mercury are taken for this study. From the definition, these
BAT-values are exclusively valid for healthy adult workers under occupational medical control. The
occupational burden must be stopped if this threshold is exceeded. These occupational threshold limits are
not valid for the total population, especially not for risk groups like children, pregnant women, older or ill
persons. Nevertheless, the BAT-values were taken for a further classifying of our high results, too. BAT-
values for mercury are established only for blood and urine, but not for hair. Table 2 gives an overview of
the HBM-, BAT- and BEI-values :
US/GHA/02/006 ŁFinal Report; Part I: Health Assessment and Survey Proposals - December 2003
12/12
Table 2 : Mercury threshold values according to Drasch et al.(2001)
Hg- blood
Hg-urine
Ąg /l
Ąg /l Ąg/g
creat.
HBM I - Human Bio Monitoring
5
7
5
HBM II - Human Bio Monitoring
15
25
20
BEI - Biological Exposure Index
15 a)
-
35 b)
BAT - Biologischer Arbeitsstoff -Toleranzwert
25
100
-
(for metallic and inorganic Hg)
a) after working b) before working
NB: for hair, the HBM II is 5Ąg/g (in analogy) and WHO proposes a treshold limit of 7Ąg/g
4.3.2 Mercury in blood, urine and hair samples
The characteristics of the cohort are given in table 3.
Table 3 - Summary of mercury exposure in the investigated population
Hg content in ...
Blood (Ąg.l-1) Urine
(Ąg.l-1)
Hair (Ąg.g-1) Hair
(Ąg.g-1)
Children
Mean-
11.6
18.2
3.0
3.74
Median 10.4
8.4
1.9
2.36
Minimum <
D.L.
0.7 0.2 1.07
Maximum 44.8 206.2 40.8 14.3
Stand.deviation
6.3 30.5 4.2 3.9
Number
N 180 179 177 16
The mean mercury concentrations according to gender, were
in blood: 12.1 Ąg.l-1 for Male and 10.7 Ąg.l-1 for Female
in urine: 23 Ąg.l-1 for Male and 9.5 Ąg.l-1 for Female
in hair: 4 Ąg.g-1 for Male and 1.2 Ąg.g-1 for Female
In the children sample, mercury concentration in hair showed high exposure for two
individuals (12.6 and 14.3 Ąg.g-1); for 10 of them, the exposure is medium (2-7 Ąg.g-1) and only 4
had less than 2 Ąg.g-1(e.g. low exposure).
4.3.3 Classification of mercury body burden.
Classes were defined following the HBM, BTA and WHO system as:
US/GHA/02/006 ŁFinal Report; Part I: Health Assessment and Survey Proposals - December 2003
13/13
Table 4: Classes of mercury body burden.
HBM 1
HBM2
BTA
BLOOD 5 Ąg Hg /l 15 Ąg Hg /l 25 Ąg Hg /l
URINE 7 Ąg Hg /l 25 Ąg Hg /l 100 Ąg Hg /l
(BEI)
HAIR 2 Ąg Hg /g
5 Ąg Hg /g
7 Ąg Hg /g
(WHO)
Class 1
2
3
4
no exposure low exposure medium exposure high exposure
The distribution of Hg concentration in blood, urine and hair samples is presented in the
figure 7.
100
Hair
80
60
M
40
F
20
Urine
0
100
1
2
3
4
80
60
M
40
F
20
100
0
80
1
2
3
4
60
M
40
F
Blood
20
0
1
2
3
4
Figue 7: Mercury body burden classes for galamsey community
In conclusion, among 180 investigated persons, the most exposed ones (class 3 and 4) were 56 individuals in
classes 3 and 4 for urine, blood or hair (3 women and 53 men), 8 of them were aged between 18 and 25 years
and 15 individuals were aged between 26 and 35 years. 17 individuals were working as galamseys for over 5
years.
US/GHA/02/006 ŁFinal Report; Part I: Health Assessment and Survey Proposals - December 2003
14/14
4.4
Clinical examination
A special section of the collection of epidemiological data was dedicated to neurological health, as mercury
is particularly noxious to the nervous system. The clinical examinations consisted in classical tests related
to walking, standing, sitting, lying, to the reflexes, the memory and drawing abilities. In this study, a
medical specialist in neurology examined 93 Individuals. It concerned 86 galamseys and 7 non galamseys.
%
80
60
M
40
F
20
0
Neuro +
Neuro 0
Figure 8 Galamseys overall neurological signs
Figure 8 shows that around 40 percent of individuals have neurological disorders for males and females. This
percentage is widely beyond than the one in a normal population. For the seven non galamseys, two had
neurological signs, one being wife of galamsey.
Figure 9 shows that neurological disorders are observed in any class of body burdens; class 2 concerns the
majority of the sample.
%70,0
60,0
50,0
Ch
40,0
Hair
0
Blood
30,0
20,0
Urine
0
10,0
0,0
1
2
3
4
Figure 9 Body burden classes for persons having neurological disorders
US/GHA/02/006 ŁFinal Report; Part I: Health Assessment and Survey Proposals - December 2003
15/15
%30,0
25,0
20,0
Neuro+
15,0
Neuro0
10,0
5,0
0,0
ch
hair
blood
urine
Figure 10: Classes 3 and 4 body burden in the galamsey sample with neurological
disorders or without any clinical defects
For classes 3 and 4 of body burden, neurological signs are discriminated by urine and hair. This result would
suggest that urine and hair mercury loads are better biomarkers than blood. This is in accordance with the
literature that indicates food influence on mercury contents in blood.
In conclusion, 39 individuals had neurological disorders 14 were aged between 18 and 25 years and 11 between
26 and 35 years. 22 were galamseys for over 5 years
5 STRATEGY AND CONCLUSIONS
The first point that should be addressed is that the sociological study is the key for a good epidemiological
investigation. In our work, the attempt for a cluster sampling at a family level was difficult to be
interpreted because its planification was not programmed. In annex (B 1 and 2) we propose the objectives
of a sociological study and a questionnaire for the preparation of a cluster sampling at a family level.
From this study, answers for two main questions could be proposed:
Is the population exposed to mercury?
In the total sample studied (180), 56 individuals are in classes 3 and 4 for urine, blood or hair mercury
burden. Our results showed that direct exposure by professional activities (galamseys) increase mainly urine
and hair mercury burden. Indirect or direct exposure of children was also observed while spouses and
women exposure was lower than men.
Is the population health affected?
The neurological signs in goldwashers group are frequent (40%). The neurological examination
(measurement of effects) and the body burden measurement (level of exposure) are done simultaneously.
The body burden remains some months while neurological effects appears some years after chronic
exposure (maximum levels being 200 Ąg/l for urine and 40 Ąg/l for blood). For this reason, the link between
body burden and neurological disorders was not always easy to identify.
US/GHA/02/006 ŁFinal Report; Part I: Health Assessment and Survey Proposals - December 2003
16/16
In perspectives three action levels could be considered:
At the studied site level
Information on mercury effects and prevention must be done to the whole population.
Considering the most exposed individuals, 33 were selected for a prevention programme with retorts
distribution.
For future human health studies, exposure assessment of mercury by the measurement of
mercury in hair in different medical centers of the country would give information on the mean
population mercury levels. Planification of a cluster sampling at a household level would indicate
the kind of prevention actions that must be proposed.
At the watershed basin level, the knowledge of the transport and fate of mercury in the river and
the estuary would help to identify hot spots. Transport modelling and species measurement
would complete the knowledge of mercury fate and would help in identifying populations to be
studied.
US/GHA/02/006 ŁFinal Report; Part I: Health Assessment and Survey Proposals - December 2003
17/17
6 REFERENCES
Akagi, H. 1997. Analytical Methods for Evaluating Human Exposure to Mercury Due to Gold
Mining. In: Proc. International Workshop on Health and Environmental Effects of Mercury Dues
to Mining Operations. p. 131-141. Manila, Philippines, Nov. 26-27, 1997. Ed. National Institute of
Minamata Disease, Japan, Dept. of Health of the Philippines and University of the Philippines.
Akagi, H. and Naganuma, A., 2000. Human Exposure to Mercury and the Accumulation of
Methylmercury that is Associated with Gold Mining in the Amazon Basin, Brazil. Journal of
Health Science, v.46, n.5, p.323Ł328.
Beinhoff, C., 2003. Mission Report to Indonesia. UNIDO report.
Boischio, A.A.P., Mergler, D.; Passos, C.J.; Gaspar, E.; Morais, S., 2003. Segmental Hair
MercuryEvaluation among Mothers, Their Babies and Breast Milk along Tapajos River, Amazon,
Brazil. Environmental Sciences, v.10, n.2, p.107-120.
Bose-O`Relly S., Maydl S., Drasch G., Roider G. Mercury as a health hazard due to gold mining
and mineral processing activities in Mindanao/Philippines UNIDO Project n░ DP/PHI/98/00511
Boese-O'Reilly, S.; Drasch, G.; Beinhoff, C.; Maydl, S.; Vosko, M.R.; Roider, G.; Dzaja, D.,
2003. The Mt.Diwata Study on the Philippines 2000 Ł Treatment of Mercury Intoxicated
Inhabitants of a Gold Mining Area with DMPS (2,3-Dimercapto-1-propane-sulfonic acid, Dimaval).
The Science of the Total Environment, v.307, n.1-3, p.71-82.
Campos, M.S.; Sarkis, J.E.S.; Muller, R.C.S.; Brabo, E.S.; Santos, E.O., 2002. Correlation between
Mercuryand Selenium Concentrations in Indian hair from Rondonia State, Amazon region, Brazil.
The Science of the Total Environment, v.287, p.155-161.
Carmouze, J.P.; Lucotte, M; Boudou, A., 2001. Mercury in the Amazon: Importance of Human
and Environment, Health Hazards. Synthesis and Recommendations. IRD Editions; Institut de
Recherche Pour le Devloppement, Paris, 40 p.
Castilhos, Z.C. and Lima, C.A., 2001. Mercury as an Environmental Problem: Human Health Risk
and Aquatic Ecosystems Contamination Assessment. In: Mercury in the Tapajos Basin. p. 75-94.
Ed. Villas Boas, Beinhoff, Silva. GEF/UNIDO/CYTED/CETEM/IMAAC publication. Rio de
Janeiro.
Cordier, S.; Gare l, M.; Mandereau, L.; Morcel, H.; Doineau, P.; Gosme-Seguret, S.; Josse, D.;
White, R.;Amiel-Tison, C., 2002 . Neurodevelopmental Investigations among Methylmercury-
Exposed Children in French Guiana Environmental Research, v.89, n.1, p.1-11.
US/GHA/02/006 ŁFinal Report; Part I: Health Assessment and Survey Proposals - December 2003
18/18
Dolbec, J.; Mergler, D.; Larribe, F.; Roulet, M.; Lebel, J.; Lucotte, M., 2001. Sequential Analysis
of HairMercury Levels in Relation to Fish Diet of an Amazonian Population, Brazil. The Science
of the Total Environment, v.271, n.1-3, p.87-97.
Drasch G., Bose-O'Reilly S.,. Beinhoff C,. Roider G, Maydl S.: The Mt. Diwata study on the
Philippines 1999 assessing mercury intoxication of the population by small scale gold mining.The
Science of the Total Environment 267 (2001) 151-168
Frķry, N; Maury-Brachet, N.; Maillot, E.; Deheeger, M.; de Mķrona, B.; Boudou, A., 2001. Gold-
Mining Activities and Mercury Contamination of Native Amerindian Communities in French
Guiana: Key Role of Fish in Dietary Uptake. Environmental Health Perspectives, v.109, p.449-
456.
Harada, M.; Nakanishi, J.; Yasoda, E.; Pinheiro, M.C.N.; Oikawa, T.; GuimarŃes, G.A.; Cardoso,
B.S.; Kizaki, T.; Ohno, H., 2001. Mercury Pollution in the Tapajos River Basin, Amazon: Mercury
Level of Head Hair and Health Effects. Environment International, v.27, p.285Ł290.
Hinton, J.J. and Veiga, M.M., 2002. Earthworms as bioindicators of mercury pollution from
mining and other industrial activities. Geochemistry: Exploration, Environment & Analysis, v. 2, n.
3,pp. 269-274. Geological Society of London
Hinton, J.J.; Veiga, M.M.; Beinhoff, C., 2003. Women and Artisanal Mining: Gender Roles and
the Road Ahead. In: The Socio -Economic Impacts of Artisanal and Small-Scale Mining in
Developing Countries. Chapter 11. Ed. G. Hilson, Pub. by A.A. Balkema, Swets Publishers,
Netherlands, 2003
International Labour Office (ILO), 1999, Social and Labour Issues in Small-scale Mines, Report
for the Tripartite Meeting on Social and Labour Issues in Small-scale Mines, Geneva 17-22 May,
1999.
IPCS Ł International Programme on Chemical Safety, 2000. Human Exposure Assessment.
Environmental Health Criteria 214. WHO, Geneva, 375 p.
JPHA Ł Japan Public Health Association, 2001. Preventive Measures against Environmental
Mercury Pollution and Its Health Effects. Japan Ministry of the Environment. 112 p.
Kinabo, C.P., 2002. Comparative Analysis of Mercury Content in Cosmetics and Soaps Used in
the City of Dar Es Salaam. In : Proc. International Workshop on Health and Environmental Effects
of Mercury:
Impacts of Mercury from Artisanal Gold Mining in Africa. p.173-186. Tanzania, Nov. 19-20,
2002. Ed. National Institute of Minamata Disease, Japan.
US/GHA/02/006 ŁFinal Report; Part I: Health Assessment and Survey Proposals - December 2003
19/19
Mergler D., 2003. Integrating Human Health into an Ecosystem Approach to Mining. ch 87 pp.
875 - 883 in D.J. Rapport, W.L. Lasley, D.E. Rolston, N.O. Nielsen, C.O. Qualset, and A.B.
Damania (eds.) Managing for Healthy Ecosystems, Lewis Publishers, Boca Raton, Florida USA.
Mergler, D., 2002. Review of Neurobehavioral Deficits and River Fish Consumption from the
Tapaj¾s (Brazil) and St. Lawrence (Canada). Environmental Toxicology and Pharmacology, v.12,
p.93-99.
Santos, E. C. O.; CŌmara, V.M.; Jesus, I.M.; Brabo, E.S.; Loureiro, E. C. B.; Mascarenhas, A. F.
S.; Fayal, Sß Filho, K. F. G. C.; Sagica, F. E. S.; Lima, M.O.; Higuchi, H.; Silveira, I.M., 2002. A
Contribution to the Establishment of Reference Values for Total Mercury Levels in Hair and Fish
in Amazonia. Environmental Research, v.90, n.1, p. 6-11.
Santos, E.C.O.; Jesus, I.M., Camara, V.M.; Brabo, E.; Loureiro, E.C.B.; Mascarenhas, A.; Weirich,
J.; Luiz, R.R.; Cleary, D., 2002. Mercury Exposure in Munduruku Indians from the Community of
Sai Cinza, State of Para, Brazil. Environmental Research, Section A, v.90, p.98-103.
Tsekpo A., Socio-economic Profile of Japa. Report for UNIDO, Accra Ł Ghana; August 2002)
Veiga, M.M. and Baker, R. Protocols for Environmental & Health Assessment of Mercury
Released by Artisanal and Small-Scale Gold Miners (ASM) - Global Mercury Project
(EG/GLO/01/G34: Removal of Barriers to Introduction of Cleaner Artisanal Gold Mining and
Extraction Technologies) UNIDO, June 2003; Vienna. 146 p.
US/GHA/02/006 ŁFinal Report; Part I: Health Assessment and Survey Proposals - December 2003
APPENDIX
APPENDIX A : ANALYTICAL RESULTS OF HUMAN SAMPLES :
A1 - Table 1 Hg concentration (Ąg.L-1 d.w.) in blood samples (mean of the 2
measurements on 2 different mineralisations excepted for certified seronorm trace element on 8
mineralisations) - (a) Seronorm spiked with 21 Ąg methylmercury .L-1
A2 - Table 2 Hg concentration (Ąg.L-1) in urine samples (mean of the 2 measurements on
2 different mineralisations excepted for recmmended seronorm trace element on 16 measurements)
A3 - Table 3 Hg concentration (Ąg.L-1) in hair samples (mean of the 2-3 measurements on
1 mineralisatios excepted for recmmended seronorm trace element on 16 measurements)
A4 - Table 4 Creatinine concentration (g.L-1) in instantaneous urine samples
APPENDIX B : PROPOSALS FOR SOCIOLOGIST STUDY:
B1 - Objectives of the preliminary sociological investigation
B2 - Questionnaire for the sociologist
US/GHA/02/006 ŁFinal Report; Part I: Health Assessment and Survey Proposals - December 2003
A1 - Table 1 Hg concentration (Ąg.L-1 d.w.) in blood samples (mean of the 2 measurements on 2 different mineralisations excepted for certified
seronorm trace element on 8 mineralisations) - (a) Seronorm spiked with 21 Ąg methylmercury .L-1
Id. N░
Mean
St.Er.Mean
Id. N░
Mean
St.Er.Mean
Id. N░
Mean
St.Er.Mean
Id. N░
Mean
St.Er.Mean
Id. N░
Mean
St.Er.Mean
0 11,1 0,40 73 9,1 0,72 122 9,3 0,23 190 7,7 0,86 266 8,5 0,42
1 14,1 1,70 74 16,8
1,13 123 11,8
0,54 196 8,2 2,09 267 19,1 1,30
2 13,3 0,49 76 8,7 1,38 126 9,4 0,99 198 9,7 1,30 268 9,5 1,18
3 14,5 0,62 77 19,6
1,10 127 9,7 2,78 200 7,2 0,94 269 15,8 1,21
8 9,4 0,53 79
11,5
2,44 128 13,2
2,28 201 12,4 2,21 270 4,2 0,79
11 17,7 1,58 80 6,7 0,18 130 6,4 2,17 206 21,6 2,82 271 9,3 1,55
15 7,9 1,14 81 7,2 1,66 134 7,6 0,21 207 7,4 0,55 272 8,0 1,00
16 2,9 1,13 84 3,9 2,28 135 11,0
1,07 208 12,5 0,99 273 8,8 1,96
17 12,3 2,79 85 13,9 1,33 138 10,7
1,12 209 26,2 2,60 274
<l.d.
18 10,9 0,34 86 14,7 0,50 139 5,0 0,57 212 10,1 0,33 275 6,6 1,06
19 10,8 0,47 87 12,4 0,87 141 8,4 0,24 215 11,7 0,66 276 2,9 0,21
20 10,4 0,51 88 8,5 0,62 144 24,6
2,36 216 7,1 0,90 277 8,6 1,11
21 12,7 0,74 89a 11,5 2,50 147 8,2 0,18 218 5,1 0,18 278 10,9 1,50
23 11,2 1,95 89b 11,2 0,60 149 8,9 2,23 219 17,4 1,47 279 7,5 0,41
25 18,2 2,38 90 15,1 1,48 150 12,4
2,14 220 16,3 0,90 280 5,2 0,17
27 9,6 0,48 92 13,5
0,52 151 16,5
1,66 223 4,1 0,26 281 2,8 0,50
28 5,8 0,84 93 17,6
1,54 152 9,8 0,72 224 4,8 0,92 282 8,9 1,79
30 9,6 1,43 94 28,2
2,37 153 10,1
0,41 228 11,1 0,49 283 2,6 0,59
31 3,9 0,30 96 19,2
2,99 154 15,6
0,91 229 7,3 1,53 284 9,3 1,54
33 13,0 1,00 98 33,0 0,99 155 16,8
0,71 230 16,3 0,66 285 10,4 0,40
34 5,9 0,57 99 33,0
2,18 157
9,6 1,29 231 14,5 1,72
Ref
a 20,8
2,4
35 30,7 1,52 100 20,4 1,72 158 10,1 0,54 232 10,3 0,97
39 2,7 0,37 101
12,1
1,39 159
6,9 0,51 234 15,9 2,10
40 6,2 0,21
101
w
12,5
0,74 160
8,3 0,65 236 17,1 1,77
41 44,8 2,84 102 8,6 0,53 161 6,2 0,30 237 13,9 0,66
43 3,1 0,78 103
26,0
1,23 162
6,3
1,38
238
28,4
0,90
44 10,6 2,00 105 13,4 0,31 163 11,5 1,02 238b 5,8 0,86
45 12,3 1,87 106 5,6 0,65 164
10,7
0,57
239
8,8
0,77
49 9,4 2,26 107 4,3 0,79
165
w
20,7
1,69
240
8,9
0,29
50 11,4 2,03 109 12,4 1,11 166
12,7
0,66
244
5,7
1,48
52 10,7 0,71 110 8,9 0,25 167 5,6
1,48
246
15,1
0,68
55 12,0 1,87 111 17,2 2,01 169 6,7
0,66
247
11,2
0,57
57 10,8 1,78 112 3,6 0,26 171
19,9
1,23
250
10,3
0,57
58 17,2 1,89 114 8,8 0,64 172 5,8
2,30
254
5,8
0,37
60 10,5 0,29 115 8,4 0,47 175 7,2
0,80
255
14,3
1,54
61 8,6 1,64 116
13,4
0,60 179
15,0
1,42
258
14,0
2,09
63 2,4 0,44 117 4,6 1,14 180
21,0
1,02
259
17,2
1,37
65 15,5 1,63 118 15,8 0,65 181 8,3
1,86
260
6,1
0,15
68 24,8 0,67 120 14,3 0,60 182
18,2
1,21
261
10,9
2,80
70 13,2 1,00 121 13,1 2,13 189 3,5
0,30
262
6,8
0,29
US/GHA/02/006 ŁFinal Report; Part I: Health Assessment and Survey Proposals ŁAppendix - December 2003 A
A2 - Table 2 Hg concentration (Ąg.L-1) in urine samples (mean of the 2 measurements on 2 different mineralisations excepted for recommended
seronorm trace element on 16 measurements)
Id. N░
Mean
St.Er.Mean
Id. N░
Mean
St.Er.Mean
Id. N░
Mean
St.Er.Mean
Id. N░
Mean
St.Er.Mean
Id. N░
Mean
St.Er.Mean
0 11,0 0,32 74 38,0
1,18 123
23,3
0,51 190 6,6 0,27 262 4,8 0,24
1 15,8 0,55 76 20,3
1,14 126
3,8
0,19 196 6,5 0,22 266 5,9 0,35
2 6,1 0,56 77 31,8
1,32
127
6,6
0,35 198 16,8 1,39 267 65,8 3,00
3 11,8 0,36 79 9,3 0,33 128
12,1
0,39 200 11,5 0,53 268 2,9 0,36
8 8,8 0,22 80 4,0
0,20
130
6,9
0,51 201 3,4 0,15 269 26,7 0,95
11 44,0 0,80 81 8,5 0,44 131 5,9 0,74 203 66,3 3,04 270 5,2 0,51
15 11,9 0,77 84 4,9 0,40 134
21,8
0,54 206 34,5 1,32 271 5,0 0,26
16 5,7 0,18 85 13,2
0,75 135
7,3
0,15 207 31,0 1,24 272 5,5 0,67
17 10,9 0,25 86 4,5 0,27 138 4,9 0,11 208 33,2 1,11 273 30,7 1,20
19 11,6 0,78 87 2,6 0,09 139
13,8
0,41 209 57,8 2,95 274 2,5 0,20
20 5,5 0,26 88 4,2 0,46 141
9,7
1,33 212 3,1 0,27 275 3,8 0,22
21 8,5 0,48 89 10,9
0,34 144
206,2
10,13 215 3,8 0,14 276 3,6 0.40
23 4,6 0,13 89b 8,5 0,83 147
9,9
0,51 216 5,1 0,23 277 11,5 0,30
25 33,4 0,77 90 6,2 0,46 149 5,9 0,33 218 8,4 0,89 278 46,7 0,26
27 7,9 0,38 92 60,2
3,96 150
11,8
0,27 219 11,8 0,63 280 0,7 1,81
28 7,5 0,20 93 9,3 0,51 151
8,2
0,29 220 14,9 0,91 281 4,4 0,40
30 52,0 1,75 94 130,2
7,84 152 7,6 0,19 223 4,7 0,20 282 11,7 0,16
31 7,3 0,98 96 6,8 0,36 153
6,7
0,12 224 4,9 0,56 283 4,9 0,57
33 30,6 1,03 98 198,6
8,95 154 9,5 0,40 228 10,5 0,39 284 11,4 0,35
34 12,1 0,69 99 105,4
4,86 155
93,6
1,22 229 9,0 0,77 285 29,8 0,64
35 199,6 3,51 100 6,6 0,28 157 6,1 0,32 230 24,3 0,91
Reference
50,1 2,20
39 4,8 0,56 101 6,7 0,40 158
5,2
0,24
231
28,5
1,23
40 32,0 0,76 101w 9,3 1,03 159
20,4
1,01
232
11,6
0,71
41 52,8 2,40 102 7,5 0,19 160 9,5
1,09
234
10,2
0,30
43 12,6 0,35 103 25,4 2,45 161 6,8
0,16
236
6,8
0,28
44 5,0 0,62 105 7,3 0,32 162
5,2
0,10
237
6,9
0,36
45 6,5 0,18 106 9,0 0,69 163
8,0
1,00
238
11,6
0,53
49 3,8 0,23 107 4,2 0,32 164
6,3
0,33
238b
24,3
0,42
50 9,1 0,82 109 9,1 0,83
165w
8,1
0,36
239
4,0
0,36
52 16,4 1,85 110 17,2 0,90 166 4,6
0,48
240
8,5
0,56
55 19,7 0,62 111 6,4 0,11 167 5,4
0,21
244
5,8
0,16
57 5,5 0,27 112 2,6 0,20 169
4,9
2,02
246
7,2
0,64
58 24,7 1,93 114 6,9 0,12 171 6,6
0,37
247
5,1
0,59
60 18,8 0,72 115 5,5 0,12 172 6,9
0,38
250
2,4
0,16
61 11,2 0,51 116 47,7 1,16 175 7,2
0,47
254
4,5
1,04
63 12,1 0,73 117 5,0 0,25 179 3,6
0,21
255
7,4
0,20
65 10,5 0,40 118 7,0 0,27 180
83,8
2,73
258
6,3
0,27
68 70,6 2,18 120 3,0 0,45 181
10,1
0,61
259
7,6
0,27
70 2,6 0,13 121 22,0
0,55 182
14,0
1,20
260
13,6
0,54
73 9,3 0,41 122 6,4 0,26 189
3,2
0,26
261
14,4
0,63
US/GHA/02/006 ŁFinal Report; Part I: Health Assessment and Survey Proposals ŁAppendix - December 2003 B
A3 - Table 3 Hg concentration (Ąg.L-1) in hair samples (mean of the 2-3 measurements on 1 mineralisatios excepted for recmmended
seronorm trace element on 16 measurements)
Id N░ Mean St.Er.mean
Id N░ Mean St.Er.mean Id N░ Mean St.Er.mean Id N░ Mean
St.Er.mean Id N░
Mean
St.Er.mean
Id N░
Mean
St.Er.mean
0
2,8
0,14
61
1,6
0,07
109
0,4
0,11
159
0,2
0,09
220
4,8
0,03
273
2,1
0,05
1
2,9
0,37
63
1,7
0,04
110
2,1
0,07
160
1,0
0,03
223
0,7
0,13
274
1,0
0,35
2
0,6
0,12
65
6,6
0,48
111
3,2
0,20
161
1,1
0,07
224
0,9
0,03
275
1,5
0,12
3
2,2
0,21
68
11,7
0,31
112
1,5
0,05
162
0,6
0,09
228
1,7
0,07
276
1,6
0,07
8
1,2
0,09
70
2,4
0,30
114
1,5
0,08
163
1,4
0,04
229
2,1
0,05
277
2,8
0,11
15
2,1
0,45
73
0,2
0,14
115
1,5
0,16
164
2,0
0,09
230
3,9
0,28
278
2,6
0,05
16
0,6
0,04
76
2,3
0,25
116
4,5
0,17
165w
1,9
0,08
231
2,7
0,25
279
1,6
0,08
17
1,6
0,08
77
15,7
1,6
117
2,3
0,38
166
2,7
0,10
232
1,9
0,76
280
1,8
0,11
19
1,6
0,05
79
1,9
0,30
118
4,2
0,16
167
0,5
0,21
234
2,1
0,06
281
1,8
0,10
20
1,8
0,17
80
1,3
0,08
120
1,6
0,10
169
0,9
0,08
236
3,0
0,19
282
1,7
0,15
21
1,3
0,09
81
2,9
0,17
121
4,4
0,35
171
0,8
0,01
237
0,4
0,13
283
1,7
0,12
23
2,5
0,33
84
1,8
0,11
122
3,1
0,68
172
0,8
0,00
238
1,5
0,07
284
2,5
0,09
25
6,7
0,34
85
1,4
0,14
123
2,6
0,22
175
1,2
0,12
238 b
3,3
0,09
285
4,1
0,11
27
0,7
0,07
86
2,3
0,60
126
2,4
0,06
179 3,1
0,59
239
1,4
0,17
Children
28
1,6
0,35
87
4,4
0,10
127
1,7
0,28
180 5,8
0,15
240
0,7
0,02
3\2
2,7
0,33
30
14,1
2,1
88
2,6
0,41
128
2,5
0,48
181 1,7
0,05
244
0,9
0,06
19\1
1,1
0,04
31
0,8
0,02
89
1,7
0,03
130
1,8
0,18
182
0,3
0,02
246
2,7
0,50
55/2
1,5
0,06
33
5,7
0,34
89b
5,7
0,23
134
1,6
0,20
189 0,7
0,03
247
2,0
0,12
63/1
2,3
0,10
34
2,2
0,22
90
0,6
0,10
135
2,6
0,26
190 1,3
0,16
250
0,8
0,03
92-2
2,6
0,47
35
13,3
0,55
92
7,3
1,07
138
8,0
0,26
196 2,5
0,03
254
0,6
0,10
96/2
2,4
0,28
39
0,8
0,22
93
3,0
0,31
139
1,9
0,09
198 2,0
0,07
255
2,6
0,09
101/2
12,6
0,36
40
3,2
0,12
94
9,5
0,24
141
1,6
0,10
200 1,4
0,13
258
1,8
0,14
131/2
2,1
0,07
41
5,0
0,24
96
0,8
0,11
144 40,8
0,98
201
0,6
0,04
259
1,0
0,13
150/1
14,3
1,9
43
0,5
0,23
98
6,1
0,18
147
3,5
0,00
203
8,4
0,34
260
0,9
0,05
153/2
5,1
0,64
44
1,2
0,06
99
4,3
0,17
149
1,2
0,37
206
6,6
0,16
261
2,0
0,08
160/1
1,1
0,07
45
1,5
0,15
100
2,2
0,33
150
1,8
0,02
207
3,2
0,31
262
0,6
0,12
163/1
2,0
0,08
49
1,4
0,06
101
5,9
0,28
151
4,7
0,51
208
6,8
0,58
266
0,4
0,08
165/2
3,1
0,11
50
1,9
0,19
101w 1,6
0,04
152
1,7
0,07
209
0,4
0,03
267
12,3
0,50
182/1
1,9
0,32
52
3,2
0,17
102
1,9
0,21
153
1,0
0,09
212
1,1
0,24
268
0,3
0,09
238/1
2,2
0,37
55
1,9
0,08
103 19,9
1,62
154
2,0
0,17
215
1,9
0,08
269
11,3
1,58
267/1
3,0
0,13
57
3,6
0,29
105
1,3
0,11
155
2,1
0,09
216
15,0
5,25
270
1,1
0,08
58
5,0
0,53
106
2,0
0,31
157
0,5
0,10
218
0,2
0,05
271
2,4
0,07
60
0,7
0,14
107
1,3
0,05
158
0,5
0,16
219
2,5
0,24
272
2,2
0,06
US/GHA/02/006 ŁFinal Report; Part I: Health Assessment and Survey Proposals ŁAppendix - December 2003 C
A4 - Table 4 Creatinine concentration (g.L-1) in instantaneous urine samples
Id.N░
g,L-1
Id.N░ g,L-1
Id.N░
g,L-1
Id.N░
g,L-1
Id.N░
g,L-1
11 1,37 68 2,18 117 1,64 167
1,73
239
0,93
15 1,28 73 0,90 118 2,39 172
1,94
240
0,90
16 0,54 74 1,79 120 1,61 175
2,03
244
1,43
19 1,07 76 1,76 121 1,64 181
1,34
247
1,52
23 1,91 77 0,99 122 1,76 182
1,79
258
2,09
25 0,90 79 1,61 123 2,21 196
1,76
259
1,34
27 1,04 80 0,54 126 1,52 200
0,99
260
1,52
28 1,46 81 1,67 127 1,01 201
0,93
261
1,88
30 0,84 84 1,37 128 1,49 206
0,81
267
1,46
31 1,19 86 1,25 130 1,91 207
2,18
270
0,48
33 1,76 89 1,52 131 1,37 208
0,39
271
0,81
34 1,16 92 2,87 134 2,33 209
2,00
272
0,87
39 0,75 96 1,58 139 2,66 218
2,27
273
2,45
40 1,73 98 1,61 141 1,58 219
1,46
274
1,22
41 0,90 99 1,64 147 1,34 220
1,01
275
1,37
43 1,85 101
1,13 144 1,91 223
1,55
276
0,87
45 3,01 103
0,81 151 1,88 224
0,87
277
0,75
52 0,39 105
1,04 153 1,97 227
1,16
278
1,10
55 1,10 106
1,01 154 2,48 231
1,13
280
1,85
57 0,99 107
1,22 159 2,03 232
1,40
281
1,31
58 1,37 107
0,69 160 1,49 234
1,10
282
1,91
60 2,57 110
1,91 161 1,91 236
2,18
283
2,00
61 3,76 112
0,36 162 0,99 237
1,16
284
1,19
63 1,46 115
1,19 163 0,75 238
1,31
285
0,87
65 1,04 116
0,84 165 0,90 238
1,31
US/GHA/02/006 ŁFinal Report; Part I: Health Assessment and Survey Proposals ŁAppendix - December 2003
D
B1 - OBJECTIVES OF THE PRELIMINARY SOCIOLOGICAL
INVESTIGATION
The objectives to be waited through the preliminary sociological investigation gather in 2
categories:
- Knowledge of the overall population sociology;
- Informations concerning individuals.
1 - Knowledge of the overall population sociology;
The location of the site using precise maps and, if it is possible, satellite pictures would be
appreciated .
THE VILLAGE AND ITS POPULATION :
- overview of the population : number of males, females , children; distribution of ages
- Description of the type of habitat:
How many households? How many people by household (mean)?
- Ethnic diversity
- Education: local school(s) ? levels ? number of pupils
- Infrastructure: sources of drinking water and of other water uses, hygiene and sanitation
(toilets...), health facilities, sources of energy, market .....
- Political Authority: chief(s), assembly .....
-Types of activity: mining, farming (importance of agriculture and animal rearing in this
area. Is there pesticides use in agriculture. Describe the proximity of rice fields.), trading,......
ARTISANAL GOLD MINERS (AGM) COMMUNITY
- General description of this community: number, sex, age, other occupational activities,
where do they live.
- Detailed description of the overall process of gold production; what is the role of each
AGM operator in this process. Where does mercury amalgamation, burning, occur: in the field? In
the household? or other? Is it a seasonal activity (dry and wet season), local organisation of gold
and mercury market. Is there child labor.
Amount of mercury yearly used in the village, ratio gold/mercury for gold production in the
different seasons.
DIET HABITS
Type of food consumed. Fish consumption: Name the fish they consume regularly. List
from the most consumed species to the least (try to obtain a % of each species consumed in each
season).
2 - Informations concerning individuals.
See the individual questionnaire. This questionnaire must be filled for 150 to 200
individuals in the AGM site and 50 approximately in the control site.
US/GHA/02/006 ŁFinal Report; Part I: Health Assessment and Survey Proposals ŁAppendix - December 2003 E
B2 - QUESTIONNAIRE FOR THE SOCIOLOGIST
Name
of
interviewer:
Questionnaire for the sociologist
Small-scale gold mining and mineral processing
Introduction and Informed Consent
(Introduce yourself, explain the purpose of the interview and request consent to be interviewed)
Personal Data
ID Number:
Surname of the particpant
First Name
Date of Birth
Age:...........
Sex:
Male
Female
Status
Living alone
Married
Number of
wives??
Education level (to be defined by sociologist: (none, basic, primary, secondary?))
Number of children and dependants living in the house: ..........
Chlidren or
dependants name
Sex
Age
Education
level
Address:....... To be defined by the sociologist after 4 to 5 zones identification in
the village
How long do you live in this area?
______ year(s)
US/GHA/02/006 ŁFinal Report; Part I: Health Assessment and Survey Proposals ŁAppendix - December 2003
F
Work Exposure
Detailed description of the job
____ Miner (in an industrial plant)
____ Artisanal gold miner (AGM)
____ Gold smelter (gold buyer)
____ Mercury seller
____ Farmer
____ Trader
____ Office Job
____ Driver
____ Other job..................................................................................................
How long do you work as an artisanal gold miner (AGM)
Years
Who is working as an AGM
yourself
Spouse
Number of children: .....
Number of other dependants: .....
For how long do you work as an AGM (Years)
Yourself:
.....
Spouse: .....
Child
1
:
.....
Dependant
1:
....
Child
2:
.....
Dependant
2:
....
Number of months per year of activity as an AGM
Yourself:
.....
Spouse: .....
Child
1
:
.....
Dependant
1:
....
Child
2:
.....
Dependant
2:
....
2.6Occupation (Detailed description of the job)
Washing
Sieving
amalgamation
Burning
comments:..............................................................................................................................
1.7 Do you handle mercury?
Yes
No
Uncertain
1.8 Where do you get mercury for amalgamation and other inputs?
a) Gold Dealers
b) Spouse
c) Relative
d) Others (specify)
US/GHA/02/006 ŁFinal Report; Part I: Health Assessment and Survey Proposals ŁAppendix - December 2003
G
1.9 Are you aware of any health or environmental hazards that may be
caused by mercury use in gold mining?
Yes
No
If yes, what are the hazards?
3 Diet Issues
How many times per week do you eat each of the following foods:
a) Meat
b) Fish
c) Chicken
d) Eggs
e) Milk
f) Rice
g) Vegetables
h) Fruits
i) Other (specify)......
4 Training
4.1 Have you received any training regarding your mining activities?
Yes
No
Where......................... What type of training ......................................
Who facilitated the training? ..............................................................
Has the training helped in your activities: Yes
No
How? ..........................................................................................
(The interviewer should read a short description of the improved mining technology and
explain it if necessary)
4.2 What are your comments in case of the introduction of proposed
improved mining and processing technology?
...............................................................................................................
...
..................................................................................................................
4.3 Would you be willing to learn this technology?
Yes
No
You will be questioned about your living circumstances and health problems related to mercury.
you will be medically examined including neurological examination. Blood, urine and a small amount of hair
nail will be taken.would you participate? Yes
No
Thanks for your cooperation, do you have any questions?
US/GHA/02/006 ŁFinal Report; Part I: Health Assessment and Survey Proposals ŁAppendix - December 2003
H
SUMMARY of the questionnaire
Name
ID Number
Sex of Respondent
Location (zone in the village)
Age of Respondent
Level of Education of Respondent
Residential Status (native/migrant)
Status (married...)
Number of children
Other Economic Activities Outside AGM
How long working as AGM
Persons working AGM in your house
Respondent Mercury Use Status
No. of times Respondent burns amalgam
Knowledge of hazards associated with exposure to Mercury
First source of Food
Second source of Food
Third source of food
Participation: Readiness to take Medical Exams
US/GHA/02/006 ŁFinal Report; Part I: Health Assessment and Survey Proposals ŁAppendix - December
2003 I
5-Jan-2004
Original: English
Assistance in assessing and reducing Mercury pollution
emanating from artisanal gold mining in GHANA Ł Phase II
US/GHA/02/006
Part II - Assessment of mercury releases to the environment and
proposal for monitoring these releases
Prepared by Mr Marc BABUT and Mr Ransford SEKYI
On the basis of the analytical work done by the LCABIE (Laboratoire de Chimie
Analytique Bio-inorganique & Environnement), University of Pau (Pr Martine POTIN-
GAUTIER, Ms Sylvaine TELLIER & Dr William BANNERMAN (University of Kumasi,
University of Pau), and the technical help of the University of Montpellier I
Project Manager: Christian BEINHOFF (PTC/PEM)
United Nations Industrial Development Organisation Vienna
2 /2
Table of contents
INTRODUCTION ..................................................................................................................................... 5
I.A
Objectives of the study ............................................................................................................................. 6
II
ASSESSMENT METHODOLOGY ................................................................................................ 6
II.A
Strategy ...................................................................................................................................................... 6
II.B
Sampling protocol ..................................................................................................................................... 8
II.B.1
Sediments ............................................................................................................................................................ 8
II.B.2
Fishes................................................................................................................................................................... 8
II.B.3
Soils...................................................................................................................................................................... 9
II.B.4
Vegetables ........................................................................................................................................................... 9
II.C
Analytical methods.................................................................................................................................... 9
II.C.1
Samples preparation ............................................................................................................................................ 9
II.C.2
Total mercury analysis........................................................................................................................................ 11
II.C.3
Methyl-mercury analysis..................................................................................................................................... 12
III
RESULTS ................................................................................................................................... 13
III.A Sediments and soils................................................................................................................................ 13
III.B Fish ........................................................................................................................................................... 15
III.C Vegetables................................................................................................................................................ 16
IV
DISCUSSION.............................................................................................................................. 16
IV.A Alluvial mining, an ecological disaster.................................................................................................. 16
IV.B Mercury impacts in Gyapa area.............................................................................................................. 18
IV.B.1
Bed sediments.................................................................................................................................................... 18
IV.B.2
Fishes................................................................................................................................................................. 20
IV.B.3
Soils.................................................................................................................................................................... 21
IV.B.4
Vegetables ......................................................................................................................................................... 22
IV.C Mercury downstream transport throughout the Ankobra catchment................................................. 23
IV.D Human exposure through the diet ......................................................................................................... 23
IV.E Comparison with the phase I study (Dumasi)....................................................................................... 24
IV.E.1
Sediment contamination patterns in the two study sites..................................................................................... 24
IV.E.2
Fish contamination patterns in the two study sites............................................................................................. 25
IV.F Summary of findings............................................................................................................................... 25
V
A PROPOSED FRAMEWORK FOR MONITORING THE MERCURY POLLUTION IN THE
CONCERNED CATCHMENTS.............................................................................................................. 26
V.A Objectives ................................................................................................................................................ 27
V.B Strategy .................................................................................................................................................... 27
V.B.1
Type of materials................................................................................................................................................ 27
V.B.2
Measurements.................................................................................................................................................... 29
V.B.3
Frequency .......................................................................................................................................................... 29
2US/GHA/02/006 ŁFinal Report; Part II: Assessment of Mercury Releases to the Environment and Proposal - December 2003
3 /3
V.B.4
Sampling points selection................................................................................................................................... 29
V.B.5
Application.......................................................................................................................................................... 30
V.C Monitoring program summary................................................................................................................ 30
RECOMMENDATIONS.......................................................................................................................... 31
References ........................................................................................................................................................... 32
Acknowledgements: Mr AKPA (UNIDO, Accra), EPA staff, Mr C. SACKEY (Minerals Commission), Mr
H. PELLA (Cemagref)
List of tables
Table 1 - Summary of the sampling program..........................................................................8
Table 2 - Soil sample pre-treatment protocol........................................................................10
Table 3 - Sediments pre-treatment protocol .........................................................................10
Table 4- Pre-treatment of fish samples ................................................................................11
Table 5 Ł Vegetables pre-treatment protocol ........................................................................11
Table 6 - Mercury concentrations in sediment samples (Ąg.kg-1 dry weight) ..............................13
Table 7 - Mercury concentrations in soil samples (Ąg.kg-1 dry weight) ......................................14
Table 8 - Mercury concentrations in fish samples (Ąg.g-1).......................................................15
Table 9 Ł Total mercury concentrations in cocoyam roots (Ąg.kg-1)..........................................16
Table 10 - Sediment and fish pros and cons as sampling materials ..........................................28
List of figures
Figure 1 Ł Map of South-Western Ghana including the study area .............................................5
Figure 2 - Mercury diffusion pathways in Gyapa ......................................................................7
Figure 3 - View of a digging zone close to Gyapa ..................................................................17
Figure 4 - Total Hg in river and pit sediments .......................................................................19
Figure 5 - Total Hg in pits..................................................................................................20
Figure 6 - Total Hg in a soil-sediment system at Gyapa..........................................................22
Figure 7 Ł Relationship between soil and cocoyam roots samples ............................................22
Figure 8 - Representation of the monitoring cycle .................................................................27
Appendix
Sampling points locations in and around Gyapa (map + table)
3US/GHA/02/006 ŁFinal Report; Part II: Assessment of Mercury Releases to the Environment and Proposal - December 2003
Abstract
This study is part of the second phase of a project aiming at assessing human health and
environmental impacts of mercury pollution due to artisanal gold mining in Ghana. While the first
phase occurred in a typical village (Dumasi) where gold is extracted from hard rock, the second
was realised in an area (Gyapa) where gold is obtained from alluvium. Sediment and fish samples
were collected in several extracting sites around Gyapa; soil and vegetables (cocoyam roots) were
sampled within and around the village. A few sediment and fish samples were also gathered at the
Ankobra estuary. Analyses of mercury were done in Pau (basically total-Hg by CV-AFS; methyl-Hg
was looked for in a few soil and sediment samples, and in all the cocoyam roots).
Sediments in the river system display variable mercury concentrations, from high to moderate
levels. The sediments sampled in exploited pits are polluted, whilst mercury concentrations tend to
decrease almost rapidly in abandoned pits. Soil contamination is more pronounced around
amalgam distillation places. However, gold extraction related activities are not the only source of
mercury in the area: some types of tropical soils may be naturally enriched; moreover, vegetation
fires would increase the mercury content of topsoil, and its mobility through erosion accordingly.
Food items (fish and vegetables) are also contaminated by mercury. Cocoyam roots mercury
contents remain low, as compared to the soil concentrations. Although mercury concentrations in
fish are most often less than safety limits fixed by WHO or US-FDA, the acceptable weekly (and
daily) intake could be exceeded for certain species. There is also an evidence of large scale
transport, leading to an accumulation of mercury in mangrove sediments in the Ankobra estuary.
The contamination pattern appears more diffuse than in the hard rock gold mining site investigated
during the first phase study. Thus sediments and fishes display lower mercury levels in Gyapa
(phase II) than in Dumasi (phase I). This statement can be extrapolated with caution to other sites
using the same processes.
Gold extraction in alluvium leads to major physical damages; when it is done in the river bed and
the associated floodplain, it strongly disturbs the flow regime, and destroy habitats for
invertebrates, fish and plants for quite a long time. Pits may also be dug directly in cultivated
parcels. Therefore, gold extraction from alluvium affects also directly the food resources
availability.
A monitoring program allowing to assess the mercury pollution due to artisanal gold mining is
proposed for the whole auriferous region. This program should use sediment and fish as sampled
matrices; the sampling campaigns would occur at the end of the dry season. Some preliminary
studies should accompany the program, in order to determine mercury background concentrations
and to select the fish species to sample.
The introduction of appropriate technology such as retorts would contribute to decrease mercury
releases to the environment, but would not eliminate them. Other approaches, e.g. education, or
fish farming, could also help to decrease the environmental impacts of artisanal gold mining.
5 /5
INTRODUCTION
In the year 2000, a study of the environmental impacts of artisanal gold mining at a pilot
site was carried out in Dumasi (Ghana, Western Region) (Babut et al., 2001). This pilot
site is among others characterised by a typical process, based on solid rocks brought
back to the village, then crushed, and afterwards treated by gravity concentration and
amalgamation. Therefore, it appeared difficult to extrapolate the conclusions to regions
where the typical process used is different, in particular when based on alluvium digging.
Following the presentation of the findings and conclusions in April 2001, it was thus
decided to carry out a second phase study focusing on an alluvial area.
The site of Gyapa (Western Region) was selected on several criteria: year-long
exploitation, accessibility, cooperation of the population. It is located about 70 km from
Tarkwa, on the road to Dunkwa (Figure 1). The village is built on a plateau (alt. 450m)
overhanging two different river stretches. The Yaya river is flowing on the northern side
of the plateau, while the Akoma Kofi river originates on the eastern side of the village,
and flows to the south. Digging sites are located throughout the area, either along the
Yaya river or its tributaries such as the Buosim river, or other rivers such as the Subin
river (see map in annex).
Study area (Gyapa)
Figure 1 Ł Map of South-Western Ghana including the study area
Gold washers dig large pits in the alluvium and/or floodplains along the river. They wash
the cobbles and gravels on sluice boxes, where they collect either gold nuggets or
powder concentrate gathered on hemp tissues. This concentrate is further processed by
amalgamation.
5US/GHA/02/006 ŁFinal Report; Part II: Assessment of Mercury Releases to the Environment and Proposal - December 2003
6 /6
I.A Objectives of the study
The study's objectives, as expressed in the terms of reference of the mission, were
twofold:
(a) Investigate situation of the environment around an alluvial gold mining site,
take samples where pollution can be assumed. Specifically, assess the nature
and extent of the mercury pollution in a selected river system and adjacent
(agricultural) sites.
(b) Discuss all the issues related to the objective of introducing and setting up a
monitoring system for continuous water quality assessment.
II ASSESSMENT
METHODOLOGY
II.A Strategy
According to the sociologist study done prior the current assessment (Tsekpo, 2002), the
amalgamation process is done in Gyapa either close to the sluice boxes or in the village.
In the latter case, the concentrate is brought back to the village with water. This means
that two separate contamination pathways can be distinguished and should be accounted
for in the sampling strategy: (i) release of mercury in the pits, at the amalgam washing /
squeezing and/or burning steps; (ii) diffusion by evaporation and further deposition on
soil in the village. Moreover, soils will be washed during the rainy season, and runoff will
transport contaminated soil particles. These particles could then contaminate other soils,
and return to the river system. As the first phase study had shown a rather high
concentration of mercury in one sample of cocoyam root (Babut et al., 2001), this kind of
vegetable should also be collected where soils would be sampled. These pathways and
the kind of samples collected around Gyapa are shown on the diagram at Figure 2.
6US/GHA/02/006 ŁFinal Report; Part II: Assessment of Mercury Releases to the Environment and Proposal - December 2003
7 /7
River system
Digging +
concentration
Amalgamation
Washing +
squeezing
Water
Sediment
Biota (fish)
Downs tream transport
Sediment
Biota (fish)
Soil
Runoff
Soil
Roots (cocoyam)
Roasting
Washing +
squeezing
Amalgamation
Soil system
Figure 2 - Mercury diffusion pathways in Gyapa
Grey boxes designate the types of samples collected at various step of the contamination and
diffusion process.
The atmospheric pathway could also be important. Further deposits on leaves is possible,
followed by absorption into the shoots (Boening, 2000; Melieres et al., 2003). Thus
human (or wildlife) exposure to mercury could occur through leaves consumption1.
However, leaves samples would be difficult to keep in appropriate condition before their
analysis. Therefore, it was decided not to sample leaves. The issue of the extent of
mercury atmospheric transport in the surroundings of galamseys sites remains pending
and should probably be addressed through a research approach, rather than through a
survey such as the study described herein.
Therefore, according to our comprehension of the diffusion pathways in Gyapa area
(Figure 2), the sampling program focussed on sediments, fishes, soils and roots of
selected vegetables. Sediments should be seen here either as a sink of mercury or as a
signature along transport pathways. For all samples, the sampling program has to
include a few reference (upstream) samples, and on-site and downstream samples
accordingly.
1 Leaves of specific vegetables are used in some local recipes
7US/GHA/02/006 ŁFinal Report; Part II: Assessment of Mercury Releases to the Environment and Proposal - December 2003
8 /8
A few samples (mainly sediments) were also collected out of the study area; they were
collected quite far downstream. Their number is obviously not sufficient to give an
overview of mercury contamination in the whole catchment, but will provide an insight on
long range transport. The sampling program is summarised in Table 1; the locations
figure on the map in Appendix.
River
Site name
fish (fillet)
sediment
soil
vegetable(root)
Akoma kofi old pits Gyapa
1
2
soil Gyapa (reference ?)
1
Ankobra
estuary, left bank
1
estuary, right bank
2
1
Buosim
river
1 1
river, pits
1
1
Esheri
bridge - tarred road
1
Subin
old pit,
1
pit, down the main road,
1
pit,
1
pit/river
1
1
bridge 1
upstream mining site
1
Yaya
downstream Yaya river
1
2
field - Gyapa
1
2
2
Gyapa village
5
3
pits
Gyapa
1
pits upstream pits
1
1
upstream reference site
1
1
1
Total
9 20 7 7
Table 1 - Summary of the sampling program
II.B Sampling protocol
The geographic coordinates were taken at each sampling site with a GPS device (GPS76,
GARMIN, Olathe, Kansas, USA).
II.B.1 Sediments
At each site, fine grain sediments ( 5 cm thick) were collected in several places with a
shovel and put in a bucket. Vegetal debris and cobbles were removed and the sediment
was gently homogenised. Then about 250 ml were taken in a plastic bottle with a double
cap and frozen.
II.B.2 Fishes
Fishes were captured by various methods, depending of environmental (physical and
hydrological) conditions. In alluvial mining surroundings, fishes are supposed to live in
the ponds formed in the pits. So in that case the water in the pits was pumped almost
8US/GHA/02/006 ŁFinal Report; Part II: Assessment of Mercury Releases to the Environment and Proposal - December 2003
9 /9
completely, and the fishes caught by hand or with a wicker basket. When the fishes were
to be captured in less disturbed river courses, wicker traps were placed 1 or 2 days in
advance in the river bed. The few fishes collected in the Ankobra estuary were caught
with nets by local fishermen.
Fishes were dissected within a few hours after capture, and a few grams of dorsal muscle
was sampled and kept in plastic bags (suitable for food conservation) and frozen.
II.B.3 Soils
The first 1-2 cm of top soils were grasped in several places of each site; cobbles, small
rocks and plant debris were removed, and the soil carefully mixed until the heap became
homogenous. Then it was divided in 4 parts. 3 of them were discarded; the remaining
part was again divided, in 2 to 4 part depending of the available quantity. Again 1 part
was taken, packed in a plastic bag and frozen.
II.B.4 Vegetables
According to the conclusions of the Dumasi's study (Babut et al., 2001) and to further
analyses on a range of plants in the Ankobra catchment (Bannerman, 2003), the
sampling focused on cocoyam tubers. They were gathered at various places in the village
and close to the mining area, in order to reflect possible pathways of mercury; as far as
possible, they were collected close to soil sampling sites. Then the roots were washed
with tap water followed by de-ionised water and frozen in plastic bags.
II.C Analytical methods
All samples were processed and analysed at LCABIE (Analytical Bioinorganic &
Environmental Chemistry Laboratory) in Pau University (France).
II.C.1 Samples preparation
II.C.1.1 Soils
Masses between 50-100g of samples were freeze Ł dried, hand ground in porcelain
mortar with pestle and preserved in clean water-tight screw-capped polypropylene
containers (POLY LABO sterilised). About 0.5 g of the dried sample was weighed into the
sample holder of a microwave digester (PROLABO 301) and digested according to the
following six-step automated digestion programme using concentrated HNO3, HCl and HF
(MERCK Suprapur):
9US/GHA/02/006 ŁFinal Report; Part II: Assessment of Mercury Releases to the Environment and Proposal - December 2003
10 /10
STEP
1 2 3 4 5 6
REAGENT HNO3 HCl HF
HCl WATER
SPEED
1/10
10 10 8 10 10
VOLUME
ml
6 5 15 3 40
POWER
%
10 20 20 85 15 35
TIME
mn.
5 5 5 20 10 10
Table 2 - Soil sample pre-treatment protocol
The digested solutions were diluted to 100ml with deionised water (Milli-Q). Further
dilutions were made with reagent blank prior to the Cold Vapor-Atomic Fluorescence
Spectrometric (CV-AFS) analysis.
II.C.1.2 Sediments
The samples were freeze - dried, hand ground and preserved in clean water-tight screw-
capped polypropylene containers (POLY LABO sterilised). About 0.25 g of the dried
sample was weighed into the sample holder of a microwave digester (PROLABO 301) and
digested according to an automated digestion programme summarised in Table 3.
STEP 1
2
REAGENT HNO3
H2O2
VOLUME ml
8
2
POWER %
10
10
TIME min.
5
5
Table 3 - Sediments pre-treatment protocol
The digests were diluted to 50ml with Milli-Q water. Further dilutions were made with
reagent blank prior to the Cold Vapour-Atomic Fluorescence Spectrometric (CV-AFS)
analysis.
II.C.1.3 Fishes
About 100 mg of the homogenised dry fish is weighed into an extraction tube and
digested in an open focused 200W microwave system (MICRODIGEST 301 PROLABO)
using the three Ł step programme described in Table 4. Excess KMnO4 may be removed
after the digestion by addition of a few drops of hydroxylamine chloride. The obtained
digest is diluted with Milli-Q water in a 25 ml volumetric flask.
10US/GHA/02/006 ŁFinal Report; Part II: Assessment of Mercury Releases to the Environment and Proposal - December 2003
11 /11
STEP I
II
III
REAGENT
Aqua regia
H2O 5%
KMnO4
VOLUME (ml)
3
5
2
POWER (W)
40
0
40
TIME (min.)
5
0
5
Table 4- Pre-treatment of fish samples
II.C.1.4 Vegetables
Vegetable samples were peeled (when necessary) on the field, washed successively with
tap water and then with Milli-Q water, chopped with plastic knives, placed in double zip-
lock bags and kept frozen. They were then freeze-dried, ground in suitable clean mortars
and kept refrigerated in polypropylene air-tight bottles until analysis.
Between 100 mg and 200 mg dried homogenised vegetable sample is weighed into a
microwave sample tube and digested according to the program summarised in Table 5.
Then ultra-pure water to 25 ml is added up to the necessary volume in a volumetric
flask.
STEP 1
2
3
REAGENT HNO3 - H2O2
QUANTITY (ml)
5
-
3
POWER (%)
40
0
40
TIME (min)
5
5
5
Table 5 Ł Vegetables pre-treatment protocol
II.C.2 Total mercury analysis
The pre-treatment procedures described earlier ensures that all mercury is present in
solution as Hg2+. Total mercury is determined by the cold vapour Ł atomic fluorescence
technique (CV Ł AFS) using the continuous flow approach. The procedure involves an
online reduction of Hg2+ to Hg0 vapour by SnCl2. Typically, the reductant is 5%m/v SnCl2
in 15%HCl. The mercury vapour is swept by argon as carrier gas to the AFS detector
(Merlin PSA 10.023).
Various sample matrices are analysed using reagent blanks which are basically in the
same chemical media as the analyte in the respective sample solutions. Measurements
were controlled by the Touchstone « control software.
The analytical performances of the procedures employed were assessed for linearity,
limits of detection and accuracy and precision of the analytical measurements. The
analyses were done in dust-free rooms meant for trace metals. The reference materials
used for the accuracy assessment include NIST SRM 2709 San Jaoquin Soil, NIST SRM
11US/GHA/02/006 ŁFinal Report; Part II: Assessment of Mercury Releases to the Environment and Proposal - December 2003
12 /12
2710 Montana Soil and BCR RM 320 River sediment. Recoveries were higher than 95%.
For other types of samples, the reference materials were GBW 08508 rice and BCR 464
fish. Recoveries were also satisfactory.
II.C.3 Methyl-mercury analysis
In most fishes, 90% or more of the total Hg is methyl-mercury (USEPA, 1999);
therefore, in the context of this study it is useless to analyse this species in fish muscles.
As little is known on methyl-mercury content in vegetables2, it seems preferable to focus
on root and soil samples, in order to get an estimation of possible pathways and transfer
rates.
A few sediment samples were also analysed for methyl-mercury (Me-Hg), although there
is no simple direct relationship between the sediment content and fish contamination in
general.
The first step of the analysis of Me-Hg in sediments involves the extraction of that
species and Hg2+ from the sediment by an open microwave method. Approximately 1 g of
homogenised dried material is weighed in the vessel; 10 ml of nitric acid (6M) is then
added and exposed to microwave irradiation at 60 W for 3 mn. The obtained solution is
cooled to room temperature, transferred to a 15 ml tube and centrifuged at 5000 RPM for
5 mn. The supernatant is kept refrigerated in a Pyrex « with a Teflon cap till analysis.
The analysis itself is done following the ethylation- cryogenic trapping - gas
chromatography - atomic fluorescence spectrometry (ET-CT-GC-AFS) procedure. In this
procedure, the first step consists of a derivatization of the mercury species with sodium
borate tetraethyl. The gas chromatography step yields 3 peaks, namely Hg0 (blank),
ethyl-Me-Hg corresponding to the former Me-Hg, and ethyl-Hg from the initial Hg2+.
A very similar procedure was used for vegetables; operational details are given in W.
Bannerman's thesis (Bannerman, 2003).
2 a quick search on Science Direct provided 0 response.
12US/GHA/02/006 ŁFinal Report; Part II: Assessment of Mercury Releases to the Environment and Proposal - December 2003
13 /13
III RESULTS
III.A Sediments and soils
Sample
River
Site name
Total Hg
SE1
Yaya
field - Gyapa
55.0
SE2 Yaya
pits
Gyapa
106.0
SE3 Yaya
pits
Gyapa
583.5
SE4
Akoma Kofi
old pits Gyapa
24.0
SE5
Akoma Kofi
old pits Gyapa
<5
SE6 Subin
upstream
Subin
<5
SE7 Subin
pit,
Subin
40.5
SE8 Subin
pit/river
Subin
183.5
SE9
Subin
pit, down the main road, Subin
166
SE10
Subin
old pit, Subin
18.0
SE11
Esheri
bridge - tarred road
88.0
SE12 Yaya
downstream
Gyapa
1102
SE13 Yaya
downstream
Gyapa
569
SE14 Buosim
Buosim
river
<5
SE15
Buosim
Buosim river, pits
18.0
SE16
Yaya
pits Yaya (upstream pits)
3021
SE17
Yaya
Yaya upstream reference site
780.5
SE18
Ankobra
Ankobra estuary, right bank
1578.5
SE19
Ankobra
Ankobra estuary, left bank
1691.5
Table 6 - Mercury concentrations in sediment samples (Ąg.kg-1 dry weight)
The recoveries of both soil and sediment certified samples were higher than 95%;
measured values were in accordance with the target values.
Mercury concentrations in sediments appear quite variable in the field; the contaminant
can not be detected in several abandoned pits along the Akoma Kofi river. There is
evidence of downstream transport throughout the catchment (cf. Esheri, Ankobra
estuary); the sample collected in the Esheri river could not be taken in a deposition area,
and contained some clay from the bank, so the concentration may be underestimated.
Surprisingly, the mercury concentration in the sediment collected upstream the Yaya
river seems rather high.
13US/GHA/02/006 ŁFinal Report; Part II: Assessment of Mercury Releases to the Environment and Proposal - December 2003
14 /14
Index
Site
Total Hg
SO1 Gyapa
village
1932.0
SO2 Gyapa
village
2697.5
SO3 Gyapa
village
1397.5
SO4
Gyapa village (10 meters away from SO3)
22935.5
SO5 Gyapa
village
9301.0
SO6
Gyapa (supposed reference)
837.0
SO7
Yaya upstream reference site
1303.5
Table 7 - Mercury concentrations in soil samples (Ąg.kg-1 dry weight)
Mercury concentrations in soils appear quite variable, at a meter scale: SO3 and SO4
samples were collected in two yards distant of 10 meters from each other. The two
samples supposed to be reference soils, i.e. away from amalgam burning, display Hg
concentrations between 800 and 1300 Ąg.kg-1.
Five sediment samples (SE4, SE8, SE13, SE18 and SE19) were analysed for methyl-
mercury (MeHg); they ranged between 3 and 5 ng.g-1 (dry weight). Moreover, MeHg was
measured in three soil samples (SO2, SO5 and SO7). The concentrations were 5, 4 and 4
ng.g-1 respectively.
In both cases, there was seemingly no relationship between MeHg and total Hg
concentrations.
14US/GHA/02/006 ŁFinal Report; Part II: Assessment of Mercury Releases to the Environment and Proposal - December 2003
15 /15
III.B Fish
Local common
Length
Hg total
Hg total
Code Common name name
(cm)
(dw)
std dev
Moisture %
(ww)
std dev
F1/1 mudfish
adwen
16.0
1.233
0.08
81.1
0.23
0.02
F1/2 mudfish
adwen
17.5
0.626
0.05
80.2
0.12
0.01
F2/0 mudfish
adwen
31.0
2.758
0.20
80.3
0.54
0.04
F3/1 mudfish
adwen
12.5
1.831
0.07
82.6
0.32
0.01
F3/2 mudfish
adwen
14.5
1.675
0.03
80.6
0.32
0.01
F4/0 mudfish
adwen
49.5
1.931
0.10
78.5
0.42
0.02
F5/0
kwafon
18.7
2.413
0.09
81.2
0.45
0.02
F6/1 mudfish - black adwen
17.5
1.935
0.10
76.4
0.46
0.02
F6/2
kwafon
14.5
4.441
0.16
83.1
0.75
0.03
F7
kwafon
nm3 2.860
0.11
80.6
0.55
0.02
F7/1
kwafon
18.0
2.629
0.14
80.4
0.52
0.03
F7/2 mudfish
adwen
17.0
2.024
0.09
83.1
0.34
0.02
F8/0
nsumpu
21.2
0.960
0.05
78.3
0.21
0.01
F9/2 grey
mullet
msamba
13.0
0.223
0.01
78.1
0.05
0.00
F9/1 grey
mullet
msamba
17.0
0.182
0.04
77.4
0.04
0.01
Table 8 - Mercury concentrations in fish samples (Ąg.g-1)
Except the 3 specimen caught in Ankobra estuary, contamination of fish muscle is
comprised between 0.12 and 0.75 Ąg.g-1. There is no obvious relationship with fish size
(data not shown).
Mean concentrations in kwafon are higher than in adwen. Nevertheless, according to a
Student test, total mercury mean concentrations in both species are not significantly
different at p = 0.01.
3 Not measured
15US/GHA/02/006 ŁFinal Report; Part II: Assessment of Mercury Releases to the Environment and Proposal - December 2003
16 /16
III.C Vegetables
Moisture
Code
Site name
Hg dw
SD
(%) Hg
ww
SD
Yaya upstream
RV7
19 1.00
71 5.51
0.29
reference site
RV1
field - Gyapa
112
18.00
93
7.84
1.26
RV3 Gyapa
village
27 2.00
68 8.64
0.64
RV4 Gyapa
village
127 7.00 94 7.62 0.42
RV5 Gyapa
village
111 9.00 82 19.98
1.62
RV2
field - Gyapa
19
1.00
58
7.98
0.42
RV6 Buosim
river
30 2.00
89 3.30
0.22
Table 9 Ł Total mercury concentrations in cocoyam roots (Ąg.kg-1)
Although about 1000 times lower than concentrations in sediments and fish, total Hg
concentrations in cocoyam roots are non negligible, and show evidence of transfer from
the soils to these vegetables.
MeHg was measured in the seven cocoyam roots samples. It was lower than the
detection limit in all of them.
IV DISCUSSION
IV.A Alluvial mining, an ecological disaster
Alluvial mining strongly disturbs the physical characteristics of the environment. Miners
do not care about water discharge; they are just looking for a place to dig, and manage
the flow according to their own needs Ł not too much water in the pit, just enough for
washing the gravels Ł (Figure 3, part a). At a wider scale (Figure 3, part b), the
discharge becomes thus completely erratic. Accordingly, habitats for fish and
invertebrates are strongly disturbed: as a consequence of the excavations, which modify
the depth and the slope of the banks; as a consequence of the flow regime disturbance;
and because of the deposition of fine clay particles instead of organic matter-rich
sediments. Food availability is also reduced, because excavations destroy the vegetation
cover and aquatic macrophytes, reducing the amount of organic matter (plant detritus
etc.) available for invertebrates and omnivorous fishes. Carnivorous fishes would also be
affected indirectly.
Not surprisingly, it was quite difficult to get some fishes in that system. All the specimens
we got were from the same species, and they seem quite rare.
16US/GHA/02/006 ŁFinal Report; Part II: Assessment of Mercury Releases to the Environment and Proposal - December 2003
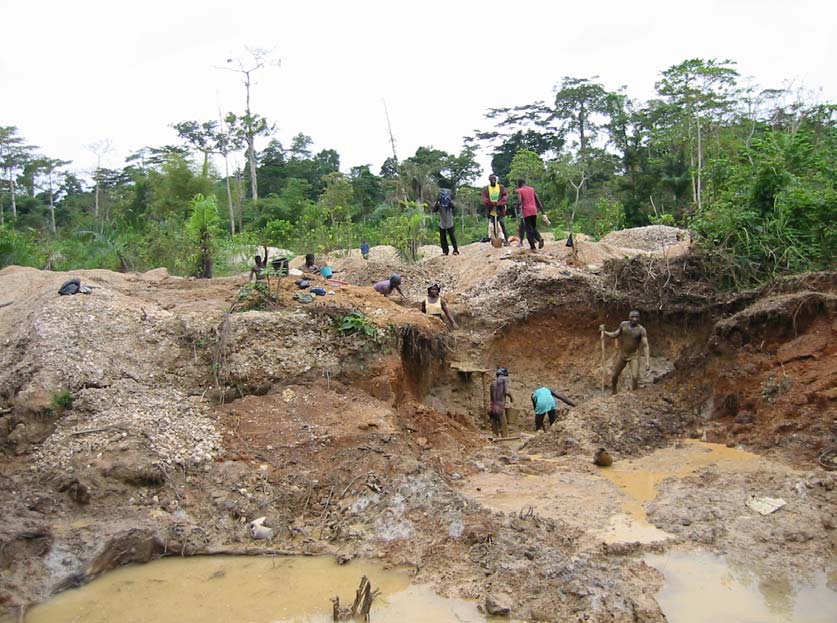
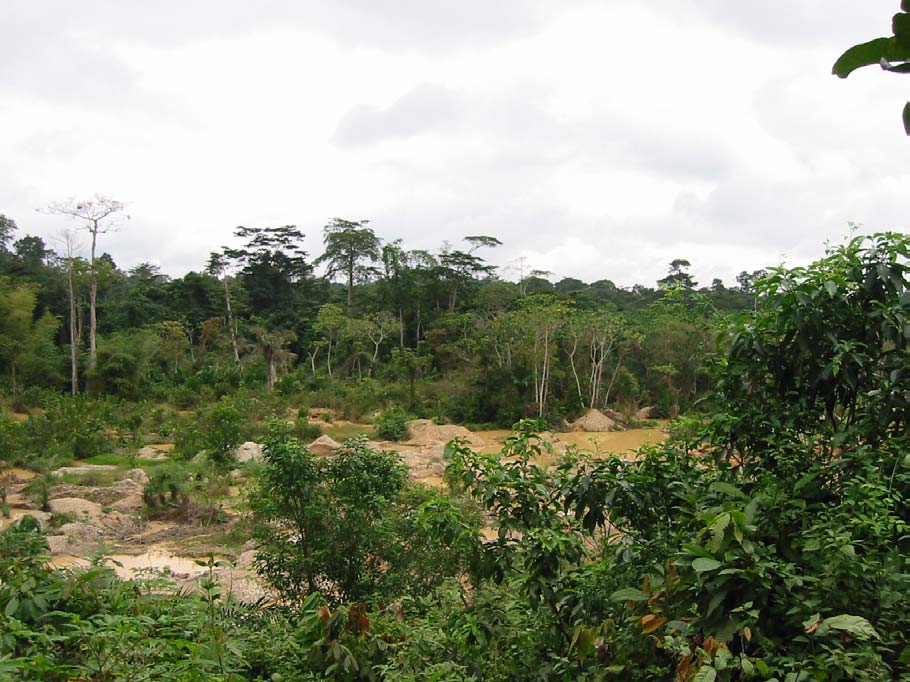
17 /17
a) active pit
b) alluvial field North Gyapa
Pictures by A. Rambaud
Figure 3 - View of a digging zone close to Gyapa
17US/GHA/02/006 ŁFinal Report; Part II: Assessment of Mercury Releases to the Environment and Proposal - December 2003
18 /18
It was out of the scope of our mandate to assess this kind of ecological effects, and the
means involved were not appropriate for assessing them either qualitatively or
quantitatively. Nevertheless, impacts are obvious, and are certainly also of concern for
villagers, as rivers are an important food source for them. Moreover, the durability of
these physical impacts would certainly be interesting to study: pits remain visible quite a
long time after being abandoned, and the flow regime also remains disturbed.
Aside ecological impacts due to mercury releases, there is therefore a dramatic impact of
artisanal mining, which affects both the biodiversity and the biomass in the aquatic
ecosystems all over the area.
IV.B Mercury impacts in Gyapa area
IV.B.1 Bed sediments
The picture of sediment mercury contamination in Gyapa area appears somewhat
confused. When comparing the results (Table 6) to either the tentative background
concentration (100 Ąg.kg-1) or the "threshold effect concentration" (180 Ąg.kg-1) used in
the Dumasi study (see Babut et al., 2001) for details), it appears that some sediments
are contaminated or highly contaminated, while others, sometimes sampled close to the
previous ones, are not. Moreover, the supposed reference site in the Yaya river
catchment belongs to the contaminated subset. Thus, the contamination gradient along
the Yaya river is less than obvious (Figure 4-a), while it is more apparent in the case of
the Subin river (Figure 4-b). The latter samples however were collected in pits rather
than in the river, which was no more distinguishable at the time of sampling.
18US/GHA/02/006 ŁFinal Report; Part II: Assessment of Mercury Releases to the Environment and Proposal - December 2003
19 /19
a) Yaya river
b) Subin river
3500
200
3000
)
)
w
w
2500
150
d
/kg 2000
g
Ą
(
Ą
g
/
k
g
d
100
g 1500
g
(
l
H
l
H
ta 1000
o
ta
T
50
To
500
0
0
SE17
SE12
SE13
SE16
SE1
SE3
SE2
SE6
SE7
SE8
SE9
Figure 4 - Total Hg in river and pit sediments
SE17, SE12, and SE13 were taken in the Yaya river itself (up- to downstream order from
left to right); SE16, SE1, SE2 and SE3 were collected in pits. Note that on graphs (a) and
(b) Y axis scales are very different.
Sampling in pits was also done in order to assess the durability of mercury contamination
in these environments. Figure 5 clearly shows two subsets: all abandoned pits (on the
left side of the figure) display low mercury concentrations, while pits still in activity (right
side) display variable but rather higher concentrations. This suggest that mercury
concentrations decrease rapidly when the pits are no more exploited. It can probably be
assumed that most of the mercury initially lost in the pits is transported downstream
associated to fine particles. Most of this transport may even occur during the exploitation
phase itself, whilst the connection to the river is not systematic when the pits are
abandoned.
19US/GHA/02/006 ŁFinal Report; Part II: Assessment of Mercury Releases to the Environment and Proposal - December 2003
20 /20
4.00
3.50
3.00
)
g
/
g 2.50
Ą
c
n
o 2.00
-
c
g 1.50
(
H
g
lo 1.00
0.50
0.00
1
2
4
5
0
7
5
3
8
9
6
1
1
1
SE
SE
SE
SE
SE
SE
SE
SE
SE
SE
SE
sites
Figure 5 - Total Hg in pits
Error bars correspond to the standard deviation of measurements.
IV.B.2 Fishes
There is seemingly no relationship between fish tissue and sediment mercury
concentrations from the data collected in this study. Fishes are exposed to mercury
either in their habitats (fish living at the bottom of the river) or through food (species
feeding on sediment, or on invertebrates, other fish species etc). Thus, depending on
their way of life, fish species will be more or less directly exposed to mercury from
sediment. Furthermore, the food exposure pathway is of more concern than the exposure
within the habitat, at least for fishes. It is usually assumed that the most contaminated
species are carnivorous species (Bidone et al., 1997; Castihos et al., 1998; Frķry et al.,
1999).
Two different species were caught in Gyapa area: adwen (local name for a kind of
mudfish) and kwafon (Muggilidae). Both are omnivorous, the former feeding more on
shellfishes and fin-fishes and the latter, a pelagic fish, on insects and other invertebrates
in the water column (Water Research Institute in Accra, personal communication).
Therefore, it could be expected that adwen fishes would be more exposed than kwafon;
our data do not confirm this hypothesis (III.B), but the number of samples is indeed too
small for testing it.
20US/GHA/02/006 ŁFinal Report; Part II: Assessment of Mercury Releases to the Environment and Proposal - December 2003
21 /21
IV.B.3 Soils
Soils in the village and its surroundings are extensively contaminated. Unlike sediments,
none of the samples displayed non measurable mercury (Table 7). The less contaminated
soil (0.837 mg.kg-1) was collected in the village itself, on the plateau's edge upstream
the Akoma Kofi river. This value cannot be considered as a reference value, because it
may be influenced by atmospheric deposition of mercury following amalgam distillation in
the village. Conversely, many tropical soils naturally contain high levels of mercury
(Roulet et al., 1999). So apart the samples collected in the vicinity of burning places it
may be difficult to interpret the mercury concentrations in soils without a thorough
knowledge of the typical mercury concentrations in different types of soils. This
knowledge is not currently available for Ghanaian soils.
The concentration measured at the remote site upstream the Yaya river seems
surprisingly high; it is as high as those in samples collected around burning places. There
is however no clear-cut indication that such a high concentration (also observed in
sediment and vegetable samples collected nearby) is due to mercury issued from gold
extraction. Forest fires in tropical environments are a known source of mercury
enrichment (Meech et al., 1997); so the seemingly high concentration observed at that
point might also be linked to fires lighted by farmers in order to clean land prior to
seeding a field; indeed, the place where this sample (SO7) was collected had been burnt
recently.
Contamination of soils near places where amalgam is distilled range between 1.4 and 22
mg.kg-1. These values compare well with published data on soils affected by gold
extraction (e.g. (Pestana et Formoso, 2003; Ramirez Requelme et al., 2003), and are
clearly above mercury concentrations in non-affected tropical soils (0.23 Ł 0.40 mg.kg-1
in Amazonian soils, (Lechler et al., 2000).
The contaminated soil particles may be transported away from amalgam distillation sites
either as dust by the wind, or by runoff in case of rain. One sediment sample (SE3) was
collected at the lower end of a runoff pathway; according to the mercury concentration
measured in that sample, it belongs to the group of contaminated sediments. Although
this concentrations is lower than those of soil samples collected around the upper end of
the same pathway (Figure 6), it can be assumed that mercury is exported from the soils
in the village to the adjacent river system, confirming our initial hypothesis (II.A; Figure
2).
21US/GHA/02/006 ŁFinal Report; Part II: Assessment of Mercury Releases to the Environment and Proposal - December 2003
22 /22
3000
2500
)
w 2000
d
g
/k
gĄ 1500
(
g
l
H
ta 1000
o
T
500
0
SO3
SO1
SO2
SE3
samples
Figure 6 - Total Hg in a soil-sediment system at Gyapa
IV.B.4 Vegetables
At four different sites throughout the village, soil and cocoyam roots were collected close
to one another (see Table 1; SO1/RV3, SO2/RV4, SO5/RV5, SO7/RV7). As it can be seen
on Figure 7, there is an obvious relationship between Hg contents in vegetables and in
soils. However, the corresponding uptake is rather low, as the concentrations in the roots
are about 400 times smaller than those in the corresponding soils.
25.0
tso
20.0
r
o
m
a
y
co
co 15.0
n) iw
w
gk 10.0
/
g
, Ątalto 5.0
(gH
0.0
0
2000
4000
6000
8000
10000
Hg (total, Ąg/kg dw) in soils
Figure 7 Ł Relationship between soil and cocoyam roots samples
22US/GHA/02/006 ŁFinal Report; Part II: Assessment of Mercury Releases to the Environment and Proposal - December 2003
23 /23
IV.C Mercury downstream transport throughout the Ankobra catchment
The two samples (SE18, 1578.5 mg.kg-1; SE19, 1691.5 mg.kg-1) collected in the estuary
(upstream the section subject to tidal influence) are among the most contaminated
sampled during this study. In the meantime, the only sample obtained in a reach
downstream the study area (SE11, Esheri river) did not show any evidence of
contamination, as the total mercury content of this sample is below the supposed
background concentration. However, the place where this latter sample was taken is not
a depositional area, and some clay from the river bank was probably present in the
sample, diluting the sediment and lowering the mercury concentration.
Nevertheless, our measurements in the estuarine sediments fit quite well with W.
Bannerman's findings (Bannerman, 2003). According to his results, most of mercury
inputs upstream Prestea originate from artisanal gold mining, whereas both artisanal and
former industrial mines are responsible for the observed contamination downstream
Prestea till the estuary.
The mercury concentrations measured in the two estuarian sediments are indeed among
the highest in our dataset; this does not necessarily means that these sediments cause a
hazard to the estuarian environment as the mangrove can be seen as a trap or a physical
and biogeochemical barrier to metal contaminant transport (Machado et al., 2002).
However, there no certainty that these sediments would remain in place in case of high
flow.
Only two fishes could be sampled in the mangrove, and they did not display worrying
mercury concentrations. However, this is insufficient to conclude about the transfer of
mercury from sediments into food webs, mainly because of the sample size.
In summary, there is indeed a concern and a need for further researches with the very
high level of mercury in these estuarine sediments. The potential impact on shellfishes,
and more generally on food webs (including humans) should be assessed in the area, and
the fluxes to the coastal system as well.
IV.D Human exposure through the diet
According to the World Health Organization (WHO), concentrations higher than 0.5 Ąg.g-1
may be dangerous, in particular for pregnant women or children (FAO and WHO, 1999).
This safety limit was exceeded by three fish samples (F6/2, 7/0 and 7/1) only. Moreover,
none exceeded the Food and Drug Administration (FDA) action level of 1.0 Ąg.g-1.
Interestingly, all the specimens which exceeded the WHO limit were of the same species
(kwafon); they were caught in the Buosim river (F6/2) and close to the most upstream
pits in the Yaya river (F7). The concentrations of mercury observed in Buosim sediments
were rather low, but the number of samples (whatever the kind) remains low. So it
23US/GHA/02/006 ŁFinal Report; Part II: Assessment of Mercury Releases to the Environment and Proposal - December 2003
24 /24
seems very difficult to relate the observed concentrations in fish either to sediment
contamination or to the local geography of gold extraction. Indeed, the pits are dug until
people do not find any more gold, then rapidly abandoned; therefore, the use of mercury
in any pit is rather transient, and spread over quite large areas. This pattern is very
different of that observed in Dumasi, where gold extraction was occurring in relatively
limited areas, even though the "sluice boxes" were not permanent installations.
The typical food ration is unknown to us neither for Gyapa population, nor in Ghana; so,
instead of assessing the risk associated to food, we only calculated the quantity of each
type of food necessary to obtain the ADI of about 43 Ąg.d-1 recalculated from a weekly
intake of 300 Ąg of total mercury, according to WHO (WHO, 1989). According to our
results, this amount is obtained on average4 either with about 75 g to 125 g of fish per
day, depending of the species. It would need 4.9 kg of cocoyam daily to reach this value.
IV.E Comparison with the phase I study (Dumasi)
The comparison with the contamination pattern in Dumasi (Babut et al., 2001) is
obviously needed, as an important conclusion of this previous study was that probably
the contamination was different in an alluvial area. Due to the respective numbers of
samples available, the comparison is only possible for sediment and fish.
IV.E.1 Sediment contamination patterns in the two study sites
Prior to that comparison, the supposed reference sites were removed from the datasets.
Although the comparison of variances prohibits any statistical comparison between the
two subsets, it appears obvious that the Dumasi sediments are much more contaminated
than those from Gyapa (respective means 15.97 and 0.399 Ąg.g-1).
At the end of the first phase study (Dumasi), it was recommended to study an alluvial
site, where it was expected a higher consumption of mercury and higher concentrations
in sediments accordingly. The underlying assumption was that Dumasi miners allocated a
large amount of their time to crush the ore, while alluvial miners would wash the gravels
directly and spend more time on amalgamation. Although this assumption is probably
true, the fact that at Gyapa an undetermined part of the gold is present in alluvium as
nuggets probably incline miners to use less mercury.
The reduced contamination in Gyapa as compared to Dumasi may also be related to the
fact that sluice boxes are very mobile in Gyapa, being moved as pits are displaced along,
while in Dumasi the sluice boxes are moved in a narrow area along the river. Therefore
4 The calculation was made on the basis on mean concentrations, rather than maximum values.
The latter would have been a worst case estimate, whilst using the mean accounts for the fact that
people pick up their food all over the area, and thus are exposed to a range of concentrations.
24US/GHA/02/006 ŁFinal Report; Part II: Assessment of Mercury Releases to the Environment and Proposal - December 2003
25 /25
the mercury emission pattern is rather diffuse in Gyapa, while it is closer to a point
source in Dumasi.
IV.E.2 Fish contamination patterns in the two study sites
According to a Student t test, fishes from the first phase study (Dumasi) are significantly
more contaminated than those of the second phase (p=0.01). Again this suggests a
different contamination pattern between the two sites, and accordingly a higher fish
exposure in Dumasi. Fish feeding habits may also contribute to the observed difference.
As a consequence, the population will be more exposed to mercury through their diet in
Dumasi than in Gyapa.
Can these findings be extrapolated to other villages in Ghana? In other words, would it
be possible (i) to infer that mercury contamination of the environment is more
pronounced in hard rock processing sites than in alluvial ones, and (ii) to consider that in
general populations from villages where gold is obtained from hard rock would be more
exposed to mercury from their environment than populations from places where gold is
extracted from alluvium?
(i) Because the design of the sampling program focused on the transport pathways, it
can be estimated that mercury pollution from alluvial processing sites is more diffuse
than from hard rock processing sites, leading to lower average concentrations.
(ii) If one considers that these villages are typical of these kinds of processes, the
response should be yes. But we would also like to warn against any misunderstanding of
this statement, for at least two reasons. First, if gold washing is applied in hard rock
processing sites on more extended areas than in Dumasi, the exposure through the
environment would probably decrease to a certain extent. Second, some fractions of the
populations in alluvial processing sites may be as exposed as populations from hard rock
processing sites. Thus, it should not be inferred that alluvial mining is safer than hard
rock mining from the viewpoint of exposure from the environment.
IV.F Summary of findings
Ę There are several lines of evidence of mercury pollution related to alluvial mining
around Gyapa:
Sediments in the river system display variable mercury concentrations, from high
to moderate levels. The sediments sampled in exploited pits are polluted, whilst
mercury concentrations tend to decrease almost rapidly in abandoned pits.
Soil contamination is more pronounced around distillation places. However, gold
extraction related activities are not the only source of mercury in the area: some
types of tropical soils may be naturally enriched; moreover, vegetation fire would
increase the mercury content of topsoil, and its mobility through erosion
25US/GHA/02/006 ŁFinal Report; Part II: Assessment of Mercury Releases to the Environment and Proposal - December 2003
26 /26
accordingly.
There are two pathways involved in environmental contamination in that village,
i.e. release of mercury directly in pits and on soils; in that case, runoff brings a
part of mercury back to the river system.
Ę Food items (fish and vegetables) are also contaminated by mercury. Cocoyam roots
mercury contents remain low, as compared to the soil concentrations. Although
mercury concentrations in fish are most often less than safety limits fixed by WHO or
US-FDA, the acceptable daily intake could be exceeded for certain species.
Ę There is also an evidence of large scale transport, leading to an accumulation of
mercury in mangrove sediments in the Ankobra estuary.
Ę Provided Gyapa can be considered as a typical alluvial gold mining site, the
contamination pattern appears more diffuse than in the hard rock gold mining site
investigated during the first phase study. Thus sediments and fishes display lower
mercury levels in Gyapa (phase II) than in Dumasi (phase I). This statement can be
extrapolated with caution to other sites using the same processes.
Ę Gold extraction in alluvium leads to major physical damages; when it is done in the
river bed and the associated floodplain, it strongly disturbs the flow regime, and
destroy habitats for invertebrates, fish and plants for quite a long time. Pits may also
be dug directly in cultivated parcels. Therefore, gold extraction from alluvium affects
also directly the food resources availability.
V
A PROPOSED FRAMEWORK FOR MONITORING THE MERCURY
POLLUTION IN THE CONCERNED CATCHMENTS
According to the available international experience (UN-ECE, 1996), monitoring should be
viewed as a cycle starting from the information needs (Figure 8). The different steps of
this cycle are briefly reviewed in the following paragraphs.
26US/GHA/02/006 ŁFinal Report; Part II: Assessment of Mercury Releases to the Environment and Proposal - December 2003
27 /27
Management
Information needs
Information utilization
Monitoring strategy
Reporting
Network design
Data analysis
Sample collection
Data handling
Analyses
Figure 8 - Representation of the monitoring cycle
V.A Objectives
The proposed objectives are currently deduced from information needs of the "problem
owners", i.e. in the case of artisanal gold mining in Ghana the Minerals Commission and
the Environment Protection Agency, on behalf of their respective Ministries. They are
merely the same as those proposed at the end of the phase I study (Babut et al., 2001):
1. Extend the current evaluation to the whole auriferous area, in order to understand
the contamination pattern, and to provide data allowing to assess the risks to human
health and the environment.
2. Detect trends.
V.B Strategy
V.B.1 Type of materials
As exposed in the phase I report (Babut et al., 2001), the best compromise choice for
the materials to be sampled and analysed are sediments and fishes. Contaminant
concentrations in sediments reflect the water contamination, as mercury like other
metals tends to adsorb on settling particles (Gray et al., 2000; Lawson et al., 2001 ;
Lindstrom, 2001); moreover, they are much less variable than water concentrations,
thus allowing to assess the contamination level with a lower effort than a strategy
focussing on water. Contaminant levels in fish also reflect the overall contamination of
the system, and account for various exposure pathways. Both kinds of materials however
present specific pros and cons (Table 10), which should not be ignored, as they may
hamper the interpretation of data and the overall efficiency of the monitoring system.
27US/GHA/02/006 ŁFinal Report; Part II: Assessment of Mercury Releases to the Environment and Proposal - December 2003
28 /28
Criteria Sediment
Fish
Sample collection
Relatively easy to difficult:
Uneasy and uncertain (fishes are
depends of accessibility, river depth mobile, and must be caught by
and width, current speed etc.
fishermen)
Handling, processing Relatively easy (conservation at
Difficult: ideally, samples should be
4░C or frozen)
processed and frozen in the field.
Analysis
Difficult (due to mercury volatility)
Very difficult (basically same
process as for sediments, but some
steps are more tricky)
Relevance
(a) according to the Good
High
current knowledge,
interpretation
criteria ...
(b) sensitivity to
Uncertain, depends of the age of Relatively good (if fishes are
possible policies
the deposit collected, currently not analysed separately, and juveniles
measurable; also influenced by
can be distinguished from older
downstream transport processes
specimens)
Table 10 - Sediment and fish pros and cons as sampling materials
According to these elements, it appears clearly that sediment sampling, handling and
analysis would be easier, more efficient, in the sense that it would be less uncertain to
collect sediments, and probably less expensive. However, the relevance of this approach
is somewhat limited: depending of the flow regime in the period preceding the sampling,
the collected sediments may not reflect current contamination trends. Another difficulty
is related to the lack of background values for Ghanaian watercourses, which would
hamper the interpretation of measurements.
The former difficulty could be bypassed by sampling the upper layer sediments once a
year, at the end of the dry season. Thus the top layer of bed sediments would be
generally constituted of recent deposits; this approach would permit to assess
contamination trends.
The second remark (lack of background values) should lead to a specific study aiming at
assessing background levels, preferably for an array of metallic cations, in different sub-
catchments of Ghanaian waterbodies5.
It seems also reasonable to complete sediment measurements by a limited number of
fish analyses, caught in some particularly interesting areas.
5 These sub-catchments would be selected to represent the various geological substrata
28US/GHA/02/006 ŁFinal Report; Part II: Assessment of Mercury Releases to the Environment and Proposal - December 2003
29 /29
V.B.2 Measurements
Considering the array of mining related pollution sources, for sediments the
measurements should include grain size, organic carbon, total mercury and if possible
other metals (Cadmium, Chromium, Copper, Lead, Nickel and Zinc) and Arsenic.
For fish, they should include species identification, length, weight, lipid content, moisture
and total mercury. A preliminary study should address the issue of species selection: one
possibility could be to avoid species selection, but interpretation rules would be difficult
to design and would probably not be applicable immediately (discrimination according to
feeding habits; comparison among groups having the same behaviour; need to develop
as many background values as the number of collected species). Conversely, selecting a
limited number of species, e.g. 3, could lead to make difficult to collect fishes in some
reaches (no a priori evidence that any species is able to live either up- and downstream).
V.B.3 Frequency
According to the results of recent research in the Ankobra basin, two main periods can be
distinguished in the yearly contamination pattern, i.e. the dry season (November to
March approximately) and the rainy season (April to October) (Bannerman, 2003).
During the rainy season, flows are rather high, erode bed sediments, and tend to dilute
the mercury loads. Moreover, high flows may hamper gold extraction activities in some
parts of the basins. Conversely in the dry season, flows are low, mercury concentrations
are higher and mercury contaminated particles tend to settle down.
Therefore the most appropriate period for sediment sampling should be at the end of the
dry season. Depending of the number of sampling locations, it could perhaps be
interesting to split the program into different packages on a geographical basis, and to
apply it through several years (1 or 2 packages per year). Thus cost and technical issues
would be kept at a manageable level.
V.B.4 Sampling points selection
Either for sediments or for fishes, the program should include reference points
(upstream), where no pollution can be assumed. These reference points would permit to
determine background levels; they would also account for atmospheric deposition
following long range transport. For sediments, other sampling should be located on main
streams and certain important tributaries, close to confluences, in order to determine
contamination pattern in sub-catchments. An appropriate selection of the sub-
catchments would also allow to monitor various geological and land cover contexts. For
fishes, sampling points should be located in areas where pollution is suspected.
29US/GHA/02/006 ŁFinal Report; Part II: Assessment of Mercury Releases to the Environment and Proposal - December 2003
30 /30
V.B.5 Application
It is suggested to set up the monitoring program with 30 sampling points for sediments
and 10 for fishes. A larger program would be difficult to implement and fund, and there
are a lot of technical issues to solve first, which would use a lot of efforts and resources:
samples handling and storage, quality insurance of the analyses, data handling etc.
Therefore it seems more reasonable to set up a program limited in size, but manageable
and allowing building capacities in the country.
It seems also necessary to get support from cooperation agencies or programs for
different aspects of this program: development of analytical capacities, quality insurance,
data management (GIS-based databases).
V.C Monitoring program summary
Ę Appropriate objectives for a monitoring program gold extraction environmental
impacts could be:
1. Extend the current evaluation to the whole auriferous area, in order to
understand the contamination pattern, and to provide data allowing to assess
the risks to human health and the environment.
2. Detect trends.
Ę The best compromise in terms of sampled matrices appears to be a combination of
sediments (basis of the program) and fishes.
Ę Aside a set of metals (Cadmium, Chromium, Copper, Lead, Mercury, Nickel and Zinc)
and Arsenic analysed as total concentrations, sediment measurements should include
grain size and total organic carbon. In fish, length, weight, lipid content, moisture and
total mercury should be measured, and the species determined.
Ę Specific studies are needed at the beginning of the program, for determining mercury
and other metals background concentrations in sediments, and refine the strategy for
fishes (species selection).
Ę Sediments should be sampled at the end of the dry season. It is suggested to apply
this strategy to 30 sediment sampling points and 10 fish sampling points. Sampled
locations should include reference points and locations close to confluences of
tributaries. If more points were selected, the program could be planned on several
years.
Ę It seems necessary that cooperation agencies afford appropriate support for
developing further the analytical capacities, quality insurance and data management.
30US/GHA/02/006 ŁFinal Report; Part II: Assessment of Mercury Releases to the Environment and Proposal - December 2003
31 /31
RECOMMENDATIONS
Ę Considering the mercury pathways to the environment (see summary pp 22-23), a
better organisation of the gold production process along with the introduction of
appropriate equipment needs to be developed. For example, in Gyapa case, doing the
amalgamation and the distillation out of the village, in places un-connected to the
river, and using retorts at the distillation step would normally decrease the transfer of
mercury to rivers and soils.
Ę Fish contamination seems a bigger issue in regions where artisanal gold mining relies
upon hard rock processing. In these regions, it should be recommended to the
populations not to eat fishes caught downstream the process sites. Developing
alternative fish sources (for example aquaculture in ponds) could be a way to
decrease human exposure to mercury from the diet.
Ę Side-effects of alluvial mining such as physical damages to the floodplains or to
cultivated land should also be accounted for. That is, alluvial miners should restore
the dug locations when they leave, at least by filling the pits. Obviously, this
recommendation is rather na’ve; however, Ghanaian authorities Ł and populations Ł
should be aware that these physical damages hamper their own resources, perhaps
as much as industrial mines do. But while industrial mines are now involved in
operations aiming at limiting the environmental impacts of their activities, artisanal
miners do not.
Ę Environmental impacts of artisanal gold mining should be monitored throughout the
auriferous region; in order to develop this program, some complementary studies are
needed, to determine background concentrations in sediments and select the
appropriate fish species.
Ę Because there is evidence of long range transport of mercury throughout the Ankobra
basin till the estuary, it is important to determine whether mercury is then brought to
the sea and contaminates fishes and shellfishes along the coast. A study of the
functioning of the mangrove and the estuary is therefore highly desirable.
31US/GHA/02/006 ŁFinal Report; Part II: Assessment of Mercury Releases to the Environment and Proposal - December 2003
32 /32
References
Babut M, Sekyi R, Potin-Gautier M, Tellier S, Bannerman W, Casellas C, Rambaud R
(2001) Assistance in Assessing and Reducing Mercury Pollution Emanating from Artisanal
Gold Mining in Ghana - Phase I: Part II - Conduct of surveys on river systems & overall
conclusions. UNIDO, Vienna.
Bannerman W (2003) Speciation and distribution of mercury and arsenic in the Ankobra
river basin (Ghana) - Impact of gold mining. Thesis. Pau (France) and Kumasi (Ghana),
Pau.
Bidone ED, Castihos ZC, Cid de Souza TM, Lacerda LD (1997) Fish contamination and
human exposure to mercury in the Tapajos river basin, Para state, Amazon, Brasil: a
screening approach. Bulletin of Environmental Contamination and Toxicology 59:194-
201.
Boening DW (2000) Ecological effects, transport, and fate of mercury: a general review.
Chemosphere 40:1335-1351.
Castihos ZC, Bidone ED, Lacerda LD (1998) Increase of the background human exposure
to mercury through fish consumption due to gold mining at the Tapajos River region,
Para State, Amazon. Bulletin of Environmental Contamination and Toxicology 61:201-
209.
FAO, WHO (1999) JOINT FAO/WHO EXPERT COMMITTEE ON FOOD ADDITIVES - 53rd
Meeting, Summary & Conclusions. Food & Agriculture Organization - World Health
Organization, Geneva.
Frķry N, Jouan M, Maillot E, Deheeger M, Boudou A (1999) Exposition au mercure de la
population amķrindienne Wayana de Guyane - EnquĻte alimentaire. Institut National de
Veille Sanitaire, Paris.
Gray JE, Theodorakos PM, Bailey EA, Turner RR (2000) Distribution, speciation, and
transport of mercury in stream-sediment, stream-water, and fish collected near
abandoned mercury mines in southwestern Alaska, USA. The Science of The Total
Environment 260:21-33.
Lawson NM, Mason RP, Laporte J-M (2001) The fate and transport of mercury,
methylmercury, and other trace metals in chesapeake bay tributaries. Water Research
35:501-515.
Lechler PJ, Miller JR, Lacerda LD, Vinson D, Bonzongo J-C, Lyons WB, Warwick JJ (2000)
Elevated mercury concentrations in soils, sediments, water, and fish of the Madeira River
basin, Brazilian Amazon: a function of natural enrichments? The Science of The Total
Environment 260:87-96.
Lindstrom M (2001) Distribution of particulate and reactive mercury in surface waters of
Swedish forest lakes -- an empirically based predictive model. Ecological Modelling
136:81-93.
Machado W, Moscatelli M, Rezende LG, Lacerda LD (2002) Mercury, zinc, and copper
accumulation in mangrove sediments surrounding a large landfill in southeast Brazil.
Environmental Pollution 120:455-461.
Meech JA, Veiga MM, Tromans D (1997) Emission and stability of mercury in the Amazon.
Canadian Metallurgical Quarterly 36:231-239.
Melieres M-A, Pourchet M, Charles-Dominique P, Gaucher P (2003) Mercury in canopy
leaves of French Guiana in remote areas. The Science of The Total Environment 311:261-
267.
32US/GHA/02/006 ŁFinal Report; Part II: Assessment of Mercury Releases to the Environment and Proposal - December 2003
33 /33
Pestana MHD, Formoso MLL (2003) Mercury contamination in Lavras do Sul, south Brazil:
a legacy from past and recent gold mining. The Science of The Total Environment
307:125-140.
Ramirez Requelme ME, Ramos JFF, Angelica RS, Brabo ES (2003) Assessment of Hg-
contamination in soils and stream sediments in the mineral district of Nambija,
Ecuadorian Amazon (example of an impacted area affected by artisanal gold mining).
Applied Geochemistry 18:371-381.
Roulet M, Lucotte M, Farella N, Serique G, Coelho H, Sousa Passos CJ, De Jesus da Silva
E, Scavone de Andrade P, Mergler D, Guimaraes J-RD, Amorim M (1999) Effects of recent
human colonization on the presence of mercury in Amazonian ecosystems. Water, Air
and Soil Pollution 112:297-313.
Tsekpo A (2002) Socio-economic profile of Japa. United Nations Industrial Development
Organization, Accra, Ghana.
UN-ECE (1996) Guidelines on water-quality monitoring and assessment of transboundary
rivers. UN-ECE, Task Force on monitoring & assessment,
USEPA (1999) Mercury update: impact on fish advisories. EPA-823-F-99-016. U.S.
Environmental Protection Agency, Office of Water,
WHO (1989) Evaluation of certain food additives and contaminants - 33rd report of the
Joint FAO/WHO Expert Committee on food additives. WHO technical report series 776.
World Health Organisation, Geneva.
33US/GHA/02/006 ŁFinal Report; Part II: Assessment of Mercury Releases to the Environment and Proposal - December 2003
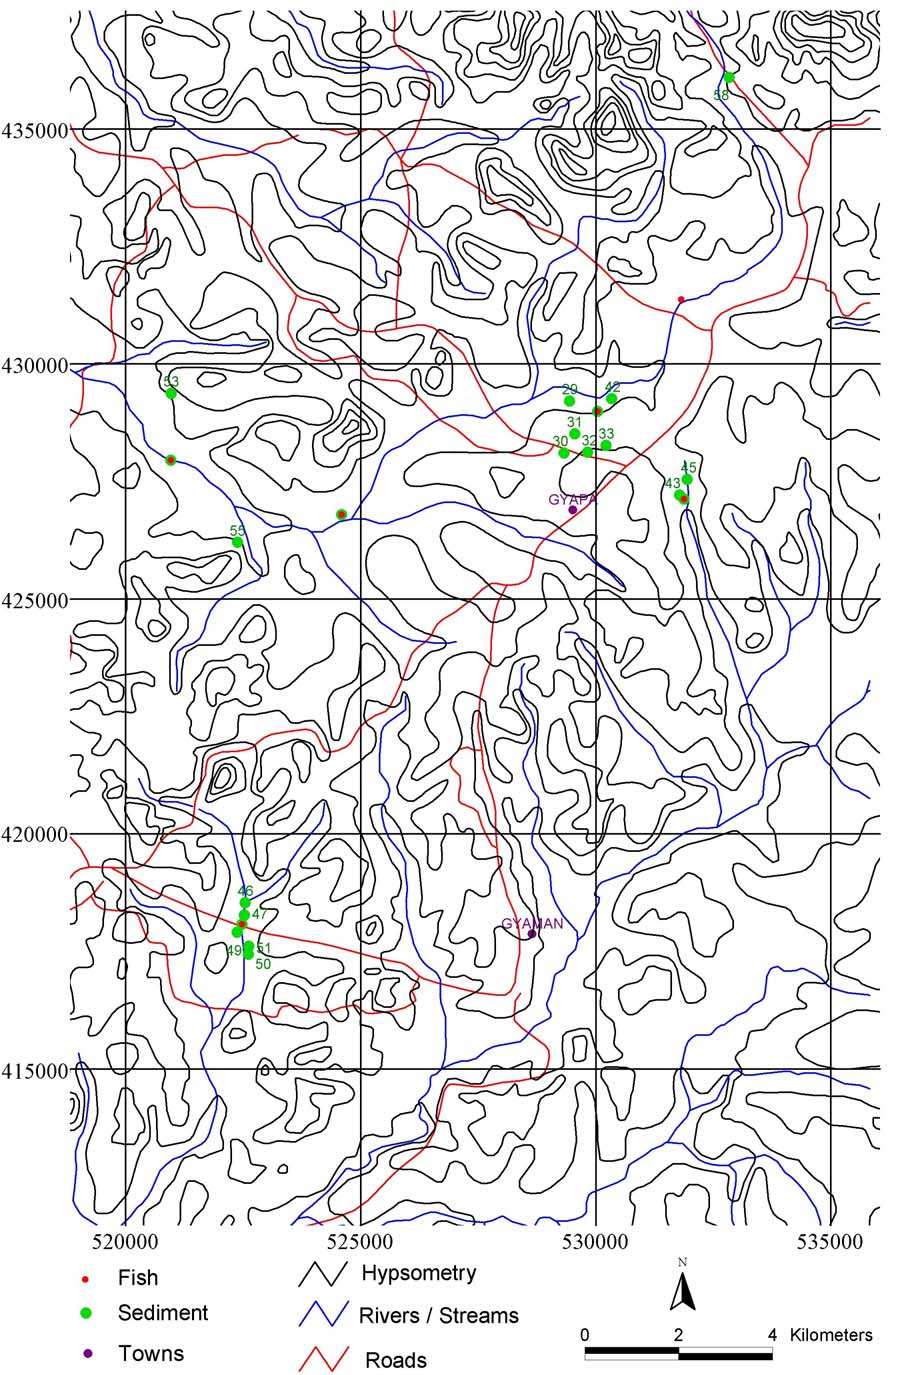
A
Appendix Ł Sampling points locations in and around Gyapa
AUS/GHA/02/006 ŁFinal Report; Part II: Assessment of Mercury Releases to the Environment and Proposal - December 2003
B
Site Ref
Sample
Code
Sample
28 RV1
Cocoyam
SE1 Sediment
F3/1 & /2
Fishes
29 RV2
Cocoyam
SE3
Sediment
42 SE2
Sediment
57 SE16 Sediment
Yaya
F7
Fish
53 SE12 Sediment
54 SE13 Sediment
F5
Fish
58 SE17 Sediment
RV7 Cocoyam
SO7
Soil
30 RV3
Cocoyam
SO1
Soil
31 RV4
Cocoyam
Gyapa
SO2
Soil
(village)
32 SO3
Soil
SO4
Soil
33 RV5
Cocoyam
SO5
Soil
43 SE4
Sediment
44 SE5
Sediment
Akoma Kofi
F4/0
Fish
45 SO6
Soil
46 SE6
Sediment
47 SE7
Sediment
48 SE8
Sediment
Subin (pits)
F1/1 & /2
Fish
49 SE9
Sediment
50 SE10 Sediment
51 F2/0 Fish
55 SE14 Sediment
RV6
Cocoyam
Buosim
56 SE15 Sediment
F6
Fish
BUS/GHA/02/006 ŁFinal Report; Part II: Assessment of Mercury Releases to the Environment and Proposal - December 2003
Document Outline
- 0 Report cover(phase2).pdf
- 1 Japa Intro.pdf
- 2 Japa Health part.pdf
- 3 Japa Health part Appendix.pdf
- 4 Japa Envir_part.pdf
- 5 Japa Envir_part-Appendix.pdf