


Global Mercury Project
Project EG/GLO/01/G34:
Removal of Barriers to Introduction of Cleaner Artisanal Gold Mining and Extraction Technologies
REPORT IN REFERENCE TO SĂO CHICO AND
CREPURIZINHO MINING SITES
by
Armin Mathis
July, 2003
1
Tables.............................................................................................................................................................................. 4
Graphs ............................................................................................................................................................................ 8
Trip Schedule (I) ........................................................................................................................................................... 9
Trip Schedule (II) ......................................................................................................................................................10
General Information ..................................................................................................................................................14
PART 1. SĂO CHICO............................................................................................... 15
The Mining Site History ............................................................................................................................................15
Site's General Description.........................................................................................................................................15
The village....................................................................................................................................................................16
Houses Profile ..............................................................................................................................................................17
Population Profile .......................................................................................................................................................17
Social Organisation.....................................................................................................................................................20
Mining Sites .................................................................................................................................................................20
Mining Workers' Profile ...........................................................................................................................................24
PART 2. CREPURIZINHO MINING SITES .............................................................. 29
The Mining Site History ............................................................................................................................................29
Sites' General Description.........................................................................................................................................29
The Village...................................................................................................................................................................31
Houses' profile.............................................................................................................................................................33
Population Profile .......................................................................................................................................................35
Social Organisation.....................................................................................................................................................41
Mining sites..................................................................................................................................................................43
Mining Worker's profile............................................................................................................................................48
2
DATA PRESENTATION........................................................................................... 54
Săo Chico Village. Data..........................................................................................................................................54
Săo Chico Community. Population profile. Data...............................................................................................58
Săo Chico Community. Dietary habits. Data......................................................................................................60
Săo Chico Mining Worker's Profile. Data............................................................................................................63
Crepurizinho Village. Data ....................................................................................................................................70
Crepurizinho Community. Population profile. Data.........................................................................................74
Crepurizinho Community. Dietary habits. Data................................................................................................75
Crepurizinho Mining Worker's Profile. Data......................................................................................................77
3
Tables
Table 1: Săo Chico - Village. Type of property .......................................................................... 54
Table 2: Săo Chico - Village. Type of habitation........................................................................ 54
Table 3: Săo Chico - Village. Type of roofing............................................................................ 54
Table 4: Săo Chico - Village. Type of floors............................................................................... 54
Table 5: Săo Chico - Village. Location of toilet ......................................................................... 54
Table 6: Săo Chico - Village. Sewage disposal........................................................................... 56
Table 7: Săo Chico - Village. Electric power source .................................................................. 56
Table 8: Săo Chico - Village. Origin of water for domestic use ................................................ 56
Table 9: Săo Chico - Village. Water storage ............................................................................... 56
Table 10: Săo Chico - Village. Domestic garbage disposal (Multiple Choice) ........................ 56
Table 11: Săo Chico Village. Vegetable Gardens.................................................................... 57
Table 12: Săo Chico Village. Domestic animals for consumption......................................... 57
Table 13: Săo Chico - Community. Distribution of population by gender................................ 58
Table 14: Săo Chico - Community. Length of residence at the village (years) ........................ 58
Table 15: Săo Chico - Community. State where villagers come from ...................................... 58
Table 16: Săo Chico - Community Population distribution according to economic activity... 58
Table 17: Săo Chico - Community Population distribution according to schooling ................ 59
Table 18: Săo Chico - Community. Population distribution according to possession of
personal identification........................................................................................................... 59
Table 19 Săo Chico Community. Economic activity (population older than 15) ............... 59
Table 20: Săo Chico - Community. Weekly consumption of rice. ............................................ 60
Table 21: Săo Chico - Community. Weekly beef consumption................................................. 60
Table 22: Săo Chico - Community. Weekly manioc flour consumption................................... 60
Table 23: Săo Chico - Community. Weekly beans consumption............................................... 60
Table 24: Săo Chico - Community. Weekly milk consumption. ............................................... 60
Table 25: Săo Chico - Community. Weekly vegetable consumption........................................ 61
Table 26: Săo Chico - Community Weekly fruit consumption.................................................. 61
Table 27: Săo Chico - Community - Community. Weekly egg consumption........................... 61
Table 28: Săo Chico - Community- Community. Weekly pasta consumption......................... 61
Table 29: Săo Chico - Community - Community Weekly chicken consumption..................... 62
Table 30: Săo Chico - Community. Weekly fish consumption.................................................. 62
Table 31: Săo Chico Mining Workers. Age of interviewees................................................... 63
Table 32: Săo Chico Mining Workers. Civil Status................................................................. 63
4
Table 33: Săo Chico Mining workers. Paternity...................................................................... 63
Table 34: Săo Chico Mining workers. Education. ................................................................... 63
Table 35: Săo Chico Mining workers. Formal Education....................................................... 64
Table 36: Săo Chico Mining workers. Personal identification documents ............................ 64
Table 37: Săo Chico Mining workers ....................................................................................... 64
Table 38: Săo Chico Mining workers. Town where lives when started working at the sites 64
Table 39: Săo Chico Mining workers. Economic activity before starting work in mining... 64
Table 40: Săo Chico Mining workers. Declared earnings in previous activities (in SM=
USD80) .................................................................................................................................. 64
Table 41: Săo Chico Mining workers. Subsistence agriculture before mining...................... 65
Table 42: Săo Chico- Mining workers. Return to previous economic activity ......................... 65
Table 43: Săo Chico Mining workers. Length of stay in the sites (in years) ......................... 65
Table 44: Săo Chico Mining workers. Last town visited. ....................................................... 65
Table 45: Săo Chico Mining workers. Money order to areas outside the mining sites. ........ 65
Table 46: Săo Chico Mining workers. Money orders receivers .............................................. 66
Table 47: Săo Chico Mining workers. Last gold earnings (g per despescagem)................... 66
Table 48: Săo Chico Mining workers. Experience with independent mining activities........ 66
Table 49: Săo Chico Mining workers. Type of independent mining activity. ....................... 66
Table 50: Săo Chico Mining workers. Illnesses in the last two months................................. 66
Table 51: Săo Chico Mining workers. Work interruption in the last two months................. 67
Table 52: Săo Chico Mining workers. Search for health care when ill. ................................. 67
Table 53: Săo Chico Mining workers. Work accidents ........................................................... 67
Table 54: Săo Chico Mining Workers . Fatal work accidents witnessed ............................... 67
Table 55: Săo Chico Mining workers. Gold burning / roasting. ............................................. 67
Table 56: Săo Chico Mining workers. Health evaluation availability.................................... 67
Table 57: Săo Chico Mining workers. TV use. ........................................................................ 67
Table 58: Săo Chico Mining workers. Radio use..................................................................... 69
Table 59: Săo Chico Mining workers. Participation in general elections. ............................. 69
Table 60: Săo Chico Mining workers. Participation in state elections................................... 69
Table 61: Săo Chico Mining workers . Participation in presidential elections...................... 69
Table 62: Săo Chico Mining workers. Contact with violence inside the site......................... 69
Table 63: Săo Chico Mining workers. Witness of violent situations with death................... 69
Table 64: Crepurizinho - Village. Residence type of property. ................................................. 70
Table 65: Crepurizinho - Village. Types of use of inhabited houses......................................... 70
Table 66: Crepurizinho - Village. Type of residence.................................................................. 70
5
Table 67: Crepurizinho - Village. Type of roof in residences.................................................... 70
Table 68: Crepurizinho - Village Type of floors in inhabited houses. ...................................... 70
Table 69: Crepurizinho - Village. Toilet location....................................................................... 70
Table 70: Crepurizinho - Village. Domestic sewage disposal.................................................... 71
Table 71: Crepurizinho - Village. Electric power availability ................................................... 71
Table 72: Crepurizinho - Village. Origin of the water for domestic use ................................... 71
Table 73: Crepurizinho - Village. Water storage ........................................................................ 71
Table 74: Crepurizinho - Village. Type of Water treatment. ..................................................... 71
Table 75: Crepurizinho Village. Garbage disposal. ................................................................. 72
Table 76: Crepurizinho - Village. Existence of yards in inhabited houses. .............................. 72
Table 77: Crepurizinho - Village. Vegetable gardens at inhabited houses................................ 72
Table 78: Crepurizinho - Village. Domestic animals.................................................................. 72
Table 79: Crepurizinho - Village. Animals for consumption..................................................... 72
Table 80: Crepurizinho - Village Agriculture ............................................................................. 72
Table 81: Crepurizinho - Village Destination of agricultural produce ...................................... 72
Table 82: Crepurizinho - Community. Distribution by gender .................................................. 74
Table 83: Crepurizinho - Community. Personal identification documents ............................... 74
Table 84: Crepurizinho Community. Employment and gender. ............................................. 74
Table 85: Crepurizinho Community. Gender and employment.............................................. 74
Table 86: Crepurizinho - Community. Weekly consumption of fish......................................... 75
Table 87: Crepurizinho Community. Weekly consumption of frozen fish ............................ 75
Table 88: Crepurizinho Community. Weekly consumption of chicken. ................................ 75
Table 89: Crepurizinho - Community. Weekly consumption of egg......................................... 75
Table 90: Crepurizinho Community. Weekly consumption of rice ........................................ 75
Table 91: Crepurizinho Community. Weekly consumption of pasta...................................... 76
Table 92: Crepurizinho - Community. Weekly consumption of beans ..................................... 76
Table 93: Crepurizinho Community. Weekly consumption of milk ...................................... 76
Table 94: Crepurizinho - Community. Weekly consumption of vegetables ............................. 76
Table 95: Crepurizinho - Community. Weekly consumption of fruits ...................................... 76
Table 96: Crepurizinho - Community. Weekly consumption of manioc flour ......................... 77
Table 97: Crepurizinho - Community. Weekly consumption of manioc................................... 77
Table 98: Crepurizinho Mining workers. Age ......................................................................... 77
Table 99: Crepurizinho Mining workers. Civil Status............................................................. 77
Table 100: Crepurizinho Mining workers. State of birth. ....................................................... 78
Table 101: Crepurizinho Mining workers. Reason for choosing this site. ............................. 78
6
Table 102: Crepurizinho Mining workers Place of residence. ................................................ 78
Table 103: Crepurizinho Mining workers. Year that began working with gold mining ....... 78
Table 104: Crepurizinho Mining workers. Previous economic activity................................. 78
Table 105: Crepurizinho Mining workers How is mercury harmful to health?..................... 79
Table 106: Crepurizinho Mining workers. Sources of information on mercury.................... 79
Table 107: Crepurizinho Mining workers. How does gold mining harm the environment? 79
Table 108: Crepurizinho Mining workers. Predicted length of say in the sites ..................... 79
7
Graphs
Graph 1: Crepurizinho village sketch .......................................................................................... 33
Graph 2: Crepurizinho. Dietary habits (average weekly consumption)..................................... 38
Graph 3: Crepurizinho Consumers goods (% from registered houses) .................................. 39
Graph 4: Crepurizinho - Village. Property ownership (in % of registered houses).................. 40
Graph 5: Crepurizinho - Village. Priorities Ranking (according to property ownership)........ 41
Graph 6: Crepurizinho Workers. Distribution by age group................................................... 49
Graph 7: Crepurizinho - Workers. Length of stay at Crepurizinho. .......................................... 50
Graph 8: Crepurizinho - Workers. Considerations about life in the miming sites.................... 52
8
Trip Schedule (I)
Mon. 9/06
Belém ITB
Environment and Mining Secretariat, Itaituba City Hall
- Project and work plan presentation
D'Gold. Mr.Dirceu Frederico Sobrinho (member of the AMOT)
- Work plan presentation, request for logistical and support for the stay in
Crepurizinho and Săo Chico.
Mr. Waldomiro - (AMOT member, one of Săo Chico's local leaderships)
- Interview on the history and present situation of the mining site.
Tues. 10/06 ITB Crepurizăo Crepurizinho
Initial survey on local geography to design the village map
Interviews with local FNS representatives
Informal meetings with the local military police. PM PA
Informal meetings with village gold buyers and dealers
Interview with José Lauręncio de Oliveira Zé Baiano (Village's ex
president and mining site owner)
Wed. 11/06
Visit to labor fronts around Crepurizinho village with Mr. Zé Baiano.
Meeting with teachers of local basic school in Crepurizinho.
- Project presentation and request for cooperation in the census
Thur. 12/06 Crepurizinho Săo Chico
Informal meetings with gold dealers and buyers.
Census
Fri 13/06
Census
Visit to mining sites close to the village interviewing miners
Sat 14/06
Census
Visit to mining sites with Carlos Henrique Gonçalves (Juca) interviewing
miners
Visit to mining sites - interviewing miners
Closing Census
Interviewing miners
Sun 15/06
Săo Chico ITB
Mon. 16/06 ITB Belém
9
Trip Schedule (II)
Tue 01/07 Belém ITB
Meeting with Mr. Ivo Lubrinna (AMOT President) and Mr. Elias Leal Moraes
(SEMMA ITB).
Săo Chico Report was presented. The results of the meeting were registered in a
document sent to the National Project Coordination. The National Project
Coordination agreed to carry out another trip in order to choose areas alternative
to Săo Chico, due to the decadence of the mining activity in this area.
Wed 02/07 Itaituba
Trip preparations
Thur. 03/07 Itaituba Jardim do Ouro (Serabim Mining) [S 06ş 19'15.4" W 55ş 47'15.4"]
This company (Australian capital) has worked in the Palito mining site. Their
license (proc. 850006/02) covers an area totalling 7.920ha. This area was
purchased from RTZ, which had carried out research there. The company works
with cyaniding in open tanks (CIP), processing a mix of the mines' rejects with
primary rocks previously extracted by miners. Present production is at 1 kg Au
per day, but it is predicted to be raised to 2 kg/Au per day by the end of the year.
Jardim do Ouro Săo Chico [landing track S 06ş 24'51.7" W 55ş 59'24.2"]
Group introduction to local leaderships. At Săo Chico's visit, our colleagues
were able to confirm all the data present in my report (little mining activity,
physical conditions of potential area). Bernhard Peregovich and Roosevelt also
made a survey on the village's logistical conditions.
Săo Chico - Mining site Fazenda Marrom [track S 07ş 53'55.8" W 56ş 40'54.3" ]
The mining site has aerial access and presented intense activity in 2001. It is
composed by two great work fronts around the river basin. Fifty people live at
the work front called Planalto [S 07ş 54'08.1" W 56ş 41'33.1"]. The works are
concentrated in virgin areas, and the extraction cycle totals to 30 to 45 days with
costs of production around 500 g Au. We were informed that currently, four (4)
pairs of machines are working, each one operated by a team of five (5) people.
In the second work front (track with canteen) there is about 50 small houses, that
indicate a population of 150 to 200 people. According to the manager of the
canteen, there are 10 or 12 pairs of machines working in the area. Due to
exhaustion of areas closer to the airstrip, there is a movement along the river to
areas still unworked.
10
Fazenda Marrom Mining Site Fazenda Săo Raimundo [S 07ş 38'02.3" W 56ş
44'28.6"]
The farm owned by Mr. Tomáz. The proprietor has 106 employees, using the
majority in farming activities. Currently the mining site owner possesses 8 pairs
of machines working in two distinct areas. The first one is located next to the
beginning of the airstrip [S 07ş 37'20.4" W 56ş 45'20.9"], the extraction is
concentrated in the unworked areas that had been covered by rejects in previous
extraction processes. The second area is located 15 minutes away from the first
area (by car). Other four pairs of machines extracted in previously unexploited
areas (riverbed). In the same area three pairs of machines that belong to Mr.
Moreira are also working. His teams are made of 5 people and have the right to
25% of the gold production. 38 people inhabit the second area. This mining site
has the characteristics of a closed garimpo; (one may enter only with the
permission of the owner, monopoly of transport and commerce, rigid discipline
imposed by the owner). It is distinct from other sites because of the farm's
center village good infrastructure (power running 24h, a tarred square, wide
landing track), becoming an exception among the region's mining sites.
Fri 04/07
Fazenda Săo Raimundo Site Crepurizăo [S 06ş 49'13.6" W 56ş 50'41.0"]
Contact with local commerce in order to verify rent conditions and purchase
necessary project equipment.
Crepurizăo Crepurizinho [S 06ş 50'02.6" W 56ş 35'01.4"]
The project was presented to Mr. Luis Preto, President of the Community. We
agreed on two possible areas of mineral prospecting: Tolentino [ S 6 47'51.4 "W
56 36'22.5" ] and Sta. Terezinha [S 56 47'00.7 "W 40'02.6"]. I had previously
visited both areas during the first trip. In Tolentino, there is a "slope"
(equipment brought from Poconé-MT, with a ball mill and centrifugal machines)
and golddiggers working; in Sta. Terezinha, property of Mr. Luís Preto, there is
primary gold extraction (shafts) and, inside of a stretch of about 1500m, teams
working in "repassagem" (second mining of a previously exploited area, mining
for a second time the same area,) and virgin areas. Throughout the conversation,
we justified to the leaderships the delay in the work schedule (remembering the
agreement with the local teachers to carry out the village's census during that
week). As to logistic support for the project, they placed an unoccupied house at
our disposal and the school (interesting solution, since the reforms to be carried
out by the project would work as a real contribution for the community and a
11
out by the project would work as a real contribution for the community and a
good acceptance of the project by the community).
Crepurizinho Itaituba
When back to Itaituba, it was carried out a meeting to exchange impressions
from the trip. This meeting also had the participation of Mr. Dirceu Federico
Sobrinho (AMOT) and Mr. Alberto Rogério da Silva from the national
coordination (by telephone). The results of this meeting were:
- AMOT is against the inclusion of Săo Chico in the project
- Crepurizinho will be kept, with two areas of extraction to be researched by
me, that may used for the environmental and technical work.
- The coordination of the project will send criteria from which to base the
choice of the new area to replace Săo Chico.
- AMOT will determine the area to be researched, based on current
information and on the criteria established by national coordination.
- the choice of a new area (new community) implies the necessity to carry out
a new social study according to Săo Chico/Crepurizinho standards.
Sat 05/07
Itaituba
Contacts with National Coordination (via e-mail) in order to inform them about
them about the facts and confirm the execution of a historical survey in
Crepurizinho, as planned.
Sun 06/07 Itaituba
Preparation for the trip to Crepurizinho.
Mon. 07/07 ITB Crepurizinho
Detailed project presentation to Crepurizinho schoolteachers, training of local
teacher to carry out community census.
Beginning of the census.
Tue 08/07 Luís Preto Mining site (Baixăo do Papagaio)
Continuation of community census
Wed 09/07 Tolentino Mining Site
Continuation of community census
Wed 09/07 Interviews with community leaderships
Continuation of community census
Wed 09/07 Interviews with community leaderships
Continuation of community census
12
Wed 09/07 Closing of community census
Crepurizinho Itaituba
Meeting with Mr. Roosevelt and Mr. Bernhard Peregovich to exchange
information about the trip (due to a black-out in Itaituba it was not possible to
carry out a formal meeting)
Sat. 10/07
Telephone contact with Mr. Ivo Lubrinna (AMOT), informing him about the
trip's first results
Itaituba Belém
13
General Information
Access
Crepurizinho. There are regular flights from Itaituba to Crepurizăo/Crepurizinho in twin-
engine airplanes accommodating 9 passengers. There is a minimum number of passengers for
the flight to be carried through. Ticket price: R$518 (USD173) (Itaituba Crepurizinho -
Itaituba).
Săo Chico. Aerial access only in a freighted airplane, costing R$ 2,200.00 (USD733) for
each stretch [permanence in Săo Chico implies that the aircraft will have to return empty to
Itaituba (one hour flight costs R$ 1,100.00), the aircraft has capacity for 5 passengers].
Săo Chico. Road access - only possible in the summer. Prices depend on the vehicle and type
of arrangement (freight, regular trip). In good road conditions the trip takes around 10 hours.
Crepurizinho - Săo Chico. Aerial access. A one-way trip costs R$1,100.00 (USD 366) (one
flight hour including aircraft's displacement and its return to its base of operation).
Crepurizinho - Săo Chico. Road access (98 km) - Only in the summer. May be travelled by
motorbike (R$150 USD50) or through freighted pick-up truck (about R$300,00 USD100).
The trip takes about 5 hours in a pick-up truck in the current conditions.
Infrastructure
Since 2002, Crepurizinho has a telephone line (Telemar). There are public and residential
telephones in good conditions. There are simple lodgings and some restaurant options (also
simple).
Săo Chico, is still not integrated to the telephone net, but one residence offers telephone
services (rural mobile) that works as a public telephone (R$1,50 /min for conventional
telephone). Usually communication with ITB is done through short waves radio. There are
two residences that rent rooms (very simple) and many houses sell meals.
Transport
The transport to the mining sites may be done in a motorbike (there are many "moto-taxis",
all over Crepurizinho) or in a freighted car. In Săo Chico there are work fronts that can only
be reached by motorbike and on foot.
14
Part 1. Săo Chico
The Mining Site History
According to information provided by Mr. Waldomiro, Săo Chico site was discovered in
1963. Probably the first areas to be exploited were those close to the village, which was built
around the landing track, supporting the work fronts. From 1986, with the opening of the
Transgarimpeira (branch of the Santarém- Cuiabá that goes from Moraes Almeida until
Crepurizăo), the access to the site is no longer exclusively via airplane, lowering the costs of
production and maintaining the viability of the mineral exploitation site even during the 90's,
albeit low gold prices in the international market and national economic policies that were
little favourable to mining. In the end of the 90's, some miners had started to exploit primary
deposits of the region, which had seemed very promising. The mining site reached top
production in 1999/2000/2001, producing - only in the work front called Montanha - about
two tons of gold. According to inhabitants' statements, the population of the site reached
about 5.000 people. At the same time, the site's new track was constructed (inside a farm,
about 1 km away from the village).
Site's General Description
Two years after the last "rush", Săo Chico shows a picture of little activity. From the seven
work fronts connected to the site, six are in activity, especially those closer to the village's
centre. There is a total of 69 people directly involved in the extraction - 59 miners/workers
and 10 cooks. Work is concentrated in the extraction of secondary gold or primary deposits
close to the surface, through outdoor panning. We estimate current production of Săo Chico to
around 1 kg/ month, value that shall increase slightly during summer.
The work carried out in the baixőes (inactive alluvial gold flats) is one of repassagem, that is
panning previously exploited material. Usually, baixőes go through their second or third
repassagem with very low productivity and profitability, sometimes not even covering costs
of extraction. Only in one of the fronts, it was observed panning of virgin alluvial material
(areas located in between the active riverbed and higher levees).
The work teams are composed of 3 people (1 in the "spurt end", 1 on the hose, 1 assistant),
with 30% of the auriferous production allocated to them. The reduction of the size of the team
from 5-4 - how it was standard until the 90's to 3 people, can be interpreted as a mechanism
to maintain mineral exploitation viable in a scenario of exhaustion of the deposits and high
15
costs of production. The increase of the individual participation from 6% (five team) or 7,5 %
(four team) to 10%, increases the possibility to guarantee, at the individual level, a minimum
income enough to assure the maintenance of the workers in the site. The reduction of the size
of the team does not necessarily mean an intensification of the individual work. Extraction
through repassagem eliminates several of the work stages which traditionally require a lot of
effort (roots cutting, river banks clearance). Nevertheless, there was an extension of weekly
work hours. Saturday became a common workday; recess was reduced to Sundays (or to the
day after despescagem (process of cleaning of the sluice box and concentration of the gold
bearing material). Recently there was the attempt to benefit rejects from mills (curimă)
through an artisan process of cyaniding in stacks. This type of work has ceased, in one of the
cases due to a misunderstanding between the partners of the enterprise and, in the other in
case, due to lack of availability of material to be treated. The "laboratory" for gold refining
was located in a farm outside village (S 06ş 25' 04.9" / W 55ş 56' 46.0"). In 2002, a "slope"
(rampa) worked in the Mountain area (set of mills and centrifugal machines for the large-
scale material processing). The owners of the equipment pay to the landowner a tax of 10% of
the production.
The village
Săo Chico village has 63 houses along the old landing track. Four out of 63 houses are
destined to public use (one of these is inhabited), three have exclusively commercial use and
eight were confirmed by the neighbours as abandoned and without use. In total, 49 looked
inhabited. From these, 44 were registered, representing a sample of 90% of total houses. The
population registered amounted to 134 individuals. In the Transgarimpeira, next to the
mining site's entrance, there were three residences that were not included in the census. The
village is 180 meters long towards 70ş SE1. The only public service in the village is a health
post for malaria analysis belonging to the National Foundation of Health. The police station
has been abandoned for three years (resident's information). The village school installed in
January 2003, interrupted its activities in June 2003 without further notice. The only
collective service available is the cleaning of the public areas carried out by an old man, who
is paid by the locals to provide this service. There are three diesel retailing and four gold
buyers. They are:
1.) Mr. Waldomiro [S 6ş 24'56.1" / W 55ş. 58'.00.4"]
2 All tracks were taken according to the direction of the river current flux
16
2.) Carlos Enrique Gonçalves (Juca) [S 6ş 24'57.0" / W 55ş. 57'.59.2"]
3.) Nilson Pine (Joăo do Comércio) [S 6ş 24'57.8" / W 55ş. 57'.58.7"]
4.) Pedro Pereira da Silva (Baixinho) [S 6ş 24'57.8" / W 55ş. 57'.58.7"]
All the gold buyers burn gold indoors, inside the store, without exhaustion and usually
without protective individual equipment. Stores 3.) and 4.) also sell foodstuffs.
Houses Profile
Most houses are at the same time used in commerce and as residences (Table 1, Table 2).
Usually their inhabitants are also the owners. They are simple, wooden buildings, with
cemented floors and roofed with aluminium sheets (Table 3,Table 4). They have four rooms
in average, with an outdoor toilet (Table 5, Table 6).
The only source of electric power is a diesel-run generator. Half of the houses have their own
generators, and usually supply electric power to the houses in the neighbourhood (Table 7).
The amount charged for this service varies. Water for domestic consumption derives from
wells (Table 8). The most common water storage procedure is in containers (Table 9). The
water is not treated before consumption. Usually, domestic garbage is deposited close-by on
unoccupied areas, and sometimes it is burnt (Table 10). A third of the houses cultivate a small
yard, planting onions, green cabbage, coriander, parsley, "maxixe" and lettuce (Table 11).
Few houses have fruit trees in their yards. In thirteen of the 44 houses, people keep animals
for consumption (pigs in five houses, hens in 11 houses) (Table 12).
Population Profile
The majority of the population in Săo Chico village are male. Average length of stay in the
village is 8.1 years (median = 7 years) (Graph 1) and the population is in average 28 years
old. Graph 2 shows the distribution according to age groups. Taking in account only the adult
population (> = 18 years), the average time of permanence in the village is raised to 9.6 years
(median 10 years) and average age is higher: 36.8 years (median 36 years).
17
Graph 1: Săo Chico. Length of permanence in the village (age groups)
> 25 years
1
20 to 24
6
15 to 19
15
10 to 14
32
5 to 9
30
1 to 4
40
< 1 year
10
0
5
10
15
20
25
30
35
40
Graph 2: Săo Chico. Distribution of population in an age pyramid
more than 60
2
51 to 60
9
41 to 50
25
31 to 40
29
21 to 30
22
18 to 20
9
15 to 17
4
6 to 14
9
less than 6
25
0
5
10
15
20
25
30
18
Most people originate from Maranhăo State (47%). If we take into account only the adult
population, this percentage is raised to 61.5% of the adult population. Most children and
adolescents (< 18 years) were born in Pará state (81.6%), thus confirming their parents' trend
for permanent migration to the region. The level of education is very low, 38% of the
population older than fifteen years did not complete elementary education (Graph 3) and have
limited reading and writing abilities. Only 17% have reached a formal degree of schooling
(secondary or elementary education).
Graph 3: Săo Chico. Education Level (% of population older than 14 years)
Not informed
10
Undergrate incomplete
1
Senior Highschool complete
6
Junior Highschool (5th - 8th)
10
complete
Junior Highschool (5th - 8th)
20
incomplete
Elementary School (1th - 4th)
15
complete
Elementary School (1th - 4th)
20
incomplete
Only 1th grade
3
Only literante
4
Never went to school
11
0
2
4
6
8
10
12
14
16
18
20
About 26% of the population does not have personal identification documents (Table 17).
This percentage is even more expressive when taking into account children and teenagers
(younger than 18) - 63.2% of them do not have identification documents. 81% of the
population older than 15 are economically active. Table 19 shows which economic activities
are carried out. A third of the people (32.1%) are gold miners. Săo Chico population' staple
diet contains rice (100% of the houses consume rice daily), beef (80% confirm daily
consumption), cassava flour (84%) and beans (61%) in their menu. Consumption of
vegetables and fruits oscillates seasonally due to the difficulties of access. Fish was the food
19
less consumed. This is also due to difficulties in supply, since fish is usually supplied by
Santarém market. Some inhabitants have declared to fish for subsistence in the farm's lakes
and rivers. Further detailing on the consumption frequency of researched food items are
available at the data presentation part. The most frequent consumer good in Săo Chico is the
gas oven, 34 houses (77%) have declared they own one. The freezer (52%) and the fan (52%)
were found in more than half of the houses. Televisions with parabolic aerials and radios (or
cd-players) have also been found in 22 and 21 houses respectively. Eleven of the registered
houses have declared to own a motorbike; nine to own a bicycle and seven a pick-up truck.
Social Organisation
Săo Chico is going through the initial stage of transition from a corrutela (a settlement only
destined to support the activities in the mineral prospecting) to a village with lasting
perspectives and diversified economic base. Social status is achieved through landownership
(generally old mining areas legalized by the previous owners) and through commerce.
Usually, there is a diversification of economy activities. The most profitable economy activity
in commerce is selling oil, which is associated with gold purchase. The economic base for
landowners is the rent and sale of land and also sale of cattle. Local dealers, who only live
from surplus generated in the mineral prospecting, can hardly accumulate any capital. All oil
dealers and landowners keep close relations with Itaituba or Santarém, where part of their
families lives (usually school age children) or where they have properties. There are no forms
of civil organisation in the village. The only form of organisation is through the protestant
church "Assembléia de Deus", gathering 30 people.
Mining Sites
MONTANHA
Localisation: S 6ş 25' 04.4" / W 55ş 58'07. 5"
Distance from the village: 0.28 km.
Activities: 3 mills (10 people), 3 pairs of machine (9 people).
Extension of the area: 400 m toward 81ş SE (following waterway)
During this work front, it was produced, in the last fofoca (1999/2001), around 2 tons of
primary as well as secondary gold.
The area is located inside Mr. Waldomiro's farm. Two members of the community also have
the use rights in smaller portions of the area. One of them received the property as a payment
20
for drilling (sondagem) services carried out by Mr. Waldomiro2. The area is totally modified,
showing signals of intense activity in previous years. Riverbanks' depths reached 12 meters in
the extraction phase. Nowadays, due to the deposit of waste and "washed" material, banks are
not even 4 meters deep. The three hammer mills3 are located together [S 6ş 25' 00.5" / W 55ş 58'
09.4"]. The mills are connected to Yanmar 18 HP engines, which burn up 15 litres of oil per
day each. They are supplied with material extracted from the main ore body, usually material
already treated in concentrators (sluice boxes). The choice of the material is made at random
by the workers responsible for filling the mills. The three mills consume about 4 kg of
mercury per week. According to one of the mill owners, in the weekly despescagem, 10
mercury grams are recovered from each mill.
Based on this information it was calculated the loss of 64 kg of Hg since February 2003, date
declared to be the beginning of the mills' activities in this region. The pulp flows over copper
plats and is deposited in small decantation holes (1 m x 1m). The decanted material (curimă)
is removed continually and stored in a nearby location [S 6ş 24' 59.9" / W 55ş 58' 09.4"]. The
extension of the base of the stack is 15 m x 20 m. Last year, this type of material was used for
cyaniding. The remaining portions of cyaniding stacks are still visible at the riverbanks.
During the visit it was observed three pairs of machines [PM1 (well) S 6ş 25' 03.7" / W 55ş 58'
06.8"], [PM2 box S 6ş 25' 03.1" / W 55ş 58' 08.4"], [PM3 box S 6ş 24' 57.4" / W 55ş 58' 10.5"]. The
size of the sluice box is 9 meters. It is lined with plastic and fabric screen. Another drain
measuring 1 meter is fixed at the end of the first one. This second sluice is an allowance made
by the machine owner to the gold miners. The gold that remains in this second box belongs to
the workers.
The level of gold purity is about 58% in both primary and secondary material.
There is an abandoned shaft in the area [S 6ş 25' 07.4" / W 55ş 58' 09.3"], which functioned until
2002. It is 18 meters deep with passages of 10 m and 3 m of extension, located in the area
with the most expressive gold production, according to the prospectors. In Montanha there
was a "slope" in 2002 (gold processing method brought from Poconé-MT) a number of
mills and concentrators able to process a great volume of ore. The owner of the area charged
2 The contract established as means of payment, the right to use 30% of the drilled area. The gold miner, who
owns a mechanical driller (4" x 70"), informed that he learnt how to use the equipment at Cuiu-Cuiu mining site
through a work colleague, who actually worked as an assistant in a mining company, which drilled in the region.
It was clear during the conversation, that they have know how on handling the machine, but a calculation of the
deposit reserve is not carried out. The process is only used in order to indicate the places with the largest
concentration of gold and based on this information, determine the levels of extraction.
3 Two mills belong to Mr. Waldomiro and one belongs to Mr. Gilberto, who informed us about the work front.
21
the owners of the equipment a tax of 10% of the production. The work stopped due to a
dispute about the amounts of payments between the landowner and the owners of the
equipment. All the water used in Montanha is drained toward a small creek (igarapé) flowing
behind Săo Chico village (located at right side of the stream). The houses in the left side of
the village collect water in wells at the margin of this stream.
ROSA
Localisation: S 6ş 25' 38.0" / W 55ş 57' 16.9"
Distance from the village: 1.85 km
Activities: 4 pairs of machine (12 people).
Extension of the area in work: about 1,320 m, route 40ş NE.
This area belongs to Mr. Paulo Araras, who charges a tax of 10% of the production for use
rights or sells use rights. Nowadays, 4 pairs of machines are in activity in three distinct places.
1) Work front Joanis [S 6ş 25' 53.4" / W 55ş 57' 38.8"]
Two pairs of machine working at the stream's margins. Although the active riverbed has
already been exploited, the current target (between the mountain and the active riverbed) has
not been worked yet. The work began in June 2003. The first despescagens generated a
production of 70 g and 80 g of gold. According to machinery owners' calculations, who
works with the team in the extraction, the production must reach 100 g for each despescagem
in order to be profitable.
2) Work front Soares [S 6ş 25' 43.2" / W 55ş 57' 25.5"]
At this site. there are a couple of machines working. The work started in 2003. The owner of
the equipment has bought from the landowner, the right to mine a 400-meter stretch of land
for 200 g of gold.
This work front's team (three people and a cook) complement their diet with fish caught from
the stream that drains the area. (camp/kitchen S 6ş 25' 39.9" / W 55ş 57' 23.7"].
3) Serviço da Concita [S 6ş 25' 38.0" / W 55ş 57' 16.9"]
The owner of the equipment is also the team's cook. The work started in May 2003. The
riverbank is 2,5 m to 3 m deep. The flow of material in the box is very strong and it is not
used a drain in the front of "maráca" (hose), so organic material and small rocks (~ 4 cm of
diameter) are poured in the sluice box. There are two more areas in this work front which
have been deactivated recently [S 6ş 25' 20.3" / W 55ş 57' 10.6'], both in the outgoing tide of the
stream.
22
SĂO CONRADO
Localisation: S 6ş 25' 04.0" / W 55ş 54' 45.3"
Distance from the village: 6.01 km (direct line).
Activities: 2 pairs of machine (6 people).
Extension of the area: 200 m, toward 150ş SE
Located at a farm with the same name. Presently, there are two pairs of machines in the [PM1
(box) S 6ş 25' 04.0" / W 55ş 54' 45.3'], [PM2 (well) S 6ş 25' 04.0" / W 55ş 54' 45.3']. The owner of
the equipment is Mr. Carlos Henrique Gonçalves (Juca), who has bought the extraction rights
from the landowner. The depth of the riverbank is 3 to 4 meters deep. The work carried out
there was the repassagem of material already worked in the active streambed. Especially at
the winter, prospectors complete their diet with fish caught at the stream that flows through
the site. We were informed of the existence of another point of service inside the area (1 pair
of machines belonging to Mr. Zezinho). However, it was not possible to confirm this
information during our visit.
SURUCUCU
Localisation: S 6ş 26' 17.3" / W 55ş 55' 28.5"
Distance from the village: 5.3 km (direct line).
Activities: 5 pairs of machine (15 people).
Extension of the area (visited): 150 m toward 30ş.
There are three working sites in this area, all of them working repassagem. The visited area is
worked by Mr. Antonio Conceiçăo Lima who uses two teams (seven people including the
cook). Each claim produces around 70 to 80 g of gold per despescagem (8 to 10 days). The
gold purity level was informed to be 83%.
BAIXĂO NOVO
Localisation: S 6ş 23' 36.2" / W 55ş 57' 42.4"
Distance from the village: 2.5 km (direct line).
Activities: 1 pair of machines (3 people).
Extension of the area: 190 m, toward 67ş NE.
There is one team working in this site. The extraction started in November 2002, the second
repassagem is being carried out in the area. The sluice box is shorter (6 m) than usual in the
region. The workers had connected a second box (1.5 m) for concentrating the gold which
was to be given to them. The material flowed through the box very irregularly because of
oscillations in the engine connected to a suction pump, driving a lot of organic material and
23
pebbles into the box. This leads to the deposits of organic material and rocks in the
concentrator box. The concentrator has and inclination of approximately 15ş. The final
verification in pan is carried out in the stream [S 6ş 23' 37.1" / W 55ş 57' 42.0"].
GROTA LADEIRA DE PEDRA [not visited]
Localisation:
Distance from the village:
Activities: 1 pair of machines (3 people).
Mining Workers' Profile
Thirty-two from the 59 miners who work in the seven work fronts linked to Săo Chico could
be interviewed, that is a 54% sample4. The Săo Chico mining sites workforce has the
following profile.
The average age of the workers who work at the sites is 40 (Table 31). The majority of them
is single or separated (Table 32), 75% informed they had children (Table 33), which entails an
average of 3.3 children per father. The level of formal education is very low (Table 34). 55%
informed never to have studied. From the remaining workers, only 4 (12.5%) went further
than elementary school, not however, completing basic education (Table 35). 18% of the
interviewed workers do not have personal identification documents (Table 36).
4 At all workfronts, we tried to interview two thirds of gold workers, thus sampling 39 individuals. Nevertheless,
at some sites, this was not possible due to the absence of some workers. The Ladeira de Pedra workfront was
inactive during our visit, but the owner told us that the works were about to be reactivated. Because of this, this
workfront was included in our target public, although was not possible, during our stay, to interview someone
from the team which was being hired .
24
Graph 4: Săo Chico Community. Distribution of worker per age band
more than 61
51 to 60
41 to 50
31 to 40
21 to 30
18 to 20
less than 18
0
2
4
6
8
10
12
Most of the workforce from Săo Chico come from Maranhăo state, where 70% were born and
lived at the time they began their activities with mining (Table 37, Table 38). In average
miners have start to work in gold mining 17 years ago. Graph 5 shows that the opening of the
Transgarimpeira in 1986 was an important motif factor for starting in the activity. The
average permanence in Săo Chico is 9.3 years (median = 7 years) and 80% of the miners have
already worked in other sites, mostly at the Tapajós region.
25
Graph 5: Săo Chico Mining Workers. Year of starting the work in mining
6
5
4
3
2
1
0
1965 1972 1974 1978 1979 1980 1983 1984 1985 1986 1987 1988 1989 1990 1993 1995 1999 2000 2002
Graph 6: Săo Chico Mining Workers. Length of stay in Săo Chico (years)
20
18
16
15
14
13
12
9
Years
8
7
6
5
4
3
2
1
0
1
2
3
4
26
Before starting to work in mining, half of the workers had worked in agriculture, cultivating
their own land (18.8%) or someone else's (31.3%), usually for subsistence. A third of them
were wage labourers before starting to work in mines (Table 39). They declared to have
earned about 1.3 minimum wages (USD100) (Table 40). Only two interviewees said they had
gone back to the previous economic activity after arriving at the mining sites. The information
above, and the length of stay in Săo Chico's mining sites, implies that mining activity is not a
complementary economic activity, but the principal one. Another fact corroborates this
hypothesis: in average, workers have not been to an urban area for four years (Table 43). The
most cited city was Itaituba (60%). Albeit the long stay at the mining sites, most of the
workers send money to relatives (43%). Those who send money, stay less continuous time at
the site (2.4 years against 5.6 years for those who do not send money).
The work regimen at Săo Chico's fronts is very homogeneous. The teams that work in the
exploration of secondary deposits receive 30% from the refined gold. As each team is
composed of three workers, the individual profit is of 10% of the gold production. The
workdays are: Monday to Saturday. Only 25% work half-time on Saturday. Usually, the only
rest day in Sunday.
By asking about profits in the last despescagens, it was possible to have an idea about
production levels at Săo Chico sites and worker's wages. The average individual profit was
8.5 grams of gold per despescagem (Table 47). Taking in account a price of R$ 22,00
(USD7.3) for a gram of gold, their profit was at a R$187,20 (USD62.4) for two working
weeks, corresponding to a monthly wage of R$374,4 (USD124.8). Even though the food is
paid by the machinery owner, in most cases the workers have to pay the cook's wages. The
cooks earn about 4 to 5 grams of gold monthly from each member of the team, totalling a
wage that oscillates between 12g to 30 grams of gold per month or R$ 264 (USD88) (for one
team) to R$ 660 (USD220) (for two teams) About 43% of the interviewed workers have
experience in working independently in the mining sites. There is an equal distribution
between working with machinery and manual work when working independently (Table 48,
Table 49).
When questioned about illnesses in the last two months, 40% of the interviewees affirmed to
have been sick in this period. From these, the great majority (70%) had to stop working and
60% looked for medical assistance (Table 50, Table 51, Table 52). Work accidents, like
falling at the banks, cuts, burnings, and scorpion or snake bites are frequent. A third of the
people interviewed reported a work related accident (Table 53) and 38% affirmed to have
already witnessed a fatal accident (Table 54).
27
80% of the workers admitted to burn or to have burnt gold (Table 55) and none of the
interviewed denied participating in a health evaluation (Table 56).
The workers' main sources of information are the radio usually Radio Nacional and
television, Globo preferred (Table 57, Table 58).
Workers hardly participate in general elections. In the last election for State Governor and
President, only one fourth of them voted (Table 59, Table 60, Table 61).
Although the situation of Săo Chico today is of apparent tranquillity, violence is present at the
individual life history of Gold workers. More than half have already witnessed scenes of
violence inside the areas, and in two third of the cases somebody was killed (Table 62, Table
63).
28
Part 2. Crepurizinho Mining Sites
The Mining Site History
This settlement (currutela) was founded in 1962, at the beginning of the new Tapajós gold
cycle. Crepurizinho has always worked as a supplying point alternative to Crepurizăo - a
village possible to be accessed by boat. In 1974, a landing track was constructed by Mr
Lourival Rodrigues de Lemos, who monopolised all flights and controlled commerce in the
village. Another historic fact that marked the region was the creation of Transgarimpeira in
1986, which made road access also possible.
Crepurizinho had top production between 1983 and 1990, producing around 350/400 kg Au
per month. At that time, 10.000 people lived at the village (3.000 registered voters). In the
90's, the discovery of new ore bodies heated the region's economy again, albeit not at the
same level as in the eighties.
Sites' General Description
Crepurizinho is used as a logistical base to the work fronts situated in a 10 km radius. This
makes estimates about mining activity in the region difficult. According to observations and
information from local businesses, it may be stated that at present (July 2003) around 60 pairs
of machines and 15 shafts are active in the region. This indicates a population of about 350
people working directly in these sites (300 gold miners and 50 cooks) and a monthly
production of about 50 kg Au. After the last rush brought about by the discovery of primary
deposits at the end of the 90's, currently the activity became stagnated.
There is a transformation in the mining activity in the region following various crisis
management strategies. Three trends were identified:
Rise in processing capacity without modifying processing
Since 1998 miners/entrepreneurs originated from Poconé (MT) have brought to the region
gold processing plants used at that site. These plants are composed by a number of ore mills,
centrifugal machines and amalgamation container able to process in average 25 to 30 cubic
meters of auriferous material, working in two shifts with a 12 people team earning wages. The
total amount of needed investment in order to implement a new plant using new equipment is
29
around US$ 400,000. The main production cost is the fuel (30.000 l per month)5. The type of
material varies. At Tolentino the processed material comes from an old ore body abandoned
by miners. At Reinaldo's, the plant owner was sampling the material from secondary deposits.
It was informed that 0.2 g Au/t and 0.8 g Au/t were extracted from the material. According to
Waldiney Mauro de Souza, Tolentino plant manager, the contents of gold in the plant's waste
is about 10-12 g Au/ t, because they have not yet used a ball mill (a cylindrically shaped steel
container filled with steel balls into which crushed ore is fed), which would raise the degree of
gold recovery.
Cyanidation
Mining of primary gold deposits, different from alluvial gold, usually concentrates processing
of auriferous material at only one place. It is the position where the mills have been installed.
By this way it is possible to get spots of tailings with still a high concentration of gold. At
first, this kind of material was not used. Nowadays, it has been targeted by people who offer
to process the tailings using cyanidation. There have been at least two reported cases
operating this processing the region. One is leaded by a chemist leads from Săo Paulo;
another is composed by people from the region who have learnt the process when working in
mining companies. Usually, the terms of agreements signed allow a partnership with the
owner of these tailings.
Cyanidation adds value to a material which is worthless at the usual process. Therefore, it
becomes attractive to many owners, whose deposits areas are at the brink of exhaustion, and
foresee an additional income by the processing of tailing material. It has been noticed at
informal conversations with landowners that there is a clear lack of information about
cyanidation - the type of technology and its dangers.
Repassagem of semi-unexploited areas
At Crepurizinho one almost does not find unexploited areas with alluvial gold. An alternative
found by workers in order to enrich the mining material was to wash already worked banks or
backfills of tailings.
Team Members Reduction
Many pairs of machines active at Crepurizinho region work with three team members, which
raise individual profits to 10% of production, at the same reducing production costs slightly.
Mining already worked areas reduce the amount of time needed to clear the banks during
extraction, avoiding the roots clearing job and enabling teams with lesser numbers.
5 Only two items represent in average production costs of about R$ 47.000,00 per month. In total production
costs are about R$ 60.000,00 (US$ 20,000), without calculating depreciation and eventual costs.
30
Reduction in the supply of workforce
Although there was an improvement of individual income due to the reduction of the team,
small scale gold mining is facing an unprecedented problem: lack of working force. At least
two visited work fronts were paralysed due to lack of workers. This situation indicates that
gold production levels are so low at Crepurizinho region, that even with food provided by the
machinery owner, the worker does not consider their efforts compensated satisfactorily, since
it their duty to pay for the cook, who is paid 5 g Au per month from each worker. This
behaviour is partly due to more wages alternatives and land access for subsistence production.
The Village
Crepurizinho village is composed by three streets and five lanes (see sketch). There are 264
households in total, with the following characteristics:
Houses
264
Unoccupied houses
56
Public unoccupied houses
04
Strictly commercial Houses
08
Houses used as deposits
12
Houses where no inhabitants were found6
22
Houses who refused to be interviewed
01
Registered houses
161
Sampling amounted to 87.5% of households. 553 inhabitants were registered, indicating a
population of about 600 people.
There is an elementary school at the village offering from 1st to 6th grade. The school has six
employees (four teachers, a caretaker and a cook). In 2003, 146 students enrolled, lees than
half enrolled in 2002 (300 students). The school works at a building that was a hospital until
1991. At the time, the building was bought7 by a city councillor from Crepurizinho, who
donated it to the community. Lesson are offered in three shifts (7h00 11h00, 13h00 17h00,
18h00-22h00). The school has its own power generator, whose fuel is provided by the local
government (mayor).
6 Three attempts were made in order to find the residents.
7 The price at the time was 353 g Au, according to buyer's information.
31
There is a public health post at the village, which carries out malaria tests and provides
medicine in case of malaria. There is also a health agent at the village, who is paid by the
local government.
The village's police station has 3 employees (1 SD, 1 corporal, 1 soldier).
There are three churches at the village, one is catholic one, and two protestant (Assembléia de
Deus and Seventh Day Adventista). The catholic church has the largest number of followers.
There are four gold buyers at the village:
- Marsan (Luizinho) [S 6o 50'10.2" W 56o 34' 58.6"]
This store has the same owner for five years and it purchases 3 to 4 kg of gold monthly.
The gold is burnt in an exhaust, but there is neither mercury recovery nor use of
appropriate safety equipment.
- Silva Compra de Ouro [S 6o 50'11.9" W 56o 34' 58.7"]
The store works inside a butchery, selling fresh meat. It's the less sophisticated and the
one which purchases the least amount of gold.
- D'Gold [S 6o 50'12.3" W 56o 34' 58.7"]
It the newest gold buying house. It opened in 2002 and buys 5 to 8 kg per month. There is
an exhaust but no mercury recovery. As for protection equipment use, they only wear
sunglasses at the time of gold casting.
- Joel do Ouro (Paizinho) [S 6o 50'13.1" W 56o 34' 58.1"]
One of the oldest stores and largest buyer (around 10 kg per month). There is an exhaust,
but no mercury recovery. As for protection equipment use, they only wear sunglasses at
the time of gold casting.
Commerce in the village is characterised by grocery stores, with large varieties, although
there are also specialised stores for clothes and shoes, for example. The main commodity is
the oil for fuel. There are 5 retailers who sell around 100.000 litres monthly, for mining (90%)
or electric power generation (10%).
32
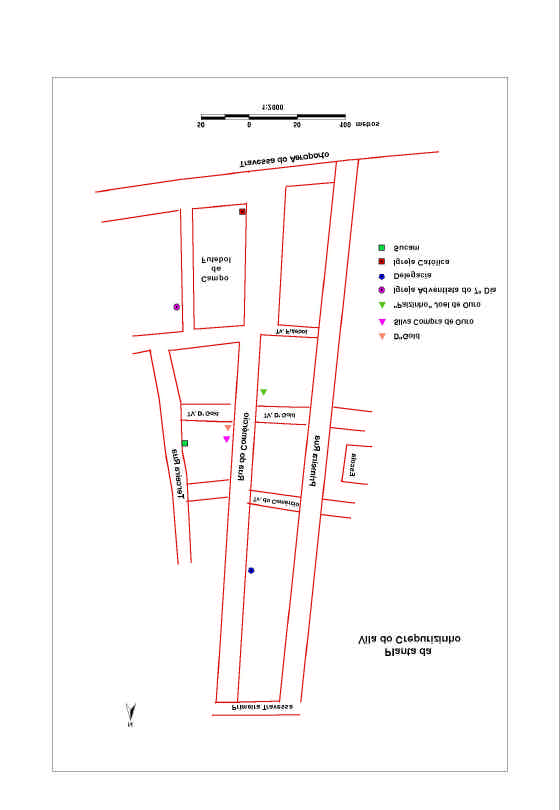
Graph 1: Crepurizinho village sketch
Houses' profile
Most houses are inhabited by owners (62.1%) and 11.2% is rented. The remaining houses
(26.7%) are lent to the inhabitants with no rent charges (Table 64).
33
Differently from Săo Chico, in Crepurizinho most of the inhabited houses (74.5%) serve
exclusively as residences. One-fourth of the houses are at the same time residential and
commercial (Table 65)
Crepurizinho houses follow a specific construction pattern. Almost all of them are wooden
houses (98,1%) roofed with brasilit or aluminium sheets (90.1%) and cement floored (Table
66, Table 67, Table 68). There are some two-floored houses.
There are 5 rooms in average in each house (1 room, 2 bedrooms, 1 kitchen, 1 bathroom), and
most of them do not have toilet inside the houses (58.8%) (Table 69). Domestic sewage is
taken to a dry-sewer (53.8%) or to an outdoor ditch (46.3%) (Table 70).
As the village has no electric power generated by the state power company, the only source of
electric power is the diesel generator. One third of the houses do not have electric power.
Some of the residences that have their own generator (24.2%) provide electric power to
neighbouring houses, and they usually charge for the service. Almost half of the houses have
electric power in this manner. Only 10% of the houses use electric power without having to
pay for the service (Table 71).
Drinking water is collected by hand or through water pumps, from shallow wells (Table 72).
Most of the houses stores drinking water in containers (47.2%). 48 houses have water tanks
(29.8%), and 20.5% store their water in buckets (Table 74). Inhabitants have shown great
concern with water treatment, only 15% drink untreated water. The remaining houses use
chlorine (56.6%) or a water filter (20.1%) for treatment (Table 74).
Crepurizinho does not have a garbage collection service. The most common way to dispose of
garbage is by depositing it on unoccupied areas (26%) or burning it (63%) (Table 75).
Most houses have a yard (83.2%), but only a small portion of them cultivates vegetables
(21.1%). The most common fruit trees found at the yards are mango, papaya, banana, coconut
and avocado trees. At these small yards, they grow vegetables and herbs like coriander, chive,
pepper, lettuce and green cabbage (Table 76, Table 77).
Almost two thirds of the households (64.6%) keep domestic animals (cat 51%, dog 37%). In
42 houses (26.1%) they have animals to complement their diet (chickens in 39 houses and
pigs in 10 houses) (Table 78, Table 79).
32 of the visited houses (19.9%) work in agriculture, in most cases only in subsistence
agriculture (72.7 %) (Table 80, Table 81). The main crops are cultivated are: corn, beans, rice,
manioc, and cassava.
34
Population Profile
Age and origin
Most people in Crepurizinho are female (50.5%). The population is 25.5 years old in average.
About 39% of the population is younger than 15 years old. Only 2.1% is older than 61. At age
pyramid, it is visible the lack of teenagers (15 to 20 years old). This may be because there is
no secondary school or university at the village (Graph 7).
People live at the village for 8 years in average (median 7 years). Half of the population was
born in Pará state (49.5%), the second largest group is from Maranhăo, 34.1% of the
population. Among the adults, (older than 18) this scenario is reversed. The majority of adults
come from Maranhăo, 51.9% and Paraenses become only 22.2% of the total, which confirms
the permanent migration trend already seen at Săo Chico.
Graph 7: Crepurizinho. Age Distribution of the population (in % from the total)
more than 61
2,4%
51 to 60
5,3%
41 to 50
15,7%
31 to 40
20,9%
21 to 30
9,8%
18 to 20
3,5%
15 to 17
3,5%
6 to14
23,5%
less than 6
15,5%
0%
5%
10%
15%
20%
25%
35
Graph 8: Crepurizinho. Population distribution according to length of residence at the
village
> 25 years
2,0%
20 to 24 years
3,9%
15 to 19 years
11,0%
10 to 14 years
22,0%
5 to 9 years
22,2%
1 to 4 years
33,9%
< 1 year
5,0%
0%
5%
10%
15%
20%
25%
30%
35%
Education
The level of formal education in the population older than 14 is very low, 62.4% have not
concluded initial elementary grades (1st to 4th grade).
36
Graph 9: Crepurizinho. Level of education (% of population older than 14)
Undergraduate complete
1,5
Undergraduate incomplete
1,8
Senior Highschool complete
3,0
Senior Highschool incomplete
0,3
Junior Highschool (5th - 8th.)
9,6
complete
Junior Highschool (5th - 8th)
14,2
incomplete
Elementary school (1th. to
6,6
4th.) complete
Elementary school (1th. to
26,2
4th.) incomplete
only 1th Grade
13,0
only literante
4,2
never went to school
19,6
0,0
5,0
10,0
15,0
20,0
25,0
30,0
From the 553 people registered, 85.5% have personal identification documents.
Income/Employment
From the population older than 14 years 65.7% are economically active. There is a clear
division of labour according to gender. Most of the labour market is composed by males.
They are 72.7% of the workforce, although their participation in this age group is of 52.6%.
Only 8.6% of the male population older than 14 is unemployed. From the unemployed older
than 14 years, 86.7% are female. (Table 84,Table 85).
The average monthly income is R$503 (USD167). The average male income is around R$538
(USD179), whereas females earn in average R$397 (USD123) per month, with a 35.7%
difference in income.
Dietary habits
The Crepurizinho population have a very diversified diet. They eat rice, milk, beans and
manioc flour almost daily. Beef consumption is much lower than in Săo Chico, only 28 % of
the population eats beef everyday. They eat beef four days a week in average. 16% of the
houses also rely on hunt in their diet usually once a week.
Fish consumed at the village usually comes from Itaituba or (although less frequently) from
Santarém. It arrives frozen and it is sold at the same price as beef (about R$ 7,00 kg). The
37
population eats fish about 1.55 times a week in average. A small portion of the houses (13%)
declared to eat fresh fish from the region. Consumption of salted fish (from Itaituba) is
insignificant (1.8%).
Graph 10: Crepurizinho. Dietary habits (average weekly consumption)
8,00
6,95
7,00
6,00
5,52
5,36
5,39
5,00
4,40
4,00
3,56
3,00
Average of weekly consumptionl
1,97
1,98
2,04
2,12
2,00
1,55
1,17
1,00
-
Beef
Milk
Rice
Manioc
Fruits
Egs
Pasta
Chicken
Beans
Frozen Fish
Vegetables
Manioc flour
Consumer goods
The most popular consumer goods in Crepurizinho are the gas oven (96.2% of the houses own
one) and the TV (60.2%). Graph 11 shows the complete picture of consumer goods
availability in the village.
38
Graph 11: Crepurizinho Consumers goods (% from registered houses)
100,0% 96,2%
90,0%
80,0%
70,0%
60,2%
60,0%
49,1%
50,0%
41,6% 39,8% 39,1%
40,0%
29,2%
30,0%
25,5%
22,4% 19,9%
20,0%
8,7%
10,0%
5,0% 3,7% 3,1% 2,5% 1,2% 0,6% 0,6%
0,0%
TV
Fan
Car
Boat
Freezer
Radio
Bicycle
Fridge
Tractor
Gas oven
Minisystem
Telephone Generator Moto bike
VHF Radio
Video-recorderPick-upTruck
DVD - Player
Properties
The village's internal economic differentiation is portrayed by the information on personal
property. 102 houses declare not to have any property (63.4%), and about 23% of the
interviewed houses declared to possess a house in the city, especially Itaituba. Farm
ownership or property is restricted to a small portion of the population (less than 10%). From
the data on property and access to consumer goods, it may be concluded that in Crepurizinho
only a small portion of people (no more than 7%) that have different economic conditions
from the others.
39
Graph 12: Crepurizinho - Village. Property ownership (in % of registered houses).
25,0%
23,0%
20,0%
15,0%
10,0%
9,3%
6,8%
5,6%
5,0%
5,0%
1,9%
1,2%
0,0%
House in the
Farm in the
House to rent
urban plot
House to rent
Comercial
Farm outside of
city
mining site
in Crepurizinho
in the city
establishment the mining site
in the city
Demands
Asked what is lacking at Crepurizinho8, most people interviewed cited lack of medical care,
either through a health post or a hospital. The second priority is a school with complete junior
highschool levels (6th 8th grade). Improvement and maintenance of road access, public water
and electric power supply were other demands. Comparing the demands according to
economic status, through the variable property, has shown interesting differences in opinion.
There was no difference in most important needs (health care, school, road), but their
attributed weights were different. Property owners attributed a higher value to medical care
than the group who do not own property, who in turn, emphasised school and road access.
There are many hypotheses to explain this difference. On one hand, we see an indication of
different levels of awareness about the importance of the health care. On the other hand, this
result may be interpreted as the availability of individual solutions, based in the availability of
financial resources, to surpass the difficulties from lack of schools and access. Examples of
8 We asked them to inform the three main demands, which ordered by priority. From the answers a ranking
score was made, the first option had a 2,0 weight, the second had a 1,5 weight and the third had 1 weight. An
item cited by 50% as the first option, by 30% as the second option and by 60% as third priority, would have a
final rank of 205 (2*50+1,5*30+1*60).
40
this strategy would be a second house in the city for children at school age or the use of air
transportation during the period when the village is inaccessible by road.
Graph 13: Crepurizinho - Village. Priorities ranking (according to property ownership)
Total
with properties
without properties
160
140
120
100
80
60
40
20
-
School
Road
Water
Hospital
Energy
Health Post
Public SecurityOptions for sports
Options of employment
Presence of the State
Basic sanitation infrastructure
Forms of comunitarian organization
Participation in health status research
The demand for health care is also expressed in the inhabitants' promptness in participating in
the health status research. Approximately 98.1% agreed to the disposal to participate in a
health evaluation.
Contact with urban areas
The villagers have close ties to urban centres, especially Itaituba, which was cited by 69.6%
as the last urban centre visited. About 41% of the informers declared that the last time they
were in a city was in 2003, and 32.3% said they were there last year. Only 13% had not been
to the city in three years.
Social Organisation
Crepurizinho is a community inside the municipal structure, which gives it some autonomy
and access to some local government resources. In 1991, Crepurizinho led a movement
41
toward emancipation of Transgarimpeira region from Itaituba county. At the time, the village
had around 3000 registered voters, and a population of about 12000 people. The plebiscite
was not successful due to the fraud of electoral ballot boxes. Political independence was
against the interests of a regional leader who intended to run for mayor in Itaituba (and later
succeeded). Independence would take away an important vote reserve for him. Although the
frauds became public afterwards, there were no re-run in the elections.
As a village, Crepurizinho has the right to the presidency of the community. Their role is to be
an intermediary of community interests before the city hall. The last elections for the position
(mandate 2003/2004) unveiled an unsatisfaction that has taken place in the last few years.
There was a dispute between two groups for the position. The election of the new leader did
not fulfil the basic rules of a democratic election, which threatened the legitimacy of the
current leader. An opposition movement was created with representatives from the church and
commerce. Their intention was to protest against the mayor's indifference toward the village,
the enduring leaderships and their poor performance before the city hall.
The opposition was a spontaneous movement without formal characteristics or ties to political
parties. This organisational weakness resulted in its rapid disintegration after the elections.
The only formal organisation besides the churches is the mother's club, created in December
2002. It brings together 82 women who meet once a week. Its main goal at the present is the
installation of a health post in the village. A vegetable garden was also created in partnership
with Pastoral da Criança (an NGO linked to the Catholic Church), which also intends to
promote a sewing course. The club also has a program for donation of cestas básicas (basic
provisions).
It is important for future project activities, to realise there are incongruities inside the
community. Any action should be presented to the local leaders before starting a community
assembly in order to gain villagers trust and to receive suggestions and ideas important to the
success of the interventions. The following leaders should be invited to this kind of
presentation:
Community President (Mr Luis Preto)
Community Vice-President (Mr Cícero Gomes da Silva)
School Principal (Mr Cleomar Nonato da Silva)
Mother's Club President (Mrs Sônia Alves Conrado)
Catholic Church representative (Mrs Marietta Régis)
AMOT Members (Mr. Zé Baiano and other residents).
42
Mining sites
The mining sites presented here do not include all the work fronts which relay on
Crepurizinho for logistical support. The choice of these sites was based on the need to select
an area to carry out the project. The criteria used for the selection were:
·
Extractive activities diversity (primary and secondary deposits and repassagem);
·
Existence expectancy (at least during the execution period of the project, the place
would have to be active)
·
AMOT's acceptance and agreement.
GARIMPO ZÉ BAIANO (JOSÉ LAURĘNCIO DE OLIVEIRA)
Localisation: S 06ş 47 50.0" W 56ş. 38'56. 9"
Distance from the village: 8.4 km (in a direct line).
This mining site which was originally chosen for carrying the project is inactive. Gold
extraction was carried out recently with heavy machinery (truck, conveyor belt tractor, shovel
and digger). The material had already been processed in a plant composed by ball mills,
hammer mill, two concentrators and two centrifugal crushers. Around 300 m3 of ore were
processed daily. Diesel consumption was about 1.200 litres per day. All the operation counted
with a team of 12 people who earn fixed wages according to their jobs. The plant construction
took two months and functioned for six months. It was stopped due to the owner's lack of
financial resources, who expected to find a gold vain below another one which was worked in
1992-2001, through conventional methods (shafts).
In 2001, the site's owner established a partnership with a Săo Paulo citizen (Mr Sergio) who
predicted the processing of the tailing through cyanidation in stockpiles. They started to build
a stockpile, it used to be periodically stirred and completed with new material. The laboratory
for gold refinement was built at Crepurizinho village. According to the mines land owner, he
was not aware of cyaniding procedures and its toxicity. After the geologist who was trying to
legalise the site requested, this partnership was terminated. Recently, the same owner received
a few new offers to process the tailing, whose content is estimated between 5 to 6 g Au per
ton.
MR TOLENTINO'S SITE
Localisation: S 06ş 47 51.4" W 56ş. 36'13.8"
Distance from the village: 4.7 km (in a direct line).
Activities: a slope, three shafts, a pair of machines
43
This site's owner, Mr Tolentino came from Maranhăo in 1962 to the Tapajós mining site.
After working at Mamoal and Crepurizăo sites, he stayed at Crepurizinho, where he started to
work in 1984. The area he occupied was discovered in 1968. From 1985, he worked with six
pairs of machines. In 1999, they started to work with the primary deposits, and the year with
the largest production was 2001. At present he has four teams working with him. Three are
extracting primary gold from the shaft and one is working with secondary gold (one pair of
machines). The gold's grade is 77.5%.
In 2003, the site's owner established a partnership with a group of miners from Poconé, who
set up in his land a plant similar to one set up at Mr. Baiano's9. The plant processes 700 tones
of material per day. The objective is to raise this capacity to 1800 tones. The plant is working
in two 12 hour shifts. The material originates from an old primary gold extraction area, and its
content is about 0.8 g per ton. It was informed that diesel consumption is at 1000 litres per
day.
The company's expansion plans depend on an understanding with the site's owner about the
land issue. The company is interested in acquiring the area. At the same time, Mr. Tolentino
who is growing older, is thinking in selling his land.
MR. LUÍS PRETO'S MINING SITE
It is composed by many work fronts; most of them along baixăo (creek) do papagaio. The
area is part of the old Tabocal mining site. Mr. Luís Preto arrived in Crepurizinho in 1974,
when he bought from Mr. Waldomiro Bandeira and Mr. Joăo Rodrigues, a portion of the land
at the price of 100 g Au. The mining site was at top production in the sixties. In 1974, it was
already considered a weak site, which facilitated its purchase and, in 1978, the expansion of
the area occupied at no charges. At that time, a team of two people produced 70 and 100 g of
gold in a fortnight. At the end of the seventies, 40 workers worked with the owner at meia-
praça10. Between 1980 and 1982 Mr. Luís Preto concentrated at the rafts (1981 Marupa, 1982
Crepurizăo) and from 1983 onwards, he started to work with machinery. At the end of the
eighties, 18 pairs of machines were working and production reached 7 kg of gold per month
before the national crisis start led by the Collor Plan. The situation improved in the second
half of the nineties with exploitation of primary gold. Besides his own land, Mr Luís Preto
9 The terms of this partnership were not written down and the information received about this contract's details
were contradictory. The person who is managing the plant is the same one who set up Zé Baiano's plant and, in
1999 set up the same equipment in Săo Chico in the mountain area and in partnership with Mr. Waldomiro.
10 Meia praça is a working regime where the working team is provided by a local shop owner with food and
working equipment. The gold production is divided between the team and the financier.
44
exploited primary gold in Săo Chico (1999) and at Zé Baiano's site (2000/2001), albeit
without success. From 2001, he went back to his own land, where he started washing
repassagem of some areas and exploitation of primary gold.
The mining site's land is free for exploitation, as long as a 10% of production is paid to the
owner. According to Mr. Luis Preto, he earns around 40 to 60 g of gold with this leasing.
Santa Terezinha work front
Localisation: S 6ş46'57.5" W 56ş39'58.2"
Distance from Crepurizinho: 10.6 km
Activities: a shaft with an eight people team and a cook
At this work front an eight people team works in the extraction of primary gold. At present
they are trying to find out the underground vain where the gold extracted from the baixăo
originates from. Two wells have been dug without expected success. The team receives 18%
of production. During the construction of the well, a carpenter works together with the team,
receiving 4% of the production. The cook earns 5g of gold per month from each team
member.
Luizinho work front
Localisation: S 6ş47'08.9" W 56ş40'04.4"
Distance from the village: 10,7 km (in a direct line)
Distance from Terezinha: 0,2km (in a direct line)
During the visit, two people were starting camp in order to start repassagem works at a creek.
The team has three people who earn 30% of production.
Tafarel's workfront
Localisation: S 6ş47'09.4" W 56ş40'14.5"
Distance from Crepurizinho: 11.0 km (in a direct line)
Distance from Luizinho: 0.3 km (in a direct line)
Activities: a 5 people team (including the work front proprietor) extraction of primary gold in
shaft.
The area was exploited in 1978. At the time production (goldwashing through panning) was
between 60 and 250 g of gold per stream bank. Between 1986 and 1990 the areas was worked
again with machinery.
The shafts are 20 and 13 meters deep. Their production up to now was 500 g of gold.
45
Raimundo das Dores Lemos (Negăo) work front
Localisation: S 6ş45'23.3" W 56ş40'58.9"
Distance from Crepurizinho: 14.0 km (in a direct line)
Distance from Tafarel: 3.6 km (in a direct line)
The front owner bought a portion of the baixăo named Papagaio three years ago for 250 g of
gold, and started working there with one pair of machines. At the beginning, the banks (10 m
x 10 m) produced about 150 g Au. At present, production is low and it is around 40 to 60
grams. The production cycle is around 4 to 5 days. This is so due to the fact that the pits are
shallow (2 meters deep) and the material worked has partly been washed already, with the
other part unexploited (area in between the margin of the active riverbed and the mountain).
Diesel consumption (27 hp engine) is 40 litres per day. After exhausting the land bought, the
work front "proprietor" continued working leasing other area. The cook's children live (6 and
2 years old) with the team. During our visit the works had stopped due to lack of workforce.
José Edmilson da Conceiçăo (Codô) work front
Localisation: S 6ş45'44.7" W 56ş40'47.5"
Distance from Crepurizinho: 13.3 km (in a direct line)
Distance from Negăo: 0.7 km (in a direct line).
Activities: two pairs of machines, 6 people
The machinery owner has been at this sector for four years. They work with repassagem of
unexploited areas at tips of the riverbed. One bank 20 m x 20 m produces from 100 to 150 g
of gold. The deposit is about 1.5 to 2 meters deep and the production cycle is around 15 to 20
days.
The workers started on May 2003. In the winter, it is not possible to work with two pairs of
machines due to the flooding of production areas. In order not to stop the work front, they
continue with only one pair of machines at lower production areas.
The main costs of production are diesel (400 litres per bank) and the rice (90 kg per bank).
Mr. José Edmilson started working with mining in 1986, and he is from CodôMA. In 1989,
he bought his first machinery and in 2000 a second pair. His wife works as a cook with him at
the site. They have a house in Tabocal and Crepurizinho, where they spend their Sundays.
Zé do Baixăo work front
Localisation: S 6ş46'44.7" W 56ş40'47.5"
Distance from Crepurizinho: 12.6 km (in a direct line)
Distance from Codô: 0.9 km (in a direct line).
46
Activities: two pairs of machines, 6 people.
The area that is exploited is the same where Codôs teams a working. The cook's children live
with the team (one is 2 years old and the other is 11 months old).
Edílson Gonçalvez Soares work front
Localisation: S 6ş46'18.2" W 56ş40'30.4"
Distance from Crepurizinho: 12.3 km (in a direct line)
Distance from Zé do Baixăo: 0.3 km (in a direct line).
Activities: one pair of machines, 3 people including the work front proprietors.
The banks (10 x 10m) produce between 40 g to 60 g of gold in a 12 to 15 days cycle. The
work front proprietor started mining in 1978 (Amaná AM), and was able to buy his own
pair of machines in 1995.
Luís Preto work front
Localisation: S 6ş46'22.7" W 56ş40'27.5"
Distance from Crepurizinho: 12.1 km (in a direct line)
Distance from Edílson: 0.2 km (in a direct line).
Activities: a pair of machines and 5 people.
The team has worked since January 2003.
Francisco das Chagas work front
Localisation: S 6ş46'24.7" W 56ş40'24.0"
Distance from Crepurizinho: 12.0 km (in a direct line), 18 km by road
Distance from Luís Preto: 0.2 km (in a direct line).
Activities: one pair of machines, 4 people.
The team has worked since April 2003 in this area. The work front proprietor has worked in
mining since 1970, always at Tapajós areas. He was able to buy his own machinery in 1984.
He lives with the cook.
Noemia's work front
Localisation: S 6ş47'06.7" W 56ş39'24.2"
Distance from Crepurizinho: 10.9 km (in a direct line)
Distance from Chagas: 1.9 km (in a direct line).
Activities: one pair of machines, 3 people.
47
The work with secondary gold deposits started on February 2003, until then extraction was
carried out through shafts.
Vicente Alves dos Santos (Brabo) work front
Localisation: S 6ş47'06.7" W 56ş39'24.2"
Distance from Crepurizinho: 10.9 km (in a direct line)
Distance from Noemia: 0.1 km (in a direct line).
Activities: One pair of machines, 2 people
The work front proprietor's wife is also the cook. There are two children living with them.
Mining Worker's profile
At Mr. Luís Preto's mining site, chosen as the project main target area, 38 workers, 7 cooks
and 7 work front proprietor were working. In order to profile these people, 31 interviews with
workers (81% sampling) and 2 interviews with cooks were carried out.11.
Age and origin
The workers are 39.75 years old in average (median = 40) (Table 98) and most of them (67%)
declared themselves as being single. From the workers interviewed, 16 have children,
averaging 2.81 children per father. More than half of the interviewed were born in Maranhăo.
Less than 20% of the workforce was born in Para. At the time they started working with
mining, about 90% of the workers lived either in Pará (41.9%) or in Maranhăo (48.4%).
Levels of formal education are very low, 20% declared never to have studied. The others have
gone to school for 3.2 years in average. Only 3 from the 31 people interviewed completed 8
grades of elementary school.
11 From the seven cooks, three were partners of the work front owners, thus being better categorised as family
labor, differently from the other four cooks.
48
Graph 14: Crepurizinho Mining Workers. Distribution by age group
more than 61
3,6%
51 to 60
3,6%
41 to 50
39,3%
31 to 40
35,7%
21 to 30
14,3%
18 to 20
3,6%
0,0%
5,0%
10,0%
15,0%
20,0%
25,0%
30,0%
35,0%
40,0%
Length of stay at the Mining sites
Workers remain some 6.5 years in average at Crepurizinho. The main reasons they chose that
site was because it was suggested by friends, because of the good levels of gold production
and because they had already met the work front proprietor. (Table 101).
Most of the workers live at the site, usually in the baixăo with work mates. Only 13%
declared to reside at the village, and 22.6% said they lived in town (almost all of them in
Itaituba).
Only 20% of workers have been visited at the site by relatives, usually brothers or sisters.
Half of these cases, these visits happened over 5 years ago.
Workers stay at the mining site for 3 years in average before they go to an urban centre. For
70% of the people Itaituba is the main reference.
One third of workers have sent money/gold to someone outside the sites this year, usually to
their families or parents.
49
Graph 15: Crepurizinho Mining Workers. Length of stay at Crepurizinho
20 to 24 years
3,3%
15 to 19 years
16,7%
10 to 14 years
10,0%
5 to 9 years
16,7%
3 to 4 years
13,3%
1 to 2 years
13,3%
< 1 year
26,7%
0,0%
5,0%
10,0%
15,0%
20,0%
25,0%
30,0%
Work experience in mining
Crepurizinho workers have worked with gold mining for 18.5 years in average (Table 103).
All of them have work experience at other sites.
Before starting to work at mining, half of them worked in agriculture 19.4% in their own
land and 25.8% in someone else's. A significant portion of them were wage labourers before
working with mining, in average they earned 1.8 minimum wages (USD144). From those who
worked in something else, 80% has never worked again with this other activity.
Work Regimen and earnings
Workers still earn a percentage of their production. This percentage varies between 10%, for
those who work in a pair of machines with a three people team, and 2.25%, for those who
work in a 8 people team in the extraction of primary gold in shafts.
Individual earnings at Crepurizinho are more complex to be calculated than in Săo Chico, due
to discrepancies in individual percentages, and because some work fronts were paralysed or
were being testes. From the available data, it is possible to estimate an average of 5g of gold
per week, remembering that one third of people interviewed did not earn an income in the
previous month.
50
From this information, it is possible to estimate that 300 workers at Crepurizinho earned about
4.500 g of gold monthly12, which corresponds to a production of about 15 kg of gold per
month. This amount is lower than the estimate provided by the businessmen in the village.
This may be explained by the fact that Mr. Luis Preto's site, which served as reference for our
estimate, produces much less than the region's average production. On the other hand, a
mistaken estimate provided by local businessmen may not be discarded.
It is indeed the case that Crepurizinho production levels were better. This may be illustrated
by the fact that the most productive despescagens informed by the interviewed miners,
produced in average 1 kg of gold (median 400g), what corresponds to individual earnings of
about 100 and 22,5 g of gold.
The workers best earnings were in average 507 g of gold (median 280 g) for 2 to 4 weeks
work. Almost half of the workers who were interviewed (48.4%) has already worked for
himself at the mining sites. Two thirds have worked manually panning gold, and one third has
already been able to buy their own machinery.
Health
Approximately 38.7% of workers declared to have been sick in the last two months. Almost
all of them (83.3%) interrupted work due to illness. Around 75% from the people who fell ill
went looking for health care (doctor: 22.2%, Public Malaria Health Service 33.3%, pharmacy,
44.4%) and paid in average about R$160 (USD 53) for private treatment.
Around 20% have had a work accident, and 35% have witnessed fatal accidents.
From the 31 workers interviewed, only one declared never to have melted gold, and only two
did not agree to participate in a health evaluation.
Citizenship
Only 61.3% of the workers have personal identification documents. Most of them (58.1%)
have never had any contact with a government representative. From those who stated to have
contacts, usually this was in reference to SUCAM (84.6%).
Participation in democratic election by voting is very low. Even though Crepurizinho is a
voting post, only 25.8% voted at the last elections, which shows the lack of necessity to go to
another a town.
12 We presumed that 75% of workers earn 20 g of Au per month .
51
Points of view and perceptions
Asked about their opinion in relation to life at the mining site, the people interviewed were
unanimous in stating that they consider having a good relationship with other team members.
Two thirds think they are well respected as a person. About 29% think the income they earn is
low. Interestingly health and accommodation have also been considered good. Food was the
item that was less evaluated as being good13.
Graph 16: Crepurizinho Mining Workers. Considerations about life in the mining sites
Good
Regular
Bad
Relation with collegues
100,0%
0,0%
Respect
67,7%
29,0%
3,2%
Income
35,5%
35,5%
29,0%
Health
41,9%
45,2%
12,9%
Food
19,4%
77,4%
3,2%
Housing
35,5%
61,3%
3,2%
The positive evaluation of the item health is confirmed by the fact that only 35.5% of the
workers thought that their work was prejudicial to their health. According to the workers, the
main health risks related to mining were: malaria and working inside the water. Contact with
mercury was only mentioned once.
Asked about the hazards of mercury, three fourths of the workers said it is prejudicial. No
one, however, could explain in detail how it is dangerous (Table 105). Their knowledge about
this was limited to the identification of the smoke from gold burning as dangerous. Most of
them informed that their source of information was TV or radio (Table 106).
A little more than half of the workers (51.6%) think that mining is harmful to the
environment. The most mentioned damage was deforestation (Table 107).
13 At many interviews, the owners of the mining site were present, which may have led to a bias in the answers.
From this perspective, we can consider "fair" as a veiled reproval.
52
Albeit all the difficulties, most workers have not thought about leaving the mining site (Table
108).
53
Data Presentation
Săo Chico Village. Data.
Table 1: Săo Chico - Village. Type of property
Frequency
Percent
Valid Percent
Cumulative Percent
Valid
Wholly owned
34
77.3
77.3
77.3
Rented
3
6.8
6.8
84.1
Loaned
6
13.6
13.6
97.7
Public
1
2.3
2.3
100.0
Total
44
100.0
100.0
Table 2: Săo Chico - Village. Type of habitation
Frequency
Percent
Valid
Cumulative
Percent
Percent
Valid Wood
42
95.5
95.5
95.5
Wood / brick
1
2.3
2.3
97.7
Other
1
2.3
2.3
100.0
Total
44
100.0
100.0
Table 3: Săo Chico - Village. Type of roofing
Frequency Percent
Valid
Cumulative
Percent
Percent
Valid Zinc / Aluminum /
36
81.8
81.8
81.8
Asbestos
Straw
8
18.2
18.2
100.0
Total
44
100.0
100.0
Table 4: Săo Chico - Village. Type of floors
Frequency Percent
Valid
Cumulative
Percent
Percent
Valid
Wood
1
2.3
2.3
2.3
Earth
8
18.2
18.2
20.5
Cement
35
79.5
79.5
100.0
Total
44
100.0
100.0
Table 5: Săo Chico - Village. Location of toilet
Frequency
Percent
Valid Percent
Cumulative Percent
Valid
Inside the house
5
11.4
12.2
12.2
Outside the house
34
77.3
82.9
95.1
Inexistent
2
4.5
4.9
100.0
Total
41
93.2
100.0
54
Missing System
3
6.8
Total
44
100.0
55
Table 6: Săo Chico - Village. Sewage disposal
Frequency
Percent
Valid Percent
Cumulative Percent
Valid
Dry sewer
15
34.1
37.5
37.5
Open air sewage
20
45.5
50.0
87.5
Water stream
1
2.3
2.5
90.0
Others
4
9.1
10.0
100.0
Total
40
90.9
100.0
Missing System
4
9.1
Total
44
100.0
Table 7: Săo Chico - Village. Electric power source
Frequency
Percent
Valid Percent
Cumulative Percent
Valid
Wholly owner generator
20
45.5
46.5
46.5
Shared generator
20
45.5
46.5
93.0
Inexistent
3
6.8
7.0
100.0
Total
43
97.7
100.0
Missing System
1
2.3
Total
44
100.0
Table 8: Săo Chico - Village. Origin of water for domestic use
Frequency
Percent
Valid Percent
Cumulative Percent
Valid
Artesian well
1
2.3
2.3
2.3
Regular well
13
29.5
30.2
32.6
Pumping well
24
54.5
55.8
88.4
Other
5
11.4
11.6
100.0
Total
43
97.7
100.0
Missing System
1
2.3
Total
44
100.0
Table 9: Săo Chico - Village. Water storage
Frequency
Percent
Valid Percent
Cumulative Percent
Valid
Water reservoir
13
29.5
30.2
30.2
Bucket
5
11.4
11.6
41.9
Barrel
22
50.0
51.2
93.0
No water
3
6.8
7.0
100.0
Total
43
97.7
100.0
Missing System
1
2.3
Total
44
100.0
Table 10: Săo Chico - Village. Domestic garbage disposal (Multiple Choice)
Pct of Pct of
Category label Code Count Responses Cases
Burned 2 9 18.8 20.9
Buried 3 1 2.1 2.3
Open air disposal 5 36 75.0 83.7
Others 6 2 4.2 4.7
------- ----- -----
Total responses 48 100.0 111.6
1 missing cases; 43 valid cases
56
Table 11: Săo Chico Village. Vegetable Gardens
Frequency
Percent
Valid Percent
Cumulative Percent
Valid
Yes
14
31.8
32.6
32.6
No
29
65.9
67.4
100.0
Total
43
97.7
100.0
Missing System
1
2.3
Total
44
100.0
Table 12: Săo Chico Village. Domestic animals for consumption
Frequency
Percent
Valid Percent
Cumulative Percent
Valid
Yes
13
29.5
30.2
30.2
No
30
68.2
69.8
100.0
Total
43
97.7
100.0
Missing System
1
2.3
Total
44
100.0
57
Săo Chico Community. Population profile. Data
Table 13: Săo Chico - Community. Distribution of population by gender
Frequency
Percent
Valid Percent
Cumulative Percent
Valid
Male
81
60.4
60.4
60.4
Female
53
39.6
39.6
100.0
Total
134
100.0
100.0
Table 14: Săo Chico - Community. Length of residence at the village (years)
Frequency
Percent
Valid Percent
Cumulative Percent
Valid
0
10
7.5
7.5
7.5
1
10
7.5
7.5
14.9
2
10
7.5
7.5
22.4
3
10
7.5
7.5
29.9
4
10
7.5
7.5
37.3
5
6
4.5
4.5
41.8
6
9
6.7
6.7
48.5
7
5
3.7
3.7
52.2
8
8
6.0
6.0
58.2
9
2
1.5
1.5
59.7
10
7
5.2
5.2
64.9
11
4
3.0
3.0
67.9
12
10
7.5
7.5
75.4
13
5
3.7
3.7
79.1
14
6
4.5
4.5
83.6
15
6
4.5
4.5
88.1
16
2
1.5
1.5
89.6
17
5
3.7
3.7
93.3
18
1
.7
.7
94.0
19
1
.7
.7
94.8
20
3
2.2
2.2
97.0
22
1
.7
.7
97.8
23
2
1.5
1.5
99.3
29
1
.7
.7
100.0
Total
134
100.0
100.0
Table 15: Săo Chico - Community. State where villagers come from
Frequency
Percent
Valid Percent
Cumulative Percent
Valid
PA
47
35.1
35.1
35.1
MA
63
47.0
47.0
82.1
PI
6
4.5
4.5
86.6
CE
4
3.0
3.0
89.6
GO
3
2.2
2.2
91.8
PR
3
2.2
2.2
94.0
MG
2
1.5
1.5
95.5
MT
2
1.5
1.5
97.0
PB
1
.7
.7
97.8
RO
1
.7
.7
98.5
BA
1
.7
.7
99.3
PE
1
.7
.7
100.0
Total
134
100.0
100.0
Table 16: Săo Chico - Community Population distribution according to economic activity
Frequency
Percent
Valid Percent
Cumulative Percent
Valid
Yes
82
61.2
61.2
61.2
No
52
38.8
38.8
100.0
Total
134
100.0
100.0
58
Table 17: Săo Chico - Community Population distribution according to schooling
Frequency
Percent
Valid Percent
Cumulative Percent
Valid Did not study
11
8.2
8.2
8.2
Literate
4
3.0
3.0
11.2
First grade only
5
3.7
3.7
70.1
Elementary School Completed
16
11.9
11.9
23.1
Elementary School Not Completed
21
15.7
15.7
38.8
Junior High School Completed
10
7.5
7.5
46.3
Junior High School Not Completed
20
14.9
14.9
61.2
Sęnior High School Completed
6
4.5
4.5
65.7
Sęnior High School Not Completed
1
.7
.7
66.4
Pré School age
23
17.2
17.2
87.3
Out of school
1
.7
.7
88.1
Studies outside gold mine area
3
2.2
2.2
90.3
Not informed / Not known
13
9.7
9.7
100.0
Total
134
100.0
100.0
Table 18: Săo Chico - Community. Population distribution according to possession of personal
identification
Frequency
Percent
Valid Percent
Cumulative Percent
Valid
Yes
99
73.9
73.9
73.9
No
35
26.1
26.1
100.0
Total
134
100.0
100.0
Table 19 Săo Chico Community. Economic activity (population older than 15)
Frequency
Percent
Valid Percent
Cumulative Percent
Valid
Gold miner
26
32.1
40.6
40.6
Mining machine owner
4
4.9
6.3
46.9
Trader
13
16.0
20.3
67.2
Restaurant / Snack Bar
6
7.4
9.4
76.6
Farrmer
4
4.9
6.3
82.8
Laundry
1
1.2
1.6
84.4
Housekeeping maid
3
3.7
4.7
89.1
Local businessman
5
6.2
7.8
96.9
Mechanic
1
1.2
1.6
98.4
Health agent
1
1.2
1.6
100.0
Total
64
79.0
100.0
Missing
System
17
21.0
Total
81
100.0
59
Săo Chico Community. Dietary habits. Data
Table 20: Săo Chico - Community. Weekly consumption of rice.
Weekly consumption in days
Frequency
Percent
Valid Percent
Cumulative Percent
Valid
7
43
97.7
100.0
100.0
Missing
System
1
2.3
Total
44
100.0
Table 21: Săo Chico - Community. Weekly beef consumption
Weekly consumption in days
Frequency
Percent
Valid Percent
Cumulative Percent
Valid
2
2
4.5
4.7
4.7
3
3
6.8
7.0
11.6
5
2
4.5
4.7
16.3
6
1
2.3
2.3
18.6
7
35
79.5
81.4
100.0
Total
43
97.7
100.0
Missing
System
1
2.3
Total
44
100.0
Table 22: Săo Chico - Community. Weekly manioc flour consumption
Weekly consumption in days
Frequency
Percent
Valid Percent
Cumulative Percent
Valid
0
3
6.8
7.0
7.0
2
2
4.5
4.7
11.6
3
1
2.3
2.3
14.0
7
37
84.1
86.0
100.0
Total
43
97.7
100.0
Missing
System
1
2.3
Total
44
100.0
Table 23: Săo Chico - Community. Weekly beans consumption.
Weekly consumption in days
Frequency
Percent
Valid Percent
Cumulative Percent
Valid
0
4
9.1
9.3
9.3
1
4
9.1
9.3
18.6
2
3
6.8
7.0
25.6
3
2
4.5
4.7
30.2
5
1
2.3
2.3
32.6
6
2
4.5
4.7
37.2
7
27
61.4
62.8
100.0
Total
43
97.7
100.0
Missing
System
1
2.3
Total
44
100.0
Table 24: Săo Chico - Community. Weekly milk consumption.
Weekly consumption in days
Frequency
Percent
Valid Percent
Cumulative Percent
Valid
0
15
34.1
34.9
34.9
1
4
9.1
9.3
44.2
3
1
2.3
2.3
46.5
5
1
2.3
2.3
48.8
7
22
50.0
51.2
100.0
Total
43
97.7
100.0
Missing
System
1
2.3
Total
44
100.0
60
Table 25: Săo Chico - Community. Weekly vegetable consumption.
Weekly consumption in days
Frequency
Percent
Valid Percent
Cumulative Percent
Valid
0
5
11.4
11.6
11.6
1
15
34.1
34.9
46.5
2
7
15.9
16.3
62.8
3
4
9.1
9.3
72.1
4
3
6.8
7.0
79.1
5
2
4.5
4.7
83.7
6
1
2.3
2.3
86.0
7
6
13.6
14.0
100.0
Total
43
97.7
100.0
Missing
System
1
2.3
Total
44
100.0
Table 26: Săo Chico - Community Weekly fruit consumption.
Weekly consumption in days
Frequency
Percent
Valid Percent
Cumulative Percent
Valid
0
7
15.9
16.3
16.3
1
15
34.1
34.9
51.2
2
9
20.5
20.9
72.1
3
5
11.4
11.6
83.7
4
1
2.3
2.3
86.0
5
1
2.3
2.3
88.4
7
5
11.4
11.6
100.0
Total
43
97.7
100.0
Missing
System
1
2.3
Total
44
100.0
Table 27: Săo Chico - Community - Community. Weekly egg consumption.
Weekly consumption in days
Frequency
Percent
Valid Percent
Cumulative Percent
Valid
0
12
27.3
27.9
27.9
1
15
34.1
34.9
62.8
2
7
15.9
16.3
79.1
3
1
2.3
2.3
81.4
4
2
4.5
4.7
86.0
5
1
2.3
2.3
88.4
6
1
2.3
2.3
90.7
7
4
9.1
9.3
100.0
Total
43
97.7
100.0
Missing
System
1
2.3
Total
44
100.0
Table 28: Săo Chico - Community- Community. Weekly pasta consumption
Weekly consumption in days
Frequency
Percent
Valid Percent
Cumulative Percent
Valid
0
10
22.7
23.3
23.3
1
14
31.8
32.6
55.8
2
12
27.3
27.9
83.7
3
4
9.1
9.3
93.0
6
1
2.3
2.3
95.3
7
2
4.5
4.7
100.0
Total
43
97.7
100.0
Missing
System
1
2.3
Total
44
100.0
61
Table 29: Săo Chico - Community - Community Weekly chicken consumption.
Weekly consumption in days
Frequency
Percent
Valid Percent
Cumulative Percent
Valid
0
11
25.0
25.6
25.6
1
12
27.3
27.9
53.5
2
13
29.5
30.2
83.7
3
6
13.6
14.0
97.7
7
1
2.3
2.3
100.0
Total
43
97.7
100.0
Missing System
1
2.3
Total
44
100.0
Table 30: Săo Chico - Community. Weekly fish consumption
Weekly consumption in days
Frequency
Percent
Valid Percent
Cumulative Percent
Valid
0
8
18.2
18.6
18.6
1
17
38.6
39.5
58.1
2
15
34.1
34.9
93.0
3
1
2.3
2.3
95.3
4
1
2.3
2.3
97.7
7
1
2.3
2.3
100.0
Total
43
97.7
100.0
Missing System
1
2.3
Total
44
100.0
62
Săo Chico Mining Worker's Profile. Data
Table 31: Săo Chico Mining Workers. Age of interviewees.
Age
Frequency
Percent
Valid Percent
Cumulative Percent
Valid
17
1
3.1
3.2
3.2
18
1
3.1
3.2
6.5
24
1
3.1
3.2
9.7
26
1
3.1
3.2
12.9
32
1
3.1
3.2
16.1
33
1
3.1
3.2
19.4
34
2
6.3
6.5
25.8
35
2
6.3
6.5
32.3
36
2
6.3
6.5
38.7
38
2
6.3
6.5
45.2
39
1
3.1
3.2
48.4
40
1
3.1
3.2
51.6
42
2
6.3
6.5
58.1
43
2
6.3
6.5
64.5
46
3
9.4
9.7
74.2
47
1
3.1
3.2
77.4
48
1
3.1
3.2
80.6
49
2
6.3
6.5
87.1
52
1
3.1
3.2
90.3
59
1
3.1
3.2
93.5
61
1
3.1
3.2
96.8
65
1
3.1
3.2
100.0
Total
31
96.9
100.0
Missing System
1
3.1
Total
32
100.0
Table 32: Săo Chico Mining Workers. Civil Status.
Frequency
Percent
Valid Percent
Cumulative Percent
Valid
Single
15
46.9
46.9
46.9
Married
6
18.8
18.8
65.6
Separated
4
12.5
12.5
78.1
Living with
7
21.9
21.9
100.0
Total
32
100.0
100.0
Table 33: Săo Chico Mining workers. Paternity.
Children?
Frequency
Percent
Valid Percent
Cumulative Percent
Valid
Yes
22
68.8
75.9
75.9
No
7
21.9
24.1
100.0
Total
29
90.6
100.0
Missing System
3
9.4
Total
32
100.0
Table 34: Săo Chico Mining workers. Education.
Has studied?
Frequency
Percent
Valid Percent
Cumulative Percent
Valid
Yes
14
43.8
45.2
45.2
No
17
53.1
54.8
100.0
Total
31
96.9
100.0
Missing System
1
3.1
Total
32
100.0
63
Table 35: Săo Chico Mining workers. Formal Education.
Frequency Percent
Valid Percent
Cumulative Percent
Valid
Only literate
1
3.1
7.1
7.1
Junior High School Not Completed
9
28.1
64.3
71.4
Senior High School Not Completed
4
12.5
28.6
100.0
Total
14
43.8
100.0
Missing System
18
56.3
Total
32
100.0
Table 36: Săo Chico Mining workers. Personal identification documents
Frequency
Percent
Valid Percent
Cumulative Percent
Valid
Yes
26
81.3
81.3
81.3
No
6
18.8
18.8
100.0
Total
32
100.0
100.0
Table 37: Săo Chico Mining workers
Frequency
Percent
Valid Percent
Cumulative Percent
Valid
PA
7
21.9
22.6
22.6
MA
22
68.8
71.0
93.5
CE
2
6.3
6.5
100.0
Total
31
96.9
100.0
Missing System
1
3.1
Total
32
100.0
Table 38: Săo Chico Mining workers. Town where lives when started working at the sites
Frequency
Percent
Valid Percent
Cumulative Percent
Valid
PA
9
28.1
28.1
28.1
MA
21
65.6
65.6
93.8
MT
2
6.3
6.3
100.0
Total
32
100.0
100.0
Table 39: Săo Chico Mining workers. Economic activity before starting work in mining
Frequency
Percent
Valid Percent
Cumulative Percent
Valid
Wholly owned farm
6
18.8
18.8
18.8
Rented farm
10
31.3
31.3
50.0
Trader / Self -employed
3
9.4
9.4
59.4
Gold mining as first job
2
6.3
6.3
65.6
Worker
11
34.4
34.4
100.0
Total
32
100.0
100.0
Table 40: Săo Chico Mining workers. Declared earnings in previous activities (in SM= USD80)
Frequency
Percent
Valid Percent
Cumulative Percent
Valid
.5
2
6.3
20.0
20.0
1.0
4
12.5
40.0
60.0
1.5
1
3.1
10.0
70.0
2.0
2
6.3
20.0
90.0
3.0
1
3.1
10.0
100.0
Total
10
31.3
100.0
Missing System
22
68.8
Total
32
100.0
64
Table 41: Săo Chico Mining workers. Subsistence agriculture before mining
Frequency
Percent
Valid Percent
Cumulative Percent
Valid
Yes
14
43.8
93.3
93.3
No
1
3.1
6.7
100.0
Total
15
46.9
100.0
Missing
System
17
53.1
Total
32
100.0
Table 42: Săo Chico- Mining workers. Return to previous economic activity
Return
Frequency
Percent
Valid Percent
Cumulative Percent
Valid
Yes. not regular
2
6.3
6.9
6.9
No
27
84.4
93.1
100.0
Total
29
90.6
100.0
Missing
System
3
9.4
Total
32
100.0
Table 43: Săo Chico Mining workers. Length of stay in the sites (in years)
Years of continuous stay
Frequency
Percent
Valid Percent
Cumulative Percent
Valid
.8
1
3.1
3.2
3.2
.9
1
3.1
3.2
6.5
1.0
2
6.3
6.5
12.9
2.0
8
25.0
25.8
38.7
3.0
6
18.8
19.4
58.1
4.0
2
6.3
6.5
64.5
5.0
1
3.1
3.2
67.7
6.0
4
12.5
12.9
80.6
8.0
2
6.3
6.5
87.1
9.0
1
3.1
3.2
90.3
10.0
1
3.1
3.2
93.5
13.0
1
3.1
3.2
96.8
15.0
1
3.1
3.2
100.0
Total
31
96.9
100.0
Missing
System
1
3.1
Total
32
100.0
Table 44: Săo Chico Mining workers. Last town visited.
City
Frequency
Percent
Valid Percent
Cumulative Percent
Valid
Alta Floresta-MT
2
6.3
6.3
6.3
Caxias-MA
1
3.1
3.1
9.4
Itaituba-PA
20
62.5
62.5
71.9
Not informed
5
15.6
15.6
87.5
Novo Progresso-PA
2
6.3
6.3
93.8
Peixoto-MT
1
3.1
3.1
96.9
Rurópolis-PA
1
3.1
3.1
100.0
Total
32
100.0
100.0
Table 45: Săo Chico Mining workers. Money order to areas outside the mining sites.
Frequency
Percent
Valid Percent
Cumulative Percent
Valid
Yes
14
43.8
43.8
43.8
No
18
56.3
56.3
100.0
Total
32
100.0
100.0
65
Table 46: Săo Chico Mining workers. Money orders receivers
Addressee
Frequency
Percent
Valid Percent Cumulative Percent
Valid
Family (wife / children)
9
28.1
64.3
64.3
Parents
3
9.4
21.4
85.7
Brother/Sister
2
6.3
14.3
100.0
Total
14
43.8
100.0
Missing
System
18
56.3
Total
32
100.0
Table 47: Săo Chico Mining workers. Last gold earnings (g per despescagem)
Valor Pct of Pct of
Category label [em g] Count Responses Cases
-------------------------------------------------
2 2 3.6 6.7
3 3 5.5 10.0
4 10 18.2 33.3
5 7 12.7 23.3
6 4 7.3 13.3
7 5 9.1 16.7
8 3 5.5 10.0
9 5 9.1 16.7
10 4 7.3 13.3
12 3 5.5 10.0
13 1 1.8 3.3
15 2 3.6 6.7
16 1 1.8 3.3
18 1 1.8 3.3
19 1 1.8 3.3
24 1 1.8 3.3
28 2 3.6 6.7
------- ----- -----
Total responses 55 100.0 183.3
2 missing cases; 30 valid cases
Table 48: Săo Chico Mining workers. Experience with independent mining activities
Frequency
Percent
Valid Percent Cumulative Percent
Valid
Yes
14
43.8
43.8
43.8
No
18
56.3
56.3
100.0
Total
32
100.0
100.0
Table 49: Săo Chico Mining workers. Type of independent mining activity.
Frequency
Percent
Valid Percent
Cumulative
Percent
Valid
Manual
7
21.9
50.0
50.0
With machine
7
21.9
50.0
100.0
Total
14
43.8
100.0
Missing System
18
56.3
Total
32
100.0
Table 50: Săo Chico Mining workers. Illnesses in the last two months
Frequency
Percent
Valid Percent
Cumulative
Percent
Valid
Yes
13
40.6
40.6
40.6
No
19
59.4
59.4
100.0
Total
32
100.0
100.0
66
Table 51: Săo Chico Mining workers. Work interruption in the last two months.
Frequency
Percent
Valid Percent
Cumulative
Percent
Valid
Yes
9
28.1
69.2
69.2
No
4
12.5
30.8
100.0
Total
13
40.6
100.0
Missing System
19
59.4
Total
32
100.0
Table 52: Săo Chico Mining workers. Search for health care when ill.
Frequency
Percent
Valid Percent
Cumulative
Percent
Valid
Yes
8
25.0
61.5
61.5
No
5
15.6
38.5
100.0
Total
13
40.6
100.0
Missing System
19
59.4
Total
32
100.0
Table 53: Săo Chico Mining workers. Work accidents
Frequency
Percent
Valid Percent
Cumulative
Percent
Valid
Yes
11
34.4
34.4
34.4
No
21
65.6
65.6
100.0
Total
32
100.0
100.0
Table 54: Săo Chico Mining Workers . Fatal work accidents witnessed
Frequency
Percent
Valid Percent
Cumulative
Percent
Valid
Yes
12
37.5
38.7
38.7
No
19
59.4
61.3
100.0
Total
31
96.9
100.0
Missing System
1
3.1
Total
32
100.0
Table 55: Săo Chico Mining workers. Gold burning / roasting.
roast or has roasted gold
Frequency
Percent
Valid Percent
Cumulative
Percent
Valid
Yes
25
78.1
78.1
78.1
No
7
21.9
21.9
100.0
Total
32
100.0
100.0
Table 56: Săo Chico Mining workers. Health evaluation availability.
Frequency
Percent
Valid Percent
Cumulative Percent
Valid
Yes
31
96.9
96.9
96.9
No answer
1
3.1
3.1
100.0
Total
32
100.0
100.0
Table 57: Săo Chico Mining workers. TV use.
Frequency
Percent
Valid Percent
Cumulative
Percent
Valid
Globo Sat
31
96.9
100.0
100.0
Missing System
1
3.1
Total
32
100.0
67
68
Table 58: Săo Chico Mining workers. Radio use.
Frequency
Percent
Valid Percent
Cumulative Percent
Valid
Do not listen to the radio daily
4
12.5
18.2
18.2
Rádio Nacional
18
56.3
81.8
100.0
Total
22
68.8
100.0
Missing System
10
31.3
Total
32
100.0
Table 59: Săo Chico Mining workers. Participation in general elections.
Has voted for Mayor?
Frequency
Percent
Valid Percent
Cumulative
Percent
Valid
Yes
9
28.1
28.1
28.1
No
23
71.9
71.9
100.0
Total
32
100.0
100.0
Table 60: Săo Chico Mining workers. Participation in state elections.
Has voted for Governor?
Frequency
Percent
Valid Percent
Cumulative Percent
Valid
Yes
8
25.0
25.0
25.0
No
24
75.0
75.0
100.0
Total
32
100.0
100.0
Table 61: Săo Chico Mining workers . Participation in presidential elections.
Has voted for President?
Frequency
Percent
Valid Percent
Cumulative
Percent
Valid
Yes
8
25.0
25.0
25.0
No
24
75.0
75.0
100.0
Total
32
100.0
100.0
Table 62: Săo Chico Mining workers. Contact with violence inside the site.
Frequency
Percent
Valid Percent
Cumulative
Percent
Valid Yes
18
56.3
56.3
57.6
No
14
43.8
43.8
100.0
Total
32
100.0
100.0
Table 63: Săo Chico Mining workers. Witness of violent situations with death
Has someone been killed?
Frequency
Percent
Valid Percent
Cumulative
Percent
Valid
Yes
12
37.5
66.7
66.7
No
6
18.8
33.3
100.0
Total
18
56.3
100.0
Missing System
14
43.8
Total
32
100.0
69
Crepurizinho Village. Data
Table 64: Crepurizinho - Village. Residence type of property.
Frequency
Percent
Valid Percent
Cumulative Percent
Valid
Owned
100
62.1
62.1
62.1
Rented
18
11.2
11.2
73.3
Loaned
43
26.7
26.7
100.0
Total
161
100.0
100.0
Table 65: Crepurizinho - Village. Types of use of inhabited houses.
Frequency
Percent
Valid Percent
Cumulative
Percent
Valid
Residence
120
74.5
74.5
74.5
Mixed
41
25.5
25.5
100.0
Total
161
100.0
100.0
Table 66: Crepurizinho - Village. Type of residence.
Frequency
Percent
Valid Percent
Cumulative
Percent
Valid
Wood
158
98.1
98.1
98.1
Brick
2
1.2
1.2
99.4
Wood / Brick
1
.6
.6
100.0
Total
161
100.0
100.0
Table 67: Crepurizinho - Village. Type of roof in residences.
Frequency
Percent
Valid Percent
Cumulative Percent
Valid
Tiles
15
9.3
9.3
9.3
Aluminum / asbestos
145
90.1
90.1
99.4
Wood
1
.6
.6
100.0
Total
161
100.0
100.0
Table 68: Crepurizinho - Village Type of floors in inhabited houses.
Frequency
Percent
Valid Percent
Cumulative Percent
Valid
Wood
9
5.6
5.6
5.6
earth
14
8.7
8.7
14.3
Cement
136
84.5
84.5
98.8
Ceramic
2
1.2
1.2
100.0
Total
161
100.0
100.0
Table 69: Crepurizinho - Village. Toilet location.
Frequency
Percent
Valid Percent
Cumulative Percent
Valid
Inside the house
66
41.0
41.3
41.3
Outside the house
94
58.4
58.8
100.0
Total
160
99.4
100.0
Missing System
1
.6
Total
161
100.0
70
Table 70: Crepurizinho - Village. Domestic sewage disposal.
Frequency
Percent
Valid Percent
Cumulative Percent
Valid
Dry sewer
86
53.4
53.8
53.8
Open air sewage
74
46.0
46.3
100.0
Total
160
99.4
100.0
Missing System
1
.6
Total
161
100.0
Table 71: Crepurizinho - Village. Electric power availability
Frequency
Percent
Valid Percent
Cumulative Percent
Valid
Own generator
39
24.2
24.2
24.2
Delivered by neighbor with paying
73
45.3
45.3
69.6
Delivered by neigbor without paying
16
9.9
9.9
79.5
Inexistent
33
20.5
20.5
100.0
Total
161
100.0
100.0
Table 72: Crepurizinho - Village. Origin of the water for domestic use
Frequency Percent
Valid Percent
Cumulative Percent
Valid
Artesian well
1
.6
.6
.6
Well with electric bomb
68
42.2
42.5
43.1
Open well
41
25.5
25.6
68.8
Supplied by neighbor
44
27.3
27.5
96.3
Others
4
2.5
2.5
98.8
Inexistent
2
1.2
1.3
100.0
Total
160
99.4
100.0
Missing System
1
.6
Total
161
100.0
Table 73: Crepurizinho - Village. Water storage
Frequency Percent
Valid Percent
Cumulative Percent
Valid
Water reservoir
48
29.8
30.2
30.2
Barrel
76
47.2
47.8
78.0
Bucket
33
20.5
20.8
98.7
others
2
1.2
1.3
100.0
Total
159
98.8
100.0
Missing System
2
1.2
Total
161
100.0
Table 74: Crepurizinho - Village. Type of Water treatment.
Frequency Percent
Valid Percent
Cumulative Percent
Valid
No treatment
24
14.9
15.1
15.1
Hipochlorite
90
55.9
56.6
71.7
Boiling
8
5.0
5.0
76.7
Filter
32
19.9
20.1
96.9
Other
5
3.1
3.1
100.0
Total
159
98.8
100.0
Missing System
2
1.2
Total
161
100.0
71
Table 75: Crepurizinho Village. Garbage disposal.
Frequency
Percent
Valid Percent Cumulative Percent
Valid
burnt
102
63.35
63.75
63.75
Disposed at own land
8
4.97
5.00
68.75
Disposed at someone else's land
42
26.09
26.25
95.00
Buried at own land
3
1.86
1.88
96.88
Buried at someone else's land
5
3.11
3.13
100.00
Total
160
99.38
100.00
Missing System
1
0.62
Total
161
100.00
Table 76: Crepurizinho - Village. Existence of yards in inhabited houses.
Frequency
Percent
Valid Percent
Cumulative Percent
Valid
Yes
134
83.2
83.2
83.2
No
27
16.8
16.8
100.0
Total
161
100.0
100.0
Table 77: Crepurizinho - Village. Vegetable gardens at inhabited houses.
Frequency
Percent
Valid Percent
Cumulative
Percent
Valid
Yes
34
21.1
21.1
21.1
No
127
78.9
78.9
100.0
Total
161
100.0
100.0
Table 78: Crepurizinho - Village. Domestic animals.
Frequency
Percent
Valid Percent
Cumulative
Percent
Valid
Yes
104
64.6
64.6
64.6
No
57
35.4
35.4
100.0
Total
161
100.0
100.0
Table 79: Crepurizinho - Village. Animals for consumption.
Frequency
Percent
Valid Percent
Cumulative
Percent
Valid
Yes
42
26.1
26.4
26.4
No
117
72.7
73.6
100.0
Total
159
98.8
100.0
Missing System
2
1.2
Total
161
100.0
Table 80: Crepurizinho - Village Agriculture
Frequency
Percent
Valid Percent
Cumulative
Percent
Valid
Yes
33
20.5
20.5
20.5
No
128
79.5
79.5
100.0
Total
161
100.0
100.0
Table 81: Crepurizinho - Village Destination of agricultural produce
Frequency
Percent
Valid Percent
Cumulative
Percent
Valid
Subsistence
24
14.9
72.7
72.7
Consumption and sale
9
5.6
27.3
100.0
72
Total
33
20.5
100.0
Missing
System
128
79.5
Total
161
100.0
73
Crepurizinho Community. Population profile. Data
Table 82: Crepurizinho - Community. Distribution by gender
Frequency
Percent
Valid Percent
Cumulative
Percent
Valid
Male
274
49.5
49.5
49.5
female
279
50.5
50.5
100.0
Total
553
100.0
100.0
Table 83: Crepurizinho - Community. Personal identification documents
Frequency
Percent
Valid Percent
Cumulative Percent
Valid
Yes
473
85.5
85.8
85.8
No
78
14.1
14.2
100.0
Total
551
99.6
100.0
Missing
System
2
.4
Total
553
100.0
Table 84: Crepurizinho Community. Employment and gender.
Working
Yes
No
Gender
Male
72.7%
13.3%
Female
27.3%
86.7%
Total
100.0%
100.0%
Table 85: Crepurizinho Community. Gender and employment.
Working
Total
Yes
No
Gender
Male
91.4%
8.6%
100%
Female
38.0%
62.0%
100%
74
Crepurizinho Community. Dietary habits. Data
Table 86: Crepurizinho - Community. Weekly consumption of fish
Frequency
Percent
Valid Percent
Cumulative Percent
Valid
0
3
1.9
1.9
1.9
1
2
1.2
1.2
3.1
2
21
13.0
13.0
16.1
3
46
28.6
28.6
44.7
4
16
9.9
9.9
54.7
5
21
13.0
13.0
67.7
6
7
4.3
4.3
72.0
7
45
28.0
28.0
100.0
Total
161
100.0
100.0
Table 87: Crepurizinho Community. Weekly consumption of frozen fish
Frequency
Percent
Valid Percent
Cumulative Percent
Valid
0
33
20.5
20.5
20.5
1
53
32.9
32.9
53.4
2
42
26.1
26.1
79.5
3
26
16.1
16.1
95.7
4
3
1.9
1.9
97.5
5
2
1.2
1.2
98.8
6
2
1.2
1.2
100.0
Total
161
100.0
100.0
Table 88: Crepurizinho Community. Weekly consumption of chicken.
Frequency
Percent
Valid Percent
Cumulative Percent
Valid
0
26
16.1
16.1
16.1
1
45
28.0
28.0
44.1
2
42
26.1
26.1
70.2
3
26
16.1
16.1
86.3
4
8
5.0
5.0
91.3
5
9
5.6
5.6
96.9
6
2
1.2
1.2
98.1
7
3
1.9
1.9
100.0
Total
161
100.0
100.0
Table 89: Crepurizinho - Community. Weekly consumption of egg.
Frequency
Percent
Valid Percent
Cumulative Percent
Valid
0
43
26.7
26.7
26.7
1
38
23.6
23.6
50.3
2
30
18.6
18.6
68.9
3
20
12.4
12.4
81.4
4
9
5.6
5.6
87.0
5
6
3.7
3.7
90.7
6
1
.6
.6
91.3
7
14
8.7
8.7
100.0
Total
161
100.0
100.0
Table 90: Crepurizinho Community. Weekly consumption of rice
Frequency
Percent
Valid Percent
Cumulative Percent
Valid
2
1
.6
.6
.6
5
1
.6
.6
1.2
6
1
.6
.6
1.9
7
158
98.1
98.1
100.0
Total
161
100.0
100.0
75
Table 91: Crepurizinho Community. Weekly consumption of pasta
Frequency
Percent
Valid Percent
Cumulative Percent
Valid
0
42
26.1
26.1
26.1
1
36
22.4
22.4
48.4
2
35
21.7
21.7
70.2
3
21
13.0
13.0
83.2
4
4
2.5
2.5
85.7
5
1
.6
.6
86.3
6
3
1.9
1.9
88.2
7
19
11.8
11.8
100.0
Total
161
100.0
100.0
Table 92: Crepurizinho - Community. Weekly consumption of beans
Frequency
Percent
Valid Percent
Cumulative Percent
Valid
0
10
6.2
6.2
6.2
1
8
5.0
5.0
11.2
2
10
6.2
6.2
17.4
3
14
8.7
8.7
26.1
4
4
2.5
2.5
28.6
5
9
5.6
5.6
34.2
6
6
3.7
3.7
37.9
7
100
62.1
62.1
100.0
Total
161
100.0
100.0
Table 93: Crepurizinho Community. Weekly consumption of milk
Frequency
Percent
Valid Percent
Cumulative Percent
Valid
0
19
11.8
11.8
11.8
1
5
3.1
3.1
14.9
2
4
2.5
2.5
17.4
3
8
5.0
5.0
22.4
4
2
1.2
1.2
23.6
5
9
5.6
5.6
29.2
7
114
70.8
70.8
100.0
Total
161
100.0
100.0
Table 94: Crepurizinho - Community. Weekly consumption of vegetables
Frequency
Percent
Valid Percent
Cumulative Percent
Valid
0
31
19.3
19.3
19.3
1
22
13.7
13.7
32.9
2
15
9.3
9.3
42.2
3
19
11.8
11.8
54.0
4
12
7.5
7.5
61.5
5
6
3.7
3.7
65.2
6
7
4.3
4.3
69.6
7
49
30.4
30.4
100.0
Total
161
100.0
100.0
Table 95: Crepurizinho - Community. Weekly consumption of fruits
Frequency
Percent
Valid Percent
Cumulative Percent
Valid
0
58
36.0
36.0
36.0
1
29
18.0
18.0
54.0
2
20
12.4
12.4
66.5
3
24
14.9
14.9
81.4
4
7
4.3
4.3
85.7
5
4
2.5
2.5
88.2
6
4
2.5
2.5
90.7
7
15
9.3
9.3
100.0
Total
161
100.0
100.0
76
Table 96: Crepurizinho - Community. Weekly consumption of manioc flour
Frequency
Percent
Valid Percent
Cumulative Percent
Valid
0
28
17.4
17.4
17.4
1
2
1.2
1.2
18.6
2
6
3.7
3.7
22.4
3
4
2.5
2.5
24.8
4
2
1.2
1.2
26.1
5
2
1.2
1.2
27.3
7
117
72.7
72.7
100.0
Total
161
100.0
100.0
Table 97: Crepurizinho - Community. Weekly consumption of manioc
Frequency
Percent
Valid Percent
Cumulative Percent
Valid
0
85
52.8
52.8
52.8
1
29
18.0
18.0
70.8
2
24
14.9
14.9
85.7
3
7
4.3
4.3
90.1
4
3
1.9
1.9
91.9
5
5
3.1
3.1
95.0
6
3
1.9
1.9
96.9
7
5
3.1
3.1
100.0
Total
161
100.0
100.0
Crepurizinho Mining Worker's Profile. Data
Table 98: Crepurizinho Mining workers. Age
Frequency
Percent
Valid Percent
Cumulative Percent
Valid
20
1
3.2
3.6
3.6
24
1
3.2
3.6
7.1
29
2
6.5
7.1
14.3
30
1
3.2
3.6
17.9
32
1
3.2
3.6
21.4
33
1
3.2
3.6
25.0
35
1
3.2
3.6
28.6
36
2
6.5
7.1
35.7
37
1
3.2
3.6
39.3
38
1
3.2
3.6
42.9
40
3
9.7
10.7
53.6
42
3
9.7
10.7
64.3
43
3
9.7
10.7
75.0
46
1
3.2
3.6
78.6
47
1
3.2
3.6
82.1
48
2
6.5
7.1
89.3
50
1
3.2
3.6
92.9
58
1
3.2
3.6
96.4
62
1
3.2
3.6
100.0
Total
28
90.3
100.0
Missing
System
3
9.7
Total
31
100.0
Table 99: Crepurizinho Mining workers. Civil Status.
Frequency
Percent
Valid Percent
Cumulative Percent
Valid
Single
21
67.7
67.7
67.7
Married
4
12.9
12.9
80.6
Separated
3
9.7
9.7
90.3
Living with a partner
3
9.7
9.7
100.0
Total
31
100.0
100.0
77
Table 100: Crepurizinho Mining workers. State of birth.
Frequency
Percent
Valid Percent
Cumulative Percent
Valid
PA
6
19.4
19.4
19.4
MA
17
54.8
54.8
74.2
PI
4
12.9
12.9
87.1
CE
1
3.2
3.2
90.3
BA
1
3.2
3.2
93.5
RO
1
3.2
3.2
96.8
TO
1
3.2
3.2
100.0
Total
31
100.0
100.0
Table 101: Crepurizinho Mining workers. Reason for choosing this site.
Frequency
Percent
Valid Percent
Cumulative Percent
Valid
High gold production
6
19.4
19.4
19.4
Knew the owner
5
16.1
16.1
35.5
Friends suggested
14
45.2
45.2
80.6
peaceful site
1
3.2
3.2
83.9
Other reasons
5
16.1
16.1
100.0
Total
31
100.0
100.0
Table 102: Crepurizinho Mining workers Place of residence.
Frequency
Percent
Valid Percent
Cumulative Percent
Valid City
7
22.6
22.6
22.6
Mining site
20
64.5
64.5
87.1
Crepurizinho / village
4
12.9
12.9
100.0
Total
31
100.0
100.0
Table 103: Crepurizinho Mining workers. Year that began working with gold mining
Frequency
Percent
Valid Percent
Cumulative Percent
Valid
1971
1
3.2
3.2
3.2
1972
1
3.2
3.2
6.5
1973
1
3.2
3.2
9.7
1979
1
3.2
3.2
12.9
1980
1
3.2
3.2
16.1
1981
3
9.7
9.7
25.8
1982
3
9.7
9.7
35.5
1983
4
12.9
12.9
48.4
1984
2
6.5
6.5
54.8
1985
2
6.5
6.5
61.3
1986
4
12.9
17.9
74.2
1987
1
3.2
3.2
77.4
1988
1
3.2
3.2
80.6
1989
1
3.2
3.2
83.9
1990
2
6.5
6.5
90.3
1998
2
6.5
6.5
96.8
2002
1
3.2
3.2
100.0
Total
31
100.0
100.0
Table 104: Crepurizinho Mining workers. Previous economic activity.
Frequency
Percent
Valid Percent
Cumulative Percent
Valid Agriculture on own land
6
19.4
19.4
19.4
Agriculture on alien land
8
25.8
25.8
45.2
Trader / Self-employed
10
32.3
32.3
77.4
Clerk
1
3.2
3.2
80.6
Unemployed
1
3.2
3.2
83.9
Others
5
16.1
16.1
100.0
Total
31
100.0
100.0
78
Table 105: Crepurizinho Mining workers How is mercury harmful to health?
Vapor
37.5%
Blood contamination
16.7%
Does not know
16.7%
Pollution
12.5%
Contamination
4.2%
Water Contamination
4.2%
Blood illness
4.2%
Evaporation
4.2%
Table 106: Crepurizinho Mining workers. Sources of information on mercury.
Frequency
Percent
Valid Percent
Cumulative Percent
Valid
Friends
5
16.1
21.7
21.7
TV / Radio
15
48.4
65.2
87.0
Mining site owner
2
6.5
8.7
95.7
Other source
1
3.2
4.3
100.0
Total
23
74.2
100.0
Missing
System
8
25.8
Total
31
100.0
Table 107: Crepurizinho Mining workers. How does gold mining harm the environment?
Deforestation
33.3%
Mercury contamination
13.3%
Deforestation and pollution
13.3%
Pollution
13.3%
River
6.7%
Deforestation/Sanding
6.7%
Devastation
6.7%
Death and illness
6.7%
Table 108: Crepurizinho Mining workers. Predicted length of say in the sites
half year
2
6.9%
1 year
4
13.8%
2 years
3
10.3%
4 years
1
3.4%
5 years
1
3.4%
10 years
1
3.4%
It depends
1
3.4%
As little as possible
1
3.4%
Not long
2
6.9%
Not predicted
13
44.8%
79