Centro de Tecnologia Mineral
Ministério da Cięncia e Tecnologia
Coordenaçăo de Desenvolvimento Sustentável
ENVIRONMENTAL AND HEALTH ASSESSMENT IN TWO
SMALL-SCALE GOLD MINING AREAS BRAZIL
SĂO CHICO AND CREPORIZINHO
FINAL REPORT
Saulo Rodrigues Pereira Filho
Project Leader
Zuleica Carmen Castilhos
Ronaldo Luiz Correa dos Santos
Allegra Viviane Yallouz
Flavia M. F. Nascimento
Silvia Gonçalves Egler
Bernhard Peregovich
Roosevelt Almeida Ribeiro
Débora Maia Pereira
Luiz Roberto Pedroso
CETEM
Luiz César Pereira da Silva
UFF
Elizabeth C. O. Santos
Edílson Brabo
Marcelo O. Lima
Kleber F. Faial
IEC
Prof. German Müller
University of Heidelberg, Germany
RT2004-004-02 Final Technical Report to UNIDO - RESERVED
April 2004
BRAZILIAN MINISTRY OF SCIENCE AND TECHNOLOGY
CENTRE FOR MINERAL TECHNOLOGY CETEM
ENVIRONMENTAL AND HEALTH ASSESSMENT IN TWO
SMALL-SCALE GOLD MINING AREAS BRAZIL
FINAL REPORT
SĂO CHICO AND CREPORIZINHO
Hg
Center for Mineral Technology
Ref.: Report Requested by UNIDO, United Nations Industrial Development Organization,
No. P. 2003/007 EG/GLO/01/G34 Removal of Barriers to the Introduction of Cleaner
Artisanal Gold Mining and Extraction Technologies
April 2004
Project Staff
CETEM Centro de Tecnologia Mineral
Saulo Rodrigues Pereira Filho
Project Leader
Zuleica Carmen Castilhos
Ronaldo Luiz Correa dos Santos
Allegra Viviane Yallouz
Silvia Gonçalves Egler
Bernhar Peregovich
Roosevelt Almeida Ribeiro
Flavia Maria Nascimento
Débora Maia Pereira
Luiz Roberto Pedroso
UFF Universidade Federal Fluminense
Luiz César Pereira da Silva
IEC Instituto Evandro Chagas
Elizabeth C. O. Santos
Edílson Brabo
Marcelo O. Lima
Kleber F. Faial
Iracina Maura De Jesus
Airton Teixeira
Antônio Carlos Nascimento
Dolores Dias Santos
Edna Cabral
Francisco Monteiro
Gregório Sá Filho
José Góis Dos Santos
Luciano Oliveira
Marcos Miranda
Raimundo Paixăo
Raimundo Pio Martins
University of Heidelberg, Germany
Institute of Environmental Geochemintry
Prof. German Müller
Acknowledgements
Dr. Gildo de A. Sá Cavalcanti de Albuquerque (in memorian)
CETEM's Director
Dr. Christian Beinhoff
Chief Technical Advisor
Global Mercury Project
UNIDO United Nations Industrial Development Development Organization
Dr. Marcello M. Veiga
Small Scale Mining Expert
Global Mercury Project
UNIDO United Nations Industrial Development Development Organization
Dr. Fernando A. Freitas Lins
Focal Point Brazil - Global Mercury Project
Prof. Dr. Roberto C. Villas Bôas
Assistant Focal Point Brazil - Global Mercury Project
Dr. Alberto Rogério Benedito da Silva
Small Scale Mining Expert Brazil
Dr. Arnaldo Alcover Neto
Head of Mineral Analysis Coordination
Elizabeth Costa Paiva , Sandra Helena Ribeiro, Jorge Luiz Florindo da Cruz
Analytical Technicians
José Augusto Ferreira Junior
Mineral Processing Technician
CETEM's Administration, specially, Mr. Aloisio Moura da Silva
Ms. Fátima Engel
Editing and Coordination of Report Edition
Mr. Ivo Lubrina
AMOT-MT
Ms. Luciana Boff Turchiello
SEMMA-MT
Summary
Executive Summary ............................................................................................... 3
1. Introduction .................................................................................................... 15
2. Study Areas in Brazil ....................................................................................... 18
3. Materials and Methods..................................................................................... 23
4. Results and Discussion .................................................................................... 27
4.1 Săo Chico................................................................................................. 28
4.1.1 Săo Chico reservoir and creek (sampling site A2)............................ 29
4.1.2. Mining area (tailings pile and open pit site A2)............................ 34
4.1.3. Surrounding area and Conrado River (sampling site A3) ................ 36
4.1.4. Săo Chico Village............................................................................ 37
4.1.5. Remote drainages (site A4)............................................................ 37
4.2. Creporizinho ........................................................................................... 40
4.2.1. Papagaio and Areal (site A5).......................................................... 41
4.2.2. Tabocal (A6) and Bofe (A7)............................................................ 42
4.2.3. Tolentino (A8) and remote areas (A9 to A11)................................. 43
4.3. Mercury in Fish ....................................................................................... 48
4.3.1. Human exposure to mercury due to fish consumption .................... 67
4.3.2. Preliminary assessment of physiological effects in fish
caused by Hg exposure .................................................................. 69
4.3.3. Bioindicators other than fish .......................................................... 73
4.4. Mining Technology and Hg Use Issues..................................................... 78
4.4.1. Alternative Processes..................................................................... 79
5. Alternative low cost method for mercury semiquantitative determination
in fish: training of local users ......................................................................... 81
5.1. Colorimetric Method for Hg Semiquantitive Analysis of Fish .................... 81
5.2. Adapting the minilab for mercury analysis in fish samples ...................... 81
5.3. Developed activities................................................................................ 82
5.3.1. Background.................................................................................... 82
5.3.2. Training new users........................................................................ 82
5.4. Application study .................................................................................... 86
5.5. Further applications................................................................................ 88
6. Health Assessment .......................................................................................... 88
6.1. Introduction ............................................................................................ 88
6.2. Area Of Study And Population .................................................................. 89
6.2.1. "Săo Chico" Gold Mining Area ........................................................ 89
6.2.2. Laboratory Analysis for Mercury in Urine ....................................... 90
6.2.3. Analysis of Some Variables Contained in the Index Cards
(Preliminary Results). Săo Chico, Itaituba, Pará-Brazil. 2003 ....... 94
6.2.4. Mercury Burden............................................................................. 98
6.3. "Creporizinho" Gold Mining.................................................................... 103
6.3.1 Laboratory Analysis for Mercury in Urine ..................................... 103
6.3.2 Analysis of Some Variables contained in Cards (preliminary
results) Creporizinho ................................................................. 105
6.3.3. Mercury Burden ........................................................................... 109
7. Conclusions ................................................................................................... 114
REFERENCES...................................................................................................... 116
Appendix 1 - Hg concentrations in sediments, tailings and soils
Appendix 2 Tables and figures of fish data
Appendix 3 - Photos of fish sampling sites and fish collected
Appendix 4 - Hg concentrations in bioindicators other than fish
Appendix 5 Semiquantitative mercury determination in fish
RT2004-004-01 CETEM/MCT
3
Executive Summary
The present report describes the results achieved in two small scale gold mining areas in
the Brazilian Amazon - Săo Chico and Creporizinho - as part of the environmental and health
assessment (E&HA) conducted by the Centre for Mineral Technology (CETEM) with the
colaboration of the Evandro Chagas Institute (IEC), under the general coordination of the United
Nations Industrial Development Organization (UNIDO). The E&HA is a part of the
GEF/UNIDP/UNIDO Global Mercury Project - Removal of Barriers to the Introduction of
Cleaner Artisanal Gold Mining and Extraction Technologies.
In order to identify sites with high concentration of mercury (hotspots) a sampling
campaign of soils, sediments and biota was conducted, consisting of 647 samples. The present
report describes characteristics of environmental samples and results of mercury analyses in
sediments, soils, tailings and dust from the Brazilian gold mining areas Creporizinho and Săo
Chico. An attempt to describe the distribution of mercury and to achieve an environmental
assessment of mercury pollution is presented, in order to provide a better understanding of the
impacted environment.
A research team comprizing 23 research scientists from CETEM (8 members) and IEC (15
members) proceeded to Itaituba, State of Para, Brazil, on 3rd of August 2003 and has
accomplished the sampling campaign within 20 days.
Two two artisanal gold mining areas, Săo Chico and Creporizinho, have been selected for
undertaking the Environmental and Health Assessment in the Artisanal Gold Mining Reserve of
the State of Para, in accordance with the Project´s Coordination Unit, after considering different
criteria, as follows:
- Commitment of the miners with the project´s objectives;
- Their association with local artisanal miners leaderships;
- Production potential and economic stability of the mining activity;
- Representativeness relative to regional standards of technologies and practices;
- Accessibility;
- Spreading potential relative to the project´s achievements.
Săo Chico General Description
The Săo Chico mining site (06ş 25'31"S and 56ş 02'99"W) is just 2 km distant from a
landing strip and in 5 km distance from the Transgarimpeira road, which during the dry season
(June-September) can be used for transportation of equipments and supply from Itaituba, the
main town in this region with 150,000 inhabitants. Due to the bad conditions of this road, it
should be used just for transportation of goods, since the 350 km distance from Itaituba needs
some 20 hours to be overcome. The Săo Chico village consists only of 63 houses and 134
individuals, being 41% of garimpeiros, 6% of machinery owners, 30% of dealers, 9% of cookers,
among others. The only public service in the village is a health post for malaria diagnosis from
the National Foundation of Health (1 health assistant).
RT2004-004-01 CETEM/MCT
4
Sao Chico Creek was dammed up forming a reservoir behind the village from which
water is used for mining activities that generate mining tailings to waterways. Few families have
backyards in the village, where herbs, fruits, roots, medicinal teas and creeping plants are
cultivated. Primary forest was replaced by pasture in hillsides. Grassland species and some
small trees occur at reservoir's banks.
From the beginning of the very first gold mining activity in 1963, the Săo Chico village
has shown two main periods os prosperity, one in the end of the 80´s after the opening of the
Transgarimpeira road, and other in the end of the 90´s, when gold rich primary deposits were
discovered. According to cross-checked estimations, about three tons of gold were produced
from the beginning of the gold rush, corresponding to an estimated mercury emission of 7.5
tonnes to the environment. Since the primary gold ore has been crushed in hammer mills and
directly amalgamated in copper plates, and no retorts have been used, the estimated Hg:Au
(lost:produced) emission ratio is about 2.5 for this type of operation.
Nowadays, exploitation of primary gold ore is over, being gold production in Săo Chico
almost restricted to the reprocessing of tailings produced during the 80´s, when alluvial and
laterite deposits (baixőes) were worked using just sluice box for gravity concentration, without
crushing. Tailings are now being concentrated through sluice boxes while the concentrate
follows the same processing circuit as for the former primary ore, while mercury is widely used
in both mineral processing steps, gravity concentration and amalgamation.
Creporizinho General Description
Creporizinho (S 06° 50` 14,1" W 56° 35` 00,0") is a typical gold mining village with 238
wooden residences for an estimated population of 1000 inhabitants. There are grocery shops,
pharmacies and a hotel. Two hundred children go to a primary school, where 5 teachers are
working. Few families have backyards in the village, where herbs, fruits, roots, medicinal teas
and creeping plants are cultivated.
In Creporizinho, located at km 145 on the Transgarimpeira, the Tolentino mining area is
located 10 km NNW from the village and represents 3 different types of small scale gold mining
activities: inactive alluvial deposits (including rework of former tailings and residues)
explored by hydraulic monitor (garimpo de baixăo), lateritic deposits explored through open
pit and primary deposits explored through open pit or shaft (garimpo de filăo). Samples were
taken in and around this area, in the village, as well as in the drainage basins nearby and
remote, including samples from Crepori River, Creporizinho River and waterbodies in
abandoned open pits.
The study sites in Creporizinho are ca. of 10 to 15 km far from the village. Creporizinho
stream flows nearby the village and is used for water supply water to mining activities.
Overbank deposits are common along its banks. There are many flooded open pits, drains of
mining tailings forming small streams along mining sites. Also herbs sprout up over mining
tailings and wastes, and pastures also replace primary forest, but forest fragments still remain in
some places. Old flooded open pits have macrophytes growing in water.
At Crepori River mining activities have been performed with dredges and hidraulic jets
at riversides. The low-water season exposes alluvial pits originated from dredge activities
during high-water season.
RT2004-004-01 CETEM/MCT
5
Since 1999 novel operations have been introduced in the Tolentino area (S 06° 47` 46,9"
W 56° 36` 27,0"), considering they have reached a sub-surface level (about 10 meters depth) with
gold veins, being 2001 identified as the higher production (said to reach 6,000 kg/year). The
owner of the Tolentino area established a partnership with a group of entrepreneurs who
assembled a plant using mainly hammer/crusher mill, hydraulic jet pumps and centrifuge
concentrators.
Environmental assessment of the mining sites ("mining hotspots")
In order to address the identification and location of mercury hotspots a sampling
campaign of soils and sediments was performed. Amalgamation tailings dumped into drainage
systems originate hotspots of metallic mercury (mining hotspot), where abnormally high
concentrations are to be found in the heavy fraction of sediments. Due to its typical
heterogeneous distribution, one may face enormous difficulties in locating mining hotspost of
mercury in a given mining site, as conventional geochemical exploration techniques have been
used unsuccessfully.
Simple sampling methods, consisting of pan concentrates for mercury analysis were also
used for locating mining hotsposts. Another estrategy, consisting of a sociological approach,
enables the reconstruction of the local mining history and the identification of amalgamation
tailings, through establishing a relationship of confidence among miners and researchers.
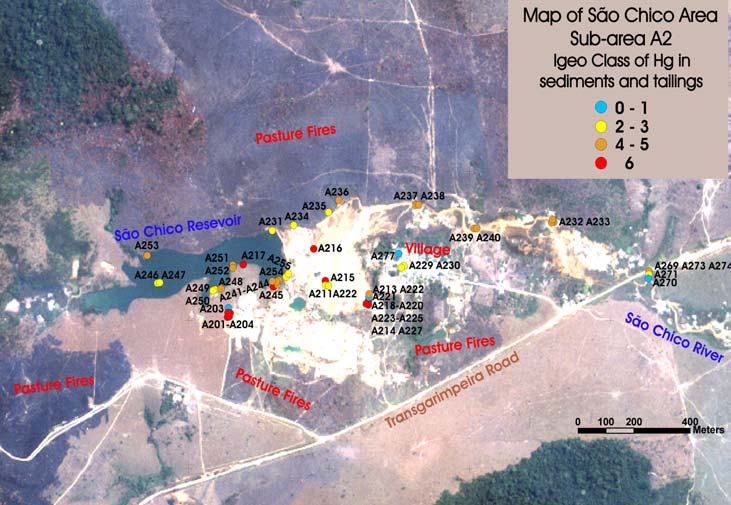
The "Geoaccumulation Index" (Igeo) of mercury in bottom sediments has been selected
for quantitative evaluation of contamination levels in aquatic systems (Müller, 1979). Since the
enrichment process of metals in sediments, caused by a given emission, generally follows an
exponential accumulation in fine fractions, the "Igeo" uses a log function for classifying distinct
order of magnitude of contamination, as follows:
Igeo = log2 Cn / 1.5 . Bn where,
Cn is the measured Hg concentration in the fraction -200 # and Bn is the background Hg
concentration. Moreover, the Igeo is divided into 7 classes, from 0 to 6, being class 0 indicative of
null contamination while class 6 represents an extreme contamination.
Săo Chico
An open pit, comprising an area of about 60.000 m2, located at the northern slope of the
valley in Săo Chico, represents a typical primary gold-ore deposit, as it is recently observed in
the Tapajós Gold Mining Reserve. Superficial lateritic soils got removed in the range of 2 to 10
meters in order to provide access to gold-bearing quartz-veins. Hammer mills and Hg coated
copper plates were placed and constructed in situ. At the eastern margin a very crude
cyanidation plant was constructed, operating from 1999 to 2001. Amalgamation tailings and
other wastes were poured into Săo Chico reservoir during this period of time. In general,
material comprise silt and sand, as a result of mineral processing of lateritic soils and weathered
rock, mainly of red and yellow colour, originated from Fe-, Mn-, and Al-oxides and
hydroxides.
In the immediate vicinity of Săo Chico village, 2 km downstream, some "virgin" areas
without any recent and past mining activities were encountered well suitable for
determination of natural background of mercury in sediments and soil. A sediment core,
RT2004-004-01 CETEM/MCT
6
divided into 6 sections, was taken in the bed of the small clear water bearing brook in the forest
area, where no former mining activity have been taken place.
The sediment core was 30 cm deep and revealed that Hg levels decreases with depth.
The lowest background values of the 200# fraction (< 74 µm) was around 0.15 µg/g in the
lowest 15 cm, corresponding to an Igeo class 0, and up to 0.84 µg/g at the surface, or Igeo class
2. This is probably a result of the contribution from atmospheric Hg released from
anthropogenic sources. It has been assumed that the lowest section of the core represents the Hg
background level of this region (around 0.15 µg/g), since this procedure has been successfully
adopted elsewhere (Rodrigues-Filho et al, 2002; Rodrigues-Filho and Maddock, 1997).
Mineralogy of fine sediment fractions in tropical waterways, draining lateritic terrains,
present a general composition of secondary minerals like kaolinite, gibbsite and Fe hydroxides,
and quartz. Significant variations on mineralogy are to be found in the heavy fraction of
sediments rather than in the more mobile, fine fractions.
Between reservoir and village, the valley floor is covered by mining tailings, extending
through an area of approximately 50.000 m2 with an average thickness of 5 meters, originated
from prior alluvial processing and former mining activities in primary ore veins from magmatic,
partially weathered rocks. This tailings pile has been deposited during a period of some 40
years.
A total of 38 composite samples of tailings from this part of the mining area were taken.
Following a typical heterogeneous distribution in tailings, Hg levels in this site confirm the
occurrence of a mining hotspot, reaching concentrations of up to 300 µg/g, whereas 34% of the
samples present an Igeo class 6, corresponding to Hg concentrations higher than 7.5 µg/g in the
200# fraction, and averaging an Igeo class 4.
Săo Chico Creek flows into Conrado River, 2 km downstream from the village, where its
water gets mixed with drainages from other mining sites, showing high turbidity. The entire
region is drained by the Conrado River, Novo River (15 km from the village) and Jamanxin
River (20 km from the village).
Săo Chico Creek was dammed up in 1989 at the end of a narrow valley, located around
Săo Chico village forming a reservoir for supplying the mining site with water to carry out
mining activities. Water covers an area of approximately 50 to 150 m width to 700 m length
(85,000 m2 surface) with an overall depth of less than 5 meters only. Outflow from this reservoir
(during dry season) amounts to less then 5 liters/second.
Since 1989, tailings from both amalgamation and cyanidation activities have been poured
into the reservoir. Due to lack of stream and turbulence nearly all of this material, in particular
suspended load, entering the reservoir could settle down and accumulate. A very small outflow
with nearly clear water feeds the Săo Chico creek, which drains the entire mining site and flows
through Conrado River, Novo River and Jamanxim into the Tapajós River.
A total of 17 composite samples composed of tailings mixed with sediments - including
settled suspended solids - were taken from reservoir bottom and margins. In general, sediments
comprise sand and silt, covered with a thin layer (< 5 mm) of clay or suspended load and
abundant organic matter. Close to amalgamation wastes and to a former cyanidation plant Hg
levels in sediments reach Igeo classes 5 and 6 (47% of the samples), corresponding to Hg
concentrations higher than 7.5 µg/g in the 200# fraction, while for samples collected in other
parts of the reservoir concentrations decrease to Igeo classes from 3 to 4 (53% of the samples).
RT2004-004-01 CETEM/MCT
7
Considering that these samples were composed of organic-rich clayey sediments, not directly
originated from amalgamation wastes, these values indicate that Săo Chico reservoir represents
both a mining hotspot, due to its proximity to amalgamation wastes, and an environmental hotspot,
as the distribution of Hg throughout the reservoir´s bottom is relatively homogeneous.
Although a less intense activity of amalgam roasting could be observed in the Săo Chico
village during the sampling campaign - presently just one gold shop is in operation - dust and
soil are sought to be efficient indicators of atmospheric Hg contamination. The maximum Hg
concentration (1,280 µg/g) was observed in a sample of spider web collected inside the gold
shop of the village, where no exhausting system exists. The others samples, composed of dust,
have been collected inside houses of its immediate neighborhood. Since all of then present
extremely high Hg levels, being the lowest one 20 µg/g, this suggests the need of urgent
measures towards the protection of the population living in this village.
Creporizinho
The mining sites of Papagaio and Areal are located circa of 15 kilometres in southeastern
direction from Creporizinho village, where alluvial gold has been explored, and from the
middle of the 90´s exploration of primary started. Nowadays, alluvial mining is very rare, being
mining of lateritic soil, primary ore and reworking of tailings common all over the area.
A total of 30 composite samples composed of tailings mixed with sediments and soils
from this part of the mining area were collected. Except 12 samples of amalgamation wastes
(A510 to A518 in Papagaio and A521, A522 and A531 in Areal), which fall in the Hg Igeo class 6,
the general distribution of Hg throughout both Creporizinho mining sites indicates an
expressive lower level of Hg contamination, comparing with the ones from Săo Chico.
The mining sites Tabocal and Bofe present a similar picture in terms of mineral
processing techniques and waste disposal as in Papagaio. A total of 16 samples of tailings and
sediments were collected. Nevertheless, Hg levels in sediments and tailings are significantly
lower than in Papagaio, indicating either less intense Hg losses or a lower mobility of Hg from a
given mining hotspot, resulting in Igeo classes close to the background, except for 3 samples
reaching the Igeo class 4, revealing a low degree of Hg contamination in inorganic samples.
Tolentino mining site is located circa 5 km in southeastern direction from Creporizinho
village, on the way to Papagaio. This is the only garimpo visited in Creporizinho area that works
with "modern" equipment, like ball mills and centrifuges. The majority of processed material
comes from primary ore deposits, extracted from gold-bearing quartz veins in magmatic rocks
in the nearby surroundings and transported by trucks to the processing unit, while
amalgamation is applied to gravity concentrates. Only a smaller part of the gold production
comes from secondary material, both, lateritic soils and tailings, resulting from former mining
activities in the entire area.
A total of 12 composite samples of sediments mixed with tailings from this site were
collected. Although one single sample reaches Igeo class 6, the whole data set, averaging an Igeo
class 2, indicates that Hg contamination is less significant than in other areas considered in this
study.
RT2004-004-01 CETEM/MCT
8
Evaluate the nature and extent of the mercury pollution in agricultural produce, especially in
those being part of the main diet
At Săo Chico mining sites 27 samples of herbs and vegetable foodstuffs were collected
close to mining tailings and backyards of the village. No aquatic plants could be found in
flooded open pits, neither in the lake at Săo Chico mining site. At Creporizinho mining sites 29
samples of herbs, macrophytes and vegetable foodstuffs were collected in the village and close
to the mining sites.
Total mercury values for soil samples at Săo Chico study area are significantly higher
than background value - 0.15 µg/g - for this area. Although mean values in soils samples from
Săo Chico (1.7 µg/g) are higher than soils samples from Creporizinho (0.99 µg/g), no significant
differences between them at < 0.05 were obtained.
Data on produces and wild plants were combined with aboveground and root plant
parts for both study areas to compare mean total mercury concentrations. Only aboveground of
produces samples from the Săo Chico mining site presents significantly higher values for
mercury levels than samples from Creporizinho area (mean of 2.55 µg/g vs. 0.12 µg/g). Since
Hg concentrations are much higher in aboveground parts of vegetable produces at Săo Chico
study area than in Creporizinho, the uptake in produce plants is likely to occur through
atmospheric deposition, as a result of amalgam burning. This makes the vegetables produced in
backyards of the village, particularly leaves, a further potential pathway of Hg exposure to the
population, besides fish consumption and inhalation of Hg vapour.
The present results also indicate that mercury concentrations in wild plants parts from
Creporizinho study area increased with mercury concentrations in soil. Apparently, they
function as a excluder, restricting transport of metal upwards to aerial parts. Since Hg
concentrations are much higher in aboveground of produces at Săo Chico study area than in
Creporizinho, the uptake in produce plants is likely to occur through atmospheric deposition,
but further studies with a larger sample set are necessary to confirm this hypothesis.
In foodstuffs other than fish mercury exists mainly in inorganic form, while the
gastrointestinal absorption is close to 7%. The average total contents of mercury in edible parts
(leaves and stems of cabbage and chive, pulp of cassava and "cara" roots, and pulp of cashew
fruit) were 0.21 ± 0.26 µg/g w wt (n = 13) for Săo Chico, and 0.01 ± 0.01 µg/g w wt (n = 7) for
Creporizinho. We estimate the average dietary daily intake of vegetables and roots close to 100
g, for an adult with 70 kg. Considering 0.3mg the provisional tolerable mercury intake per
person weekly (PTWI), the ingestion of total mercury from those foodstuffs falls close to the
PTWI in Săo Chico area, whereas in Creporizinho area the estimated Hg ingestion falls in a
range much lower than the PTWI. However, it should be taken into account the small
gastrointestinal absorption of inorganic mercury, which results in 0.017 mg/week for Săo Chico
and 0.0007 mg/week for Creporizinho.
The translocation of mercury from soil through roots to aboveground in produce plants
was not significant in both studies areas.
Nature and extent of mercury pollution in the river system adjacent to the hot spot area
Sampling and analysis of total suspended solids (TSS) and bioindicators in aquatic
systems play a pivotal role in assessing mercury mobility and the nature of pollution. Mercury
transported onto suspended particles may be deposited in riverside deposits forming mercury
RT2004-004-01 CETEM/MCT
9
sinks, which are potential sources for mercury remobilization, since mercury is adsorbed onto
fine particles and prone to form soluble complexes, mainly in the presence of humic substances.
Since metallic mercury can be transported downstream onto particulate matter, it is
assumed that mercury can be oxidized and promptly form soluble complexes in the presence of
organic substances. Therefore, the accumulation of these organic-rich sediments receiving loads
of soluble-mercury complexes may account for an environmental hotspot, since mercury
biovailability increases. High contents of organic matter in sediments have been sought during
sampling.
Since sampling of TSS by filtering through 0.45 µm membranes has been reported as
controvertial, due to its unefficiency of recovering enough material for analysis, it was sought
naturally settled TSS samples where favorable hydrodynamic conditions were to be found.
Săo Chico
According to the present results, the estimate of 7.5 tonnes of mercury released into the
environment in Săo Chico is consistent. High mercury levels were found not only near
amalgamation tailings, which are mining hotspots with up to 300 µg/g of Hg, but also
associated with suspended solids inside the reservoir and up to at least 20 km downstream, as
indicated by the high Hg levels averaging an Igeo class 4 along the Săo Chico Creek, and further
up to the mouth of the Novo River into the Jamanxin River, where Hg levels reach Igeo classes
from 4 to 6. This is an indication that the mercury load released in Săo Chico is becoming mobile
and prone for transportation onto suspended particles downstream.
A likely explanation for this particular mercury behaviour in Săo Chico, associated with
suspended particles, is due to the introduction in 2001 of cyanidation by heap leaching from
amalgamation tailings, which was undertaken at the margin of the dam reservoir situated
upstream of the main mining site in Săo Chico, the so-called Montanha. Therefore, the formation
of cyanide-mercury complexes into the reservoir is likely to be responsible for increasing
mercury mobility downstream. This type of chemical treatment is being prepared to be
undertaken once more through the storage of amalgamation tailings.
Similarly, another important factor contributing to Hg mobilization in Săo Chico is likely
to be related to fires yearly practiced for cleaning up pasture throughout the study area, as it
could be observed during the sampling campaign, when the surrounding pasture, very close to
the reservoir and tailings, has been burned three days long. The sudden elevation of the soil
temperature is likely to be very effective in releasing Hg from mining hotspots in soils to the
atmosphere, thus enhancing its mobility. The extension of the area impacted by pasture fires is
also visible from the satellite image in detailed scale of Săo Chico mining site.
The cyanidation attempt of amalgamation tailings together with the physical and
chemical features of the dam reservoir, a semi-closed aquatic system with high organic contents
in sediments and anoxic conditions in the botton, make this environment a promising field
opportunity for a better understanding of the behavior of mercury in aquatic systems in the
presence of cyanide, and surrounded by pasture fires. Therefore, a more detailed investigation
in the Săo Chico reservoir is enthusiastically recommended.
The physiochemical parameters in the water column of the Săo Chico reservoir are
consistent with usual water parameters of Amazonian rivers, and fall in the range of near-
neutral pH and low electrical conductivity (low salinity). Lower values of dissolved oxygen are
due to anoxic conditions in the botton of the reservoir. Those physiochemical conditions are
RT2004-004-01 CETEM/MCT 10
favourable to the stability of elemental mercury. Thus, one may realize that further factors are
likely being responsible for Hg mobility in this aquatic system, such as biochemical processes
through microbiological activity and/or anthropogenic ones, among which the cyanidation
attempt and pasture fires are to be highlighted.
Veiga et al. (1994) indicated the significant role that deforestation plays among the most
important emission sources of Hg in tropical countries, where forest fires are contributing to
increase Hg emissions worldwide through the release of Hg baselevels present in biomass.
Futher downstream, a total of 15 composite sediment samples were collected from the
Conrado River, Novo River and Jamanxin River, in order to evaluate to which extension the Hg
load released from Săo Chico is influencing the sediment chemical composition. In general,
sediments comprise a thin layer of settled suspended load and organic matter covering riverine
deposits in overbanks and riversides.
Since the main contribution in terms of Hg emissions to the Novo River comes from the
Săo Chico region, showing its high turbidity, one may realize that due to its indicated
association onto suspended particles, Hg released from Săo Chico is prone to be transported
downstream up to a distance at least as long as 20 km. However, a further in-depth study is
required to verify this indication.
A general distribution of Igeo classes of Hg in sediments, tailings and soils throughout
the whole Săo Chico area is presented in a satellite image of the study area. It is to be
highlighted the occurrence of significantly high Hg levels associated with fine sediments (< 200#
fraction) up to 20 km downstream from the Săo Chico mining area, where 5 of 15 samples fall in
the range of Igeo classes 3 to 6.
Creporizinho
The most downstream area along the Crepori River, close to the mouth of the
Creporizinho River, which drains the mining sites considered in this study lies circa of 40 km
from the mining sites. Although among 11 samples there are significant indications of Hg
contamination in fine sediments, pointing that Hg is being transported onto suspended particles
downstream, one may face in this case severe difficulty in tracing the source of Hg. This
difficulty is due to the existence of several mining operations throughout the Crepori river basin.
On the other hand, the highest values of Igeo classes averaging class 5 - are represented
by samples collected in the Creporizinho River that drains the mining sites considered in this
study. This is an indication of Hg contamination whose source is related to mining activities
located 40 km upstream, but further studies are required to confirm this hypothesis.
Additionally, the so-called Porto Alegre site and the mouth of a clear stream to the
Crepori River are located upstream of the investigated mining areas, but downstream of other
existing mining sites along the Crepori River. There, a less intense Hg contamination in
inorganic samples is to be reported for the Crepori River, where Igeo classes of Hg range from 0
to 4, being predominant values close to the background, with Igeo classes from 0 to 1.
Mercury in Fish
Fish sampling was conducted in August 2003, at Săo Chico and Creporizinho mining
sites, where the mining activities are distributed along the tributaries of the Tapajós River. These
RT2004-004-01 CETEM/MCT 11
two areas belong to two distinct hydrographic basins: Jamanxin river basin and Crepori river
basin, respectively.
It was investigated the mercury levels in fish from 11 sites: 4 in Săo Chico and 7 in
Creporizinho. A total of 234 fish specimens of 16 species were collected: 73 specimens belonging
to 13 species in Săo Chico and 161 specimens of 11 species in Creporizinho. A total of 9 common
species could be collected in both areas (acari, cará, curimată, lambari, mandi, piau, piranha and
traíra).
It is well known that freshwater biota is able to accumulate Hg from natural and
anthropogenic sources. Maximum background levels for Hg in uncontaminated freshwater fish
are in the range of 0.1 to 0.3 µg/g, although considerably higher levels can be found in large
predators. The mean concentration of Hg (1.04µg/g) in fish species from this work was similar
to those observed in other contaminated Amazonian rivers (Lacerda & Solomons, 1991; Akagi et
al, 1994, Malm et al., 1996; Bidone et al., 1997; Castilhos et al., 1998).
However, Săo Chico area has shown Hg levels in fish that are considered abnormally
high (2.53µg/g ± 3.91; n=73), compared with results from previous studies. In Creporizinho area
(n=161), mercury levels in fish resulted in 0.36±0.33µg/g. Additionally, the results show that the
minimum values for Hg in fish are similar between areas (0.027µg/g and 0.025µg/g), whereas
the maximum values are one order of magnitude higher in Săo Chico (21.90µg/g) than in
Creporizinho area (2.10µg/g). Among the analyzed fish in both areas, 82 specimens (35% of the
total) from 6 species (37,5% of the total) presented Hg concentrations above 0.5 µg/g, the Hg
concentration in fish recommended by WHO (1990). Whereas in Creporizinho 22% of fish
samples showed Hg levels above that limit, in Săo Chico this percentage increases to more than
60%. This is a further indication that mining hotspots in Săo Chico are becoming environmental
hotspots, strengthening the results and conclusions obtained in the geochemical survey.
Additionally, the results show that the minimum values for Hg in fish are similar
between areas, whereas the maximum values are one order of magnitude higher in Săo Chico
than in Creporizinho area.
Comparisons with global means of Hg in fish, however, may result in a certain
misinterpretation, since observations on given species of marine and freshwater fish indicate
that Hg concentrations in fish tissue increase with increasing age, as inferred from length
(WHO, 1990); it is also strongly affected by fish species and size (length and weight) and, in
addition, it is generally agreed that Hg concentrations in carnivorous fish are higher than in
non-carnivorous species (e.g., Watras and Huckabee 1994), due to the indirect Hg
bioaccumulation or biomagnification. It was investigated a relationship between fish length and
Hg levels, by correlation analysis with log-transformed and non-transformed data and, also, by
using the mean values of the length intervals. The objective was to assess the Hg contamination
in those sites and to find an indicator of Hg bioavailabiliy by using fish species.
The present results show that fish from Săo Chico are more contaminated, heavier and
larger than those from Creporizinho area. However, no correlation was found between fish Hg
concentration and weight or length when analyzing all specimens in both areas. Comparing
mercury levels in fish from each site within each study area (Săo Chico and Creporizinho) the
results showed that fish from the Săo Chico Reservoir present the highest mercury levels in Săo
Chico and are smaller than fish from the other sites.
RT2004-004-01 CETEM/MCT 12
In order to assess the Hg biomagnification processes in the ichthyofauna of the study
areas, data were worked out whereby distinct food habits and their correspondent Hg
concentrations were taken into account and analyzed. The fish were classified as carnivorous
(arraia, bocudo, lambari, piranha, pirarara, surubim e traíra) and noncarnivorous. The non-
carnivorous fish species were classified into (i) detritivorous (acari and curimată); (ii)
herbivorous (pacu and piau), (iii) insectivorous (ituí), (iv) macrophagous (sairu), (v)
microphagous (cará) and omnivorous (candiru and mandi). As expected, carnivorous species
showed higher Hg concentrations than in non-carnivorous species for total data and for both
studied areas.
In Săo Chico area, the Hg levels in carnivorous species are higher than in detritivorous.
When this analysis is performed considering only noncarnivorous, the microfagous species are
different of the herbivorous, detritivorous and insectivorous species. In Creporizinho, the
species of detritivorous, herbivorous and macrofagous showed different Hg levels of the
carnivorous, microfagous and omnivorous ones, being macrofagous species different of
detritivorous ones. This results is very interesting and one could suggest that mercury transfer
in the trophic chain in those studied areas could be distinct, since in Creporizinho, omnivorous
showed higher Hg levels than carnivorous.
In Creporizinho area, fish from the site A8 showed higher Hg levels than all the other
sites (A5, A6, A7, A9, A10 and A11), and the specimens are also smaller than fish from the most
of the other sites (A6, A9, A10 and A11). However, significant positive correlation between Hg
in muscles and length were found in sites A6, A7 and A9, and a negative correlation in A11,
whereas no significant correlation was found for A2 nor to A8.
Carás and Traíras from Săo Chico have higher mercury levels than the ones from
Creporizinho, whereas others species (Piranha, Acari, Curimată, Piau and Mandi) did not show
any difference between areas. The ratio of total mercury levels in Trairas and Carás from several
sites of two study area ranged from about 2 to 4, meaning that the carnivorous specie
accumulates Hg from 2 to 4 times more than noncarnivorous species. In addition, the results
showed that Hg levels only in Traíras from A2 are higher than Traíras from the other sites,
which are similar one each other. Mercury levels in Carás from A1 and A2 are higher than Carás
from A5, A6, and A8. Mercury levels in Carás from A5 and A6 are similar each other and lower
than levels in Carás from A8.
A toxicological approach has been used for the risk assessment to human health. Hazard
Quotient (HQ) results show for all study sites values above one, from 1.5 to 28.5, except for A11,
which is considered a reference area. The Săo Chico reservoir (A2) showed the higher values of
HQ, followed by A1, A4, and A3. In Creporizinho area, the HQ values are close to 2 for all sites,
except in A8, where the HQ attained 3.3.
It should be stressed that the present modeling is an evaluation tool, and therefore its
uncertainty should be taken into account for interpretation of results and conclusions. From the
present results, however, one could indicate that possibly in all sites, except in A11, and
depending on their dietary habits, populations are subject to potential hazards and health effects
due to fish consumption, being site A2 the most evident case of mercury pollution. Therefore,
further in-depth studies on Hg bioavailability are highly recommended for the overall study
area, while an awareness campaign should address to the local population the risk of consuming
fish from the site A2.
RT2004-004-01 CETEM/MCT 13
According to the correlation analyses, there is correlation between Hg and length and/or
weight, in Creporizinho area, with Curimată and Piranha' species, and in Săo Chico area, the
species Curimată and Ituí showed positive and significant correlation between Hg and length.
The other species, including Traíra species, did not show any correlation in both areas.
Considering specific species collected from different sites, Curimată from A1 and Acari from A9
showed significant correlation between Hg and length and Piranha from A11 showed significant
correlation between Hg and weight.
Although Traíras and Carás did not show any correlation between mercury levels and
length or weight when total data were analyzed in Săo Chico and/or Creporizinho and, even,
when data from each site was considered, we decided to investigate the correspondence
between log of length and log of mercury levels in muscles, as advised by the UNIDO Protocol.
We have chosen these species because they are distributed throughout the studied aquatic
systems, have different food habits and the number of specimens collected is large enough. The
data analyzed showed very low correlation between parameters for all Traíras from Săo Chico
and Creporizinho, as well as for Traíras from different sites. Carás also did not show any
correlation in Săo Chico and Creporizinho, neither in sites of those areas. Other species, like as
Sairu from Creporizinho, A5, A6, A7; Piau from A11 and Piranha from A11 did not show any
correlation. The results showed strong positive correlation between log length and log mercury
levels only for Curimată from A1 (Săo Chico area), Acari and Piranhas from A9 (Creporizinho
area), showing the same tendency found with non-transformed data.
Considering the low correlation coefficient resulting from analysis of log transformed
data for most part of species studied, we decided to investigate the correspondence between
length intervals and the average mercury levels in fish muscles, trying to decrease the high
variability in data, considering, firstly, data not log transformed and, secondly, log transformed
data. The linear equation for Traíras from A2 with log transformed data shows a positive and
significant correlation. It is very interesting result, but it should be considered that changes in
length intervals could change this linear relationship. However, considering the present results,
one could suggest that Traíras can be used as indicator organism for mercury contamination, at
least in Amazonian contaminated sites.
Although Traira does not show good correlation between Hg and length, it should be
used as a Hg bioindicator for the following reasons: It shows the fairly highest Hg levels; it has
the most widespread distribution in tropical drainages; in contrast to other species it is easily
adapted to adverse conditions in impacted areas and, it is appreciated for eating. Although the
indication of absence of correlation shows that this species do not fit well with the modelling
proposed in the Protocol, this has a potential negative effect in the human population (easy to
catch and appreciated as food). In addition, Piranhas, Curimată and Acari are also good
indicators for specific sites, suggesting that, in order to find an indicator of Hg contamination, a
search for a site-specific fish species, with more than one species for different sites, could bring
better results.
The relationship between Hg levels in fish and Hg in sediments can be used as an
indicative of bioavailability of Hg in aquatic system. In order to investigate this availability, we
performed the ratio between Hg levels in fish and Igeo classes of Hg in sediments. Traíra and
Piranha (carnivorous species) and Cará and Curimată (non carnivorous species) were chosen
because they were collected in Săo Chico and Creporizinho areas and represent different food
habits. All sites showed this ratio below 0.5 considering all species, except A2 and A7 for Traíra,
RT2004-004-01 CETEM/MCT 14
which resulted in 1.5 and 1.8, respectively. The results suggest that A2 and A7 showed higher
mercury bioavailability than the other sites.
In order to assess the potential ecological effects in Amazonian fish from aquatic systems
influenced by gold mining, Hg in tissue and its hematological and biochemical responses were
measured in each fish specimen. The results of total Hg in fish muscles and fish blood and
biochemical parameters were used as effects biomarkers in ecological risk assessment. It was
investigated biochemical parameters as enzyme activities, such as amino-alanina transferase-
ALT; amino- spartate transferase-AST; creatina kinase and creatinine, and hematological
parameters, such as hematocrit, hemoglobin, erythrocytes and total leukocyte count;
trombocytes-leukocytes count in blood of fish from Săo Chico and Creporizinho.
A total of 42 fish specimens of those species (Carás and Traíras) were collected: 27
specimens in Săo Chico (18 Carás and 9 Traíras) and 15 specimens in Creporizinho (11 Carás
and 4 Traíras).
All biochemical parameters measured in the present work did not show any difference
between both areas, probably as a result of the low number of specimens, which did not permit
performing the correlation analysis. In addition, those biochemical parameters could not be
sensible as mercury biomarkers. However, the data are important because they can be used as
biochemical reference values for Amazonian fish, considered as rare data.
Traíras and Carás from Creporizinho showed higher globular volume and erythrocytes
number and/or mean globular volume than the ones from Săo Chico. Mercury levels and
globular volume showed significant negative correlation for both species, suggesting that
mercury levels may cause decrease in number of erythrocytes, which are smaller than normal
ones and are characteristic of regenerative anemia.
RT2004-004-01 CETEM/MCT 15
1. Introduction
The present report describes the results achieved in two small scale gold mining areas in
the Brazilian Amazon - Săo Chico and Creporizinho - as part of the environmental and health
assessment (E&HA) conducted by the Centre for Mineral Technology (CETEM) with the
colaboration of the Evandro Chagas Institute (IEC), under the general coordination of the United
Nations Industrial Development Organization (UNIDO).
In order to identify sites with high concentration of mercury (hotspots) a sampling
campaign of water, soils, sediments and biota was conducted, consisting of 658 samples. The
present report describes characteristics of environmental samples and results of mercury
analyses in samples from the Brazilian gold mining areas Creporizinho and Săo Chico. An
attempt to describe the distribution of mercury and to achieve an environmental assessment of
mercury pollution is presented, in order to provide a better understanding of the impacted
environment.
A research team comprizing 23 research scientists from CETEM (8 members) and IEC (15
members) proceeded to Itaituba, State of Para, Brazil, on 3rd of August 2003. On the same day, a
meeting has been organized by the Local Association of Miners (AMOT) with CETEM´s team,
the Municipal Secretaries of Environment and Health (SEMMA and SEMS), and a representative
of the State Secretary of Science, Technology and Environment (SECTAM), since the local
authorities required a comprehensive explanation about the activities to be performed during
the field work of the Environmental and Health Assessment for the Global Mercury Project
(GMP).
The following benefits should be seen as a voluntary contribution from UNIDO, CETEM
and IEC to the mining community of Itaituba through this E&HA work, in addition to the
project objectives thenselves:
- Gratuitous medical assisstance including diagnosis, treatment recommendation and
medicines for the whole mining communities of Săo Chico and Creporizinho, encompassing
700 people;
- Restoration of a local laboratory in Itaituba for implementing an innovative semi-
quantitative method for mercury analysis in fish samples, including training of 5
technicians from the local Secretaries (SEMS, SEMMA and SECTAM) during two weeks;
- Improvements on the installations of both schools, in Săo Chico and Creporizinho, which
served as field laboratories for CETEM´s team.
The Global Mercury Project, funded by GEF and co-funded by UNDP and UNIDO, is
complemented by a suite of ongoing activities that are financed either through the participating
countries' resources and/or bilateral programs. The main goals of the GMP are (Veiga and
Baker, 2003):
o Reduce mercury pollution caused by artisanal miners on international waters;
o Introduce cleaner technologies for gold extraction and train miners;
o Develop capacity and regulatory mechanisms within local governments that will enable the
sector to minimize mercury pollution;
o Introduce environmental and health monitoring programs;
RT2004-004-01 CETEM/MCT 16
o Build capacity in local laboratories to assess the extent and impact of mercury pollution.
The monitoring component of the Global Mercury Project (GMP) has specific goals
described in the Objective 3 of the project proposal: "identify hotspots in project demonstration sites,
conduct geochemical and toxicological studies and other field investigations in order to assess the extent of
environmental (mercury) pollution in surrounding water bodies and devise intervention measures".
Small-scale or artisanal gold mining is an essential activity in many developing countries
as it provides an important source of livelihood, particularly in rural regions where economic
alternatives are critically limited. Artisanal mining encompasses small, medium, informal, legal
and illegal miners who use rudimentary processes to extract more than 30 different mineral
substances worldwide. Artisanal mining activities are not necessarily limited to small-scale
mining activities. When a large number of individuals excavate a single site, the resulting pit
diameter can be as large as 2 km. This is the case of Serra Pelada, an infamous ASM site in the
Brazilian Amazon where, during the 1980's, more than 80,000 miners gathered to manually
extract about 90 tonnes of gold from the same open pit. The International Labour Organization
(ILO, 1999) estimates that the number of artisanal miners is currently around 13 million in 55
countries and rising, which suggests that 80 to 100 million people worldwide depend on this
activity for their livelihood. Gold is easy to transport across borders and easily sold, and is by far
the main metal being extracted. Worldwide it is estimated that more than 2.5 million women
and 250,000 children are directly employed in artisanal mining (Hinton et al, 2003).
Although the use of mercury in mineral processing is illegal in most countries, mercury
amalgamation is the preferred method employed by ASM. When used correctly, mercury is an
effective, simple and very inexpensive reagent to extract gold (e.g., 1kg of Hg costs from 1 to 2g
of Au). A variety of mining and amalgamation methods are used in artisanal mining operations
and they must be primarily surveyed to establish a reliable environmental assessment (Veiga
and Baker, 2003).
The extent of mercury losses from a specific site is defined by Au-Hg separation
procedures; mercury often is discharged with contaminated tailings and/or volatilized into the
atmosphere. Typical amalgamation methods used by ASM are listed below (Veiga and Meech,
1995):
- Whole ore is amalgamated: mercury is mixed with the whole ore in pump boxes or
introduced in sluices during gravity concentration or amalgamated when copper plates are
used.
- Only gravity concentrates are amalgamated: mercury is mixed with concentrates in
blenders or barrels and separation of amalgam from heavy minerals is accomplished by
panning in waterboxes, in pools or at creek margins.
Many miners are nowadays amalgamating only gravity concentrates. This is an
important improvement in artisanal mining methods, resulting in significant decreases in Hg
consumption and emissions. Using this method approximately 14 grams of mercury is required
to amalgamate 1 kg of concentrate (ratio Hg:Concentrate » 1:70). Amalgamation is efficient for
particles coarser than 200 # (0.074 mm) and for liberated or partially liberated gold (Wenqian &
Poling, 1983).
Although artisanal mining has shown some positive contributions worldwide, it has also
suffered negative conceptualization as a misnomer to mineral sector development by host
Governments. Whereas some countries choose to ignore the existence of such activities, others
RT2004-004-01 CETEM/MCT 17
lack adequate legal frameworks to regulate them. As a result, the activities are carried out
illegally thus denying the host Governments the badly needed revenues (Beinhoff, 2002).
The increasing societal demand for actions and strategies towards sustainability of small-
scale gold mining in developing countries has led experts to face the challenge of managing the
hazards associated with mercury contamination from active and abandoned mine sites.
Mercury contamination in drainage systems and its health effects are the most frequent subjects
on environmental researchs dealing with small-scale gold mining worldwide. Also, filling of
river beds with mineral matter originated from runoff of abandoned mining waste piles and
tailings generally causes both silting of waterways and elevation of Hg concentrations in the
environment.
From the end of the 80's onwards the extraction of gold in rain forest areas and wetlands
worldwide, in the form of SSGM operations, are receiving increased attention from scientists
and public planners. Moreover, the formidable impacts caused by mercury usage in industrial
activities, be it in chemical factories or energy production, as it is inherent in coals used in
thermal power plants, and in agriculture as part of herbicides compounds are well documented
in the literature. As well teeth amalgams are an old concern, recently revived in the scientific
literature (Villas-Bôas, 2001).
Inhalation of mercury vapor is the primary exposure pathway to miners, gold shop
workers and people living near areas where mercury is handled. High methylmercury
concentrations in fish in waterways contaminated by mercury released from mining sites is the
main means of exposure to local residents in rural communities. Because fish are plentiful and
inexpensive fish are the main protein source for community residents, but can also result in
consumption of greater amounts of methylmercury than health authorities advise (Veiga and
Baker, 2003).
Biota is the ultimate indicator of bioavailability of any form of Hg. Mercury, particularly
MeHg, is highly biomagnified in the food web and reaches its highest concentrations in fish,
especially fish-eating, carnivorous fish. Mercury concentration in fish is usually expressed on a
wet weight basis as parts per million (ppm) which is equivalent to mg/kg or µg/g. The natural
background in fish has been estimated to be between 0.05 to 0.3 ppm Hg and may be less than
0.01 ppm Hg in small, short-lived herbivorous species (Suckcharoen et al, 1978).
By employing toxicological methods for the risk assessment to human health,
significance of the contamination can be ascertained. At a screening level, a Hazard Quotient
(HQ) approach (USEPA, 1989), assumes that there is a level of exposure (i.e., RfD = Reference of
Dose) for non-carcinogenic substances, like mercury, below which it is unlikely for even
sensitive populations to experience adverse health effects.
There are three physiological responses regarding the translocation of metals to
aboveground plant tissues. The excluder response, where aboveground tissues concentrations
are low until a critical soil concentration is reached, and an unrestricted transport occur with
toxicity results. The indicator response, when tissues and environmental concentrations are
proportional, with a passively regulated transport and uptake. The accumulator response, when
metal is actively accumulated through a highly specialized physiology (e.g. hyperaccumulators
species). Shoot : root ratios could be a measure of the degree of metal transport, a higher amount
of metal in above-ground than in roots could indicate an no restricted metal uptake (Windham
et al., 2003).
RT2004-004-01 CETEM/MCT 18
Assimilation through plants plays a major role in the entry of mercury into terrestrial
food chain (WHO, 1990). The assimilation of mercury by plants does not depend only on its
concentration in soil, but also on the ratio of soil and air mercury contamination, on bio-
chemical conditions of soil and on meteorological conditions. The assimilation from the soil by
roots depends on soil type, content of humic acid, microbiological activity, pH, and redox
potential. The assimilation through leaves depends on type of plant, air contamination and
atmospheric aerosol deposition (Vecera et al., 1999). Bryophites and lichens without any roots,
assimilate mercury only from air and water and can be used as active biomonitors (Fernández et
al., 2002). Further studies show that certain plant species, such as carrots, lettuce and
mushrooms in particular, are likely to assimilate more mercury than other plants growing at the
same place, but on the other hand, they show that mercury levels in plants bear little
relationship to the mercury content of soils (Nichols et al., 1997).
Mercury toxicity and sources of exposure depends on its chemical form. For organic and
inorganic mercury compounds, diet is the most important source for the majority of organisms.
In terrestrial food webs, mercury exists in an inorganic form, and accumulates in plants.
However, it does not biomagnify in the organisms that feed on them (Nichols et al., 1997).
Concentrations of mercury in most foodstuffs are often below the detection limit, usually less
than 20 g.g-1 wet weight, with mercury mainly in the inorganic form (WHO, 1991, as cited by
UNEP, 2002), with gastrointestinal absorption close to 7%. WHO (1990, as cited by UNEP, 2002)
estimates an average daily intake of inorganic mercury of 3.6 µg/day, for populations not
occupationally exposed, whereas its retention in the body averages 0.25 µg/day, as a result of
consumption of foodstuffs other than fish.
A Joint FAO/WHO Expert Committee on Food Additives (1972, as cited by IPCS, 1976)
established a provisional tolerable weekly intake (PTWI) of 0.3 mg of total mercury/person (of
which 0.2 mg should be in methylmercury form), being these amounts equivalent to 5 µg /kg of
body weight, and 3.3 µg/kg relative to methylmercury.
2. Study Areas in Brazil
Two artisanal gold mining areas, Săo Chico and Creporizinho, have been selected for
undertaking the Environmental and Health Assessment in the Artisanal Gold Mining Reserve of
the State of Para, in accordance with the Project´s Coordination Unit, after considering different
criteria, as follows:
- Commitment of the miners with the project´s objectives;
- Their association with local artisanal miners leaderships;
- Production potential and economic stability of the mining activity;
- Representativeness relative to regional standards of technologies and practices;
- Accessibility;
- Spreading potential relative to the project´s achievements.
RT2004-004-01 CETEM/MCT 19
Săo Chico (06ş 25'31"S and 56ş 02'99"W)
The garimpo Săo Chico is just 2 km distant from a landing strip and in 5 km distance
from the Transgarimpeira road, which during the dry season (June-September) can be used for
transportation of equipments and supply from Itaituba, the main town in this region with
150,000 inhabitants. Due to the bad conditions of this road, it should be used just for
transportation of goods, since the 350 km distance from Itaituba needs some 20 hours to be
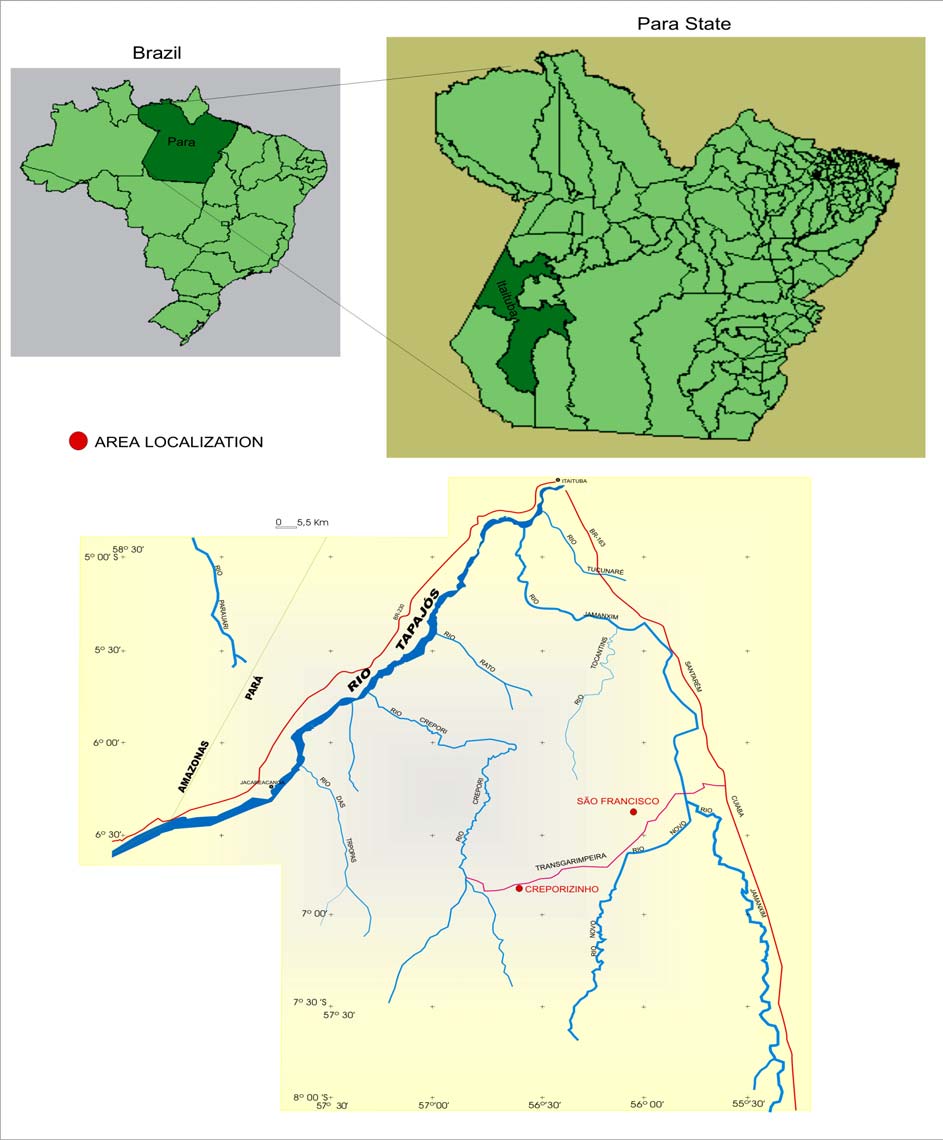
overcome (Figure 1).
The Săo Chico village consists only of 63 houses and 134 individuals, being 41% of
garimpeiros, 6% of machinery owners, 30% of dealers, 9% of cookers, among others. The only
public service in the village is a health post for malaria diagnosis from the National Foundation
of Health (1 health assistant)(Armin Mathis, Sociological Report, July 2003).
At Săo Chico mining site a small village has been established on the bottom of a valley.
The topography is undulating with mean altitudinal differences between plateaus and stream
valleys of 10-20 m.
Sao Chico stream was dammed up forming a reservoir behind the village from which
water is used for mining activities that generate mining tailings to waterways (Figure 2). Few
families have backyards in the village, where herbs, fruits, roots, medicinal teas and creeping
plants are cultivated. Primary forest was replaced by pasture in hillsides. Grassland species and
some small trees occur at reservoir's banks.
From the beginning of the very first gold mining activity in 1963, the Săo Chico village
has shown two main periods os prosperity, one in the end of the 80´s after the opening of the
Transgarimpeira dirt road, and other in the end of the 90´s, when gold rich primary deposits were
discovered. According to revised estimations, about two tons of gold were produced during the
last gold rush, while a total estimated mercury emission to the environment reachs three tons
since 1963.
RT2004-004-01 CETEM/MCT 20
Itaituba
0 '------' 20 km
Săo Chico
Creporizinho
Figure 1 - Location Map of the Target Areas in the Tapajós Basin, Brazil
RT2004-004-01 CETEM/MCT 21
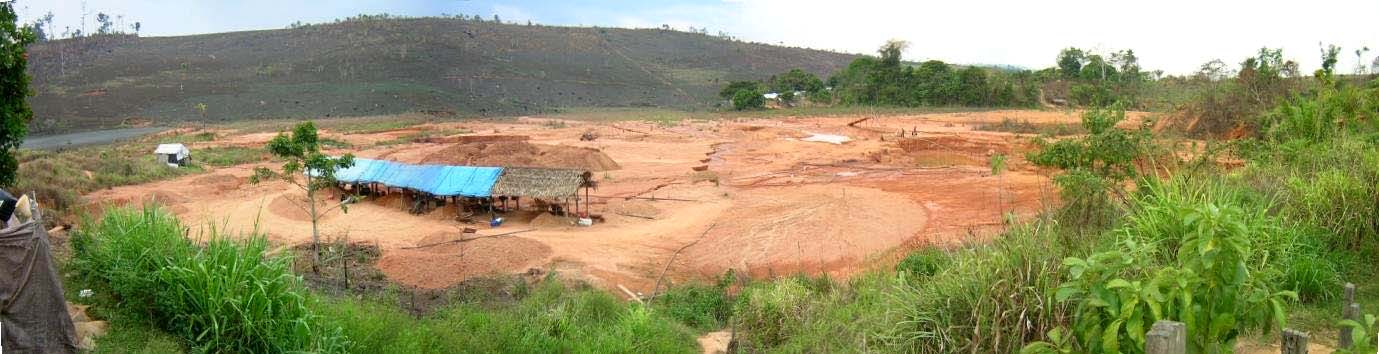
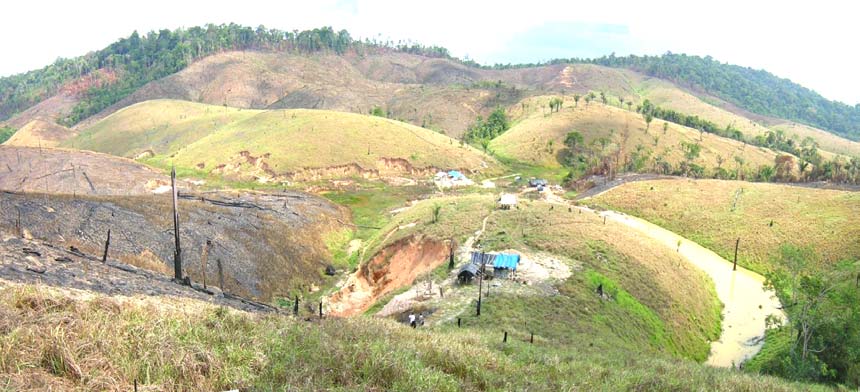
Figure 2 - Main tailing deposit in Săo Chico: lies at the slope of a valley, between the village
(to the right) and a dam reservoir (on the left)
Creporizinho (S 06° 50` 14,1" W 56° 35` 00,0")
Creporizinho is a typical gold mining village with 238 wooden residences for an
estimated population of 1000 inhabitants. There are grocery shops, pharmacies and a hotel.
Electricity is based on diesel engines. The 200 children go to a primary school, where 5 teachers
are working. Gold is bought at any corner. Few families have backyards in the village, where
herbs, fruits, roots, medicinal teas and creeping plants are cultivated.
Both study sites, Tolentino and Papagaio, were said to start its prospective/extraction
activities since 1968 (manual extraction). From 1985 on started to work with machinery
consisting basically on processing alluvial colluvial terraces. They have privilegiated the using
of hydraulic jet pumps coupled with riffled or carpeted sluice boxes in order to concentrate gold
prior to amalgamation.
Creporizinho study sites are ca. 10 km far from the village. Creporizinho stream flows
nearby the village and is used for water supply water to mining activities. Overbank deposits
are common along its banks. There are many flooded open pits, drains of mining tailings
forming small streams along mining sites. Also herbs sprout up over mining tailings and wastes,
and pastures also replace primary forest, but forest fragments still remain in some places. Old
flooded open pits have macrophytes growing in water.
From 10 to 15 kilometres in southeastern direction from Creporizinho village lies the
mining area of "Luis Preto", comprising the Garimpos Papagaio (Figure 3), Tapocal an Areal
Alluvial gold has been mined and from the middle of the 90´s exploration of primary ore began,
more or less successfully. Nowadays, alluvial mining is very rare, mining of lateritic soils,
primary ore and reworking of residues and tailings from former mining activities became
common all over the area.
RT2004-004-01 CETEM/MCT 22
Figure 3 Panoramic view of the Papagaio area in Creporizinho
In the Papagaio mining site (S 06° 47` 00,2" W 56° 40` 03,2"), primary ore from open pits
and from shafts is extracted, transported to the processing unit, located on top of a hill, where
material gets ground and undergoes amalgamation through mercury-coated copper plates. In
the neighbouring Tapocal, Bofe and Areal areas, prevailing mining activities concentrate on
reprocessing of tailings and residues mainly located along recent or past courses of creeks or
small rivers. Amalgam is usually roasted locally.
At Crepori River mining activities were performed with dredges and hidraulic jets at
riversides. The low-water season exposes alluvial pits originated from dredge activities during
high-water season.
Since 1999 novel operations have been introduced in the Tolentino area (S 06° 47` 46,9"
W 56° 36` 27,0"), considering they have reached a sub-surface level (about 10 meters depth) with
gold veins, being 2001 identified as the higher production (said to reach 6,000 kg/year). The
owner of the Tolentino area established a partnership with a group of entrepreneurs who
assembled a plant using mainly hammer/crusher mill, hydraulic jet pumps and centrifuge
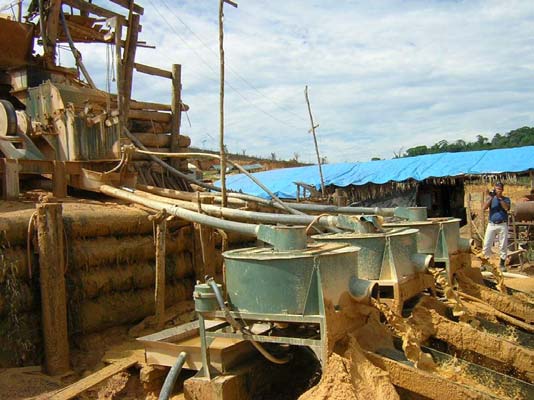
concentrators (Figure 4).
Figure 4 - Processing plant at Tolentino mining site3. Materials and Methods
RT2004-004-01 CETEM/MCT 23
In order to address the identification and location of mercury hotspots a sampling
campaign of soils and sediments was performed. Amalgamation tailings dumped into drainage
systems originate hotspots of metallic mercury (mining hotspot), where abnormally high
concentrations are to be found in the heavy fraction of sediments. Due to its typical
heterogeneous distribution, one may face enormous difficulties in locating mining hotspost of
mercury in a given mining site, as conventional geochemical exploration techniques have been
used unsuccessfully. Therefore, the introduction of novel sampling and analytical methods was
required, including in situ mercury analyses by a semi-quantitative colorimetric method.
Sampling and analysis of total suspended solids (TSS) and water in aquatic systems play
a pivotal role in assessing mercury mobility and the nature of pollution. Mercury transported
either in solution or onto suspended particles may be deposited in riverside deposits forming
mercury sinks, which are potential sources for mercury remobilization, since mercury is
adsorbed onto fine particles and prone to form soluble complexes, mainly in the presence of
humic substances.
Since metallic mercury can be transported downstream onto particulate matter, it is
assumed that mercury can be oxidized and promptly form soluble complexes in the presence of
organic substances. Therefore, the accumulation of these organic-rich sediments receiving loads
of soluble-mercury complexes may account for an ecological hotspot, since mercury
biovailability increases. High contents of organic matter in sediments have been seeked during
sampling.
Simple sampling methods, consisting of pan concentrates for mercury analysis were also
used for locating mercury hotsposts. Another estrategy, consisting of a sociological approach,
enables the reconstruction of the local mining history and the identification of amalgamation
tailings, through establishing a relationship of confidence among miners and researchers.
Some physico-chemical parameters are considered important for assessing the fate of
mercury in the environment, and its eventual bioaccumulation and/or biomagnification in fish,
mainly as methilmercury. Therefore, besides the investigation of natural and/or anthropogenic
mercury concentrations in sediments and water, the physiochemical parameters of water, such
as temperature, electrical conductivity, pH and dissolved oxygen were determined in the
drainage waters by multi-electrodes.
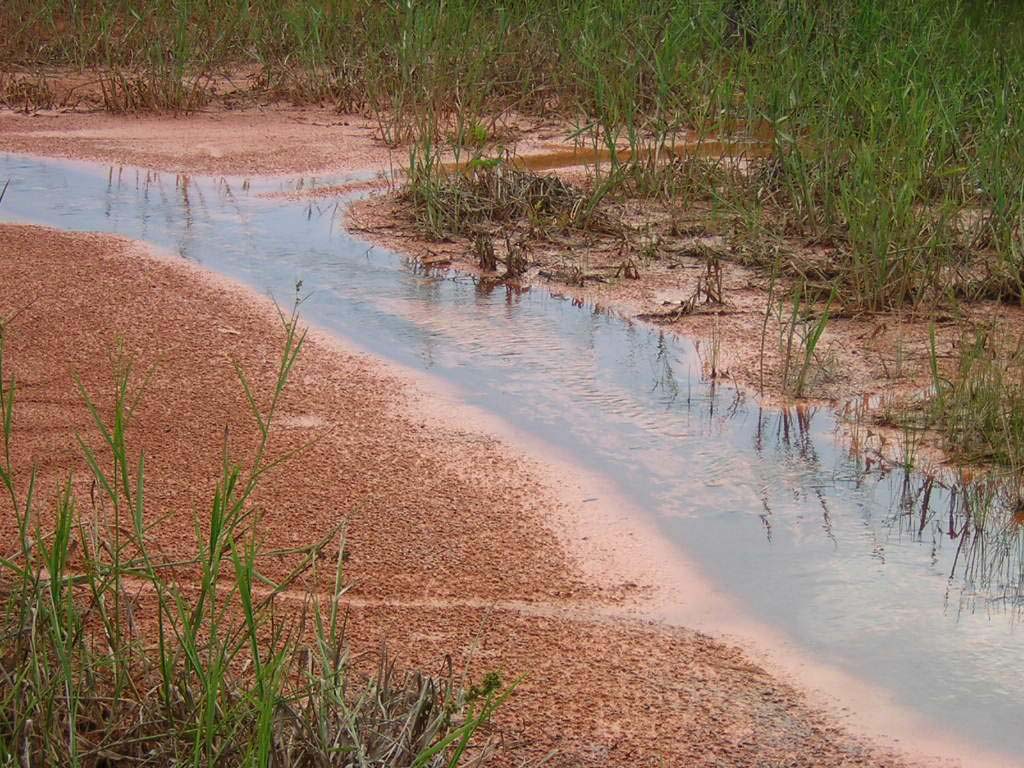
Since sampling of TSS by filtering through 0.45 µm membranes has been reported as
controvertial, due to its unefficiency of recovering enough solid material for analysis, it was
sought naturally settled TSS samples where favorable hydrodynamic conditions were to be
found. An example of settled TSS on the Săo Chico Creek is ilutrated in Figure 5.
RT2004-004-01 CETEM/MCT 24
Figure 5 Fine layer of settled TSS on Săo Chico Creek margins
The "Geoaccumulation Index" (Igeo) of mercury in bottom sediments has been selected
for quantitative evaluation of contamination levels in aquatic systems (Müller, 1979). Since the
enrichment process of metals in sediments, caused by a given emission, generally follows an
exponential accumulation in fine fractions, the "Igeo" uses a log function for classifying distinct
order of magnitude of contamination, as follows:
Igeo = log2 Cn / 1.5 . Bn where,
Cn is the measured Hg concentration in the fraction -200 # and Bn is the background Hg
concentration.
Moreover, the Igeo is divided into 7 classes, from 0 to 6, being class 0 indicative of null
contamination while class 6 represents an extreme contamination.
Preparation of sediment, soil and tailing samples consisted of homogenization followed
by wet sieving for separating grain size fractions above and below 200 # (74 µm). After that,
each fraction has been dried at 40 °C for analysis.
The analytical method used in the field was undertaken by a portable atomic absorption
for mercury analysis (LUMEX), which allows simple and direct determinations in different
matrixes without acid digestion.
The method used in the laboratory for the determination of total mercury in
environmental samples (soils, sediments, fish) follows the methodology developed by Akagi
and Nishimura (1991) (Speciation of Mercury in the Environment, in: Advances in Mercury
Toxicology, edited by T.Suzuki et al.). It involves sample digestion with strong acids followed
by reduction to elemental mercury, aeration and measurement of mercury absorption with cold
vapor atomic absorption spectrometry.
The sample digestion procedure insures complete digestion of organic materials and at
the same time avoiding mercury loss by use of a combination of acids and oxidizing agents. This
combination involves a mixture of nitric, perchloric and sulfuric acids. Additionally, water is
RT2004-004-01 CETEM/MCT 25
added to protein-rich samples, to avoid frothing upon heating. The sample is then heated at 250
oC for 20 minutes.
The sample solution is reduced by staneous chloride, generating elemental mercury
vapor, which is then circulated in a closed system. Absorbance is measured when equilibrium of
mercury vapor between gas and liquid phases is reached. The use of a syringe with needle when
adding the reducing agent avoids loss of mercury by vaporization. The detection limit of the
method is 0.5 ng Hg. The flowchart below shows a scheme of the procedure.
Hg was analyzed in the fish muscle through Atomic Absorption Spectrophotometer
(KK.Sanso SS) using a Vapor Generation Accessory-VGA (CVAAS). For the analysis of Hg-total,
approximately 0.5 g of tissue was weighed in 50-ml-vol flasks, to which was added 2 ml of
HNO3-HClO4 (1:1), 5 ml of H2SO4, and 1 ml of H2O (Hg free), and heated on a hot plate to 230-
250°C for 20 minutes. After cooling, the digested sample solution was made up to 50 ml with
water. An aliquot (5 ml) of digested sample solution was introduced in the Automatic Mercury
Analyzer Hg 3500. The difference in duplicate sample analyses was less than 10% (precision of
measurements was 90%). The accuracy of analyses was estimated with analyses of biological
tissue standard reference materials from International Atomic Energy Agency. The results
indicated that the sample preparation and analytical procedures consistently produced accurate
measures of Hg concentrations.
Statistical differences between Hg concentrations and allometric parameters among
different sites and garimpos areas (Săo Chico and Creprorizinho) were tested using parametric
Student's T-test after Levene's test for equality of variance, or, if the underlying assumptions for
parametric testing are not met, a nonparametric test of significance, the Mann-Whitney U-test
was employed. The significant level considered was the probability level 0.05. Correlation
analyses were determined with both the Pearson correlation coefficient and/or the Spearman
rank correlation coefficient. Significance of the correlation was determined with a two-tailed
Student's t test. One-way ANOVA followed by Duncan pos-hoc were performed when
appropriate for testing differences among groups.
Plant samples, collected manually or using a shovel to dig out the roots, were washed
several times, labeled, stored in plastic bags and frozen. Approximately three replicates of each
specimen were collected. In laboratory, plants samples were washed with tap water and cleaned
with a small brush to remove potential aerial superficial mercury contamination. Roots, stems
and leaves were analyzed separately. Wet materials were used to obtain total mercury
concentrations in plant parts. Plant samples water content percentages were utilized to
transform wet weight concentration to dry weight concentration.
Individual and composite substrate (soil and sediment) samples were collected with an
plastic shovel, labeled, and stored in plastic bags. Composite samples were obtained mixing sub-
samples in the plastic bags.
To evaluate the relationship between the mercury contamination in soil and plants,
single variable regressions were performed, using natural-log transformed of mercury
concentration in both soil and plants prior to regression analyses (BJC, 1998). Measurements of
Hg concentrations in plants and soils were compared among studies areas, plant types and
parts, and soil fractions (+200# and -200#), by t-test for independent samples and U Mann-
Whitney test (n 8) (Siegel, 1975).
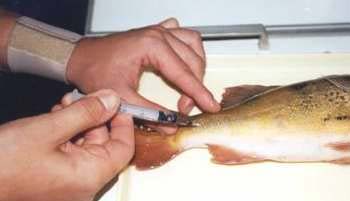
RT2004-004-01 CETEM/MCT 26
The estimate of total mercury weekly dietary intake were calculated by the product of
the upper-bound range of mercury concentration (Cplant) obtained in edible plant parts and the
consumption rate (CR) of those foodstuffs (HgI = Cplant x CR).
Produce plants identifications were obtained from the Brazilian Ministry of Agriculture,
while wild plants were identified by Dra. Rafaela Campostroni Forzza from the Instituto de
Pesquisas Jardim Botanico do Rio de Janeiro.
Quality assurance/quality control (QA/QC) concerns were addressed through the use of
analytical duplicates. Analytical duplicates were included with each sample, and duplicate
analyses for each sample were checked to assure that the relative percent difference between
duplicates was no greater than 10%.
Fish samples were collected usually by gill-netting, fishing line with a fish-hook and
fishing line with several hooks ("espinhel"). After fish caught, still alive, the blood was drawn
by caudal puncture with a EDTA containing syringe (Figure 6). All specimens were subjected to
blood collection, while just for 60 specimens the collection was successful. The total blood was
kept in Eppendorf tubes and haematological exams were performed. In the field, the manual
methods for counting erythrocytes were performed as the same time as the total leukocyte
count. Smears, two slides per individual, were prepared from fresh and without anticoagulant
substances blood, air dried, fixed in methanol, and stained with Giemsa's solution. The
hematocrit (or globular volume) was performed by microhematocrit method, using small
capillary tubes, which were filled approximately two-thirds full with anticoagulated blood and
centrifuged. The percentage of packed cells to total volume is determined by direct
measurement.
After blood collection, each specimen was weighed (Wt), and its length (Lt) was
measured at the time of collection. After removing the individual axial muscle (fillet) each
sample was placed in polyethylene bags and on ice as soon as possible, and frozen (Figure 7).
The samples were delivered to Mercury lab at CETEM to carry out the total Hg measurement in
the axial muscles of fish.
Figure 6 - Fish blood collection by caudal puncture.

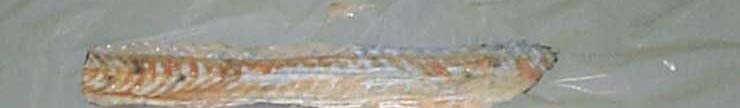
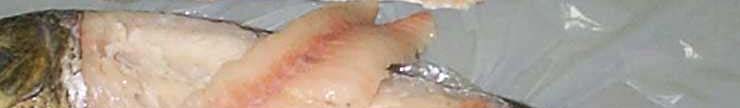
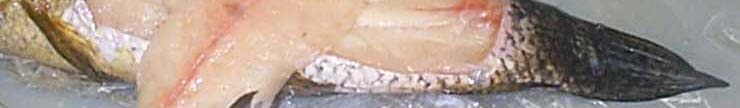

RT2004-004-01 CETEM/MCT 27
Figure 7 - Individual axial muscle (fillet) of fish
4. Results and Discussion
A sampling campaign was conducted in August 2003, at two study areas: Săo Chico and
Creporizinho mining areas. Table 1 shows the study sites in each area. These areas are located
inside of the Tapajós Gold Mining Reserve, State of Para, between the cities of Jacareacanga and
Itaituba, where the mining sites are distributed alongside the tributaries of the Tapajós River.
However, these two areas belong to two distinct hydrographic basins: Jamanxin river basin and
Crepori river basin, respectively.
For correlation purposes, results of Hg in sediments and fish are presented according to
11 study sites, A1 to A11, while site A1 has been used exclusively for fish sampling (Table 1).
Table 1 - Study sites in Săo Chico (A1-A4) and Creporizinho (A5-A11) study areas
Study
Site
A1
Flooded open pit, clear water, near to Conrado River
A2
Săo Chico Reservoir
A3
Flooded open pit, mining wastes, high turbidity, near Rosa stream, sandy area
A4
Inflow Conrado River to Novo River
A5
Papagaio mining site; stream with high turbidity
A6
Flooded open pit at Tabocal mining site
A7
Flooded open pit at Bofe mining site
A8
Tolentino mining site
A9
Porto Alegre site in Crepori River, upstream of Creporizăo village
A10 Inflow of clear stream to Crepori River
Inflow of Chico Chimango, a clear water stream, near the inflow of Creporizinho
A11 River to Crepori River
RT2004-004-01 CETEM/MCT 28
4.1 Săo Chico
In Săo Chico, located at km 51 on the Transgarimpeira, the main mining aera lies at the
slope of a valley, between the village (see also report of Armin Mathis, July 2003) and an dam
reservoir, which supplies the pumps for mining and milling activities with water (Figure 2).
In the same process material from primary deposits is mixed with residues of former
mining activities and milled. The gold is concentrated on mercury coated copper plates. Samples
were taken (see detailed list) in and around this aera, in the village as well as in the drainage
basins nearby and remote, including samples from Jamanxim, Rio Novo and Conrado, in which
via igarapé Săo Chico and Sta. Rosa the mining area is drained.
From the beginning of the very first gold mining activity in 1963, the Săo Chico village
has shown two main periods os prosperity, one in the end of the 80´s after the opening of the
Transgarimpeira road, and other in the end of the 90´s, when gold rich primary deposits were
discovered. According to cross-checked estimations, about three tons of gold were produced
from the beginning of the gold rush, corresponding to an estimated mercury emission of 7.5 tons
to the environment. Since the primary gold ore has been crushed in hammer mills and directly
amalgamated in copper plates, and no retorts have been used, the estimated Hg:Au
(lost:produced) emission ratio is about 2.5 for this type of operation.
Nowadays, exploitation of primary gold ore is over, being gold production in Săo Chico
almost restricted to the reprocessing of tailings produced during the 80´s, when alluvial and
laterite deposits (baixőes) were worked using just sluice box for gravity concentration, without
crushing. Tailings are now being concentrated through sluice boxes while the concentrate
follows the same processing circuit as for the former primary ore, while mercury is widely used
in both mineral processing steps, gravity concentration and amalgamation. Mercury emission
ratio becomes therefore even higher, since "old" mercury is mixed with "new" mercury.
This typicall artisanal mining site can be briefly characterized as follow:
- Actually there is not too much prospective work. All activities are based on reprocessing
the old tailings. Each processing plant operates with hydraulic monitors, 4 inches
diameter, pumping very diluted pulp (around 5 10% solids) to carpeted sluice boxes.
-
Gold production in 2003 was informed to be about 1.10 1.20 kg/monthly, so far.
- Hammer mills operate circa 10 hours daily (7 am to 5 pm) showing typical dimensions of
30 x 45 cm, being common to generate particles < 2 inches. Depending on the opening
chamber mills, processing capacity can vary from 1 ton/hour to 2 ton/hour.
- After milling, all particulate material is repulped again with plenty of water and fed up
to the amalgamated copper plates (sizes corresponding to about 600 x 2000 mm, width x
lenght).
- Those devices are not expensive being informed that the whole set (hammer mill and
amalgamated copper plates) would cost circa 100 grams of gold.
- Mercury use was informed to obey a traditional ratio used in such region corresponding
to 2 4 kg Hg : 1 kg Au produced for both methods, using copper plates and gravity
concentration.
- If concentrates are amalgamated, the main Hg emission source derives from amalgam
burning in open pans. This operation, normally, produces a gold doré that contains 2 to
RT2004-004-01 CETEM/MCT 29
5% residual Hg. When the doré is melted at gold shops, most commonly located in urban
areas, further release of mercury vapors takes place.
- When gravity concentrates are amalgamated, the mineral portion is separated from
amalgam by panning, forming a tailing that is usually dumped into a stream generatting
a "mining hotspot". Panning is usually done in water-boxes or in pools excavated in the
ground or at creek margins. Hg excess is removed by squeezing it through a piece of
fabric and is generally recycled.
- Since the estimated ratio Hglost : Auproduced is 2.5 for processing plants using copper plates
and 1.5 for gravity concentration, the average ratio for this area is 2.0.
- Processing techniques practiced consist in to reprocess old tailings that resulted from the
"fofocas" ages (that means, from 1999-2001), when there was a greater activity, which
enabled garimpeiros to produce about 2000 kg over such period.
4.1.1 Săo Chico reservoir and creek (sampling site A2)
The Săo Chico Creek was dammed up in 1989 at the end of a narrow valley, located
around Săo Chico village forming a reservoir (Figure 2) for supplying the mining site with water
to carry out mining activities. Water covers an area of approximately 50 to 150 m width to 700 m
length (85,000 m2 surface) with an overall depth of less than 5 meters only. Outflow from this
reservoir (during dry season) amounts to less then 5 liters/second.
The small Săo Chico Creek, about 1 meter wide and only a few centimetres deep (Figure
5), having its source at Sao Chico reservoir, drains the mining site and the village. Very clear
water could be observed during the survey campaign, indicating a low intensity of mining
activity.
Since 1989, tailings from both amalgamation and cyanidation activities have been poured
into the reservoir. Due to lack of stream and turbulence nearly all of this material, in particular
suspended load, entering the reservoir could settle down and accumulate. A very small outflow
with nearly clear water feeds the Săo Chico creek, which drains the entire mining site and flows
through Conrado River, Novo River and Jamanxim into the Tapajós River.
A total of 17 composite samples (tailings mixed with sediments - including settled
suspended load) were taken from reservoir bottom and margins. In general, sediments comprise
sand and silt, covered with a thin layer (< 5 mm) of clay or suspended load and abundant
organic matter.
Close to amalgamation wastes and to the former cyanidation plant Hg levels reach an
Igeo class 6, while samples collected in other parts of the reservoir concentrations decrease to
Igeo classes from 3 to 5, which are still very high considering that these samples were composed
of organic-rich clayey sediments, not directly influenced by amalgamation wastes (Figure 8).
Since Hg concentrations in sediments and tailings have been transformed into Igeo
classes throughout the present report, a table containing all data of Hg concentrations is
presented in Appendix 1.
RT2004-004-01 CETEM/MCT 30
7
Close to Cyanidation Plant
Close to amalgamation wastes
Distance from Hot Spot (E-W)
IGEO
(Hot Spot)
(Hot Spot)
0-------------------------------> 400
Hg
6
5
4
3
2
1
0
A217 A248 A249 A250 A251 A252 A246 A247 A253 A231 A241 A242 A243 A244 A245 A254 A255
Figure 8 Distribution of Igeo Classes of Hg in sediments (< 74 µm) of the Săo Chico
Reservoir
According to the present results, the estimate of 7.5 tonnes of mercury released into the
environment is consistent. High mercury levels were found not only near amalgamation
tailings, which are mining hotspots with up to 300 µg/g of Hg, but also associated with
suspended solids inside the reservoir and up to 1 km downstream, as indicated by the high Hg
levels averaging an Igeo class 4 along the Săo Chico Creek. Among the 15 TSS samples collected
along the creek, up to 800 m from the main tailing deposit, there is no decreasing pattern of Hg
concentrations from the main source (Figures 9 and 10). This is an indication that the mercury
load released in Săo Chico is becoming mobile and prone for transportation either in solution or
onto suspended particles downstream.
Moreover, a total of two water samples collected downstream from the main source, in
the Conrado River and Jamanxim River, present slightly higher Hg concentrations in the filtered
phase, averaging 1.25 µg/L, than the limit, of 1 µg/L for drinking water established by the
Brazilian Ministry of Health. It is to be highlighted that Hg concentrations in water samples
from gold mining sites generally fall in the range from 0.10 to 2.80 µg/L (Rodrigues-Filho and
Maddock, 1997).
A possible explanation for this particular mercury behaviour in Săo Chico, associated
with suspended particles, is due to the introduction in 2001 of cyanidation by heap leaching
from amalgamation tailings which was undertaken at the margin of the dam reservoir situated
upstream of the main mining site in Săo Chico, the so-called Montanha. Therefore, the formation
of cyanide-mercury complexes into the reservoir could be responsible for increasing mercury
mobility downstream. An additional factor that likely enhances Hg mobility is due to pasture
fires close to amalgamation tailings.
RT2004-004-01 CETEM/MCT 31
6
Distance from Hot Spot in Săo Chico Creek, W - E
Igeo
50 -200 m
500 m
650 m
900 m
1250 m
Hg
5
4
3
2
1
0
A234 A235 A236 A237 A238 A239 A240 A232 A233 A269 A270 A271 A272 A273 A274
Figure 9 Distribution of Igeo Classes of Hg in sediments (TSS) of the Săo Chico Creek up
to 1.25 km downstream
The cyanidation attempt of amalgamation tailings together with the physical and
chemical features of the dam reservoir, a semi-closed aquatic system with high organic contents
in sediments and anoxic conditions in the botton, make this environment a promising field
opportunity for a better understanding of the behavior of mercury in aquatic systems together
with cyanide.
Table 2 shows the physiochemical parameters in the water column of the Săo Chico
reservoir, which are consistent with usual water parameters of Amazonian rivers, with neutral
pH and very low electrical conductivity (low salinity). Lower values of dissolved oxygen are
due to anoxic conditions in the botton of the reservoir. Those physiochemical conditions are
favourable to the stability of elemental mercury. Thus, one may realize that further factors are
responsible for Hg mobility in this aquatic system, such as biochemical processes through
microbiological activity and/or anthropogenic ones, among which the cyanidation attempt and
forest fires are to be highlighted.
Veiga et al. (1994) indicated the significant role that deforestation plays among the most
important emission sources of Hg in tropical countries, where forest fires are contributing to
increase Hg emissions worldwide through the release of Hg baselevels present in biomass.
Accordingly, another important factor contributing to Hg mobilization in Săo Chico is
likely to be related to forest fires yearly practiced for cleaning up pasture throughout the study
area, as it could be observed during the sampling campaign (Figure 10), when the surrounding
pasture close to the reservoir and tailings has been burned three days long. The sudden
elevation of the soil temperature is likely to be very effective in releasing Hg from mining
hotspots in soils to the atmosphere, thus enhancing its mobility. The area impacted by fires in
pasture is also visible from the satellite image in detailed scale of Săo Chico mining site (Figure
11).
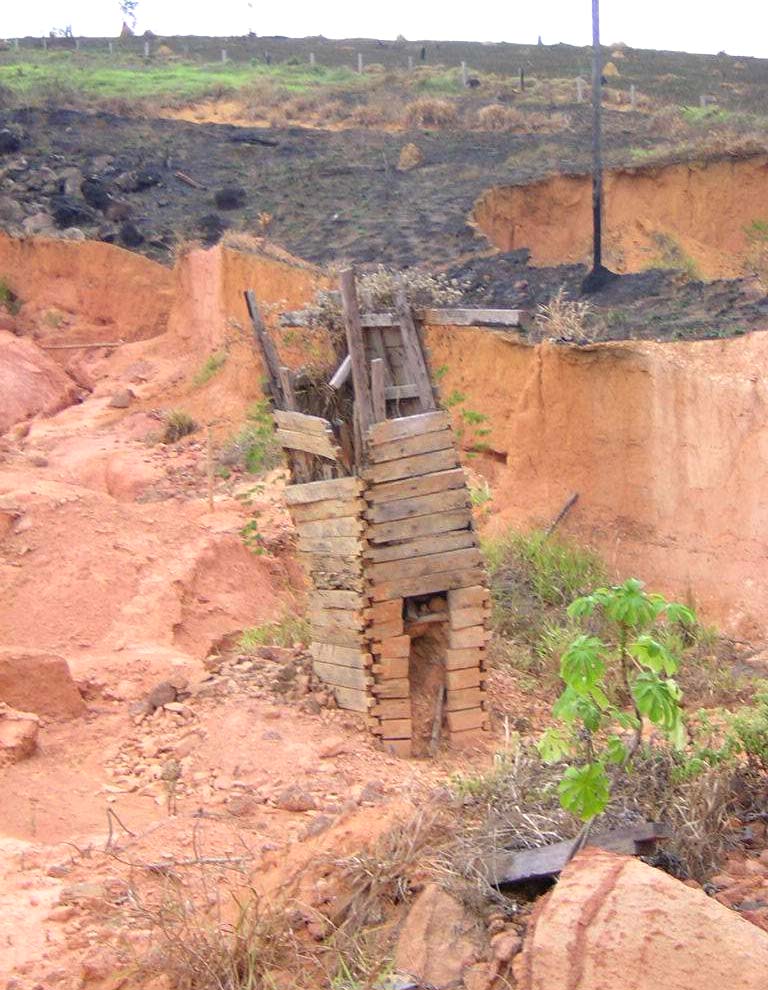
RT2004-004-01 CETEM/MCT 32
Table 2 Physiochemical parameters in the water column Săo Chico reservoir
Conduct.
Temp
Sample-Nr. pH
DO
(mg/l)
Depth (m)
(µS/cm)
(°C)
W 1
5.1
5.71
114
29
0.5
W 2
5.1
7.62
142
28
0
W3 6.1
7.60
163
28
0
W4 6.2
7.61
113
28
0
W5 6.5
4.82
163
30
1
W6 5.1
5.75
105
29
1
W7 6.0
2.48
204
27
1
Figure 10 Former shaft in Săo Chico with burned pasture
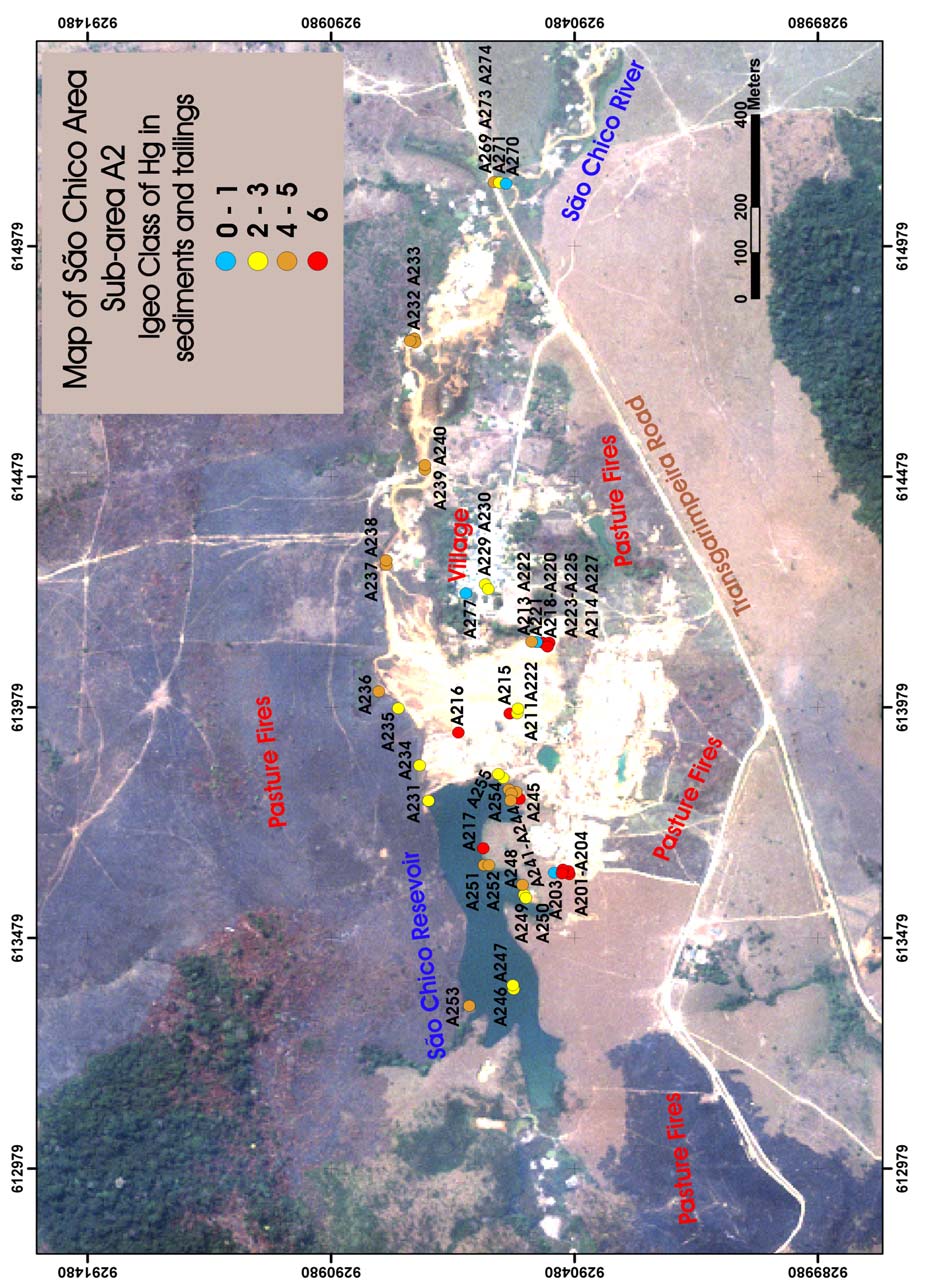
RT2004-004-01 CETEM/MCT 33
Figure 11 Distribution of Igeo classes of Hg in the vicinities of the Săo Chico Village
(Hg hotspots in red dots) and marks of pasture fires
RT2004-004-01 CETEM/MCT 34
4.1.2. Mining area (tailings pile and open pit site A2)
Between lake and village, the valley floor is covered by mining tailings, extending
through an area of approximately 50.000 m2 with an average thickness of 5 meters, coming from
prior alluvial processing and former mining activities in primary ore veins from magmatic,
partially weathered rocks. This tailings pile has been deposited during a period of some 40
years.
A total of 38 composite samples of tailings from this part of the mining area were taken.
In general, material comprises silt and sand, due to former grinding procedures, mainly of red
colour, origin from Fe-oxides and hydroxides from lateritic soil. Following a typical
heterogeneous in tailings, Hg levels in this site confirm the occurrence of a mining hotspot,
reaching concentrations of up to 300 µg/g, or a maximum Igeo class 6 (Figure 12).
6
IGEO
Hg
5
4
3
2
1
0
A201
A202
A203
A204
A211
A212
A213
A214
A215
A216
A217
A218
A219
A220
A221
A222
A223
A224
A225
A226
A227
Figure 12 - Distribution of Igeo Classes of Hg in tailings (< 74 µm) of the Săo Chico mining
site
An open pit, comprising an area of about 60.000 m2, located at the northern slope of the
valley, represents a typical primary gold-ore deposit, as it is recently observed in the Tapajós
Gold Mining Reserve (Figure 13). Superficial lateritic soils got removed in the range of 2 to 10
meters in order to provide access to gold-bearing quartz-veins. Several shafts, up to 20 m deep
(Figure 10) have been dug, trying to follow the inclined quartz veins. Hammer mills and Hg
coated copper plates were placed and constructed in situ. At the eastern margin a very crude
cyanidation plant was constructed (Figure 14), operating from 1999 to 2001. Amalgamation
tailings and other wastes were poured into Săo Chico reservoir during this period of time. In
general, material comprise silt and sand, due to origin from lateritic soils and weathered rock,
mainly of red and yellow colour, origin from Fe-, Mn-, and Al-oxides and hydroxides.
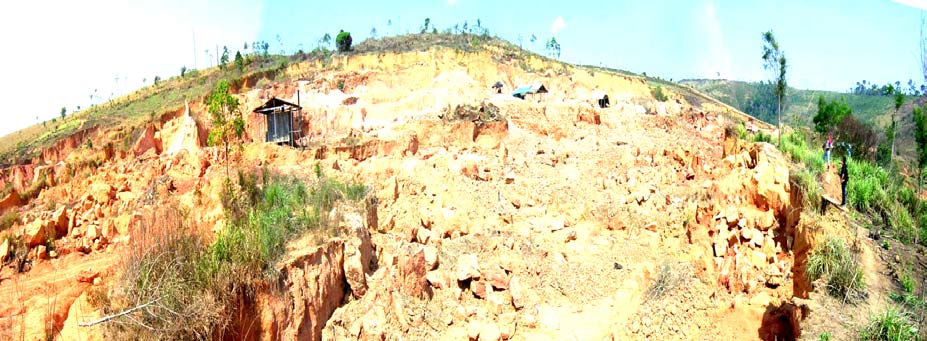
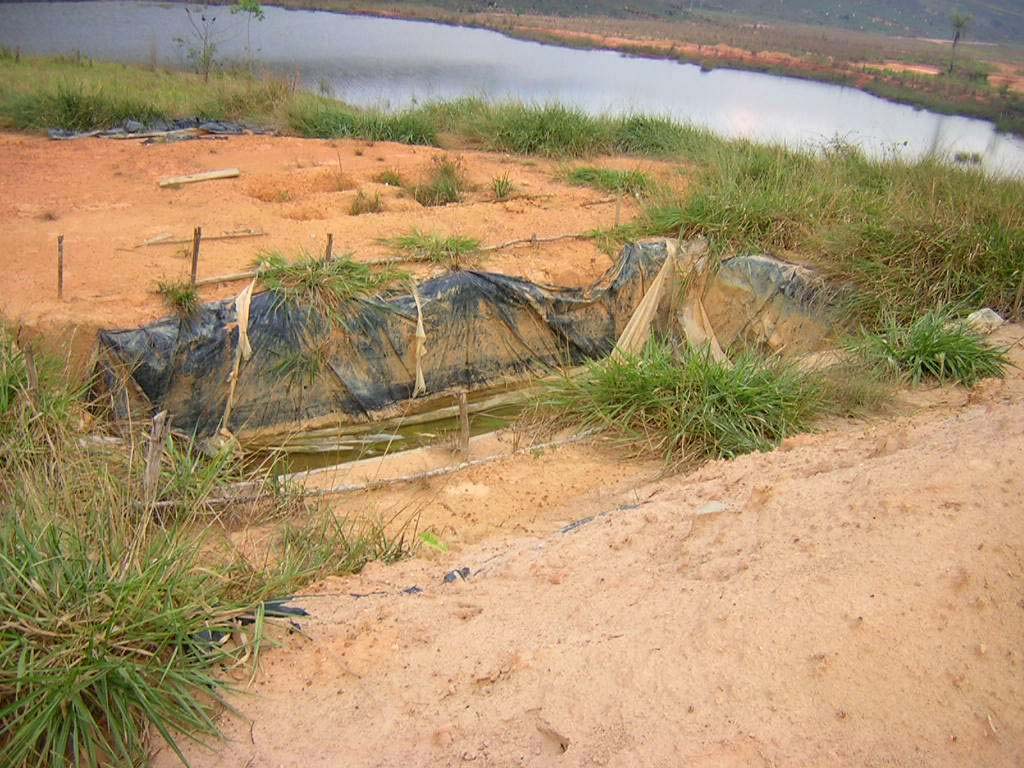
RT2004-004-01 CETEM/MCT 35
Figure 13 Panoramic view of the open pit in Săo Chico
Figure 14 A former cyanidation heap leaching close to the reservoir
The general distribution of Igeo classes of Hg in sediments, soils and tailings throughout
the study site A2, in a detailed scale, is presented from a satellite image of the study area. It is to
be highlighted the occurrence of Hg hotspots represented by the red dots (Figure 11).
RT2004-004-01 CETEM/MCT 36
4.1.3. Surrounding area and Conrado River (sampling site A3)
In the immediate vicinity of Săo Chico village, 4 km downstream, there are some small
active and abandoned garimpos along the Conrado River and its creeks little mining activity
could be observed during the field survey period in July/August 2003. Predominately tailings of
past mining activities are reprocessed in those areas, while Hg levels in those tailings are
moderately high, averaging an Igeo class 3 (Figure 15).
However, close to this site, some "virgin" areas along the Rosa Stream, without any
recent and past mining activities were encountered well suitable for determination of natural
background of mercury in sediments and soil. A sediment core, divided into 6 sections, was
taken in the bed of the small clear water bearing brook in the forest area, where obviously no
former mining activity have been taken place. Sediment consists of nearly pure grey clay with
some organic matter, like rotten leaves.
The sediment core was 30 cm deep and revealed that Hg levels decreases in depth. The
lowest background values of the 200Mesh fraction (< 74 µm) was around 0.15 µg/g in the
lowest 15 cm, corresponding to an Igeo class 0, and up to 0.84 µg/g at the surface, or Igeo class 2
(Figure 14). This probably a result of the contribution from atmospheric Hg released from
anthropogenic sources. It has been assumed that the lowest section of the core, samples A305 to
A307, represents the Hg background level of this region (around 0.15 µg/g), since this
procedure has been successfully adopted elsewhere (Rodrigues-Filho et al, 2002; Rodrigues-
Filho and Maddock, 1997).
5
Sediment Core
Conrado River
IGEO
Virgin Area (Rosa Stream)
4 Km dow nstream from Hot Spot
Hg
4
3
2
1
0
A301
A302
A304
A305
A306
A307
A308
A309
A310
Figure 15 - Distribution of Igeo Classes of Hg in sediments (< 74 µm) of the Conrado River
and in a sediment core (Rosa Stream)
RT2004-004-01 CETEM/MCT 37
4.1.4. Săo Chico Village
Although a less intense activity of amalgam roasting could be observed in the village of
Săo Chico during the sampling campaign, presently just one gold shop is in operation, dust and
soil are sought to be efficient indicators of atmospheric Hg contamination.
The maximum Hg concentration (1,280 µg/g) corresponds to an Igeo of 12 and was
found in a sample of spider web collected inside the gold shop of the village, where no
exhausting system exists. The others samples, composed of dust, have been collected inside
houses of its immediate neighborhood. Since all of then present extremely high Hg levels, with a
minimum Igeo of 6, it is suggested the need of urgent measures towards the protection of the
population´s health (Figure 16).
14,00
Spider Web
IGEO
Hg 12,00
10,00
8,00
6,00
4,00
2,00
0,00
A256
A257
A258
A259
A260
A261
A262
A263
A264
A265
Figure 16 Distribution of Hg Igeo in dust and spider web samples from Săo Chico village
4.1.5. Remote drainages (site A4)
Săo Chico Creek flows into Conrado River, 2 km downstream from the village, where its
water gets mixed with drainage from other mining sites, showing high turbidity. The entire
region is drained by the Conrado River, Novo River (15 km from the village) and Jamanxin
River (20 km from the village)(Figure 17).
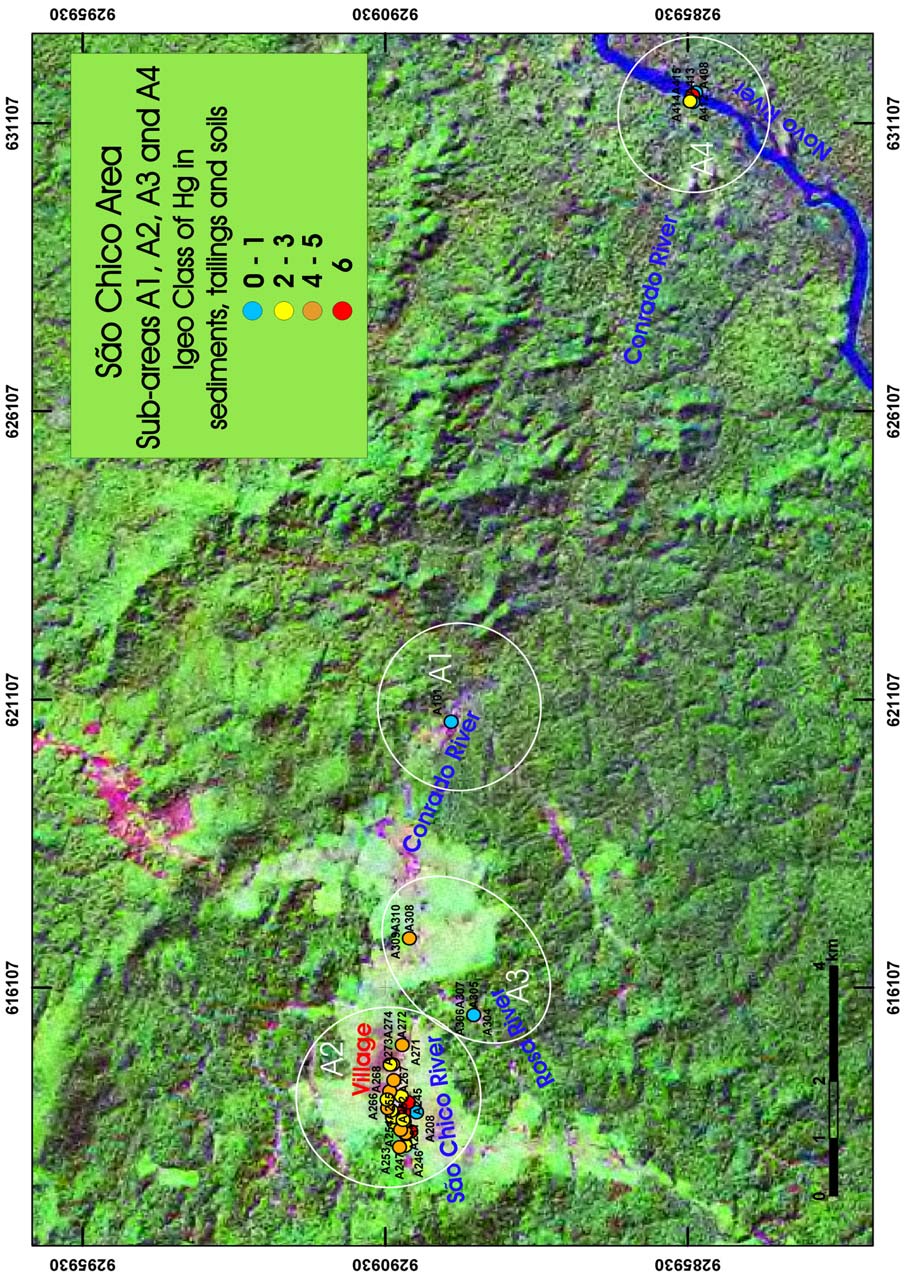
RT2004-004-01 CETEM/MCT 38
Figure 17 Regional distribution of Igeo classes of Hg in sediments, tailings and soils from
Săo Chico mining site and surrounding areas
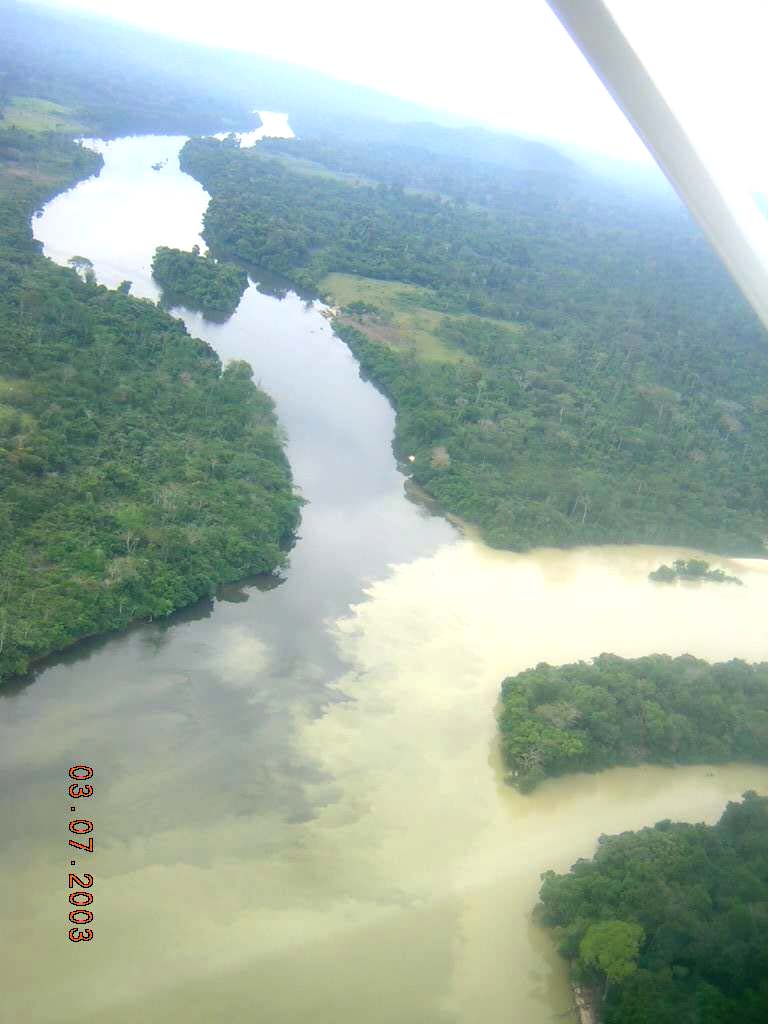
RT2004-004-01 CETEM/MCT 39
A total of 15 composite sediment samples were taken from the Conrado River, Novo
River and Jamanxin River, in order to evaluate to which extension the Hg load released from
Săo Chico is influencing the sediment chemical composition downstream. In general, sediments
comprise a thin layer of settled suspended load and organic matter covering riverine deposits in
overbanks and riversides.
Since the main contribution in terms of Hg emissions to the Novo River comes from the
Săo Chico region, showing its high turbidity (Figure 18), one may realize that due to its
indicated association onto suspended particles, Hg released from Săo Chico is prone to be
transported downstream up to a distance at least as long as 20 km, as indicated by results
reaching Igeo classes 6 and 4 (Figure 19).
Figure 18 Mouth of the Novo River to the Jamanxin River
RT2004-004-01 CETEM/MCT 40
7
6
5
4
3
2
1
0
A401 A402 A403 A404 A405 A406 A407 A408 A409 A410 A411 A412 A413 A414 A415
Figure 19 - Distribution of Igeo Classes of Hg in sediments (< 74 µm) of surrounding
drainages (up to 20 km downstream site A4)
A general distribution of Igeo classes of Hg in sediments, tailings and soils throughout
the whole Săo Chico area is presented, in a regional scale, from a satellite image of the study
area. It is to be highlighted the occurrence of significantly high Hg levels associated with fine
sediments (< 200#) up to 20 km downstream from the Săo Chico mining area, in the site A4
(Figure 17).
4.2. Creporizinho area
Creporizinho is a typical gold mining village with 238 wooden residences for an
estimated population of 1000 inhabitants. There are grocery shops, pharmacies and a hotel.
Electricity is based on diesel engines. The 200 children go to a primary school, where 5 teachers
are working. Gold is bought at any corner.
In Creporizinho, located at km 145 on the Transgarimpeira, the Tolentino mining area
chosen for sampling is located about 5 to 10 km NNW from the village and represents 3 different
types of small scale gold mining activities: inactive alluvial deposits (including rework of former
tailings and residues) explored by hydraulic monitor (garimpo de baixăo), lateritic deposits
explored through open pit and primary deposits explored through open pit or shaft (garimpo
de filăo). Samples were taken in and around this area, in the village, as well as in the drainage
basins nearby and remote, including samples from Rio Crepori, Creporizinho, waterbodies in
abandoned open pits and the draining igarapés.
RT2004-004-01 CETEM/MCT 41
4.2.1. Papagaio and Areal (site A5)
From 10 to 15 kilometres in southeastern direction from Creporizinho village lies the
mining area of "Luis Preto", comprising the Garimpos Papagaio (Figure 3) and Areal where
alluvial gold has been mined and from the middle of the 90´s exploration of primary ore began,
more or less successfully. Nowadays, alluvial mining is very rare, mining of lateritic soil,
primary ore and reworking of residues and tailings from former mining activities became
common all over the area.
In the Papagaio mining site, primary ore from open pits and from shafts is extracted,
transported to the processing unit, located on top of a hill, where material gets ground and
amalgamated over mercury-covered copper plates. In the neighbouring site Areal, prevailing
mining activities concentrate on reprocessing of tailings and residues mainly located along
recent or past courses of creeks or small rivers. Amalgam is usually roasted locally.
A total of 30 composite samples (residue, sediments and soils) from this part of the
mining area were taken. In general, material comprise silt and sand, due to origin of grinding
activities from lateritic soils and weathered rock, mainly of red and yellow colour, origin from
Fe-, Mn-, and Al-oxides and hydroxides.
Except samples from amalgamation wastes (mining hotspots), A510 to A518 in Papagaio
and A521, A522 and A531 in Areal, which show very high Hg concentrations, the general
distribution of Hg throughout both Creporizinho mining sites indicates an expressive lower
level of Hg contamination, comparing with the ones from Săo Chico (Figure 20).
7
Papagaio (sediments)
Papagaio (tailings)
Areal
IGEO
Hg
6
5
4
3
2
1
0
A 501 A 502 A 503 A 504 A 505 A 506 A 507 A 508 A 509 A 510 A 511 A 512 A 513 A 514 A 515 A 516 A 517 A 518 A 519 A 520 A 521 A 522 A 523 A 524 A 526 A 525 A 527 A 528 A 529 A 531
Figure 20 - Distribution of Igeo Classes of Hg in sediments and tailings (< 74 µm) of site A5
RT2004-004-01 CETEM/MCT 42
4.2.2. Tabocal (A6) and Bofe (A7)
The mining sites Tabocal (A6) and Bofe (A7) present a similar picture in terms of mineral
processing techniques and waste disposal as in Papagaio (A5). Nevertheless, Hg levels in
sediments and tailings are significantly lower in A6 and A7 than in A5, indicating either less
intense Hg losses or a lower mobility of Hg from a given mining hotspot, resulting in Igeo
classes close to the background, except for 3 samples reaching the Igeo class 4, revealing a low
degree of Hg contamination in inorganic samples (Figures 21 and 22).
6
IGEO
Hg
5
4
3
2
1
0
A602
A603
A604
A605
A606
A607
A608
A609
A613
A614
A617
Figure 21 - Distribution of Igeo Classes of Hg in sediments and tailings (< 74 µm) of site A6
6
IGEO
Hg
5
4
3
2
1
0
A701
A702
A703
A704
A705
Figure 22 - Distribution of Igeo Classes of Hg in sediments and tailings (< 74 µm) of site A7
RT2004-004-01 CETEM/MCT 43
4.2.3. Tolentino (A8) and remote areas (A9 to A11)
Tolentino mining site (A8) is located circa 5 km in southeastern direction from
Creporizinho, on the way to Papagaio. This is the only garimpo visited in Creporizinho area,
which works with "modern" equipment, as it was being used successfully in Poconé for years,
like ball mills and centrifuges (Figure 4). The majority of processed material comes from primary
ore deposits, extracted from gold-bearing quartz veins in magmatic rocks in the nearby
surroundings and transported by trucks to the processing unit, while amalgamation is applied
to gravity concentrates. Only a smaller part of the gold production comes from secondary
material, both, lateritic soils and tailings, resulting from former mining activities in the entire
area.
A total of 12 composite samples of sediments mixed with tailings from this site were
taken. In general, material comprises silt and sand, due to former mining procedures, mainly of
red color, origin from Fe-oxides and hydroxides from lateritic soil.
Although one single sample reached Igeo class 6, the whole data indicate an overall
situation in terms of Hg contamination less significant than in other areas considered in this
study (Figures 23 and 24).
6
IGEO
Hg
5
4
3
2
1
0
A801
A801
A802
A803
A804
A805
A806
A807
A808
A809
A810
A811
Figure 23 - Distribution of Igeo Classes of Hg in sediments and tailings (< 74 µm) of site A8
Sampling sites A9 and A10 represent the so-called Porto Alegre site and the mouth of a
clear stream to the Crepori River, both located upstream of the investigated mining areas, but
downstream of other mining sites along the Crepori River (Figure 25). A similar picture in terms
of Hg contamination in inorganic samples, as in sites A6 and A7, is to be reported for A9 and
A10, where Igeo classes of Hg range from 0 to 4, being predominant values close to the
background, with Igeo classes from 0 to 1 (Figures 26 and 27).
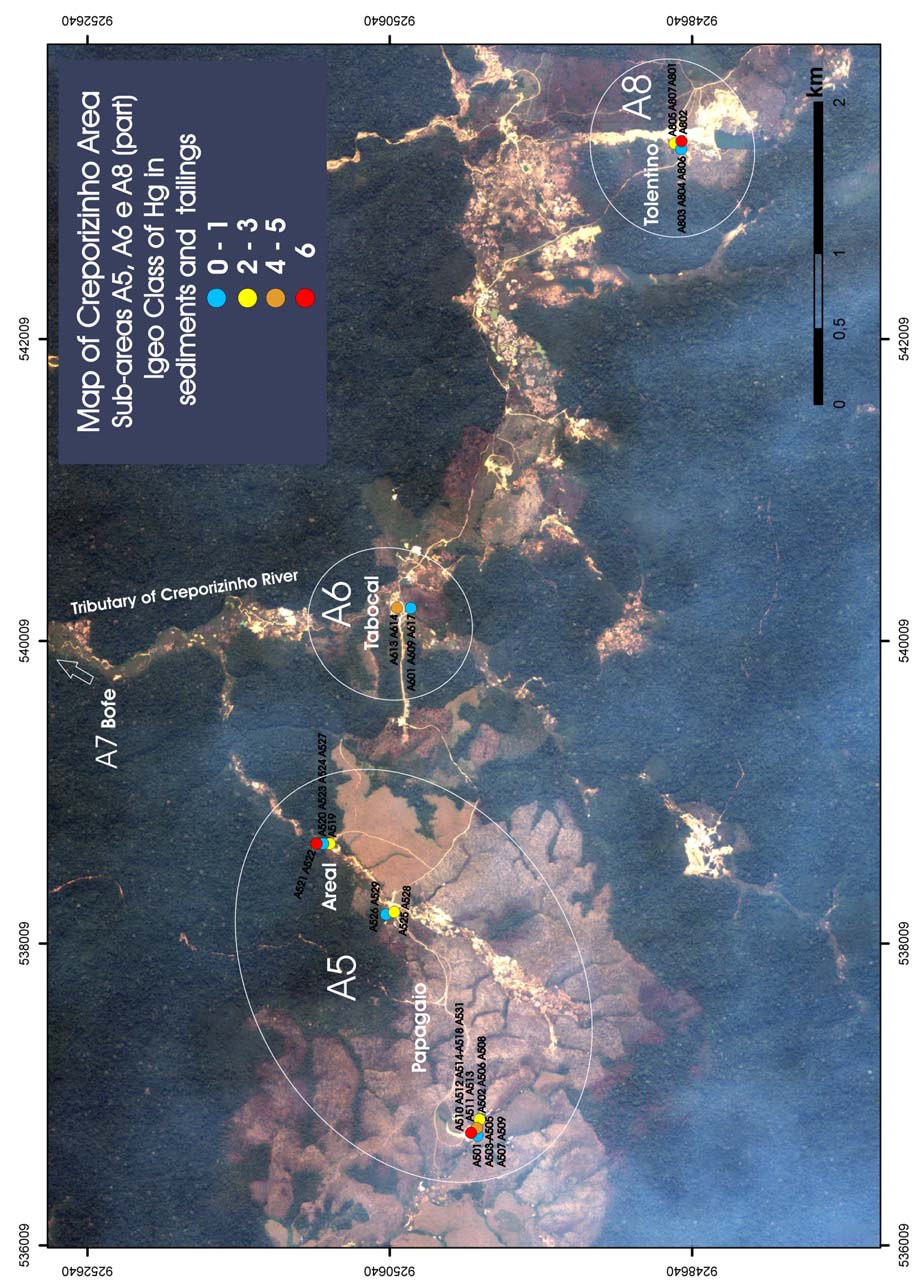
RT2004-004-01 CETEM/MCT 44
Figure 24 - Distribution of Igeo classes of Hg in the vicinities of the Creporizinho Village
(Hg hotspots in red dots)
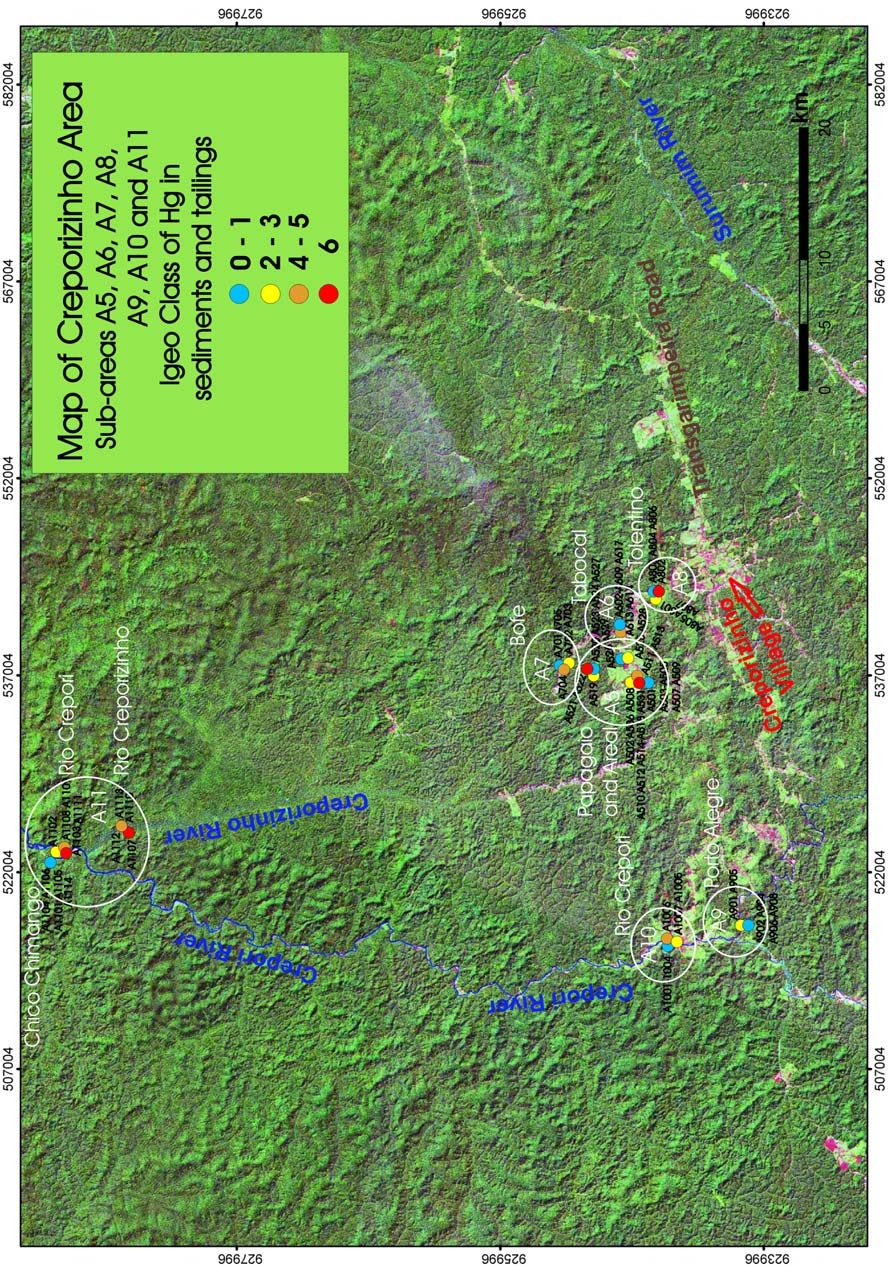
RT2004-004-01 CETEM/MCT 45
Figure 25 - Regional distribution of Igeo classes of Hg in sediments, tailings and soils from
Creporizinho mining site and surrounding areas
RT2004-004-01 CETEM/MCT 46
6
IGEO
Hg 5
4
3
2
1
0
A901
A902
A903
A904
A905
A906
A907
A908
Figure 26 - Distribution of Igeo Classes of Hg in sediments and tailings (< 74 µm) of site A9
6
IGEO
Hg 5
4
3
2
1
0
A1001
A1002
A1003
A1004
A1005
A1006
A1007
Figure 27 - Distribution of Igeo Classes of Hg in sediments and tailings (< 74 µm) of site A10
RT2004-004-01 CETEM/MCT 47
Sampling site A11 represents the most downstream area along the Crepori River, close to
the mouth of the Creporizinho River, which drains the mining sites of Papagaio (A5), Tabocal
(A6), Bofe (A7) and Tolentino (A8). This sampling site lies circa of 40 km from the mining sites
downstream (Figure 28).
A total of 9 water samples were collected in the Creporizinho and Crepori River. Their
results show Hg levels from 0.10 to 3.44 µg/L, averaging 1.55 µg/L, which is slightly higher in
the filtered phase than the limit, of 1 µg/L for drinking water established by the Brazilian
Ministry of Health. It is to be highlighted that Hg concentrations in water samples from gold
mining sites generally fall in the range from 0.10 to 2.80 µg/L (Rodrigues-Filho and Maddock,
1997).
Although among 9 sediment samples there are significant indications of Hg
contamination in fine sediments, as shown in Figure 33, indicating that Hg is being transported
onto suspended particles downstream, one may face in this case severe difficulties in tracing the
source of Hg. This difficulty is due to the existence of several mining operations throughout the
Crepori river basin. In contrast to the clear water Chico Chimango Creek, the high values of Igeo
classes are represented by the samples from both Crepori and Creporizinho River that drains
several mining sites not considered in this study.
7
Chico Chimango Creek
IGEO
Crepori River
Creporizinho River
Hg
6
5
4
3
2
1
0
A1101 A1104 A1105 A1106 A1114 A1102 A1108 A1109 A1111 A1103 A1110 A1112 A1113 A1107
Figure 28 - Distribution of Igeo Classes of Hg in sediments and tailings (< 74 µm) of site A11
Creporizinho has been a strategic important village in the Tapajós Gold Mining Reserve
since its foundation in 1962. The remaining 4 Gold shops, sharing turnovers of about 20 kg of
gold per month, are operating with crude and primitive facilities for burning of amalgam.
Vapour outlets exist in all of these shops, but none of them seems to work properly (Figure 29),
so, contamination caused by mercury is to be found inside the shops as well as outside in the
surroundings. Since during the past 40 years those types of shops were spread over the whole
village area, soils and dust collected in the village might be a good indicator for accumulation of
precipitated mercury.
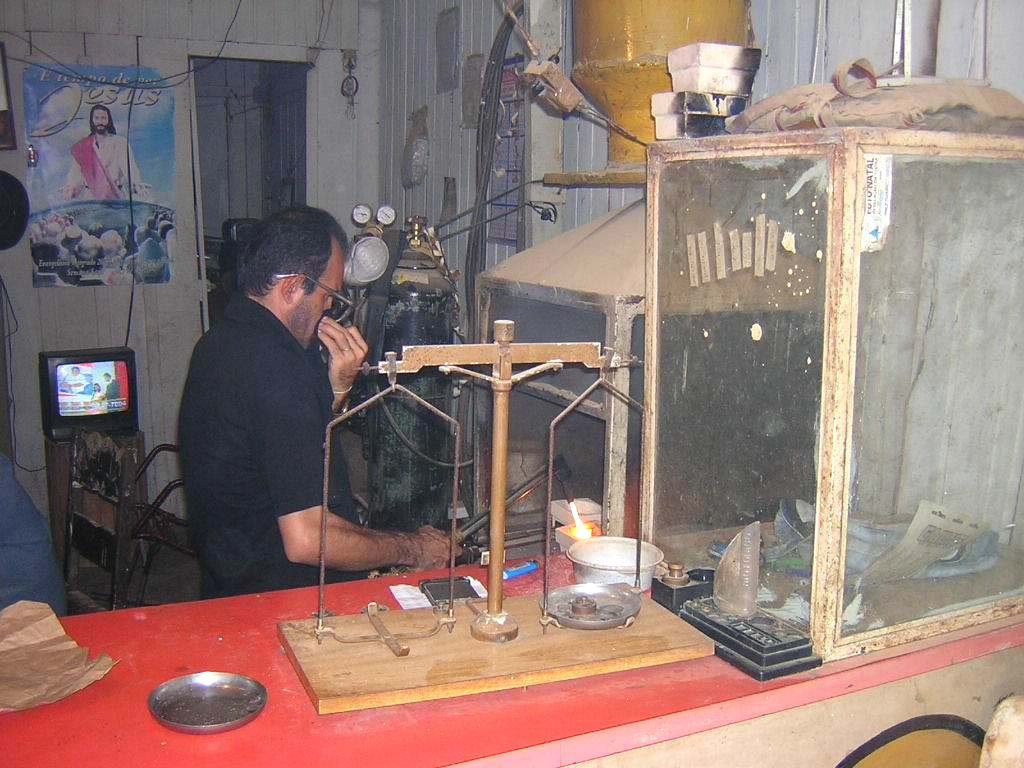
RT2004-004-01 CETEM/MCT 48
Figure 29 Gold shop in Creporizinho
The entire mining area around Creporizinho drains via small, partially unnamed watercourses
leading to Creporizinho River, which flows into Rio Crepori, then into Tapajós and via
Amazonas into Atlantic Ocean, in a distance of about 2,000 kilometres. Fine sediments are
originally rare along the clear water drainages, although significant turbidity could be observed
as a consequence of mining activities.
4.3. Mercury in Fish
Fish sampling was conducted in August 2003, at two study areas: at Săo Chico and at
Creporizinho mining sites or "garimpo" areas. These areas are located inside of the Mineral
Tapajós Reserve, State of Para, between the cities of Jacareacanga and Itaituba, where the mining
sites are distributed alongside the tributaries of the Tapajós River. These two areas belong to two
distinct hydrographic basins: Jamanxin river basin and Crepori river basin, respectively.
The absence of a consistent relationship between Hg concentrations in water, sediment
and various fish species, in general, illustrates the complexity and site-specific nature of mercury
bioaccumulation. Thus, direct Hg determinations in the local biota appear to be crucial to
adequately evaluating Hg sources, and, ultimately, the risk of the Hg exposure to human health
(Peterson et al.1996).
It was investigated the mercury levels in fish from all 11 sites: 4 in Săo Chico and 7 in
Creporizinho. A total of 234 fish specimens of 16 species were collected: 73 specimens belonging
to 13 species in Săo Chico and 161 specimens of 11 species in Creporizinho. A total of 7 common
species could be collected in both areas (acari, cará, curimată, mandi, piau, piranha and traíra).
Table 3 shows the popular and scientific names of species collected in the Tapajós region; their
food habits (FH), the number of specimens collected (n) in each site (A) and total number of fish
collected.
RT2004-004-01 CETEM/MCT 49
Table 3 - Study sites in Săo Chico (A1-A4) and Creporizinho (A5-A11) garimpo areas
Study
Site
A1
Flooded open pit, clear water, near to Conrado River
A2
Săo Chico Reservoir
A3
Flooded open pit, mining wastes, high turbidity, near Rosa stream, sandy area
A4
Inflow Conrado River to Novo River
A5
Papagaio mining site; stream with high turbidity
A6
Flooded open pit at Bofe mining site
A7
Flooded open pit at Baieta/Tabocal mining site
A8
Buriti mining site; recent flooded open pit, near to Creporizinho River spring
Porto Alegre site in Crepori River, upstream of Creporizaçăo village, with fluvial
A9
garimpo's areas
A10 Inflow of clear stream to Crepori River
Inflow of Chico Chimango, a clear water stream to Crepori River, near the inflow of
A11 Creporizinho River to Crepori River
Table 4 shows the popular and scientific names of species collected in the Tapajós region;
their food habits (FH), the number of specimens collected (n) in each site (A) and total number
of fish collected. In Appendix 3 there are some photos of fish sampling sites and fish collected.
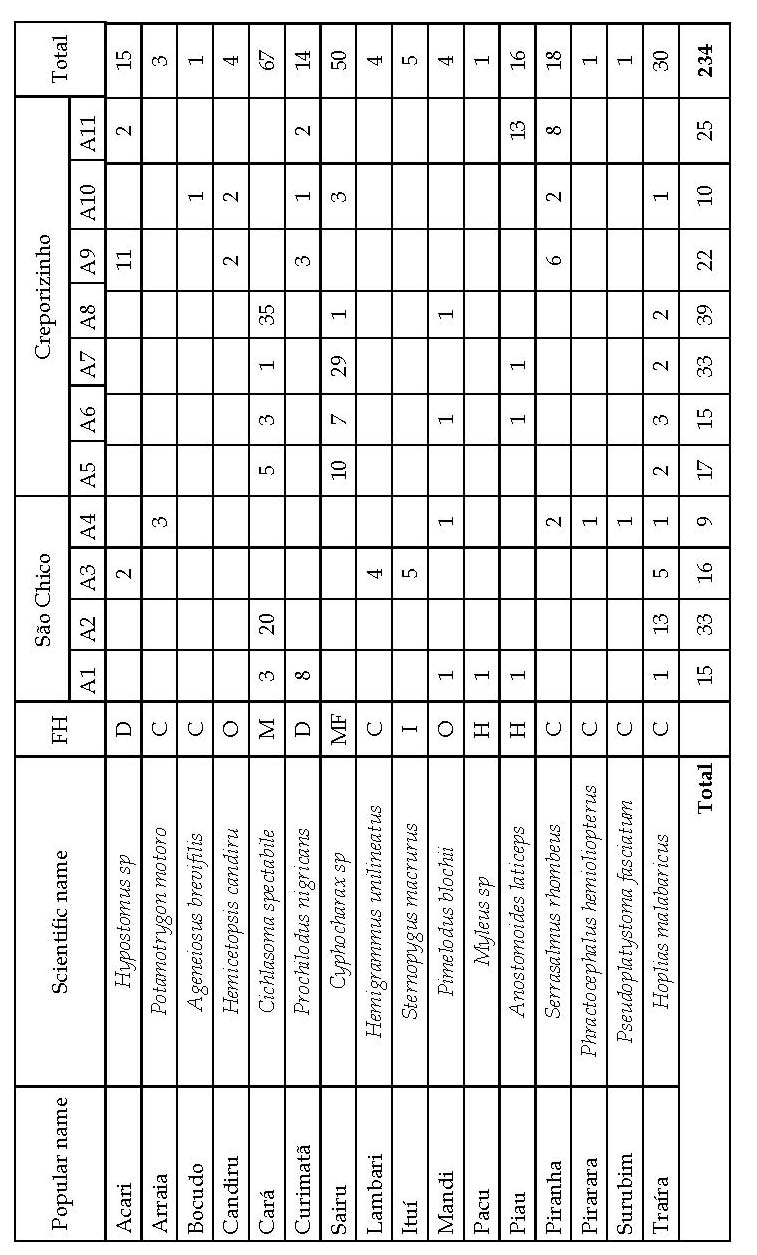
RT2004-004-01 CETEM/MCT 50
Table 4 - Popular and scientific names of species collected in the Tapajós river region; food
habits (FH), number of specimens collected (n) in each site (A) and total number of fish
collected
carnivorous and/or icthyophagous=C; herbivorous=H, insectivorous=I; microphagous=M;
omnivorous=O; macrofauna=MF
RT2004-004-01 CETEM/MCT 51
Fish samples were collected usually by gill-netting, fishing line with a fish-hook and
fishing line with several hooks ("espinhel"). Each specimen was weighed (Wt), and its length
(Lt) was measured at the time of collection. After removing the individual axial muscle (filet),
each sample was placed in polyethylene bags and cooled in ice box before being frozen for
transportation.
The results of total mercury in fish, length and weight from Săo Chico and Creporizinho
area are shown in Table 5.
Table 5 - Results of total Hg in muscles (wet weight), length and weight of fish from both
study areas (arithmetical mean and standard deviation)
Mercury
Length
Weight
Garimpo area
N
N
N
(µg/g)
(cm)
(g)
Săo Chico
73
2.53±3.91*
73
18.75±14.42*
32
934.3±1,681.7*
Creporizinho 161
0.36±0.33
161
11.62±4.86
49
191.8±186.0
Total 234
1.04±2.42
234
13.84±9.56
81
485.2±1,118,0
N= number of specimens. Student's t-Test; * p<0.0001
It is well known that freshwater biota is able to accumulate Hg from natural and
anthropogenic sources. Maximum background levels for Hg in uncontaminated freshwater fish
are in the range of 0.1 to 0.3 µg/g, although considerably higher levels can be found in large
predators. The mean concentration of Hg (1.04µg/g) in fish species from this work was similar
to that from species from some Amazonian rivers, mainly contaminated rivers (Lacerda &
Solomons, 1991; Akagi et al, 1994, Malm et al., 1996; Bidone et al., 1997; Castilhos et al., 1998;
Brabo, 2000). However, Săo Chico area has shown Hg levels in fish that are considered
abnormally high, comparing then with results from previous works. Among the analyzed fish,
82 specimens (35% of total sampled fish) from 6 species (37,5% of total 16 species collected)
presented Hg concentrations above 0.5 µg/g, the Hg concentration in fish recommended by
WHO (1990) as limit for human protection by Hg exposure by fish consumption. Whereas in
Creporizinho 22% of fish samples showed Hg levels above that limit, in Săo Chico this
percentage increases to more than 60%.
The results show that total mercury in fish from Săo Chico (Figure 30) is higher than in
fish from Creporizinho area (Student's t-Test; t=4,75; p<0.0001), Figure 31. Table 6 shows that the
minimum values for Hg in fish are similar between areas, but the maximum values are one
order of magnitude higher in Săo Chico than in Creporizinho area.
Table 6 - Results of total Hg in fish from both study areas (arithmetical mean ± standard
deviation and range -maximum and minimum values; wet weight)
Mercury
Garimpo area
N
Range
(µg/g)
Săo Chico
73
2.53±3.91
0.027-21.90
Creporizinho 161 0.36±0.33
0.025-2.10
Total 234
1.04±2.42
0.025-21.90


RT2004-004-01 CETEM/MCT 52
Figure 30 Mercury distribution in fish from different sites in Săo Chico area
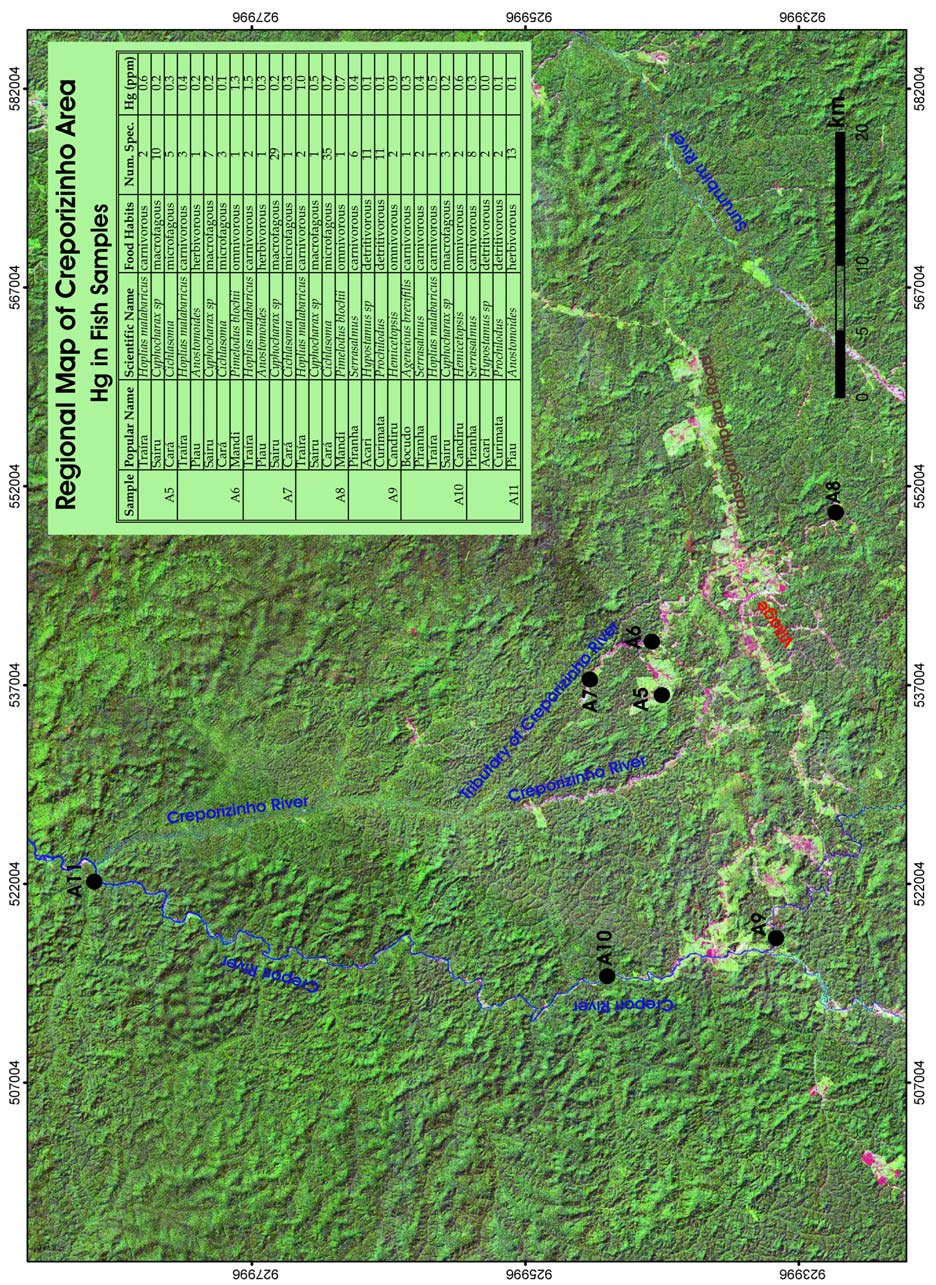
RT2004-004-01 CETEM/MCT 53
Figure 31 Mercury distribution in fish from different sites in Creporizinho area
RT2004-004-01 CETEM/MCT 54
Comparisons with global means of Hg in fish, however, may result in a certain
misinterpretation, since observations on given species of marine and freshwater fish indicate
that all tissue concentrations of mercury increase with increasing age (as inferred from length) of
fish (WHO, 1990); it is also strongly affected by fish species and size (length and weight) and, in
addition, it is generally agreed that Hg concentrations in carnivorous fish are higher than in
non-carnivorous species (e.g., Watras and Huckabee 1994), due to the indirect Hg
bioaccumulation or biomagnification. Considering that, the data were compared, firstly,
between garimpos' areas and among their sites; secondly, considering the different food habits
of fish species collected and, after, by using Hg concentrations in individual species collected. It
was investigated a relationship between fish length and Hg levels, by correlation analysis with
log-transformed and non-transformed data and, also, by using the mean values of the length
intervals. The objective was to assess the Hg contamination in those sites and to find an
indicator of Hg bioavailabiliy, by using fish species.
Fish from Săo Chico are also heavier and larger than those from Creporizinho area
(t=2.49; p<0.0001 and t=4.12; p<0.0001; respectively). However, the present results showed no
correlation between fish Hg concentration and weight or length when analyzing all specimens
in both areas. The significant correlation between Hg levels and length is very low (0.13; p<0.05;
n=234) and the higher correlation between Hg levels and weight is not significant (-0.668; n.s;
n=81). Maybe it is because we are dealing with many species within each group. Additionally, in
this work, the weight measurements were not performed for fish lighter than 100 g, and this
parameter were performed just for 35% of the specimens collected (n=81).
Comparing mercury levels in fish from each site within each study area (Săo Chico and
Creporizinho) the results (Table 7) showed that fish from A2 (Săo Chico Reservoir) have the
highest mercury levels (4.97±4.80µg/g), whereas the other sites in Săo Chico area, A1, A3 and
A4 present no significant difference to each other. Additionally, fish from A2 are smaller than
fish from A3 and A4. Fish from A4 are heavier than the others sites. Furthermore, fish from A2
showed positive and significant correlation between Hg in muscles and length but not with
weight (n=13), whereas in the other sites (A1, A3 and A4) there was no significant correlation
(Table I in Appendix 2).
Table 7 - Total Hg in fish muscles (arithmetical mean ± standard deviation; wet weight) from
different sites of Săo Chico and Creporizinho garimpo's areas
Garimpo area
Length
Weight
N
Mercury (µg/g)
N
N
(cm)
(g)
Săo Chico
73
2.53±3.91
73
18.75±14.42
32
934.3±1,681.7
A1 15
0.57±0.75
15
12.33±4.01
1
A2 33
4.97±4.80
33
13.11±6.83
13
200.0±81.64
A3 16
0.32±0.15
16
22.04±13.2
9
166.7±66.1
A4 9
0.83±0.43
9
43.61±20.0
9
2,838.9±2,294.5
Creporizinho 161 0.36±0.33
161
11.62±4.86
49
191.8±186.0
A5 17
0.27±0.16
17
9.53±1.88
-
A6 15
0.30±0.30
15
13.4±7.15
5
290.0±134.2
A7 33
0.32±0.35
33
9.80±2.57
3
150.0±86.6
A8 39
0.66±0.33
39
8.57±2.33
2
150.0±70.7
A9 22
0.25±0.28
22
13.2±3.00
12
129.7±62.0
A10 10
0.32±0.17
10
15.75±9.25
6
341.7±196.4
A11 25
0.13±0.10
25
16.06±3.58
21
171.4±48.9
Total 234
1.04±2.42
234
13.84±9.56
81
485.2±1,118.0
RT2004-004-01 CETEM/MCT 55
In Creporizinho area, fish from the site A8 showed higher Hg levels (0.66±0.33µg/g) than
all the other sites (A5, A6, A7, A9, A10 and A11), but specimens are smaller than fish from other
sites (A6, A9, A10 and A11). Also, fish from A7 showed higher Hg levels than fish from A11 and
the others did not show significant differences among each other. It is indicated that A8 is the
most contaminated site in Creporizinho area. Fish from this site have the highest Hg levels and
are smaller than fish from the other sites. Significant positive correlation between Hg in muscles
and length were found in sites A6, A7, A9 and significant negative correlation in A11. For A11
the negative and significant correlation was found also between Hg in muscles and weight
(Table I in Appendix 2).
The indirect bioaccumulation or biomagnification is a phenomenon through which a
chemical substance accumulates in a given species according to its trophic levels in a food chain
(Bruggeman 1982). Noncarnivourous fish represents close to 75% of total sampled fish in this
work (n=234). Microfagous represents 36%, macrofagous 30%, detritivorous 15%, herbivorous
10%, omnivorous 5% and insectivorous, 3% approximately. In Săo Chico area, non-carnivorous
and carnivorous fish represents close to 50% each, but at A1 and A2 sites in Săo Chico area non-
carnivorous fish represents more than 60%, whereas at A3 and A4, carnivorous are predominant
(56% and 88%, respectively).
In Creporizinho area, non-carnivorous fish represents close to 85% of collected fish, since
from the A5 site to A11, non carnivorous fish are the majority (above 60%). Carnivorous species
are placed at a higher trophic level than non-carnivorous species in a food chain. It is generally
agreed that Hg concentrations in carnivorous fish are higher than in non-carnivorous species
(e.g., Watras and Huckabee 1994). This was observed for results showed in Table II in Appendix
2 , for total data (Student's t-Test; t=3.30; p<0,005) and for both studied areas ( Săo Chico:t=2.84;
p<0.05; Creporizinho: t=2.66; p<0.01).
The ratio between mercury levels in carnivorous: non-carnivorous fish resulted in 4.4 for
total fish sampled, 4.3 for Săo Chico and 1.,6 for Creporizinho, meaning that carnivorous fish
showed from 1.6 to 4.4 times more mercury levels than non-carnivorous fish. Whereas the
carnivorous fish are heavier and larger than non-carnivorous when total data are analyzed
(t=5.21; p<0.0001), only the differences in length remains significant when the data are analyzed
separately in each area (t=3.52; p<0.001 and t=3.99; p<0.0001 for Săo Chico and Creporizinho,
respectively).
The correlation between Hg in muscles and length considering total data (Table III in
Appendix 2) showed no correlation for carnivorous, and significant but lower correlation for
non-carnivorous and its correlation between Hg in muscles and weight resulted positive and
significant. However, its important to consider the few number of specimens available for this
analysis.
Considering the data in each area, the results showed that the correlation only between
Hg in muscles and length were significant. Non-carnivorous showed a negative and significant
correlation in both areas, Săo Chico and Creporizinho. In Creporizinho, carnivorous fish showed
positive and significant correlation for Hg in muscles and length (Table I in Appendix 2).
In order to assess the Hg biomagnification processes in the ichthyofauna of the studied
areas, the data were worked out whereby distinct food habits and their correspondent Hg
concentrations were taken into account and analyzed. The fish were classified as carnivorous
(arraia, bocudo, lambari, piranha, pirarara, surubim e traíra) and non-carnivorous. The non-
carnivorous fish species were classified into (i) detritivorous-D- (acari and curimată); (ii)
herbivorous-H- (pacu and piau), (iii) insectivorous-I- (ituí), (iv) macrophagous-Mf- (sairu), (v)
RT2004-004-01 CETEM/MCT 56
microphagous-M- (cará) and omnivorous-O- (candiru and mandi). The results of mercury,
length and weight in these groups are shown in Table IV in Appendix 2.
The carnivorous fish species are pelagic and they are active in water column. Adults feed
mainly on freshwater shrimps and fish. The detritivorous fish have as basic food source algae,
bacteria and other organisms living in lime or mud and detritus. The herbivorous fish feed on
fruits, roots, seeds and other important parts of the plant material. For these species, the flooded
forest is an important food source. The insectivorous fish feed mainly on insects and the
macrophagous have the macrofauna (ex. poliquetas; crustaceans; gastropoda; bivalvia) as the
principal food item. The microphagous feed mainly on microrganisms as amoebas, small hidros,
clams, briozoas and seas-squirt and the omnivorous fish can feed on either animal food or
vegetable source, they have high capacity for feeding different kinds of food.
In Săo Chico area, the carnivorous species showed mercury levels different of the
detritivorous. When this analysis is performed considering only non-carnivorous, the
microfagous species are different of the herbivorous, detritivorous and insectivorous species
(M>H=D=I). In Creporizinho, the species of detritivorous, herbivorous and macrofagous
showed mercury levels different of the carnivorous, microfagous and omnivorous ones, being
macrofagous species different of detritivorous ones (D<O>C=M>H=Mf; H=D<Mf).
Hg levels were investigated in distinct fish species from studied areas, as shown in Table
8.
The results showed that Carás and Traíras from Săo Chico have higher mercury levels
than from Creporizinho. Others species (Piranha, Acari, Curimată, Piau and Mandi) did not
show any difference between areas. Besides these results, it should be considered that Traíras
and Carás were present in almost all of the studied aquatic systems. Then, they may be used as
indicator species for mercury contamination in Amazonian aquatic ecosystems.
According to the correlation analyses, there are correlations between Hg and length
and/or weight, in Creporizinho area, with Curimată' and Piranha' species. The Curimată
specimens showed positives and significant correlation between Hg and length and between Hg
and weight. The Piranha specimens showed strong positive and significant correlation between
Hg and weight. In Săo Chico area, the species Curimată and Ituí showed positive and significant
correlation between Hg and length. The other species, including Traíra specie, did not show any
significant correlation in both areas. The correlation coefficients were shown in Table I in
Appendix 2.
RT2004-004-01 CETEM/MCT 57
Table 8 - Total Hg concentrations (arithmetical mean ± standard deviation) in individual fish
species (µg/g ) from studied areas
Mercury (µg/g)
Popular name
Scientific name
N Săo
Chico N
Creporizinho
Carnivorous
Arraia
Potamotrygon motoro
3
0.63±0.27
Bocudo
Ageneiosus brevifilis
1
0.266
Lambari
Hemigrammus unilineatus
4
0.43±0.14
Piranha
Serrasalmus rhombeus
2
0.93±0.38
16
0.34±0.13
Pirarara
Phractocephalus hemioliopterus
1 0.28
Surubim
Pseudoplatystoma fasciatum
1 1.20
Traíra**
Hoplias malabaricus
20
6.11±5.93
10
0.80±0.55
Non-
carnivorous
Detritivorous
Acari
Hypostomus sp
2
0.03±0.01
13
0.05±0.02
Curimată
Prochilodus nigricans
8
0.17±0.04
6
0.12±0.04
Herbivorous
Pacu
Myleus sp
1 0.09
Piau
Anostomoides laticeps
1 0.14 15
0.08±0.07
Insectivorous
Ituí
Sternopygus macrurus
5
0.30±0.06
Macrofagous
Sairu
Cyphocharax sp
50
0.23±0.08
Microfagous
Cará**
Cichlasoma spectabile
23
2.21±1.28
44
0.55±0.35
Omnivorous
Candiru
Hemicetopsis candiru
4
0.73±0.21
Mandi
Pimelodus blochii
2
0.92±0.95
2
0.98±0.46
Total
73
2.53±3.91
161
0.36±0.33
N=number of specimens; Student-t Test ** p<0.0001
In Tables 9 and 10 are shown the average Hg concentrations in individual fish species
(µg/g ) from different sites in Săo Chico and Creporizinho, respectively.
RT2004-004-01 CETEM/MCT 58
Table 9 - Total Hg concentrations (arithmetical mean±standard deviation) in individual fish
species (µg/g ) from Săo Chico garimpo area
Mercury (µg/g)
Popular name
Scientific name
A1(n)
A2 (n)
A3 (n)
A4 (n)
Carnivorous
Arraia
Potamotrygon motoro
0.63±0.27 (3)
Hemigrammus
Lambari
unilineatus
0.43±0.13 (4)
Serrasalmus
Piranha
rhombeus
0.93±0.38 (2)
Phractocephalus
Pirarara
hemioliopterus
0.27
(1)
Pseudoplatystoma
Surubim
fasciatum
1.2
(1)
Traíra
Hoplias malabaricus
2.6 (1)
9.01±5.4*(13) 0.39±0.09 (5)
0.60 (1)
Non-
carnivorous
Detritivorous
Acari
Hypostomus sp
0.03±0.003 (2)
Curimată
Prochilodus nigricans 0.16±0.04(8)
Herbivorous
Pacu
Myleus sp
0.09 (1)
Anostomoides
Piau
laticeps
0.14(1)
Insectivorous
Sternopygus
Ituí
macrurus
0.30±0.06(5)
Microfagous
Cará
Cichlasoma spectabile 1.36±0.15(3) 2.34±1.33 (20)
Omnivorous
Mandi
Pimelodus blochii
0.25 (1)
1.6 (1)
Total
15 33 16 9
N=number of specimens; * Student's-T test (t=5.73) p<0.0001
In Săo Chico area, all fish species were collected only in one site, or in very few number
in more sites than one, except Traíras and Carás. Traíras are similar in length and weight, but
Hg levels are higher in specimens from A2 than from A3. Carás did not show Hg levels
significant differences between A1 and A2, but specimens from A1 are bigger than ones from
A2. It is possible that Carás from A2 have less exposure time for mercury than A1, and, if the
time exposure were similar, the mercury levels would be higher. In addition, it should be
considered that there is few specimens in A1.
RT2004-004-01 CETEM/MCT 59
Table 10 - Total Hg concentrations (arithmetical mean±standard deviation) in individual fish
species (µg/g ) from Creporizinho garimpo area
Mercury (µg/g)
Popular name
A5 (n)
A6 (n)
A7 (n)
A8 (n)
A9 (n)
A10 (n)
A11 (n)
Carnivorous
0.266
Bocudo
(1)
Piranha
0.44±0.15
0.38±0.01
0.25±0.06
(6)
(2)
(8)
Traíra
0.61±0.29 0.38±0.03
1.54±0.78
1.04±0.36
0.46
(2)
(3)
(2)
(2)
(1)
Non-carnivorous
Detritivorous
Acari
0.05±0.01
0.04±0.02
(11)
(2)
Curimată
0.15
0.11±0.06
0.12±0.04
(3)
(1)
(2)
Herbivorous
0.19
0.30
Piau
0.06±0.02
(1)
(1)
(13)
Macrofagous
0.51
Sairu
0.20±0.04 0.20±0.06
0.24±0.07
0.15±0.04
(10)
(7)
(29)
(1)
(3)
Microfagous
0.27
Cará
0.25±0.06 0.11±0.07
0.65±0.33
(5)
(3)
(1)
(35)
Omnivorous
0.91±0.64
0.56±0.07
Candiru
(2)
(2)
1.3
0.65
Mandi
(1)
(1)
Total 17
15
33
39
22
10
25
N= number of specimens
In Creporizinho area, Piranha specie showed no differences in length and weight, but Hg
levels are higher in specimens form A9 than from A11. Traíra specie showed no differences in
mercury levels, length or weight for specimens from A5, A6, A7 and A8. Cará specimens from
A8 are smaller but showed higher mercury levels than ones from A5 and A6 (Kruskall-Wallis
One-Way ANOVA and Mann-Whitney U-test).
It was performed the correlation analysis considering specific species collected from
different sites, when the number of specimens were enough (more than 4). Traíras from A2
showed very low and no significant correlation between Hg and length or weight. Traíras from
A3 showed relatively high but no significant negative correlation between Hg and length and no
correlation between Hg and weight. Lambari from A3, Cará from A2, A5 and A8 and Sairu from
A5, A6 and A7 did not show any correlation between Hg and length.
Curimată from A1 and Acari from A9 showed significant correlation between Hg and
length and Piranha from A11 showed significant correlation between Hg and weight The
correlation coefficients were shown in Table I in Appendix 2.
RT2004-004-01 CETEM/MCT 60
In Table 11 are shown total mercury levels in Trairas and Carás from several sites of two
study area and the ratio of mercury between these species, a carnivorous and a non-carnivorous
species. The ratio ranged from about 2 to 4, which means that Hg accumulates from 2 to 4 times
more in Traíras than in Carás.
In addition, the results showed that Hg levels only in Traíras from A2 are higher than
Traíras from the other sites, similar one each other (Kruskall-Wallis One-Way ANOVA and
Mann-Whitney U-test). Mercury levels in Carás from A1 and A2 are higher than Carás from A5,
A6, and A8 (p<0.005). A7 has one specimen. Mercury levels in Carás from A5 and A6 are similar
each other and lower than levels in Carás from A8 (p<0.05; Kruskall-Wallis One-Way ANOVA
and Mann-Whitney U-test).
Table 11 - Ratio of total mercury in muscles of Traíras and Carás from different study sites in
both Garimpo's areas, Săo Chico and Creporizinho
Traíras (T) Carás (C)
Ratio
Study
Mercury
Mercury
N
N
Hg T/C
sites
(µg/g)
(µg/g)
A1 1
2.6 3
1.36±0.15
A2 13
9.00±5.42
20
2.34±1.33
3,8
A3 5
0.39±0.09
- -
A4 1
0.61
- -
A5 2
0.60±0.29
5
0.25±0.06
2,4
A6 3
0.38±0.03
3
0.11±0.07
3,45
A7 2
1.54±0.78
1 0.27
A8 2
1.04±0.35
35
0.65±0.33
1,6
A10 1 0.46 -
-
Although Traíras and Carás did not show any correlation between mercury levels and
length or weight when total data were analyzed in Săo Chico and/or Creporizinho and, even,
when data from each site was considered, we decided to investigate the correspondence
between log of length and log of mercury levels in muscles, as advised by Protocol. We chosen
these species because they are distributed throughout the studied aquatic systems, have
different food habits and the number of specimens collected are large enough. The data
analyzed showed very low correlation between parameters for all Traíras from Săo Chico and
for Traíras from A2, as shown in Figures I and II in Appendix 2.
The analysis were also performed with species from all sites, when adequate number of
specimens was available, but there was no strong correlation for: Traíras from Săo Chico, from
A2, from A3 and from Creporizinho; Cará from Săo Chico, from A2, from Creporizinho; from
A5 and from A8; Sairu from Creporizinho, from A5, from A6, from A7; Piau from A1 and
Piranha from A11. The results showed strong positive correlation between log length and log
mercury levels only for Curimată from A1 (Săo Chico area), Acari and Piranhas from A9
(Creporizinho area). These results are shown in Figures 32, 33 and 34.
RT2004-004-01 CETEM/MCT 61
-0,5
1,98
2
2,02
2,04
2,06
2,08
2,1
2,12
2,14
-0,6
-0,7
-0,8
y = 2,6158x - 6,677
-0,9
R2 = 0,5689
-1
-1,1
log mercury (ug/g)
-1,2
-1,3
-1,4
-1,5
log length (mm)
Figure 32- Log fish length versus log Hg in Acari from A9 (n=11) from
Creporizinho Garimpo´s area.
0
2,02
2,04
2,06
2,08
2,1
2,12
2,14
2,16
2,18
2,2
2,22
2,24
-0,1
-0,2
y = 1,637x - 3,8678
R2 = 0,8056
y (ug/g)
-0,3
c
ur
log mer -0,4
-0,5
-0,6
log length (mm)
Figure 33 - Log fish length versus log Hg in Piranhas from A9 (n=6) from
Creporizinho Garimpo´s area
RT2004-004-01 CETEM/MCT 62
0
1,96
1,98
2
2,02
2,04
2,06
2,08
2,1
2,12
2,14
-0,1
-0,2
-0,3
-0,4
ug/g)
y = 1,5381x - 3,9407
y (
R2 = 0,4231
-0,5
c
ur
-0,6
log mer
-0,7
-0,8
-0,9
-1
log length (mm)
Figure 34 - Log fish length versus log Hg in Curimată from A1 (n=8) from
Săo Chico Garimpo´s area
Considering the low correlation coefficient resulting from analysis of transformed data
for most part of species studied, we decided to investigate the correspondence between length
intervals (close to 10cm to Traíras and 5cm to Carás, as for other species, when available) and
the average mercury levels in fish muscles, trying to decrease the high variability in data, and
considering data not log transformed. In addition, these data were log transformed and the
correlation coefficient were also investigated. The results are shown in Table V in Appendix 2. It
could be notice that there are no significant differences between the analysis, except for Piau
from Creporizinho, where the log values showed stronger negative correlation coefficient (y = -
4.0512x + 7.9362; R2 = 0,5544) than values not log transformed, and for Acari from Creporizinho,
where the results from not transformed data were stronger. The other results showed the same
tendency.
Traíras from A2 showed a significant correlation between Hg levels and length
considering non log transformed (as shown in Table 12 and Figure 35) and for log transformed
data, which the linear equation resulted as: y = 1.3316x 2.1111; R2 = 0.6. In Creporizinho, the
relationship between Hg levels and length considering non log transformed resulted in negative
correlation (as shown in Table VI and Figure III in Appendix 2).
We should consider that changes in intervals of length could change the linear
relationship found for Traíras from A2. However, considering the present results, one could
suggest that Traíras can be used as indicator organism for mercury contamination, at least in
Amazonian heavily contaminated sites.
RT2004-004-01 CETEM/MCT 63
Table 12 - Total mercury in muscles, weight and length intervals (arithmetical means) of
Traíras from A2; Săo Chico Garimpo´s area.
Length intervals
Length mean
Mercury
N
(mm)
(µg/g)
150 150 5.3
1
175 175 8.1
3
215-225 220 14.1
2
245-265 255 9.6
4
16
14
12
y = 0,0523x - 1,183
R2 = 0,4415
10
8
mercury (ug/g) 6
4
2
0
100
120
140
160
180
200
220
240
260
280
length (mm)
Figure 35 - Total mercury in muscles and length intervals (arithmetical means) of Traíras
from A2; Săo Chico Garimpo´s area.
Carás from A2, Săo Chico area, showed a strong negative correlation between length
and Hg levels, as shown in Table VII and Figure IV in Appendix 2. Carás from A8, Creporizinho
area showed very low liner relationship between length intervals and Hg levels (y = 0.0228x +
0.4795; R2 = 0.072).
Other fish species from Creporizinho and its sites were also tested: Acari, Sairu, Piau and
Piranha. The best results are shown in following Tables and Figures. Acari from A9 showed a
strong positive relationship between Hg levels and length intervals of 100mm (y = 0.0107x
0.0656; R2 = 0.9546). The results are shown in Table 13 and Figure 36.
RT2004-004-01 CETEM/MCT 64
Table 13 - Total mercury in muscles and length intervals (arithmetical means) of Acari from
A9 -Creporizinho Garimpo´s area.
Length intervals
Length mean
Mercury
N
(mm)
(µg/g)
9-10 90.5 0.04
1
10-11 105.0 0.04
3
11-12 115.0 0.06
5
12-13 125.0 0.07
1
13-14 135.0 0.08
1
0,09
0,08
y = 0,0
011x - 0,0656
R2 = 0,9546
0,07
0,06
/
g)
g
u
y
(
e
r
c
ur
0,05
m
0,04
0,03
0,02
90
95
100
105
110
115
120
125
130
135
140
length (mm)
Figure 36 - Total mercury in muscles and length intervals (arithmetical means) of Acari from
Creporizinho Garimpo´s area.
Sairu showed weak correlation between Hg levels and length intervals for data from A5
and taken into account all of 50 specimens from Creporizinho area, the relationship was not
strong. However, Sairu from A6 (Baixăo do Bofe), showed stronger positive relationship
between Hg levels and length intervals (y = 0.0325x 0.0846; R2 = 0.557). Piau from A11 (n=13).
Finally, Piranhas from A9, A10 and A11, with total number of 16 specimens showed strong
positive relationship between Hg levels and both length intervals, 50mm and 100mm, y =
0.0435x 0.2115; R2 = 0.4399 and y = 0.0422x 0.1718; R2 = 0.4447, respectively. However, when
analyzed specimens from A11 and A9 individually, Piranhas from A11 did not show any
correlation with 50mm of intervals, but show stronger relationship with 100mm of intervals (y =
0.0302x 0.11; R2 = 0.4125). On the other hand, Piranhas from A9 showed strong relationship
between mercury levels and both length intervals, 50mm and 100mm (y = 0.0552x 0.3182; R2 =
0.7737 and y = 0.0544x 0.276, R2 = 0.8522, respectively). The best results, concern to Piranhas
from A9 with 100mm of length intervals are shown in Tables 14 and Figure 37.
RT2004-004-01 CETEM/MCT 65
Table 14 - Total mercury in muscles and length intervals (arithmetical means) of Piranhas
from A9 -Creporizinho Garimpo´s area.
Length intervals
Length mean
Mercury
N
(mm)
(µg/g)
100.0-110.0 105.0
0.34
1
110.0-120.0 115.0
0.31
2
150.0-160.0 155.0
0.49
2
160.0-170.0 165.0
0.69
1
0,8
0,7
y = 0,0544x - 0,276
R2 = 0,8522
0,6
g)
g/
(u 0,5
r
y
e
r
c
u
m
0,4
0,3
0,2
90
100
110
120
130
140
150
160
170
length (mm)
Figure 37 - Total mercury in muscles and length intervals (arithmetical means) of Piranha
from A9 -Creporizinho Garimpo´s area.
Although Traira does not show good correlation between Hg and length, it should be
used as a Hg bioindicator for the following reasons: it shows the fairly highest Hg levels; it has
the most widespread distribution in tropical drainage, in contrast to other species, it is easily
adapted to adverse conditions in impacted areas and, it is appreciated for eating. Although the
indication of absence of correlation shows that this species do not fit well with the modeling
proposed in the Protocol, this has a potential negative effect in the human population (easy to
catch and appreciated as food). In addition, Acari, Curimată, Ituí, Piranha and Sairu are also
good indicators for specific sites, suggesting that in order to find a Hg contamination indicator
organisms, search for a site-specific fish species, with more than one species for several sites,
could be a better approach in tropical aquatic ecosystems.
The relationship between mercury levels in fish and mercury in sediments can be used as
an indicative of bioavailability of mercury in aquatic system. In order to investigate this
availability, we performed the ratio between mean mercury levels in fish and IGEO, which is a
contamination classification system, explained previously. Traíra and Piranha (carnivorous
species) and Cará and Curimată (non carnivorous species) were chosen because they were
RT2004-004-01 CETEM/MCT 66
collected in Săo Chico and Creporizinho areas and represent different food habits. The results
are shown in Figure 38. All sites showed the ratio below of 0.5 considering all species, except A2
and A7 for Traíra, which resulted in 1.5 and 1.8, respectively. The results suggest that A2 and A7
showed the highest mercury bioavailability for fish from sediments.
By using the indicator fish species, we have chosen for A1, Curimată specie; A2, Traíras
and Carás; A3, Ituí; A4, Arraia; A5, A6 and A7, Sairu; A8, Carás; A9, Acari and Piranhas, A10,
Sairu and A11, Piranhas. The results are shown in Figure 39. All sites showed the ratio below of
0.5 considering all species, except A2 (for Traíra). These results confirm the previous one,
suggesting that A2 showed higher mercury bioavailability than the other sites, but, in contrast,
A7 showed ratio below 0.5, similar to the other sites.
2,00
1,80
Piranha
1,60
Traíra
Curimată
1,40
Cará
1,20
1,00
0,80
Ratio Hg fish/IGEO 0,60
0,40
0,20
0,00
A2
A3
A4
A5
A6
A7
A8
A9
A10
A11
Site
Figure 38 - Ratio between total mercury in muscles of some fish species and IGEO for all
sites in Săo Chico and Creporizinho Garimpo´s area.
RT2004-004-01 CETEM/MCT 67
2,00
1,80
1,60
arraia
acari
1,40
O
E
piranha
1,20
IG
traira
sh/ 1,00
itui
o Hg fi 0,80
cará
Rati
sairu
0,60
0,40
0,20
0,00
A2
A3
A4
A5
A6
A7
A8
A9
A10
A11
Sites
Figure 39 - Ratio between total mercury in muscles of some indicator fish species and Igeo of
Hg in sediments for all sites in Săo Chico and Creporizinho Garimpo´s area.
4.3.1. Human exposure to mercury due to fish consumption
By employing toxicological methods for the risk assessment to human health,
significance of the contamination can be ascertained. At a screening level, a Hazard Quotient
(HQ) approach (USEPA, 1989), assumes that there is a level of exposure (i.e., RfD = Reference of
Dose) for non-carcinogenic substances, like mercury, below which it is unlikely for even
sensitive populations to experience adverse health effects.
The MeHg RfD value is 1E-04 mg.Kg-1.d-1 (IRIS 1995) with an uncertainty factor of 10
and its confidence level is medium. Uncertainties of the RfD statistics have been reported,
suggesting an under-estimation of RfD for Hg presented in IRIS, 1995 (Smith and Farris 1996).
However, other authors suggest that there is no safe human exposure to MeHg and that of all
living species, human appear to have weakest defenses against MeHg (Clarkson 1996).
However, considerable gaps remain in our knowledge on that. Our approach therefore is to use
the human risk assessment proposed by USEPA, at screening level. HQ is defined as the ratio of
a single substance exposure level (E) to a reference of dose (E/RfD). When HQ exceeds the value
of one, there may be concern for potential health effects.
The estimated exposure level was obtained by multiplication of 95th percentil
upperbound of mean Hg concentration (see Table 7) considering all fish as suggested by USEPA
(1989), by the adult human ingestion rate for local populations, Table 15. Most of the studies on
RT2004-004-01 CETEM/MCT 68
riverside population assume consumption rate close to 0.2 Kg.d-1. However, the Sociological
Study from the Săo Chico community reported that close to 57% of the population consume fish
just once a week and 90% consume fish twice weekly. Thus, it has been considered reasonable,
and more conservative, a consumption rate close to 0.02 Kg.d-1 in those study areas, considering
that fishing is not usual and fish is not caught easily.
Finally, the intake dose is estimated by dividing that product by 70 kg, considering the
average weight of a human adult. Although total mercury was quantified in fish, it has been
demonstrated elsewhere that about 75-95% of total mercury in fish muscles is methylmercury.
Thus, it has been assumed that total mercury in fish represents methylmercury. The resultants
HQ for MeHg are shown in Table 15.
Table 15 MeHg Hazard Quotient due to fish ingestion in Săo Chico and Creporizinho
garimpo's areas and sites
Garimpo's area RfD
Intake Dose
HQ
Săo Chico
1 E-04
9,8E-03
14.8
A1 1
E-04
2.7E-03
4.1
A2 1
E-04
1.9E-02
28.5
A3 1
E-04
1.1E-03
1.7
A4 1
E-04
3.2E-03
4.8
Creporizinho 1
E-04 1,2E-03
1.8
A5 1
E-04
9.9E-04
1.5
A6 1
E-04
1.3E-03
1.9
A7 1
E-04
1.3E-03
1.9
A8 1
E-04
2.2E-03
3.3
A9 1
E-04
1.1E-03
1.6
A10 1
E-04
1.2E-03
1.8
A11 1
E-04
4.9E-04
0.7
Total 1
E-04
3,9E-03
5.8
HQ results show for all study sites values above one, from 1.5 to 28.5, except for A11,
which is considered a reference area. The Săo Chico reservoir (A2) showed the higher values of
HQ, followed by A1, A4, and A3. In Creporizinho area, the HQ values are close to 2 for all sites,
except in A8, where the HQ attained 3.3.
It should be stressed that the present modeling is an evaluation tool, and therefore its
uncertainty should be taken into account for interpretation of results and conclusions. From the
present results, however, one could indicate that possibly in all sites, except in A11, and
depending on their dietary habits, populations are subject to potential hazards and health effects
due to fish consumption, being site A2 the most evident case of mercury pollution. Therefore,
further in-depth studies on Hg bioavailability are highly recommended for the overall study
area, while an awareness campaign should address to the local population the risk of consuming
fish from the site A2.
RT2004-004-01 CETEM/MCT 69
In a previous study (Bidone et al. 1997) showed the estimates of Hg concentration in
blood and in hair from contaminated site, using the single-compartment model (WHO 1990)
through which the steady-state Hg concentration in blood (C) in µg.l-1 is related to the average
daily dietary intake (d) in µg of Hg, as follows: C = 0.95 * d. Hair concentrations of Hg are
proportional to blood concentrations at the time of the formation of the hair strand, and blood-
to-hair ratio in humans is about 1 to 250, but appreciable individual differences have been found
(WHO, 1990). A synthesis of the estimates to Hg concentration in blood and in hair using the
single-compartment model for Săo Chico and Creporizinho areas is shown in Table 16.
Table 16 Hg concentration in fish; estimated average Hg daily intake (d); estimated blood
Hg concentration (b) and estimated hair Hg concentration(h).
Garimpo's areas
Hg in fish*
d
b
h
(µg.g-1)
(µg.d-1)
(µg.l-1)
(µg.g-1)
Săo Chico
3.44
103.3
98.2
24.5
Creporizinho
0.41
12.3
11.7
2.9
Total 1.35
40.6
38.7
9.7
* = 95 percent upper confidence limit on the arithmetic mean
The estimated blood and hair Hg concentration in Săo Chico (98.2 µg.l-1 and 24.5 µg.g-1)
do not agree with the observed 21.6µg.l-1 and 3.16±2.63 µg.g-1 (n=136) total Hg concentration,
respectively. However, it should be taken into account that there are some individuals with
higher levels of mercury in blood (as 141µg.l-1) and hair (15 µg.g-1) in this area.
Considering only A1, A3 and A4, the estimated Hg in blood and hair are closer to the
verified values: 23.5µg.l-1 and 5.9 µg.g-1. As a result, one could suggest that consumption of fish
from A2 appears to be uncommon within the local community. This has been confirmed through
interviews with the local population, probably as a result of a general perception towards Hg
contamination in the reservoir (A2). On the other hand, it is highlighted that the estimated blood
and hair Hg concentration in Creporizinho fall closer to the observed 23.21±27.11 µg.l-1 and
1.82±1.53 µg.g-1 of total Hg concentration, respectively.
The estimated and verified blood and hair Hg concentrations are lower than those values
(~200µg.l-1 and 50 µg.g-1) associated with adverse effects on nervous system, manifested as an
approximately 5% increase in the incidence of paraesthesia. Clinical observations in Iraq suggest
that women are more sensitive to the toxic effects of MeHg during pregnancy; pregnant women
may suffer effects at lower methylmercury exposure than non-pregnant adults, suggesting a
greater risk for pregnant women and, especially for their offspring. (WHO, 1991).
4.3.2. Preliminary assessment of physiological effects in fish caused by Hg
exposure
Whereas potential human health effects from Hg exposure have received considerable
attention, relatively few studies have explored effects of realistic environmental Hg
concentrations on fish or have attempted to use wild fish collected from polluted site where
interactions among factors including diet, water chemistry and other variables could be
important. Physiological biomarkers may identify effects at a tissue/organ before they are
apparent at a clinical/pathological level.
RT2004-004-01 CETEM/MCT 70
Biological markers, or biomarkers, are observable properties of an organism that indicate
biochemical components, structure, or function and that can be measured biologically.
Biomarkers can be used to estimate prior exposure, to identify changes and effects on
organisms, and to assess underlying susceptibility of an organism. Markers of internal dose are
direct measures of a toxic chemical and integrate multiple portals of entry and fluctuating
exposure dose. Markers of biologically effective dose assess the internal molecular targets, and
markers of early biological effect assess the molecular sequelas (es.epa.gov/ncer/fra/2004).
Some studies have been shown that MeHg has affinity for red blood cells (WHO 1990).
So, hematology might be an important diagnostic test related to Hg exposure. It is possible to
classify and evaluate fish anemias and this can be particularly important in fish, since clinical
signs of anemia are often masked until quite late in the pathogenesis of the disease (Stoskopf
1993). In fish's erythrocytes, about 90% of the Hg is in the organic form (Olson, 1973), as the
same ratio presented in muscles. Additionally, experimental Hg poisoning in fish showed
marked hematological anomalies (Gill and Pant 1984). However, in order to evaluate the
contaminant's adverse effects on ichthyofauna and other wildlife, one should establish the
normal or reference values, overall to Amazonian species (Almosny and Santos 2001), since the
information is limited.
The main objective of this approach is to assess biochemical and hematological
parameters in Amazonian fish from aquatic systems influenced by gold mining areas. Both the
level of Hg in tissue and the hematological and biochemical responses were measured in each
specimen. The results of total Hg in fish muscles and fish blood and biochemical parameters
were used as effects biomarkers in ecological risk assessment.
It was investigated biochemical parameters as enzyme activities, such as amino-alanina
transferase-ALT; amino- spartate transferase-AST; creatina kinase and creatinine, and
hematological parameters, such as hematocrit, hemoglobin, erythrocytes and total leukocyte
count; trombocytes-leukocytes count in blood of fish from Săo Chico and Creporizinho.
A total of 49 fish specimens from Săo Chico (30) and Creporizinho (19) were examined:
Bocudo (1), Cará (29), Mandi (1), Piau (2), Piranha (1), Pirarara (1), Surubim (1) and Traíra (13).
Considering that only Traíras and Carás were collected in reasonable number, the following
analysis of the results are related with these two species. A total of 42 fish specimens of those
species (Carás and Traíras) were collected: 27 specimens in Săo Chico (18 Carás and 9 Traíras)
and 15 specimens in Creporizinho (11 Carás and 4 Traíras).
After fish were caught, still alive, the blood was drawn by caudal or heart puncture with
an EDTA containing syringe. In the field, the manual methods for counting erythrocytes were
performed at the same time as the total leukocyte count, as recommended by Almosny et
al.(1993) and Almosny and Santos (2001). A specific dilution of the blood was made with a
diluent Gowers and Giemsa staining solutions, and the Newbauer,(Improved) cell counting
chamber was flooded. Smears, two slides per individual, were prepared without anticoagulant
substances from fresh blood, air dried, fixed in methanol, and stained with Giemsa's solution.
Blood corpuscules were examined by immersion microscopy and photographed. The hematocrit
(or globular volume) was performed by microhematocrit method, using small capillary tubes,
which were filled approximately two-thirds full with anticoagulated blood and centrifuged for
five minutes at 14,000G. The percentage of packed cells to total volume was determined by
direct measurement. The mean globular volume (MGV), a Wintrobe erythrocyte index, was
calculated as follows: MGV =[(hematocrit) x 100] / Total erythrocyte count.
RT2004-004-01 CETEM/MCT 71
The modified Cianometaheamoglobin method (Murachi, 1959) was used for hemoglobin
measurement, because this method is considered the most appropriate to determine
haemoglobin in fish (Campbell & Murru, 1990; Stoskopf, 1993; Canfield et al ,1994). The
procedure was performed in field, with n Spectrophotometer 800M Analyser®, by using 20µl of
blood collected with EDTA, until 12h after blood collection. For biochemical analyses, plasma
was collected after centrifugation and the elements measured were: Urea (BUN- Blood Urea
Nitrogen), Creatinine, Ammonia, and CK Creatine Kinase , ALT Alanine Transferase,
Aspartato Transferase AST Aspartate Transferase. The procedure was performed in laboratory
using biochemical-dry analizer, an Ektachem DT60 II System -Ortho-Clinical Diagnostics,
Johnson & Johnson®.
Statistical differences on Hg concentrations, physical, hematological and biochemical
parameters between different sites were tested using parametric tests (Student's t-Test) or a
nonparametric test of significance (the Mann-Whitney U-test). One-way ANOVA followed by
Duncan pos-hoc were performed when appropriate. The significant level considered was the
probability level 0.05. Correlations were determined with both the Pearson correlation
coefficient and the Spearman rank correlation coefficient on the original data.
The results are shown in Tables 17 and 18.
Table 17 - Total mercury in muscles, biochemical and hematological parameters of Traíras
from Garimpo´s area
Parameters N Săo
Chico N Creporizinho
Mercury 9
7.71±6.20*
4
0.73±0.43
Length
9
24.11±7.23
4
18.63±9.80
Weight 9
400.00±493.71
3
316.67±202.1
ALT 2
32.50±4.95
1 47.00
AST 2
219,500±99.70
2
225,000±247.50
CK 2
5,380.00±1,909.2
2
5,147.50±3,885.5
Creatinine 2
0.25±0.071
1 0.30
CHCG 2
19.86±0.44
- -
Amonia 3
866.67±119.30
2
585.0±70.71
Ureia 2
2.00±1.41
1 3.0
Hb 2
5.45±0.58
- -
Erythrocyte count
7
2,177,142±401,111*
4
2,785,000±455,814
GV 7
26.86±5.50**
4
40.75±5.25
MGV 7
123.40±15.35
4
148.87±26.53
Trombocyte-
- - - -
leukocyte count
Student's t-Test: *p<0.05; ** p<0.005
RT2004-004-01 CETEM/MCT 72
Table 18 - Total mercury in muscles, biochemical and hematological parameters of Carás from
Garimpo´s area.
Parameters
N Săo
Chico N
Creporizinho
Mercury 18
2.16±1.02
11
0.42±0.26
Length
18
8.25±0.60
11
8.68±0.79
Weight -
-
-
-
ALT -
-
-
-
AST -
-
-
-
CK -
-
-
-
Creatinine -
-
-
-
CHCG 16
23.75±4.9
- -
Amonia -
-
-
-
Ureia -
-
-
-
Hb 16
5.85±1.05
- -
Erythrocyte
17
1,971,176±329,125 11
2,080,909±215,102
count
GV 18
24.83±4.02**
11
29.27±3.13
MGV 17
128.43±19.47
11
141.68±17.95
Trombocyte-
16
19.5±6.46
10
22.0±10.38
leukocyte count
It should be noted that by macroscopic clinic observation of fish specimens, they did not
show any significant alteration, except in Traíras from A2, which showed very high number of
muscles parasites in all samples. It has been suggested that wild population in equilibrium with
its environment shows up to 30% of organisms with visible number of parasites, while in
stressed population, a higher number of parasites are to be found in higher percentage of
organisms, as observed in Traíras from A2.
All biochemical parameters measured in the present work did not show any difference
between sites. These data maybe resulted due to low number of specimens with biochemical
parameters measured, available to compare between areas, which did not permit perform the
correlation analysis. In addition, those biochemical parameters could not be sensible as mercury
biomarkers. However, the data are important because they can be used as biochemical reference
values for Amazonian fish, considering as rare data .
Traíras from Creporizinho showed higher globular volume and erythrocytes number
than Traíras from Săo Chico. Carás from Creporinho showed higher globular volume and mean
globular volume than those from Săo Chico. Mercury levels and globular volume showed
significant negative correlation for both species (Traíras: -0.82; p<0.005 n=11; Carás: -0.37; p<0.05
n=29). These results suggest that mercury levels may cause decrease in number of erythrocytes,
which are smaller than normal ones, characteristics of regenerative anemia.
RT2004-004-01 CETEM/MCT 73
4.3.3. Bioindicators other than fish
Very few samples of earthworms, a number of 5, could be obtained in the field, due to
severe physical impacts caused by silting of drainages that likely prevented the availability of
invertebrates in the study sites, while some samples were lost during the depuration period, due
to dehydration or by physical damages during washing or handling. Thus, earthworm
specimens could not be used as a bioindicator of methylation potencial of Hg in sediments and
soils.
At Săo Chico mining sites 27 samples of herbs and vegetable foodstuffs were collected
close to mining tailings and backyards of the village. No aquatic plants could be found in
flooded open pits, neither in the lake at Săo Chico mining site.
At Creporizinho mining sites 29 samples of herbs, macrophytes and vegetable foodstuffs
were collected in the village and close to the mining sites.
The concentration of total mercury in plant parts (aboveground and roots), and
corresponding substrates are shown in Appendix 2. Total mercury values for soil samples at Săo
Chico study area are higher than background values for this area (about 0.15 to 0.20 mg./kg)
Table 19. Although mean values in soils samples from Săo Chico are higher than soils samples
from Creporizinho, no significant differences between them at < 0.05 were obtained.
Data on produces and wild plants were combined with aboveground and root plant
parts for study area to compare mean total mercury concentrations. Only aboveground of
produces samples from the Săo Chico mining site presents significantly higher values for
mercury levels than samples from Creporizinho area (means 2.5517 vs. 0.1183; t = 2.6023, P =
0.0159, Table 20). The non-parametric U Mann Whitney test were used to identify the produce
species with significant values. Only above-ground parts of cabbage present samples size to
perform the test, and significant values for mercury levels (Săo Chico, n = 3, Creporizinho, n = 3,
U = 0, P = 0.050).
To obtaining the relationship between the mercury contamination in soil fractions and
plants, the same data arrangements to compare means were used in regression analysis (Table
21). Data of Săo Chico wild plants aboveground and roots parts were insufficient for the
construction of models. Regression of mercury concentrations in plants versus soil produced
significant model fits for five of 12 analyses performed (Table 21). The slopes of nine regression
models were positive, including of five significant regression models (Figures 40 to 44). Intercept
differed from zero in nine of the regression models. Determination coefficients (r2) for significant
models ranged from 0.5549 to 0.9963. Over all regression models of produce samples generated,
only soil-root produce regression model from the Creporizinho's study area were significant,
and the slope were negative (Figure 40). Over all regression models of wild plants samples
generated, of both aboveground and root plant parts, from Creporizinho's study area were
significant, and the slopes were positive (Figures 45 to 48).
Aboveground : root ratios were higher than 1 in all of the produce samples of Săo Chico
(n = 5), and in only one of Creporizinho study area (n = 3) (Table 22). The translocation of
mercury from soil through roots to aboveground in produce plants was not significant in both
studies areas (Table 21), and mercury uptake probably occurs through stomata by atmospheric
mercury deposition. Aboveground : root ratios were lower than 1 in wild plants (Săo Chico,
n = 3; Creporizinho, n = 11), except samples A5-13 and A5-14 V of Creporizinho (Table 22).
Nevertheless, the translocation of mercury from soil through roots to aboveground in wild
plants were significant in samples of Creporizinho (Table 21), suggesting that a significant
RT2004-004-01 CETEM/MCT 74
proportion of Hg uptake occurs through roots, with higher concentrations in root tissues and
lower translocation to aboveground tissues.
The present results indicate that mercury concentrations in wild plant parts from
Creporizinho study area increase with mercury concentrations in soil. Apparently, they function
as a excluder, restricting transport of metal upwards to aerial parts.
Since Hg concentrations are much higher in aboveground of produces at Săo Chico study
area than in Creporizinho (Tables 23 and 24, and U Mann-Whitney test result), the uptake in
produce plants is likely to occur through atmospheric deposition, but further studies with a
larger sample set are necessary in other to confirm this hypothesis.
In foodstuffs other than fish mercury exists mainly in inorganic form, while the
gastrointestinal absorption is close to 7%. The average total contents of mercury in edible parts
(leaves and stems of cabbage and chive, pulp of cassava and "cara" roots, and pulp of cashew
fruit) were 0.21 ± 0.26 µg/g w wt (n = 13) for Săo Chico, and 0.01 ± 0.01 µg/g w wt (n = 7) for
Creporizinho. We estimate the average dietary daily intake of vegetables and roots close to 100
g, for an adult with 70 kg. Considering 0.3mg the provisional tolerable mercury intake per
person weekly (PTWI), the ingestion of total mercury from those foodstuffs falls close to the
PTWI in Săo Chico area, whereas in Creporizinho area the estimated Hg ingestion falls in a
range much lower than the PTWI. However, it should be taken into account the small
gastrointestinal absorption of inorganic mercury, which results in 0.017 mg/week for Săo Chico
and 0.0007 mg/week for Creporizinho.
Table 19 - Comparison of total mercury values for substrates samples at Săo Chico and
Creporizinho studies areas
Săo Chico
Creporizinho
Substrate Mesh
t
P
n Mean SD n Mean SD
#
200 7 1.9571 1.4305 4 0.9963 0.5152 1.2718 0.2353
soil
# - 200
7
1.5041
1.1247
4
0.9401
0.3950
0.9520
0.3659
# 200
-
-
-
4
0.4921
0.5663
sediment # - 200 -
-
-
4
0.6773
0.8361
Table 20 - Data on total mercury concentrations in produces and wild plants, aboveground
and root plant parts at Săo Chico and Creporizinho studies areas
(Hg concentrations in µg/g dw)
Săo Chico
Creporizinho
Plant parts
Types
t
P
n Mean SD
n Mean SD
Produces 14 2.5517 3.0855 11 0.1183 0.1100 2.6023 0.0159*
Above-
ground
Wild
4 0.3838 0.1455 15 0.3090 0.6161 0.2363 0.8160
plants
Produces
5
0.4141
0.3005 3 0.2588
0.2554
0.7428
0.4856
Root
Wild
4 0.4594 0.2221 11 0.2233 0.2594 1.6085 0.1317
plants
RT2004-004-01 CETEM/MCT 75
Table 21 - Results of regression of the natural log of total mercury concentrations in
produces and wild plants, aboveground and root plant parts versus natural log of total
mercury concentrations in soil fractions at Săo Chico and Creporizinho studies areas
Study Plant parts
Type
Soil fractions
n
r2 P
Area
Above
Produces +200# 13
0.0270
<
0.5916
ground
-200#
13
0.0695
<
0.3841
Wild
plants
+200#
4
- -
h
i
c
o
-200#
4
- -
Roots Produces +200# 5
0.1493
<
0.5205
S
ă
o C
-200#
5
0.0105
<
0.8692
Wild
plants
+200#
4
- -
-200#
4
- -
Above
Produces +200# 11
0.0349
0.5819
ground
-200#
11
0.1025
0.3371
Wild
plants
+200#
15
0.7722
0.00002*
h
o
-200#
15
0.7999
0.00001*
Roots Produces +200# 3
0.9963
<
0.0382*
o
r
i
z
in
-200#
3
0.6891
<
0.3764
e
p
Wild
plants
+200#
11
0.5890
<
0.0058*
Cr
-200#
11
0.5549
<
0.0085*
Table 22 - Ratios of above-ground : root for each plant species of Săo Chico and Creporizinho
studies areas
Sample area
Above-ground :
Study Area
Type
Field number
root ratio
A2-1 cabbage
9.9302
A2-1 chive
1.4057
A2-3 cabbage
3.1460
A2-3 chive
5.3474
Săo Chico
A2-4
mango shoot
1.4541
A2-4 Poaceae
sp.1
0.4655
A2-4 Poaceae
sp.2
0.5963
A2-6 sweet
potato
6.6521
A5-12
Cyperaceae sp. 1
0.5954
A5-13 Poaceae
sp.3
2.8535
Hypolytrum sp.1
A5-14
1.4996
(Cyperaceae)
A6-15 Poaceae
sp.4
0.6313
Creporizinho A6-16
Cyperaceae sp. 2
0.3144
A6-17
Cyperaceae sp. 3
0.0645
A6-17 macrophytes
0.2539
A8-18 cassava
0.6914
A8-19 cabbage
3.5597
A8-21 cabbage
0.4283
A9-22 Poaceae
sp.5
0.2304
A9-22 herbaceous
species 0.3839
Crepori river A9-22 herbaceous
species 0.1838
A11-23
Cyperaceae sp. 4
0.3111
RT2004-004-01 CETEM/MCT 76
y = -1,816 - 2,056 x
r ˛ = 0,9963
-0,4
-0,8
-1,2
-1,6
-2,0
-2,4
-2,8
concentration in cultivate root (µg/g dwt.)
-3,2
95% pred. lim.
-0,8
-0,6
-0,4
-0,2
0,0
0,2
0,4
0,6
0,8
concentration in soil (# 200 µg/g dwt.)
Figure 40 - Significant scatterplots of soil-plant regressions models and the 95% upper
prediction limit of produce plants roots. Hg concentrations (µg/g) were expressed on dry
weight basis. Samples from Creporizinho study area
y = -2,221 + 0,48334 x
r ˛ = 0,7722
1,5
0,5
-0,5
-1,5
ant above-ground (µg/g dwt.)
-2,5
-3,5
concentration in wild pl -4,5
95% pred. lim.
-4
-3
-2
-1
0
1
2
3
4
concentration in soil (# 200 µg/g dwt.)
Figure 41 - Significant scatterplots of soil-plant regressions models and the 95% upper
prediction limit of wild plants above grounds. Hg concentrations (µg/g) were expressed on
dry weight basis. Samples from Creporizinho study area.
RT2004-004-01 CETEM/MCT 77
y = -2,472 + 0,66365 x
r ˛ = 0,7999
1,5
t.)
0,5
g/g dw
µ
ound ( -0,5
gr
-1,5
ild plant above- -2,5
tion in w
a -3,5
concentr -4,5
95% pred. lim.
-2
-1
0
1
2
3
4
concentration in soil (# - 200 µg/g dwt.)
Figure 42 - Significant scatterplots of soil-plant regressions models and the 95% upper
prediction limit of wild plants above grounds. Hg concentrations (µg/g) were expressed on
dry weight basis. Samples from Creporizinho study area
y = -1,849 + 0,23874 x
r ˛ = 0,5890
0,2
-0,2
-0,6
-1,0
ant root (µg/g dwt.)
pl -1,4
l
d
wi
n -1,8
on i
-2,2
-2,6
concentrati
-3,0
95% pred. lim.
-4
-3
-2
-1
0
1
2
3
4
concentration in soil (# 200 µg/g dwt.)
Figure 43 - Significant scatterplots of soil-plant regressions models and the 95% upper
prediction limit of wild plants above grounds. Hg concentrations (µg/g) were expressed on
dry weight basis. Samples from Creporizinho study area
RT2004-004-01 CETEM/MCT 78
y = -1,948 + 0,30558 x
r ˛ = 0,5549
0,2
-0,2
g/g dwt.) -0,6
µ
oot ( -1,0
ant r
pl -1,4
l
d
wi
n -1,8
ti
on i
a
-2,2
-2,6
concentr
-3,0
95% pred. lim.
-2
-1
0
1
2
3
4
concentration in soil (# - 200 µg/g dwt.)
Figure 44 - Significant scatterplots of soil-plant regressions models and the 95% upper
prediction limit of wild plants above grounds. Hg concentrations (µg/g) were expressed on
dry weight basis. Samples from Creporizinho study area
4.4. Mining Technology and Hg Use Issues (Veiga, 2004)
Amalgamation is a preferred method used by artisanal miners to extract fine gold. It has
been known that mercury is an avid collector for gold forming an amalgam paste that can be
easily separated from other solid material in an ore. There are many methods and devices used
to contact mercury with an ore, each of which have their own specific efficiency, effectiveness
and impact on the environment. Mercury is relatively inexpensive. It is commonly sold in
Brazilian "garimpos" (artisanal mining sites).
Artisanal miners use a variety of mining and amalgamation methods. Together with the
fate of contaminated tailings and Au-Hg separation procedures, these methods define the extent
of mercury losses from a specific site. If concentrates are amalgamated, the main emission
source derives from burning amalgam in open pans. This operation, normally, produces a gold
doré that contains 2 to 5% residual Hg. When the doré is melted at gold shops most commonly
located in urban areas, further release of mercury vapor takes place.
When gravity concentrates are amalgamated, the mineral portion is separated from
amalgam by panning, forming a tailing that is usually dumped into a stream generating a "hot
spot". Panning is usually done in water-boxes or in pools excavated in the ground or at creek
margins. Excess mercury is removed by squeezing it through a piece of fabric. The excess is
generally recycled but some is lost to the tailing.
RT2004-004-00 CETEM/MCT 79
Amalgam usually contains about 60% gold and so must be retorted or burned in an open
pan. When retorts are not used, atmospheric emissions represent as much as 50% of the total
mercury introduced into the process. However, when amalgamation in conducted properly and
retorts are used, losses are very low as little as 0.05%. This recycling practice suggests one of
the first approaches to reduce the Hg burden to the environment.
4.4.1. Alternative Processes (Veiga, 2002)
Amalgamation is applied in "garimpos" for two purposes: to cover fine gold from the
whole ore and to extract the gold from concentrates to a very high grade product. The first
application is the one, which must be stopped. This will avoid mercury emissions directly to the
aquatic environment with tailings. To stop the second application is extremely unlikely. So, our
goal should be to encourage use of amalgamation only for gravity concentrates and to see that it
is conducted in a sensible and controlled way.
Amalgamation of the total ore is attractive since the gravity process is easily adaptable to
amalgamation. Mercury can be added directly to the primary extraction operations without
requiring a second processing stage. To eliminate mercury use for the total ore, we must find
alternative methods to recover fine gold. In the initial stages of a "rush", fine gold is rarely an
issue the attraction of a site generally is due to the presence of "easy-to-recover" coarse gold
nuggets. As the ore becomes depleted, the miners will turn to amalgamation to maintain their
gold production by recovering fine gold. Alternatively, some miners may begin reprocessing old
tailings or waste dumps using mercury for fine gold.
Attempts to introduce new gravity concentration equipment, such as shaking tables,
spirals, automatic panners etc, to eliminate amalgamation, have not been very successful.
Mercury use has declined, but never eliminated. The principle of these methods is based on
using gravity to clean an initial (rougher) concentrate to obtain a rich final concentrate for
smelting. Instead of amalgamation, the tables work as cleaners to produce a concentrate that is
smelted and sold. A gold-rich concentrate is produced which must be amalgamated to extract
very fine gold, but this material is very low in weight relative to the ore and so a significant
decrease in mercury consumption results.
Centrifuges, such as Falcon or Knelson Concentrators, have potential as primary gravity
concentrators for fine gold as well as for cleaning ordinary gravity concentrates. A new model of
the Falcon Super Bowl uses a fluidized bed spinning-bowl that can process up to 60 tonnes of
solids/h, applying a centrifugal force of 200G. Concentrates can reach grades above 20,000 g
Au/ton in two stages (rougher and cleaner), which can be directly smelted, potentially avoiding
an amalgamation step. Knelson Concentrators has developed a continuous high-G force unit as
well.
Centrifuges have been manufactures in Brazil (MacKnelson) and area in use by many
artisanal miners. Despite being rough copies of the Knelson Concentrator, they do provide
improvement in gold recovery and a reduction in mercury use.
Froth flotation, has been tried in a few South American artisanal operations to
concentrate fine gold. But even with concentrate grades as high as 3000 g Au/ton, the product
still requires amalgamation or cyanidation it is nor easy to directly smelt such concentrates.
Using xanthate collectors, concentrates were upgraded from 13 g Au/ton to 3,000 g Au/ton at
82% recovery. Flotation of coarse gold (<0.43mm) is inefficient so a two-stage process is
RT2004-004-00 CETEM/MCT 80
necessary. Flotation cannot compete economically with amalgamation as used by artisanal
miners.
Experiments
with
coal-oil agglomeration show some promise. Agglomerates of coal and
oil (5mm) are formed and contacted with a gravity concentrate pulp. Recoveries of 90% are
possible. Envi-tech Inc., Edmonton, Canada has developed a novel agglomeration process using
a proprietary adsorbent. Following 5 to 10 minutes of intense agitation, gold-loaded adsorbent
is separated by froth flotation achieving 70% recovery.
A
salt-electrolytic process to leach gold has been developed by the Center of Mineral
Technology (CETEM) in Rio de Janeiro and tested in a pilot plant in the Tapajos region of Brazil.
This process has the potential to replace amalgamation of gravity concentrates. Material with as
little as 1 µg Au/g is mixed with a sodium chloride solution (1.0M), which is transformed by
electrolysis into a mixture of sodium hypochlorite-chlorate. More than 95% of the gold dissolves
within 4 hours and is collected on a graphite cathode. The solution is recycled, minimizing
effluent discharge. Plastic tanks are used, reducing investment and replacement costs and so the
process may be relatively inexpensive in some cases. The main drawback is the need for trained
personnel to control operating variables (pH, current density etc.).
Cyanidation is a process beginning to appear in artisanal mining operations in Andean
countries and, to a lesser extent, in Brazil. Numerous organized mining companies have
adopted cyanidation of ores and flotation concentrates widely. The establishment of effluent
discharge standards that are difficult, if not impossible has essentially banned the use of
amalgamation, to meet when amalgamation is used. With ores that contain extremely fine gold
or gold in solid solution, cyanidation has replaced amalgamation as the preferred method in
order to obtain high recovery. As coarse gold requires long retention time for cyanide leaching,
it is generally, a gravity process prior to submitting the material to flotation and/or cyanidation
generally removes it.
Despite high gold recoveries, cyanidation needs much more skill and investment than
simple amalgamation. In such cases, artisanal miners need constantly technical support. A small
cyanidation plant can be set up for use by a small mining community, but this is not a general
solution for all cases of artisanal mining. Another important issue is the occupational risk
operator. Although part of the residual cynide is naturally degraded by sunlight and heat, total
cyanide destruction requires a method such as the INCO SO2/air process. These processes are
not simple. Although the environmental impacts of cyanide are usually lower than those of
mercury, the consequences of occupational exposure can be rapid and very dramatic. Cyanide
does not bioaccumulate like mercury, rather it may kill-off food sources in the food-web.
The possibility of replacing amalgamation with other processes is remote, but must be
pursued. For an artisanal miner, mercury is an easy and efficient way to extract fine gold. When
amalgamation is applied to gravity concentrates, more than 90% of the gold is generally
recovered. Alternative processes must be investigated, but no extraordinary breakthrough
should be expected.
RT2004-004-00 CETEM/MCT 81
5. Alternative low cost method for mercury semiquantitative
determination in fish: training of local users
5.1 Colorimetric Method for Hg Semiquantitive Analysis of Fish
The usual analytical method to determine mercury content in biological samples is the
cold vapor technique connected to an atomic absorption spectrometer. Although simple, it
requires qualified technicians and infrastructure, which are not suitable for most of the
locations, where a continuous monitoring of mercury content in fish is to be accomplished, like
in the Amazon region. The lack of laboratory infrastructure and the difficult access to these
places, associated to the high cost of analysis by conventional methods, has inspired the
development of a low cost and easy operational method which attends the WHO
recommendations (Yallouz, 1997; Yallouz et al, 2000 and Yallouz et al, 2002). A brief
description of the method and some results about its quality assurance can be find at Appendix
4.
5.2 Adapting the minilab for mercury analysis in fish samples
The minilab for semiquantitative mercury determination in fish was adapted in a
building that was used in former times by the Companhia de Recursos Minerais (CPRM),
nowaways belonging to the Ntional Health Foundation (FUNASA). Some restoration works
(painting, exhaustion installation) were performed before our starting the training. Equipments
of air-conditioned and freezer were rent for the period of our stay. The technical activities were
developed in the period from 08/04 to 08/22/2003 Allegra Viviane Yallouz and Débora Maia
Pereira.
RT2004-004-00 CETEM/MCT 82
5.3. Developed activities
5.3.1 Background
At the meeting with Dra Amélia Ayako Kamagari Araújo, Municipal Secretary of Health,
it was made a brief exhibition of the objectives of the work. Dra Amélia showed its concern in
relation to the repercussion of studies disclosed by the press that aimed the evaluation of
mercury contamination in babies born in Itaituba. Despite being not conclusive, it mobilized the
public opinion.
The practical work started on 08/08/2003. In the occasion the materials of the kit were
adapted and installed. The equipments (balances and heating plate) and reagents were
organized by the team composed of two trainees.
Since the first moment it was strengthened to the collaborators the need of care with
comments and the ethics related to the popularization of the results, independent of the texts,
seeking to avoid any situation of misunderstanding.
An intensive training of 5 technicians (Table 23) was performed in the use of the method
and quality assurance of analytical results. The training was done strenghtening theoretical
concepts and safe lab practices. Each participant received the detailed work instructions and the
copy of the transparencies used in the seminar.
Table 23 - Users indicated for the training
Name Institution
Lúcia Fátima Cruz Bezerra
AMOT
José Arnóbio Lima Linhares
Municipal Secretary of Agriculture
José Sales of Medeiros
City Hall of Itaituba
Kátia Cilene Silva Peăo
Municipal Secretariat of Health
Telma Lúcia Matias of Araújo
SECTAM
5.3.2. Training new users
The theorical concepts were teached in two steps:
1) Informal discussions using median posters placed on the lab walls were used (Figure 45).


RT2004-004-00 CETEM/MCT 83
MÉ
MÉTODO SE
TODO SEMI - QUANT
-
I
QUANTITATI
TATIVO
VO
MÉ
M TOD
TO O
D S
O E MI
M -
I Q
- U
Q ANTI
N TA
TI
TIV
I O
Solub
lu ilizaçăo d
bilizaçăo da amo
amostra
De
D t
e er
e m
r i
m naç
inaç ăo
ăo d
e
d m
e e
m r
e c
r úri
r o
io em
e p
m ei
pe x
ixes
e
h10 g de filé do pescado
hSoluçăo resultante da solubilizaçăo
h25 mL de mistura H2SO4/HNO3/V2O5
hAquecimento a 90o C , por 1 h
h25 mL SnCl2 50% em HCl 50%
hPapel detetor
h20 mL de H O
2
hAr comprimido
h25 mL de KMnO4 5%
hComparaçăo visual
MÉ
M TOD
TO O
D S
O E MI
M I- Q
- U
Q ANTI
N TA
TITATI
T V
I O
O
Comp
m ar
pa a
r ç
aç ăo Vi
V s
i ual
al
Testando a similaridade entre os
sistemas
Intensidades para diferentes
concentraçőes
100 ng/g
300 ng/g
600 ng/g
Figure 45 - Examples of miniposters used as a didatic material in the minilab
2) A lecture with discussions that was done on the third day of training during four hours, with
discussions with all trainees and two invited researchers from local IBAMA. The lecture was
done in AMOT Chemical concepts of the method, and practical details could be discussed at
this moment. Important topics were discussed as:
· Comparision with usual methods
· Tthe importance of the mercury determination in fish
· The different toxicology of mercury species
· The chemical ways of the mercury in the environment
· Method's applicability
· Method's advantages and limitations
· WHO recommendations and the Brazilian Laws regarding mercury level in fish,
· Quality assurance of the results
· Possible applications.
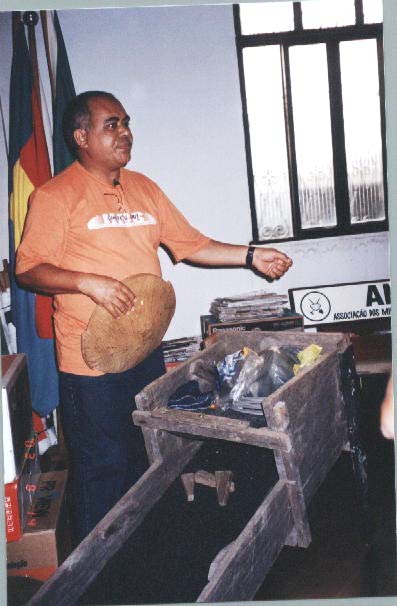
RT2004-004-00 CETEM/MCT 84
During the lecture (Figure 46), we had the opportunity to hear the explanation about the
garimpos' techniques for the concentration of the material extracted by José Sales, using the
models in exhibition in AMOT. They were also presents in this lecture, Alexandre Bezerra of
Carvalho (biologist) and Vera Christiana Pereira Pastokino (chemist), that work in IBAMA
demonstrated interest in participating at the training program. The schedules were not
adequate, and it was only possible to attend the lecture.
Figure 46 - Lecture presented at AMOT
The practical training program (Figure 47) was performed giving individual training for
each participant beggining with a practical demonstration of the use. After demonstration of the
use, each operator participated of an exhaustive practical training in the use of the
determination system until the complete domain of the system using mercury aqueous solutions
with well-known concentration. For the digestion step, three samples acquired in the local
market were used.
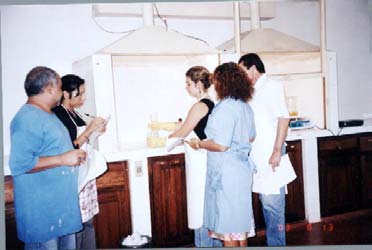
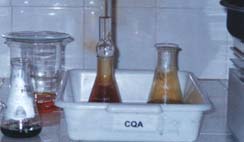
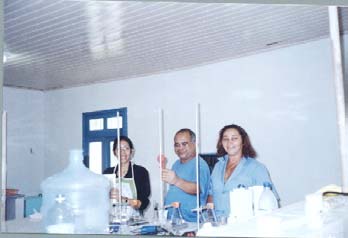
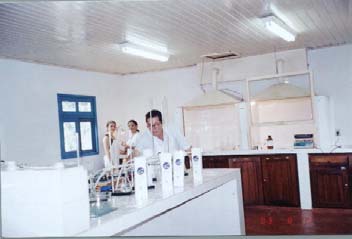
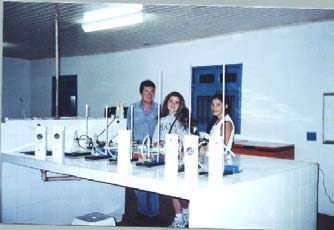
RT2004-004-00 CETEM/MCT 85
Figure 47 - Some views of the training program
The best trainee Kátia, was submitted to test, using a control sample supplied by
Canadian Food Inspection Agency. The obtained results were in agreement with the expected
values (Table 24).
Table 24 - Results from the performance test
Sample
Expected Value (ng/g) Found Value (ng/g)
MQAP 300
142-334
<300
MQAP 329
285-465
300-600
It was also promoted a discussion about teh work instructions with the users to clear
doubts and the users' contribution was considered..
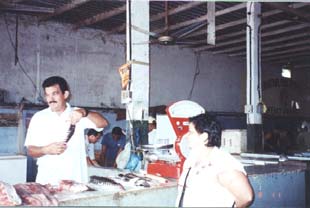
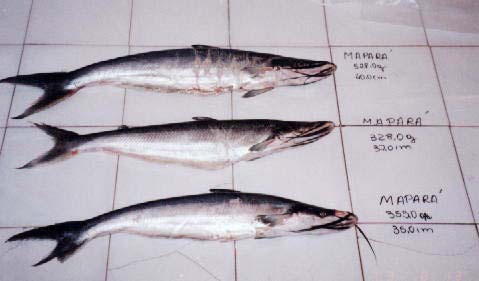
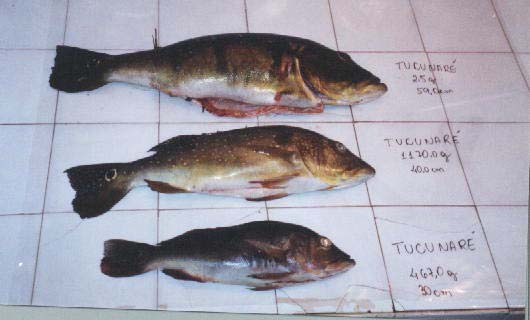

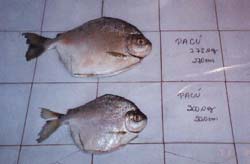
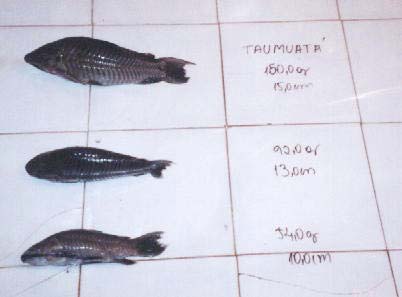
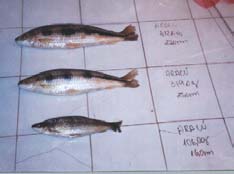
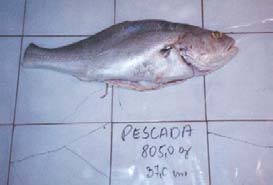
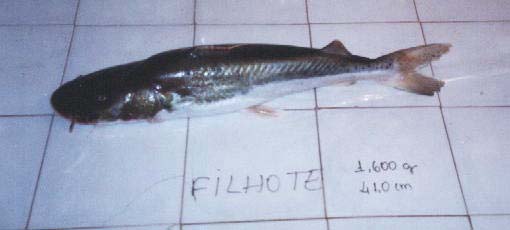
RT2004-004-00 CETEM/MCT 86
5.4. Application study
A short application study was performed to demonstrate the applicability of the method.
When it was possible, it was chosen to work with 3 different sizes from the same species. 28
samples could be analysed by the recently trained team, under our supervision and the results
are shown in Table 25. Fish samples were recorded through pictures and stored and frozen in
plastic bags (Figure 48). The sampling criteria were based on fish habits, size, and preferences of
the population for consumption.
Figure 48 - Some samples analysed by the recently trained group
The samples were analysed in duplicate nad where no correspondence were observed in
triplicate. A control sample was used. All the team worked together with exception of Sra
RT2004-004-00 CETEM/MCT 87
Telma, from Belém, that return after the training was finished. It was a good opportunity to
review every detail with the group.
Table 25 - Results of the analysis of an application study of the method
Sample
Size(cm)/weight(g)
Result
Tucunaré-1 59
/2500
<100
Tucunaré-2 40/1170
300-600
Tucunaré-3 30/467
~
300
Tucunaré-4 ~1000g*
~600
Filhote-1 41/1600 100-300
Filhote-2 ~5000 100-300
Surubim ~1000g* 600-1000
Pirarucu-1 ~170/80Kg
~600
Pirarucu-2 ~74
Kg
>1000
Pescada-1 37/805 100-300
Pescada-2 #
/
750 100-300
Pirapitinga-1 46/2600
<100
Pirapitinga-2 36/1600
<100
Pacu-1 27/
# <100
Pacu-2 20/
# <100
Pacu-3 15/140 <100
Acari-1 # <100
Acari-2 # <100
Acari-3 # <100
Tamuatá-1 10/54
<100
Tamuatá-2 13/92
<100
Tamuatá-3 15/150
<100
Mapará-1 35/355
<100
Mapará-2 37/368 100-300
Mapará-3 528/40 100-300
Aracu(piau)-1 16/106
<100
Aracu(piau)-2 25/319
<100
Aracu(piau)-3 27/412
<100
The results confirm the literature descrition about the diference of accumulation on
carnivurous fishes. The species popularly known as surubim, pirarucu e tucunaré shown a
higher mercury content. Other samples must be analysed for a complete conclusion, but our
intention was to demonstrate how the method can be apllied by a simple and low cost way.
RT2004-004-00 CETEM/MCT 88
5.5. Further applications
Further applications may be done comparing preference intake of the different groups of
fish eaters and the mercury content, to evaluate the risk of contamination. The results may be
used to tranquilize the population or to give guidelines about safer consumption. The Health
Secretaty of Itaituba demonstrated willingness to further applying this methodology. A
questionary to check the population preferences regarding fish consumption should be applied
by health agents (there are about 85 ones, each one covering about 100 families). Following this
step, the most consumed species and the most vulnerable ones should be analysed by the
alternative method and the results be used for an awareness campaign. The experience in
Itaituba was very usefull to evaluate the positive response of the local community in this regard.
6. Helth Assessment
6.1. Introduction
The Health Assessment part of the Global Mercury Project is designed to complement
the Environmental Assessment providing indications of the level of mercury poisoning and
their health effects on ASM communities. This exposure may be caused either by mercury vapor
inhalation or by ingestion of contaminated food, in particular fish as the most accessible protein
in riparian communities, or both. Based on the assessment of pathways and bioavailability of
mercury vapor and methylmercury to the mining communities, the Heath Assessment combines
information from biological samples associated with medical exams to evaluate the level of
impact that the pollutant caused or may cause to individuals residing in "mining and
environmental hot-spots" (Veiga and Baker, 2003).
A Health Assessment is an epidemiological research and therefore includes an
evaluation of the physical and neurological conditions of individuals and possible influences of
external factors that may or may not contribute to the aggravation of their health. Medical exams
were ofsigned to establish a relationship between biomonitoring materials (analysis of hair,
urine and blood) and symptoms of poisoning (Veiga and Baker, 2003).
The main pathways through which mercury is bioaccumulated in humans are the
inhalation of metallic mercury vapor from amalgam burning (and gold melting) and the oral
ingestion of fish contaminated with methylmercury. Other pathways may include inhalation of
Hg evaporated from amalgamation tailings, ingestion of contaminated vegetables or
consumption and dirt ingestion by children (Veiga and Baker, 2003).
The Evandro Chagas Institute, through its Environment Department, responding to a
request by the Centre for Mineral Technology (Centro of Tecnologia Mineral CETEM/MCT) to
participate as a contracted party in the "Removal of Barriers to Introduction of Cleaner Artisanal
Gold Mining and Extraction Technologies" project, under the sponsorship of the United Nations
Industrial Development Organization (UNIDO), performed field and laboratory activities in the
two selected areas to accomplish the study (the "Săo Chico" gold mining and the
"Creporizinho" gold mining) located in the Tapajós region in the municipality of Itaituba-Pa.
RT2004-004-00 CETEM/MCT 89
As part of the investigation of the general health of the local populations and the long
term exposure to mercury, specially by the gold miners and their families, a comprehensive
physical structure has been set up in the two locations to support the activities which included a
field laboratory to collect material, the conditioning of the samples and processing of some
hematological biochemical e parasitologic determinations, a space to fill out the epidemiological
questionnaire and a medical office.
6.2. Area Of Study And Population
The survey about the social-economical conditions of the two working areas: the "Săo
Chico" gold mining and the "Creporizinho" gold mining was performed by Dr. Armin Mathis
of the "Universidade Federal do Pará" and are summarized in the "Report referring to the
prospecting of "Săo Chico and Creporizinho", presented by the author to the other Institutions
involved in the Project. The information served to fund the subsequent activities of a
comprehensive health survey.
6.2.1. "Săo Chico" Gold Mining Area
The access to the Săo Chico community is done, preferably, by air in a freighted airplane,
by land this is only possible during summer time. The villa is located along an old prospecting
landing field.
In the "Săo Chico" community 246 people were attended who fulfilled the necessary
requirements to participate in the research, submitting them to all the steps and procedures
planned in the protocol. The field work steps involved in the filling out of the epidemiological
questionnaire, collecting of material (blood and urine), receiving the standard containers with
preservative for the parasitologic test of feces and doctor service (clinical and neurological).
Table 26 shows the distribution by sex and age of the population resiofnt in this and nearby
locations. About 20% of the population are children up to 10 years old.
There is a predominance of male individuals (n=151) against 95 of the female sex. The
biggest percentages, including men and women, were verified in the age ranges 31-35 and 36-40
with 13.8% and 13.0% of the population considered in the study, followed by individuals of age
range between 46 and 50 with 11,0%. This distribution corresponds to the one expected in
communities such as the Săo Chico.
The information referring to the origin and occupation of the individuals who
participated in the research in the community of "Săo Chico" indicate that 43.1% (n=106) come
from the Maranhăo State, followed by Pará with 34.1% (n=84), Piauí, Goiás and Ceará with 6.5%
(n=16); 2.8% (n=7) and 2.4% (n=6), respectively. As to the occupation of 44.3% that corresponds
to 109 individuals, it referred to prospectors or shop workers dealing with the purchase and sale
of gold. Among the other occupations, businessmen 3.7% (n=9) and other activities 52.0%
(n=128), which include cooks, housewives, cattle farmers, mechanics and salespeople, etc.
RT2004-004-00 CETEM/MCT 90
Table 26 Distribution by age and sex range of the population served at the "Săo Chico"
gold mining, Itaituba, Pará Brazil. 2003.
Age Masculine Feminine Sub-Total %
0 2
6
10
16
6,5
3 5
12
6
18
7,3
6 10
8
6
14
5,7
11 15
3
4
7
2,9
16 20
12
4
16
6,5
21 25
6
9
15
6,1
26 30
10
10
20
8,1
31 35
21
13
34
13,8
36 40
20
12
32
13,0
41 45
12
8
20
8,1
46 50
19
8
27
11,0
51 55
11
2
13
5,3
>55 11
2 13 5,7
Total 151
95 246 100,0
The educational level, evaluated through the number of years of study, is extremely low,
with an average 2 years stay in school. Among the individuals who participated in the research
31.1% (n=77) referred to themselves as not literate. Among the participants of the study in the
age range between 7 and 11, 20.1% (n=42) and those aged 12 (19.7%), which correspond to 42
individuals, are in this situation. It was also verified that in the first age range referred herein,
there are 3 children who are out of school.
6.2.2. Laboratory Analysis for Mercury in Urine
Inhalation of Hg vapor is more significant for mining and gold shop workers directly
involved in handling metallic mercury, but can also indirectly affect surrounding communities.
Hg vapor is completely absorbed through the alveolar tissue. The biological half-life of Hg in
blood absorbed as vapor is about 2-4 days when 90% is excreted mainly through urine (Veiga
and Baker, 2003).
Mercury can accumulate in the central nervous system (CNS) and damage it irreversibly.
Kidneys are the most affected organs in exposure of moderate duration to considerable levels,
while the brain is the dominant receptor in long-term exposure to moderate levels (Suzuki, 1979
APUD Veiga and Baker, 2003).
Occupational Hg vapor exposure in humans indicates that neurotoxicity is the adverse
effect most likely to occur at lowest exposure level (LOEL) and usually it is reversible. Elemental
mercury is categorized as Group D, unable to be classified as to human carcinogen, according to
USEPA Guideline for Carcinogen Risk Assessment (USEPA, 1986).
In general, it is difficult to find an association between exposure level and blood
concentration due to confounding exposure to methylmercury from fish consumption, but this
problem is not so important when analyzing urine, as only a very small fraction of absorbed
methylmercury is excreted by urine (WHO, 1991) and one could assume that most part of Hg in
RT2004-004-00 CETEM/MCT 91
urine is due to Hg vapor exposure. Since inorganic mercury poisoning affects liver and kidneys,
high levels in urine can indicate undue exposure to Hg vapor (Veiga and Baker, 2003).
Determination of total Mercury in the urine and blood samples were performed to
evaluated the exposure to Mercury metallic steam, considered comparison parameters for the
criteria adopted by the OMS. Determinations of Urinary creatinine in urine were also
performed and the values were related to the content of mercury for the correction of the results
and comparison with the data of the literature.
In the Săo Chico community, a total of 235 urine samples were analyzed, where 104 were
those of prospectors and 131 of the control group (intern). The analysis results of blood and
urine Mercury of the participants in the Săo Chico gold mining are summarized in Table 27. The
research used the urine of the people considered as not prospecting as internal control of the
studied population and the Mercury determinations are presented without correction with the
values of creatinine. This correction is the one that has to be used for the comparison with the
clinical results. The arithmetic average of total mercury contents in urine among the prospectors
(17.37 ± 36.55 µg/l; n= 104) represented three times the content found among the non-
prospectors (5.73 ± 8.65 µg/l; n=131). Other data such as maximum amplitude and the
distribution by quarters, also showed the higher mercury levels among the prospectors. After
readjusting the Mercury values by the creatinine values, the average contents of mercury
represented about twice the values observed among the prospectors. Thus in general, a bigger
impact was observed in the reduction of mercury levels in the prospecting group after the
correction of values by Urinary creatinine which shows, in an indirect form, the occurrence of
alteration in excretion of creatinine in this group. Therefore, this could be an adverse effect on
normal kidney function.
WHO (1991) stated that effects of elemental mercury vapor on the kidney had been
reported at lower exposure levels than those associated with the onset of CNS signs and
symptoms.
WHO (1991) concluded that a person with a urine Hg level of 100 ug/g creatinine has a
high probability of developing symptoms such as tremors and erythism. For Hg levels between
30 and 100 µg/g creatinine, the inciofnce of certain subtle effects on psychomotor performance.
The occurrence of several subjective symptoms such as fatigue, irritability and loss of appetite
can be observed. For Hg levels below 30-50 µg/g creatinine, mild effects can occur in the
sensitive individuals but it seems more difficult to observe symptoms.
RT2004-004-00 CETEM/MCT 92
Table 27 - Descriptive statistics of Mercury levels in the researched population of the "Săo
Chico" Gold mining. Itaituba, Pará-Brazil. 2003.
Variables
"Prospectors" "Non-Prospectors"
Total
Hg Urine (µg/l)
No. Individual
104
131
235
Mean/Std. Deviat.
17,37±36,55
5,73±8,65
10,88±25,75
Amplitude
0,157 301,17
0,118 73,06
0,118 301,17
1ş quartil
4,63
1,33
1,78
3ş quartil
15,51
6,54
11,22
Corrected ValuesUrine (µg/g of creatinine)
No. Individual
104
129
233
Mean/Std. Deviat.
9,29±13,59
5,13±13,59
6,99±11,09
Amplitude
0,087 - 78,505
0,090 - 55,000
0,087 - 78,50
1ş quartil
2,178
1,064
1,442
3ş quartil
9,316
5,396
7,665
Hg Blood (µg/l)
No. Individual
106
128
234
Mean/Std. Deviat.
27,74±23,19
16,50±10,46
21,60±18,26
Amplitude
3,90 141,00
2,92 63,00
2,92 141,00
1ş quartil
15,42
10,37
10,90
3ş quartil
35,23
19,26
24,39
Hg Hair (µg/g)
No. Individual
1
136
137
Mean/Std. Deviat.
3,92
3,157±2,63
3,16±2,62
Amplitude
-
0,14 14,97
0,14 14,97
1ş quartil
-
1,55
1,56
3ş quartil
-
3,79
3,84
OBS: The normal values of 10 µg/g creatinine, and Limit of Biological Tolerance (LBT) of 50
µg/g creatinine, in urine, according to the World Health Organization (1990). Methylmercury.
Geneva. Environmental Health. 101-144. For blood the values are: up to 8 µg/l, normal and the
Limit of Biological Tolerance (LBT) of 30 µg/l. For hair, up to 2 µg/g for not exposed
individuals, while 6 µg/g is the Limit of Biological Tolerance (LBT).
In addition, WHO (1991) concluded that a person with a urine Hg levels of 100 µg/g
creatinine has a high probability of developing symptoms such as tremors and erythism. For
Hg levels between 30 and 100 µg/g creatinine, the inciofnce of certain subtle effects on
psychomotor performance. The occurrence of several subjective symptoms such as fatigue,
irritability and loss of appetite can be observed. For Hg levels below 30-50 µg/g creatinine,
mild effects can occur in the sensitive individuals but it seems more difficult to observe
symptoms.
However, Drasch et al (2001) have found that miners from gold mining area, with
median levels of 11.0 and max. 294 µg/l showed classical symptoms of mercury intoxication
such as tremor, ataxia, metallic taste, blush line in the gums. The authors diagnosed chronic
mercury intoxication based on high blood/urine and/or hair mercury levels together with
RT2004-004-00 CETEM/MCT 93
abnormal medical examination results. They also found that individuals not directly involved
with Hg handling had high Hg levels in urine (median 4.1, max 76.4 µg/l), relative to an outside
control group (median 1.7, max. 7.6 µg/l). These results are very consistent with the present
work. The control group, which is not involved directly with Hg handling, presented Hg in
urine close to 6 µg/l and max. 73.06 µg/l.
In Brazilian Amazon, gold shop workers with high levels of Hg in urine (average around
270 µg/l) exhibited some signs of mercurialism, such as dizziness, headache, palpitations,
tremors, pruritus and insomnia (Malm et al., 1995).
Another study with 20 amalgamation workers, 8 individuals presented high mercury
levels in urine (exceeding 50 µg/g creatinine) and 4 of them with symptoms of poisoning such
as stomach irritation, nausea, sexual dysfunction, headache and character alteration. Mercury
levels in urine as high as 460 µg/g creatinine were observed (Schulz-Garban, 1995; as cited in
Veiga and Baker, 2003).
A positive correlation has been established between the daily time-weighted exposure to
Hg vapor and the daily mercury in blood and urine (Roels, 1987 apud WHO, 1991). Urinary
levels about 50 µg/g creatinine were seen occupational exposure to about 40 µg/m3 in the air.
Such exposure would correspond to about 17 µg/l of blood. So, values for air concentration (in
µg/m3) are approximately the same as those for urine mercury concentration (expressed in
µg/g creatinine) (WHO, 1991).
The ratio of urine to air concentrations was re-evaluated by WHO (1980) to be closer to
2.0-2.5. However, USEPA 2001, using experiments with animals, indicates continuous exposure
to Hg above 0.3 µg/m3 of air may present a health hazard. The critical effects related to human
exposure to elemental mercury are reported as hands tremor, increases in memory disturbances,
slight subjective and objective evidence of autonomic dysfunction.
At the Săo Chico gold mining, 106 blood samples of individuals referring to themselves
as prospectors were analyzed and 128 of the non-prospectors group (control). The average
mercury concentration in the group of gold miners reachs 27.74 µg/l, varying from 3.90 to
141.00 µg/l. In the second group, the average mercury level reachs 16.50 µg/l, varying from 2.92
to 63.00 µg/l. In blood samples, the average mercury concentration among the prospectors was
almost the double of those observed in non-prospectors.
The mercury levels in hair were analyzed among the non-prospectors and presented an
average of 3.15 µg/g with a variation of 0.14 to 14.97 µg/g, the majority remaining (third quarter
- 75%) below the LTB (6 µg/g) and near the normal limits for those not exposed (2 µg/g).
The mean concentration of total mercury in whole blood (in the absence of consumption
of fish with high methylmercury levels) is probably of the order of 5-10 µg/l, and the hair about
1-2 ug/g. The average mercury concentration in urine is about 4 µg/l. One source of the
variation in urine levels seems to be exposure from dental amalgams while for blood and hair
levels fish consumption is the major source of exposure (WHO, 1991).
The background level in hair falls in the range of 1-2 µg/g (WHO, 1991). Hazardous
effects on fetus are likely when 20 µg/g is analyzed in the hair of pregnant women (Krenkel,
1971). WHO (1990) reports that 50 µg/g Hg in hair is an adequate threshold to observe clinical
effects and that child-bearing women with Hg concentrations in hair above 70 ug/g exhibit
more than 30% risk of having neurological disorder in the offspring. Levels of 10 µg/g must be
considered as the upper limit guideline for pregnant women (Skerfving, 1973). Recent
evaluation considers 5 µg/g Hg in hair a safety guideline for pregnant women (Yagev, 2002)
RT2004-004-00 CETEM/MCT 94
6.2.3. Analysis of Some Variables Contained in the Index Cards (Preliminary
Results). Săo Chico, Itaituba, Pará-Brazil. 2003.
The general working conditions with mercury (Table 28) show that 84.1% of the
prospectors have been using mercury directly in their activities, as an average, for 15 years,
performing the burning of gold-mercury amalgam in open recipient, characterizing an chronic
occupational exposure. Only 11.2% use a retort for the process of burning amalgam, which is a
recent improvement for mercury handling in this area.
Table 28 - Occupational conditions of the use of mercury in the Săo Chico gold mining.
Itaituba, Pará-Brazil. 2003.
Săo Chico
n = 109
Variables
Nş of gold
Average working
miners
%
time
(years)
Work with Hg
90
84,1
14,9
Hg burning in open air
82
76,6
-
Use of retort
12
11,2
2,1
The diagnosis of the main diseases in the region is shown on Table 29. As expected, the
highest incidence refers to malaria, with 4 cases detected and treated at the moment of the
research. Past cases of malaria were reported by 94.5% of the prospectors (an average of 6 past
episodes) and 71.5% of the non-prospectors (average of 4 past episodes). Other diseases were
also pointed out, such as tuberculosis, hanseniasis and hepatitis of unspecified origin, all with
one current case. Therefore, malaria is spread all over the study area, being almost all the local
population infected by this endemic disease. This makes malaria a potential confounder
parameter when analyzing health effects due to mercury.
Table 29 Analysis of the Main Diseases of the Region - Săo Chico. Itaituba, Pará-Brazil.
2003.
Variables
Prospectors
Non-Prospectors
Malária
(N=109)
(N=137)
Total
Current
1 (0,9%)
3 (2,1%)
4 (1,6%)
Past
103 (94,5%)
98 (71,5%)
201 (81,7%)
Mean incidence
6,0
4,0
5,0
Tuberculosis
Current -
1
(0,7%)
1(0,4%)
Past
2 (1,8%)
1 (0,7%)
3 (1,2%)
Hanseníase
Current -
1
(0,7%)
1
(0,4%)
Past
1 (0,9%)
-
1 (0,4)
Hepatitis
Current -
1
(0,7%)
1
(0,4%)
Past
12 (11,0%)
20 (14,6%)
32 (13,0)
The existence of intestinal parasitism in the Săo Chico god mine showed the occurrence
of parasite agents presented in Table 30, where the presence of Ancilostomidis and the Ascaris
RT2004-004-00 CETEM/MCT 95
lumbricoiofs were more prevailing among the helmintos and Giardia lamblia and Entamoeba
histolytica are noted among the protozoa.
Table 30 - The prevailing of Intestinal Parasites in the Săo Chico community. Itaituba, Pará-
Brazil. 2003.
Helmintos e Protozoan Prospectors Non-Prospectors
Total
(N=109)
(N=137)
(N=246)
n
(%)
n
(%)
n
(%)
Ascaris lumbricoiofs
13 11,9 27 19,7 40 16,3
Trichuris trichiura
1
0,9 1
0,7 2 0,8
Strongiloiofs stercoralis
0 - 1 0,7 1
0,4
Ancilostomiofos
42 38,5 29 21,2 71
28,9
Giardia lamblia
22 20,6 42 30,7 64
26,0
Entamoeba histolytica
23 21,5 32 23,4 30
21,2
WHO (1991) concluded that a person with a Hg level in urine of 100 µg/g creatinine has
a high probability of developing symptoms such as tremors and erythism. For Hg levels
between 30 and 100 µg/g creatinine, the incidence of certain subtle effects on psychomotor
performance. The occurrence of several subjective symptoms such as fatigue, irritability and loss
of appetite can be observed. For Hg levels below 30-50 µg/g creatinine, mild effects can occur in
the sensitive individuals but it seems more difficult to observe symptoms.
Occupational exposure of mercury has resulted on effects on CNS. Acute exposure has
cause delirium, hallucinations and suicidal tendency as well as erithism (exaggerated emotional
response), excessive shyness, insomnia and muscular tremors. The latter symptoms are
associated with long-term exposure to high levels of Hg vapor. In milder cases, erithism and
tremors regress slowly over a period of years following removal from exposure pathways
(WHO, 1991).
Long-term, low-level Hg vapor exposure has been characterized by less pronounced
symptoms of fatigue, irritability, loss of memory, vivid dreams and depression (WHO, 1991).
Some signs and symptoms of interest were investigated to evaluate the mercury
exposure, as demonstrated in Tables 31 and 32.
Table 31 - Some Signs and Symptoms of the Prospecting Population of Săo Chico. Itaituba,
Pará-Brazil. 2003
Never once/month once/week once/day
Symptoms
n
%
n
%
n
%
n
%
Metallic Taste 91 83,5
7
6,4
2
1,8
9
8,3
Sialorrhea 78
71,6
14
12,8
4
3,7
13
11,9
Náusea 83
76,1
19
17,4
5
4,6
2
1,8
Cefaléia 55
50,5
33
30,3
8
7,3
13
11,9
Palpitation 63
57,8
29 26,6 5 4,6
12
11,0
Paresthesia 56
51,4
14 12,8 7 6,4 32
29,4
RT2004-004-00 CETEM/MCT 96
Table 32 - Some Signs and Symptoms of the Non-Prospecting Population of Săo Chico.
Itaituba, Pará-Brazil. 2003.
never once/month
once/week
once/day
Symptoms
n
%
n
%
n
%
n
%
Metallic Taste 131 95,6
2
1,5
-
-
4
2,9
Sialorrhea 127
92,7
6 4,4 1
0,7
3
2,2
Náusea 109
79,6
22
16,1
3
2,2
3
2,2
Cefaléia 95
69,3
20
14,6
7
5,1
15
10,9
Palpitation 107
78,1
20 14,6 8 5,8 2
1,5
Paresthesia 120
87,6
12 8,8 3 2,2 2 1,5
In general, the occurrence of these symptoms was more frequent among the prospectors
rather than among the non-prospectors, mainly for symptoms cited as once a month or once a
day. The frequency of paraesthesia is pretty higher in gold miners than in control group, as well
as other important symptoms, as metallic taste and palpitations. These findings suggest effects
due to mercury exposure in gold miners.
Certain symptoms such as nausea (that can be associated to digestive disturbance and to
parasitism) and headache (associated to many causes) are similar in the two groups.
Although pulmonary problems and dermatitis due to high levels of Hg vapor were the
main symptoms reported in a population exposed to Hg vapor in the Peruvian Yanacocha mine
(Veiga and Baker, 2003), in Table 33 we observe the predominance of skin mucus paleness,
which represents n= 130 (52.8%) of the population, the non-prospectors category prevailing
with 77 (56,2%). This situation is the consequence of the anemic parasitism syndrome, common
to other communities of the rain forest, investigated by the Environment Department of the
Evandro Chagas Institute.
Table 33 Analytical Results of Skin - Săo Chico. Itaituba, Pará-Brazil. 2003.
Prospectors Non-Prospectors
General
Symptoms
(n=109)
(n=137)
(n=246)
n % Cases
n
% Cases
n % Population
Skin paleness
53
48.6%
77
56.2%
130
52.8%
Skin Itch
7
6.4%
18
13.1%
25
10.2%
Hypochromatic Spots
3
2.8%
9
6.6%
12
4.9%
Hyperchromatic Spots 3
2.8%
11
8.0%
14
5.7%
Piodermitis 1
0.9%
-
-
1
0.4%
Impetigo 1
0.7%
-
-
1
0.4%
Symptoms typically associated with high, short-term exposure to Hg vapor (1000 to
44,000 µg/m3), such as those miners are subject to when burning amalgam in open pans, are
chest pains, dyspnoea, cough, haemoptysis, impairment of pulmonary function and interstitial
pneumonitis (Veiga and Baker, 2003).
Table 34 shows the results of digestive system analysis in gold mining workers and
control group.
RT2004-004-00 CETEM/MCT 97
Table 34 Analytical Results of the Digestive System - Săo Chico. Itaituba, Pará-Brazil. 2003.
Prospectors Non-Prospectors
General
Symptoms
(n=109)
(n=137)
(n=246)
n % Cases
n
% Cases
n % Population
Anorexia 8
7.3%
20
14.6%
28
11.4%
Hepatomegaly 4
3.7%
1
0.7%
5 2.0%
Diarrhea 4
3.7%
7
5.1%
11
4.5%
Intestinal Obstipation 1
0.9%
-
-
1
0.4%
Esplenomegaly 3
2.8%
1
0.7%
4 1.6%
Abdominal Pain
41
37.6%
48
35.0% 89
36.2%
Dispepsia 28
25.7%
13
9.5%
41
16.7%
Pelvic Pain
2
1.8%
22
16.1% 24
9.8%
Icterícia 2
1.8%
-
-
2
0.8%
Vomit 4
3.7%
9
6.6%
13
5.3%
Weight Loss
2
1.8%
3
2.2%
5
2.0%
Nutrition Disturbance
2
1.8%
1
0.7%
3
1.2%
The frequency of hepatomegaly, splenomegaly and dispepsia in gold mining workers is
close to 5, 4 and 3 times higher than in control group, respectively. These results are consistent,
since inorganic mercury poisoning affects liver and kidneys.
The results of Table 35 refer to the frequency in which one finds infections in the upper
airways, probably due to the climate conditions and the high diversity of viral and bacterial
agents in the region, associated to the general health and environmental conditions.
Table 35 Analytical Results of the Respiratory System - Săo Chico. Itaituba, Pará-Brazil.
2003.
Prospectors Non-Prospectors
General
Symptoms
(n=109)
(n=137)
(n=246)
n % Cases
N
% Cases
n % Population
Crackling Stertors
1
0.9%
2
1.5%
3
1.2%
Sub-crackling Stertors 7
6.4%
17
12.4% 24
9.8%
Sibilos 2
1.8%
3
2.2%
5
2.0%
Epistaxe 1
0.9%
-
-
1
0.4%
Rinorrhea -
-
10
7.3%
10
4.1%
Nasal Obstruction
1
0.9%
1
0.7%
2
0.8%
Pharynx Hiperemia
-
-
4
2.9%
4
1.6%
Amygdala Hipertrofy -
-
5
3.6%
5
2.0%
Dispnea 8
7.3%
8
5.8%
16
6.5%
Cough 7
6.4%
20
14.6%
27
11.0%
Lung Disturbance
7
6.4%
19
13.9% 26
10.6%
The frequency for the most symptoms showed in Table 36, was similar between groups,
except arterial hypertension, for which the gold miners showed frequency close to 3 times
higher than the control group.
RT2004-004-00 CETEM/MCT 98
Table 36 Analytical Results of the Cardiovascular System - Săo Chico. Itaituba,
Pará-Brazil. 2003.
Prospectors
Non-Prospectors
General
Symptoms
(n=109)
(n=137)
(n=246)
n % Cases n
% Cases
n % Population
Cardiac Disturbance
1
0.9%
1
0.7%
2
0.8%
Arterial Hypertension 7
6.4% 4 2.9%
11 4.5%
Taquycardia -
-
3
2.2%
3
1.2%
Bradicardia 1
0.9%
-
-
1
0.4%
Precordial Pain
1
0.9% 2 1.5% 3
1.2%
Table 37 shows similar frequency for most of the symptoms in both groups. However, it
was detected higher frequency of muscular and articular pain in the control group.
Table 37 Analytical Results of the Osteomuscular System - Săo Chico. Itaituba, Pará-Brazil.
2003.
Prospectors Non-Prospectors
General
Symptoms
(n=109)
(n=137)
(n=246)
n % Cases
n
% Cases
n % Population
Backbone Pain 4
3.7%
3
2.2%
7
2.8%
Spine
Pain 36
33.0%
26 19.0%
62 25.2%
Fatigue 26
23.9%
31
22.6%
57
23.2%
Astenia 26
23.9%
32
23.4%
58
23.6%
Muscle Pain
55
50.5%
41
29.9%
96
39.0%
Thorax Pain
14
12.8%
9
6.6%
23
9.3%
Articular Pain 55
50.5%
39
28.5%
94
38.2%
6.2.4. Mercury Burden
This section provides analysis of clinical and neurological signs and symptoms and their
possible association with mercury concentrations in prospectors and non-prospectors of Săo
Chico. The common manifestation of chronic exposure to excessive levels of Hg vapor is the
metallic taste and gum diseases, such as gingivitis, ulcers and formation of a blue line at gum
margins (Stopford, 1979).
The self-perception survey as to health and sickness in the group of prospectors obtained
very similar answers, i.e., 51% of the individuals feel healthy, while 49% feel they are not
healthy (Table 38). However, in the non-prospectors group these percentages are 73 and 27%,
respectively.
The mercury levels in urine of the prospectors presented a difference in relation to the
health complaints, such as metal taste, hair loss and breathing problems as well as renal illness.
This difference however did not prevail after the statistics evaluation (p>0.05). In the case of
tremors related, and its interference in work, a significant difference has been observed (T-test=-
2.69, p=0.004). The worsening of the health did not show a significant variation in relation to the
mercury exposure (p>0.05).
RT2004-004-00 CETEM/MCT 99
Table 38 Average mercury contents in prospectors and non prospectors according to health
self-perception and the presence of certain health complaints, Săo Chico gold mining,
Itaituba, Pará-Brazil, 2003.
Prospectors (104)
Non-Prospectors (129)
Self-Perception of
Mean of Hg Corrected Values
Mean of Hg Corrected Values
Health
n
Urine
n
Urine
(µg/g of creatinine)
(µg/g of creatinine)
Feel Healthy
Yes 53
8,65±13,49
94
5,35±9,18
No 51
9,97±13,79
35
4,54±4,36
Perception of Health Worsening
Not Exposed
37
6,59±8,43
88
4,67±8,56
Exposed (No)
33
10,90±18,96
25
6,09±7,82
Exposed (Yes)
34
10,69±11,73
16
6,15±6,36
Tremors
No
54
5,94±7,35
101
5,12±8,76
Yes 50
12,92±17,43
28
5,17±5,57
Metallic Taste
Yes 17
12,45±16,03
6
5,00±6,08
No 87
8,68±13,07
123
5,14±8,26
Sialorrhea
Yes 30
8,53±9,75
10
3,60±4,90
No 74
9,60±14,91
119
5,26±8,37
Appetite
Yes 72
9,51±13,07
32
4,71±7,89
Disturbed 32 8,82±14,89
17
7,91±9,49
Weight Loss
Yes 15
9,41±19,57
5
9,20±16,36
No 89
9,28±12,45
124
4,97±7,73
Hair Loss
Yes 9
4,94±5,83
30
5,45±7,66
No 95
9,71±14,05
99
5,03±8,33
Cough
Yes 2
1,53±1,47
3
1,78±0,78
No 102
9,45±13,67
126
5,21±8,23
Renal Sickness
Yes 16
6,34±5,09
3
1,08±0,56
No 88
9,83±14,57
126
5,23±8,22
Respiratory Disturbance
Yes 9
14,47±24,59
6
4,46±5,53
No 95
8,81±12,16
123
5,16±8,27
In relation to tests of static balance, 43.3% of the prospectors showed an alteration in at
least one of the evaluation forms, while in the non-prospectors group this percentage was of
13.2%. The mercury levels however, in the prospectors with some variation were about twice the
average of contents found in the non-prospectors (Table 39).
RT2004-004-00 CETEM/MCT 100
Table 39 Alterations registered in the static balance investigation in 104 prospectors and 129
non-prospectors, Săo Chico gold mining, Itaituba, Pará-Brazil, 2003.
Prospectors (N=104)
Non-Prospectors (N=129)
Altered
Normal
Altered
Normal
Mean Hg Urine
Mean Hg Urine
Mean Hg
Mean Hg
N
(µg/g creatinine)
N
(µg/g creatinine)
N
Urine (µg/g
N
Urine (µg/g
creatinine)
creatinine)
Static
45
Balance
10,26±14,96
59
8,56±12,53
17
4,68±5,79
112
5,20±8,48
Stand
(open
7
16,29±17,12
97
8,79±13,27
2
2,43±1,05
127
5,18±8,21
eyes)
Stand
(closed
39
11,13±15,90
65
8,19±12,00
15
4,82±6,11
114
5,18±8,41
eyes)
Bend
30
9,94±16,04
74
9,03±12,58
5
8,76±8,31
124
5,06±8,18
Down
Tremors 40 9,91±15,02
64
8,91±12,72
7
6,94±8,23
122
5,03±8,17
The evaluation of dynamic balance (Table 40) also showed variation in about 1.9% of the
prospectors (alteration in at least one of the tests) and also 0.8% of the non-prospectors, with an
average in the mercury levels well higher in the first group as compared to the second one.
Table 40 Alterations registered in the dynamic balance in 104 prospectors and 129 non
prospectors, Săo Chico gold mining, Itaituba, Pará-Brazil, 2003
Prospectors (N=104)
Non-Prospectors (N=129)
Altered
Normal
Altered
Normal
Mean Hg
Mean Hg
Mean Hg
Mean Hg
N Urine (µg/g
N
Urine (µg/g
N
Urine (µg/g
N
Urine (µg/g
creatinine)
creatinine)
creatinine)
creatinine)
Dynamic
2
Balance
24,22±25,66
102
9,00±13,32
1 10,18 128
5,10±8,18
Walk
1 42,37 103
8,97±13,26
- - 129
5,14±8,16
Forward
Walk
1 42,37 103
8,97±13,26
- - 129
5,14±8,16
Backward
Feettip
- - 104
9,29±13,59
1 10,18 128
5,10±8,18
Walking
Heel
1 42,37 103
8,97±13,26
- - 129
5,14±8,16
Walking
Joint Feet
- - 104
9,29±13,59
- - 129
5,14±8,16
Jumping
Right Foot
- - 104
9,29±13,59
- - 129
5,14±8,16
Jumping
Left Foot
- - 104
9,29±13,59
- - 129
5,14±8,16
Jumping
Ataxia - - 104
9,29±13,59
- - 129
5,14±8,16
Rigidity 1 6,07 103
9,33±13,66
- - 129
5,14±8,16
Most prospectors answered negatively when questioned about physical fatigue (Table
41), no relevant differences were found in the levels of mercury among the prospectors
RT2004-004-00 CETEM/MCT 101
according to a positive or negative answer regarding physical fatigue. In the non-prospectors,
the reports on physical fatigue as well as mercury levels were always lower.
Table 41 Physical fatigue evaluation in 104 prospectors and 129 non-prospectors, Săo Chico
gold mining, Itaituba, Pará-Brazil, 2003.
Prospectors (N=104)
Non-Prospectors (N=129)
Altered
Normal
Altered
Normal
Mean Hg
Mean Hg Urine
Mean Hg
Mean Hg
n
Urine (µg/g
n
(µg/g
n
Urine (µg/g
n
Urine (µg/g
creatinine)
creatinine)
creatinine)
creatinine)
Physical Fatigue 54
9,01±10,70
50
9,60±16,26
21
5,58±8,95
108
5,05±8,04
Easily Tired
46
8,90±11,16
58
9,60±15,34
18
6,31±9,49
111
4,94±7,95
Need more Rest 42
9,47±11,51
62
9,17±14,93
16
6,74±9,98
113
4,91±7,89
Sleepy 38
8,51±11,41
66
9,74±14,77
12
5,27±10,79
117
5,12±7,90
Disposition to
31
Daily Tasks
8,71±9,76
73
9,54±14,98
12
2,37±2,73
117
5,42±8,48
Lack of Energy
39
8,11±8,96
65
10,00±15,76
13
4,34±5,65
116
5,22±8,41
Less Muscle
45
8,61±9,19
59
9,82±16,23
15
4,52±5,51
114
5,19±8,38
Strengh
Feel Weak
48
8,05±8,73
56
10,36±16,69
16
4,42±5,37
113
5,24±8,49
Good
Disposition but
44
7,96±9,00
60
10,27±16,16
12
3,50±5,08
117
5,30±8,41
Easily Tired
In the mental fatigue evaluation (Table 42) of the prospectors the negative answers were
also predominant as to the survey carried on, however among the non prospectors there were
less negative answers when compared to those of the prospectors, and mercury contents were
also much lower.
Table 42 . Mental fatigue evaluation in 104 prospectors and 129 non-prospectors, Săo Chico
gold mining, Itaituba, Pará-Brazil, 2003.
Prospectors
(N=104)
Non-Prospectors
(N=129)
Altered
Normal
Altered
Normal
Mean Hg
Mean Hg
Mean Hg
Mean Hg
n
Urine (µg/g
n
Urine (µg/g
n
Urine (µg/g
n
Urine (µg/g
creatinine)
creatinine)
creatinine)
creatinine)
Mental
52
Fadigue
11,07±16,30
52
7,52±10,06
36
4,01±5,08
93
5,26±9,09
Difficulty to be 29
9,12±14,28
75
9,36±13,42
20
4,29±5,40
109
5,29±8,62
concentrated
Difficulty to
25
6,79±8,14
79
10,09±14,86
5
2,25±2,43
124
5,25±8,29
think clearly
Difficulty to
24
18,91±8,62
80
9,97±14,74
3
2,54±3,11
126
5,20±8,23
oral expression
Ocular Fadigue 45
10,64±14,71
59
8,27±12,71
27
4,10±4,71
102
5,41±8,45
Memory
40
11,22±15,40
64
8,09±12,31
32
4,70±4,99
97
5,28±8,98
Disturbance
RT2004-004-00 CETEM/MCT 102
Table 43 shows several parameters related to muscular strength na reflex
alterations.
Table 43 Muscular Strength and Reflex Alterations - Săo Chico, Itaituba, Pará-Brazil, 2003.
Prospectors (N=104)
Non-Prospectors (N=129)
Altered
Normal
Altered
Normal
Mean Hg
Mean Hg
Mean Hg
Mean Hg
n
Urine (µg/g n Urine (µg/g n Urine (µg/g
n
Urine (µg/g
creatinine)
creatinine)
creatinine)
creatinine)
Abdominal Skin
- - 104
Reflex
9,29±13,59
- - 129
5,14±8,16
Mentolabial Reflex
66
10,73±15,71
38
6,41±8,42
45
4,71±5,04
84
5,36±9,43
Reflex of Babinski
2
11,92±3,92
102
9,24±13,72
5
5,58±5,88
124
5,12±8,25
Reflex of Hoffmann
1
9,15
103
9,30±13,66
3
7,08±7,24
126
5,09±8,20
Press Strength
67
10,78±15,79
37
6,59±8,43
50
5,39±6,76
79
4,97±8,97
SRP (Reflex of
21
13,49±19,00
83
8,23±11,77
6
4,71±5,64
123
5,16±8,28
quadríceps)
BSR (Reflex of
14
16,84±22,52
90
8,12±11,37
3
7,16±7,43
126
5,09±8,19
bíceps braquial)
Radial Reflex
5
31,27±30,68
99
8,18±11,40
1 0,78 128
5,17±8,18
RA Reflex
Aquileu (tríceps
15
16,46±21,69
89
8,09±11,45
2
1,23±0,64
127
5,20±8,21
sural)
Yesetria facial
1
3,18
103
9,35±13,65
- - 129
5,14±8,16
Muscular Strengh
-
-
104
9,29±13,59
- - 129
5,14±8,16
Ocular Movement
-
-
104
9,29±13,59
- - 129
5,14±8,16
Tactile Sensitivity
-
-
104
9,29±13,59
- - 129
5,14±8,16
Pain Sensitivity
-
-
104
9,29±13,59
- - 129
5,14±8,16
Distinguishing
- - 104
9,29±13,59
- - 129
5,14±8,16
Segmental Position
Distinguishing
- - 104
9,29±13,59
- - 129
5,14±8,16
Colors
Distinguishing
- - 104
9,29±13,59
- - 129
5,14±8,16
Geometric Forms
Intentional Tremor
21
10,00±16,72
83
9,12±12,80
1 0,35 128
5,17±8,18
Ataxia
3
16,01±22,83 101
9,09±13,36
- - 129
5,14±8,16
For all parameters, gold miners showed higher frequency than non-goldmi ners, except
for Reflex of Babinski and Reflex of Hoffman. In Mentolabial reflex, press strength, intuitional
tremor, the differences of frequency between groups were close to 20%, higher in gold miners.
Ataxia close to 3% of frequency, was hoted only in gold miners.
6.3. "Creporizinho" Gold Mining
In the Creporizinho community, 451 individuals participated in all the steps of the
protocol of the Project. However, a contingent of 208 people sought the IEC-SAMAM team and
received medical service, be it with present and/or past clinical complaints. Table 44 shows a
distribution of the population who was served in this location. About 15% of the population are
children from zero to 10 years old.
RT2004-004-00 CETEM/MCT 103
Table 44 Distribution by age range and sex of the population served in the "Creporizinho"
gold mining. Itaituba, Pará-Brazil. 2003.
Age Masc. Fem. Sub-Total %
0 2
6
5
11
2,4
3 5
13
7
20
4,4
6 10
15
16
31
6,9
11 15
5
13
18
4,0
16 20
5
3
8
1,8
21 25
4
11
15
3,3
26 30
13
13
26
5,8
31 35
32
18
50
11,1
36 40
60
18
78
17,3
41 45
51
24
75
16,6
46 50
36
16
52
11,5
51 55
20
6
26
5,8
>55 34 7 41 9,1
Total 294 157 451 100,0
The information referred to in the epidemiological inquiry related to origin showed that
48% (n=216) of the individuals are from Maranhăo, followed by 29,1% (n=131) originating from
the state of Pará. The rest of the individuals belong to Piauí 6,2% (n=28); Ceará 3,8% (n=17) and
Goiás 2,4% (n=11). As to marital status, 27,6% (n=124) reported being single and 51,9% (n=233)
said they were married or lived as a couple.
The epidemiological inquiry also showed that 51,2% (n=230) of the individuals
participating in the survey were at the moment working as "prospectors" in the poor districts
near the urban centers as businessmen 2,9% (n=13), salesclerks of shops buying and selling gold
0,7% (n=3). Other occupations 45,3%, which include housewives, cooks, sales people, etc.
As to schooling referred to by the individuals who participated in the survey, it was
verified that the average time spent in school was 2 years. The level of the illiterate people is
21,8% (n=98) whereas in the age range between 6 and 11 and older than 12, these levels are 17,4
and 18,4%, respectively. There is also, out of a total of 29 children between 7 and 11 years old
one out of school and the rest with 1 to 2 years of school attendance.
6.3.1 Laboratory Analysis for Mercury in Urine
In the Creporizinho community a total of 345 urine samples were analyzed, 170 of which
belonging to prospectors and 175 to the control group (intern). The analysis results of Hg blood
and urine of the Creporizinho gold mining participants are summarized in Table 45. Here too
the urine of people considered non-prospectors was analyzed as an internal control of the
studied population and the Hg determinations are presented with and with correction Hg
Urinary creatinine. The arithmetic average of total Hg contents in urine among the prospectors
(13.75±19.59 µg/l; n= 170)) represented 3.5 times the content found among the non-prospectors
(3.91±4.87 µg/l; n= 175). These values are similar to Săo Chico garimpo's area, showed
previously. Other data such as the maximum amplitude and the distribution by quarters also
showed the highest levels of Hg among the prospectors. After the adjustment of Hg values by
RT2004-004-00 CETEM/MCT 104
the values of creatinine, the average contents of Hg also represented about twice the contents
observed among the prospectors. In general, a bigger impact was observed in the Hg level
reduction in the prospectors group after the correction of values by the Urinary creatinine,
which indirectly shows the occurrence of variation in Urinary excretion of creatinine in this
group, as said previously for the same results from Săo Chico garimpo's area.
At the Creporizinho gold mining, 211 blood samples of individuals referring to
themselves as prospectors were analyzed and 190 of the non-prospecting group (control). The
average Hg concentration in the prospectors group was of 25.23 µg/l with a variation of 0.74
and 128.74 µg/l. In the second group, the average was of 20.97 µg/l with a variation of 1.11 and
171.75 µg/l. In this analyzed material the average mercury contents found among the
prospectors was just a little lower than that observed in the non-prospectors while the other data
presented in general, higher values among the prospectors except the maximum amplitude,
where a bigger value was found among the non-prospectors. The Hg levels in hair were
analyzed among the non-prospectors and presented an average of 1.82 µg/g with a variation of
0.23 to 10.48 µg/g, the majority remaining (third quarter - 75%) close to the normality limits of
those not exposed (2µg/g).
Table 45 Ofscriptive statistic of Hg levels in the researched population at the Creporizinho
gold mining. Itaituba, Pará-Brazil. 2003.
Variables
Mean Hg Urine
"Prospectors" "Non-Prospectors"
Total
(µg/l)
No. Individual
170
175
345
Mean/Std. Deviat.
13,75±19,59
3,91± 4,87
8,76± 14,99
Amplitude
0,030 147,00
0,21 36,19
0,030 147,00
1ş quartil
3,20
1,38
2,11
3ş quartil
16,45
4,48
2,11
Corrected Values Urine (µg/g of creatinine)
No. Individual
169
175
344
Mean/Std. Deviat.
6,00±9,30
1,93±1,88
3,92±6,95
Amplitude
61,58 0,02
12,07 0,12
61,58 0,02
1ş quartil
1,75
0,74
1,11
3ş quartil
5,72
2,39
4,01
Hg Blood (µg/l)
No. Individual
211
190
401
Mean/Std. Deviat.
25,23±25,59
20,97±28,61
23,21±27,11
Amplitude
0,74 128,74
1,11 171,65
0,74 171,65
1ş quartil
8,14
6,27
7,27
3ş quartil
32,00
19,09
27,36
Hg Hair
No. Individual
-
116
116
Mean/Std. Deviat.
-
1,82±1,53
1,82±1,53
Amplitude
-
0,23 10,48
0,23 10,48
1ş quartil
-
0,77
0,77
3ş quartil
-
2,49
2,48
RT2004-004-00 CETEM/MCT 105
OBS: The normal values of 10 µg/g creatinine, and Limit of Biological Tolerance (LTB) of 50
µg/g creatinine, in urine, according to the World Health Organization (1990). Methylmercury.
Geneva. Environmental Health. 101-144. For blood the values are: up to 8 µg/l, normal and the
Limit of Biological Tolerance (LTB) equal to a 30 µg/l. For hair, up to 2 µg/g for not exposed
individuals, 6 µg/g is the Limit of Biological Tolerance (LTB).
6.3.2 Analysis of Some Variables contained in Cards (preliminary results)
Creporizinho
The general working conditions with Hg (Table 46) are similar with Săo Chico area,
showing that the majority of the prospectors, i.e. 90,1%, has been using Hg directly in their
activities for about 14 years, performing the gold amalgam Hg burning in open recipient
(84,5%). A small number of prospectors (6,0%) uses a retort in the amalgam burning process.
Table 46 - Occupational Conditions of the use of Hg in the Creporizinho gold mining.
Itaituba, Pará-Brazil. 2003.
Garimpo Crepurizinho (n=233)
Variables
Nş of Prospectors
%
Mean of Time
(anos)
Work with Hg
210
90,1
14,4
Amalgam Burning in open air
197
84,5
-
Use Retort
14
6,0
2,9
The analysis of the main diseases in the region show, as expected, that the biggest
incidence is malaria, with 6 cases detected and treated at the moment of the research. Past cases
of malaria were reported by 94,5% of the prospectors (an average of 7 past episodes) and 74,2%
of the non-prospectors (average of 5 past episodes). Other diseases were also pointed out, such
as tuberculosis (no current case) , hansenias (5 current cases) and hepatitis of unspecified origin,
all with one current case (Table 47).
Table 47 Analysis of the Main Diseases of the Region Creporizinho. Itaituba, Pará-Brazil.
2003.
Variables
PROSPECTORS
Non-Prospectors
Total
Malária
(n=233)
(n=217)
(n=450)
Current
5 (2,1%)
1 (0,5%)
6 (1,3%)
Past
220 (94,5%)
162 (74,2%)
381 (84,7%)
Mean No. of Episodes
7,0
5,0
6,0
Tuberculosis
Current -
-
-
Past 3(1,3%)
1
(0,5%)
4
(0,9%)
Hanseníase
Current
4 (1,7)
1 (0,5)
5 (1,1%)
Past
1 (0,4%)
2 (0,9)
3 (0,7)
Hepatite
Current -
1
(0,5%)
1
(0,2%)
Past
32 (13,7)
24 (11,2%)
56 (12,4)
RT2004-004-00 CETEM/MCT 106
The prevailing of intestinal parasitism in the Creporizinho gold mining showed the
occurrence of parasite agents presented in Table 48, where the presence of Ancilostomídeos and
the Ascaris lumbricoides were also the most prevailing among the helmintos, two cases of Taenia
sp were still existing which is not common in other regions but are maybe due to the poor
conditions existing on the swine and cattle farms. The Giardia lamblia and Entamoeba histolytica
are noted among the protozoa.
Tabela 48 The Prevailing of Intestinal Parasitism in the Creporizinho community, Itaituba,
Pará-Brazil. 2003.
Prospectors
Non-Prospectors
Total
Helmintos and Protozoans
(n=233)
(n=217)
(n=450)
n (%) n (%) n (%)
Ascaris lumbricoides
27 11,9 40 18,4 67 14,9
Trichuris trichiura
5 2,1
10 4,6
15
3,3
Taenia sp
1 0,4 1 0,5 2 0,4
Ancilostomideos
67 28,8 11 5,1 78 17,3
Giardia lamblia
79 34,9 93 42,9
172
38,2
Entamoeba histolytica
33 14,2 44 20,3 77 17,1
The evaluation of some interesting signs and symptoms of the exposure to Hg are shown
in Tables 49 e 50. In general the occurrence of these symptoms were more frequent among the
prospectors than the non-prospectors, including certain symptoms normally related to various
causes such as nausea (that may be associated to digestive disturbance and to parasitism) and to
headache (associated to various causes).
Table 49 Some Signs and Symptoms in prospectors from Creporizinho
never once/month
once/week once/day
Symptoms
n
%
n
%
n
%
n
%
Metallic Taste
173 74,2 20
8,6
6
2,6
34
14,6
Sialorrhea 165
70,8
32
13,7
9
3,9
27
11,6
Náusea 154
66,1
46
19,7
25
10,7
8
3,4
Cefalea 87
37,3
64
27,5
48
20,6
34
14,6
Palpitation 120
51,5
63
27
14
6 36
15,5
Paresthesia 101
43,3
8
3,4
1
0,4
123
52,8
Table 50 Some Signs and Symptoms in non-prospectors from Creporizinho
never once/month
once/week once/day
Sintomatologia
n
%
n
%
n
%
n
%
Metallic
Taste 216
99,5
1 0,5 - - - -
Sialorrhea 214
98,6
2
0,9
1
0,5
-
-
Náusea 216
99,5
-
-
1
0,5
-
-
Cefalea 214
98,6
1
0,5
1
0,5
1
0,5
Palpitation 213
98,2
3
1,4
-
-
1
0,5
Paresthesia 214
98,6
- -
3
1,4
-
-
In general, the occurrence of these symptoms were more frequent among the prospectors
rather than among the non-prospectors. The frequency of paraesthesia is pretty higher in gold
miners than in control group, as well as all the other symptoms (metallic taste, excessive sweat,
RT2004-004-00 CETEM/MCT 107
palpitations, nausea and headache). These findings suggest that Hg exposure in gold miners
could be in progress.
Table 51 shows the predominance of skin mucus paleness, which represents n= 217 (48.2
%) of all the studied population, contributed similarly between gold miners and control group.
This situation is the consequence of the anemic parasitism syndrome, common to other
communities of the rain forest, investigated by the Environment Department of the Evandro
Chagas Institute.
Tabela 51 Analysis Results of Skin Creporizinho. Itaituba, Pará-Brazil. 2003.
Prospectors
Non-Prospectors
General
Symptoms
(n=233)
(n=217)
(n=450)
n % Cases
n
% Cases
n % Population
Skin paleness
109
46,2
108
49,8
217
48,2
Skin Itch
16
6,9
11
5,1
27
6,0
Hypochromatic Spots
10
4,3
10
4,6
20
4,4
Hyperchromatic Spots
8
3,4
13
6,0
21
4,7
Piodermite 4
1,7
-
-
4
0,9
Impetigo -
-
-
-
-
-
The frequency of dispepsia in gold miners is close twice of control group's frequency, but
no other symptoms are more frequent in gold mining workers comparing to control group
(Table 52).
Tabela 52 Analytical Result of the Digestive System Creporizinho. Itaituba, Pará-Brazil.
2003.
Prospectors Non-Prospectors
General
Symptoms
(n=233)
(n=217)
(n=450)
n % Cases
N
% Cases
n % Population
Anorexia 12
5,2
19
8,8
31
6,9
Hepatomegaly 1
0,4
3
1,4
4 0,9
Diarrhea 9
3,9
14
6,5
23
5,1
Intestinal Obstipation 2
0,9
2
0,9
4
0,9
Esplenomegaly 1
0,4
1
0,5
2 0,4
Abdominal Pain
89
38,2
89
41,0
178
39,6
Dispepsia 49
21,0
25
11,5
74
16,4
Pelvic Pain
3
1,3
20
9,2
23
5,1
Icterícia 1
0,4
2
0,9
3
0,7
Vomits 7
3,0
21
9,7
28
6,2
Weight Loss
4
1,7
6
2,8
10
2,2
Nutrition Disturbance 1
0,4
-
-
1
0,2
The results of Table 53 refer to the frequency in which one finds infections in the upper
airways, probably due to the climate conditions and the big diversity of viral and bacterial
agents in the region, associated to the general health and environment conditions.
RT2004-004-00 CETEM/MCT 108
Table 53 Analytical Results of the Respiratory System Creporizinho. Itaituba, Pará-Brazil.
2003.
Prospectors Non-Prospectors
General
Symptoms
(n=233)
(n=217)
(n=450)
n %
Cases n %
Cases n %
Population
Crackling Stertors
1
0,4
-
-
1
0,2
Sub-crackling Stertors 8
3,4
15
6,9
23
5,1
Sibilos -
-
2
0,9
2
0,4
Epistaxe 1
0,4
1
0,5
2
0,4
Rinorrhea 5
2,1
5
2,3
10
2,2
Nasal Obstruction
4
1,7
5
2,3
9
2,0
Pharynx Hiperemia
3
1,3
2
0,9
5
1,1
Amygdala Hipertrofy 4
1,7
3
1,4
7
1,6
Dispnea 6
2,6
8
3,7
14
3,1
Cough 9
3,9
19
8,8
28
6,2
Lung Disturbance
11
4,7
20
9,2
31
6,9
Table 54 shows the results of the cardiovascular system investigatrion.
Table 54 - Analytical Results of the Cardiovascular System Creporizinho. Itaituba, Pará-
Brazil. 2003.
Symptoms
Prospectors Non-Prospectors General
(n=233)
(n=217)
(n=450)
n % Cases
n
% Cases
n % Population
Cardiac Disturbance
11
4,7
5
2,3
16
3,6
Arterial Hypertension 21
9,0
16
7,4
37
8,2
Taquycardia 12
5,2
6
2,8
18
4,0
Bradicardia -
-
-
-
-
-
Precordial Pain
10
4,3
7
3,2
17
3,8
The gold miners showed higher frequencies for all of the symptoms than control group,
including hypertension, as seen in Săo Chico area.
Table 55 showed different frequencies of the most of the symptoms in gold miners and
control group. Generally, all frequencies were from 2 to 5 times higher in gold miners group
than in control one. Muscular and articular pains are the most frequent complains.
Table 55 - Analytical results of the Osteomuscular System Creporizinho. Itaituba, Pará-
Brazil. 2003.
Symptoms
Prospectors
Non-Prospectors General
(n=233)
(n=217)
(n=450)
n % Cases
n
% Cases
n % Population
Backbone Pain
3
1,3
-
-
3
0,7
Spine Pain
107
45,9
36
16,6
143
31,8
Fatigue 106
45,5
48
22,1
154
34,2
Astenia 107
45,9
49
22,6
156
34,7
Muscle Pain
124
53,2
51
23,5
175
38,9
Thorax Pain
16
6,9
3
1,4
19
4,2
Articular Pain 125
53,9
50
23,0
175
38,9
RT2004-004-00 CETEM/MCT 109
6.3.3. Mercury Burden
Some analysis of signs and symptoms compared to the contents of Hg found in prospectors and non-
prospectors of the Creporizinho.
In the case of the Creporizinho gold mining, the self-perception survey as to health and
sickness in the group of prospectors obtained different answers, where 32.5% of the individuals
feel healthy, while 67.5% think they are not in good health. However, in the non-prospectors
group 97.7% reports feeling healthy (Table 56). The Hg levels in urine of the prospectors
presented a difference in relation to the health complaints, such as metal taste, excessive sweat
and breathing problems as well as tremors and renal illness, this difference however did not
prevail in terms of significance in the statistics evaluation (T- student, p>0.05). The worsening
of current health problems showed a significant variation in relation to the Hg exposure
(Kwallis test=10,22 p=0.006).
Table 56 Average Hg concentrations in prospectors and non-prospectors according to health
self-perception and the presence of certain health complaints, Creporizinho gold mining.
Itaituba, Pará-Brazil. 2003.
Prospectors Non-Prospectors
Self-Perception
N
Mean Hg Urine
(µg/g creatinine)
N
Mean Hg Urine
(µg/g creatinine)
Feel Healthy
Yes 55
4,60±7,02
171
1,90±1,85
No 114
6,88±10,59
4
3,90±2,52
Perception of Health
Worsening
Not Exposed
24
2,64±2,37
171
1,92±1,87
Exposed without
52
problems
8,10±12,06
3
1,62±0,67
Exposed with problems
93
5,95±9,02
1 7,02
Tremors
Yes 51
5,61±8,75
170
1,91±1,86
No 118
6,37±9,99
5
3,34±2,52
Metallic Taste
Yes 46
7,53±11,68
1 1,39
No 123
5,62±8,72
174
1,95±1,89
Sialorrhea
Yes 51
7,11±11,35
3
2,69±1,99
No 118
5,72±8,78
172
1,93±1,89
Appetite
Yes 50
6,55±9,75
5
2,11±1,62
No 119
5,97±9,59
170
1,94±1,90
Weight Loss
Yes 19
7,12±13,43
2
0,98±0,15
No 150
6,02±9,07
173
1,96±1,89
RT2004-004-00 CETEM/MCT 110
Table 56 (Cont.) Average Hg concentrations in prospectors and non-prospectors according to
health self-perception and the presence of certain health complaints, Creporizinho gold
mining. Itaituba, Pará-Brazil. 2003.
Prospectors Non-Prospectors
Self-Perception
N
Mean Hg Urine
N
Mean Hg Urine
(µg/g creatinine)
(µg/g creatinine)
Hair Loss
Yes 37
6,84±8,14
- -
No 132
5,95±10,01
175
1,95±1,89
Cough
Yes 5
4,22±3,60
1 2,39
No 164
6,20±9,74
174
1,94±1,89
Renal Sickness
Yes 15
8,61±10,33
1 4,83
No 154
5,90±9,54
174
1,93±1,88
Respiratory Disturbance
Yes 24
7,26±11,86
1 1,39
No 145
5,95±9,23
174
1,95±1,89
In relation to tests of static balance, 74,0% of the prospectors showed an alteration in at
least one of the evaluation forms, while in the non-prospectors group this percentage was only
of 3.4%. The Hg levels however, in the prospectors with some variation were about twice the
average of contents found in the non-prospectors (Table 57).
Table 57 Alterations registered in the static balance investigation in 169 prospectors and
175 non-prospectors, Creporizinho gold mining. Itaituba, Pará-Brazil..
Prospectors (N=169)
Non-Prospectors (N=175)
Altered Normal Altered Normal
Mean Hg
Mean Hg
Mean Hg
Mean Hg
n
Urine (µg/g
n
Urine (µg/g
n
Urine (µg/g
n
Urine (µg/g
creatinine)
creatinine)
creatinine)
creatinine)
Static
125
Balance
6,24±9,78
44
5,31±7,82
6
2,93±2,47
169
1,90±1,85
Stand
(open
5
5,48±4,61
164
6,01±9,41
1 1,09 174
1,94±1,88
eyes)
Stand
(closed
110
6,71±10,32
59
4,67±6,88
5
3,35±2,52
170
1,89±1,85
eyes)
Bend
103
down
6,28±9,78
66
5,55±8,54
5
3,24±2,63
170
1,89±1,85
Tremors 99 5,81±9,87
70
7,26±6,48
6
2,93±2,47
169
1,90±1,85
The evaluation of dynamic balance (Table 58) also showed variation in about 4.1% of the
prospectors (alteration in at least one of the tests), there were no variations found in the non-
prospectors, with an average in the Hg levels well higher in the first group as compared to the
second one.
RT2004-004-00 CETEM/MCT 111
Table 58 Alterations registered in the investigation of the dynamic balance in 169
prospectors and 175 non-prospectors, Creporizinho. Itaituba, Pará-Brazil. 2003.
Prospectors
(N=169)
Non-Prospectors
(N=175)
Altered Normal Altered Normal
Mean Hg Urine
Mean Hg Urine
Mean Hg Urine
Mean Hg Urine
n
n
n
n
(µg/g creatinine)
(µg/g creatinine)
(µg/g creatinine)
(µg/g creatinine)
Dynamic
Balance
7
4,31±4,10
162
2,22±1,56
- - 175
1,93±1,88
Walk
1 1,88 168
6,02±9,32
- - 175
1,93±1,88
Forward
Walk
2
1,38±0,71
167
6,05±9,34
- - 175
1,93±1,88
Backward
Feettip
1 1,88 168
Walking
6,02±9,32
- - 175
1,93±1,88
Heel
2
Walking
1,38±0,71
167
6,05±9,34
- - 175
1,93±1,88
Joint Feet
2
Jumping
1,38±0,71
167
6,05±9,34
- - 175
1,93±1,88
Right Foot
2
1,38±0,71
167
6,05±9,34
- - 175
1,93±1,88
Jumping
Left Foot
2
1,38±0,71
167
6,05±9,34
- - 175
1,93±1,88
Jumping
Ataxia 4 5,03±5,46
165
6,02±9,38
- - 175
1,94±1,88
Rigidity 7 4,31±4,10
162
6,07±9,46
- - 175
1,94±1,88
Most prospectors answered affirmatively when questioned as to physical fatigue (Table
59), being the Hg levels generally higher among those prospectors who answered affirmatively
to the physical fatigue question. In the non-prospectors, the data on physical fatigue as well as
Hg levels were always well lower.
Table 59 Physical fatigue evaluation in 169 prospectors and 175 non-prospectors,
Creporizinho gold mining. Itaituba, Pará-Brazil. 2003.
Prospectors (N=169)
Non-Prospectors (N=175)
Altered
Normal
Altered
Normal
Mean Hg
Mean Hg
Mean Hg
Mean Hg
n
Urine (µg/g
n
Urine (µg/g
n
Urine (µg/g
n
Urine (µg/g
creatinine)
creatinine)
creatinine)
creatinine)
Physical Fatigue 129
6,58±9,20
40
4,12±9,48
6
2,13±2,47
169
1,90±1,85
Easily Tired
119
6,32±8,17
50
5,71±12,48
5
3,34±2,52
170
1,91±1,86
Need more Rest 122
6,72±9,44
47
4,62±10,01
5
3,34±2,52
170
1,91±1,86
Sleepy 121
6,51±9,06
48
5,22±10,94
5
3,34±2,52
170
1,91±1,86
Disposition to
119
Daily Tasks
5,78±7,12
50
7,00±13,92
5
3,34±2,52
170
1,91±1,86
Lack of Energy
124
6,30±8,59
45
5,69±12,10
5
3,34±2,52
170
1,91±1,86
Less Muscle
123
6,45±8,99
46
5,31±11,17
5
3,34±2,52
170
1,91±1,86
Strengh
Feel Weak
123
6,45±8,99
46
5,31±11,17
5
3,34±2,52
170
1,91±1,86
Good
Disposition but
123
6,42±9,00
46
5,41±11,16
6
2,13±2,47
169
1,90±1,85
Easily Tired
In the mental fatigue evaluation of the prospectors the negative answers were
predominant (Table 60), however among the non-prospectors the negative answers were much
fewer when compared to those of the prospectors, with Hg contents also much more reduced.
RT2004-004-00 CETEM/MCT 112
Table 60 Mental fatigue evaluation in 169 prospectors and 175 non-prospectors,
Creporizinho gold mining. Itaituba, Pará-Brazil. 2003.
Prospectors (N=169)
Non-Prospectors (N=175)
Altered
Normal
Altered
Normal
Mean Hg Urine
Mean Hg Urine
Mean Hg
Mean Hg
n
(µg/g
n
(µg/g
n
Urine (µg/g
n
Urine (µg/g
creatinine)
creatinine)
creatinine)
creatinine)
Mental Fadigue 52
11,07±16,30
52
7,52±10,06
36
4,01±5,08
93
5,26±9,09
Difficulty to be 29
concentrated
9,12±14,28
75
9,36±13,42
20
4,29±5,40
109
5,29±8,62
Difficulty to
25
think clearly
6,79±8,14
79
10,09±14,86
5
2,25±2,43
124
5,25±8,29
Difficulty to
24
18,91±8,62
80
9,97±14,74
3
2,54±3,11
126
5,20±8,23
oral expression
Ocular Fadigue
45
10,64±14,71
59
8,27±12,71
27
4,10±4,71
102
5,41±8,45
Memory
40
Disturbance
11,22±15,40
64
8,09±12,31
32
4,70±4,99
97
5,28±8,98
Table 61 shows several parameters related alteration of reflex and muscular force in gold
miners and control group.
Table 61 Alteration of Reflex and Muscular Force - Creporizinho. Itaituba, Pará-
Brazil. 2003.
Prospectors (N=169)
Non-Prospectors (N=175)
Altered
Normal
Altered
Normal
Mean Hg
Mean Hg
Mean Hg
Mean Hg
n
Urine (µg/g
n
Urine (µg/g
n
Urine (µg/g
n
Urine (µg/g
creatinine)
creatinine)
creatinine)
creatinine)
Abdominal Skin Reflex
3
4,25±2,43
166
6,03±9,37
- - 175
1,93±1,88
Mentolabial Reflex
143
6,60±9,96
26
2,69±1,86
5
3,30±2,57
170
1,89±1,85
Reflex of Babinski
3
4,30±2,01
166
6,03±9,37
- - 175
1,93±1,88
Reflex of Hoffmann
1
61,58
168
5,67±8,26
- - 175
1,93±1,88
Press Strengh
174
6,59±9,90
25
2,56±2,44
5
2,12±1,62
170
1,93±1,89
SRP (Reflex of
50
3,93±2,65
119
6,87±10,84
2
4,21±3,98
173
1,91±1,85
quadríceps)
BSR (Reflex of bíceps
39
braquial)
3,89±2,82
130
6,63±10,41
2
4,21±3,98
173
1,91±1,85
Radial Reflex
7
3,90±3,04
162
6,09±9,47
- - 175
1,93±1,88
RA Reflex Aquileu
49
(tríceps sural)
3,75±2,49
120
6,91±10,80
- - 175
1,93±1,88
Yesetria facial
1
2,82
168
6,02±9,32
- - 175
1,93±1,88
Muscular Strengh
-
-
169
6,00±9,29
- - 175
1,93±1,88
Ocular Movement
3
6,67±1,41
166
6,04±9,37
- - 175
1,93±1,88
Tactile Sensitivity
-
-
169
6,00±9,29
- - 175
1,93±1,88
Pain Sensitivity
-
-
169
6,00±9,29
- - 175
1,93±1,88
Distinguishing
- -
169
6,00±9,29
- - 175
1,93±1,88
Segmental Position
Distinguishing Colors
-
-
169
6,00±9,29
- - 175
1,93±1,88
Distinguishing
- -
169
Geometric Forms
6,00±9,29
- - 175
1,93±1,88
Intentional Tremor
79
6,56±10,38
90
5,50±8,25
1 0,88 174
1,94±1,88
Ataxia
8
4,07±1,61
161
6,09±9,51
- - 175
1,93±1,88
RT2004-004-00 CETEM/MCT 113
Gold miners showed higher frequencies for all parameters. Mentolabial reflex and
intentional tremor were shown by 84 and 46% of gold miners. Ataxia was shown by 4.71 of gold
miners.
The evaluation to Hg exposure included Hg determinations in blood and urine. Table 62
shows a summary of the analysis results of Hg in the group of individuals who are working at
the moment or used to work as "prospectors" and the other occupations ("non-prospectors") in
both study areas.
With regard to Hg in urine, the higher exposure to inorganic mercury in Săo Chico is
reflected by 20.2% of the gold miners with Hg levels in urine between 10 and 50 µg/g creatinine,
while in Creporinho only 13% fall in this range. Moreover, 2.9% of the gold miners in Săo Chico
and 1.2% in Creporizinho present Hg levels higher than 50 µg/g creatinine. This is an indication
that the gold miners in Săo Chico are more intensively exposed not only to methylmercury, but
also to inorganic mercury, in relation to Creporizinho (Table 62).
Within the control group, represented by the population not directly involved in gold
mining activities, it is observed that 13.9% of the population in Săo Chico present Hg levels in
urine higher than 10 µg/g creatinine, while in Creporizinho only 0.6% falls in this range. With
regard to Hg levels higher than 50 µg/g creatinine in this group, only 1.5% of the population in
Săo Chico falls in this range, whereas no individual in Creporizinho does (Table 62).
Table 62 Population distribution according to Hg levels in urine above normality and Limit
of Biological Tolerance (LBT) in both areas
PROSPECTORS
NON-
PROSPECTORS
Total
10<Hg< 50
Hg>50
10<Hg<
Hg>50
10<Hg<
Hg>50
Garimpo n µg/g
µg/g
n
50 µg/g
µg/g
n
50 µg/g
µg/g
creatinine
creatinine
creatinine creatinine
creatinine creatinine
n % n % n % n % n % n %
Săo Chico 104 21 20.2 3 2.9 129 18 13.9 2 1.5 233 39 16.7 5 2.1
Creporizi
nho
169 22 13.0 2 1.2 175 1 0.6 - - 344 23 6.7 2 0.6
The use of blood as a bioindicator of exposure to inorganic mercury requires further
investigations using either speciation techniques or the determination in plasma and
erythrocytes in order to identify the contribution of inorganic and organic mercury. Although
27.3% of the gold miners in Săo Chico present Hg levels in blood higher than 50 µg/L, and in
Creporizinho only 13% fall in this range, it is not possible to identify mercury sources that
caused this exposure level (Table 63).
Table 63 Population distribution according to Hg levels in blood above normality and
Limit of Biological Tolerance (LBT) in both areas
PROSPECTORS
NON-
PROSPECTORS
Total
10<Hg< 50
Hg>50
10<Hg<
Hg>50
10<Hg< 50
Hg>50
Garimpo n
µ
n
n
g/l
µg/l
50 µg/l
µg/l
µg/l
µg/l
n % n % n % n % n % n %
Săo
150
106 65 61.3 29 27.3 128 85 66.4 15 11.7 234
64.1 44 18.8
Chico
Creporiz
211 112 53.1 28 13.3 190 78 41.0 21 11.0 401 190 47.4 49 12.2
inho
RT2004-004-00 CETEM/MCT 114
7. Conclusions
Since 1989, amalgamation tailings have been dumped into Săo Chico reservoir, originally
built for water supply. As time plays an important role in the behaviour of mercury in the
environment, and miners are additionally using cyanide for reworking amalgamation tailings,
this has been increasing mercury mobility.
Moreover, pasture fires close to mining hotspots, as observed in Săo Chico, are likely to
represent an important factor responsible for Hg mobilization from soils to the atmosphere. The
widespread distribution of Hg contaminated soils in the vicinities of the mining site
demonstrate that Hg is probably being precipitated from the atmosphere, after being released
from amalgam burning, and remobilized again to the atmosphere during pasture fires.
Since formation of cyanide-mercury complexes into the Săo Chico reservoir could also be
responsible for increasing mercury mobility downstream, as well as the usual practice of pasture
fires, this site must be studied in detail to understand the behaviour of mercury species from
cyanidation tailings.
High mercury levels have been detected all over the nearby water body, including
sediments (averaging 4.10 µg/g) and aquatic organisms (averaging 4.97 µg/g in fish). After
several studies conducted by CETEM on assessment of mercury pollution in the Amazon, this is
the first case where the dispersion of mercury from mining hotspots throughout an aquatic
system is detected to such an extent. According to the present results, Săo Chico has shown clear
indications of Hg dispersion from mining hotspots, reaching a distance at least as long as 20 km.
This consists of a major environmental and health concern. The environmental factors
responsible for this particular Hg behavior, marked by its high mobility, are likely to be linked
to both the cyanidation attempt and pasture fires.
The present results reveal that the most of fish from Săo Chico present higher mercury
levels than the ones from Creporizinho area. Additionally, in Săo Chico area, the highest levels
of mercury bioaccumulation in fish was shown in Traíra species, a carnivorous and appreciated
species for consumption by local residents, extending the environmental risk to a health issue.
Although Piranha and Acari could not be collected in all study sites, their positive
correlation in terms of length and Hg concentration demonstrates the feasibility of their use as
indicator organisms for mercury availability in tropical aquatic systems, besides Traíra, which
showed advantage due to its widespread distribution in the study area.
Traíras from Creporizinho showed higher globular volume and erythrocytes number
than Traíras from Săo Chico. Carás from Creporinho showed higher globular volume and mean
globular volume than those from Săo Chico. Mercury levels and globular volume showed
significant negative correlation for both species, suggesting that mercury levels may cause
decrease in number of erythrocytes, which are smaller than normal ones, characteristics of
regenerative anemia.
The present results also indicate that mercury concentrations in wild plants parts from
Creporizinho study area increased with mercury concentrations in soil. Apparently, they
function as a excluder, restricting transport of metal upwards to aerial parts. Since Hg
concentrations are much higher in aboveground of produces at Săo Chico study area than in
Creporizinho, the uptake in produce plants is likely to occur through atmospheric deposition,
but further studies with a larger sample set are necessary to confirm this hypothesis. The
RT2004-004-00 CETEM/MCT 115
translocation of mercury from soil through roots to aboveground in produce plants was not
significant in both studies areas.
Considering 0.3mg the provisional tolerable mercury intake per person weekly (PTWI),
the ingestion of total mercury from those foodstuffs falls close to the PTWI in Săo Chico area,
whereas in Creporizinho area the estimated Hg ingestion falls in a range much lower than the
PTWI. However, it should be taken into account the small gastrointestinal absorption of
inorganic mercury (7%), which results in 0.017 mg/week for Săo Chico and 0.0007 mg/week for
Creporizinho.
Artisanal miners use a variety of mining and amalgamation methods. Together with the
fate of contaminated tailings and Au-Hg separation procedures, these methods define the extent
of mercury losses from a specific site. If concentrates are amalgamated, the main emission
source derives from burning amalgam in open pans. When retorts are not used, atmospheric
emissions represent as much as 50% of the total mercury introduced into the process. However,
when amalgamation in conducted properly and retorts are used, losses are very low as little as
0.05%. This recycling practice suggests one of the first approaches to reduce the Hg burden to
the environment.
The successful training of new users for the semiquantitative method of mercury
determination in fish encourages us to recommend the application of this methodology in all
localities were mercury pollution presumably exists. New applications were developed during
the last months, so that the same equipment can be used for Hg determinations in urine, soils
and sediments. This means that in next training programs we will be able to offer training on
semiquantitative mercury determination in fish, sediments, soils an urine samples. As an
application of this training, local authorities would be able to manage their pollution problem,
using the SMQ determination as a low cost tool for Hg pollution and health monitoring.
The general health conditions observed in both areas revealed to be very
precarious, as demonstrated by extremely high incidence of malaria, parasithosis and
other diseases not related to mercury exposure.
Since mercury burning in open air is a common practice in both areas since at least 1989,
one could realize that a chronic exposure to inorganic mercury occurs. Moreover, pasture fires
over Hg contaminated soils in Săo Chico characterizes a further exposure route to inorganic
mercury for local population.
With regard to the exposure to methylmercury through fish consumption, as indicated
by its high occurrence in fish from specific sites, one suggests that a possible explanation for
increasing Hg bioavailability is related to the cyanidation attempt in Săo Chico.
The use of blood as a bioindicator of exposure to inorganic mercury requires further
investigations using either speciation techniques or the determination in plasma and
erythrocytes in order to identify the contribution of inorganic and organic mercury.
Although Hg levels in hair samples are relatively low, as 75% of both population
investigated presented Hg concentrations lower than 4 µg/g, it is highlighted that the mean Hg
concentration in hair samples from Săo Chico are the double of those from Creporizinho. This is
consistent with the main results obtained by the environmental survey, through which a higher
mercury mobility and potential bioavailability has been suggested.
With regard to Hg in urine, the higher exposure to inorganic mercury in Săo Chico is
reflected by 20.2% of the gold miners with Hg levels in urine between 10 and 50 µg/g creatinine,
RT2004-004-00 CETEM/MCT 116
while in Creporinho only 13% fall in this range. Moreover, 2.9% of the gold miners in Săo Chico
and 1.2% in Creporizinho present Hg levels higher than 50 µg/g creatinine. This is an indication
that the gold miners in Săo Chico are more intensively exposed not only to methylmercury, but
also to inorganic mercury, in relation to Creporizinho.
Within the control group, represented by the population not directly involved in gold
mining activities, it is observed that 13.9% of the population in Săo Chico present Hg levels in
urine higher than 10 µg/g creatinine, while in Creporizinho only 0.6% falls in this range. With
regard to Hg levels higher than 50 µg/g creatinine in this group, only 1.5% of the population in
Săo Chico falls in this range, whereas no individual in Creporizinho does.
In relation to symptoms potentially associated with mercury exposure, it is highlighted
the significant incidence of metallic taste, paresthesia, tremors and palpitation in both areas. As
for paresthesia, an incidence in the gold miners group as high as 30% in Săo Chico and 50% in
Creporizinho has been observed, while within the control group in both areas this incidence
decreases to 1.5% and 0.5% respectively. These results strengthen the need of a continuous
monitoring on the health effects within the identified critical groups.
REFERENCES
Akagi H, KinjoY, Branches F, Malm O, Harada M, Pfeiffer WC, Kato H (1994) Methylmercury
pollution in Tapajos river basin, Amazon. Environ Sci 3: 25-32
Bechtel Jacobs Company (BJC). 1998. Empirical Models for the Uptake of Inorganic Chemicals
from Soil by Plants, BJC/OR-133, Oak Ridge National Laboratory, Oak Ridge, Tennessee.
Available in: http://www.esd.ornl.gov/programs/ecorisk/documents/bjcor-133.pdf.
Accessed on: 30 oct. 2003.
Bidone ED, Castilhos ZC, Cid de Souza TM, Lacerda LD (1997) Fish contamination and human
exposure to mercury in the Tapajós River Basin, Pará State, Amazon, Brazil: a screening
approach. Bull Environ Contam Toxicol 59: 194-201.
Bruggeman WA (1982) Hidrophobic interactions in the aquatic environment. In: O. Hutzinger
(ed) The Handbook of environmental chemistry, vol 2, pt.B Spring-Verlag, Germany, 205p.
Campos RC, Curtis AJ (1990) Riscos e Consequęncias do Uso de Mercúrio, Seminário Nacional,
FINEP, Rio de Janeiro, pp. 110-134
CANFIELD, P.J., QUARTARARO, N, GRIFFIN, D.L., et al Haematological and biochemical
reference values for captive Australian snapper, Pagrus auratus. Journal of Fish Biology v. 44,
p. 849-856, 1994.
Castilhos, ZC, Bidone, ED, Lacerda, LD (1998) Increase of the reference human exposure to
mercury through fish consumption due to gold mining at the Tapajos river region, Amazon.
Bull Environ Contam Toxicol 61:202-209.
Choi BH (1989) The effects of methylmercury on the developing brain. Prog Neurobiol 32: 447-
470
Cid de Souza TM, Bidone ED (1994) Estimativa do consumo global de mercúrio nos garimpos
do estado do Pará, 1980-1993. 38° Congresso Brasileiro de Geologia, Camboriú, SC
RT2004-004-00 CETEM/MCT 117
Clarkson TW (1994) The toxicology of mercury and its compounds. In: In: Watras CJ, Huckabee
JW (ed) Mercury pollution: Integration and synthesis. Lewis Publishers, Boca Raton,
Florida, USA, 727p
Cleary D (1994) Mercury contamination in the Brazilian Amazon: An overview of
epidemiological issues. In: Proceedings of the International Workshop on "Environmental
Mercury Pollution and Its Health Effects in Amazon River Basin", Rio de Janeiro, Brazil,
p.61-72
Drasch, B.; Boese-O'Reilly, S.; Beinhoff, C.; Roiofr, G.; Maydl, S. (2001) The Mt. Diwata Study on
the Philippines 1999 Assessing Mercury Intoxication of the Population by Small-Scale
Gold Mining. The Science of the Total Environment, v. 267, p. 151-168.
Fernández, J.A.; Ederra, A.; Núnez, E.; Martýnez-Abaigar, J.; Infante, M.; Heras , P.; Elías, M.J.;
Mazimpaka, V. & Carballeira, A. 2002. Biomonitoring of metal deposition in northern Spain
by moss analysis. Scien. Total Environm. 300:115127.
Hinton, JJ, Veiga, MM, Beinhoff, C, 2003. Women and Artisanal Mining: Gender Roles and the
Road Ahead. In: The Socio -Economic Impacts of Artisanal and Small-Scale Mining in
Developing Countries. Chapter 11. Ed. G. Hilson, Pub. by A.A. Balkema, Swets Publishers,
Netherlands, 2003.
Hinton, JJ, Veiga, MM, Veiga, ATC. Clean artisanal gold mining: a utopian approach ?. Journal
of Cleaner Production 11 (2003) 99-115.
International Labour Office (ILO), 1999, Social and Labour Issues in Small-scale Mines, Report
for the Tripartite Meeting on Social and Labour Issues in Small-scale Mines, Geneva 17-22
May, 1999.
IPCS (International Programme on Chemical Safety). 1976. Mercury. Environmental Health
Criteria 1. Available in: http://www.inchem.org/documents/ehc/ehc/ehc001.htm.
Accessed on: 30 mar. 2004.
IRIS- Integrated Risk Information System (1995) EPA, Office of Research and Development,
Washington, DC
Issac VJ, Ruffino ML. (1994) Informe estatístico do desembarque pesqueiro na cidade de Santaré,
PA: 1992-1993. IBAMA: Coleçăo Meio Ambiente. Série Estudo de Pesca, 6p
Krenkel, P. A. (1971) Report on International Conference on Environmental Mercury
Contamination. Water Research, v.5, p. 1121-1122.
Lacerda LD (1997) Evolution of mercury contamination in Brazil. Water, Air and Soil Pollut
97:247-255
Lacerda, LD & Solomons, W (1991) Chemical Time Bom Project. Ducht Ministry of Housing,
Physical Planning and Environment.
Malm O, et al (1996) Fourth International Conference on Mercury as a Global Pollutant,
Hamburg, Germany, August, 4-8, Abstract p.10.
Malm, O et al (1995) Mercury and Methylmercury in fish and human hair from the Tapajós
River Basin, Brazil. The Science of the Total Environment, v. 175, p. 141-150.
Mayers GJ, Marsh DO, Davidson PW, et al. (1995) Main neurodevelopmental study of
Seychellois children following in utero exposure to methylmercury from a maternal fish
diet: outcome at six moths. Neurotoxicol 16: 653-664
RT2004-004-00 CETEM/MCT 118
Müller, G. (1979). Schwermetalle in Sedimenten des Rheins Veränderungen seit 1971.
Umschau, 79: 778-783 (in German).
Murachi, S. Haemoglobin content, erythrocyte sedimentation rate and haematocrit of the blood
in the young of the carp Cyprinus carpio (L.) Journal of the Faculty of Fish Animal
Husbandry Hiroshima University . v. 2 , p.241-247, 1959.
Nichols, J.W, Ambrose, Jr., RB, Cubbison, C, Fairbrother, A, Keating, MH, Mahaffey, KR,
Mukerjee, D, Rice, GE, Reisman, DJ, Schoeny, R, Swartout, J & Troyer, M. 1997. Mercury
study report to Congress. Volume VI: an ecological assessment for anthropogenic mercury
emissions in the United States. EPA-452/R-97-008. Office of Air Quality Planning &
Standards/Office of Research and Development, U.S. Environmental Protection Agency,
Washington, D.C.
Peterson MJ, Southworth GR, Crumby WD (1996) Monitoring mercury in fish in a stream system
receiving multiple industrial inputs. Environ Monit Assess 40: 91-105
Rodrigues-Filho S, Behling H, Irion G, Müller G, (2002). Evidence for lake formation as a
response to an inferred Holocene climatic transition in Brazil. Quaternary Research, 57: 131-
137.
Rodrigues-Filho, S. and Maddock, J.E.L. (1997). Mercury pollution in two gold mining areas of
the Brazilian Amazon. Journal of Geochemical Exploration, 58: 231-240.
Roels, H., Abofladim, S., Ceulemans, E., & Lauwerys, R. (1987) Relationships between the
concentrations of mercury in air and in blood or urine in workers exposed to mercury
vapour. Ann. Occup. Hyg., 31 (2): 135-145.
Roulet M, Lucotte M, Farella N,Serique G, Coellho H, Souza Passos CJ, De Jesus da Silva E,
Scavone de Andrade P (1996) The relative importance of slash and agriculture on the
presence of mercury in Amazonian forest ecosystems. Mercury as a Global Pollutant Book
of Abstracts, Congress Centre Hamburg, Germany, p.95
Schulz-Garban, K. (1995) Determination of Hg Concentration in Workers and in the Air of
Several Amalgamation and Gold Processing Centers of "Baio"Caroni. June-November,
1994. Master Thesis. UNEG, Ciudad Guayana. 156 p. (in spanish)
Siegel, S. 1975. Estatística Năo-Paramétrica para as cięncias do comportamento, Săo Paulo
McGraw- Hill do Brasil.
UNEP (United Nations Environment Programme). 2002. Global Mercury Assessment.
UNEP Chemicals. Geneva, Switzerland. Available in: http://www.chem.unep.ch. Accessed
on: 24 mar. 2004.
Skerfving, S. (1973) Mercury in Fish Some Ecological Considerations. Food, Cosmetics and
Toxicology, v.10, p.543-556.
Smith JC, Farris FF (1996) Methylmercury pharmacokinetics in man: a reevaluation. Toxicol
Appl Pharmacol 137:245-252
Stopford, W. (1979) Industrial Exposure to Mercury. In: The Biogeochemistry of Mercury in the
Environment. p.367-397. Ed. J.O. Nriagu. Elsevier/North-Holland Biomedical Press,
Amsterdam.
Stoskopf, M.K. Fish Medicine. Philadelphia: W.B. Saunders Company, 1993.
RT2004-004-00 CETEM/MCT 119
Suckcharoen, S.; Nuorteva, P.; Häsänen, E., 1978. Alarming Signs of Mercury Pollution in a
Freshwater Area of Thailand. Ambio, v.7, n.1, p.113-116.
Suzuki, T. (1979) Dose-effect and Dose-response relationships of Mercury and its Derivatives. In:
The Biogeochemistry of Mercury in the Environment, p299-431. Ed. J.O. Nriagu.
Elsevier/North-Holland Biomedical Press, Amsterdam.
US EPA (2001) Water Quality Criteria Methylmercury. www.epa.gov.
USEPA- Environmental Protection Agency (1989) Risk Assessment Guidence For Superfund vol
1. chapt.6, pp. 1-54
Vecera, Z, Mikuska, P, Zdráhal, Z, Docekal, B, Buckova, M, Tynova, Z, Parizek, P, Mosna, J &
Marek, J, 1999. Additional comments about trace elements in crop plants. IN: Analysis of
Plant, Soil, Water and Chemical Treatment Samples Determination of Heavy Metals and
Macronutrients. Available in: http://www.dsa.unipr.it/phytonet/fertilia/partners
/vecera3.htm. Accessed on: 01 sep. 2003.
Veiga MM, Meech JA, Onate M (1994) Mercury pollution from deforestation. Nature 168:816-817
Veiga, M. M. & Baker, R. (2003) Protocols for Environmental & Health Assessment of mercury
Released by Artisanal and Small-Scale Gold Miners (ASM). Global Mercury Project,
UNIDO.
Veiga, MM & Baker, R (2003). Protocols for Environmental & Health Assessment of Mercury
Released by Artisanal and Small-Scale Gold Miners (ASM). Global Mercury Project,
GEF/UNDP/UNIDO. Vienna, Austria. 146 p.
Veiga, MM and Beinhoff, C. 2003. Technical gaps of knowledge that need to be addressed to
introduce cleaner technologies for artisanal and small-scale gold mine (ASM), Memo UNIDO,
2003.
Veiga, MM and Meech, JA, 1995. HgEx - A Heuristic System on Mercury Pollution in the
Amazon. Water, Air & Soil Pollution, v.80, p. 123-132.
Veiga, MM and Meech, JA, 1999. Reduction of mercury emissions from gold mining activities
and remedial procedures for polluted sites . In: Environmental Impacts of Mining Activities. Ed.
J.M. Azcur-Spring-Verlag, 1.143-162.
Veiga, MM, Meech, JA, Ońate, N, 1994. Mercury Pollution from Deforestation. Nature, 368: 816-
817.
Veiga, MM. Equipment specification for the demonstration units in Zimbabwe, Global Mercury
Project, UNIDO, 2004.
Veiga, MM. Suggestion for implementation of the Demonstration Units, UNIDO, 2002
Watanabe C, Satoh H (1996) Evolution of our understanting of methylmercury as a health threat.
Environ Health Perspect 104(supp.2): 367-379
Watras CJ, Huckabee JW (1994) Mercury pollution: Integration and synthesis. Lewis Publishers,
USA, 727p.
Wenqian,W. and Poling, G.W., 1983. Methods for Recovering Fine Placer Gold. CIM - Canadian
Inst. Mining and Metallurgy Bulletin, v.76, n.860, p.47-56.
WHO World Health Organization, 1980. Recommended health-based limits in occupational
exposure to heavy metals. WHO Technical Report Series, 647. 116p., Geneva.
RT2004-004-00 CETEM/MCT 120
WHO World Health Organization, 1990. Environmental Health Criteria 101: Methylmercury.
Geneva.
WHO World Health Organization, 1991. Guidelines for Methylmercury in Fish. (CAC GL 7
1991). http://www.who.int/fsf/Coofx/methylmercury.htm.
WHO (1989) Evaluation of certain food additives and contaminants Thirty-third report of the
Joint FAO/WHO Expert Coommitee on Food Additives, Geneva, World Health
Organization (WHO Technical Report Series 776)
WHO (1990) Environmental Health Criteria 101: Methylmercury. Geneva, World Health
Organization.
Wilson AR (1991) Environmental risk: Identification and management. Lewis Publishers Inc.
Chelsea, MI, USA, 431p
Windham, L.; Weis, J.S. & Weis, P. 2003. Uptake and distribution of metals in two dominant salt
marsh macrophytes, Spartina alterniflora (cordgrass) and Phragmites australis (common reed).
ESTUA. COAST.SHELF SCIEN., 56: 63-72.
Yagev, Y. (2002) Eating Fish during Pregnancy: Risk of Exposure to Toxic Levels of
Methylmercury. http://www.motherisk.org/updates/oct02.php3
Yallouz AV, Campos RC & Paciornik S. 2000. A low-cost non instrumental method for
semiquantitative determination of mercury in fish. Fresenius Journal of Analytical Chemistry
366: 461-465.
Yallouz, A . Y. Estudo de parâmetros experimentais visando a construçăo de um sistema simples para
determinaçăo semi-quantitativa de mercúrio em peixes. Tese de Doutorado. PUC-Rio, 1997
Yallouz, AV, Hacon, S & Calixto, TMP. 2002 "Semiquantitative mercury determination in fish: a tool
for poisoning prevention". Anais da Academia Brasileira de Cięncias 74(1): 187-191.
Zapponi G (1988) Methods for the health component of industrial development projects. In: The
9th International Seminar on Environmental Impact Assessment, University of Aberdeen,
Scotland, UK, 20p
.
APPENDIX 1
Hg concentrations in sediments, tailings
and soils
Igeo Class
Sample
Ref_Lab
Hg (µg/g) Hg (µg/g)
Igeo
200#
+200#
A101 CC3
0.28
0.32
1
A201 01
122.40
43.50
9.09
6
A202 02
58.70
30.90
8.03
6
A203 03
0.27
0.27
0.26
1
A204 04
10.70
6.26
5.57
6
A205 05
303.50
137.80
10.40
6
A206 06
14.40
5.10
6.00
6
A207 07
151.70
11.30
9.40
6
A208 08
0.30
0.24
0.42
1
A209 09
0.11
0.12
-1.03
0
A210 10
16.30
2.57
6.18
6
A211 11
0.46
0.06
1.03
2
A212 12
1.47
0.47
2.71
3
A213 13
1.01
0.47
2.17
3
A214 15
95.80
54.20
8.73
6
A215 18
25.60
8.60
6.83
6
A216 19
8.27
18.00
5.20
6
A217 20
9.45
5.39
6
A218 A
21
21.10
31.30
6.55
6
A219 A01
122.40
43.50
9.09
6
A220 A02
58.70
30.90
8.03
6
A221 A08
0.25
0.09
0.15
1
A222 A23
1.17
0.49
2.38
3
A223 A24
25.50
6.12
6.82
6
A224 A25
23.00
5.45
6.68
6
A225 A26
21.10
31.30
6.55
6
A226 A27
3.16
1.32
3.81
4
A227 A30
23.00
5.45
6.68
6
A228 C90
10.80
0.05
5.58
6
Sample
Ref_Lab
Hg (µg)
Hg (µg)
Igeo
Igeo Class
200#
+200#
A229 C91
0.58 0.42 1.37
2
A230 C92
1.19 0.29 2.40
3
A231 F
1
1.58
2.81
3
A232 F
10
2.49 1.06 3.47
4
A233 F
11
6.01 1.21 4.74
5
A234 F
2
1.46 1.51 2.70
3
A235 F
3
1.74 0.70 2.95
3
A236 F
4
2.63 1.70 3.55
4
A237 F
6
3.78 2.77 4.07
5
A238 F
7
1.88 1.56 3.06
4
A239 F
8
1.93 1.03 3.10
4
A240 F
9
3.01 2.68 3.74
4
A241 L
1
7.61
5.08
6
A242 L
1A
7.45
5.05
6
A243 L
1B
7.45
5.05
6
A244 L
2
8.79
5.29
6
A245 L
2B
5.50
4.61
5
A246 L
4
2.31
3.36
4
A247 L
4A
1.56
2.79
3
A248 L
5
2.33 0.82 3.37
4
A249 L
5A
1.63 0.75 2.86
3
A250 L
6
4.46 1.86 4.31
5
A251 L
7
2.22
3.30
4
A252 L
7A
2.14
3.25
4
A253 L3
4.03
4.16
5
A254 L8
1.20
2.42
3
A255 L8A
1.18
2.39
3
A256 P01
42.10
7.55
6
Sample
Ref_Lab
Hg (µg)
Hg (µg)
Igeo
Igeo Class
200#
+200#
A257 P02 44.20
7.62 6
A258 P03 51.50
7.84 6
A259 P04 82.20
8.51 6
A260 P05 1286.80
12.48 6
A261 P06 65.40
8.18 6
A262 P07 20.30
6.50 6
A263 P08 29.20
7.02 6
A264 P09 152.70
9.41 6
A265 P10 196.50
9.77 6
A266 S
3 1.29
0.62
2.52 3
A267 S
5 5.68
1.93
4.66 5
A268 S
6 0.73
0.22
1.70 2
A269
Sta. Rosa 1
2.06
0.39
3.19
4
Sta. Rosa
A270
0.35
0.64 1
1A
A271
Sta. Rosa 2
0.50
1.15
2
A272
Sta. Rosa 3
1.56
2.79
3
A273
Sta. Rosa 4
2.28
3.34
4
A274
Sta. Rosa 5
2.08
3.21
4
A275 1Vc 0.89
0.45
1.98 2
A276 3Vc 0.54
3.84
1.26 2
A277 4V 0.33
0.19
0.55 1
A278 1Vc 2.48
1.88
3.46 4
A279 6V 0.47
0.29
1.06 2
A280 7V 2.80
1.70
3.64 4
A281 9Vc 4.44
2.88
4.30 5
A282 10V 0.54
3.84
1.26 2
A283 11Vcv 2.80
1.70
3.64 4
A301 Kern
1a
0.84
0.43
1.90 2
Sample
Ref_Lab
Hg (µg)
Hg (µg)
Igeo
Igeo Class
200#
+200#
A302 Kern
1b 0.33 0.28 0.55 1
A304 Kern
1c 0.25 0.22 0.15 1
A305 Kern
1d 0.16 0.18 -0.49 0
A306 Kern
1e 0.18 0.15 -0.32 0
A307 Kern
1f 0.19 0.18 -0.24 0
Rio Conrado
A308
0.95 0.39 2.08 3
1
Rio Conrado
A309
0.31
0.46 1
2
Rio Conrado
A310
3.34 2.23 3.89 4
3
A401 Conr1 0.95 0.39 2.08 3
A402 Conr3 3.34 2.23 3.89 4
A403 ConrCava3
2.34 1.86 3.38 4
A404
J6 0.13
-0.79
0
A405
JX 13.10
5.86
6
A406
JX1 0.23
0.03
1
A407
JX2 0.22
0.06
-0.02
0
A408
JX3 15.80
2.02
6.13
6
A409
JX5 0.10
-1.17
0
A410
JX7 0.35
0.05
0.64
1
A411
JX8 0.21
0.03
-0.10
0
A412
JM1 0.07
-1.68
0
A413
JM1 0.07
-1.68
0
A414
JM2 0.15
0.59
-0.62
0
A415
JM2 0.68
1.60
2
A501 C02
0.21 0.03 -0.10 0
A502 C03
0.66 0.08 1.55 2
A503 C04
0.40 0.09 0.83 1
A504 C05
0.11 0.08 -1.06 0
A505 C06
0.32 0.08 0.51 1
Sample
Ref_Lab
Hg (µg) Hg (µg)
Igeo
Igeo Class
200#
+200#
A506 C07 0.82
0.05
1.87 2
A507 C08 0.15
0.04
-0.58 0
A508 C09 0.68
1.60 2
A509 C10 0.14
0.10
-0.73 0
A510 C11 29.30
1.65
7.02 6
A511 C12 4.53
0.66
4.33 5
A512 C14 48.30
2.82
7.75 6
A513 C15 5.57
0.88
4.63 5
A514 C16 26.20
4.18
6.86 6
A515 C17 8.29
5.08
5.20 6
A516 C18 10.40
2.15
5.53 6
A517 C19 11.40
1.08
5.66 6
A518 C21 21.10
31.30
6.55 6
A519 C23 0.57
0.14
1.34 2
A520 C24 0.38
0.04
0.76 1
A521 C25 23.00
5.45
6.68 6
A522 C30 17.60
2.82
6.29 6
A523 C31 0.29
0.25
0.37 1
A524 C32 0.25
0.22
0.15 1
A525 C33 0.57
0.14
1.34 2
A526 C34 0.37
0.04
0.72 1
A527 C35 0.26
0.24
0.20 1
A528 C36 1.54
0.50
2.77 3
A529 C37 0.10
0.09
-1.17 0
A530 CS2 0.60
0.52
1.42 2
A531 12V 21.10
31.30
6.55 6
A601 C40 0.39
0.21
0.79 1
Sample
Ref_Lab
Hg (µg)
Hg (µg)
Igeo
Igeo Class
200#
+200#
A602 C41
0.14 0.39 -0.68 0
A603 C42
0.31 0.03 0.45 1
A604 C43
0.36 0.07 0.68 1
A605 C44
0.32 0.03 0.51 1
A606 C45
0.27 0.15 0.26 1
A607 C46
0.23 0.04 0.03 1
A608 C47
0.24 0.03 0.09 1
A609 C48
0.33 0.05 0.55 1
A610 C49
0.61 0.34 1.44 2
A611 C50
2.37 0.61 3.40 4
A612 C51
1.67 0.38 2.89 3
A613 15V
1.93 1.24 3.10 4
A614 16V
1.93 1.24 3.10 4
A617 17V
0.30 0.62 0.44 1
A701 C26
0.10 0.09 -1.17 0
A702 Bof02 0.48 0.12 1.09 2
A703 Bof2b 0.81 0.28 1.85 2
A704 C27
1.93 1.24 3.10 4
A705 Bof3
0.12 0.11 -0.91 1
A801 C01
0.95 6.41 2.08 3
A802 C80
151.90
64.40
9.40 6
A803 Pap1
0.42 0.48 0.89 1
A804 Pap2
0.38 0.00 0.76 1
A805 Paps
0.56 0.33 1.32 2
A806 SolA
0.43 0.36 0.93 1
A807 Tol2
0.51 0.19 1.18 2
A808 18V
0.86 0.54 1.93 2
A809 19V
0.52 1.72 1.20 2
Sample
Ref_Lab
Hg (µg)
Hg (µg)
Igeo
Igeo Class
200#
+200#
A810 20V 0.52
1.72
1.21
2
A811 21V 0.92
0.98
2.03
3
A812 C52 0.80
0.64
1.83
2
A901 PA1 1.04
0.32
2.21
3
A902 PA2 0.29
0.05
0.37
1
A903 PA3 0.26
0.08
0.23
1
A904 PA4 0.23
0.19
0.03
1
A905 PA5 0.63
0.13
1.49
2
A906 PA6 0.28
0.32
1
A907 PA7 0.18
-0.32
0
A908 22V 0.20
0.05
-0.17
0
A1001 Cao1 0.32
0.03
0.51
1
A1002 Cao2 0.27
0.26
1
A1003 Cao3 0.23
0.04
0.03
1
A1004 Cao4 0.39
0.21
0.79
1
A1005 Cao5 0.61
0.34
1.44
2
A1006 Cao7 2.37
0.61
3.40
4
A1007 Cao8 1.67
0.38
2.89
3
A1008 Cao9 0.27
0.12
0.26
1
A1101 CME 0.29
0.16
0.34
1
A1102 GME 1.47
0.85
2.71
3
A1103 h
12.90
5.84
6
A1104 IC
0.43
0.26
0.93
1
A1105 ICMD 0.35
0.29
0.64
1
A1106 ICMEB
0.41
0.24
0.86
1
A1107 D
22.20
6.62
6
A1108 a
3.24
3.85
4
A1109 b
4.02
4.16
5
A1110 E13 4.74
4.40
5
A1111 C
13.50
5.91
6
A1112 F
5.87
4.71
5
A1113 G
6.52
4.86
5
A1114 23V 0.27
0.05
0.26
1
APPENDIX 2
Tables and Figures of Fish Data
Table I - Significant correlation coefficients of correlation analysis between Hg levels in
muscles and length and weight of fish from Săo Chico and Creporizinho garimpo's areas
Săo Chico
Creporizinho
Garimpo's areas
Hg xLt (n)
Hg x Wt (n)
Hg x Lt (n)
Hg x Wt (n)
A2
0.688 (33)
-
-
-
A6
-
- 0.54
(15) -
A7
-
- 0.68
(33) -
A9
-
-
0.57 (22 )
-
A11
-
-
-0.53 (25)
-0.64 (21)
Carnivorous
-
- 0.40
(27) -
Noncarnivorous
-0.35 (42)
-
-0.25 (134)
-
Curimată
0.75 (8)
-
0.88 (6)
0.87 (5)
Ituí
0.90 (5)
-
-
-
Piranha
- - -
0.78
(10)
Curimată, A1
0.75 (8)
-
-
-
Acari, A9
-
- 0.74
(14) -
Piranha, A11
- - -
0.86
(6)
Table II - Results of total Hg in fish muscles (arithmetical mean ± standard deviation; wet
weight), length and weight of fish from Săo Chico and Creporizinho areas, considering their
food habits
Mercury
Length
Weight
Garimpo area
N
N
N
(µg/g)
(cm)
(g)
Săo Chico
73
2.53±3.91
73
18.75±14.42
32
934.3±1,681.7
Carnivorous 31
4.16±5.42
31
25.17±15.79
27
1,038.8±1,805.9
Noncarnivorous 42 1.33±1.38
42
14.0±11.32
5
370.0±493.2
Creporizinho 161
0.36±0.33
161
11.62±4.86
49
191.8±186.0
Carnivorous 27
0.50±0.41
27
15.92±6.49
19
234.2±289.6
Noncarnivorous 134 0.32±0.30
134
10.75±3.95
30
165.0±57.5
Total 234
1.04±2.42
234
13.84±9.56
81
485.2±1,118.0
Carnivorous 58
2.46±4.35
58
20.87±13.12
46
706.52±1,441.7
Noncarnivorous 176 0.56±0.83
176
11.50±6.60
35
194.28±191.6
Table III Significant correlation coefficients of correlation analysis between Hg levels in
muscles and length and weight of fish from Săo Chico and Creporizinho garimpo's areas
Garimpo's areas HgxL (n)
HgxWt (n)
Săo Chico
-
-
Creporizinho - -
Total 0.13
(234)
-
Carnivorous - -
Noncarnivorous -0.16
(176) 0.54
(35)
Table IV - Total Hg in fish muscles (arithmetical mean±standard deviation; wet weight),
length and weight of fish from Săo Chico and Creporizinho garimpo's areas, considering the
different food habits
Mercury
Length
Weight
Garimpo area
N
N
N
(µg/g)
(cm)
(g)
Săo Chico 73
2.53±3.91
73
18.75±14.42
32
934.3±1,681.7
Carnivorous
31
4.16±5.42
31
25.17±15.79
27
1,038.8±1,805.9
Noncarnivorous
42
1.33±1.38
42
14.0±11.32
5
370.0±493.2
Detritivorous 10 0.13±0.06
10
11.40±1.23
- -
Herbivorous
2
0.11±0.03
2
14.50±3.53
- -
Insectivorous 5 0.30±0,06
5
40.20±6.1
4
150.0±40.8
Microfagous 23
2.21±1.28
23
8.13±0.61
- -
Omnivorous 2
0.92±0.95
2
28.2±19.4
- -
Creporizinho 161 0.36±0.33
161
11.62±4.86
49
191.8±186.0
Carnivorous
27
0.50±0.41
27
15.92±6.49
19
234.2±289.6
Noncarnivorous
134
0.32±0.30
134
10.75±3.95
30
165.0±57.5
Detritivorous 19 0.07±0.04
19
13.07±3.47
11
145.4±65.1
Herbivorous 15
0.08±0.07
15
18.7±2.07
14
196.42±36.5
Macrofagous 50
0.23±0.08
50
9.05±0.81
- -
Microfagous 44
0.56±0.34
44
8.13±0.84
- -
Omnivorous 6
0.81±0.28
6
16.91±1.46
5
12.00±44.5
Total 234
1.04±2.42
234
13.84±9.56
81
485.2±1,118.0
1,5
y = 0,6543x - 0,3688
R2 = 0,0124
1
0,5
0
1
1,1
1,2
1,3
1,4
1,5
1,6
1,7
Log mercury (ug/g)
-0,5
-1
log length (mm)
Figure I - Log fish length versus log Hg in Traíras (n=25) from
Săo Chico Garimpo´s area
1,4
y = 0,5306x + 0,2047
1,3
R2 = 0,0393
1,2
1,1
1
log mercury (ug/g) 0,9
0,8
0,7
0,6
1,1
1,15
1,2
1,25
1,3
1,35
1,4
1,45
log length (mm)
Figure II - Log fish length versus log Hg in Traíras from A2 (n=13) from Săo Chico
Garimpo´s area.
Table V - Correlation coefficients from relationship between mercury in muscles and
length intervals (arithmetical means), not transformed and log transformed data
Fish Specie
site
Log transformed
Not transformed
A9
0.963
0.955
Acari
Creporizinho
0.019
0.362
A2
0.620
0.642
Cará
Creporizinho
0.060
0.029
A8
0.058
0.072
Creporizinho
0.554
0.051
Piau
A11
0.00002
0.0004
Creporizinho
0.306
0.445
Piranha
A11
0.345
0.412
A9
0.870
0.852
Săo Chico
0.210
0.164
A2
0.600
Traíra
0.441
A3
0.159
0.152
Creporizinho
0.339
0.355
Creporizinho
0.470
0.375
A5
0.016
0.008
Sairu
A6
0.607
0.557
A7
0.142
0.123
Table VI - Total mercury in muscles and length intervals (arithmetical means) of Traíras
Creporizinho Garimpo´s area.
Length intervals
Length mean
Mercury
N
(mm)
(µg/g)
65 65
0.82
1
150-160 155 1.26
3
180-190 185 0.57
2
210 210 0.99
1
250 250 0.42
1
280 280 0.38
1
385 385 0.46
1
1,4
1,2
1
y = -0,002x + 1,1341
/
g)
g 0,8
R2 = 0,3548
l
s
(
u
ve
r
y
le
0,6
r
c
u
Me
0,4
0,2
0
0
50
100
150
200
250
300
350
400
450
Length (mm)
Figure III - Total mercury in muscles and length intervals (arithmetical means) of Traíras
from Creporizinho Garimpo´s area.
Table VII - Total mercury in muscles, weight and length intervals (arithmetical means) of
Carás from A2; Săo Chico Garimpo´s area.
Length mean
Mercury
N
(mm)
(µg/g)
70.0 2.60
2
75.0 3.20
2
80.0 2.26
12
85.0 2.32
3
90.0 1.25
1
3,5
3
y = -0,0715x + 8,043
R2 = 0,6422
)
/
g
g
u
2,5
r
y (
mercu
2
1,5
1
65
70
75
80
85
90
95
length (mm)
Figure IV - Total mercury in muscles and length intervals (arithmetical means) of Carás (A2)
from Săo Chico Garimpo´s area.
APPENDIX 3
Photos of fish sampling sites and fish collected
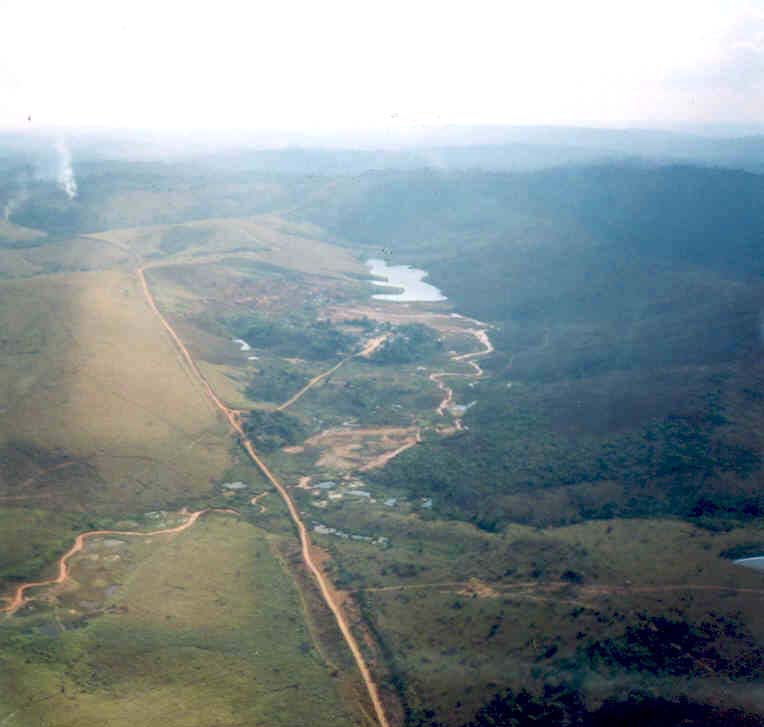
Fish sampling sites in Săo Chico (A1-A4) and Creporizinho (A5-A11) garimpo areas.
Study Site
A1 Flooded open pit, clear water, near to Conrado River
A2 Săo
Chico
Reservoir
A3 Flooded open pit, mining wastes, high turbidity, near Rosa stream
A4 Inflow Conrado River to Novo River
A5 Papagaio mining site; stream with high turbidity
A6 Flooded open pit at Bofe site
A7 Flooded open pit at Tabocal site
A8 Buriti mining site; recent flooded open pit, near to Creporizinho River spring
A9 Porto Alegre site in Crepori River, upstream of Creporizaçăo village
A10 Inflow of clear stream to Crepori River
A11 Inflow of Chico Chimango, a clear water stream to Crepori River, near the
inflow of Creporizinho River to Crepori River
Site A2
Săo Chico
Reservoir
Site A1
Flooded
open pits
Photo 1. Săo Chico garimpo area, where can be see the Transamazônica road, the Săo Chico reservoir, and
several flooded open pits along of the secondary roads.
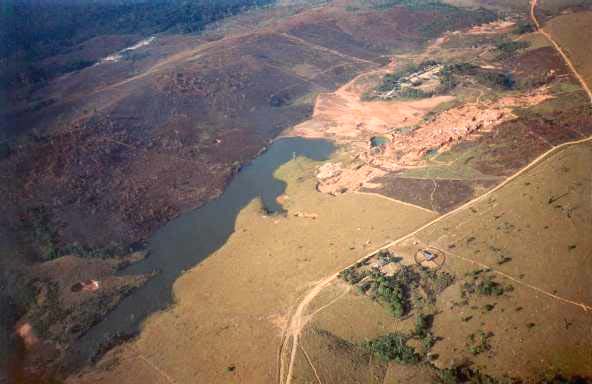
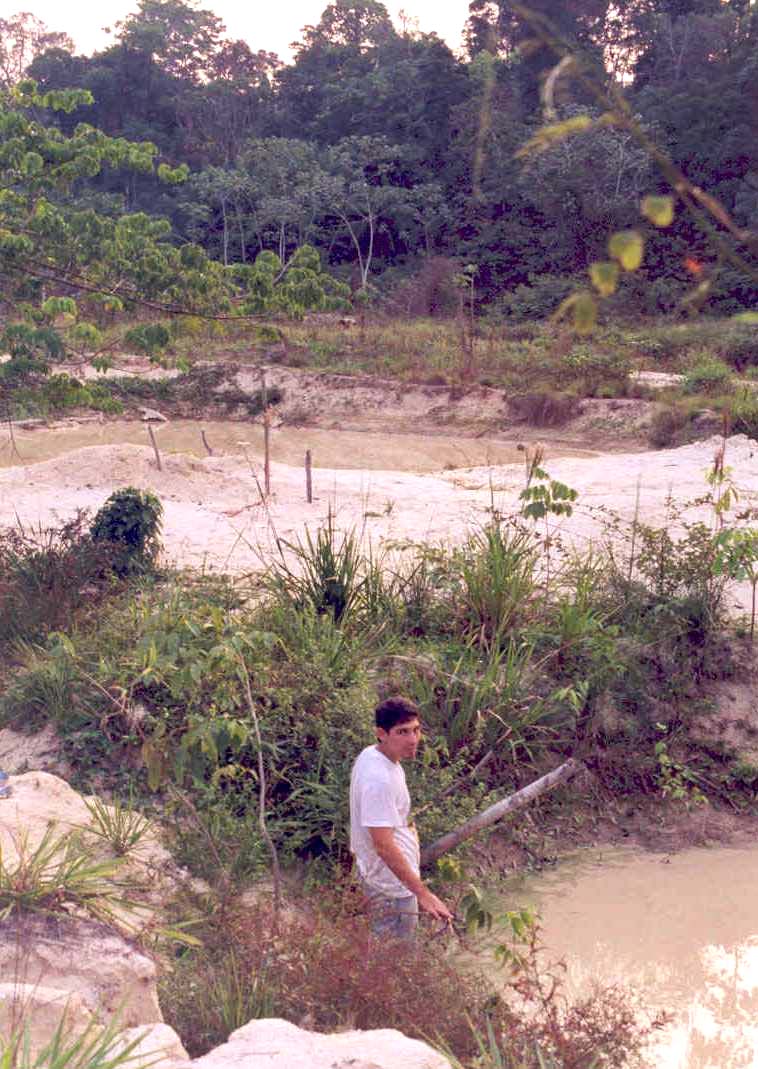
Site A2
Săo Chico
Reservoir
Photo 2. Săo Chico reservoir, mining sites and Săo Chico village.
Photo 3. Flooded open pit, mining wastes, high turbidity, near Rosa stream (A3)
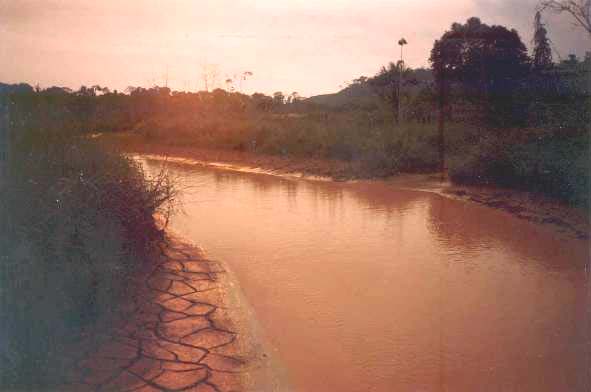


Photo 4. Conrado River. It is near A1, but fish are scarce there, due to high turbidity.
Photo 5. Inflow of Conrado River to Novo River (A5).
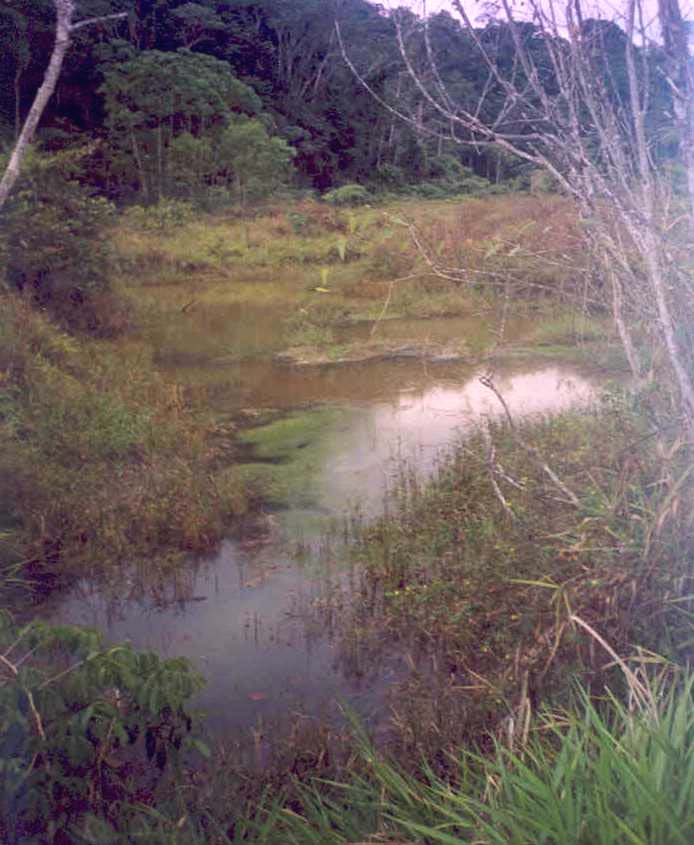
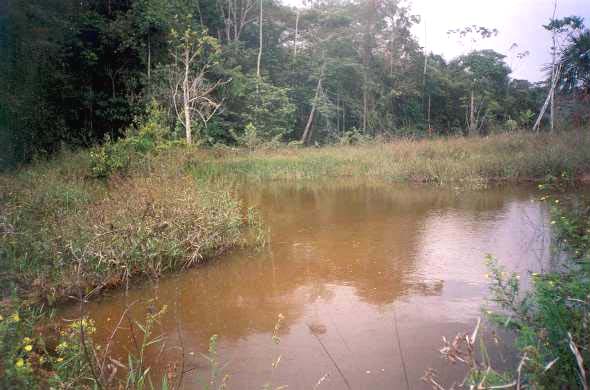
Photo 6. Flooded open pit at Bofe site
Photo 7. Flooded open pit in Baieta/Tabocal site (A7)
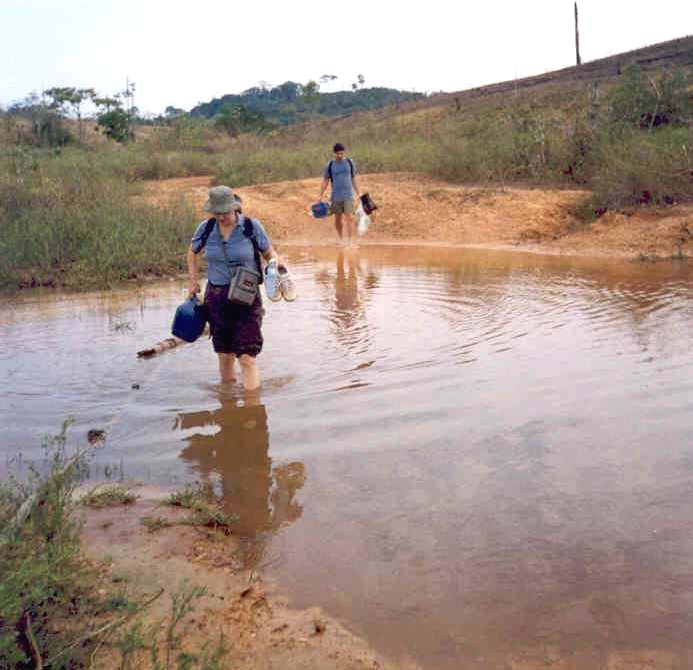
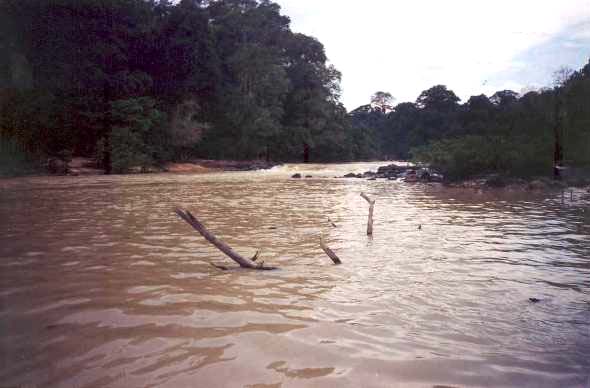
Photo 8. Flooded open pit in Buriti site (A8)
Photo 9. Crepori River, Porto Alegre site (A9), upstream of Creporizinho inflow.
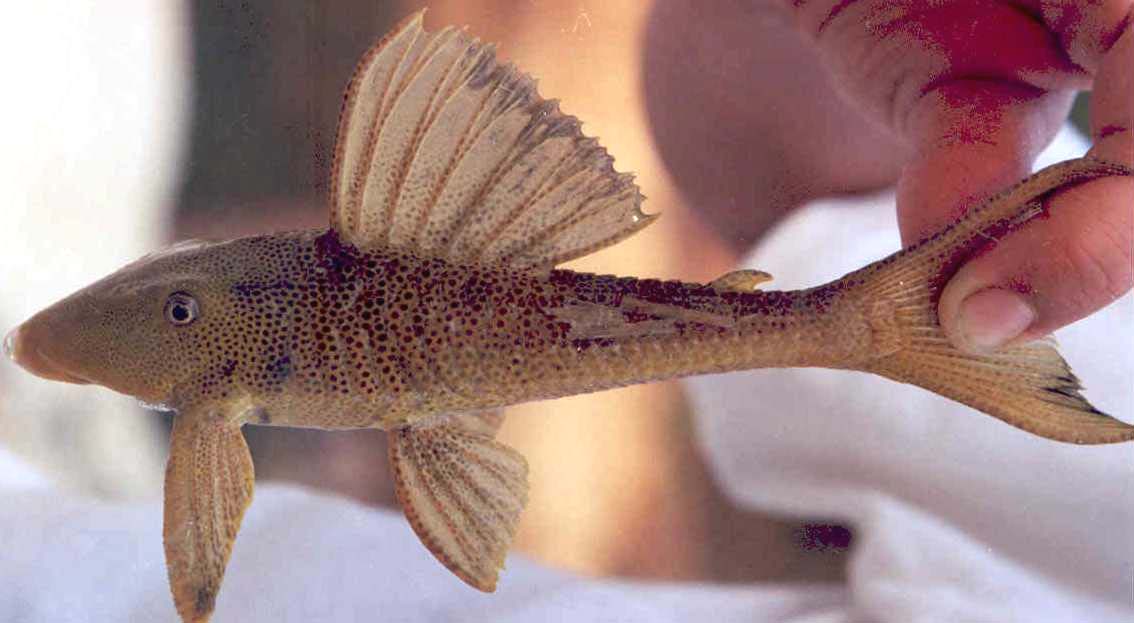
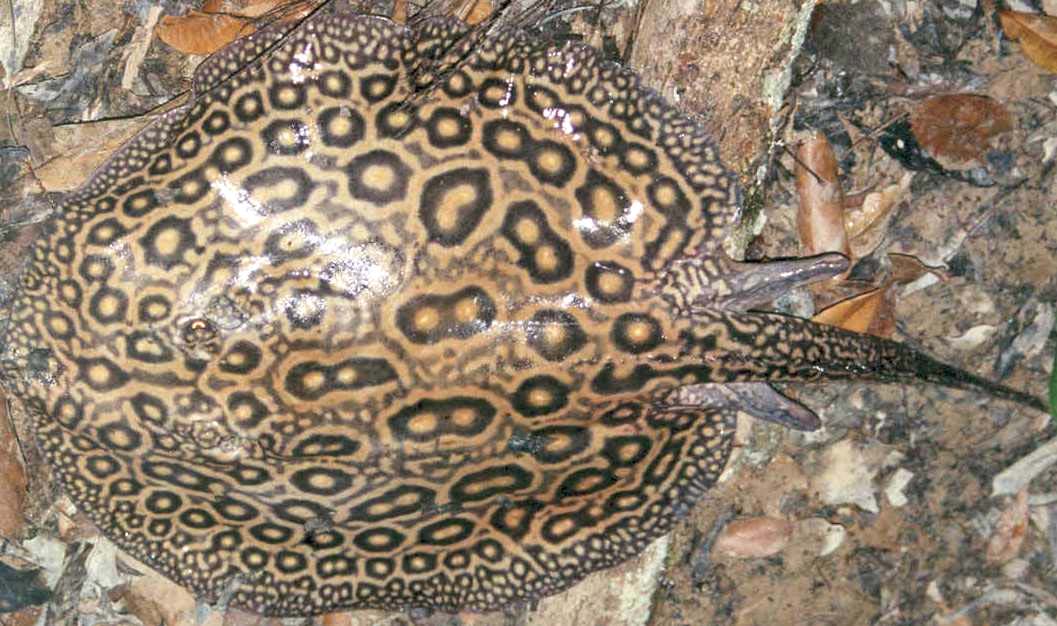
Fish collected
Photo 10. Fish collected: Acari
Photo 11. Fish collected: Arraia
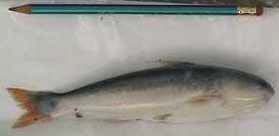
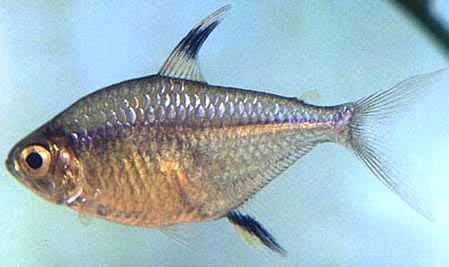
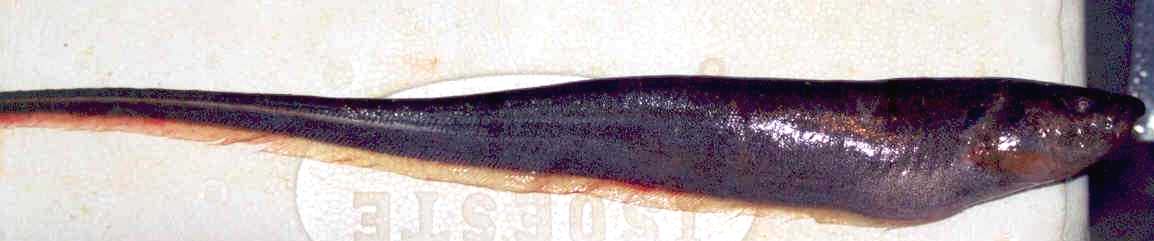
Photo 12. Fish collected: Candiru
Photo 13. Fish collected: Lambari
Photo 14. Fish collected: Ituí
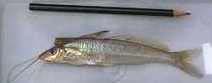
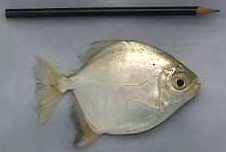
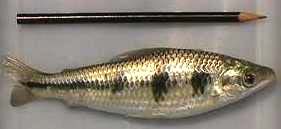
Photo 15. Fish collected: Mandi
Photo 16. Fish collected: Pacu
Photo 17. Fish collected: Piau
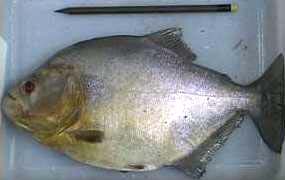
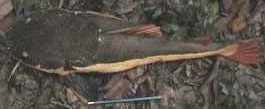
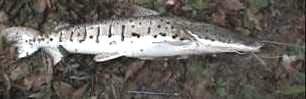
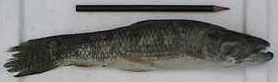
Photo 18. Fish collected: Piranha
Photo 19. Fish collected: Pirarara
Photo 20. Fish collected: Surubim
Photo 21. Fish collected: Traíra
APPENDIX 4
Hg concentrations in bioindicators other than fish
APPENDIX 5
Semiquantitative mercury determination in fish
A brief description of semiquantitative mercury determination in fish samples
To determine mercury concentration in fish, 10 g of sample is digested with an oxidant
mixture, containing sulfuric acid, nitric acid and vanadium pentoxide (Figure Ia). To the clear
solution obtained, containing ionic mercury, a reduction reagent (acid solution of stannous
chloride) is added and elemental mercury formed is forced by an air stream (Figure Ib). The
mercury steam is forced to go covered with emulsion containing cuprous iodide. The color
intensity formed by the complex is proportional to the mercury concentration in the sample.
a
b
b
Figure Ia: digestion system Figure Ib: determination system
At the end of the operation, the operator is capable to classify the sample according to the
WHO recommendations, by comparing it with the color developed in similar analytical systems,
containing standard solutions. Figure II shows the range of colors resulting from the analytical
tests.
0 ng/g
300 ng/g
600 ng/g
1000 ng/g
Figure II- Similar colors to those developed in the detecting papers
After determination, fish samples can be classified into 3 groups according to Table I.
Table I - Table classification according to mercury content and the WHO recommendations
Classification
Mercury content (ng/g) of fish
Proper for frequent consumption
Lower than 300
Proper for eventual consumption
Between 300 and 600
Not proper for consumption
Higher than 600
The semiquantitative method was compared to the conventional analytical method
(CVAAS), whose performance was checked using Standard Reference Materials of fish muscle
and liver fish (Squalus acanthias) produced and distributed by National Research Council
Canadá (NRC-CNRC), named DORM-1 and DOLT-2. Participation on the Mercury Quality
Assurance Program (MQAP), coordinated by Canadian Food Inspection Agency has been used
for the quality assurance of the quantitative method since January 2000. Some results are shown
in Figure III which confirmed the method accuracy.
2500
Reference value
2000
Found value
1500
1000
500
0
A-1
A-2
A-3
A-4
B-1
B-2
B-3
B-4
C-1
C-2
C-3
C-4
D-1
D-2
D-3
D-4
Figure III - Quality assurance results for interlaboratorial the quantitative method
(CV-AAS).
Since February 2002 the semiquantitative results are being accompanied by quarterly
performance evaluations coordinated by the Canadian Food Inspection Agency (Table II). The
results obtained showed that the method is sufficiently accurate even in a semiquantitative level.
Table II - Comparison of semiquantitative results for interlaboratory rounds coordinated by
the Canadian Food Inspection Agency
MQAP
Found value ng/g (n) Reference Value ng/g (N)
MQAP 308
300-600 (3)
190 to 374 (43)
MQAP 309
300-600 (3)
286 to 494 (42)
MQAP 310
>1000 (3)
1433 to 2975 (43)
MQAP 311
300-600 (3)
197 to 381 (42)
MQAP 312
300-600
301 to 481 (42)
MQAP 313
600-1000
465 to 757 (42)
MQAP 314
300-600
306 to 474 (42)
MQAP 315
>1000
707 to 1495 (43)
MQAP 316
300-600
349 to 605
MQAP 317
300-600
282 to 478
MQAP 318
600-1000
794 to1438
MQAP 319
<300
199 to 365
MQAP 320
<300
147 to 283
MQAP 321
<300
283 to 527
MQAP 322
300-600
288 to 588
MQAP 323
300-600
442 to 818
n= number of replicates ; N=number of participants in the round