Ministry of Agriculture
and Rural Development
Ministry of Environment
Code of Good
Agricultural Practice
- 2001 -
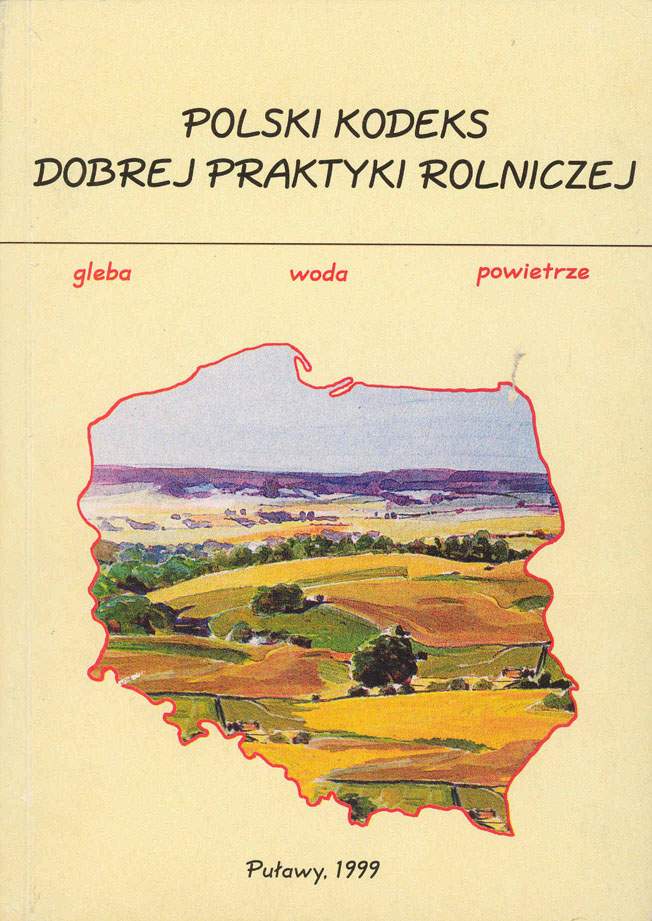
Poland is often perceived abroad as a
Being specific and unique element of the
country of open space: vast plains
environment from the earliest days on, water has
interspersed with lakes, extensive always been decisive factor to determine both,
meadows and woodland. This image has
human life itself and its quality. Water resources
been sustained thanks to the natural
in Poland comprising lakes, rivers and their water
heritage preservation efforts of the
basins belong to our common heritage. They
earlier generations of Polish farmers. It
provide us with potable water, render the
is thanks to their ways of farming land
development of agriculture and industry possible
over many decades that we can now
as well as enable all of us to enjoy recreation
pride ourselves on the landscape they
activities. Thus, it is of utmost importance for us
have passed on to us.
to protect our heritage and ensure that
technological development and economic growth
However, it is also us who need to
are of little negative impact to the quality of our
expand our farming community's waters.
awareness on the environmental aspects
of agriculture to ensure its Farmers have been traditionally assigned with the
environmentally sustainable
role of guardians protecting rural landscape and
development. Raising farmers' heritage. They understood the natural environment
awareness on these matters and protection was very important quite a long time
supporting their efforts to have the
ago. They have always known that the
manure and animal waste collection and
environment protection is important not only for
storage facilities installed on the farm
the sake of nature itself, but also because it is the
holding is the responsibility of the
only source to sustain life. However, the last few
Ministry of Agriculture because of the
decades witnessed some significant changes in
growing importance of the activities that
farming practices that have led to growing
ensure effective animal waste utilisation
specialisation and intensity of agricultural
and management. Proper management
activities. They, in turn, have led to some adverse
practices bring twofold benefits as they
effects on natural assets, including water, and, in
prevent soil and water pollution on the
broader sense, the entire environment.
one hand, and maximise the nitrogen
content in organic fertilisers and the best
As an attempt to fill in the information and
effects if applied to the soil on the other.
educational gap, "Code of good agricultural
practice" provides farmers with a collection of
"Code of good agricultural practice"
environmentally friendly agricultural practices. If
presents practical guidance on how to
applied, they will ensure sustainable growth of
minimise water pollution and what best
agricultural production. The major aim of CGAP
practices can be applied on an individual
is to upgrade the general awareness and basic
farm to control it. The Code is to inform
knowledge on water protection as it is a major
and instruct farmers on how they can
element of the natural environment, to be
enhance the landscape they live and
followed by the enhanced knowledge of how to
work because their role is absolutely
better protect some other natural environment
crucial to further development.
resources such as soil, air and landscape. We need
Therefore, the use of CGAP should be
to know what can be done to protect them better.
recommended to the entire farming
community.
Handing over the CGAPP to readers I hope its use
is going to be promoted widely by all the
interested parties local self-government
authorities, agricultural organisations, academics
and research workers and agricultural extension
services as well as farmers communities nation-
wide. We all need to act to sustain natural
resources for our own sake.
Jaroslaw Kalinowski
Stanislaw elichowski
Legislation on the
agri-environment protection
A
Farm holding facilities
and management
in sustainable agriculture
· Management according to farm field structure
· Plant and animal production arrangements
· Balancing mineral and organic matter nutrients
· Integrated plant protection
B
Water protection
· Protecting water against point-source pollution
- Manure pad and tanks to store organic fertilisers
- Other solutions to protect water
· Protecting water against non-point source pollution
- application timing and dosing for mineral and organic
fertilisers
- application of sewage and sewage sediment effluents
- application of plant protection chemicals
- agronomic methods to prevent water pollution
C
Protection of farmland
· Protection of soil against erosion and physical degradation
- Erosion caused by water
- Erosion caused by air
- Air water relations in soil on farmed land
- Air water relations in soil on grassland
· Protection of soil against chemical degradation
- Soil reaction
- Content of nutrients in assimilable form
· Protection of soil against biological degradation
- Organic matter content in soil
- Biological soil activity
D
Protecting air
· Air fogginess and dustiness
- Odour substances
- ammonia
- greenhouse gases
E
Protecting landscape and
maintaining biodiversity
· Farm holding in rural landscape
· Biodiversity in a farm holding
F
Rural areas infrastructure
G
Abridged set of good
agricultural practice
principles to implement the
Nitrate Directive
H
Annexes
Annex 1
Soil organic matter reproduction and degradation coefficients
Crop or organic
Soil reproduction (+) or degradation (-)
fertiliser
Unit
light medium Heavy
Humus-type
soils
Root crops
1 ha
-1,26
-1,40
-1,54
-1,02
Maize/corn
1
ha -1,12 -1,15 -1,22 -0,91
Cereals, oil-
1
ha -0,49 -0,53 -0,56 -0,38
seed plants
Legumes 1
ha +0,32 +0,35 +0,38 +0,38
Turf grass
1 ha
+0,95
+1,05
+1,16
+1,16
Papilionaceous
1
ha +1,89 +1,96 +2,10 +2,10
crops
Manure 10
t
+0,70
Slurry
10 t
+0,28
Straw 10
t
+1,80
Example (chapter B, item 20):
Crop rotation on light soil: potatoes 1 ha (25 tonnes of manure/ha) maize 1 ha - oats 1 ha - rye 1 ha
Organic matter balance = l ha*(-1,26) + 25ton*(O,O7) + I ha*(-1,12) + 1 ha*(-O,49) +
1 ha*(-O,49) = -1,61
Warning! Organic matter balance is negative, crop rotation should be modified or new source of organic
matter should be added (aftercrop, straw to be ploughed in).
Annex 2
Rates for farm livestock to be converted into Large Livestock Units (LLUs)
Regulation of the Minister of Environment, Natural Resources and Forestry of 14 July, 1998 (JoL, No
98 of 23 September, 1998)
Animal species and type
Age or weight
1 animal = 1 LLU
Fully grown horses
Weight over 500 kg
I ,2
Young horses
2-3 years, 1-2 years, 0,5-1year, up to 6
1,00; 0,80; 0,50; 0,30
months
Bulls
over 600 kg
1,40
Cows and heifers to be calved
over 2 years, weight about 500 kg
1,00
Heifers and young bulls
1-2 years, 6 to 12 months
0,80; 0,30
Calves
up to 12 months
0,15
Sows and boars
Sows with piglets
0,30
Fatteners
Heavy, bacon type
0,25; 0,20
Whiners
Up to 30 kg
0,10
Piglets
Up to 2 months
0,02
Rams
Over 18 months
0,12
Ewes heavy with lambs or milk
Over 18 months
0,10
ewes
Young sheep
Young rams and ewes
0, l 0; 0,08
Lambs
6-12 months
0,05
Example (chapter C, item 10):
A farm holding with 15 hectares of farmland has livestock including cattle and pigs.
Cattle herd (closed cycle) includes: 10 cows, 5 calves up to 6 months, 5 heifers and young bulls 6-12
months, 5 heifers and young bulls 1-2 years. Pigs: (piglets have been bought): 20 whiners up to 30 kg,
20 pigs fattened for bacon.
Livestock density in LLU: = 10 cows *(I,00) + 5 calves*(0,15) + 5 young cattle 6-12 months *(0,30) +
5 young cattle 1-2 years* (0,80) + 20 whiners* (0,10) + 20 pigs fattened for bacon* (0,20) = 20,25
Annex 3
Organic fertiliser and nutrients amount from 1 animal per year.
Animal species
Manure
Slurry
and type
Weight in Nitrogen Phosphorus Potassium
Weight in
Nitrogen in Phosphorus Potassium
tonnes
in kg
in kg
in kg
tonnes
kg
in kg
in kg
Cattle
Calves 0-6
2,6
20,8
5,2
15,6
- - - -
months
Young bovine
animals, 6-12
2,9
15,4 8,1 19,1 7,0 23,1 7,7 29,4
months
Young bovine
animals 12-24
4,8 25,0 15,4 31,2 12,1 42,3 15,7 58,1
months
Cows - 4000
12,0
66,0 38,3 64,8 23,2 97,4 39,4 107,0
1mleka
Pigs
Sow with
4,0 20,0 24,4 18,8 8,3 25,4 26,6 20,7
piglets
Whiners up to
0,6
3,6 3,4 2,7 1,2 5,4 3,8 3,1
do 30 kg
Fatteners 30-
1,2
7,2 6,9 5,4 2,4 10,8 7,5 6,3
110 kg
Sheep
1,5
1,1
0,6
1,8 - - - -
Horses
2,8
23,8
12,9
33,9
- - - -
* kept indoors all the year round
Example (chapter C, items l; 7):
The farm is the same as in Annex 2, all the animals kept indoors according to manure system.
Amount of manure = 10 cows*(12,0) + 5 calves*(2,6) + 5 young bovine animals*(2,9) + 10 young
bovine animals*(4,8) + 20 whiners*(0,6) + 40 fatteners*(1,2) = 155 tonnes of manure = 155*1,1 = 170
m3 manure in a year.
Annex 4
Average amount of nitrogen nitrate (N-NO3) in soil in autumn
Soil layer
N-NO3 content in soil in kg/ha
Very light
light
medium
Heavy
0-30
cm
28 33 37 37
30-60
cm
15 18 20 20
60-90
cm
10 12 14 14
0-90
cm
53 63 71 71
Example (chapter C, item 65):
Farm holding is located on light soil with water capacity of 70+70+70 = 210 mm in the 0-90 cm layer;
wintertime precipitation totals 140 mm.
The rainfall can move during wintertime up to 60 cm deep in soil (70 + 70 mm) and nitrates from the
soil layer of 60-90 cm and 30-60 cm are going to leach into the ground water. Out of the total quantity
12 + 18 = 30 kg of the nitrogen leaching, half of the nitrogen will be lost (denitrification), and half of it
will enter ground water. Thus, having added 140 mm rainfall (1400000 litres or kg / ha), 15 kg N-NO3
per ha will enter ground water, which equals 15000000 mg/ 1400000 kg = 10 mg N-NO3 in 1 litre (after
rounding).
Warning: it is upper limit of nitrate nitrogen in drinking water there is a risk o nitrate pollution and the
farm holding in question should apply prevention measures, for e.g. grow cover or winter crops (green
fields).
Annex 5
Nutrients intake by some plants per one yield unit
Group of plants or
Kg per100 kg (1 dt)
Kg per 100 kg (l dt)
a plant
major crop + side crop
side crop
Nitrogen Phosphorus Potassium Nitrogen Phosphorus
Potassiu
m
Cereals and similar crops (seeds)
Winter wheat
2,37
0,98
1,51
0,52
0,18
1,20
Rye 2,16
1,00
2,16
0,55
0,21
1,42
Triticale 2,41
1,07
2,
11
0,59
0,23
1,45
Spring barley
2,10
0,96
1,64
0,55
0,29
1,44
Oats 2,22
1,08
2,19
0,59
0,27
1,88
Rape seed
5,18
1,97
4,00
1,45
0,30
2,04
Peas 4,86*
1,35
3,24
1,68
0,41
2,11
Root and fodder crops
Potatoes 0,39
0,14
0,66
0,26
0,07
0,41
Sugar beets
0,40
0,16
0,65
0,36
0,09
0,66
Maize 0,37
0,14
0,46
-
-
-
Clover 0,51*
0,
11
0,53
-
-
-
Alfaalfa 0,61*
0,14
0,56
-
-
-
Grass mixtures
0,50
0,14
0,58
-
-
-
Crop grass
0,51
0,14
0,59
-
-
-
Grassland 0,40
0,
11
0,49
-
-
-
* - it is assumed that papilionaceous take in 50-70% N through Rhizobium
Example (chapter D, item 62):
Crops grown on the farm: potatoes(2,5 ha, yield 250 dt), rye (3,0 ha, yield 40 dt), oats (2,5 ha, yield 30
dt) and maize for silage (3,0 ha, yield 350 dt).
Nitrogen intake = (2,5*250*0,39) + (3,0*40*2,16) + (2,5*30*2,22) + (3,0*350*0,37) = 1058 kg
Nitrogen/ 11 ha = 96 kg of Nitrogen from 1 hectare.
Phosphorus intake = (2,5*250*0,14) + (3,0*40* 1 ,00) + (2,5*30* 1 ,08) + (3,0*350*0,14) = 435 kg
Phosphorus/11 ha = 39 kg Phosphorus from 1 hectare.
Potassium intake = (2,5*250*0,66) + (3,0*40*2,16) + (2,5*30*2,19) + (3,0*350*0,46) = 1318 kg
Potassium/11 ha = 120 kg Potassium from 1 hectare.
Annex 6
Rates to convert yield into grain units
Plan or plant group
Yield unit
Following conversion into grain
units
Cereals, buckwheat
100 kg grain
1,00
Rape seed
100 kg seeds
2,00
Legumes
100 kg seeds
1,20
Potatoes, sugar beets
100 kg tubers, roots
0,25
Maize for silage
100 kg green mass
0,12
Alfaalfa, clover, mixtures
100 kg green mass
0,14
Grass for fodder, pasture
100 kg green mass
0,13
Permanent grassland
100 kg hay
0,40
Example (chapter D, item 63):
Farm holding as in example 5,
Grain units from 1 hectare = 250 dt, potatoes*0.25 + 40 dt, rye* 1,0 + 30 dt, oats* 1,0 +
350 dt, maize *0,12 = 43,6 grain units per one hectare.
Nitrogen intake: 43,6*2,4 = 105 kg nitrogen from 1 hectare.
Phosphorus intake: 43,6*1,1 = 48 kg Phosphorus from 1 hectare.
Potassium intake: 43,6*2,6 = 114 kg Potassium from 1 hectare.
NOTE: as calculated here., the nutrient intake differs slightly from that in Annex 5 (for the same farm
holding), but the differences are negligible.
Document Outline
- ţ˙
- ţ˙
- ţ˙
- ţ˙
- ţ˙
- ţ˙
- ţ˙
- ţ˙
- ţ˙
- ţ˙
- ţ˙
- ţ˙
- ţ˙
- ţ˙
- ţ˙
- ţ˙
- ţ˙
- ţ˙
- ţ˙
- ţ˙
- ţ˙
- ţ˙
- ţ˙
- ţ˙
- ţ˙
- ţ˙
- ţ˙
- ţ˙
- ţ˙
- ţ˙