1
Managing Lake Basins
2
Practical Approaches for Sustainable Use
3
4
(Final Report for GEF-Medium Sized Project: Towards a Lake Basin Management
5
Initiative)
6
7
8
9
10
11
12
13
14
15
16
17
18
19
20
21
22
23
24
25
26
27
28
29
30
31
32
33
34
35
36
37
38
39
40
41
42
43
44
45
46
47
48
49
50
51
52
53
Front and back covers to be a single, continuous stylized map of the world with lakes
54
indicated in their native languages. Logos on bottom.
55
1
Additional Front Matter will include:
2
3
Publication Data
4
List of Tables
5
List of Figures
6
List of Boxes
7
List of Acronyms and Abbreviations
8
Dedication?
9
10
Executive Summary (also to be published separately)
11
12
Back Matter will include several Appendices, a Glossary and a CD-ROM of Volume 2
13
(Experience and Lessons Learned Briefs) and Volume 3 (Thematic Papers). An electronic
14
copy of Volume 1 (this main report) will also be included on the CD. The CD will have a
15
search mechanism.
16
17
Draft Final Report: Not for Quotation or Citation
ii
1
Table of Contents
2
3
Table of Contents ........................................................................................... iii
4
Foreword ...................................................................................................... vii
5
Acknowledgements ........................................................................................ ix
6
Structure of the Report ................................................................................... xi
7
Section I. Understanding the Resource ............................................................1
8
Chapter 1: Biophysical Characteristics of Lakes ................................................3
9
Extent and Global Distribution of Lakes ............................................................... 3
10
Lakes and Their Basins ..................................................................................... 3
11
Characteristics of Lakes .................................................................................... 5
12
Long Retention Time ................................................................................... 5
13
Complex Dynamics ..................................................................................... 6
14
Transmissivity............................................................................................ 7
15
Chapter 2. Human Use of Lakes .......................................................................9
16
A Lake; its Development and Management ........................................................... 9
17
The Story of a Lake..................................................................................... 9
18
Commentary ........................................................................................... 10
19
Resource Value of Lakes and Lake Basins........................................................... 13
20
Typical Problems Facing the World's Lakes.......................................................... 15
21
Response to the Problems: Management Interventions......................................... 18
22
The Components of Lake Basin Management ...................................................... 19
23
Section II. Meeting the Governance Challenge................................................ 23
24
Chapter 3. Effective Institutions: Responding to Change ................................. 25
25
Institutions: Society's Response to Scarcity........................................................ 25
26
What are effective institutions? ................................................................... 25
27
A Typology of Institutional Forms for Lake Basin Management ............................... 26
28
Customary and self-regulated management .................................................. 26
29
Coordinating committee............................................................................. 27
30
Coordinating agency ................................................................................. 27
31
Executive (regulatory) agency .................................................................... 28
32
The Role of Local governments ................................................................... 28
33
Evolution of integrated lake basin management .................................................. 29
34
The governance framework for lake basin management ....................................... 30
35
The enabling environment .......................................................................... 30
36
Transparency and accountability.................................................................. 31
37
Customary rights...................................................................................... 31
38
The necessity of harmonization ................................................................... 31
39
Towards effective institutions........................................................................... 32
40
Chapter 4: Identifying Effective Policies: Incentives and Regulations .............. 33
41
A Not-so-simple Example ................................................................................ 34
42
Identifying Potential Policy Responses ............................................................... 35
43
Rules and Regulations--Command and Control Policies.................................... 35
44
Policies that Use Existing Markets................................................................ 37
45
Policies that Create Markets ....................................................................... 38
46
The Policy Matrix ........................................................................................... 39
47
Lessons of Past Experience: Increasing the chances for successful policy
48
implementation ............................................................................................. 43
Draft Final Report: Not for Quotation or Citation
iii
1
Policies, Policy Tools and Governance ................................................................ 45
2
Chapter 5: Involving People: Values, Education and Participation ................... 47
3
Who are the "People"? .................................................................................... 48
4
Farmers and Agriculturalists ....................................................................... 48
5
Business and Industry ............................................................................... 48
6
Youth ..................................................................................................... 48
7
Indigenous People .................................................................................... 49
8
Women ................................................................................................... 49
9
Non-Governmental Organizations (NGOs) ..................................................... 49
10
Local Governments ................................................................................... 49
11
Public Participation and Empowerment .............................................................. 50
12
Community-level Participation..................................................................... 51
13
Lessons Learned Regarding Public Participation ................................................... 51
14
Chapter 6. Technological Responses: Possibilities and Limitations .................. 55
15
Watershed-based Measures ............................................................................. 58
16
Wastewater Diversion................................................................................ 58
17
Conventional Wastewater Treatment (Primary and Secondary Treatment)........... 58
18
Advanced Wastewater Treatment (Tertiary Treatment) .................................... 59
19
Industrial Wastewater Treatment ................................................................. 60
20
Constructed Wetlands................................................................................ 61
21
Reforestation ........................................................................................... 62
22
In-Lake Measures .......................................................................................... 63
23
Predators ................................................................................................ 63
24
Biomanipulation ....................................................................................... 63
25
Biocides .................................................................................................. 64
26
Aeration.................................................................................................. 64
27
Freshwater Diversion into a Basin ................................................................ 64
28
Dredging................................................................................................. 65
29
Harvesting .............................................................................................. 66
30
Chapter 7. Informing the Process: The Role of Science and Monitoring............ 67
31
Information Needs for Lake Basin Management................................................... 67
32
Use of Scientific Information............................................................................ 67
33
Showing limits to a resource....................................................................... 68
34
Enlightening hard to see connections ........................................................... 68
35
Providing Innovative/Novel Approaches (to solve conflicts) .............................. 70
36
A Note on Modeling................................................................................... 70
37
"Non-use" of Science...................................................................................... 71
38
Value of Monitoring........................................................................................ 72
39
To assess baseline conditions...................................................................... 72
40
To assess effects of a policy........................................................................ 73
41
What to monitor....................................................................................... 73
42
A Note on Serendipity ............................................................................... 74
43
Sharing Information ....................................................................................... 74
44
Use of Indicators ...................................................................................... 74
45
Museums and Information Centers .............................................................. 75
46
Involving People ....................................................................................... 75
47
Organizing/Carrying out Science and Monitoring ................................................. 76
48
Resident Institutes.................................................................................... 76
49
Internationally funded programs ................................................................. 76
50
Fragmentation ......................................................................................... 76
51
How much information is enough? .................................................................... 77
52
Chapter 8. Mobilizing Sustainable Funding ..................................................... 79
53
The Decision Maker's Complaint ....................................................................... 79
54
Locally Generated Funds ................................................................................. 80
Draft Final Report: Not for Quotation or Citation
iv
1
User Fees................................................................................................ 81
2
Pollution Charges...................................................................................... 82
3
An independent source of funding? .............................................................. 83
4
The Principle of Cross-subsidization ............................................................. 84
5
Should people pay for "gifts of nature/basic human rights"? ............................. 84
6
The special case of the "poorest of the poor" ................................................. 85
7
National Funding ........................................................................................... 85
8
External Funding ........................................................................................... 86
9
The Special Case of the Global Environmental Facility (GEF) ............................. 86
10
External funding--necessary? sufficient?....................................................... 87
11
The Sustainability of External Funding, or, is there life after external funding?? ... 87
12
Practical Steps towards Securing Additional Funding ............................................ 88
13
Section III. Synthesis .................................................................................... 91
14
Chapter 9. Plans to Action: Integration of Planning Dimensions ...................... 93
15
Lake Basin Planning ....................................................................................... 93
16
A Framework for Analyzing Lake Basin Planning .................................................. 96
17
Integration of Management Interventions over Time and Space............................100
18
Integration by Encompassing.....................................................................100
19
Integration by Unification..........................................................................101
20
Integration by Broadening.........................................................................101
21
Integration Lessons ......................................................................................102
22
Integration should first take place where the pressures are greatest.................102
23
Integration should be phased over time .......................................................103
24
Integration should be pursued by necessity rather than integration by design ....103
25
Adaptive Management Planning.......................................................................103
26
Planning for Sustainable Lake Basin Management Institutions ..............................104
27
Planning for Lake Basin Governance.................................................................105
28
Chapter 10: Towards the Future ................................................................... 109
29
Reassessing Existing Lake Basin Management Programs ......................................109
30
Dealing With Roadblocks ................................................................................110
31
From Lake Basin Management Initiative to Global Lake Basin Governance ..............112
32
Toward Global Stakeholder Participation and Partnerships ...............................112
33
Toward Enhancement of the Global Lake Basin Management Knowledge Base ....112
34
Appendix A: Economics, Total Value, and Total Economic Value (TEV) ........... 113
35
The concept of Total Value and Total Economic Value (TEV) ..................................113
36
A With-project and Without-project Framework is Applied ...............................114
37
A Note of Caution ....................................................................................115
38
Summary: The Goal of an Economic Analysis ....................................................116
39
Appendix B: Project Details ......................................................................... 121
40
Key Organizations Involved in this Project.........................................................121
41
Objectives and Outcomes...............................................................................121
42
Lake Selection and Characteristics...................................................................122
43
Lake Briefs, Thematic Papers and Regional Workshops ........................................123
44
Website Clearinghouse and e-Forum ................................................................123
45
Steering Committee ......................................................................................123
46
Working Group Meetings ................................................................................123
47
Appendix C: List of Experience and Lessons Learned Brief and Thematic Paper
48
Authors ....................................................................................................... 124
49
Appendix D: Workshop Agendas and Participant Lists................................... 125
50
Appendix E: Summaries of 28 Project Lakes ................................................. 126
Draft Final Report: Not for Quotation or Citation
v
1
References.................................................................................................. 127
2
Glossary ..................................................................................................... 129
3
4
Draft Final Report: Not for Quotation or Citation
vi
1
Foreword
2
3
Lakes and reservoirs are vital to the economic development process. They contain about
4
90 percent of the earth's surface storage of liquid freshwater; are critical elements of the
5
earth's hydrological system; form vital ecosystems for aquatic biodiversity; and provide
6
livelihood and social, economic and aesthetic benefits that are essential for improving the
7
quality of life of the basin communities. Yet they have not received sufficient attention in
8
the global water policy discourse. Increasingly, human activities are profoundly impacting
9
their ecological integrity. Lakes are closed systems with relatively long retention times,
10
which can trap pollutants for extended periods. They have complex dynamics and
11
characteristics, and are particularly vulnerable to a range of anthropogenic stresses. The
12
science of limnology has improved considerably in the past few decades, but our
13
knowledge of how to effectively use science to inform public policy and the management
14
of lakes remains limited. To address the knowledge gap, the World Bank partnered with
15
the GEF, UNDP, UNEP, Ramsar Bureau, USAID, BNWPP, Shiga Prefecture, ILEC, LakeNet,
16
and lake stakeholders to implement a cooperative project to review lessons from the
17
experience of lake basin management at 28 lake basins around the world. Appendix B
18
summarizes the project's objectives, methodology, and implementation arrangements.
19
This report is a key output of the project.
20
21
This report builds on the World Lake Vision presented at the Third World Water Forum,
22
which highlighted key principles of lake basin management, and the recommendation of
23
the World Bank to develop a Lake Basin Management Initiative (see Ayres et al 1996). It
24
also supports the implementation of the World Bank's Environment Strategy and Water
25
Resources Sector Strategy. It is also an important contribution to practical approaches to
26
sustainable lake basin management, supporting the Millennium Development Goals
27
(MDG) on sustainable water resources management.
28
29
The project has produced four major benefits. First, it has focused on practical
30
lessons learned from lake basin management efforts around the world. Although much
31
work has been done to share scientific and technical experiences on lakes--as evidenced
32
by the number of international, government, and academic conferences and
33
publications--less attention has been devoted to analyzing the effectiveness of
34
alternative management approaches, including the policy, institutional, economic, and
35
social dimensions of lake management. A strong scientific knowledge base is critical to
36
sustainable management, but little has been done to draw practical lessons from the
37
implementation of water and environmental policies and institutional reforms, or from
38
involving people in lake basin management programs around the world. This report
39
directly addresses this gap and should help strengthen the human capacity for improved
40
lake and reservoir basin management at the local, basin, national, and global levels.
41
42
Second, the project has created new knowledge. It supported the preparation of lake
43
briefs focusing on experiences and lessons learned for 28 lakes from East, Central, and
44
South Asia; Eastern and Western Europe; Eastern, Central, and Southern Africa; and
45
North, Central, and South America. In addition, the project produced 17 thematic papers
46
on specific lake management issues. Additionally, knowledge was generated and shared
47
by more than 200 lake stakeholders and participants at the three regional workshops
48
held in Burlington, Vermont, USA in June 2003; in Manila, Philippines in September 2003;
49
and in Nairobi, Kenya in Novemb er 2003. Knowledge creation and sharing was also
50
supported by a project-implemented electronic forum that linked global stakeholders in
51
the review of the lake briefs, thematic papers, and this final report.
52
53
Third, the project fills an important gap in lake management experiences on tropical
54
lakes, saline lakes, and lakes in developing countries. A temperate zone bias was
55
avoided by the inclusion of many lakes from tropical, arid, and semi-arid regions. Further,
56
the project included a particular focus on lakes from developing countries where lessons
Draft Final Report: Not for Quotation or Citation
vii
1
have not yet been adequately synthesized or disseminated. Saline lakes are also included
2
in the project.
3
4
Finally, the report derives lake management lessons from internationally funded
5
projects, principally Global Environment Facility (GEF)-financed lake basin projects, as
6
well as lake projects financed by the World Bank and other agencies and governments.
7
Over the last decade, the GEF has provided the most significant financial support for lake
8
basin management projects through its three implementing agencies (World Bank, UNDP,
9
UNEP). The experience gained from the national and international lake projects reviewed
10
in this report has provided a wealth of new information from lake environments that have
11
not been studied well. The GEF has recognized that analysis and dissemination of past
12
lake basin management experiences will guide ongoing and future programs on these
13
lakes, as well as in other lakes and reservoirs.
14
15
At the broadest level, the report's intended audience includes communities, technical
16
staff and policymakers working on lake basin management, particularly the staff from
17
government and nongovernmental agencies, research and policy institutions, and funding
18
agencies. The report will be most useful to decision makers. This report also provides
19
guidance for the GEF, the World Bank, and other GEF implementing agencies such as
20
UNDP and UNEP for current and future lake basin management programs.
21
22
Draft Final Report: Not for Quotation or Citation
viii
1
Acknowledgements
2
3
This Main Report is a key output of the GEF Medium Size Project--Towards a Lake Basin
4
Management Initiative: Sharing Experiences and Lessons from GEF and Non GEF Lake
5
Basin Management Projects. The project was implemented by the World Bank and
6
executed by the International Lake Environment Committee (ILEC), with support from
7
LakeNet, between March 2003 and December 2004. The project was implemented as a
8
cooperative program supported by a partnership of multilateral and bilateral agencies,
9
local governments, non-governmental organizations, academic and research institutions,
10
individuals, and # resource persons and # stakeholders from 28 lake basins from Africa,
11
Asia, Europe, and Americas. Project implementation was supported by funds from the
12
GEF, USAID, and the government of Shiga Prefecture in Japan, the Bank Netherlands
13
Water Partnership Program, ILEC and the World Bank.
14
15
Project Implementation was led by Rafik Hirji of the World Bank and managed by
16
Masahisa Nakamura of ILEC. An international project Steering Committee consisting of
17
representatives from various organizations including Stephen Lintner, Chair (The World
18
Bank), Barbara Best (USAID), Peter Bridgewater (Ramsar Convention), Alfred Duda
19
(GEF), Sean Khan (UNEP) and Dann Sklarew (UNDP) provided overall guidance to project
20
implementation, and the preparation of the main report.
21
22
The ILEC and Lakenet Project Management Team and Secretariat also included Hiroya
23
Kotani, Genjiro Furukawa, Thomas Ballatore, Victor Muhandiki, Chiharu Uyama, and TBD
24
from ILEC, and David Barker, Lisa Borre and TBD from LakeNet. Richard Davis, Kisa
25
Mfalila, Sharon Esumei, Diane Flex, Robin Broadfield, Siree Malaise and Samson Kaber
26
from the World Bank supported data collection and project administration.
27
28
The 28 lake basin management briefs and 17 thematic papers on specialized topics
29
related to lake basin management formed other substantive outputs of the project. The
30
papers and the authors are listed in Appendix C and provided on the attached CD-ROM.
31
Additionally, Appendix D lists over 200 key stakeholders who reviewed the draft lake
32
briefs and thematic papers at three regional workshops for 12 lakes from Americas,
33
Europe and Central Asia held in Vermont, USA (June 2003), 8 lakes from East and South
34
Asia held in Manila, Philippines (September 2003) and 8 lakes from Eastern, Southern
35
and Central Africa held in Nairobi, Kenya (November 2003). These workshops were
36
organized with support from St. Michaels College in Burlington, Vermont, Laguna de Bay
37
Lake Development Authority in Manila, Philippines, and Pan-African START Secretariat in
38
Nairobi, Kenya. Regional co-ordination of the Lake Briefs was provided by Thomas
39
Ballatore of ILEC (Asian Lake Briefs), David Barker of LakeNet (North American, South
40
American and European Lake Briefs) and Victor Muhandiki of ILEC (African Lake Briefs).
41
Draft and final lake briefs and thematic papers and the main report were posted on the
42
project supported electronic forum for public comment. The final draft briefs for the 14
43
GEF supported lake basin management programs were also reviewed by the respective
44
implementing agency task managers.
45
46
The Main Report was prepared by a team, led by Masahisa Nakamura who served as
47
Senior Editor/Report Editor, and was composed of Thomas Ballatore, David Barker, Lisa
48
Borre, John Dixon, Walter Garvey, Victor Muhandiki, Masahisa Nakamura, James Nickum,
49
and Walter Rast. While working together as a team, each chapter had one or more lead
50
authors as follows: Chapter 1 (Biophysical Characteristics) Ballatore and Muhandiki;
51
Chapter 2 (Human Use of Lakes) Nakamura and Davis; Chapter 3 (Institutions) Nickum
52
and Nakamura; Chapter 4 (Policy) Dixon; Chapter 5 (People) LakeNet; Chapter 6
53
(Infrastructure) Ballatore, Chapter 7 (Role of Information) Rast and Ballatore; Chapter 8
54
(Financing) Dixon; Chapter 9 (Planning) Nakamura, Davis and Garvey; and Chapter 10
55
(Towards the Future) Garvey and Nakamura. Appendix A on Economics was prepared by
56
Dixon. Walter Rast and Richard Davis were the technical co-editors of the Report.
57
Draft Final Report: Not for Quotation or Citation
ix
1
Many others also contributed: TBD for preparation of maps; TBD for editing of the Lake
2
Briefs; TBD for Desk Top Publishing; TBD for production of the CD containing the Lake
3
Briefs and Thematic Papers. Add other acknowledgments as appropriate.
4
5
Preparation of the Main Report was supported by a series of Working Group Meetings of
6
the core team members and other lake basin stakeholders including Oyugi Aseto, Adelina
7
Santos-Borja, Eric Odada, Sonia Davila-Poblete and Sven Erik Jorgensen.
8
9
Michael Glantz from the National Center for Atmospheric Research and Nick Davidson
10
from the Ramsar Bureau peer reviewed the final report.
11
12
The Project Managers are very grateful to the funding agencies, steering committee
13
members, and all contributors including consultants, authors, reviewers, workshop
14
organizers and participants, and other supporters of the project and its outputs.
15
Draft Final Report: Not for Quotation or Citation
x
1
Structure of the Report
2
3
The report is organized in ten chapters under three sections. Section I includes two
4
chapters that provide the background for understanding the challenges facing lakes, and
5
their potential values and uses as a key resource for sustainable livelihoods and
6
development around the world, as well as for maintaining important life-supporting
7
ecosystems . Section II, with six chapters, forms the core of the report. It presents the
8
key lessons learned on the main themes of lake management from the 28 case studies
9
and 17 thematic papers: institutions, incentives and regulations, involving people,
10
technology, information, and financing. Section III, with the final two chapters, is a
11
synthesis of the report. The chapter on planning brings all the themes of Section II
12
together and discusses how lake basin management is carried out in practice. The final
13
chapter presents guidelines for taking action to improve the conditions of a lake and the
14
people and nature that both depend on it.
15
16
17
18
19
20
21
Chapter 1:
Chapter 2:
22
Section I:
Biophysical Characteristics
Human Use
Understanding the Resource
23
of Lakes
of Lakes
24
25
26
27
28
29
30
Chapter 3:
31
Institutions
32
33
34
Section II:
Chapter 4:
Chapter 5:
Chapter 6:
35
Meeting the
Incentives and
Involving People:
Technological
Governance Challenge
Regulations
Values and
36
Response
Participation
37
38
39
Chapter 7:
Chapter 8:
40
Information
Finance
41
42
43
44
45
46
Chapter 9:
47
Plans to Action
48
Section III:
49
Synthesis
50
Chapter 10:
51
Towards the
52
Future
53
54
55
56
57
Draft Final Report: Not for Quotation or Citation
xi
1
Draft Final Report: Not for Quotation or Citation
xii
1
2
3
4
5
6
7
8
9
10
11
12
13
14
15
16
17
18
19
20
21
22
23
Section I. Understanding the Resource
24
25
This section is comprised of two parallel chapters: the former (Chapter 1) discusses
26
biophysical aspects of lakes and the latter (Chapter 2) looks at how lakes are used and
27
how those uses have typically been developed and governed. Both chapters are written
28
with a prototypical lake in mind and we hope that the story told will resonate with people
29
everywhere. Taken together, these two chapters provide the background necessary to
30
understand the challenges facing lakes, and their potential values and uses, as a key
31
resource for promoting sustainable human livelihoods and development around the world,
32
as well as for maintaining important life-supporting ecosystems .
33
Draft Final Report: Not for Quotation or Citation
1
1
Chapter 1: Biophysical Characteristics of Lakes
2
3
Extent and Global Distribution of Lakes
4
5
Lakes are widespread and plentiful: considered collectively they contain more than 90%
6
of the available liquid freshwater on the earth's surface (Shiklomanov 1993). Although
7
there is no definitive count, there are at least several million lakes on the planet. Most
8
are small and often located in remote areas. Several hundred lakes are over 500 km3 in
9
surface area, however, making them major features of the global landscape.
10
11
Lakes are found on all continents of the world, even on Antarctica, which is home to
12
many saline surface lakes, and even some lakes buried under kilometers of ice (e.g.,
13
Lake Vostok). The distribution of lakes is governed primarily by variations in geology and
14
climate: geology in the sense that the land surface must contain a depression capable of
15
storing water; climate in the sense that there must be a balance between the amount of
16
inputs (precipitation) and outputs (evaporation, leakage to groundwater, outflowing
17
rivers) for the water to accumulate to large volumes. Where these two factor come
18
together most clearly, such as in the glacial deposit areas of North America and Europe,
19
lakes are hyper-abundant. Humans also construct artificial lakes by damming flowing
20
rivers. These reservoirs and impoundments are most often built in regions of the world
21
that lack substantial numbers of natural lakes, and are used primarily to address
22
recurring problems of water shortages (drought) or excesses (floods).
23
24
Lakes and Their Basins
25
26
Because of their unique properties, lakes occupy a significant niche in the global
27
hydrologic cycle, the means by which nature supplies water throughout our planet. A lake
28
is first and foremost a natural ecosystem, containing a large volume of water, and a
29
mixture of interacting living and non-living components. In fact, there is no way to
30
separate the influences of either component on the other.
31
32
A complete lake system, however, consists both of the depression in the land surface that
33
contains the water (the lake itself), as well as the land surface (drainage basin; see Box
34
1.1 on terminology) which surrounds the lake. Although water can also enter a lake from
35
underground sources (groundwater flow), the major water inputs are usually from
36
surface inflows (i.e. rivers, streams) and direct precipitation. The water entering a lake
37
from its drainage basin picks up and carries materials from the land to the lake, making
38
lakes good reflections of land-use and other human activities in their catchments.
39
40
The concept of the linkage between a lake and its surrounding drainage basin is of
41
fundamental importance in lake management. Problems with lakes can originate within
42
the lake itself (such as over-fishing), be transmitted to the lake from its upstream
43
drainage basin (such as agri-chemicals from irrigation areas), or in a few cases come
44
from outside the drainage basin (such as acid rain). Use of the lake's resources can also
45
impact on downstream communities. Thus, recognition of this fundamental interrelation
46
between the lake and its upstream and downstream drainage basin is an essential part of
47
effective lake management efforts. In this document, we will discuss the management of
48
the lake and its resources and so will focus on the lake and its upstream drainage basin,
49
as articulated in Principle 2 of the World Lake Vision (World Lake Vision Committee,
50
2003):
51
52
"A lake drainage basin is the logical starting point for planning and
53
management actions for sustainable lake use."
54
55
A further discussion on drainage basins, as well as an illustration of common types, is
56
illustrated in Boxes 1.1 and 1.2.
57
Draft Final Report: Not for Quotation or Citation
3
Box 1.1. Watershed, Catchment, or Basin?
Water somehow gets into a lake. In some cases, like Lake Victoria--a large, relatively shallow great lake--most
of the water enters as direct precipitation. For most lakes, however, the large majority of water enters as
precipitation runoff from surrounding land. For decision makers, what is happening on that surrounding land is
tremendously important because it has profound effects on the lake itself. Therefore, it is widely recognized
today that lake management cannot stop at the lakeshore but must extend to the surrounding land, and even
beyond in cases where atmospheric transport is important.
The problem is finding a common term for that surrounding land. Nowadays, several terms are used almost
interchangeably. The first is "catchment". The meaning is intuitive--the catchment is the area around a lake
that "catches" precipitation, which then drains to the lake (noting of course evaporation, evapotranspiration,
seepage to groundwater, etc. that occur along the way). A similar term is "drainage basin", which maintains the
intuitive flavor of "catchment"--namely, it is the area from which water "drains" to the lake. "Watershed" used
to mean the boundary between two catchments (or drainage basins!) but has become synonymous with the
catchment itself, not just the infinitely thin dividing line around the edge of the catchment. "Basin" literally is
like a wash basin--the area covered only by water--in this case, the lake itself. However, this use of the term is
not common among policy makers and "basin" too has come to be simple shorthand for "drainage basin".
Finally, "lake basin" is a drainage basin with a lake in it. Naturally there are catchments, drainage basins and
watershed without lakes in them; lake basins must have a lake to live up to their name!
This may seem quite confusing, but is actually simple--all the terms really mean the same thing--the land
surrounding a lake. In this report, we try to use "drainage basin" but all the terms are inevitably used at
different places in this report and in the lake briefs and thematic papers.
1
Box 1.2. Common Types of Drainage Basins
There are a wide variety of drainage basins types--each with profound effects for lake management and use.
Some of the more common types are illustrated below.
Closed Drainage Basin (endorheic basin)--A closed
basin with no water outlet (river, stream). Water
leaves the lake only through evaporation or seepage
to groundwater. This high rate of evaporation
generally leads to higher salinity (total ionic
concentration) in a lake. Thus, most lakes in closed
basins are either saline (total ionic concentration >3
g/L) or are becoming so. Examples of closed basin
lakes include the Aral Sea, and Lakes Chad and Issyk-
Kul.
Open Drainage Basin (exorheic basin)--An open
basin with a water outlet(s). Water leaves the lake by
one or more rivers, allowing ions (components of
salinity) to be flushed. Thus, the water remains
"fresh" (i.e., low salinity--drinkable). Most lakes in this
report are in open drainage basins. Examples are
Lakes Champlain, Constance and Dianchi.
Coastal Drainage Basin--A drainage basin with
flows to and from the ocean. Fresh water typically
enters the lake through rivers draining to it. The lake
Ocean
sometimes drains (via a river) to the ocean;
sometimes the ocean drains to the lake. This can lead
to complex salinity relationships. Examples include
Lake Chilika and, to a lesser extent, Laguna de Bay.
Draft Final Report: Not for Quotation or Citation
4
Mixed Flow Drainage Basin--A drainage basin with
flows that reverses depending on the season. In
contrast to a coastal lake, the flows typically come
from a freshwater river. This reversal of flow leads to
large fluctuations in lake water level and area. Tonle
Sap is an example of this type of lake. In this case,
the size of the lake's drainage basin is seasonal, since
the connecting river inflow is seasonal.
1
2
Characteristics of Lakes
3
4
The fact that the word "lake" is applied to such diverse waterbodies as Lake Baikal (1,637
5
m deep, 31,500 km2 of surface area, and 25 million years old) and Lake Baringo (2.5 m,
6
108 km2 of surface area, and a few thousand years old) indicates that, in spite of the
7
tremendous diversity of lakes around the world, they share some common characteristics.
8
These characteristics are examined below with the implications for management noted.
9
10
Long Retention Time
11
12
Rivers flow--lakes don't. Specifically stated, rivers are lotic (flowing water) whereas lakes
13
are lentic (standing water). Of course, that is an over-simplification--lakes have outlets
14
and their water is flushed, but the period of flushing is quite long, reaching over
15
hundreds of years for some lakes. This flushing period is called the retention time (or
16
hydraulic residence time) and is equal to the volume divided by the outflow. For most
17
lakes, the volume is so massive it dwarfs the flow, leading to long residence times. For
18
example, Lake Malawi contains around 18,400 cubic kilometers (km3) of water, but the
19
flow out of the lake (through rivers and evaporation) is just 66 km3 per year. With that
20
much water, Lake Malawi, like most other lakes, is a permanent feature of the landscape
21
on the human-time scale.
22
23
Long retention time has several important implications. One is that lakes are relatively
24
stable. Even in severe droughts, lakes still have some water in them: their large volumes
25
mask short-term variations. There are exceptions of course, usually of lakes in closed
26
basins like the Aral Sea, which is known to have dried up 3 times in the last 2 millennia.
27
Nevertheless, most lakes hold and can absorb large amounts of water, buffering both
28
floods and droughts. Acting as a "pool" of water, they present a flat surface allowing for
29
easy navigation. Additionally, long-retention time implies a slow rate of flow which allows
30
for more time (than in a river for example) for suspended materials to settle to the
31
bottom--this means that lakes act as sinks for many materials. Also, by simply being
32
around for a long time, they foster civilizations and can become symbols of a culture (like
33
rivers, of course).
34
35
Another implication is that long-term stability coupled with relative "isolation" provides
36
sufficient conditions for complex ecosystems to evolve in lakes. Just as islands can be
37
viewed as "islands of land in an ocean of water," lakes can be characterized as "islands of
38
water in an ocean of land." Both situations represent isolated ecosystems within which
39
area-unique biological communities can develop and evolve. Lake Malawi provides an
40
example of what millions of years of relative isolation, coupled with natural selection, can
41
accomplish--over 500 endemic (native) fish species exist in this lake. However, this
42
biodiversity can be rapidly destroyed, as demonstrated by the major loss of fish
43
community structure in Lake Victoria. This illustrates the important point that lake
44
ecosystems are very resilient when faced with stresses that have existed over
45
evolutionary-time scales but they are ext remely vulnerable to "new" stresses (usually
46
anthropogenic) that the ecosystem has never faced before.
47
Draft Final Report: Not for Quotation or Citation
5
1
Finally, and most importantly for management, once a lake is degraded, it takes a very
2
long time--if ever--to put things right. The implication is that before a decision is taken
3
that adversely affects a lake, one must be really sure that is a wise course to take
4
because turning back the clock is very hard, very costly, and often, just plain impossible.
5
The loss of fish species in Lake Victoria is a clear example; the long-term release of toxic
6
chemicals from sediment is another. Thus, the long retention time of lakes leads to lags
7
in response that makes them poorly matched to the human management timescale.
8
9
Complex Dynamics
10
11
In addition to long retention time, lakes are complex systems: what you put into a lake is
12
not necessarily what you get out. And what you get out depends on how much was put
13
in, when, and in what order. This complex response is termed "hysteresis" and is
14
illustrated in Figure 1.1.
15
16
D
C
*
*
Time
Plankton
Concentration
Time
*
B
A *
Nutrient Concentration
17
Figure 1.1. An example of complex dynamics of a lake.
18
19
Imagine a relatively pristine (oligotrophic) shallow lake lying at point A in Figure 1.1.
20
Nutrient concentration is quite low, so the concentration of plankton living in the lake (an
21
indicator of trophic state) is also low--there is not enough food to go around. As human
22
population around the lake grows and as incomes increase, nutrient loading to the lake
23
(and therefore concentration in the lake) inevitably increases, but the plankton
24
concentration increases only slightly (to point B), reflecting the ecosystem's natural
25
capacity to absorb external influences and neutralize them. Then, with only a slight
26
additional increase in loading, the lake ecosystem changes dramatically, with a sudden
27
increase in plankton density--often exhibited as an algal bloom (point C). The algal
28
bloom is an easy-to-see sign that something is going wrong in the lake and that uses are
29
being impaired; consequently, local people call on politicians to implement policies to
30
decrease nutrient loading.
31
32
Reducing the nutrient load requires changes in human behavior--that requires political
33
will--and like most things political, it only lasts until the next election. The difficulty for a
34
decision maker is that the lake cannot simply go from C back to B. There are likely to
35
have been irreversible changes to the ecosystem (in this case, phytoplankton have
36
replaced macrophytes as the dominant species), so the path is usually from C to
37
something like D. That means sacrifice over a long period without much to show for it,
38
i.e. plankton concentrations are still high; blooms are still occurring. That is a tough road
39
for a decision-maker to walk. Chapter 7 talks about the role of information and illustrates
40
how science can be used to find where a lake lies on the graph (between A and D).
41
Science can also offer shorter paths from C back to A through things like biomanipulation
42
and in-lake restoration methods.
43
Draft Final Report: Not for Quotation or Citation
6
1
The complex nature of lake ecosystems also gives rise to various indirect effects such as
2
biomagnification. Biomagnification refers to the increase in concentration
3
("magnification") of certain compounds in organisms ("bio") as one goes up the food
4
chain (i.e., as organisms at lower positions in the food chain are eaten by organisms at
5
higher positions in the chain). Compounds such as PCBs and dioxins are extremely
6
soluble in fat (lipophilic) and therefore remain in the bodies of organisms that consume
7
them. Those organisms may get eaten, indirectly transferring the lipophilic compound to
8
the predator. The Laurentian Great Lakes provide a good example of this phenomenon
9
(See Table 1.1). As shown in the table, the concentration of PCBs increases up the food
10
chain. This implies that organisms higher up the food chain (including humans) are
11
exposed to higher concentrations and therefore are at higher risk.
12
13
Table 1.1. Biomagnification of PCBs in the Laurentian Great Lakes
Organism
PCB concentration
(relative to conc. in phytoplankton)
Humans
?
Herring Gull Eggs
4960
Lake Trout (a large fish)
193
Smelt (a small fish)
47
Zooplankton
5
Phytoplankton
1
14
(Adapted from USEPA and Government of Canada, 1995)
15
16
Note that for a decision maker and any one eating Lake Trout (or Herring Gull Eggs!),
17
this is a real problem. It is ironic that while the lake's complex food chain makes
18
existence of valuable fish like the Lake Trout possible, the same complexity leads to
19
indirect effects like biomagnification that may make the fish dangerous to eat.
20
21
Transmissivity
22
23
Lakes integrate; they are the mixing pots of nature. They receive inputs from their
24
catchments (and beyond), mix the inputs together, transform them and spread them out
25
again. Additionally, fish, water and even pollution are able to move around more or less
26
freely in all directions. This property--transmissivity--is the third key characteristic of
27
lakes.
28
29
One important implication of transmissivity is that a problem at a lake is shared by most
30
users. Rivers provide a simple counter-example: pollution at one point in a river
31
immediately flows downstream, often leading to a disconnection between those causing
32
the pollution and those affected by it. This can result in upstream-downstream conflict.
33
The transmissive nature of lakes means that one user's effect on another is spatially
34
spread out and shared, including by the original user. This is very similar to global
35
warming: the effects of one person's emission of greenhouse gases are felt by all,
36
including the emitter.
37
38
Another implication of transmissivity is that most uses of lakes (see Chapter 2 for a full
39
description) are non-excludable; that is, it is costly to exclude users from accessing a
40
given lake resource. As Box 1.3 describes, when access to resources is costly to control,
41
open access is the default regime. This is not desirable because open access, combined
42
with human nature, invariably leads to overuse and destruction of the resource base. It is
43
important to note that this physical property of lakes--transmissivity--profoundly affects
44
a social issue--how the use of lake resources is managed.
45
46
Overall, these three defining characteristics--long retention time, complex dynamics, and
47
transmissivity--when taken together, make lakes what they are: beautiful, valuable,
48
complex, but also vulnerable and difficult to manage. Lessons learned on how societies
49
govern resource use--how they control access to various lake resources--is the
50
remainder of this report.
51
Draft Final Report: Not for Quotation or Citation
7
1
2
Box 1.3. Some "common" terms and their meaning: common-pool resources, common property and
the commons.
Most readers have likely heard of the "tragedy of the commons", an idea made popular by a 1968 article in
Science by Garrett Hardin. This article captured the spirit of the times and has gone on to trigger a massive
research effort on environmental management. The problem is that the term "commons" used by Hardin was
misleading because it is often assumed to refer to common property; however, Hardin's main point was that
open access to resources usually leads to overexploitation, something shown clearly in the lake briefs. To
avoid confusion, we define below some terms used in this report.
Common-pool resources are resources for which one person's use takes away from another's use and for
which it is hard to exclude other users. The table below compares common-pool resources against other types
of resource by examining two characteristics: rivalry and excludability. Rivalry (also sometimes called
subtractability) means that one person's use of a resource subtracts from the amount available to other users
(e.g. someone catching fish reduces the amount someone else can catch--at least over the short-term). For
non-rival goods, one person's use does not affect another's (e.g. everyone can enjoy the climate-moderating or
aesthetic benefits derived from a lake). Excludability refers to the cost of controlling someone's access to a
resource. Non-excludable goods have a positive cost for restricting access.
Excludable
Non-excludable
Rival
Private good Common pool resource
Non-rival Club good
Public good
Many of the resources provided by lakes are common-pool; good examples are fishing, water extraction, and
the use of the lake as a sink for pollutants. Some uses like flood control are public goods. For almost all uses, it
is costly (but socially desirable) to exclude users.
Access to a given resource of a lake can either be open (open access) or closed (private, common, or
government property). Common property is a type of institution that gives the rights of use of a resource to a
defined group. That group usually has rules specifying how the group's members can use the resource. Lake
Naivasha is an excellent case of a riparian group (Lake Naivasha Riparian Association) using the lake as
common property. Private property and government (public) property are also widespread ways that societies
have developed to control access to "open access" resources.
The stand-alone term "commons" is often used as short hand for either common-pool resources or for
common property, often leading to confusion about what is being discussed (i.e. the nature of the resource or
the type of property regime governing its use?). Some may think of the "commons" as a shared, public
resource often with no control over access.
Overall, it is important to clearly distinguish between the characteristics of a resource and the characteristics of
the management regime governing use of the resource. Also, one must note that a lake may provide various
resources, each with different characteristics, but many sharing a common-pool or public good nature.
Therefore, it is misleading to speak of a lake, as a whole, as a common-pool resource: it is clearer to specify
which use of the lake is being referred to.
3
4
Draft Final Report: Not for Quotation or Citation
8
1
Chapter 2. Human Use of Lakes
2
3
A Lake; its Development and Management
4
5
The Story of a Lake
6
7
People settled around the lake shore many millennia ago. While the population was low,
8
the resources that it offered were abundant and there was little conflict between different
9
settlements over use of these resources. The fish caught by one community did not
10
seriously impair the ability of another community to obtain fish; the water drawn for
11
domestic use did not noticeably lower the lake level. But, as the lake's population
12
increased, some of these resources came under pressure. This happened first with the
13
fish. Following some years of low rainfall, fish catches began to decline and those fish
14
that were caught were smaller than before. The more experienced fishermen realized
15
that this was because the wetlands were not being flooded and the fish could not breed
16
successfully. Conflicts started to break out between different communities about access
17
to the best fishing grounds. Fortunately, the rains returned before these conflicts became
18
unmanageable, the breeding grounds became available and the fish populations
19
recovered.
20
21
Nevertheless, the incident caused the leaders of the fishing communities to agree on
22
some rules of access to fishing grounds that would reduce tensions. Each community had
23
the right to send only a specific number of boats to these areas. Also the wetlands were
24
agreed to be off limit during the period when they were flooded and the fish were
25
spawning. Any transgressors would be judged by an assembly of the leaders of the
26
lakeshore communities with those found guilty being banned from fishing and even
27
expelled from their community.
28
29
A more difficult problem arose many years later with the influx of a group of farming
30
families into the catchment feeding into the lake. As they prospered and grew, these
31
families cleared increasing areas of land. The land began to erode during the wet season
32
and the wetlands at the entrance to the lake began to silt up. Again fish breeding was
33
interrupted and fish numbers began to decline. However, the farmers did not accept the
34
claims of the fishing communities that they were causing the siltation of the wetlands.
35
They believed that the rivers were always silty during the wet season and that the
36
decline in fish catch was nothing to do with them. Although this caused bad blood
37
between the farmers and fisherfolk, it did not lead to violence because other fish
38
breeding grounds were still operating and the fisherfolk were able to compensate by
39
moving further offshore, and building fish traps and fish ponds. Nevertheless, a distance
40
developed between the two groups that was never bridged and to a large extent they led
41
separate lives.
42
43
Over time, the lakeshore communities expanded into towns. The town people, while not
44
relying directly on fishing for their incomes, continued to identify with the lake. They
45
were proud of its scenery, enjoyed its waters for recreation and used it for easy transport
46
of their goods to other destinations. They also used it to dispose of their wastes. Rubbish
47
was dumped in creeks to be eventually flushed into the lake. To keep up with the
48
amenity offered by other towns throughout the country, the local council installed
49
sewage removal and primary treatment of the effluent to remove the worst of the
50
organic matter. The resulting effluent was then disposed of in the lake at a convenient
51
distance from the town.
52
53
A major expansion of the region occurred many years later when the national
54
government decided to develop a large irrigated cotton growing area upstream of the
55
lake to take advantage of increasing European demand for cotton. The development was
56
widely welcomed by the region's business interests (they had lobbied strongly for it), and
57
the town councils were briefed on the plan and endorsed it. Of course, the land had to be
Draft Final Report: Not for Quotation or Citation
9
1
expropriated from the farmers who had settled there many generations earlier but, in
2
compliance with national laws, the government intended to provide them with alternative
3
agricultural land some days travel away. Many of the town people and the fisherfolk were
4
uneasy about this development but had no means of finding out much about it, let alone
5
influencing it. They felt little solidarity with the farming communities and actually felt
6
quite relieved when the irrigation area went ahead. New, wealthier farmers appeared and
7
the old groups were moved away.
8
9
At first the new irrigation area appeared to cause no problem. The region prospered with
10
the additional income and the towns grew rapidly to provide necessary services. A
11
government agriculture office was opened in the major town and many new people
12
arrived to take advantage of the employment opportunities in the irrigation area.
13
14
However, after some decades problems started to appear in the lake. Dense mats of
15
weeds began to grow around the mouths of the town creeks and spread into the boat
16
harbours. Waterweeds even began to appear near the fish pens. Since the region had
17
long ceased to be dependent on the fishing industry, this was seen more as a nuisance
18
than a major problem by many people. In fact, some entrepreneurial women harvested
19
the weeds to use for weaving. More alarmingly to most people, the water near the towns
20
quite quickly and unexpectedly turned dirty and had a musty smell. Many of the
21
townspeople, particularly the older residents who remembered the beauty of the lake
22
when they were younger, were seriously upset and complained to the town council. The
23
fishermen were also worried, but for a different reason. They had trouble launching their
24
boats through the weeds and they had trouble selling their fish because of the
25
widespread perception that the fish were dirty and tasted bad.
26
27
There was a strong local opinion that the problem was caused by the upstream irrigators
28
although the government officials in the Agricultural office claimed that it was nothing to
29
do with their industry and that the problem resulted from the expansion of the towns.
30
Under pressure, the government promised to upgrade the sewage treatment plant for the
31
town to remove nutrients from the sewage since this could be completed within three
32
years. They also promised to launch a scientific investigation into the causes of the
33
problem.
34
35
Commentary
36
37
This story, while only a microcosm of all that can occur in lakes, illustrates many
38
important features of lakes and their management. It shows that:
39
�
At the broadest level, lakes provide a variety of uses or values to people and
40
these values change over time, from initial subsistence values through to later
41
aesthetic and cultural values;
42
�
There are potential limitations on the use of these resources as the demand for
43
them increases--this can appear as simple over-exploitation of fish, or as a more
44
subtle overuse of the lake's capacity to absorb wastes;
45
�
Competition for these resources intensifies and authorities--sometimes local
46
leadership groups, sometimes more distant governments--intervene to resolve
47
conflicts;
48
�
Rules of behavior are discussed and agreed, and structures (councils,
49
government departments) are established to administer and apply these rules;
50
�
Uncertainty is central to management; unpredictable natural variations in rainfall
51
can cause problems; some conflicts are not neatly resolved; there are different
52
views about the causes of eutrophication; etc;
53
�
Knowledge, both local experience (e.g. the importance of fish breeding areas)
54
and scientific knowledge can play a central role in making management more
55
effective;
Draft Final Report: Not for Quotation or Citation
10
1
�
Lakes are not worlds unto themselves. The difficulty of managing lakes without
2
involving groups from the upstream catchments, for some problems, is
3
illustrated by the siltation problem;
4
�
Also the importance of influences from outside the region is illustrated by the
5
effect that international markets had on development of the irrigation area;
6
�
The choices that a decision maker faces are heavily constrained by other
7
developments--the town's sewage treatment system was originally introduced
8
for aesthetic and sanitary reasons, and subsequent actions to reduce nutrient
9
loading to the lake had to take account of the existence of this point nutrient
10
source; and,
11
�
Finally, the need for a coordinated, planned approach to take account of these
12
linked influences so that the overall benefits are maximized is hinted at.
13
14
This story is also shown in diagram form in Figure 2.1. The upper part of the figure
15
shows the change in values supplied by the lake and its catchment over time. During the
16
expansion phase there is a steady increase in values as an increasing number of
17
resources are used--fish, water supply, transport, aesthetic enjoyment, recreation, etc.
18
19
Two development interventions, the introduction of improved fishing techniques (D1) and
20
the introduction of irrigated agriculture (D2), lead to significant increases in the values
21
extracted from the lake basin. At the same time (lower part of the figure) there is a
22
gradual deterioration in the state of the lake from the side effects of these and other
23
developments. At some point (V1) this deterioration in the lake's environment--
24
increasing nutrient levels, spread of weeds and algae, unsightly and smelly water--begins
25
to affect the value of the resources that can be extracted from the lake and overall
26
production plateaus and then begins to decline (V2). Remedial actions (C1) such as
27
upgrading of sewage treatment plant and the ban on use of phosphate-based detergents
28
lead to improvements in water quality and the values extracted from the lake increase
29
again. While there are cases in which the degradation of lake environment is small and
30
the response to the restoration efforts is rapid, most often, the degradation may turn out
31
to be more extensive than expected and the restoration efforts may prove to be
32
extremely costly and time-consuming (R1), if not impossible (R2). The management
33
authorities and the communities often do not have the resources to invest in
34
conservation/remediation interventions (either structural or non-structural) to the point
35
where the lake returns to pristine conditions. Nevertheless, at the end of the story, the
36
communities may be better off than they were at the beginning.
37
38
While the above story illustrates many important features of lakes and their management,
39
each lake possesses unique features, as is shown in the 28 lakes briefs. Each lake has its
40
own set of resources values, its own set of problems and its own set of potential
41
management actions. In the above story, the government accepted that the town sewage
42
was the most likely cause of the algae and aquatic weeds and agreed to invest in
43
remedial upgrade works because of the high value the townspeople placed on a clean and
44
enjoyable lake. In other towns, it is possible that the townspeople would not have the
45
same pride in their lake and would rather see the funds spent on further development
46
investments. Such judgments depend on the values that people place on the resources of
47
each lake, the physical characteristics of each lake that lead to biophysical manifestations
48
of problems, and the socio-political characteristics of the decision processes for each lake.
49
50
Draft Final Report: Not for Quotation or Citation
11
1
V1: Gradual
deterioration
D2:
of resource
More
Development
value
intervention 2
V2: Sharp
decline in
resource
D1:
value
Development
intervention 1
Resource
value
C1
D2
D1
C1:
Conservation/
remediation
intervention
Less
Time
Better
E1: Gradual
R2: Full
deterioration of
restoration is
D1
environment
rarely possible
State of
lake
environme
D2
E2: Prolonged
state of
degradation
C
R1: Recovery
1
is slow
Worse
Time
2
Figure 2.1. Changing resource value through development and conservation/remediation
3
interventions.
4
5
Draft Final Report: Not for Quotation or Citation
12
1
Resource Value of Lakes and Lake Basins
2
3
The wide range of uses of lakes and their catchments are amply shown in the 28 lakes
4
briefs. These various uses all contribute to the total value of the lake. Among the uses
5
cited are the following:
6
7
� "...direct use of the lake for fisheries in net present value terms ... is then some
8
PhP30.5 million" (Laguna de Bay).
9
� "...a potential source of water supply for Northeastern Estonia and the Estonian
10
capital Tallinn" (Lake Peipsi).
11
� "...provides water supply for domestic (in the dry years), and industrial and
12
agricultural uses" (Lake Dianchi).
13
� "...biodiversity offers a resource base for tourism attraction" (Lake Baringo).
14
15
Many lakes also provide valuable services to nature, such as serving as habitats for
16
aquatic fauna and flora. These services are also part of the total value of lakes and their
17
basins. One such service is the provision of genetic materials, e.g., for improving fish
18
strains used in aquaculture. Another such service is as regulator of extreme hydrologic
19
events such as floods and droughts.
20
21
The value of lake water and the resources in the lake-basin ecosystem can be divided
22
into "use" and "non-use" values, the terms that are typically used by economists to
23
divide the totality of the goods and services from any resource.
24
25
Use values are divided into direct use and indirect use values. Direct use values are those
26
that come directly from using various parts of the lake ecosystem. These include
27
both "consumptive" uses and "non-consumptive" uses. Consumptive uses are those that
28
occur when the user actually consumes the resource (e.g. catching fish or waterfowl,
29
harvesting of reeds and other plants, diversion of water for human use or irrigation). This
30
categorization of types of values from lakes is shown in Figure 2.2.
31
Total Economic Value
Use Values
Non-use Values
Direct Values
Indirect
Option
Bequest
Consumptive
Values
Values
Values
and non-
Ecosystem
Premium
Benefits for
consumptive
functions and
placed on
future
use of
services
possible future
generations
resources
uses
Existence Values
"Knowing that it is
there..."
32
33
Figure 2.2. Categories of Uses of Lake Resources
34
35
Lake fishermen in the story were engaging in a consumptive, direct-use of the lake's
36
resources. A key point about consumptive uses is that use by one person reduces the
37
amount available for others to use, called `rivalry' by economists (see Box 1.3 for further
Draft Final Report: Not for Quotation or Citation
13
1
discussion). In contrast, non-consumptive direct uses do not reduce the amount of the
2
resource available to others. Non-consumptive uses include certain types of recreation,
3
aesthetic and amenity values, or general ecosystem services. The later residents of the
4
town who enjoyed the aesthetics of the lake were engaged in non-consumptive, direct
5
use of the lake resource. Boating and sailing are also non-consumptive, direct uses. In
6
these cases the "users" does not actually consume the resource, or reduce the
7
availability of the resource for other users.
8
9
Of course, in the extreme, you can have so many people using the lake in a non-
10
consumptive, direct use manner that congestion sets in and crowding can reduce the
11
"benefit" that each user receives. Congestion can be observed within a particular use
12
sector or among sectors. An example of the former would be when lake-based recreation
13
became so crowded that all the recreators experienced decreased enjoyment. An
14
example of the latter would be when expansion of the water intake structures to service
15
the town's water supply started to interfere with the fish cages. In general direct uses of
16
the resources in the lakes and their basin are both easier to identify and easier to
17
measure, both qualitatively and quantitatively, than other parts of lake values.
18
19
Indirect use values are also often important and include most services provided by
20
healthy ecosystems (e.g. maintaining water quantity or quality; moderating flooding;
21
providing a sink for effluents). Indirect use merely means that the beneficiary is located
22
somewhere else (usually downstream) and receives a benefit from the lake ecosystem.
23
For example, downstream populations will benefit from these ecosystem services
24
provided by the lake, and will enjoy them as direct use values (again, they may be either
25
consumptive or non-consumptive). In Japan, for example, one important benefit from
26
Lake Biwa being maintained as a sound ecosystem with good water quality is the indirect
27
use value accruing to the people living downstream of the lake in Osaka and Kyoto.
28
Similarly, in Lake Toba, an indirect beneficiary of the lake water includes various
29
industrial facilities including an aluminum smelting plant that are dependent on cheap
30
hydropower produced by the Asahan River hydroelectric plant. Indirect use values are
31
often harder to measure and value than the more easily observed direct use values.
32
33
Obviously the line between direct and indirect use values gets blurred in many cases--
34
lakeshore communities that extract lake water as a source of drinking or municipal water
35
should probably be labeled as "direct" users of the lake and its resources, even if the
36
consumers receive their water in a pipe and do not know where it comes from!
37
38
There are also important non-use values associated with lake ecosystems. Non-use
39
values are as the label suggests--values that people receive but without any use--direct
40
or indirect--of the lake or its resources. These non-use values include the benefit people
41
receive from knowing that the lakes are there and are healthy (e.g. the benefits that
42
Armenians derive from knowing that Lake Sevan in Armenia continues to exist), and the
43
value associated with leaving an intact and healthy resource for future generations.
44
These two types of non-use value are referred to as "existence values" and "bequest
45
values".
46
47
An additional category of value is referred to as Option Value--the benefit that people
48
receive from knowing that the resource will be there in case they want to use it in the
49
future. This is a hybrid between Use and Non-use Values and is usually listed under Use
50
Values as a form of "deferred use". Use values are often reflected to a greater or lesser
51
extent in prices--payment for water supply, in fish prices, etc. However, the two types of
52
non-use values (bequest values and existence values) as well as option value are rarely
53
reflected in market prices simply because, by their very natures, they are not traded in
54
markets. The consequence is that they are commonly overlooked by decision makers.
55
However, they may be very important to the people concerned and are therefore valid
56
components of the total value of the lake (see Appendix A for more details on the formal
57
economic analysis of lake resources and the concept of Total Economic Value).
Draft Final Report: Not for Quotation or Citation
14
1
2
It is also important to note that, in general, lake values are often over-looked by decision
3
makers for two major reasons: lack of information and institutional weaknesses. Because
4
of the pervasive nature of externalities (see Box 2.1 for definition), many benefits from
5
improved lake management affect someone else, often at some distance. Actions in the
6
upper basin affect both the quantity and quality of water that drains into the lake, and
7
actions along the lakeshore and in the lake affect the water that leaves the lake, and the
8
ecology of the lake. For smaller lakes it may be easier to actually see the links (as in
9
Lake Dianchi or Toba for example) while for very large or international lakes it is harder
10
to understand all of the actions that affect the lake resource (and are in turn affected by
11
the lake's water quality).
12
13
The second constraint to recognizing lake benefits is an institutional one--government
14
ministries and agencies are held responsible for and are rewarded for the actions that
15
they take that affect their differing resources. The Fisheries Department is accountable to
16
the fishermen and fish catch, even if fishing activities ultimately affect the welfare of
17
downstream water consumers and agriculture users also. Since these groups fall
18
"outside" the area of responsibility of the Fisheries Department, benefits and costs that
19
occur elsewhere are largely ignored. A similar case exists with agricultural authorities in
20
the upper watershed. Lake basin management authorities are designed to overcome
21
these two problems but, even if they have a broader knowledge of the resource, they
22
usually lack any effective management authority at the sectoral level. Therefore the
23
institutional management challenges remain (and are discussed in Chapter 3).
24
25
Typical Problems Facing the World's Lakes
26
27
Problems can be defined as the impediments to obtaining desired values from lake
28
resources. Ironically, problems often arise from the side effects of the use of lake
29
resources. The proximate causes of these problems can arise from both the direct
30
exploitation of lake resources as well as from human activities taking place within and
31
outside of the lake basins that have little to do with the direct use of the lake resources.
32
Thus, the farmers who settled in the catchment above the lake caused problems for the
33
fishermen, even though they (the farmers) were not using lake resources directly. This
34
type of problem would be classified as an externality since the farmers received the
35
benefits from soil cultivation and the downstream fishermen bore the costs. Externalities
36
are particularly important for lakes and rare expanded on later in this chapter and in
37
Appendix A. Downstream users too can cause problems for users of lake resources. For
38
example, downstream irrigation schemes can place demands on water from the lake that
39
restrict developments around the lake.
40
41
The root causes, as discussed in the World Lake Vision, generally include:
42
43
� Increased demands for developing and using lake resource due in part to
44
population growth and economic development
45
� Limited public awareness and understanding of human impacts on lakes
46
� Insufficient governance and accountability systems
47
� Inadequate mechanisms for managing international lake systems.
48
49
The lake briefs show that lakes around the world experience diverse problems. From a
50
biophysical perspective, these can be categorized as water quantity, water quality and
51
ecological problems. Water quantity problems arise when there is either too much or not
52
enough water to meet human uses. Flooding because of increased runoff of cleared
53
catchments and lake drawdown because of excessive water withdrawals are clear
54
examples. There are numerous water quality problems ranging from sedimentation, to
55
the presence of toxic substances, to excess quantities of nutrients. Ecological problems
56
arise because lakes, amongst their other functions, provide habitats that support various
57
biological organisms and communities which are the basis of many of the ecological
Draft Final Report: Not for Quotation or Citation
15
1
services that people require from lakes. Note that under the above definition a change in
2
water quantity, quality or ecology is, by itself, not a problem unless it represents a loss of
3
value to someone.
4
5
Problems with lakes have been documented in a number of earlier reports including the
6
"Survey of the State of the World's Lakes," compiled in the late 1980s and early 1990s by
7
ILEC and UNEP. Based on this work, Kira (1997) concluded that lakes face a number of
8
widespread and continuing problems including eutrophication, acidification, toxic
9
contamination, water level changes, salinization, siltation, and the introduction of exotic
10
species. These and other problems continue to be identified in the lake briefs
11
commissioned for this report (Table 2.1). The table identifies the primary causes and
12
their effects on lake uses and values, and identifies lakes in this project exhibiting these
13
problems. More detailed information can be found in the National Research Council
14
(1992), UNEP (1994), Dinar et al. (1995), Ayres et al. (1996), Nakamura (1997), Duker
15
(2001), Jorgensen et al. (2003) and the Experience and Lessons Learned Briefs in the
16
attached CD-ROM.
17
18
Table 2.1. Some typical problems facing the world's lakes
Problem
Cause
Impacts on Lake
Example from
Values
this Study
Biodiversity
Many kinds of human
Loss of ecosystem
Lake Victoria
loss
impacts, including most
function; loss of option
on this list
value for future use
Climate
Natural and
Changes in hydrological Lake Chad
variability
anthropogenic causes
balances of lakes
Eutrophication
Excessive nutrient input
Algal blooms, excessive Lake Dianchi
macrophyte growths, loss
of water transparency,
taste and odor
compounds, algal toxins
Exotic species
Natural, intentional, or
Food web changes, loss
Laurentian Great
unintentional introduction of biodiversity
Lakes (zebra
mussel)
Overfishing
Unsustainable
Decreased fish catches,
Lake Malawi
exploitation of fish for
loss of biodiversity
sustenance and
commercial purposes
Pathogens
Fecal contamination from Waterborne diseases
Lake Ohrid
domestic and livestock
sources
Salinization
Diversion of inflow,
Ecosystem degradation, Aral Sea
discharge of saline waters loss of freshwater supply
from irrigated lands,
runoff of salts from
deforested land
Siltation
Soil erosion from
Decrease in lake volume Lake Baringo
cultivation and
and flood control
deforestation
capacity, destruction of
aquatic habitats
Structural
Lakeshore development
Destruction of littoral
Lake Biwa
impacts
(e.g., embankments,
communities in lake
weirs, roads)
Toxic
Industrial effluents
Toxicity to fish and
Laurentian Great
contamination
agricultural and urban
disruption of endocrine
Lakes (DDT and
runoff, atmospheric
system, bioaccumulation PCB
deposition
in fish increases risk to
contamination)
humans and other
predators
Water level
Diversion of inflow, over-
Secondary salinization,
Lake Naivasha
decline
withdrawal of water
ecosystem degradation
19
20
These problems are not unique to lakes--they occur in most waterbodies. However, the
21
special characteristics of lakes, described in the previous chapter, influence the way in
22
which the problems are manifest in lakes.
23
Draft Final Report: Not for Quotation or Citation
16
1
The relatively long retention time of lakes means that many problems can take a long
2
time to become apparent. This is particularly true where the problem arises because of
3
long term change to some component of the lake that is not visible. For example, toxic
4
contaminants can build up in the sediments over many years before they cause a
5
problem by entering the foodchain. Similarly, alterations to the lower levels of the lake's
6
foodchain because sediments in the water cause changes in light regime may not be
7
immediately apparent to the users of the lake. By the same token, these problems can
8
take a long time to correct in lakes, a point taken up in the next section on management
9
responses.
10
11
The complexity of lake dynamics also influences the way in which problems become
12
apparent. This is readily seen in the case of eutrophication where a steady buildup of
13
nutrients can apparently cause little problem in lakes until a critical point is reached. At
14
that critical point the lake can abruptly switch into a different state with reduced use and
15
non-use values. In the case of Lake Victoria, nutrients had been building up in the lake
16
water and sediments for decades without apparent effects until the early 1990s when,
17
quite suddenly, the basis of the lake's ecosystem shifted. Cyanobacteria dominated the
18
base of the foodchain, much of the lake became turbid and blooms of potentially toxic
19
cyanobacteria became common in the near shore areas of the lake. It is known, from
20
experience in other lakes, that it is very difficult (if not impossible) to shift such a lake
21
back to its previous state (see Figure 1.1).
22
23
The transmissivity of lakes simply means that problems can seldom be localized with
24
lakes. The fluidity and mixing of the water ensures that physical, chemical and ecological
25
problems become apparent, to some degree, throughout the whole lake and downstream
26
waters. Floods affect all of the lake's shoreline; pollution spreads beyond its source to
27
affect much of the lake; and biological problems, such as introduced species, can spread
28
throughout the lake. However, there are often limits on the extent to which problems can
29
spread throughout the lake. Deep lakes are often stratified and the bottom waters do not
30
readily mix with the top waters, and large lakes are not completely uniform across their
31
surfaces.
32
Box 2.1. Transmissivity and Externalities
The transmissivity characteristic of lakes means that externalities are a particularly important source of
problems in lake management. Externalities occur when the action of one individual (or group) affects the
welfare of another individual (or group) and the latter group is not effectively consulted (or compensated)
during decision-making. In the case of lakes, the flow of water from the catchment to the lake readily
transmits problems from upstream to downstream (as in the example of the farmers and the fishermen); the
transmissivity of the lake means that many people around the lake can be affected by the actions of a few.
Externalities are commonplace in the lake briefs. Upstream forest clearance results in increased sedimentation
in Lake Baringo. The introduction of water hyacinth in Lake Victoria hinders lake transportation and fishing.
Tonle Sap water levels are affected by changes in the Mekong River annual flows, and some of these changes
have their origin in China or Laos. These externalities are all transmitted by the fluidity of water: many are
local, but some are international.
Externalities as usually thought of as negative and so cause problems. However, they can also be positive. For
example, reforestation in the upper watershed around Lake Sevan has improved water quantity and quality in
the lake over time. In all cases where externalities exist, however, there is a "break" between the person
taking the action and the people where the impact is felt. And since there is no link, normal market signals
(that is, prices) do not reflect these links and their impact.
Problems caused by externalities can be overcome by "internalizing the externalities"--that is, by including
benefits and costs, wherever they occur (this speaks to correctly defining the boundary of the analysis) and
whomever they affect (a social-welfare perspective). This is easier said than done. With sufficient foresight and
recognition of the issues, however, it is possible to do such an analysis and thereby make better decisions
about management alternatives. In addition, even if some of these impacts cannot be formally valued in
economic terms, just recognizing them and including them qualitatively in the analysis is an important first
step.
33
Draft Final Report: Not for Quotation or Citation
17
1
Response to the Problems: Management Interventions
2
3
The story at the beginning of this chapter illustrates that there are two types of
4
management interventions in lake management, one for development of lake resource
5
values and the other for conservation/remediation of the same. As shown in Figure
6
2.1, the cumulative impacts (i.e., the problems arisen) of development interventions
7
often necessitate introduction of conservation/remediation interventions. Intervention
8
measures in either case can be structural (e.g., construction of water intake structure as
9
versus sewerage system), or non-structural (introduction of new fishing technology vs.
10
new regulatory provision for the control of effluent discharge). For the purpose of this
11
report, we confine ourselves to management interventions for conservation/remediation
12
(C/R interventions) of resource values.
13
14
Therefore, the story of this report--how conservation/remediation interventions are
15
carried out--is the story of how lake uses are governed by society. "Governing" is defined
16
(Oxford English Dictionary) as "control(ing), influence(ing), regulat(ing), or
17
determin(ing)...the course or issue of events." The sort of governing acts common in the
18
28 lake briefs include:
19
20
� forming organizations that provide continuity of lake management, including
21
development of plans, representation of the goals of different groups,
22
implementation and management of structural investments, and enforcement of
23
decisions (Chapter 3)
24
� developing rules, including police powers as well as financial incentives, about
25
sharing the lake basin's resources and limiting externalities for other users
26
(Chapter 4)
27
� changing peoples values so that the net benefits gained from the use of a lake
28
basin's resources are maximized (Chapter 5)
29
� engaging people in management through devolution of responsibilities (Chapter 5)
30
� introducing technological measures to reduce or ameliorate adverse impacts
31
(Chapter 6).
32
33
Just as the characteristics of lakes have an effect on the way in which problems occur,
34
they also have an influence on how to manage those problems. The long retention
35
time of lakes--particularly for larger and deeper lakes--necessitates that their
36
management be anticipatory, committed, and well-planned over the long term. A good
37
understanding of the physical, chemical and biologic al processes occurring; long-term
38
goals supported from the highest political level to the local communities; and well worked
39
out, long-term plans will be needed if lake management is to be successful. The
40
instruments of management--institutions, people, laws, rules and regulations, finances
41
for operations, investments in infrastructure, knowledge for efficient interventions--all
42
need to be established and supported for the long term but, at the same time, be flexible
43
enough to adapt to changing values and new knowledge. In fact, the long timescales
44
involved in lake management argue for the existence of institutions in order to give
45
permanence to management beyond the shorter timescales of individuals. One other
46
implication is the need for secure financing to make sure that structural and non-
47
structural interventions are effective over the long term.
48
49
The complex dynamics of lakes also argues for drawing on the best available scientific
50
knowledge and, if necessary, mounting research programs to obtain chunks of knowledge
51
that are critical to management. However, there needs to be a proper conceptual model
52
of these dynamics worked out in advance in order to make sure that the research is truly
53
focused on the critical chunks for management.
54
55
Finally, the transmissivity of lakes and the consequent difficulty of excluding users from
56
accessing many of the lake's resources has many management implications. Common
57
pool resources (see Box 1.3), such as the fish in the lake, can be over-exploited since
Draft Final Report: Not for Quotation or Citation
18
1
there is no incentive for individual users to limit their use of these resources. Rules are
2
usually introduced, once the resource shows signs of over-harvesting, to ensure that
3
these common pool resources are shared equitably. Rules may also need to be
4
introduced to protect, public goods, the other category of non-excludable lake uses. The
5
visual amenity of the lake and flood protection from levy banks are examples of such
6
public goods. Unlike common pool resources, these rules are not needed to allocate the
7
goods amongst comp eting users (by definition the use by one person does not affect
8
another person's use). Instead the rules may be needed to protect the quality of the
9
good. For example, prohibitions may need to be introduced on dumping rubbish to
10
protect the visual amenity of the lake or rules may needed to ensure that all beneficiaries
11
from flood protection contribute towards the costs.
12
13
The transmissivity of water also means that, for many problems, the lowest effective
14
level of management (the principle of subsidiarity) is the lake and its catchment.
15
Managing the water resource at this level can help internalize the externalities that arise
16
from the transmissivity. Of course, having a management structure that is responsible for
17
the whole of a lake basin is no guarantee that these externalities will be managed � that
18
will depend on the sense of community, financial transfers, etc. This does not necessarily
19
imply that a monolithic lake basin management authority is the best institution for
20
management. Rather it argues for management coordination across the area of the basin
21
and, often, coordination across the different sectors that use the basin's resources.
22
Sometimes this can be most efficiently carried out by a single basin management
23
authority; sometimes not.
24
25
The Components of Lake Basin Management
26
27
From the preceding discussion, it is apparent that there are a number of aspects to
28
managing a lake's resources to ensure that they are accessed equitably and efficiently,
29
given the inherent characteristics of lakes and their basins. These aspects, or
30
components, can be categorized as:
31
32
� Institutions
33
� Incentives and Regulations
34
� People (Values and Participation)
35
� Technology
36
� Information
37
� Finance
38
39
Institutions carry forward the mandate for managing the lake and its catchment for the
40
benefit of all lake resource users. They are sanctioned by society to give them the
41
necessary authority and longevity to operate effectively. They can operate at local level
42
(such as local councils), at regional level (such as a lake basin authority), at national
43
level (such as sectoral government departments) or at international level (such as
44
international commissions for transboundary lakes).
45
46
Rules governing peoples' use of lake resources and impacts on lakes can be encoded in
47
formal laws, statutes and regulations and implemented by formal institutions. They can
48
also be informal, often being developed and accepted amongst traditional groups of lake
49
people. Rules are used to both ensure equitable allocation of lake resources and to
50
ensure that these resources are not wasted.
51
52
The involvement of people is central to lake management. They decide the values to
53
be obtained from the lake's resources; they provide knowledge and experience; they
54
form informal organizations for management; they provide support for enforcing rules;
55
and they can be a source of the finance needed to operationalize management.
56
Institutions don't operate in a vacuum; they require leadership from committed and
57
visionary individuals as is seen in some of the case studies.
Draft Final Report: Not for Quotation or Citation
19
1
2
Technology is not always essential for management; non-technological solutions can
3
sometimes be sufficient. However, technical responses can dramatically increase access
4
to a lake's resources and contribute to the resolution of some types of problems. For
5
example, embankments can significantly add to a lake's ability to buffer floods (an
6
indirect use value) while sewage treatment plants can be very effective at removing
7
wastes and contaminants from concentrated sources of pollution.
8
9
Information, both traditional knowledge and scientifically acquired knowledge,
10
promotes efficient management. That is, the more that reliable and demonstrable
11
knowledge is used in management, the more likely it is that the goals of those groups
12
using a lake's resources will be met at minimal cost. This report places considerable
13
emphasis on scientific knowledge, primarily because it is obtained via a process that is
14
open to scrutiny and leads to incremental improvements in understanding. This emphasis
15
does not deny the value of traditional knowledge--in the introductory lake story, the
16
experienced fishermen were well aware of the role that the intermittently flooded
17
wetlands in played in fish breeding.
18
19
Finance is the Achilles heel of lake management in many developing countries. Policies
20
can be well thought-out; institutions can be properly designed and established; rules can
21
be embedded in laws; people can be involved; etc. But if there is no provision for long
22
term funding of both structural and non-structural interventions then management is a
23
hollow concept. This is the component which, in practice, is most difficult to establish
24
successfully.
25
26
Putting these six components in some sort a management framework (a plan) may be
27
easy on paper but is likely to be quite difficult in reality. For one thing, the critical
28
deficiency in any one of the components could falter implementation of the plan.
29
Additionally, there is a set of basic quality of the system of governance that will have to
30
be satisfied for any such plan to be adequately pursuable. For example, (i) there must be
31
a sound political system where those in authority are selected, monitored and replaced,
32
(ii) the government must have the capacity to effectively manage its resources and
33
implement sound policies, and (iii) the citizens and the state respect the institutions that
34
govern economic and social interactions among them, etc. These are collectively qualified
35
as "good governance" requirements and it encompasses more than just the procedural
36
aspects of planning and management. The "good governance" also includes concepts of
37
legitimacy, fairness, wisdom, acceptability, and accountability.
38
39
"Good governance", on the other hand, will not be achievable unless the elements of lake
40
basin management are carried out fairly and efficiently. Fairly means that all groups and
41
individuals receive equitable access to the lake's resources; have some level of certainty
42
in planning for their future use of those resources; have a say in the decisions that affect
43
them; and are compensated when they lose resources that they have a right to (see Box
44
2.2). It also requires that governments and institutions act in the interests of all citizens
45
and not on behalf of powerful groups; consequently transparency of decision-making and
46
access to legal redress are important components of good governance. Efficiency means
47
that the components of management are implemented with minimal waste of resources.
48
However, the long retention time of lakes requires that efficiency needs to be assessed in
49
the long term; i.e. interventions that appear to be efficient in the short-term may not be
50
efficient in the longer term.
51
52
These six components of lake management are discussed in detail in Section II of this
53
report as part of good governance. These discussions draw lessons from the case studies
54
and other experience about the application of these components in practice.
55
Draft Final Report: Not for Quotation or Citation
20
1
Box 2.2. Equity
Equity considerations, that is, who benefits and who loses (and how much) from any action, are important in
managing a lake ecosystem. The distribution of costs and benefits is important for ethical reasons, as well as
being an important factor in designing effective policies and management plans; i.e. there are two dimensions
to equity--distributional concerns (the people dimension) and effective policy design. Formal government
institutions are more likely to address the concerns of those people who are both "mainstream" and more
powerful economically. Consequently, decision makers need to be particularly aware of the needs and role of
poorer and more politically �marginal groups. These same groups may also belong to minority populations.
Fishermen, who are often politically weak and marginalized, illustrate the second dimension. A sustainable
fishing industry can promote an ecologically sustainable lake, for the benefit of other groups.
The ideas of "internalizing externalities" and "maximizing social welfare" carry the implicit assumption that
economic transfers are actually made and that those who are disadvantaged by some action are compensated.
Obviously this is not always the case. Therefore even when the "socially preferred" management option is
identified and implemented, it is important to make sure that the required transfers and compensation actually
take place. Equity concerns are among the most difficult issues any natural resource decision maker has to
address, and lakes are no exception!
Equity is not the same as equality. Equality implies that ALL stakeholders are equal with respect to income or
resources. This is almost never the case anywhere in the world. Equity, on the other hand, is a measure of
"fairness" and implicitly implies that those who are poorer/worse off are not disproportionately affected by any
change. The Lake Kariba brief describes the way in which the Tonga people were displaced and made worse off
by the construction of a large reservoir, while the benefits were reaped by powerful sections of a colonial
society. In fact, an equity objective for lake management may mean that management actions
disproportionately benefit the poorest members of society (even if there is a "cost" in terms of conventional
economic measures of benefits and costs).
2
3
Draft Final Report: Not for Quotation or Citation
21
1
2
3
4
5
6
7
8
9
10
11
12
13
14
15
16
17
18
19
20
21
22
23
24
Section II. Meeting the Governance Challenge
25
26
This section, presenting the lessons learned from the 28 lakes regarding institutions
27
(Chapter 3), incentives and regulations (Chapter 4), people (Chapter 5), technology
28
(Chapter 6), information (Chapter 7), and financing (Chapter 8) is the core of the report.
29
While each chapter in Section II can be read as a stand-alone description of one
30
component of lake management, the case studies show that sustainable lake
31
management requires a grasp of all the themes, taken together as a whole.
32
33
Draft Final Report: Not for Quotation or Citation
23
1
Chapter 3. Effective Institutions: Responding to Change
2
Key Lessons Learned about Institutions
�
Effective institutions in one sector can expand to tackle more complex issues.
�
Scientific institutions are often a good starting point for transboundary lake dialogue.
�
External accreditation can trigger effective management.
�
Without political will, institutions are ineffective.
�
Informal institutions can be more flexible in responding to issues.
3
4
Institutions: Society's Response to Scarcity
5
6
In the absence of scarcity, there is little need for institutions. In the story at the start of
7
the previous chapter population densities were initially low and development limited.
8
There were enough of the lake's natural resources--water, fish, reeds, other products--
9
for all to enjoy and consume as much as they want. As a result of both population growth
10
and economic development, however, resources started to become scarce--that is, their
11
uses become congested, and it becomes necessary to control and limit access to the
12
"commons" and allocate the goods and services provided by the lake basin through rules
13
of various sorts. Institutions are the originators, custodians and implementers of the
14
agreed "rules of the game," or the "humanly devised constraints on human behavior".
15
16
As the level of scarcity and complexity grow, the nature of institutions also changes.
17
Management, and institutions, typically evolve from the individual (or private
18
management), to communal forms of management, to public or national management.
19
For international lakes, transboundary management is difficult to achieve and typically
20
occurs at a later stage of development. Basically, institutions are society's way of
21
responding to the problem of "scarcity" by devising rules to allocate the goods and
22
services provided by the lake and implementing those rules.
23
24
Institutions and institutional arrangements are essential to address the "common pool"
25
aspect of lake management, to reduce the conflicts that otherwise inevitably arise from
26
competition. Yet they are not costless. The lake briefs indicate that institutions and
27
institutional arrangements are expensive to set up and maintain.
28
29
What are effective institutions?
30
31
In the context of lake basin management, effective institutions generate an improvement
32
in the lake environment by distributing resources equitably and efficiently. Specifically,
33
effective lake institutions, individually and as a group, share a number of characteristics.
34
It is observed in the Lake Briefs that effective institutions...
35
36
� respond to new problems as they evidence themselves both in the ecosystem and
37
in the "human system".
38
� tackle critical problems at the most appropriate scale. For example, hot spots can
39
be identified within the lake basin and dealt with on a localized basis (e.g.,
40
Missisquoi Bay in Lake Champaign; Akanoi Bay in Lake Biwa; numerous islands in
41
Lake Malawi). For issues confined to these locations, local institutions may be
42
sufficient.
43
� remember, learn, and build and maintain both personal and institutional
44
relationships ("social capital") with key stakeholders, including funders. This is
45
greatly facilitated by the continuity of key staff. A key individual, catalytic and
46
sometimes charismatic, can play a critical role in institution building, even if not
47
permanently attached to a single organization.
48
� mobilize resources, direct government financing (or budgetary sources, if a
49
government line agency or local government), and external funding.
Draft Final Report: Not for Quotation or Citation
25
1
� address collective choice problems (conflicts) that make it difficult for existing
2
(usually sectoral) governance and user stakeholders to solve on their own
3
business as usual basis. It does this by involving stakeholders to identify problems
4
and suggest solutions. It also addresses the political problem of handling conflicts
5
and tradeoffs among stakeholders, including new ones.
6
� secure the trust of the regulated and legitimacy among the public (Chilika Lake,
7
India after 1997; Laguna de Bay, Philippines), and
8
� forge issue linkages, especially where source and affected party are different.
9
10
Effective institutions accumulate "institutional capital" as they evolve and learn.
11
Institutional capital comes in various forms --social, human, informational, and physical.
12
It allows effective institutions to change their agendas in response to changes in the
13
natural and human environments; to address problems involving many different
14
stakeholders (collective-choice problems); to be prepared for crises, in part because they
15
are capable of learning from the experiences of others; to focus on critical problems; to
16
enjoy a high level of legitimacy and trust among key stakeholders, built up over time
17
through credible commitments; and to mobilize financial resources on a sustained basis,
18
especially from a variety of different sources, including end users.
19
20
A Typology of Institutional Forms for Lake Basin Management
21
22
Institutions can take various forms. The following examples are listed in order of
23
increasing formal powers. However, this does not necessarily imply that more formal
24
structures are better than informal organizations. Given the long time required to build
25
effective institutions, building from below (a "bottom-up" approach) and on the basis of
26
accumulated institutional capital may create the most effective and strongest institutions.
27
28
Customary and self-regulated management
29
30
Customary and communal structures for single sectors, such as fisheries, are
31
effective in many situations with low population pressure and fairly abundant resources.
32
In many cases, local sectoral organizations have expanded into multisectoral institutions
33
without the "benefit" of regulatory oversight (Box 3.1).
34
Box 3.1. An Evolving Institutional Base: The Lake Naivasha Example
In 1929, the owners of the Lake Naivasha, Kenya foreshore organized themselves into the Lake Naivasha
Riparian Owners Association (LNROA) in order to regulate the use of the lake bed periodically exposed in front
of their properties as the lake level rose and fell naturally. These owners were, in general, wealthy, influential
Europeans and European-Kenyans who wanted to protect this land because it provided lake access, a scenic
foreground to their properties, and was useful for grazing activities. Other groups with an interest in the lake,
such as fishermen, nomadic Maasai grazers, and residents of the local towns and villages were not part of the
Association.
The LNROA was granted custodianship of this riparian land by the colonial government in 1933. The Association
successfully regulated access to these riparian lands from that time through to the present day although, for
most of that period, it was not an active organization. In the early 1990s it started to become more active
because of the increasing pressures on the lake. It changed its name to the Lake Naivasha Riparian Association
(LNRA) and expanded its membership base to include members that were not riparian property owners but who
had an interest in the health of the lake.
During the 1980s and 1990s the population within the lake basin grew dramatically and a thriving cut-flower
trade commenced on the shores of the lake. The larger flower growers organized themselves into a
representative institution--the Lake Naivasha Growers Group--to respond to adverse publicity, including claims
that their industry was polluting the lake. For a number of years, the LNGG and the LNRA were in conflict.
However, by the late 1990s these conflicts had been mainly sorted out and the two institutions started working
together for the management of the lake.
A management plan was drawn up for the lake in the late 1990s and the Lake Naivasha Management
Implementation Committee (LNMIC) was formed to implement it. The LNRA plays a leading role on this cross-
sectoral institution along with representatives of many other groups with an interest in the lake--fishermen,
town people, and government agencies such as the Kenyan Wildlife Service. The LNGG are not formally
members and nor are representatives of the settlers in the upper catchment and the traditional Maasai. These
Draft Final Report: Not for Quotation or Citation
26
groups will likely be brought into the process, both due to the recognition by many riparian groups that the
sediment load entering the lake from the upper catchment may become a problem to themselves, and because
of new environmental and water laws in Kenya. The recent Kenya Water Act allows for the formation of
representative Advisory Committees in each catchment that will have influence in the allocation of water and
the regulation of pollution. When this happens, the LNMIC will likely evolve into the regional Advisory
Committee and the evolution of the lake management institution will continue.
1
2
Coordinating committee
3
4
As population pressures and competition for resources grow, often a first step towards
5
coordinated management is the creation of a coordinating committee. A committee or
6
office, typically consisting of sectoral agencies (or, internationally, representatives from
7
member governments), is formed to coordinate efforts, while implementation remains
8
with existing sectoral and regional institutions. These committees are often weak since
9
they do not have legislative backing, a separate budget, or independent staffing. As such,
10
they are voluntary creatures of the sectoral ministries or, in international cases, of the
11
member governments. Many international lake basin commissions fall into this category.
12
13
Coordinating agency
14
15
A coordinating agency has legal authority or some higher level authorization (such as
16
cabinet approval), a separate budget and staff, and (sometimes) organizational
17
independence from sectoral agencies. It does not have executive authority but exists to
18
coordinate the actions of sectoral and regional institutions. For these reasons it is more
19
powerful than a coordinating committee. Examples include the Lake Chilika Development
20
Authority, the Cambodia National Mekong Committee, the Department of Lake Biwa and
21
the Environment (Shiga Prefectural government), the interagency Lake Dianchi Protection
22
Committee and Bureau, and the International Joint Commission of the Great Lakes. Most
23
of the active lake basin management bodies in our briefs are coordinating agencies. The
24
coordinating agency may be concerned with just the lake or it may also include the
25
catchment. Its powers include persuasion, facilitation, and convening.
26
27
Coordinating agencies face several major challenges:
28
29
These agencies are often quite weak and have to contend with the complexity of
30
preexisting, often imbedded, institutions and stakeholder groups. For example, the
31
Chilika Development Authority maintains institutional linkages with seven state
32
government organizations, four NGOs, three national ministries, two other national
33
organizations, four international organizations, nine research institutions, and four
34
different categories of community groups (see Figure # in Chilika brief). This is a difficult
35
coordinating task and requires strong leadership coupled with firm political backing by
36
politicians to succeed.
37
38
Successful coordination and the trust relationships required for coordination rely on the
39
presence of key individuals, especially at the chief minister or governor level but also in
40
agency management. The experience of the Lake Laguna Development Authority and
41
others is that one of the greatest challenges facing a development authority is the
42
frequency of changes in the government and appointed directors.
43
44
It is important that "coordination" not become a pretext for shedding responsibility. An
45
effective agency must be an advocate for integrated lake management policy, working
46
together with stakeholders to solve problems and, ideally, with a policy patron at a
47
supra-sectoral level, such as the governorship. Preparing a lake basin management plan
48
is an effective tool for policy coordination (see Chapter 9).
49
50
Draft Final Report: Not for Quotation or Citation
27
1
Executive (regulatory) agency
2
3
A regulatory agency can actually carry out actions, such as levying fees or creating
4
enforcing regulations, under its own authority. Since the potential always exists for
5
conflict with sectoral agencies, executive agencies should be authorized through
6
legislation and retain powers such as permitting, policy setting, financing and
7
implementation.
8
9
Since the existence of such an executive agency means that others have to give up
10
power, they are often hard to establish. Prerequisites for creating an executive agency
11
often include a) a long evolutionary history of trust building; b) a crisis; and c) no
12
international borders. Probably the best instance of such an agency outside the
13
governmental structure is the Lake Laguna Development Authority, which combines
14
coordinating, development and regulatory functions (see Box 3.2). The water resources
15
departments of Orissa and Madhya Pradesh (Lake Chilika and Bhoj Wetland, respectively)
16
provide both coordinating and regulatory authorities, but are not lake-specific agencies.
17
The actual executive powers vested in an executive agency can include the following
18
functions: Regulatory, Development, Conservation, and/or Restoration.
19
Box 3.2. Institutional reengineering of the Laguna Lake Development Authority
Inherent in the existing LLDA Charter is the developmental function for water resources development purposes,
but at present the LLDA is performing more of its regulatory function than its planning and development roles.
This overarching mandate of LLDA has not been realized because of lack of capacity and appropriate
mechanisms to enable the Authority to initiate and involve the private sector in capital intensive infrastructure
development projects in the region. Further, the financial flexibility of LLDA and other government owned
corporations, in terms of sourcing finances and utilization, has largely been constrained by the Philippine
Government's multi-layered approval process for fund solicitation through the NEDA/Investment Coordinating
Committee.
Performing the diverse functions as regulator and to a limited extent as a developer has overstretched the LLDA
and resulted in its inability to fully accomplish its original mandate as a development agency. This is evident in
its current business strategy and financial profile, thus the need to delineate and segregate its regulatory and
planning-developmental functions. Likewise, the LLDA has realized that building institutional capacities for
undertaking large-scale infrastructure projects in the region requires that the regulatory and policy-making
function of LLDA is balanced with a strong, but segregated, development function. This was the starting point of
the institutional re-engineering program. Previous studies identified potential investments of around US$381
million to maintain the environmental quality in the Laguna de Bay area through dredging, embankments,
sanitary landfills, and sewage and treatment plants. LLDA urgently needs to develop the capability to leverage
and facilitate private sector participation in necessary large-scale environmental and water-related
infrastructure projects in the lake area.
Source: Laguna de Bay Brief
20
21
The Role of Local governments
22
23
Local governments play a critical role in lake basin management, since localized issues
24
can often be handled best at local level. In addition, local authorities are often the most
25
accountable to the public and may be the best placed to facilitate stakeholder dialogues
26
at the operational level. They are the most capable of responding to local needs in
27
addressing the economic, social, and environmental challenges of sustainable
28
development. Their decisions on land use zoning, transportation, construction, public
29
health, ecological zoning, solid waste management, and industrial incentives all affect
30
water resources.
31
32
Few of the 28 lakes surveyed are managed entirely by a local government, however. The
33
Bhoj Wetland and Lake Baringo are controlled by a municipal and a county authority
34
respectively, while lakes Biwa, Chilika and Toba are under intermediate levels of
35
government. The remainder are managed at the national or international levels.
36
Local governments cannot manage all lake basins problems. Many problems, because of
37
the transmissivity of lakes, affect a wider area than just one local government
38
jurisdiction. In addition, local governments often lack jurisdictional authority and
Draft Final Report: Not for Quotation or Citation
28
1
resources to address context -specific issues, including a limited ability to bring other
2
levels of government to the table; (the financial and human resources to implement
3
properly sustainability initiatives; and the necessary political will, due to the brevity of
4
the electoral or administrative cycle.
5
6
In practice, the lake and its watershed often occupy a low position on the priority list of
7
local governments, especially in developing countries. Indeed, local governments can be
8
major sources of lake degradation if they are indifferent to urban sewage, diversion of
9
funds, support of activities that generate pollution as well as revenue and employment.
10
In many countries, local governments are highly politicized and just as hierarchical as
11
distant agencies, making consensus-building very difficult on cross-sectoral issue (Box
12
3.3).
13
Box 3.3. Involving local governments in an integrated policy at Laguna de Bay
Lakeshore municipalities challenged the Laguna Lake Development Authority over the right to issue fishery
permits, especially for the lucrative fish cages and fish pens. In 1995, the Supreme Court ruled in favor of the
LLDA, noting that the lake "cannot be subjected to fragmented concepts of management policies where
lakeshore local government units exercise exclusive dominion over specific portions of the lake water...The
implementation of a cohesive and integrated lake water resource management policy...is necessary to conserve,
protect and sustainably develop Laguna de Bay." This decision re-iterated LLDA's authority over permitting. It is
also interesting to note that, since the permitting program began, the LLDA has maintained a revenue sharing
policy of the fees with the local governments. This has undoubtedly contributed to the acceptance of the
program at the local level
Source: Laguna de Bay Brief
14
15
Evolution of integrated lake basin management
16
17
As lake uses increase in scope and magnitude, conflicts increase, and the benefits of
18
some sort of integrated management of the lake becomes more evident. Stakeholder
19
institutions evolve, often working out new ways of sharing the resource and avoiding
20
present and potential conflict, especially internally but also with other sectors. For
21
example, moratoriums on fishing have been imposed in Lakes Baringo and Naivasha to
22
allow depleted breeding grounds to recover; some agricultural drainage in Lake Biwa is
23
treated and recycled to avoid unwanted scrutiny of a highly protected sector; and the
24
horticulturalists of Lake Naivasha have responded to pressures from EU consumers and
25
the Lake Naivasha Riparian Association to adopt state-of-the-art techniques for pollution
26
control.
27
28
Institutions tend to arise and evolve for developmental needs, but can transform
29
themselves into effective preservers of the lake (Box 3.4). The Laguna Lake Development
30
Authority began with a resource development focus, but the national environmental
31
agenda quickly began to assert itself in its operations. Shiga Prefecture shifted the Lake
32
Biwa Comprehensive Development Plan upon its first renewal in 1982 from its initially
33
almost exclusive focus on developmental projects towards environmentally-friendly public
34
works, such as a wide-area sewerage system and a large infrastructure for irrigation. The
35
prefecture then went beyond the Plan to establish research and educational facilities such
36
as the Lake Biwa Research Institute, the International Lake Environment Committee, the
37
Lake Biwa Museum and Shiga Prefectural University.
38
39
Draft Final Report: Not for Quotation or Citation
29
1
Box 3.4. Great Lakes: A large institutional infrastructure, evolving over a century
The experience of the Great Lakes indicates that formal lake management institutions need to evolve to remain
relevant. Beginning with the establishment of the International Joint Commission (IJC) to implement the
International Boundary Waters Treaty of 1909 between the United States and the United Kingdom (for Canada),
a considerable `institutional infrastructure' for Great Lakes resource management has been created through
laws, treaties, conventions, compacts and formal agreements. The principal stakeholders of these formal
institutions are the governments involved, both federal and state or provincial.
The IJC was established as an independent body to advise and make recommendations on problems
("references") given to them by the governments and has been a pioneer in identifying emerging environmental
problems, such as nonpoint source pollution and the effect of phosphorus on lake eutrophication. Initially, the
IJC investigations only held public hearings on specific topics; otherwise, they were carried out in private
because only the governments could give permission to release `internal communications... by boards,
committees'. With the 1972 Great Lakes Water Quality Agreement between the United States and Canada, the
IJC opened up to more public involvement in its very effective PLUARG (Pollution from Land Use Activities
Reference Group) activities. It also assumed responsibility for monitoring pollution along the lakes, identifying
43 hot spots (Areas of Concern, or AOCs). Each AOC requires a Remedial Action Plan (RAP), and remains listed
until both countries agree on its removal. By and large, the IJC has been able to retain its independence,
although critical monitoring functions were assumed by the member governments after 1989, with mixed
results.
New stresses, both from changes in stakeholders' rights (Native Americans) and from problems arising from out
of the lake basin (zebra mussels, airborne lead), pose severe challenges to which present institutional
infrastructure must adapt.
2
3
Trained and experienced staff play a critical role. Putting resources into building the
4
conservation agenda and capacity of existing sectoral institutions may strengthen their
5
commitment and capacity for dealing with resource issues directly, or in cooperation with
6
environmental bodies. This may require modifications in personnel procedures, however,
7
in organizations where trained staff are regularly reassigned. This has been identified as
8
a problem in Lake Malawi and Lake Nakuru, and is probably quite widespread. On the
9
other hand, there are cases such as Lake Chilika where highly qualified people with
10
excellent networking skills are brought in to improve environmental capacity and enlist
11
the support of stakeholders at all levels.
12
13
Coordinating agencies rely on sectoral institutions to be effective. For example, Lake
14
Constance relies on individual sectoral institutions that are sufficiently coordinated to
15
integrate the management of lake conservation. The adaptability of existing institutions
16
are essential to the successful management for Lake Constance. Also important have
17
been the existence of infrastructure in place (especially sewerage) that allows upgrading
18
at modest cost, a high level of social capital exhibited in the very strong research agenda
19
of citizen groups and NGOs, a heritage of international cooperation, and the compulsion
20
of EU directives.
21
22
It is helpful if political and basin boundaries are the same. Lake Biwa and its watershed
23
are almost entirely coincident with the boundaries of Shiga Prefecture. Between 1972
24
and 1997, its development was governed under the Lake Biwa Comprehensive
25
Development Plan, which distributed public works projects among existing agencies.
26
27
The governance framework for lake basin management
28
29
The enabling environment
30
31
Whether formal or informal, water management institutions operate within a larger
32
context, or governance framework. Effective lake basin management requires that this
33
framework create an "enabling environment" that provides the conditions for institutions
34
to be effective. A governance framework includes laws and regulations both as they are
35
formulated and as they are implemented as well as a judiciary to fairly adjudicate
36
disputes (see Box 3.5). It also includes certain cultural endowments, such as those that
Draft Final Report: Not for Quotation or Citation
30
1
promote trust or impute non-market values to lakes. International lakes must deal with
2
questions of national sovereignty that make coordinated management more difficult than
3
for national lakes.
4
Box 3.5. Public Interest Litigation in India
A major development in stopping the continuing degradation of lakes in India has been the involvement of the
judiciary, sometimes at the highest level, the Supreme Court. Indian law courts have been extremely proactive
on the issue of environmental protection. Groups of affected people and third parties have been filing public
interest litigations (PIL) in courts across the country seeking remedial actions, especially for highly polluted
urban lakes.
The Supreme Court, in a PIL in the case of Badal Khol and Surajkund lakes in Haryana state, held that the
precautionary principle is part of the law of the land, and limited construction activity in the near vicinity of the
lakes. Although PILs have generally helped in restoration of lakes, there are opposite instances, as was the case
of the Rabindra Sarovar lake in West Bengal, where the PIL sought to legalize encroachment onto the lake.
(From M.S. Reddy and N.V.V. Char, Management of Lakes in India)
5
6
Transparency and accountability
7
8
Especially in developing countries, a pervasive lack of accountability and transparency
9
characterizes governance at all levels, even in democracies. Sophisticated laws, plans
10
and policies are not implemented. Information, when it exists, is hoarded as an
11
instrument of power. Under these circumstances, it is especially imperative to involve
12
stakeholders (Chapter 5).
13
14
Customary rights
15
16
Sometimes the local government is able to assume the functions of lake management,
17
especially where its boundaries coincide closely with a significant portion of the lake
18
basin. Informal or "customary" institutions can manage user priorities or transfer rules,
19
use rights for seasonal migrants, self-initiated lobby groups, and informal cooperatives.
20
Outside investors using formal property claims sometimes appropriate resources used
21
under customary rights, possibly contributing to the impoverishment of artisanal fishers
22
and farmers. This type of conflict is very common in developing country cases, especially
23
with the spread of fishpen culture in Asia. At Chilika Lake, arbitrary changes in traditional
24
fishing rights to promote fishpen investments led to violent clashes with police that drew
25
national attention to the lake.
26
27
In other cases, pressures are from migrating populations rather than heavily capitalized
28
outsiders. Traditional use rights of seasonal migrants in Lake Tonle Sap are under
29
challenge as customary migrants overstay their welcome and entirely new populations
30
come into the area. Similar conflicts between ethnic communities are widespread in
31
Africa.
32
33
Customary rules can transcend post-colonial national boundaries. In the Lake Chad area
34
pre-colonial rules are still in place to some extent for establishing the order of use
35
priorities in the face of dramatic changes in size and form of the lake. In this
36
circumstance, the lingering application of colonial Roman Law in assigning free access to
37
groundwater overlying landowners is retrogressive.
38
39
The necessity of harmonization
40
41
Differences in regulations and their enforcement can lead to perverse economic behaviors
42
for transboundary lakes. One of the most pressing needs in many international lakes
43
such as Lakes Victoria and Kariba is to harmonize national regulations in areas such as
44
fishery and pollution control. Harmonization is not necessarily the same as uniformity.
45
The intention is to ensure that there are not conflicts between the laws and regulations
46
across national borders, rather than to ensure that the laws are identical.
Draft Final Report: Not for Quotation or Citation
31
1
2
At the same time, harmonization should be tailored to the specific lake as opposed to the
3
needs of the riparian nations. Laws are too often formulated for the entire nation, and
4
may not be appropriate for a transboundary lake. Nigeria is important to the Lake Chad
5
basin, but the basin is not dominant in Nigerian policy thinking. It is necessary for basin
6
states to enable within-basin stakeholders to harmonize rules among themselves across
7
borders, but not necessarily with other regions in each country.
8
9
Towards effective institutions
10
11
Based on the experiences detailed in the lake briefs, a number of lessons have been
12
learned about creating effective institutions. Realizing that institutions may be private,
13
communal, national or international, however, these lessons have to be applied at the
14
appropriate scale and manner for each particular lake.
15
16
The key lessons are contained in the following bullet points:
17
18
� Effective management requires a core. Institutional effectiveness is stronger when
19
the lake is closer to an economic or political-administrative center of a nation.
20
"Marginal" lakes receive marginal attention. International cooperation may be
21
particularly difficult to achieve when a lake is marginal to one of the major basin
22
countries, as Lake Victoria is to Burundi or Lake Chad to Nigeria.
23
� Scientific institutions often make a good starting point for lake-wide dialogue.
24
Informal peer groups at the technical level can be a key factor in creating
25
supportive networks, especially across national borders. Whether it is the Great
26
Lakes or Lake Biwa, resident research institutes and centers for intellectual
27
exchange provide not only knowledge creation and dissemination but also neutral
28
fora where people can develop a common discourse.
29
� Effective management builds on existing institutions. Developing a lake-wide
30
institution is best done by building on a powerful sectoral institution, often
31
catalyzed by a crisis. Institutions usually exist already at the sectoral level. For
32
example, fisheries management bodies already exist in many of the lakes studied
33
in this report. Efforts to undertake cross-sectoral management of lakes should
34
build on these institutions, as problems arise.
35
� Effective management is not afraid to act. It may be difficult to determine
36
whether certain management actions will be successful or not. Nevertheless, the
37
Lake Briefs show that management institutions can be very effective if they are
38
seen to be taking action to remedy problems , even when there is little reliable
39
knowledge available. This is what the Lake Laguna Development Authority calls a
40
"ready, fire, aim" approach.
41
� Effective integrated management focuses on specific problems. The best lake
42
management experiences often focus on a limited number of critical points, such
43
as the removal of phosphorus from detergents in Lake Biwa, the biological
44
treatment of water hyacinth in critical bays in Lake Victoria, the addition of
45
tertiary sewage treatment in Lake Constance, or the identification of 43 hot spots
46
(Areas of Concern, or AOCs) in the Great Lakes. Public support will follow from
47
these initial successes.
48
Draft Final Report: Not for Quotation or Citation
32
1
Chapter 4: Identifying Effective Policies: Incentives and
2
Regulations
3
Key Lessons Learned about Policy
�
It is not possible to implement major policy changes if people do not understand the long-term
benefits.
�
Point source control policies are often a first step because implementation is easier to do and results
are easier to see than with broader, longer-term policy changes.
�
Effective policy making usually requires a mix of different policies.
�
Effective policies have to be tailored to the situation in each lake basin.
�
Without proper monitoring and enforcement, policies become worthless.
�
Designating a lake basin as a protected area does not necessarily stop exploitation.
4
5
Policy-making is an art, not a science, and changing specific policies for improved lake
6
management is part of a multi-step process. After identifying the parameters of the
7
lake's physical system (see Chapter 1), and the roles of the various stakeholders within
8
the system (see Chapters 2 and 5), the decision maker considers what is happening at
9
present, what alternatives are feasible, and the overall objectives of improved
10
management. These are the "goals" of improved lake management and the objectives
11
toward which new, specific policies are put in place.
12
13
Changing policies is an integral part of introducing effective solutions and making a
14
difference in a lake basin. Policies can be considered at several different levels. The
15
broader policy framework includes many dimensions--general goals for lake basin
16
management, the supporting legal framework and institutional arrangements (both
17
formal and informal), and the state of scientific knowledge. In addition, polic ies (or policy
18
responses) are needed to address specific issues and change behavior. These policy tools
19
often take the form of economic signals or incentives, as well as rules and regulations,
20
and are designed to create specific outcomes. This latter set of policies are the focus of
21
this chapter. People-centered policies, those that rely on public information and
22
involvement, are equally important and are discussed in Chapter 5.
23
24
In some cases (the easy ones) the needed improvements are largely engineering
25
investments, and the main problem is in securing financial resources (money!!).
26
Engineering and infrastructure solutions are discussed in Chapter 6 and Financing is
27
discussed in Chapter 8. However, in most cases, improved management usually
28
means improved management of people and their actions, and the introduction
29
of policies to change their behavior.
30
31
As discussed earlier, in almost all cases the users of lake resources (the stakeholders) are
32
doing what they feel is best for them given the prices, policies and institutions that they
33
face. Accordingly, any change in the patterns of resource use (whether it is a change in
34
agricultural practices in the upper watershed or fishing in the lake, for example) will
35
require someone doing something different, and taking an action that they would not
36
normally take. In fact, since we assume that all individuals are already "doing the best
37
that they can" any change in their behavior must be induced. Consequently, various
38
policy tools are used to "change the rules of the game." This is the role of new policies or
39
institutions--to make changes in the signals that lake resource users perceive and react
40
to, and thereby improving the use of the lake and its resources.
41
42
The process of changing policies is never easy. As seen in most of the lake briefs, there
43
are almost always winners and losers, and there are usually additional investment costs
44
associated with what is being proposed. Different interest groups may require quite
45
different policies, and in some cases where lake management is a regional or
46
international responsibility, this further complicates the process of designing and
47
implementing new policies. Hence effective policy change requires planning, political
48
commitment, and the financial and economic resources to implement change.
Draft Final Report: Not for Quotation or Citation
33
1
2
A Not-so-simple Example
3
4
The 28 case studies provide many useful examples of this challenge. In the case of
5
Laguna de Bay, for example, the government's management approach has been flexible
6
and has evolved over time as the management authorities have had to both respond to
7
new challenges (e.g. expansion of fish pen operations and shoreline industrial
8
development) as well as search for new sources of funding. See Box 4.1 for a discussion
9
of this process, and how the Laguna Lake Development Authority has tried a variety of
10
different policy approaches to address the lake's problems. As explained in Box 4.1, the
11
LLDA has shown the wisdom of trying to make a difference and fine-tuning policies as
12
experience was gained. This view is summarized in their informal motto of "Ready�Fire�
13
Aim"!
14
Box 4.1. Laguna de Bay and LLDA--an evolving policy response
When the Laguna Lake Development Authority (LLDA) was set up in 1966 to help manage Laguna de Bay and
its water quality problems, the approach used was a fairly traditional Command and Control (plus capital
investments) approach. Initially funded by an annual allocation of one million pesos from the National
Government, over time the LLDA has become much more self-financed through a combination of regulatory
fees and fines, laboratory services, and resource user fees (aquaculture and water abstraction). As the LLDA
gained experience, it broadened its mandate and set of activities to take a more proactive approach in
managing the lake as an economic as well as an ecological asset.
A particular area of interest has been the development and management of the fish pen/ aquaculture industry,
and the conflicts with traditional fishing populations and issues of changes in water quality. Programs were
developed to both support fish pen development as well as alternative income generating programs for
lakeshore communities. Conflicts among competing uses of the lake's resources grew: for example, the area
covered by fish ponds increased from less than 40 hectares in the 1970s to more than 30,000 hectares in 1983,
reducing the area available for open fishing and impeding lake navigation. Different government ministries
sometimes worked at cross-purposes within the lake.
The LLDA has also evolved in its response and more recently has tried to blend economic instruments (that
either use or create markets) with command and control policies. Implementation of the Environmental User
Fee System (EUFS) began in 1997 and combined a fixed fee and a variable fee to attack the problem of water
pollution from lakeshore industries and communities. The fixed fee component is based on volume of discharge
and covers administrative costs. The variable fee is based on whether discharges are above or below the BOD
standard of 50 mg/l. Implementation began slowly and focused on a small set of industrial polluters (who were,
however, responsible for up to 90% of the total organic load being discharged into the lake). The EUFS was
gradually expanded to cover other firms, residential areas and commercial establishments.
The EUFS use of fixed and variable fees helps to correct a problem commonly encountered with discharge
standard based fees--the later encourage dilution of discharges (to meet the standard) while the fixed fees will
tax the increase in quantity of wastewater released. The LLDA still has CAC functions like registering all units
that discharge into the lake, and monitoring and enforcement are always issues.
In another innovative approach a fish pen fee (basically a licensing fee) was set whereby monies are collected
from the fish pen operators and then shared between the lakeshore communities (more if they have fish pens
in their area) and the LLDA for general operating expenses. The fee is currently about US$120 per hectare per
year, and up to 35% of the money collected goes to lakeshore communities and the balance to LLDA.
The LLDA is an excellent example of a lake management authority that began life as a government mandated
(and funded) regulatory agency and has evolved into a much more market-responsive agency willing to try
different policy approaches to address evolving problems. In fact, the LLDA applies all four approaches in
varying degrees.
LLDA's willingness to innovate is seen in the interactions with fish pen operators--clearly a high value operation
(and consequently one that has a substantial ability to pay) but also an industry that contributes to
environmental problems in the lake. Competition for lake resources between the fish pen operators and
traditional lakeshore communities is an on-going concern and one that the LLDA has tried to address with a
number of different policies including fish pen regulation and creation of new economic activities on the shore.
The willing to try new approaches attitude of the LLDA is well summarized in their philosophy of "Ready--Fire--
Aim". They are willing to start with actions and are happy to fine tune later. Put another way, in the world of
policy formulation it is important that we "don't let the perfect [policy] be the enemy of the good."
15
Draft Final Report: Not for Quotation or Citation
34
1
Identifying Potential Policy Responses
2
3
As mentioned earlier, policies can be thought of at many different levels, including
4
changing institutions or legal frameworks, or taking legislative action. As used here,
5
however, policy response refers to a narrower set of discrete actions taken by
6
governments or other management organizations in reaction to some problem
7
and to produce some desired outcome, often by changing some price signal or
8
setting certain standards or norms. These types of policies can also be thought of as
9
a combination of economic signals and incentives (market-based policies) and rules and
10
regulations (command-and-control policies).
11
12
In effect, this definition of policy making is an example of the "Monday morning rule"--
13
whereby the decision maker, after attending a workshop and thinking about lake
14
management challenges in the context of the analysis and approaches presented in this
15
report, has to decide what can be done differently when he or she returns to the office on
16
Monday morning. Therefore the focus is on discrete, often modest changes that can
17
begin to make a difference (while not denying that broader, longer term social and
18
institutional change are also an important part of the search for more sustainable lake
19
management). Incremental changes are often the first step to effective lake
20
management by making all stakeholders part of the management process and getting
21
their "buy-in" into the process. Modest first steps towards control of industrial pollution in
22
Lake Dianchi in China, for example, laid the foundation for more major interventions over
23
time.
24
25
Although each lake or basin being analyzed will probably require a very specific set of
26
policies to address its own concerns, there are some more general lessons that provide
27
useful guidance, both on the types of policies most likely to be effective, and the
28
appropriate mix of policies to be used.
29
30
Decision makers can draw upon an expanding literature on effective policies to manage
31
environmental problems. Although many of the policies were developed for other
32
ecosystems, the principles are very transferable to many of the problems encountered in
33
lake basin management. In a broad review of environmental management polices, four
34
broad categories of policies were identified (see Five Years after Rio: innovations in
35
environmental policy, World Bank, 1997). These categories are the following:
36
37
� Policies that engage the public (public awareness, voluntary groups, the mass
38
media, others)
39
� Command and control type policies (rules and regulations)
40
� Policies that use existing markets (and often use price signals)
41
� Policies that create markets (and often create price signals).
42
43
These categories cover the entire range of policy tools being used at present and
44
represent quite different ways of attacking similar problems. The only other intervention
45
commonly used in lake basin management is a technological response such as physical
46
investment in capital works like advanced sewage treatment, dredging and the use of
47
biological agents to control weed growth. These technical responses are an important
48
part of the management package but are not "policies" in the sense used here--they are
49
discussed in Chapter 6. Furthermore, the first category listed above--policies that engage
50
the public --is really a different type of initiative and is appropriately discussed in the
51
following chapter on the role of public participation in lake basin management. Each of
52
these remaining three broad classes of policies is now discussed.
53
54
Rules and Regulations--Command and Control Policies
55
56
The first broad category of policy tools or instruments commonly employed by
57
governments is the use of regulations and standards. These are often referred to as
Draft Final Report: Not for Quotation or Citation
35
1
command and control (CAC) policies. Whether it is a restriction on the use of a certain
2
type of fishing gear, or the setting of an allowable pollution load for industrial or
3
residential effluent, command and control policies are popular with governments because
4
they can specify the desired outcome. Environmental management in the West started
5
with a CAC approach, and this helped to create the "policing" mentality about many
6
resource management agencies. Users often felt that governments were there to oversee
7
and police them, rather than work together for improved environmental and economic
8
sustainability. There was an additional attractive feature about CAC type policies.
9
Governments can state that they have strict standards in place and therefore feel like
10
they are "doing something" about the problem--even is nothing is being enforced! The
11
former Soviet Union was a classic example where everything was "controlled" by norms
12
or standards, and almost none of the standards were actually enforced.
13
14
For some goals, in some social settings, command and control policies can be a very
15
efficient and effective way to make a difference. For example, to reduce water pollutants
16
in a lake specifying allowable boat engine types (two stroke or four stroke engines, for
17
example) or fuels that may be used may be quite effective in reducing water pollutants.
18
Similarly, banning certain pesticides can quickly help reduce water pollution from
19
agricultural return flows. The lake Biwa example mentioned earlier used regulations to
20
control phosphate pollution in the lake. Many developed countries relied heavily on CAC
21
policies in the past, and they were effective in achieving environmental goals. Command
22
and control policies work best when the number of people affected is not too large, and
23
when there is a social acceptance of government-set standards. If "social capital" is weak
24
and enforcement is lax, command and control policies are unlikely to be effective,
25
A mixture of CAC policies is often used. To help manage fish stocks in a lake, specifying
26
fishing boat size or imposing gear restrictions will have a direct impact on fish catch.
27
Other CAC policies for fishery management include
28
29
� specifying "closed seasons" when certain species may not be caught,
30
� assigning allowable catch amounts per species or per period of time, or
31
� designating fishing zones for different categories of fishermen or different
32
fisheries.
33
34
Note that command and control policies are NOT economic policies--they usually do not
35
ask what are the benefits or costs of any policy (or, more importantly, what the net
36
benefits are), they merely specify the desired outcome. As a result, CAC policies can be
37
very inefficient ways to reach many goals. (In this case, "inefficient" means that the
38
chosen policy may be effective in reaching a goal, but at a much higher cost that other
39
policies.) The economic inefficiency occurs since CAC policies do not leave much room for
40
negotiation or trades--everyone is expected to follow the same standard. Experience with
41
air pollution reduction in the United States has shown that when polluters have the ability
42
to "trade" pollution reductions, those firms that are more efficient in doing so can often
43
"sell" extra reductions to older or less efficient firms. The net result of this market-based
44
approach is that total pollution reduction targets are met but at a considerably lower cost
45
than if each firm had to meet a given target (a traditional command and control
46
approach). When the US wanted to reduce atmospheric sulfur emissions, for example, a
47
tradable quotas approach was used and allowed the overall target to be met at half the
48
cost originally estimated to achieve the same reduction. Of course, to implement such an
49
approach requires setting an overall target for pollution reduction and allocating initial
50
firm-level reduction goals before trading begins.
51
52
Finally, command and control policies are often costly to administer and implement. The
53
more finely tuned the CAC policy, the larger the administrative burden in enforcing the
54
policy. In addition, if the policies are aimed at large numbers of individuals (rather than
55
just a handful of individuals) monitoring and enforcement may be impossible. A good
56
example is the difference in enforcing fishery regulations for thousands of artisinal or
57
near-shore fishermen or for a handful of larger operators. In this case neither group may
Draft Final Report: Not for Quotation or Citation
36
1
be easy to manage with CAC policies--monitoring or policing a large number of relatively
2
weak artisinal fishermen may be just as ineffective as trying to impose restrictions on a
3
small number of often wealthy or influential large fishing operators. The challenges in
4
Lake Victoria in managing the different groups of competing fishermen illustrate this
5
point.
6
7
Another illustration of the challenge is to try and affect agricultural chemical use by
8
farmers in the upper lake basin. A CAC approach would specify what chemicals are
9
permitted or how they may be applied--and could be almost impossible to enforce and
10
monitor. A "blunter" approach is to combine the use of some CAC policies (e.g. ban the
11
import and sale of the most damaging chemicals) with certain market-based policies such
12
as correctly pricing agricultural inputs (removing subsidies) so that there is an incentive
13
to use the input carefully and not over-apply. This happened with fertilizer in Indonesia.
14
In the past, heavily subsidized fertilizer was over-used in rice production, much of the
15
fertilizer was wasted and entered water return flows, and this created serious
16
downstream environmental impacts. The government then raised fertilizer prices (a
17
market based policy) largely because the Treasury could no longer afford to pay the
18
subsidy. The net result was a sharp decrease in fertilizer use (and the pollution of water
19
that was an associated by-product of excessive fertilizer use in the past) but no decrease
20
in rice production. Farmers just started to use fertilizer, now a more expensive and hence
21
"valuable" input, more carefully!
22
23
In summary, command and control approaches are more likely to succeed when the
24
following requirements are met:
25
26
� the number of individuals or units to be managed are small or there are easily
27
monitored points e.g. landing beaches or sites for fish catch
28
� the institutional structure to monitor and enforce sanctions exists and is effective
29
� there is a reasonable level of "social capital," and individuals and society have
30
respect for government and institutions
31
� there is a sense of "shared responsibility" for management of the lake basin and
32
its resources
33
34
This is a rather demanding set of requirements and helps explain why in many countries
35
command and control has been only minimally effective in promoting improved lake
36
basin management (while still allowing governments to give the impression of having set
37
many standards and having taken action).
38
39
In other cases, policies send signals or create incentives/ disincentives to change
40
behavior. These policies are generally referred to as "market-based incentives" and either
41
use existing markets or create new markets. Just as with command and control policies
42
the market-based policies usually require monitoring and institutions to help enforce
43
them.
44
45
Policies that Use Existing Markets
46
47
Markets and market prices are very powerful senders of signals--a higher price for a food
48
or fish product will cause farmers or fishermen to increase production, a higher price for
49
fuel or inputs will decrease incomes and may cause a shift in technology. Even
50
subsistence farmers and fishermen are affected by market price signals, although the
51
impact may be quite indirect and lagged in time. The policies that use prices to send
52
signals are the most important category of what economists refer to as "market-based
53
incentives" or MBIs.
54
55
Economists accordingly place a lot of emphasis on "getting the prices right" and the
56
power of the market (and prices) to change behavior. There are several reasons for this:
57
Draft Final Report: Not for Quotation or Citation
37
1
� Market signals (prices) affect most people and normally do not require direct
2
government intervention once the price has been set
3
� Market signals affect both those who are in the market and those who are only
4
marginally involved
5
� People respond to market signals (prices)
6
� Market signals (prices) can change quite quickly and hence are a fairly responsive
7
policy tool (think of the impacts in changes in the price of fuel or water)
8
� Market signals can be used to both reward good behavior (e.g. a subsidy for use
9
of environmentally friendly equipment), or to punish undesirable behavior (e.g. a
10
tax to discourage over use of a scarce resource or to discourage polluters)
11
� Changes in market prices is a classic way to "internalize environmental
12
externalities" , and thus encourage more efficient resource use. A higher price for
13
pesticides, for example, helps the price reflect the costs of pesticide pollution of
14
water, and also encorgaes farmers to use less pesticide and use it more carefully.
15
16
Having said this, it is usually not a simple political process to introduce these changes.
17
Since the well-being (welfare) of people is being affected, there will always be pressures
18
to resist changes by those who will lose something due to changes in prices. This is
19
natural--no one wants to pay more for anything (e.g. water for drinking or irrigation,
20
fishing permits, waste water discharge permits) even if they agree that the current price
21
is too low--and has some subsidy built into it. The people who receive free or subsidized
22
services (or free access to certain lake resources) almost always feel that the lower price
23
is the "correct" price and will fight efforts to raise the price. Whether they are successful
24
or not in preventing efforts to increase prices (or restrict use) often depends on their
25
political power. In addition, when those affected are low-income fishermen or farmers,
26
there are important distributional issues about any new burden--can they afford the new
27
costs (even if the costs are fully justified)? Are there other groups receiving subsidies
28
who could (and should) pay more, and maybe provide a cross-subsidy to lower income
29
resource users? For example, the Lake Naivasha Brief raises interesting questions about
30
who benefits from the uses of the lake waters (flower growers, fishermen, traditional
31
pastoralists), and who should shoulder what portion of the costs of improved
32
management.
33
34
The one exception where some users may be willing to accept an increase in a charge or
35
price for a previously free or under priced resource is where the user group sees that
36
some action or investment is needed or else they will all lose in the future. This form of
37
"enlightened self-interest" is unfortunately less common than one would like, but
38
examples do exist. In Asia for example, both the fish pen operators in Laguna de Bay and
39
the pulp industry in Lake Toba have accepted a new fee/charge in hopes of assuring the
40
longer-term financial (and ecological) sustainability of the lake resource and their
41
industry.
42
43
Policies that Create Markets
44
45
Sometimes markets are poorly developed or lacking--this is usually due to poorly defined
46
property rights or where past use was limited and did not put pressure on the
47
sustainability of the resource. In a fishery, for example, if the previous levels of catch
48
were below the MSY--maximum sustainable yield--there was no need to regulate or
49
control the catch--there were enough fish for all users. However, with population growth
50
or introduction of new technologies (such as bigger boats or more effective fishing gear)
51
this situation often changes. Users begin to compete with one another and the resource
52
begins to degrade.
53
54
In these cases it may be possible to create a new market and then reap the benefits of
55
market-based policy tools. For example, if the lake fishing industry is an open-access
56
resource (e.g. anyone with a boat can catch fish) it may be possible to assign property
57
rights (or catch quotas) to lakeshore communities. The fish have then become an
Draft Final Report: Not for Quotation or Citation
38
1
economic commodity and the entitlement holders (those individuals or groups with the
2
property rights or the catch quotas) now own an "economic asset" and have increased
3
interest in and options for managing the fish resource. The newly enfranchised owners of
4
the fish resource may chose to harvest their allotment, sell their quota to another group,
5
or wait until later to harvest their share. This is not unlike what happens when grazing
6
lands or forest lands are changed from communal open-access resources to resources
7
that have identifiable property rights.
8
9
Note that communal resource management can work in some settings (usually where
10
there are smaller, more homogenous groups), but the history of open access fisheries is
11
full of examples where over fishing resulted in serious degradation of the fish resource.
12
Some of the issues of communal management of resources are discussed in Chapters 2
13
and 5.
14
15
Another type of policy that creates a market is where there is a new or expanding use. In
16
many case, for example, sport fishing in lakes has been traditionally unregulated and
17
untaxed. The introduction of "user fees"--a license fee, a per catch charge, a daily
18
admission fee--are all ways that a market can be created. Once the market is created the
19
policy instruments or tools that are used are the same as those found under the third
20
category (Policies that Use Existing Markets).
21
22
A final example of "market creation" is found in many international lakes or lakes that
23
are designated as Ramsar sites. In these cases the lake basin and its resources have
24
been recognized as having international benefits and international "stakeholders" in their
25
management. This recognition is often accompanied by additional funding to help pay for
26
management and the production of these trans-national benefits. The GEF has been
27
actively funding management of international waters (including lakes) and many bilateral
28
agencies and NGOs help pay for management in specific lakes that yield important
29
biodiversity or other environmental benefits.
30
31
The Policy Matrix
32
33
Policy-making is a creative process and successful policy-making is almost always a
34
combination of several different policy instruments or tools. The institutional framework
35
for implementing new policies is equally crucial. It is not possible (nor desirable) to be
36
prescriptive with respect to which policy is best for each problem. Since policies are
37
designed to affect people and their behavior, what works in one situation may not
38
necessarily work in another. Successful policy implementation depends on many factors--
39
socio-cultural factors, institutional dimensions, the extent of market development and
40
public confidence in the "system" and various aspects of what economists call "social
41
capital" (See Box 4.2).
42
Box 4.2. Social Capital
Social capital is the sum of the beneficial ways that different members of a society interact with one another. It
is often the missing ingredient in creating a successful policy intervention. Societies with higher levels of social
capital have greater possibilities of reaching co-operative solutions, and using self-discipline to enforce required
changes. Social capital is not the same as economic wealth--some poor societies can have a large amount of
social capital (especially if the population is fairly homogenous). One characteristic of societies with large
amounts of social capital is a "shared vision"-- the Costa Rican public's view of the role and importance of the
environment is one excellent example. The lack of social capital, in contrast, is often marked with distrust,
cynicism, and failure to find co-operative solutions. Unfortunately, in many of the world's lakes (especially those
with very mixed, ethnically diverse populations and sharp competition for available resources) social capital is
scarce and this makes implementation of new policies very challenging.
43
44
Draft Final Report: Not for Quotation or Citation
39
1
Table 4.1. The Policy Matrix--Selected Applications to Lake Basin Management
Engaging the Public
Command and Control
Creating Markets
Property
Tradable
International
Information
Public
Rights/
Permits/
Offset
By sector or theme
Disclosure
Participation
Standards
Bans/Quotas
Zoning
Decentralization
Rights
Systems
Water
resources
Public
Lake-based
awareness
NGO
(Chilaka,
(Victoria)
Biwa)
Fisheries
Licenses
(George)
Gill net
Fish pen
size
licenses
(Victoria)
Fishing
(Laguna)
Fishing
Gear
moratorium
Fish pen
Fishing
management
standards
(Baringo,
zones
concession
(Laguna)
(Peipsi)
Naivasha)
(Laguna)
(Ohrid)
Land
Management
Village level
environmental
conservation
Land use
groups
control
(Nakuru)
(Naivasaha,
Dianchi,
Resource Management
Toba)
Sustainable
Agriculture
Flower
growers co-
operative
(Naivasha)
Biodiversity
Lake level
control
(Toba)
Water
Pollution
Water
Detergent
quality
bans
Land use
standards
(Champlain,
planning
(Dianchi)
Biwa)
(Dianchi)
Solid Waste
Relocate
Pollution Control
landfill
(Nakuru)
Hazardous
Waste/Toxic
Chemicals
Land use
controls
(Dianchi)
2
3
Draft Final Report: Not for Quotation or Citation
40
1
Table 4.1. (cont.) The Policy Matrix
Using Markets
Environmental Taxes on
User Fees for
Subsidy
Natural
By sector or theme
Reduction
Emissions
Inputs
Products
resources
Services
Targeted Subsidies
Water
resources
Payments
from
Raise water level
downstream
(Sevan, Aral Sea)
water users
Improve water quality
(Biwa)
(Aral Sea)
Fisheries
Fish levy
(Victoria)
Fish pen fee
(Laguna, Ohrid)
Fishing
Fish catch
licenses
(Ohrid)
(Champlain)
Land
Management
Resource Management
Environ-
mental mgt
fee
Reforestation
(Toba)
(Dianchi)
Sustainable
Agriculture
Watershed areas
(Naivasha?)
Biodiversity
Water Pollution
Fertilizers
Industrial
subsidy
pollutants
Sewage/ wastewater
reduction
taxes
treatment
(Peipsi,)
(Laguna,
(Great Lakes,
Dianchi)
Dianchi)
Solid Waste
Pollution Control
Hazardous
Waste/Toxic
Chemicals
2
3
Draft Final Report: Not for Quotation or Citation
41
1
2
Policies have to be tested and proved in the field and it is difficult to predict in advance
3
whether or not a policy will be completely successful. The case studies provide many
4
examples where well-intentioned policies were ineffective, or where policies successfully
5
used in one setting failed in another.
6
7
One aid to policy making is the use of a Policy Matrix--a simple device that lists the main
8
potential policies on the columns (grouped by the five major policy types introduced
9
earlier � engaging the public, rules and regulations, using markets, creating markets,
10
and engineering solution)) and the major management issues on the rows. The different
11
cells of the matrix are then filled in with examples drawn from the case studies and the
12
literature. See Table 4.1 for an example of a Policy Matrix and selected examples of its
13
application to lake resources management. The Policy Matrix draws from examples in this
14
chapter as well as the chapter on People (Chapter 5).
15
16
For example, the common problem of over fishing can be addressed by any number of
17
different policies. Although what is likely to work in any particular lake will depend on the
18
situation in that lake, a set of potential policies that could be considered to control over
19
fishing include the following:
20
21
� Auctioning of pre-determined catch quotas (using a market), or
22
� Assignment of new catch quotas that can then be bought and sold (creating a
23
market), or
24
� Restrictions on the types of fishing gear allowed, fishing effort, or allowable catch
25
(command and control approaches), or
26
� Public information campaigns to encourage fishermen to limit or restrict their
27
catch (public information/ involvement).
28
29
Obviously the selection of an appropriate policy, or mix of policies, is likely to very site-
30
specific. See Box 4.3 for an example from Lake Dianchi or using a mix of policies to
31
address water pollution. Even when command and control approaches are chosen to
32
address a problem, public information and consultation may be essential in gaining
33
acceptance of (and compliance with) the new policies. Since policies basically are
34
designed to change human behavior, we must never lose sight of the importance of
35
properly consulting on and explaining the new policies if they are to be successfully
36
introduced. Those societies that have gained recognition as being "environmentally
37
friendly"--Costa Rica is one example--have been able to do this largely through public
38
education and participation, and obtaining political support at the highest levels of
39
government. Otherwise improved environmental management will always be everyone's
40
second (or third) priority.
41
Draft Final Report: Not for Quotation or Citation
42
1
Box 4.3. Lake Dianchi, China--A mix of policies to improve lake water quality
Water pollution was a major problem in Lake Dianchi in China. Although Kunming, the capital, obtained its
primary water supply from the Song Hua Ba reservoir, Dianchi was an important water source for Kunming in
dry years as well as serving industry and agriculture. Pollution came from sewage, industrial effluents, irrigation
return flow and storm run-off. The municipal government responded with a combination of policies--strengthen
administration and enforcement of laws and regulations, and new investments totaling more than 2.1 billion
yuan (about $250 million). The investments were supported in part by a World Bank loan. Large engineering
investments were made in sewers and water treatment facilities, and industrial polluters began to meet
discharge standards.
Still, numerous old industries remained important sources of pollution. A pollution levy system had previously
been introduced into China and was being applied in the basin along with the discharge standards under which
industries were charged a penalty if their discharges exceeded the discharge standards. The charges provided
an incentive for industries to take steps to control their pollution. They were assisted in making pollution
reducing investments by government loans and grants, funded in part by the revenues collected from the
pollution levies, as well as from additional government funds for environmental protection. This "carrot and
stick" approach, combining discharge standards, pollution charges, and loans for pollution-reducing
investments, has been used in many locations to help encourage industries to reduce their pollution.
In Dianchi progress has been reported in reducing pollution in the lake. Compared with 1995, by the year 2000
industrial wastewater discharged was reduced by 60%, COD was reduced by 80%, and soot, dust and SO2 were
all significantly reduced. These benefits, largely due to capital investments and management improvements,
have been supported by an active program of citizen's involvement and public dissemination of water quality
information. In order to help repay loans for the capital improvements and their operation and maintenance,
the city also began to charge user fees via water charges, and fees for wastewater treatment and domestic
solid waste disposal. The management challenge remains since Kunming is growing rapidly and is the economic
hub of the province. Still the example of management of Lake Dianchi illustrates the application of a number of
different policy tools to work together towards the longer-term goal of improved lake water quality.
2
3
Lessons of Past Experience: Increasing the chances for successful policy
4
implementation
5
6
Given the "Chinese menu" approach to policy making (selecting one policy from this
7
category and another from another category)--and the many possible ways to achieve
8
any given objective--what suggestions can be made for effective policy design? Based on
9
considerable worldwide experience with implementing environmental-management
10
policies, five broad lessons have been learned about what is likely to make a successful
11
policy package. Again, one cannot be prescriptive but successful interventions in many
12
environmental management areas indicate that successful (e.g. effective) programs often
13
share these characteristics:
14
15
Build "political will". Without the support of the general public and the political
16
establishment it is usually impossible to implement effective management. Whether this
17
is done by grass-root level efforts, or a carefully developed public information campaigns,
18
the creation of interest in and commitment to improved lake basin management is an
19
essential component of improved management. Often referred to as "political will", this
20
merely means that governments and management authorities are committed to take
21
actions and enforce changed policies.
22
23
Governments rarely lead with respect to improved environmental management--they
24
usually follow demands from the public. Once the general public is committed to change,
25
it is a powerful incentive for governments and management authorities to take actions
26
and enforce changed policies. Accordingly, the role of an informed and involved public is
27
essential in creating the "enabling framework" for improved lake basin management.
28
Active citizen involvement has helped create political will to take action in lakes as
29
diverse as Biwa, Sevan, Constance or the Great Lakes.
30
31
Achieve financial sustainability. Successful programs usually generate some or all of
32
the revenues needed for their management. Fortunately a number of potential policies
33
have the attractive feature of helping reach an environmental or economic objective
Draft Final Report: Not for Quotation or Citation
43
1
while also generating resources (e.g. money!) that can be used to pay for management.
2
Examples include the use of "user fees" or other use-based charges. For example,
3
expanding lake�based recreation and the implementation of a user fee can help put
4
management on a self-financing basis. Some of these approaches are discussed in
5
Chapter 8 on financing.
6
7
As mentioned earlier, there are serious sustainability questions about management
8
programs that are entirely dependent on either outside funds or the use of subsidies. If
9
local financial support (e.g. income) is not developed, when the external source of
10
funding ends, so may the management program. There are too many examples of lake
11
management initiatives or research programs that lasted only as long as the external
12
funding. External resources should therefore play more of a catalytic role rather than
13
an implementing role. A number of the case studies illustrate this point.
14
15
Ensure administrative sustainability. Linked to the financial issue is the
16
administrative and institutional requirement needed to implement any new set of policies.
17
Effective policies have to fit within the institutional capabilities that exist, or the new
18
policies have to provide sufficient resources to develop and strengthen institutions.
19
Command and control polices (e.g. regulations) may be particularly demanding with
20
respect to institutions � both for monitoring and imposing any needed sanctions. Again,
21
experience around the world illustrates the difficulty in building institutions that are
22
effective and sustainable--and this is increasingly difficult when the scale of the
23
institutional responsibility increase. Localized institutions may be easier to set up and
24
maintain than regional, or international institutions.
25
26
Build effective constituencies for change. In addition to the broader issue of building
27
"political will" for change, managing lake basin resources usually means managing
28
various groups of people, often with quite different interests. As pointed out by Carpenter
29
and Cottingham "the fundamental problem of lake restoration is an economic mismatch:
30
those who cause the problem do not benefit sufficiently from the remediation." Therefore,
31
building a sense of "community" and ownership among the various "stakeholders" is
32
essential if new policies are to be implemented. A strict enforcement-only approach
33
(basically a command and control approach) is unlikely to be successful, especially in the
34
longer term. Lake management, since it often involves large numbers of users, many of
35
whom are poor or "marginalized" members of society, is especially challenging. This point
36
is well illustrated by many of the case studies.
37
38
Actively work towards policy integration. Policy integration means that different
39
policies in different sectors of the economy need to work together to obtain the desired
40
objectives. While this is a simple statement to make, actually practicing it requires that
41
analysts, planner and decision makers explicitly consider the external impacts of their
42
more narrow sectoral policies. For example, attempts to improve lake water quality are
43
hurt when agricultural development policies designed to increase grain production
44
provide subsidized fertilizer or agricultural chemicals in the upper watershed, thereby
45
promoting increased chemical use and increased grain production (a good thing) but
46
resulting in increased chemical inflows into the lake and reduced water quality (a bad
47
thing).
48
49
The focus on the role of science and technology in this report (see Chapter 6 and 7)
50
helps inform this debate. Policy integration is never easy since it requires different parts
51
of government or the management structure to change what they would normally do.
52
Although the higher objective is "improved lake management", the direct implication at
53
the sectoral level may be to decrease output (c.f. the agriculture example given above).
54
55
In addition, if policy integration within a country is difficult, the problems are
56
compounded when the lake is an international lake and lake management must
57
incorporate more than one country and many different government entities. The Great
Draft Final Report: Not for Quotation or Citation
44
1
Lakes Commission of the United States and Canada illustrates the slow, but quite
2
successful, evolution of an international management regime. The numerous difficulties
3
in implementing improved management in Lake Victoria, in contrast, illustrate the
4
remaining challenges.
5
6
Policies, Policy Tools and Governance
7
8
This chapter has focused on policy tools (how one gets something done) that are used
9
after one has decided on more general policies (what one wants to accomplish). Linking
10
policies and policy tools is the whole issue of governance and institutions (who will get
11
something done). As discussed in Chapter 3 on institutions and governance, creating
12
effective governance institutions is one of the major challenges of development. And lake
13
basin management, given the diverse set of stakeholders in most lake basins with often
14
conflicting interests, is one of the more difficult governance challenges.
15
16
Chapter 5 discussed the role of participation and people in improved lake basin
17
management. As the chapter stated forcefully, involving people is not an option in lake
18
management, it is essential. However, all of the issues discussed up to now, including the
19
role of people, are necessary but not sufficient conditions for improved lake basin
20
management if taken one by one. Chapter 3 on institutions and governance shows how
21
these different concerns can be linked and made to work together.
22
Draft Final Report: Not for Quotation or Citation
45
1
Chapter 5: Involving People: Values, Education and Participation
2
Key Lessons Learned about People
This chapter needs a complete re-write. Material from Chapter 4 on involving people appears at the end and
needs to be integrated or put back into Chapter 4.The following lessons may emerge after re-write...
�
Good policy must reflect the desires of the people. (People supply endpoint)
�
Policies developed without participation of stakeholders cannot be effectively implemented.
�
One key way of preventing lake value degradation is to internalize social norms into people's behavior
through education.
�
Awareness raising can go a long way in tackling lake problems.
�
Relevant stakeholders include those with a right, those at risk and those with responsibility. (Or, not
everyone is a relevant stakeholder.)
�
Reliance on civil society to reflect the will of society as a whole shortcuts the democratic process and
gives faction dangerous power.
3
4
Managing lakes means managing people. In fact, one of the most difficult elements of
5
effective lake management is the shift from considering "people" as a homogeneous and
6
passive citizenry that "receives governance," to one recognizing "people" as active
7
participants in the process of lake management. The lake briefs contain many examples
8
of engineering solutions that were only partially effective � and for which it was
9
necessary to involve people to achieve the management goals. A basic conclusion,
10
therefore, is that behavioral change at the individual, household and community levels is
11
essential, and that "involving people" is an essential, not optional, part of effective lake
12
management.
13
14
Involving people for effective lake management is not a new concept. The World Lake
15
Vision stated that:
16
17
"Citizens and other stakeholders should be encouraged to
18
participate meaningfully in identifying and resolving critical lake problems."
19
20
Involving people (so-called public participation) provides individuals and groups with a
21
forum for informing decision-makers about their views. It focuses primarily on involving,
22
informing and consulting the public in planning, management and other decision-making
23
activities. In fact, of all the policy tools available to facilitate effective lake management
24
(see Chapter 4), decision-makers most often underestimate the potential of those policy
25
tools that involve the public. This is in part because the public participation process is
26
more bottom-up and consultative, while the traditional decision-making and policy-
27
making framework is top-down and dictated, usually by governmental entities. The
28
challenge, therefore, is to make the involvement of people "meaningful," and to also
29
develop mechanisms for resolving conflicts when consultation alone is not sufficient. The
30
rhetoric is clear: Effective lake basin management ideally should involve all citizens and
31
stakeholders in the process. As noted in Chapter 7, one of the requirements for
32
meaningful public participation is to provide the information and data needed to make
33
the public aware of the magnitude of given lake problems, and the public's role in both
34
causing and solving them, as well as the ultimate environmental and socioeconomic
35
consequences if the problems are ignored. Fortunately, the various lake briefs, as well as
36
the results of three regional workshops, support this principle and provide insight as to
37
how to begin to put it into practice.
38
39
The lake briefs show that local communities and non-governmental organizations (NGOs)
40
are among the stakeholders that can significantly affect the outcome of management
41
efforts in lake basins. They demonstrate that active community participation also can be
42
vital to reducing poverty and achieving social equity and sustainable development in lake
43
basin management.
44
Draft Final Report: Not for Quotation or Citation
47
1
Who are the "People"?
2
3
Different stakeholders are involved in different phases of the lake management process,
4
and this stakeholder participation takes place at different levels of governance--
5
community, local, national or international, or a mix of these. Various methods, ranging
6
from information sharing to empowerment, can be used to match the different
7
circumstances, capacities and needs of lake stakeholders. It is logical, therefore, to ask
8
who are the "people" (the public) to be involved in lake management? A broad definition
9
is that the public comprises the people within a country or locality, or a community within
10
a specified region. It typically comprises people of diverse, sometimes conflicting,
11
interests and attitudes, as well as groups of people with a common interest. Relevant
12
groups include drainage basin `citizens', businessmen and industrialists, farmers and
13
agriculturalists, environmentalists, non-governmental organizations, international
14
organizations and professional societies, funding agencies and even governmental
15
entities in some cases. For the purposes of this report, the public is taken to mean all
16
those people and groups with an interest in the supply, use, management and/or
17
conservation of lakes, whatever their individual views, complementary or antagonistic.
18
19
To this end, principal lake stakeholders include the following:
20
21
Farmers and Agriculturalists
22
23
In many parts of the world, productive farming requires irrigation, and farmers were
24
among the largest water users in 7 of the 28 lake basins. Lake Baikal is the most striking
25
example in this study of the significant human health and ecosystem effects of excessive
26
water abstractions on the lake and its basin. Because agriculture uses substantial
27
amounts of fertilizers and pesticides, which can seriously degrade lake water quality,
28
water awareness programs typically target farmers to improve agricultural management
29
practices.
30
31
Business and Industry
32
33
Every society faces trade-offs between the production of things people need or want, and
34
the waste generated as a result of the production. The resulting water quality
35
degradation has both human and ecosystem health implications. Further, parastatal
36
hydroelectric power companies constructed the two modern dams in this study (Tucurui,
37
Kariba). Dams also had a major effect on Lakes Ohrid and Toba, where major rivers were
38
re-directed to flow into the lake basin.
39
40
Domestic and international tourists also are drawn to lakes for their scenic beauty and
41
recreation (swimming, fishing, etc.). Thus, tourism is, or is hoped to become, a major
42
industry for more than half the lakes in this study. A combination of good water quality
43
and cultural heritage sites are essential for successful tourism, and many of the lakes in
44
this study are striving to re-orient their tourism based on scenery, protected areas, and
45
cultural heritage. Tourism development strategies are evident in varying degrees for
46
Lakes Baikal, Biwa, Champlain, Cocibolca, Constance, Dianchi, Issy-Kul, Ohrid, Sevan,
47
Titicaca, Toba, and the North American Great Lakes.
48
49
Youth
50
51
Environmental education can be a very effective tool for public involvement, particularly
52
when directed to children. It also must be approached, however, as a continuous, lifelong
53
process, ideally beginning at the elementary school level. Further, the best results are
54
usually gained when relevant educational activities are conducted in direct contact with
55
nature. However, only a few lake briefs specifically mentioned lake programs targeted to
56
children, a major example being Lake Biwa. More than 300,000 5th grade students have
57
participated in a two-day work-study program since 1983 on a "floating school" ship. For
Draft Final Report: Not for Quotation or Citation
48
1
Lake Peipsi, more than 5,000 children a year have participated in an international
2
creative works contest, "World of Water Through the Eyes of Children," since 1996.
3
Indigenous People
4
5
As used here, the term `indigenous people' refers to traditional occupants of portions of a
6
lake basin that may be distinguished from other groups in national society by their
7
language, culture or economic activities. From a national perspective, they are typically
8
considered minorities, although they may form the dominant population in a given lake
9
basin. The traditional knowledge and belief-systems of indigenous peoples, however, are
10
based on sustainability and living in harmony with their environment, and can be
11
invaluable in promoting good lake management.
12
13
Neglecting indigenous peoples had negative impacts for several lakes in this study. A
14
disregard of the indigenous fishing community in the Lake Chilika basin, for example, it
15
was a source of conflict between the "gheri" fishermen and the increasingly marginalized
16
indigenous fishermen, the latter typically employing sustainable fishing practices. The
17
Tonga people in the Lake Kariba basin were forcibly displaced to build the Kariba Dam,
18
without consideration of its prolonged negative impacts on the Tonga community. Positive
19
experiences also are available in the lake briefs. In the case of Lake Titicaca, for
20
example, the Binational Authority, in coordination with the lake's indigenous
21
communities, greatly facilitated monitoring and lake regulatory activities.
22
23
Women
24
25
Among the four Dublin Principles for water management, the third principal specifically
26
refers to the issue of women's participation: "Women play a central role in the provision,
27
management and safeguarding of water." Few lake briefs, however, acknowledge
28
women's participation in implementing water programs and projects. One is the
29
Participatory Rapid Appraisal (PRA), a successful technique for Lake Toba in which women
30
were invited to participate in community meetings. Women also organized the
31
previously-noted "Soap Movement" to eliminate the use of phosphorus-containing
32
detergents in the Lake Biwa basin (see Box 5.1).
33
34
Non-Governmental Organizations (NGOs)
35
36
The term `NGO' generally denotes formal groups of organized individuals for a variety of
37
reasons. With memberships ranging from local to global, NGOs can advocate a particular
38
cause or carry out programs . As used here, the term NGO refers to non-governmental
39
organizations that are intermediaries in the process of facilitating policies and projects at
40
the local community level. NGOs can play an important role in developing the capacity of
41
local communities for self-mobilization and collective action, including helping
42
marginalized community groups lacking the capacity to appropriately articulate their
43
demands.
44
45
Local Governments
46
47
Although not a `public' stakeholder in the traditional sense, local governments can play a
48
central role in improved lake basin management. Constituted as municipal, district and
49
regional or state governments, local governments are the bodies `closest to the ground,'
50
with the responsibility of feedback, initiation of ameliorating activities and execution of
51
policies, and usually have the major day-to-day responsibility for development. By the
52
nature of their commitment, they are often best placed for facilitating this dialogue at the
53
cutting-edge execution level.
54
55
There is widespread agreement that what is required for effective management is `to
56
make distributed governance effective.' Distributed governance describes a system
57
whereby the State no longer acts alone. Rather, many different parties--government, civil
Draft Final Report: Not for Quotation or Citation
49
1
society, private sector, individuals--have roles and responsibilities. As the level of
2
government closest to the people, local governments are key actors in the field of
3
freshwater management. Their position as a service provider, coupled with their ability to
4
create behavioral change in their communities, afford them the opportunity to influence
5
public responses to water use and mismanagement.
6
7
The first type of `local authority' comprises lakes (and their basins) managed by a local
8
government, or a number of local governments acting together, which is only possible
9
when the lake lies within the boundaries of a single country. The Bhoj Wetlands, for
10
example fall under the jurisdiction of the Bhopal Municipal Corporation (BMC). The state
11
government executes the lake plan using its departments as well as the BMC. Lake
12
Baringo is controlled by the Baringo County Council, with the lake being managed via a
13
committee with governments, community and NGO representatives.
14
15
A second class is represented by Lake Naivasha, wherein the initiative for lake
16
management came from local stakeholders, primarily through LNRA, an association of
17
property holders that expanded its membership to become more representative. It
18
developed a lake management plan approved by the national government, also forming
19
the LNMIC as a wide body with additional representation from the district and national
20
level. LNMIC has no legal powers or formal budget, however, and the lake management
21
plan is implemented through consensus building.
22
23
Lake Biwa (managed directly by the Shiga Prefecture) and Chilika (under the direct
24
control of the state government, with full regulatory and executive powers) are a third
25
type, managed by single regional governments with jurisdiction over the lake. The
26
powers of such governments are more effective than municipal or district bodies, and do
27
not depend on authority delegated by national governments.
28
29
Some lakes fall within the boundaries of a single country, but are managed directly by
30
the national government (e.g., Laguna de Bay, Lakes Nakuru, Tonle Sap, Tucurui, Issyk-
31
Kul and Sevan). Only preliminary lake management studies have been carried out for the
32
latter four cases. The Laguna de Bay case, however, is particularly instructive, since the
33
LLDA enjoys wide regulatory powers and has been successful in identifying several
34
management initiatives.
35
36
The largest type in this study comprise lakes shared between a number of different
37
countries, ranging from two (Aral Sea) to five (Lake Chad). A lake authority or project
38
has usually been set up by an interstate treaty/agreement to manage the lake, with
39
powers being delegated to the authority. These situations range from model
40
arrangements (e.g., Lake Champlain, with broad participation from all stakeholders) to
41
more informal structures (e.g., Lake Constance, where the stakeholders participate
42
through indirect means). For Lakes Dianchi and Nyasa/Malawi), no such authority has yet
43
been established, with lake conservation efforts remaining uncoordinated.
44
45
Resources, professional support and capacity building of local bodies are needed to
46
facilitate achievement of their desired functions. To this end, national governments must
47
be more receptive to facilitating the access of local governments to financial and
48
information resources, and to providing an enabling environment in which priority issues,
49
defined at the local level, can be addressed. Thus, a strong and equal partnership is
50
needed between all spheres of government--local, national and international.
51
52
Public Participation and Empowerment
53
54
Public participation in environmental management is a complex issue involving many
55
aspects. The term `public participation' is used in differing ways in different cases,
56
sometimes being interchanged with other terms (e.g., stakeholder or citizen
57
participation). According to the World Bank (2000) there are four exclusive levels (or
Draft Final Report: Not for Quotation or Citation
50
1
types) of participation. In ascending order, from least influence to most influence, they
2
include: (1) information sharing (one-way communication); (2) consultation (two-way
3
communication); (3) collaboration (shared control over decisions and resources); and (4)
4
empowerment (transfer of control over decisions and resources). These levels are not
5
indicators of scale, but rather distinctly different types of participation. It is not
6
necessarily assumed, however, that all participation is good, or that a higher level or
7
more participation is automatically better. Its ultimate value depends on the particular
8
lake management situation. Some rationale for public participation and involvement in
9
lake management are summarized in Box 5.2
10
11
The experience from most developing countries suggests that international actors
12
constitute an important stakeholder group. Through multilateral or bilateral programs
13
and international NGOs, international donors can play a unique, critical role in translating
14
global institutional agendas and local grassroots agendas into a common policy for
15
managing lakes for their sustainable use. Further, international stakeholders often
16
facilitate the critical technical and financial assistance for developing and establishing
17
participatory lake basin management in developing countries.
18
19
Community-level Participation
20
21
At the community level, stakeholders can be individuals and/or community-based
22
organizations (sometimes referred to as primary stakeholders). In this report, they refer
23
to local communities involved in lake basin management, referred to as community-level
24
participation. The term `community' is used to designate both communities-of-place and
25
communities-of-interest. Communities-of-place include members of the public who may
26
be affected by, or interested in, lake management decisions and actions by virtue of their
27
residency at or near the locations of management interventions. Communities-of-interest
28
include groups with a focused interest in management of resources unrelated to their
29
residences. Some communities can be both of place and interest (e.g., villages highly
30
dependent on fishery, forestry or agriculture).
31
32
Lessons Learned Regarding Public Participation
33
34
Communication, education and public awareness are major elements for trying to change
35
human behavior. In the public participation process, communication is a two-way
36
exchange of information, ideally leading to mutual and enhanced understanding, and
37
facilitating cooperation between different groups in lake basins. Education refers to the
38
process of informing, motivating and empowering people to be effective stakeholders.
39
Awareness involves bringing lake issues to the attention of individuals and key groups
40
with the power to influence outcomes. Awareness tends to be an agenda setting and
41
advocacy exercise meant to help people understand why lake management is an
42
important issue, the management targets, and what is being done (or can be done) to
43
achieve them.
44
45
Based on the lake briefs, a number of best practices for public participation, and tools for
46
information dissemination are summarized below. Additional information is provided in
47
Boxes 5.3 and 5.4.
48
49
�
Active participation of the local community is vital to managing lakes and
50
their resources for sustainable use. Achieving meaningful community-level
51
participation can be difficult, and depends on the degree of the community awareness
52
of the important technical and social issues. Thus, local community involvement in
53
lake management efforts should be accompanied by public awareness and
54
information campaigns. In the Lake Baringo case, for example, the awareness-
55
building program was linked to establishment of four wildlife sanctuaries managed by
56
local communities.
57
Draft Final Report: Not for Quotation or Citation
51
1
�
Effective participation of local communities depends on social
2
organization that establishes manageable groups within a community.
3
Communities may lack knowledge on how to build community institutions that
4
represent a community's diverse interest groups or the capacity to act collectively.
5
Thus, local community involvement needs to be supported by various measures to
6
develop the capability for collective actions. NGOs can play an important role in this
7
task, particularly in helping marginalized community groups.
8
9
�
NGOs can play an important role in the implementation of projects and
10
activities directed to integrated lake basin management.
11
12
Based on the experiences in this lake initiative, an important set of policy instruments
13
is the set of policies or actions that involve the public in some way, ranging from
14
relatively "soft" approaches (public information and publicity campaigns), to more
15
targeted techniques (public participation exercises, public consultation), to more
16
extreme approaches (public oversight committees with assigned powers).
17
Nevertheless, although public participation offers great potential, it is no panacea. It
18
is an essential, but not always sufficient condition, for developing and implementing
19
improved lake basin management regimes.
20
21
In almost all cases, however, the potential for using public participation and
22
awareness to improvement lake basin management are substantial. As noted in the
23
lake briefs, these approaches tend to be more successful in lakes where the
24
population is better educated, better informed and wealthier. By definition, they also
25
are usually willing to forego some present private benefit for a greater public gain. In
26
poorer societies, however, this may be a less feasible approach, since people would
27
likely be unwilling to give up any present income possibilities without some
28
alternative being available.
29
30
�
Appropriate indicators of success are needed to assess the effectiveness of
31
lake management interventions
32
Environmental and socioeconomic indicators provide a means of identifying lake
33
problems, their root causes and potential impacts, and particularly for assessing the
34
degree to which a lake management intervention has been successful (or not). The
35
SOLEC experience (State of the Lake Ecosystem Conference) in the North American
36
Great Lakes provides valuable insight into the difficulties of developing and using
37
indicators that are insightful in regarding to identifying the magnitude of the
38
management problems being faced in the lakes and their basins, as well as in
39
evaluating the success (or not) of addressing these problems (see Box 4.1). Although
40
much work remains to be done on this topic collectively by the scientific and
41
management community, there is no doubt that a set of meaningful, measurable and
42
understandable indicators represents an important means of identifying problems,
43
assessing management options, and ensuring the awareness of the public and lake
44
decision-makers of their necessity. Such indicators also can be valuable in changing
45
the community attitudes toward the need for lake management interventions,
46
including the possible impacts of what might happen if nothing is done.
47
48
Box 5.1. "Soap Movement" in Lake Biwa Watershed
A well-known example of public involvement is the case of the so-called Soap Movement in the Lake Biwa
drainage basin. The initial problem was the occurrence of red tides, and their impacts on the lake's water
quality, and a growing public awareness of the links between water quality, red tides and the use of
phosphorus-containing synthetic detergents. Started initially by a woman's consumer group, the detergent
manufacturers actively resisted change, and fought the Soap Movement. This manufacturer's resistance
resulted in an increased level of awareness about the problem throughout the Shiga Prefecture, and actually
helped ensure the very opposite result from what the manufacturers wanted (e.g., banning of phosphate-
containing detergents). In this case, the impetus for change clearly came from the people, and the government
responded to this movement with enactment of the Eutrophication Control Ordinance of 1979. The Lake Biwa
Draft Final Report: Not for Quotation or Citation
52
example illustrates the potential synergies between public involvement (crucial, but not sufficient by itself) and
government action (in this case, a regulatory policy) that resulted in an effective response to Lake Biwa's water
quality problem related to phosphate-containing detergents.
1
Box 5.2. Some Important Rationale for Public Involvement and Participation
�
In democratic societies, government policy agendas (including natural resources) are fundamentally
defined by the public;
�
Policies and decisions that include significant inputs from public participation and consultation tend
more often to be `publicly owned' than those that without such inputs;
�
Public participation allows governments and decision-makers to `tap' into local and indigenous
knowledge;
�
Stakeholders affected by management decisions will not feel that their views were not considered
(even if not completely used);
�
Large parts of lake and reservoir basins are owned by the public (individuals rather than the state) in
many countries;
�
Management decisions often can be reached more expeditiously, following public participation (i.e.,
fewer time-consuming objections);
�
It is `good business' to give the customer (i.e., the public) what it wants;
�
Best practice environmental management recognizes the good sense of proactive community
involvement and consultation.
(Source: Trudel et al., 2002)
2
Box 5.3. Best Practices for Public Participation
�
Written MOUs to denote partnerships, cooperative agreements, etc.; "soft law" can be as important as
laws and regulations;
�
Legal requirements for open information and accountability;
�
Permits for foreign investments need to include community consultation and an environment impact
assessment (e.g., fish farms for Lakes Cocibolca and Toba);
�
Engaging community groups, both formal and informal, is an effective way to involve people; formal
groups have a greater likelihood of sustaining results and activities;
�
Support for local watershed groups, etc., through small grants and other forms of technical assistance.
The best practice is to provide both project funding, and financial support for basic operating costs of
groups working to achieve basin management goals;
�
Education and Science centers are important (e.g., Lakes Chilika, Champlain, Laguna de Bay);
�
Information, education and awareness are a starting point for effective involvement;
�
Gender perspectives should be considered, including important role of women, gender training (Lake
Nakuru), sensitization to gender perspectives, etc;
�
Recognizing and building upon the connection between people and their cultural heritage, as well as
formal designations (e.g., World Heritage Sites, Biosphere Reserves, Ramsar sites);
�
Mapping the watershed and presenting it to stakeholders is fundamental to establishing a basin-wide
perspective;
�
Participatory Rural appraisal (PRA) technique has been effectively adapted and applied in several
developing country situations in Africa and Asia;
�
Involving people is essential for basin management practices related to land use for controlling soil
erosion and urban runoff through the conservation and management and management of agricultural
and forest lakes (e.g., Lake Nakuru basin);
�
Institutions, whether formal or informal, need to be created to facilitate and coordinate public
involvement;
�
Community-based (bottom-up) approaches to lake basin management help encourage participation of
citizens and stakeholders, and can lead to better management results. However, the community-based
approach must be implemented within the context of existing governance structures and in
coordination with relevant lake basin institutions
�
Involvement of citizens and stakeholders should be done as early as possible in the lake planning and
management process;
�
A democratic governance framework, although not essential, can facilitate the process. Even in highly-
developed democracies, however, it remains a challenge to get citizen involvement.
3
Box 5.4. Information Dissemination Tools
Innovative tools for dissemination information include:
Resource, education or exhibition centers--Places where information generated through research and
monitoring programs can be collected, collated and distributed through media such as print, Internet, television
and other audio-visual means. These centers also provide a focal point for organizing campaigns, public forums
and socio-cultural activities. Such centers have proven successful for Lakes Champlain, Chilika, Biwa, Nakuru
(youth hostel) and Sevan, and the Bhoj Wetlands. In the Lake Ohrid basin, "Green Centers" were established in
Macedonia and Albania to serve as clearinghouses to connect NGOs to each other and to provide the critical
information they need to mobilize public interest and action.
Draft Final Report: Not for Quotation or Citation
53
information they need to mobilize public interest and action.
Participatory Rural Appraisal (PRA) programs--An avenue for disseminating information, particularly to local
communities. They have been utilized, for example, in the Lake Baringo basin to dissemination information on
the resource values of the lake system.
Models or pilot programs--Useful for demonstrating the possibilities and advantages of conservation actions
(e.g., Lake Naivasha).
1
2
Chapter 4 material by JAD.
3
4
One important set of policy instruments or tools is the set of policies or actions that
5
involve the public in some way. These include such relatively "soft" approaches as public
6
information and publicity campaigns, to more targeted techniques like public participation
7
exercises and public consultation, and, at the extreme, public oversight committees with
8
assigned powers. Public participation offers great potential but is no panacea--it often is
9
an essential but not sufficient condition for formatting and implementing improved
10
management regimes.
11
12
In almost all cases, however, the potential for using public participation (and awareness)
13
to improve lake management are substantial (see Chapter 5 for more on the potential for
14
involving people). Not surprisingly, people-centered approaches often tend to be more
15
successful in lakes where the population is better educated, better informed, and
16
wealthier and by definition willing to forgo some present private benefit for a greater
17
public gain. Is this borne out by Briefs?? In poorer societies, this may be less feasible
18
since people are unwilling to give up any present income without some alternative being
19
offered. As seen in many locations, public consultation and participation per se are no
20
guarantee of improved or successful management--different groups can still have
21
conflicting objectives and may agree to consult on, but not abide by, the new proposals.
22
Consultation is a necessary, but by no means sufficient, condition for effective lake basin
23
management.
24
25
Of all of the policy tools available, decision makers most often underestimate the
26
potential of those policy tools that involve the public. This is in part because the very
27
process is more bottom-up and consultative while the traditional decision-making and
28
policy-making framework is top-down and dictated. Nevertheless, a number of useful
29
examples of public involvement in improved lake management are seen in the lake case
30
studies. Slower and not "openable"
31
32
One well-known example is the case of the Soap Movement in Lake Biwa. The initial
33
problem was the occurrence of red tides and a growing public awareness of the links
34
between water quality, red tides, and the use of phosphate-containing synthetic
35
detergents. Started initially by a woman's consume r group, the soap manufacturers
36
actively resisted change and fought the Soap Movement. This resulted in an increased
37
level of awareness about the problem throughout Shiga prefecture, and actually helped
38
ensure the very opposite result (e.g. banning of phosphate-based detergents) from what
39
the manufactures wanted. In this case the impetus for change clearly came from the
40
people, and government followed with the enacting of the Eutrophication Control
41
Ordinance of 1979. The Lake Biwa example nicely illustrates the synergies between
42
public involvement (crucial but not sufficient by itself) and government action (in this
43
case a regulatory command and control (CAC) policy) that resulted in an effective
44
response to the water quality problem. This instrument should be left to earlier chapter
45
or else these chapters need to be merged.
46
Draft Final Report: Not for Quotation or Citation
54
1
Chapter 6. Technological Responses: Possibilities and Limitations
2
Key Lessons Learned about Technological Responses
�
Technological interventions by themselves are not sufficient: root causes must be addressed.
�
When diverting wastewater, don't forget about the "new" downstream.
�
It is cheaper to prevent toxic contamination that to dredge a lake.
�
Extensive research is needed to ensure that the introduction of a biological agent to a lake will not
have unexpected effects.
�
If root causes of macrophytes growth (high nutrient levels) are not addressed, successful removal of
one species can just make way for another species to invade.
�
Water diversion schemes, while they may have a positive effect on the receiving basin, can be
disastrous for the exporting basin.
�
If the root cause of a problem has been controlled, then dredging can have a positive, long-term
effect.
3
4
Changing people's behavior is not easy. Whether it is done by making rules or creating
5
incentives (Chapter 4) or by internalizing new values through education and raising
6
awareness (Chapter 5), it is a challenge. Decision makers know this. And that is why one
7
of the first responses to a problem at many of the lakes in this study is a technological
8
response--a "quick fix"--one that tries to alleviate a problem, often not by addressing the
9
root causes, but by engineering a solution.
10
11
Sometimes these technological responses can have profoundly positive effects on lakes.
12
Below, we will look at cases where measures like sewage treatment, dredging, and the
13
biological agents have increased lake values. One of the key lessons of this report,
14
however, is that technological responses on their own are not sufficient and is the main
15
reason why we see a range of responses described in Chapters 4, 5 and 6.
16
17
The purpose of this chapter is to discuss the conditions under which technological
18
responses can be useful and to extract some lessons from the lake briefs. This chapter
19
examines "technical" conservation/remediation interventions that help protect a lake's
20
values and does not discuss development interventions such as fish pens and hydropower
21
dams. The technological responses described here can be broadly divided into two
22
groups: watershed-based measures (which include point and nonpoint measures) and in-
23
lake measures (which include biological, chemical and physical measures). Table 6.1
24
provides a summary of the various techniques described in the lake briefs as well as an
25
overview of this chapter.
26
27
However, the extraction of lessons about technological interventions from the lake briefs
28
is limited for two main reasons. First, the lakes selected for this project tend to be quite
29
large, so many of the techniques used at smaller lakes (e.g. water-level drawdown, deep
30
water discharge, artificial circulation, sediment oxidation) are not described. The Bhoj
31
Wetland case (the smallest lake in the sample) is an exception which illustrates some of
32
these potential techniques such as artificial aeration. A reader interested in a more
33
comprehensive survey of technological responses may wish to consult reports such as
34
Holdren et al. (2001) and National Research Council (1992).
35
36
37
Draft Final Report: Not for Quotation or Citation
55
1
Table 6.1. Summary of Technological Responses at the 28 Study Lakes
Drainage Basin-level Measures
Point source control
Nonpoint source control
Wastewater
Wastewater Treatment
Constructed
Reforestation
Problem
Diversion
Conventional
Advanced
Industrial
Wetlands
Biodiversity Loss
Lake Dianchi,
Algal
Lake Tahoe,
Lake Baikal
Blooms
Lake Washington
Lake Baringo
Extensive,
including
Bhoj Wetland
Aral Sea
Lake Chad
Lake Chad
Lake Chilika
Laguna de Bay
Lake Champlain
Lake Nakuru
Lake Naivasha
Lake Biwa,
Lake Biwa,
Lake Ohrid
Lake Ohrid
Lake Champlain,
Lake Tanganyika
Low
Lake Champlain,
Lake Constance,
Bhoj Wetland,
Extensive (see
Lake Constance,
Lake Toba
Dissolved
Lake Dianchi,
Oxygen
Lake Dianchi
Box 1 for list)
Lake Dianchi,
Laguna de Bay,
North American
North American
Eutrophication
Great Lakes
Great Lakes
Excessive
Macrophyte
Growth
Exotic Species
Lake Michigan,
Extensive (see
Pathogens
Bhoj Wetland
Box 1 for list)
Various Indian
Siltation
See above
See above
Rivers
Lake Baikal,
Lake Biwa,
Lake Champlain,
Toxic
Lake Constance,
Contamination
Lake Dianchi,
North American
Great Lakes
Water Level
Decrease
Draft Final Report: Not for Quotation or Citation
56
1
Table 6.1. (cont.) Summary of Technological Responses at the 28 Study Lakes
In-Lake Measures
Biological
Chemical
Physical
Predators
Biomanipulation
Biocides
Aeration
Dilution/
Dredging
Harvesting
Problem
Diversion
Biodiversity Loss
Aral Sea
Algal
???
Ex of algicide?
Blooms
Bhoj Wetland,
Lake Biwa,
Low
Lake Dianchi
Dissolved
Bhoj Wetland
Lake Dianchi
(Chilika Lagoon
Oxygen
for indirect
marcophyte
Eutrophication
control)
Excessive
Macrophyte
Growth
Bhoj Wetland,
Lake Kariba,
Lake Biwa,
Lake Naivasha,
Lake Kariba
Chilika Lagoon,
Lake Victoria
Lake Toba,
Lake Victoria
Exotic Species
Lake Chad,
Lake Victoria
(macrophytes
Pathogens
removal to
control vector
breeding
grounds)
Bhoj Wetland,
Siltation
Chilika Lagoon
Lake
Champlain,
Toxic
Bhoj Wetland,
Lake Dianchi,
Contamination
Lake Victoria
North American
Great Lakes
Lake Dianchi
Water Level
(Proposals at
Decrease
Aral Sea and
Issyk-kul)
2
Draft Final Report: Not for Quotation or Citation
57
1
Watershed-based Measures
2
3
Point-source Control
4
5
Wastewater Diversion
6
7
One simple way of avoiding the negative effects of wastewater on a lake is to divert it
8
outside of the basin so that it never reaches the lake. Over 100 years ago--to combat
9
typhoid and cholera outbreaks--the wastewater of Chicago was diverted from Lake
10
Michigan by an engineering project that reversed the flow of the Chicago River from its
11
original direction to Lake Michigan to the Illinois River/Mississippi River system. This
12
effectively removed the huge city of Chicago, located on the shores of Lake Michigan,
13
from the drainage basin of the North American Great Lakes. However, while it took care
14
of the pathogen problem in Lake Michigan, the water quality of the Illinois River and
15
Mississippi River suffered as a result. Similar diversions of sewage have been carried out
16
in the Bhoj Wetland case to control nutrient inflow as well as to minimize microbial
17
contamination of this drinking water source. Diversion of sewage may become an option
18
at Lake Dianchi, but only after completion of another diversion project--one that brings
19
water from outside the Dianchi basin into the basin for use in Kunming city. The reason is
20
that without the in-coming diversion, the water balance in the basin depends heavily on
21
the irrigation return flows and re-use of domestic sewage, so exporting sewage was, until
22
recently, not an option because of the need to keep scarce (yet polluted) water resources
23
in the basin.
24
25
In addition to the Lake Michigan and Bhoj Wetland, there are two classic cases of sewage
26
diversion in the literature. In the 1960s sewage was diverted from Lake Washington
27
(near Seattle in the NW United States) to the Puget Sound, which as part of the ocean,
28
was thought to have higher assimilative capacity. As a result of the diversion, the lake
29
went from a eutrophic to an oligotrophic state due to lower nutrient loading, making Lake
30
Washington a well-known lake that had been "saved". A similar scheme was carried out
31
at Lake Tahoe (on the California-Nevada border in the Western United States). Even
32
though the sewage flowing into Lake Tahoe had been treated at an advanced level, the
33
remaining nutrients were still high enough to pose a problem for this ultra-oligotrophic
34
lake. The sewage was diverted out of the basin into a constructed impoundment.
35
36
The key lesson learned from these examples is that wastewater diversion can have a
37
positive effect on a lake from which the sewage is being diverted, but it is important to
38
consider potential negative effects on the area receiving the new pollution load. That may
39
indeed be preferable in cases when a valuable lake resource is being saved is greater
40
than the costs being incurred elsewhere, including the losses suffered by people not well
41
represented in the decision-making process.
42
43
Conventional Wastewater Treatment (Primary and Secondary Treatment)
44
45
Directly treating wastewater before it gets to a lake is another major response to lake
46
problems, and one that actually addresses the root causes. This sub-section, and the two
47
that follow, look at three major types of wastewater treatment found in the cases:
48
conventional wastewater treatment (for pathogen and organic removal), advanced
49
wastewater treatment (for nutrient removal) and industrial wastewater treatment (for
50
toxic removal).
51
52
Conventional wastewater treatment is traditionally divided into primary and secondary
53
treatment. Primary treatment involves mainly physical means of treating wastewater,
54
such as sedimentation tanks, whereas secondary treatment usually employs
55
microorganisms to degrade organic material in the sewage, by processes such as
56
activated sludge or trickling filters. Conventional treatment is usually carried out at
57
centralized locations that are connected to sewerage pipes that bring in the sewage from
Draft Final Report: Not for Quotation or Citation
58
1
surrounding domestic sources, although on-site treatment is common in areas with low
2
population density. Conventional treatment removes many pathogens and much organic
3
material thereby alleviating problems related to pathogenic contamination and low
4
dissolved oxygen levels due to high organic loading. However, as discussed in Chapter 2,
5
in many cases, the main motivation for constructing a conventional wastewater
6
treatment system is the amenity and direct health benefits of sanitation it provides to
7
users--regardless of the positive effects it may have on a lake. Box 6.1 summarizes the
8
use of conventional and advanced wastewater treatment in the 28 cases.
9
Box 6.1. Conventional and Advanced Wastewater Treatment at the 28 Study Lakes
Ide (2004) analyzed the extent of sewage treatment at the 28 lakes based on per capita gross national income
(GNI) and population density. The results are summarized in the table below. The extent and degree of
wastewater treatment is indicated by the bold words in each cell (e.g., Low to High). The classes of treatment
are indicated as low = primary, medium = secondary, and high = tertiary. For lake basins with low population
density and low GNI per capita (cell I-1), almost no sewage treatment is carried out. As both income and
density increase (I-2, II-1, II-2), conventional treatment systems expand, usually with bilateral funding. For
high GNI per capita countries (III-1, III-2), even in sparsely populated areas (III-1) conventional and advanced
treatment are carried out, usually with central or local government funding. A full discussion can be found in Ide
(2004) on the CD-ROM.
Population Density
GNI per capita
1) < 100 person/km2
2) >= 100 person/km2
I-1) Malawi, George, Tonle Sap, Issyk- I-2) Victoria, Naivasha, Nakuru,
I) Low-Income Economies
Kul, Chad, Kariba, Tanganyika,
Bhoj Wetland, Toba
< US$736
Baringo, Chilika
Low to Medium (in urban area)
Rare or Low; Even not in plan
Funded by bilateral assistance
II-1) Aral Sea, Baikal, Titicaca, Ohrid, II-2) Dianchi, Laguna de Bay
II) Middle-Income Economies Xingkai/Khanka, Tucurui,
Low to High
US$736 � US$9,075
Peipsi/Chudskoe, Cocibolca
Funded by bilateral or the central
Low to Medium
government's assistance
Partly funded by bilateral assistance
III-1) Champlain, Great Lakes
III-2) Constance, Biwa
III) High-Income Economies High
High
> US$9,075
Funded by the central and local
Funded by the central and local
governments
governments
Source: Ide (2004).
10
11
Advanced Wastewater Treatment (Tertiary Treatment)
12
13
Advanced wastewater treatment, as discussed here, is simply enhanced nutrient (N, P)
14
removal at conventional wastewater treatment plants. The purpose is to cut down on the
15
load of nutrients to a lake to prevent or control eutrophication. While conventional
16
treatment removes a small percentage of nutrients in sewage, advance treatment such
17
as chemical precipitation and nitrification/denitrification can achieve up to 95% removal
18
of nutrients. Advanced treatment requires both conventional treatment to be in place and
19
additional funds for construction and operation; therefore, it is usually carried out only in
20
high-income economies like those in cells III-1 and III-2 of Box 6.1. In our 28 cases,
21
only Lakes Biwa, Champlain, Constance, Dianchi and the North American Great Lakes
22
have extensive advanced treatment facilities in place. However, in those cases, advanced
23
treatment has profoundly reduced the load of phosphorus to the lakes, a root cause of
24
eutrophication.
25
Draft Final Report: Not for Quotation or Citation
59
1
Box 6.2. Timing of Water Supply, Conventional and Advanced Wastewater Treatment Development
The cases of Lake Constance, Lake Biwa and Lake Nakuru provide contrasting examples of the timing and
methods of how infrastructure like water supply, conventional wastewater treatment and advanced wastewater
treatment are developed.
For Lake Constance, people in the lake basin have had water supply service for more than one hundred years.
Installation of a sewerage system came much later than the completion of the water supply system. In 1972
only 25% of all inhabitants in the catchment area were connected to sewage plants with biological
(conventional-secondary) treatment. However, the percentage has increased rapidly since reaching 90% in
1985 and over 95% in 2001. At the same time, the percentage of biologically-treated sewage that is also
treated with phosphorus removal systems (advanced) increased from 24% in 1972, to 88% in 1985, and to
97% in 2001.
The population coverage of water supply at Lake Biwa basin was about 30% in the 1950s, but in step with high
economic growth in Japan, the percentage increased rapidly and reached 80% in the 1960s. However, sewage
treatment systems covered only 4% until the 1980s. Drastic expansion of the sewage system in Shiga started
in the early 1980s, and current coverage is now around 70%. Interestingly, because the construction of
sewerage and sewage treatment was relatively "late", both conventional and advanced treatment systems were
constructed together from the beginning. Today, the percentage of advanced treatment in Shiga is the highest
in Japan.
In sharp contrast to the above two lakes, a full scale water supply system was first installed in the catchment
area of Lake Nakuru in the early 1990s. As a result, the old sewage treatment plant (conventional) became
unable to treat the volume of newly generated wastewater, and much wastewater began to come into the lake
without treatment. To solve this problem, a large-scale improvement project of sewage system started at Lake
Nakuru several years later. However, no advanced treatment has been installed yet. Additionally, connection to
the upgraded plant has not been completed and it is running well under capacity. This illustrates the necessity
of a multisectoral plan that considers the development of water supply system together with sewage system.
In short, water supply, sewage, and advanced treatment systems were adopted in stages at Lake Constance as
well as other lakes in most developed countries. However, both sewage and advanced treatment systems were
introduced simultaneously at Lake Biwa after the completion of water supply system. Even though Lake Nakuru
had the above-mentioned problem and does not have advanced treatment yet, it achieved the development of
water supply and sewage system almost at the same time. These facts imply that, if financial arrangements are
available, there is a possibility to develop those three systems simultaneously although stepwise
implementation of environmental infrastructure is more realistic and common. The development of
environmental infrastructure in a multisectoral manner would be more desirable to achieve long-term goals for
lake management.
Source: Ide (2004).
2
3
Industrial Wastewater Treatment
4
5
While industrial wastewater can be a source of organic matter and nutrients to a lake,
6
one of the main reasons for industrial wastewater treatment is to prevent toxic
7
contamination. The extent of industrial wastewater treatment is similar to advanced
8
wastewater treatment (discussed in Box 6.1) with some exceptions. Extensive treatment
9
with strict effluent standards is in place at Lakes Biwa, Champlain, Constance, Dianchi
10
and the North American Great Lakes. This treatment removes toxics as well as organic
11
matter and nutrients before it can reach the lakes.
12
13
At Lake Baikal, the only significant source of industrial wastewater to the lake--a pulp
14
mill--is installing a closed wastewater treatment system to control release of organo-
15
cholide compounds to the lake. Plans to control toxic effluents have been proposed for
16
Lakes Naivasha and Nakuru but are yet to be carried out. There is a special program in
17
place at Laguna de Bay that charges industries for the amount of organic matter (BOD)
18
they discharge to the lake. The brief argues that this has lead to a sharp drop in organic
19
loading to the lake (see also Chapter 8 for discussion).
20
21
In some cases, such as the Russian side of Lake Xingkai/Khanka or Lake Sevan,
22
economic downturns can lead to a drop in industrial wastewater loads--an example
23
where factors exogenous to the lake basin itself van have a great influence on the lake.
Draft Final Report: Not for Quotation or Citation
60
1
2
The main lesson regarding industrial wastewater treatment comes from the cases where
3
it was not carried out. In general, when there was a large release of toxic in a lake basin,
4
the three characteristics of lakes make clean-up a huge undertaking. Long retention time
5
means that toxic chemicals in a lake are not flushed and stay in the system for a long
6
time. Complex dynamics means that the chemicals often biomagnify, creating both
7
ecological damage and risk to humans. Transmissivity means that the problem cannot
8
usually be contained to a small area but tends to spread. As discussed latter in this
9
chapter, various remediation methods exist, but all are more expense that proper
10
treatment in the first place.
11
12
Nonpoint Source Control
13
14
Point source control is one of the first technological responses to lake problems, but even
15
in cases where it has been considered successful, nonpoint sources of pollutants often
16
remain uncontrolled and contribute to persistent problems. The Lake Biwa, Champlain,
17
Constance and North American Great Lakes Briefs all cite nonpoint sources as the main
18
challenges facing those lakes. The difficulty in controlling nonpoint sources, which include
19
agriculture and urban runoff, is that sources cannot be readily identified (complicating
20
regulation and enforcement) and usually are related to precipitation events and therefore
21
quite variable. The problem of nonpoint source pollution is compounded in many lake
22
basins by the destruction of littoral wetlands, areas that typically moderate nonpoint
23
inputs to a lake by serving as a sort of "filter".
24
25
Constructed Wetlands
26
27
Almost all the 28 lake briefs indicate some degree of human encroachment on littoral
28
wetlands. This usually results from development of lakeshore areas (urban sprawl at Lake
29
Champlain, construction of roads at Lake Biwa) or reclamation of wetlands for farming or
30
grazing. One simple way of reducing nonpoint source loads to a lake is to rehabilitate
31
these wetlands. An additional benefit is that rehabilitation helps conserve and restore
32
biodiversity. Some of the more detailed efforts include:
33
34
� The Lake Ohrid Brief describes how the 2003 "Transbouandary Watershed Action
35
Plan" signed by riparian countries provides for habitat protection and restoration
36
through wetlands inventory and the establishment of a no-net-loss policy.
37
� The Lake Chad Brief provides a good example of rehabilitation of the Logone
38
wetland in Cameroon in 1993. The embankments of the barrage along the river
39
were modified over eight years. Stakeholders and local community members were
40
involved in the planning and design of the project.
41
� The Lake Champlain Brief details how the Lake Champlain Basin Program
42
sponsored a wetland acquisition strategy that laid the groundwork for a four-
43
phase, multiyear program to permanently protect almost 9,000 acres of wetlands
44
in the Champlain Valley. By 2001, $1.4 million in federal funds had been provided
45
to the project, which had conserved 4,000 acres of wetlands and surrounding
46
areas in the Basin.
47
� The Lake Naivasha Brief shows how several of the larger farms in the basin have
48
looked at ways of improving their impact on the environment by using integrated
49
pest management to cut down on pesticides and using constructed wetlands to
50
treat their wastewater.
51
� The Aral Sea Brief illustrates international efforts by the GEF and World Bank to
52
restore wetlands on the lower Amu Darya delta.
53
54
The main lesson learned, especially for lake basins where wetlands are still in their
55
natural condition, is that wetland protection should be a top priority. If wetlands are lost,
56
the cases show that there will be an imperative in the future to replace them; therefore,
57
it is much more cost effective to avoid destruction in the first place. The activities of the
Draft Final Report: Not for Quotation or Citation
61
1
Ramsar Convention, the major international effort to promote wetland conservation and
2
restoration, are detailed in Box 6.3.
3
4
Reforestation
5
6
Like the destruction of wetlands, loss of forest cover in a lake basin also invariably has
7
negative effects on a lake, usually by increasing land erosion and sediment transport.
8
Reforestation schemes (replacing destroyed forests) are discusses in the Baikal, Chad,
9
Laguna de Bay, Nakuru, Ohrid, Tanganyika and Toba Briefs. Afforestation schemes (to
10
plant forest where it did not exist before) are described in the Baringo, Bhoj Wetland and
11
Chilika Briefs. Once again, the key lesson learned is that it is better to preserve the
12
original resource than to restore it, as will inevitably be necessary.
13
Box 6.3. Wetland Conservation: The Ramsar Convention and Lakes
One of the most important international initiatives to protect and restore wetlands is the Convention on
Wetlands (Ramsar, Iran, 1971), known as the Ramsar Convention for short. The approximately half of lakes in
this survey have Ramsar sites, which include, in some cases, both littoral areas and the lakes themselves.
The Ramsar Convention defines "wetlands" in its Article 1.1 as "...wetlands are areas of marsh, fen, peatland or
water, whether natural or artificial, permanent or temporary, with water that is static or flowing, fresh, brackish
or salt, including areas of marine water the depth of which at low tide does not exceed six metres" and Article
2.1 provides that wetlands "may incorporate riparian and coastal zones adjacent to the wetlands, and islands or
bodies of marine water deeper than six metres at low tide lying within the wetlands".
For lake systems, a detailed Ramsar Classification System for Wetland Types the classification has the following
categories:
O--Permanent freshwater lakes (over 8 ha); includes large oxbow lakes.
P--Seasonal/intermittent freshwater lakes (over 8 ha); includes floodplain lakes.
Q--Permanent saline/brackish/alkaline lakes.
R--Seasonal/intermittent saline/brackish/alkaline lakes and flats
Note that for the Convention lakes can be fresh, brackish saline or alkaline. Lakes in general are not well
represented as wetlands of International Importance, although some regions have good representation. More
importantly, the fact that the Convention urges contracting parties to manage effectively and sustainably all
wetlands, including lakes, within a contracting parties national boundaries, means the Convention process and
advice covers all lakes and the dependant biodiversity, even if some of this is migratory.
Of the Ramsar sites (wetlands of international importance) the areal extent of the 4 categories, in each of the
Ramsar regions, is shown in the Table below:
O
P
Q
R
all 4 types
Africa
14,535,913
16,253,389
1,593,452
2,294,209
24,313,987
Asia
2,904,800
1,589,078
4,100,218
2,442,435
6,118,175
Europe
15,372,268
5,807,754
3,818,388
2,172,043
16,861,747
North America
14,289,625
1,360,416
913,297
1,201,914
14,920,266
Oceania
704,720
3,609,323
477,211
1,789,330
4,982,808
Neotropics
18,751,932
11,116,523
4,391,158
8,242,720
25,440,355
World Total
66,559,258
39,736,483
15,293,724
18,142,651
92,637,338
The Ramsar Small grants fund, a rather small fund, has nonetheless funded lake projects to a value of around
CHF 950,000, helping deal with management issues for lakes with a total areal extent of 4,278,364 Ha. The
Lakes were in all regions of the world, including the following countries: Bulgaria, Former Yugoslavia, Armenia,
Georgia, Russian federation (3), Algeria, Uganda, Burkina Faso, Comoros, Togo (2), China (3), Mongolia,
Philippines, Argentina, Paraguay, Peru, Ecuador (2), and Bolivia.
The Convention will continue to promote wise management of lake systems, as part of its global approach to
wetlands and water. Approaches that emphasize the need for integrated management approach, and build on
the river basin initiative being developed between Ramsar, CBD and UNDP-GEF will continue to be advanced by
the Ramsar secretariat. Lake issues will be included in the range of issues and advices to be considered by the
next COP meeting, set for November 2005 in Kampala, Uganda.
Source: Peter Bridgewater, Secretary General, RAMSAR Convention.
Draft Final Report: Not for Quotation or Citation
62
1
2
In-Lake Measures
3
4
Biological Measures
5
6
Predators
7
8
Biological measures can be used to control either introduced nuisance species, such as
9
water hyacinth, or problematic outbreaks of endogenous species, such as excessive
10
blooms of cyanobacteria. A major reason why introduced species are often so successful
11
in new environments is because they are no longer faced with their natural enemies.
12
Thus, when Water Hyacinth is introduced (unintentionally) to a lake where these
13
pathogens and predators are absent, and where other conditions are favorable
14
(temperature, nutrients), then the growth can be explosive. These enemies of the
15
invasive species' can be introduced in order to control their rampant growth.
16
17
For example, at Lake Victoria two species of weevils (Neochetina eichhornia and
18
Neochetina bruchi) have been used successfully to combat serious infestation of Water
19
Hyacinth. Extensive research was conducted prior to the release of the weevils to show
20
the weevils would be Water Hyacinth-specific and would not result in another
21
uncontrollable distortion of the ecosystem (as occurred after the introduction of the Nile
22
Perch in the 1950s). The weevils have been successful in controlling the Water Hyacinth
23
infestation in this lake, although the reduction in the weed was probably assisted by a
24
period of extreme weather. The traditional fishing communities have been successfully
25
engaged in raising and releasing the weevils for water hyacinth control, so the program
26
can be expected to sustain itself.
27
28
In Lake Kariba, grasshoppers (Paulinia acuminata) were used to control excessive growth
29
of the invasive Kariba Weed (Salvinia molesta). The effect of these predators, along with
30
generally dropping nutrient levels, has been credited with the weed's decline.
31
32
The Lake Naivasha case notes that Kariba Weed has been on the lake since 1962 and by
33
the early 1970s it had become a major ecological problem as it covered a large portion of
34
the lake. After chemical control (see below) failed, a biological control agent Cyrtobagus
35
salviniae, a host-specific insect, was introduced and by the early 1990's had effectively
36
reduced the Kariba Weed cover to insignificant levels. Unfortunately, after the Kariba
37
Weed was controlled, Water Hyacinth was able to spread rapidly, probably due to lack of
38
competition with Kariba Weed. Water Hyacinth is now being controlled by the Neochetina
39
weevils described above. The key lesson learned is that without attacking the root causes
40
(high nutrient levels), control of one aquatic weed may just make room for another.
41
42
Fish can also be introduced to control aquatic weeds. For example, at Bhoj Wetland,
43
herbivore Grass Carp (Ctenopharyngodon idella) along with Indian Major carp were
44
introduced in the lakes to control submerged weeds such as Hydrilla, Najas and
45
Vallisnaria. In order to avoid any problems cause by breeding of the Grass Carp, triploid
46
species that do not reproduced were used. This introduction has resulted in the reduction
47
of density of aquatic weeds up to 50% and increase in fish production by 130%. Thus
48
there has been improvement of lake water quality as well as economic conditions of
49
fishermen.
50
51
Biomanipulation
52
53
Biomanipulation is the deliberate introduction of species that will affect the lake's food
54
chain in a beneficial way. The technique has been most widely used to control outbreaks
55
of nuisance algae. In the classic approach, top-level predatory fish are introduced to a
56
lake in order to reduce the populations of insectivorous fish. This, in turn, reduces the
57
pressure on invertebrates which feed on the algae. Invertebrate populations increase and
Draft Final Report: Not for Quotation or Citation
63
1
algal numbers decrease. While the technique has been successful in trials, it has not
2
proven sustainable in the long-term. There are too many alternative food pathways and
3
too many other influences on algae for the technique to be reliable. In addition, it
4
requires a detailed knowledge of the aquatic ecology of the lake and the long-term
5
presence of ecological monitoring. For these reasons, its use has been confined to lakes
6
in the developed world and even there it is not in widespread use.
7
8
Chemical Measures
9
10
Biocides
11
12
Another possible technical response is to apply a chemical to a lake to control an algal
13
bloom or to kill an invasive species. While bio-degradable chemicals can often be used to
14
contain unwanted side-effects of a chemical, the cost is usually prohibitive is the
15
infestation is extensive. For example, herbicides have been used at Lake Kariba to control
16
both Water Hyacinth and Kariba Weed but given the scale of the infestation, it was shown
17
that chemical measures would be uneconomical. In addition, there is usually a strong
18
public reaction against these methods, even when biodegradable chemicals are used. For
19
this reason, this approach is not very common.
20
21
Physical Measures
22
23
Aeration
24
25
The decay of organic matter in a lake, either because of high organic loading from the
26
watershed or from the decay of algal blooms, can lead to low dissolved oxygen (DO) in a
27
lake. Low DO can lead to fish kills and the denial of benthic waters to commercially and
28
ecologically important species. One short-term way of dealing with the problem is to
29
inject more dissolved oxygen into the low DO area, usually the bottom of the lake. This is
30
only viable in the smallest lakes. For example, aeration has only been used at the
31
smallest lake in our study, the Bhoj Wetland, where a total of 15 aeration units have
32
been installed to oxygenate the bottom water. This has not only caused improvement in
33
water quality but has become a tourist attraction. Naturally, this effort does not attack
34
the root cause of low DO levels which is high organic loading and eutrophication of the
35
lake.
36
37
Freshwater Diversion into a Basin
38
39
In cases where water in a lake basin is in short supply or when a lake has been heavily
40
polluted, another physical countermeasure is to bring more water in from outside the
41
basin. Adding more water to a lake and/or its basin can alleviate a water shortage or it
42
can serve to dilute already polluted water, thereby lowering the concentration of
43
pollutants in the lake. While bringing in more water does not address the root causes of
44
any problems (inefficient water use, overuse, or pollution), it is nevertheless used in
45
some cases.
46
47
For example, to alleviate a chronic water shortage in the Lake Dianchi basin caused by
48
rapid population growth in a water scarce area, a water transfer scheme from the
49
Zhangjiuhe River (a tributary of the Jinsha River which is located downstream of the
50
Dianchi Basin) is under construction (expected completion date of 2005/6). The project
51
will bring in about 245 million m3 of water into Kunming for the purpose of the city's
52
water supply. Additionally, the Aral Sea brief notes that "during the latter part of the
53
Soviet period, water managers in Moscow and in Central Asia proposed diversion of
54
massive flow, up to 60 km3, from Siberian rivers to the region as the panacea for
55
perceived water shortage problems. Although real and serious potential ecological threats
56
(of regional, not global magnitude as claimed by some opponents) were given as the
57
chief reason for canceling the project, economic considerations were the fundamental
Draft Final Report: Not for Quotation or Citation
64
1
factors in this decision." The Issyk-kul brief also mentions similar yet-to-be-implemented
2
schemes to transfer water into the basin in order to maintain development of irrigation
3
(in the Issyk-kul basin), and also to maintain the current water balance and water level
4
of the lake.
5
6
A unique "diversion" scheme is currently taking place at the Aral Sea (apart from the
7
proposal discussed above). Desiccation of the Aral Sea, due to diversions of inflowing
8
rivers, has lead to the split-up of the lake into three parts (as of 2004). A small dam has
9
been built between the Small Aral in the north and the Large Aral in the south. The dam
10
is used to retain water in the smaller yet deeper northern part; without the dam, water
11
would continue being lost from the Small Aral to the Large Aral, where it tends to be
12
rapidly lost due to high evaporation. It is expected that the Large Aral will completely dry
13
up in the mid-term, but with this "diversion", the Small Aral will stabilize and a portion of
14
the biodiversity of the original Aral Sea will be maintained.
15
16
A key lesson from these diversion schemes is that, while they may have a positive effect
17
on the basin that receives that water, there is undoubtedly a negative effect in the basin
18
that loses the water. As discussed in Chapter 2, there have been numerous diversions
19
from lake basins (e.g. Aral, Baringo, Chad, Nakuru and Sevan), all with large, often
20
unexpected, negative effects. Proposed schemes of water transfer from Lakes Naivasha
21
and the North American Great Lakes have not been carried out, in part due to the
22
knowledge of these negative experiences and economic reasons.
23
24
The use of transferred water to "dilute" a polluted lake is more common at small lakes
25
than at the type of lakes in our survey. However, one of the purposes of the Lake Dianchi
26
diversion discussed above is to change the flushing rate of the lake in order to decrease
27
the hypereutrophic conditions that currently prevail. The Lake Ohrid case discusses how a
28
large river (Sateska) was diverted from its natural course, which originally flowed to a
29
point outside of the Lake Ohrid basin, to a new course within the basin that was designed
30
to drain a marshland for farming and to increase the hydropower potential of the lake.
31
The purpose was not to "dilute" the water of Lake Ohrid, which at the time was
32
oligotrophic, but the effect of the diversion was to increase the size of the Lake Ohrid
33
subwatershed by about 174%. The problem was that this new inflow brought with it a
34
large load of sediment and organic matter that has had a negative effect on the lake.
35
36
Nevertheless, it is obvious that the proverb "dilution is not the solution to pollution" is
37
perfectly correct. Given the transmissivity of lakes, even if a greater water volume is
38
somehow attained, it is only a matter of time before the pollution spreads. In fact, the
39
Lake Ohrid case shows that "dilution" can actually be a cause of "pollution". A key lesson
40
from these diversion schemes is that, while they can have a positive effect on the basin
41
that receives that water, there is usually a negative effect in the basin that loses the
42
water and sometimes even in the lake receiving the additional water. Very thorough
43
studies need to be carried out in advance to understand these likely consequences. Again
44
it is a matter of balancing these benefits against the costs and taking into account the
45
equity issues in any such water transfers.
46
47
Dredging
48
49
The removal of sediment from lake bottoms by hydraulic dredging is a common activity
50
to removed excess silt, nutrients, and toxic compounds. For example, changes in basin
51
land use led to large increases in sedime nt loading to both the Bhoj Wetland and Chilika
52
Lagoon. For the Bhoj Wetland, the deposition of silt had created a land mass formation at
53
confluence points which resulted in decrease in storage capacity and surface area, as well
54
as the obstruction of the lake's outlet. Silt was removed from the upper and lower lakes
55
by both hydraulic and dry excavation means, increasing the capacity of the lake by 4%.
56
The excavated materials were used to convert previously barren lands into productive
57
lands for agriculture. At the Chilika Lagoon, siltation of the outlet of the lake resulted in a
Draft Final Report: Not for Quotation or Citation
65
1
decrease in salinity which caused both a decline in the native fisheries as well as an
2
increase in invasive macrophytes growth. A new channel to the ocean was dredged and
3
the salinity returned to normal conditions, leading to a dramatic recovery of the fishing
4
and prawn industries. There was also a decrease of the area covered by invasive species
5
and substantial increase in the weed free zone consequent upon desiltation operation.
6
7
Dredging of sediment is also sometimes used to remove internal sources of nutrients
8
(usually phosphorus) in shallow, eutrophic lakes or toxic contaminants. For example, the
9
Lake Biwa, Bhoj Wetland and Lake Dianchi cases all describe how dredging was carried
10
out to remove phosphorus-laden sediment. In another example, 140,000 tons of PCB
11
contaminated sludge were removed from the sediment of Cumberland Bay in Lake
12
Champlain at a cost of US$35 million. Similar programs have been used to remove toxic
13
contaminants from the North American Great Lakes and heavy metals from Lake Dianchi.
14
However, the sediments of a lake are part of a complex ecosystem harboring benthic
15
organisms that act as food for higher trophic levels and provide services such as removal
16
of nitrogen. Removing sediment invariably destroys these functions.
17
18
The key lesson from these dredging activities is that, if the root cause of the problem
19
(excess siltation, nutrient loading or toxic contamination) has been controlled, then
20
dredging can have a positive effect on a lake. However, dredging, by itself, without load
21
control is not cost effective and only a temporary measure and may destroy important
22
ecosystem functions.
23
24
Harvesting
25
26
In many cases, excessive macrophyte growth impedes boat traffic, blocks irrigation
27
channels, interferes with hydropower generation and water treatment plants as well as
28
degrading recreation values. Infested areas can also foster the spread of vector-borne
29
diseases. Harvesting these macrophytes can be a relatively quick and direct way to
30
remove the nuisance weeds as well as the nutrients and any toxic chemicals they may
31
have accumulated.
32
33
The Bhoj Wetland, Lake Biwa, Chilika Lagoon, Lake Toba and Lake Victoria briefs all
34
discuss how harvesting has been carried out for a variety of reasons. Of special interest
35
are the harvesting programs at Lakes Toba and Victoria which have relied heavily on
36
community involvement. The harvested weeds can sometimes be turned into an
37
economic good by local communities. In the case of Lake Victoria, the weeds were used
38
for handicrafts. However, harvesting is usually a temporary measure that does not
39
address the root causes leading to excessive macrophytes growth.
40
41
Draft Final Report: Not for Quotation or Citation
66
1
Chapter 7. Informing the Process: The Role of Science and
2
Monitoring
3
Key Lessons Learned about Information
�
Information is costly and never complete so lack of complete information is not a reason for delaying
action (note LLDA's "Ready, fire, aim!")
�
Local knowledge is often overlooked but can be invaluable; make efforts to tap this source.
�
Sharing and utilizing the collective knowledge base for lake management requires ensuring that all
relevant stakeholders are involved at the beginning in identifying lake problems and helping to
formulating realistic solutions for them.
�
Information not properly "translated" into the language of decision makers and stakeholders is wasted.
�
Resident scientific institutions are better than teams of scientist brought in for short-term studies. The
nature of lakes (long water residence times and complex dynamics) makes long-term commitment
particularly valuable.
�
The entire lake basin, not just the lake itself, must be a part of any monitoring program.
�
Keep things simple: Simple models can often provide management information equal to that obtained
from complex models.
4
5
Information Needs for Lake Basin Management
6
7
Information is necessary for good decision-making, but is costly and never perfect. This
8
is the dilemma facing all decision makers--how to balance the need for further study with
9
the need for action. In the absence of any good information, a decision maker could
10
simply flip a coin and hope for the best: this is obviously not desirable. Nor is it desirable
11
for the decision-making process to be paralyzed because 100% certainty has not been
12
obtained about the current state of a lake basin or about the effects a range of policies
13
may have on it. This chapter draws lessons from the 28 cases on the search for an
14
appropriate balance.
15
16
Information comes in a variety of forms. Many readers will immediately think of
17
"scientific information", such as the values of measured parameters like dissolved oxygen,
18
nutrient concentrations and biomass counts that come from scientific studies and
19
monitoring programs. The use of this "hard" information is indeed important and forms
20
the bulk of this chapter. When devising and implementing policies, however, it is also
21
very important to know socio-economic information about the watershed; to know about
22
cultural values and people's view of the resource; to know about the institutional and
23
policy frameworks that exist--to know what is possible and what is not (see Box 7.4).
24
25
Another valuable source of lake information resides in the memories and experiences of
26
indigenous people living along a lakeshore or in lake basin communities. Often this local
27
knowledge can augment scientific information. In the absence of long-term monitoring
28
programs, it may be the only source of information about a given lake. Thus, in the
29
absence of scientific data, the Ugandan government has been able to use local
30
knowledge to identify and protect important fish breeding areas on the eastern shore of
31
Lake Albert on the border between Uganda and The Democratic Republic of the Congo.
32
33
No matter what form information takes, the long retention time, complex dynamics, and
34
transmissivity of lakes, mean that good information is particularly valuable in the
35
decision-making process because the cost of a mistake (or missed opportunity) can be
36
very high. Reflecting the experience presented in the 28 cases, this chapter first
37
discusses the uses (and "non-uses") of science, then covers monitoring as a special topic
38
before considering lessons learned on how information is shared and how information
39
gathering is carried out
40
41
Use of Scientific Information
42
43
The lake briefs contain many examples of how the use of science and other types of
44
information has led to better decision-making. The cases show that science is used in
Draft Final Report: Not for Quotation or Citation
67
1
three main ways: (1) to show the limits of resource, (2) to enlighten hard-to-see
2
connections and (3) to provide novel/innovative solutions.
3
4
Showing limits to a resource
5
6
Fishing is one of the main resource uses in many of the lakes in this survey; overfishing
7
is one of the main problems. Overfishing threatens lake ecosystems and livelihoods built
8
upon them, especially in developing countries. One of the key contributions of scientific
9
studies has been information leading to moratoria on fishing (e.g. Lakes Baringo and
10
Naivasha) or restrictions on allowable technologies (e.g. Lakes George, Ohrid, and
11
Victoria). As a result of the policies based on this information, these fisheries have either
12
recovered, or are in better shape than they would have been without the policy change.
13
14
Another common problem facing many lakes is eutrophication, caused by excessive
15
nutrient load (usually phosphorus; occasionally nitrogen) generated from human
16
activities in a lake's drainage basin (and sometimes beyond). As illustrated in Figure 1.1,
17
a lake can absorb a certain quantity of nutrient load without showing dramatic changes.
18
However, there also is often a point at which the loading becomes excessive, leading to a
19
major (usually undesirable) shift or imbalance in the lake ecosystem. The extent of the
20
nutrient load, along with information on how much is "tolerable" is a key contribution of
21
science. The briefs on Lakes Champlain, Constance and the North American Great Lakes
22
show how far science can actually go in aiding the decision-making process. For example,
23
based on a comprehensive modeling exercise, the United States and Canada acted jointly
24
to reduce the phosphorus load to the Great Lakes, mainly by enhancing phosphorus
25
removal at wastewater treatment plants and by banning P-containing detergents in the
26
drainage basin. It is interesting to note that, even though this polic y was successful in
27
controlling much of the point-source load to the lakes, recent study has shown that
28
nonpoint sources also must be controlled to fully meet the targets. The Lake Baikal brief
29
also demonstrates how scientific study can reveal that, contrary to popular opinion,
30
nonpoint sources can be a major threat to a lake.
31
32
Enlightening hard to see connections
33
34
Lakes are complex. It is not enough for humans to rely on gut feelings arising from
35
everyday experience, because human judgment is not necessarily suited to
36
understanding complex ecosystems. A key role of science, therefore, is to shed light on
37
hard-to-see, indirect connections that are common in lake management. Some examples
38
include the following:
39
40
� For Lake Naivasha, there was a controversy about the causes of the declining
41
water level. A simple model was developed, making use of long-term monitoring
42
data, to show that abstractions for horticulture and not other causes, such as
43
climate variability, were almost certainly responsible for the decline in lake level.
44
As a result, there was widespread acceptance of this cause and an understanding
45
that different interest groups needed to work together to use the lake's resources
46
equitably. (See Box 7.1 for a fuller discussion.)
47
� For Laguna de Bay, scientific investigations showed the negative effects of a
48
hydraulic control structure (designed to stop salt water intrusion from the ocean)
49
on the lake fisheries. Eventually, it was decided to halt operation of the structure,
50
allowing natural salt water intrusion occur again, resulting in a decrease in
51
turbidity and improved conditions for fisheries.
52
� For Lake Biwa, it was shown that decreasing snowfall amounts over the last few
53
decades along with a weakening of the spring overturn (both possibly related to
54
climate change) led to a decrease in the transfer of large amounts of dissolved
55
oxygen (from snowmelt and from the atmosphere) to the hypolimnion every
56
spring, resulting in possibly anoxic conditions at certain times, with the potential
Draft Final Report: Not for Quotation or Citation
68
1
for large-scale phosphorus release from sediments and a rapid worsening of the
2
eutrophic conditions.
3
� For the North American Great Lakes, research has shown the connection between
4
fossil fuel burning at distant power plants and mercury deposition to the lakes.
5
These sources are mo stly outside of the watershed but part of the "airshed" and,
6
therefore not one of the first pollutant sources normally considered by decision
7
makers.
8
� For Lake Victoria, recent studies (Hecky 2004 on CD-ROM) suggest the role of
9
atmospheric deposition of phosphorus to the lake has been greatly
10
underestimated. If confirmed, this unexpected pathway could have major
11
implications for managing the lake.
12
Box 7.1. The Value of Long Term Monitoring and Simple Modeling at Lake Naivasha
For over 100 years, Lake Naivasha in Kenya had attracted the attention of hydrologists, partly because of the
extreme decade-to-decade changes in its surface area, and partly because it remained fresh even though there
is no surface outlet. The first phenomenon was eventually explained as being the result of the shallow
bathymetry of the lake coupled with climate variability, while the second was found to result from groundwater
outflows that carried away dissolved salts.
The lake's water balance became more than a scientific curiosity when, in 1982, a vegetable grower successfully
switched to raising flowers for the cut flower trade. This success rapidly led to much of the land around the lake
being converted from grazing and cropping to intensive horticulture. By the early 1990s over 100 km2 had been
converted to grow flowers for the European cut flower trade. With this growth came an influx of workers. Water
was abstracted from the lake, the local aquifers, and the inflowing rivers for the horticultural industry and for
domestic use by the rapidly increasing population.
The Lake Naivasha Riparian Association (LNRA), representing landowners and others around the shores of the
lake, feared that the lake's water was being over-used by this new development. They also were concerned
about pollution of the lake and aquifers from agro-chemicals used by the horticulture industry. However, many
horticulturalists did not believe that they were over-using the water resource and pointed out that the lake was
higher than it had been in the 1950s prior to the development of their industry. They, in turn, formed the Lake
Naivasha Growers Group (LNGG) to counter these and other claims about their industry.
In 1996 the LNRA asked the Ministry of Water Development to study the water balance and
the water related environmental impacts. This study was carried out in close collaboration with ITC in the
Netherlands. This study was able to settle the issue of lake water use by developing a simple, spreadsheet
based water balance model of the lake and its catchment. The model required data on the inflows from the two
major rivers; direct rainfall onto, and evaporation from, the lake's surface; and observed lake level and
bathymetry. These data were available from a variety of sources--government and private sector--for a period
from 1932 to the present day (some of the data, such as the local rainfall, were available from 1901).
If a groundwater outflow of 4.6 million m3 per month was allowed for, then the model was able to reproduce the
observed lake level from 1932 to 1982 with remarkable accuracy (Figure Box 7.1). 95% of all observed monthly
lake levels differed from the modeled levels by 0.52m or less over this period. This accuracy makes the growing
discrepancy between the observed and the modeled lake levels after 1982 all the more striking. By 1997 the
observed level was 3-4 m below that predicted by the model if there had been no abstractions.
observed lakelevel
calculated lakelevel
1894
1892
Start lake exploitation
1890
1888
1886
lakelevels 1884
Difference between exploited and
1882
unexploited basin approx 3 meters
jan-32
sep-45
mei-59
jan-73
okt-86
jun-00
Date
Draft Final Report: Not for Quotation or Citation
69
Figure Box 7.1. To be reformatted (color removed, dates put into English) with data provided from original
author.
This argument was strengthened by the coincidence between the onset of this decline in water level and the
commencement of horticulture in the area in 1982, and the close match between the annual water deficit by
1997 (60 x 106 m3) and the estimated water use based on the area of horticulture and the crops grown.
These results are now broadly accepted by all within and outside the horticulture industry around Lake Naivasha
as showing that the rapid development of the industry and the increase in domestic demand has had a
significant impact on the lake level. The LNRA and the LNGG now work more closely together to promote a
stronger conservation ethic amongst horticulturalists and to protect the lake's values. Apart from the results of
the water balance study the LNGG understand the importance of their activities on the lake.
This conclusive result could not have been achieved without access to long�term reliable monitoring data. It
was the closeness of fit between the modeled and the observed lake levels prior to 1982, as much as the steady
divergence thereafter that added to the power of the results.
A second notable feature was the simplicity of the modeling. The spreadsheet-based water balance was simple
enough to be transferred and used by the LNRA without requiring specialist modeling expertise.
Source: R. Becht and D.M. Harper 2002. Towards an understanding of human impact upon the hydrology of
Lake Naivasha, Kenya. Hydrobiologia 488 1-11.
1
2
Providing Innovative/Novel Approaches (to solve conflicts)
3
4
Finally, science can be used to develop innovative and novel approaches to address a
5
range of lake problems. Some of the major examples from the cases include:
6
7
� For the Chilika Lagoon, modeling studies showed how dredging a channel between
8
the lake and the ocean could improve salinity conditions and fishery production in
9
the lake. The channel was dredged, leading to a dramatic recovery in the fishery
10
and prawning catches. Apart from restoring livelihoods fisherfolk, this action also
11
alleviating a major source of conflict among the local communities.
12
� At Lake Kariba, ecological studies showed how introduction of a fish (Limnothrissa
13
miodon) into an ecological niche opened up by the formation of this reservoir
14
provided a commercially valuable fishery.
15
� For Lake Chad, test releases from the Tiga and Challawa dams showed that such
16
releases could perfectly simulate wet season conditions. This demonstrated that
17
the dam outlets and the Hadejai barrage were adequate for generating artificial
18
flooding in most wetlands in the river system, a previous source of conflict in the
19
drainage basin.
20
� For the Bhoj Wetland, high levels of heavy metals were shown to result from
21
immersion of idols during religious festivities, an unlikely but significant source.
22
Research was used to quantify the problem and show how a solution (moving the
23
ceremony to another site) was possible.
24
� For the Aral Sea, scientific studies indicated that construction of a dam between
25
the Small Aral and Large Aral seas could maintain the current (greatly reduced)
26
size of the Small Aral given the reduced inflows, and with it, some of the lake's
27
biodiversity and livelihoods for local people.
28
29
A Note on Modeling
30
31
The term "modeling" probably conjures up images of computers and mathematics for
32
many readers. But models are not necessarily complex, mathematical or even run on a
33
computer. Actually, they can be quite simple: anything that is a generalization of reality
34
that used to gain deeper insight can be is a model. This section on "Use of Science" can,
35
in fact, be thought of as a model: we proposed that science is used for three main
36
purposes in lake basin management; we use case studies to test the "model"; we hope
37
the "model" will be used by readers to better understand the use of science at their own
38
lakes.
39
Draft Final Report: Not for Quotation or Citation
70
1
The point is: a wide range of models has been used the lakes in this survey; some are as
2
simple as a thought in a decision maker's head like "Nutrients cause eutrophication; our
3
lake is eutrophic; let's cut down on nutrient loading"; some are as complex as three-
4
dimensional, time-varying, ecological-physical models. A complex hydro-dynamic model
5
of circulation patterns was used to assess the likely benefits from different lake openings
6
in Chilika Lake before the new opening was dredged to the ocean. On the other hand, a
7
model was constructed of Lake Victoria but it has not proven useful to understanding the
8
processes in the lake or been influential with decision makers because of its complexity
9
and data demands. In the case of the North American Great Lakes, the issue of model
10
complexity also was illustrated. Five different eutrophication models, ranging from simple
11
phosphorus loading graphs to multi-dimensional, time -varying models, were used to
12
determine the phosphorus target loads for the North American Great Lakes (GLWQA,
13
1978). Despite the range of complexity in the models used, however, they tended to
14
converge on the same target numbers, implying that the simple models were sufficient.
15
Lake Naivasha (Box 7.1) provides another example where a simple, spreadsheet models
16
proved to be influential in management.
17
18
Overall, the cases indicate that it is important that lake modeling efforts be tailored to
19
the lake being modeled, including ensuring that the model is no more complex than is
20
needed to meet the modeling objective. It is essential that the model design is driven by
21
the managers and other stakeholders and not by the model developers. Initial
22
brainstorming sessions between lake stakeholders and model developers can
23
substantially facilitate this goal. Further, a model for a given lake should not be
24
developed without the participation of local experts and officials in its development, as
25
well as those ultimately responsible for its long-term use and refinement. In the absence
26
of specific data and information for a lake being modeled, initiation of specific monitoring
27
also may be required to obtain such data. A conceptual model developed at an early
28
stage of a lake management project can help identify data needs and required sampling
29
and monitoring efforts, thereby saving both human and financial resources.
30
31
It is noticeable how often simple models have proven successful. The lesson is not that
32
simple models are best--it is doubtful if the Chilika Lake requirements could have been
33
met with a simple model--but that the complexity of the model needs to be matched to
34
the capacities of the users, the data available and the demands of the task. If the model
35
development is driven by technological possibilities and not by the needs of the decision
36
makers, then it is very likely that the model will not be used.
37
38
"Non-use" of Science
39
40
The lake briefs also show how a lack of scientific information can constrain the decision
41
making process. There are a number of cases where science could have been used
42
effectively, but was not. For example, the lake briefs cited the need for scientific studies
43
to show:
44
45
� The effects of climate change versus local water withdrawals on lake levels in
46
Lakes Chad and Baringo;
47
� The limits to grazing in Lake Baringo;
48
� The limits of irrigation on Lake Chad and the Aral Sea;
49
� The effects of aquaculture on Lake Toba;
50
� The effect of future upstream dams on Tonle Sap; and,
51
� The effects of siltation/nutrient loading, before it becomes a major problem, at
52
Lakes Malawi and Tanganyika.
53
54
The briefs also show how scientific knowledge may have influenced policies before they
55
were implemented. Examples include:
56
Draft Final Report: Not for Quotation or Citation
71
1
� Health problems resulting from the unexpected release of airborne particles from
2
the exposed lake bed of the desiccated Aral Sea;
3
� Ecological studies might have shown the detrimental effects from lowering the
4
level of Lake Sevan for hydropower and irrigation; and,
5
� The effects of soil erosion and nutrients from human wastes on the eutrophic
6
status of Winam Gulf in lake Victoria may have been better appreciated by
7
decision makers if scientific studies had been carried out some years ago.
8
9
While the briefs do not speculate on why scientific studies were not carried out in these
10
and similar cases, it is possible to use experience from scientific input to management in
11
other fields to suggest the causes. First, decision makers often see scientific inputs as
12
time-consuming, expensive and inconclusive when they need to make decisions quickly.
13
It can be as difficult to persuade scientists that an imprecise but timely answer is
14
required as it is to persuade decision makers that a delay of a year while waiting for
15
factual information can be highly cost-effective in the long-term. Secondly, scientists are
16
often poor communicators with both decision makers and stakeholder groups. They can
17
have difficulty in expressing their findings in ways that have meaning to non-scientists.
18
Thirdly, it can be very difficult to get scientists from disciplines as diverse as sociology
19
and hydrology to work together. This integrative approach to scientific studies is
20
particularly necessary in understanding lake basins where so many processes (terrestrial
21
and aquatic; biophysical and socio-economic; physical and ecological) interact. Finally, it
22
is worth stating that these typical difficulties affect scientific studies in the developed
23
word as much as they affect the developing world.
24
25
Value of Monitoring
26
27
Without carrying out special scientific studies or developing models, simple monitoring of
28
a lake and its basin can provide valuable insights into a lake's baseline condition, its
29
change over time including the effects of a given policy.
30
31
To assess baseline conditions
32
33
One key purpose of monitoring is to understand the baseline or "normal" conditions of a
34
lake in order to inform policy. Such monitoring programs have been in place at all of the
35
study lakes located in developed countries and in some of the developing countries such
36
as at Laguna de Bay in the Philippines. Two other examples from developing countries
37
illustrate the value of baseline monitoring:
38
39
� The Lake Nakuru brief notes that the monitoring data demonstrate the high
40
degree of natural variation that can occur in the lake's water levels due to high
41
levels of evaporation and water abstractions, as well as influences from more
42
global phenome na, such as global climate change. All are causing dramatic
43
changes in the lake's limnological characteristics. By having information on this
44
natural variation, decision makers are better positioned to recognize and evaluate
45
the impacts on the lake from human activities in its drainage basin.
46
� Monitoring data collected over the past several years at Lake Ohrid suggest that
47
both the phytoplankton and zooplankton communities in the lake are changing,
48
consistent with the increasing eutrophication of the lake. This baseline monitoring
49
makes it unequivocally clear to the basin communities that there is a need to
50
control nutrient loads to the lake.
51
52
While long-term monitoring is most desirable for providing a baseline, even short-term,
53
historical studies can also prove valuable. For example, Talling's work on Lake Victoria in
54
1961 provides an invaluable baseline on the condition of the lake 40 years ago and was
55
has been used in recent times to show that the lake has changed dramatically from a
56
diatom-dominated to a cyanobacterially-dominated lake. In another example, various
Draft Final Report: Not for Quotation or Citation
72
1
studies on the endemic species of Lake Dianchi in the 1950s, have proven useful in
2
understanding past conditions in that lake and on the need for biodiversity conservation.
3
4
To assess effects of a policy
5
6
Decision makers need monitoring of a lake's condition after the implementation of a
7
policy change, to properly evaluate the effectiveness of the policy. As discussed in
8
Appendix A, when evaluating policies, it is important to use a with/without project
9
(policy) analysis. The Lake Dianchi brief shows how, even though the pollution load to
10
the lake has increased in recent years, polices have led to a divergence between the load
11
generated at source, and the load entering the lake. Without good information on loading,
12
the current policies would probably be declared a failure, when in fact they have had a
13
positive effect. The Lake Titicaca brief argued that monitoring made it possible to
14
establish clear priorities during the execution of the Master Plan for Flood Prevention and
15
Resource Management in the basin. On the other hand, the Lake Chad brief noted that,
16
because of the absence of international monitoring bodies, past agreements on the
17
conservation and development of basin resources could not be enforced, resulting in
18
detrimental impacts on the lake ecosystem.
19
20
What to monitor
21
22
Experience in monitoring lakes around the world has demonstrated that some
23
parameters that are relatively simple-to-measure can provide a great deal of insight into
24
the condition of a lake and its resources. A list of fundamental in-lake parameters is
25
provided in Box 7.2. Although many additional in-lake and laboratory measurements can
26
be very helpful (e.g., types and numbers of different algal species; composition of rooted
27
plants), the list in Box 7.2 can provide a reasonably accurate picture of the major
28
problems facing a lake. However, it will not necessarily indicate the sources of these
29
problems. Because the lake drainage basin is the place where human activities occur, and
30
the root causes of most lake problems, information on drainage basin characteristics may
31
also be needed to help identify sources of lake problems.
32
Box 7.2. Easily obtained parameters for evaluating lake conditions
�
Water flushing rate: The faster the flushing rate, the faster a pollutant will be flushed from a lake
(assuming the pollutant input has been reduced or eliminated). This is a function of both lake
volume (how much water the lake contains) and the water inflows and outflows (the rate at
which water enters and leaves a lake, including that lost to evaporation);
�
Water transparency: The clearer and more transparent the water, usually the better the water
quality;
�
PH: This is a measure of the acidity of water. Fish cannot survive above a certain level of acidity;
�
Specific conductance: A measure of the quantity of dissolved minerals (e.g., calcium, magnesium,
sodium, potassium) in the water, typically the higher the specific conductance, the higher the
mineral concentration;
�
Dissolved oxygen concentration: The lower the oxygen concentration in the water, the greater the
likelihood the oxygen-consuming organisms (especially fish) will be affected. Further, a low
oxygen concentration can accelerate the release of nutrients from sediments at the bottom of
lakes;
�
Biological oxygen demand (BOD) and chemical oxygen demand (COD): These tests provide
information on the possibility of pollution from organic substances. A special concern exists in
regard to synthetic organic materials (DDT, PCBs, dioxin), which are carcinogenic and can
bioaccumulate in the tissues of aquatic and terrestrial organisms, including humans.
�
Nutrients: Phosphorus (and nitrogen in some cases) is considered to the nutrient controlling or
limiting the maximum biomass of algae and aquatic plants. The higher the concentrations of the
biologically-available forms of these nutrients, the greater the potential for nuisance algal blooms
and other eutrophication symptoms in a lake;
�
Temperature: This parameter has important implications for the physical structure of the water
column, as well as maintenance of aquatic life (especially fish). Temperature also controls the
rate at which various biophysical and chemical reactions occur;
�
Chlorophyll concentration: As a measure of algal biomass (quantity), the larger the chlorophyll
concentration, the greater the possibility that the lake will experience nuisance algal blooms and
other eutrophication symptoms.
�
Heavy metal concentration: Certain heavy metals, particularly those that can bioaccumulate in
Draft Final Report: Not for Quotation or Citation
73
the tissues of aquatic and terrestrial organisms, including humans (e.g., lead, mercury), are
toxic. The higher the concentration, the greater the potential for negative impacts.
1
2
A Note on Serendipity
3
4
Long-term monitoring, even when carried out without an immediate purpose, can have
5
serendipitous effects. For example, the Lake Biwa brief highlights how long-term records
6
of parameters as diverse as snowmelt, temperature, and dissolved oxygen in the
7
hypolimnion all subsequently came together to give indications about the potential
8
effects of global warming on the lake. The North American Great Lakes brief also notes
9
that both formal and informal data sets "become invaluable in monitoring and
10
interpreting ecosystem changes often unrelated to the purpose for which the data were
11
originally collected."
12
13
Sharing Information
14
15
The Lake Nakuru illustrates an important point; the need ensure that research and
16
monitoring findings are available in simplified language that decision makers and
17
resource users can understand. The key lesson learned is that the value of science and
18
monitoring as information for policy makers evaporates if the results and their meaning
19
are not properly transmitted. Some ways in which information can be successfully shared
20
include the following.
21
22
Use of Indicators
23
24
While some of the parameters presented in Box 7.2 are easily understood by the public
25
and decision makers, many are not. Transparency is a fairly easy concept (the less "stuff"
26
in the water, the clearer it is; therefore, the deeper one can see into the water); In
27
contrast, the Chemical Oxygen Demand is not. In fact, even professionals can make
28
mistakes about the type of COD measured (e.g., was the oxidizing agent manganese or
29
chromium?). To make the sharing of information as easy as possible, many of the lakes
30
in this study have developed "indicators" of various types of describe lakes or basin
31
conditions.
32
33
For example, the development of easily understood indicators has been the subject of
34
major biennial conferences in the North American Great Lakes basin (described in Box
35
7.3). For Laguna de Bay, the Laguna Lake Development Authority has shown
36
considerable progress in presenting water quality data in a simple schematic diagram
37
called the Water Mondriaan. Inspired by the work of Piet Mondriaan, a famous Dutch
38
painter, it presents technical information in the form of simple lines and colors in an
39
easily understood format for the public and decision-makers. For its International Waters
40
Projects (including # of our study lakes), the GEF has developed a suite of indicators
41
(process indicators, stress reduction indicators, environmental status indicators) which
42
are flexibly applied and can allow for easy evaluation of project progress (Duda 2002).
43
Box 7.3. Evolving Indicators: The State of the Lakes Ecosystem Conference (SOLEC)
The purpose of the U.S.-Canada Great Lakes Water Quality Agreement (GLWQA) is "to restore and
maintain the physical, chemical and biological integrity of the Great Lakes Basin." To evaluate the
effectiveness in meeting this goal, the Environmental Protection Agency and Environment Canada
biennially host a "State of the Lakes Ecosystem Conference (SOLEC), to report on the state of the Great
Lakes ecosystem and the major factors impacting it, including environmental and socioeconomic
indicators for assessing these factors. SOLEC also provides a forum for information exchange and
discussion among people in all levels of government, corporate and not-for-profit sectors that make
decisions affecting the Great Lakes. To date, five SOLEC conferences have been held.
�
SOLEC 1994--The first conference addressed the entire lake system, emphasizing aquatic
community health, human health, aquatic habitat, toxic contaminants and nutrients, and the
changing Great Lakes economy;
�
SOLEC 1996--This conference focused on areas where biological productivity was greatest and
humans had maximum impacts, including nearshore waters, coastal wetlands, lakeshore lands,
Draft Final Report: Not for Quotation or Citation
74
impacts of changing land use, and information availability and management. Also recognized was
the need for a comprehensive set of indicators to allow the governments to report on progress
made under the GLWQA in a predictable, compatible and standard format;
�
SOLEC 1998--This conference focused more formally on the indicator development process, with
development of a suite of easily-understood indicators that objectively represented the condition
of the Great Lakes ecosystem components, as called for in the GLWQA;
�
SOLEC 2000--This conference reported on the state of the Great Lakes on the basis of 80
science-based indicators developed since SOLEC 1998. It also introduced a new group of
"Societal Indicators," which seek to measure both human activities impacting the environment,
and the societal action(s) taken in response to these environmental pressures;
�
SOLEC 2002--This conference continued to update and assess the state of the Great Lakes,
focusing on 43 indicator assessments used to provide the most comprehensive analysis to date of
the Great Lakes Basin Ecosystem. It also presented a candidate set of "Biological Integrity"
indicators, as well as proposed indicators for agriculture, groundwater, forestry and society
responses, which, as a part of the "Societal indicator" suite, measure positive human responses
to ecosystem pressures.
Work continues on the Great Lakes indicator suite, including efforts to streamline the reporting
requirements of the GLWQA, and to report progress under it within the context of management challenges
and actions. Further information on the SOLEC indicators can be found on the website:
http://www.epa.gov/glnpo/solec/
1
2
Museums and Information Centers
3
4
Lake-based museums or centers are another useful way to ensure that scientific and
5
other types of information are widely disseminated. One example is the realization of a
6
Lake Science Center established at Barkul in the Chilika Lake basin for hydrobiological
7
and other studies during 1999-2002. The Lake Champlain brief highlighted the value of
8
developing a lakefront laboratory and science museum (Leahy Center) as a means of
9
fostering effective lake management within the drainage basin. The Lake Biwa Museum is
10
a long-standing and very successful example of a lake science center devoted to
11
disseminating of information and data about the lake and its problems. Based in part on
12
these successes, establishment of a Lake Resource Centre (LRC) at the Bhoj Wetland has
13
been recommended.
14
15
Involving People
16
17
Finally, many of the case studies show the benefits of directly using people to gather and
18
provide information on lakes. Examples include the following:
19
20
� An interesting example of information gathering by citizens is the "Firefly
21
Monitoring" in the Lake Biwa drainage basin. Akanoi Bay, which feeds into the
22
South Basin of Lake Biwa, used to be famous for fireflies. Changes in landscape
23
(mainly the channeling of rivers and loss of natural habitats), however, have led to
24
a decline in the number of fireflies. A local NGO implemented various restoration
25
projects, with one key indicator of success being an increase in the number of
26
fireflies--a simple, but effective, indicator of restoration progress.
27
� In Lake Victoria, water hyacinth expansion and control are carried out and
28
monitored by local fishing communities, who are the ones best placed to carry out
29
such work.
30
� The Lake Tanganyika Brief notes the importance of involving the local
31
communities in data collection. It is noteworthy that the Brief also questions the
32
extent of this involvement, since the collection of water samples or reading of
33
water/rain gauges may not be appropriate for communities that are not trained to
34
undertake such tasks.
35
� The Lay Monitoring Program in lake Champaign has conducted lakewide
36
monitoring of eutrophication parameters using citizen volunteers every year since
37
1979. The information collected by these citizen monitors has been used to
38
develop state water quality standards.
39
Draft Final Report: Not for Quotation or Citation
75
1
Organizing/Carrying out Science and Monitoring
2
3
In an ideal world, with no shortage of funding or and trained staff, each lake basin would
4
have a resident institute--recognized for its capabilities and impartiality--carrying out
5
both required and elective research and monitoring and coordinating information
6
gathering between various sectors. This actually is close to reality for some of the survey
7
lakes. Where funds are scarce, however, we see fragmentation and a reliance on
8
international funding--not necessarily problems, but also not ideal.
9
10
Resident Institutes
11
12
Lake Champlain (along with Lake Biwa and the North American Great Lakes) provides an
13
example of just how important and effective a role science and monitoring can play. The
14
Lake Champlain Basin Program has always sought to base planning and policy decisions
15
on sound scientific information. The brief contends that, without this strong foundation in
16
sound science, a watershed management program will not necessarily produce the
17
desired outcomes. Nearly two dozen representatives from the technical community
18
throughout the lake basin have been brought together in a Technical Advisory Committee
19
(TAC) to examine the scientific issues of every major policy question, and provide policy
20
and budget guidance to the Steering Committee each year. The TAC also reviews
21
research and implementation projects to ensure both scientific merit and successful
22
conclusion. Moreover, it is chaired by a non-governmental scientist who also holds a seat
23
on the Lake Champlain Steering Committee. When scientific information is not adequate
24
to guide a management decision, the LCBP allocates funds to support focused and timely
25
research or monitoring to address the knowledge gap. This effort, however, does not
26
come cheap. Monitoring environmental conditions in the lake basin typically requires up
27
to $300,000, a sum of money usually not available for most lakes.
28
29
Internationally funded programs
30
31
For lakes in developing countries without the ability to maintain resident programs
32
international studies and funding can play an important role. For example, lakes like
33
Malawi, Victoria and Tonle Sap have received much attention from foreign scientists and
34
the information gathered has been used in decision making.
35
36
Several of the cases indicate the need for local training and ongoing support to ensure
37
the sustainability of such internationally-funded programs. In Lake Tanganyika for
38
example, except for the CLIMLAKE project, all the training conducted only lead to
39
certificates, rather than higher degrees. In such situations, the riparian states are forced
40
to rely heavily on expatriates to undertake tasks which would otherwise have been
41
undertaken by local experts. The Laguna Lake Development Authority (LLDA) provides a
42
contrary example, in which local ability was well supported and developed.
43
44
Fragmentation
45
46
The Lake Toba brief illustrated the shortcomings when the agencies conducting various
47
research projects did not readily communicate with one another. Instead they kept much
48
of their results and data to themselves for reasons of prestige and dominance. As a result
49
there is no sound, comprehensive research project covering the major aspects and
50
concerns of the lake.
51
52
The same problem arises between countries. In the Lake Xingkai/Khanka Brief it was
53
stated that, although China and Russia developed their own monitoring and information
54
management systems for the lake, a lack of adequate technical and institutional capacity
55
to collect, analyze and store relevant data has prevented harmonized and cost-effective
56
management for the transboundary environmental issues. A UNEP Diagnostic Analysis
57
brought teams of Chinese and Russian scientists together to produce a definitive
Draft Final Report: Not for Quotation or Citation
76
1
document. The GEF's Transboundary Diagnostic Analysis (TDA) process has helped
2
countries exchange information and work together in several of the study lakes (e.g.
3
Lake Titicaca and the Caspian Sea).
4
5
How much information is enough?
6
7
Like money, no amount of information ever seems to be enough: almost every brief cites
8
the need for more information, for more research, for more monitoring. Even in cases
9
where a tremendous amount of money has been spent on information the call is
10
unambiguous. The Lake Champlain brief states that additional research and monitoring
11
efforts are needed to better understand the sources and effects of toxic pollutants in the
12
Basin, whilst the Lake Biwa brief states that the funds wasted for the lack of a scientific
13
approach in managing the lake far outweighed the required investment--another clear
14
call for more scientific information.
15
16
One lesson learned from this chapter is that the lack of information should not impede
17
action. The Laguna Lake Development Authority (LLDA) has adopted the slogan "Ready,
18
fire, aim!" for good reason. The LLDA has not been paralyzed by incomplete information;
19
instead they have learned while acting and, as a result, have been successful in their
20
management efforts.
21
22
Finally, acquiring a sufficient level of information does not necessarily have to be
23
prohibitively expensive: the Lake Nakuru brief cites the development of a cost-effective
24
package of practices for environmental monitoring, noting that it is not likely to cost
25
more than 1% of the annual revenue generated at the Lake Nakuru National Park in
26
which the lake is located. A checklist of the essential information and data for lake
27
management is given in Box 7.4
28
Box 7.4. The Information Bare Essentials: A Checklist for Decision Makers
�
Scientific/Technical Prospects and Options--What is the current condition of a lake (i.e., current water
quantity and quality, and changes in them over time)? What is the status of its biological
communities? What are the root causes, within and outside the lake drainage basin, for the observed
problems? What are the lake management options and what are their possible outcomes? How can
progress in lake recovery be evaluated? What is the expected degree of, and recovery time frame for,
specific lake problems?
�
Sociological Perspectives--What is the cultural history of lake use in its drainage basin? What
customs, social mores or religious beliefs influence the use of lakes and their resources? To what
extent can the public and other lake stakeholders be mobilized to help identify and implement
effective lake management efforts?
�
Economic Characteristics--What are the economic characteristics of the drainage basin stakeholders,
including the relevant governmental management bodies? Are sufficient financial resources available
for sustainable management interventions? Is poverty alleviation linked to sustainable lake use? What
economic incentives, penalties or subsidies exist to facilitate lake management interventions and
what are their past experiences?
�
Institutional and Legislative Frameworks-- What is the existing legislative framework in the drainage
basin? Do adequate institutions and laws exist to regulate, protect or guide the sustainable use of a
lake and its resources, or are new or modified ones needed? Do different lake management
institutions have overlapping or conflicting mandates? Are existing laws and regulations enforced in a
consistent, equitable manner? What other legislative incentives exist and what are their experiences?
�
Political and Governance Structures--What are the political realities regarding the sustainable use of
lakes and their resources within the lake drainage basin? Is the political structure amenable to public
inputs? Are current politicians and government officials providing the necessary leadership to
facilitate needed lake management interventions? Is the lake governance process transparent,
equitable and accessible to the public and other lake stakeholders?
29
Draft Final Report: Not for Quotation or Citation
77
1
Chapter 8. Mobilizing Sustainable Funding
2
Key Lessons Learned about Financing
�
Although international finance is attractive (it often comes as grants that do not have to be re-paid)
international finance is also short-term and often targeted to specific issues. Consequently decision
makers need to develop both local and national level sources of funding.
�
Financing for capital infrastructure investments usually comes from the national level or from
international resources; local level funding is an important source of money to help meet routine
recurrent expenditures.
�
Financing for routine monitoring and lake scientific labs is particularly problematic; this is one are
where external financing may play an important catalytic role but should not be relied upon for long
term funding.
�
It is easier to levy local fees when the money stays in part in local coffers (to pay for current needs)
and locals have a say over its use.
�
To ensure global benefits from lake projects, particularly in the case of international lakes, a
programmatic approach is better than a project-by-project approach. In order to sustainably provide
global benefits, global action and close co-ordination among national management agencies is
required. This is one case where external funding may be necessary to implement the new
management regime.
3
4
Improved lake basin governance costs money--money for new or existing institutions
5
and staff, money for investments in discrete projects, money to compensate "losers"
6
when new policies are introduced. Sustainable lake basin governance means sustainable
7
financing--and financing that is sufficient in quantity and guaranteed over time. Neither
8
condition is likely to be met in many of the world's lake basins.
9
10
In an ideal (and completely unrealistic) world all stakeholders using or affected by a lake
11
and its basin would contribute to the costs of actions and policies needed to maintain
12
ecological integrity and economic sustainability. However, in most lake basins the
13
numbers of people involved are large and the ability of many to pay is very limited. In
14
addition, there is often no effective institutional mechanism to collect money from
15
individuals and make the required investments or payments. And the administrative and
16
financial costs of collecting fees or charges can be substantial.
17
18
Lake basin decision makers face two ma jor types of costs: capital investments--usually
19
large and "lumpy" investments in infrastructure like sewage treatment or lake hydraulic
20
works--and day-to-day management costs--largely salaries and modest capital costs
21
and usually referred to as "recurrent costs". In most developing countries neither cost is
22
met from local resources. This chapter examines what a decision maker can do to at
23
least increase funding for regular, on-going expenses. Capital investments will probably
24
have to continue to be paid by others--national governments or foreign donors.
25
26
The Decision Maker's Complaint
27
28
Securing sufficient financial resources is a constant concern. A few excerpts from the
29
Lake briefs make interesting reading:
30
31
� "the Government has been suffering from acute shortages of resources and
32
this has weakened the capacity of remaining extension staff to carry out its
33
activities" Lake Nakura Brief
34
� "it is unclear how successful projects developed under the GEF project will
35
continue to receive funding now that the (GEF) project is over" Lake Baikal
36
Brief
37
� "lack of financial support in general and poor working conditions in
38
particular make it hard for the preserve to function in any normal way"
39
Lake Issyk-kul Brief
40
� "the assessment rates overall sustainability as unlikely. Staff incentives
41
were reduced with a return to Government salaries. Malawi cannot provide
Draft Final Report: Not for Quotation or Citation
79
1
sufficient budget to sustain the lake research program..." Lake Malawi/
2
Nyasa Brief
3
4
Around the world, in rich and poor countries alike, decision makers complain that
5
resourc es are not enough to do all that needs to be done. While this complaint may be
6
true for almost any natural resource, improved lake governance, and the financing that
7
supports it, is often attainable if one is careful in resource use, creative in identifying new
8
sources of funding, and inclusive in involving stakeholders. For example, judicious
9
investment in knowledge gathering (monitoring and scientific studies) can help target
10
management interventions so that funds are used efficiently; and, high rates of fee
11
collection can be achieved if users of the lake's resources are given a genuine say in the
12
management of the lake basin.
13
14
In addition, since money is transferable between uses (or, as economists say, fungible),
15
the challenge for decision makers is usually to increase the aggregate amount of money
16
available, regardless of the source. While it is often true that international donor funds
17
are often tied to specific activities or investments, these same donor funds are usually
18
additional money and they free-up other money that is not "tied" and can then be
19
redirected to other uses. Consequently decision makers often focus as much on
20
increasing total funding (that is, increasing the size of the "financial pie") as they do on
21
the allocation of those funds (who or what receives the "slices" of the same pie).
22
23
As mentioned in Chapter 4 on policy, political will is an essential ingredient in
24
increasing support for and funding for improved lake management. Any funding scheme
25
has to be implemented on order to collect revenues, and this requires political will. The
26
second essential ingredient is public acceptance and understanding of the new
27
system--and this implies education and awareness building.
28
29
This chapter considers three distinct sources of potential funding for improved lake basin
30
governance, and presents examples and the opportunities and cautions about each
31
source of funding. Most of this funding will be for recurrent costs, also referred to as O, M
32
and R--operations, maintenance and replacement--and not for initial capital costs. These
33
three main sources of funding include the following:
34
35
� Local sources (including user fees and other locally generated revenues),
36
� National level financial resources, and
37
� International funding including both bi-lateral and multi-lateral funds (including
38
the GEF).
39
40
Selected examples from the 28 case studies are given to illustrate each type of funding.
41
42
Locally Generated Funds
43
44
A somewhat new source of funding for improved lake basin governance is locally
45
generated revenues, either payment for services (e.g. user fees like drinking water
46
charges or recreational charges) or fines for pollution (e.g. pollution charges like
47
wastewater discharge fees). These funds are collected from various groups and include
48
those who are direct users (and beneficiaries) of the lake resource such as fishermen,
49
those who benefit from the lake as a source of ecosystem services (e.g. various people
50
who benefit from flood mitigation, improved water supply, or enhances amenity values),
51
or those groups whose activities pollute or harm the lake (e.g. industries or municipal
52
wastewater disposal systems).
53
54
In this case the definition of "locally generated funds" is broad enough to include
55
revenues from those downstream users who are directly linked via the ecosystem. This
56
means that a downstream beneficiary may be an important source of funding for decision
57
makers. This is especially true if the downstream uses are high valued uses such as
Draft Final Report: Not for Quotation or Citation
80
1
drinking water or hydropower generation (and these same users also have a high ability-
2
to-pay, that is, they are well-off). For example, Lake Biwa is fortunate to have large and
3
wealthy downstream stakeholders. Lake Biwa has been very successful in attracting
4
money from Osaka and Kobe for investment and management costs to help protect the
5
Lake's resources and ensure continuing water supply (both quantity and quality) to these
6
large urban areas. In fact, total public investment in the Lake Biwa region for lake
7
management totals hundreds of millions of dollars.
8
9
Private funding is a subset of locally generated funding and is usually only important
10
when the number of stakeholders is very small and the community is both relatively rich
11
and socially cohesive. One can think of small lakes with a small number of owners/lake
12
users who band together to make needed investments and enforce certain management
13
policies. This has been observed around some small lakes in the US where the primary
14
use is recreational, and in fact most "externalities" have been "internalized" (see
15
Appendix A). This is only rarely seen in practice (usually where the lake is small and the
16
number of stakeholders is also small) and almost never observed in larger lakes or where
17
large numbers of stakeholders are involved. Private funding via donations can be
18
important additional source of money (sometimes targeted to specific management
19
objectives such as biodiversity or cultural conservation).
20
21
Although not discussed in the Lake Sevan Brief, a recent study (Wang 2003) has
22
examined the willingness-to-pay (WTP) of Armenians, both inside Armenia but more
23
importantly, the larger and wealthier community of Armenians living abroad. The initial
24
results for residents of Yerevan, the capital, indicate a total WTP of around $18 per
25
person. This is based on a monthly payment of $0.50 per month for a 3 year period) to
26
stabilize the lake level and prevent any further lowering of the lake level. Although
27
seemingly not a large sum per person, this is a substantial WTP given the very low
28
income levels in Armenia. Additional research is looking at expatriate Armenian WTP
29
measures and these numbers are expected to be much higher. The challenge, of course,
30
will be to design an effective policy tool to collect some of the WTP, both within Armenia
31
and abroad.
32
33
User Fees
34
35
Locally generated (and locally retained) financial resources often take the form of some
36
sort of "user fee"--perhaps from fishermen or recreational user, or from those who
37
consume a lake resource such as drinking water. A user fee is a charge that is paid by
38
someone who derives a benefit from the direct, or indirect, use of the lake and therefore
39
has both an interest it the conservation and management of the lake's environment, and
40
an implicit responsibility to help pay for that conservation and management. Education
41
and public awareness are central components of any new user fee system. In Box 8.1,
42
for example user fees from fish pen operators in Laguna de Bay in the Philippines have
43
become an important source of funds for the local lake development and management
44
authority. This example also illustrates the importance of agreeing on a distribution of the
45
funds with responsible institutions, such as local government, and those paying the fees.
46
Draft Final Report: Not for Quotation or Citation
81
1
Box 8.1. User Fees in Laguna de Bay, the Philippines
The Laguna de Bay managers have used several different types of user fees to help both generate revenues and
provide an incentive for polluters to reduce pollution.
Introduced in 1997, the Environmental User Fee System (EUFS) is designed to help reduce pollution loading in
the lake system and is composed of a fixed fee and a variable fee. The fixed fee covers the administrative costs
of implementing the system and the variable component is based on the BOD concentration of the effluents.
The current threshold level for BOD is 50 mg/L. The combination of a fixed fee (a Command and Control
measure) and the variable fee (an economic-based instrument) has been effective in both meeting
administrative costs and encouraging firms to reduce their pollutant levels. The EUFS has been implemented in
stages with the larger firms affected first.
Revenues from a separate user fee on fish pen operators are shared between the local government units and
the Laguna de Bay Lake development Authority (LLDA). The fee, currently about US$120 per ha of fishpen,
generates revenues for improved lake basin management and makes the lakeshore communities active
stakeholders in lake basin management.
These two fees have been effective in achieving two important goals � developing a source of local funding for
the LLDA and lake shore communities, and providing an incentive for industrial polluters to reduce their
emissions to the lake.
2
3
Tourism, both national and international, is another excellent example where user fees
4
(admission fees, daily use charges) can be developed and begin to produce revenue for
5
improved lake management. This is a well-established practice and has been
6
implemented in a number of lakes where tourism is an important use--for example, in
7
Lake Nakuru, visitors to the national park to see the flamingos all pay a user fee. This
8
practice could be expanded to other lakes, especially where there is a clearly defined
9
lake-based recreational activity (c.f. Lake Baringo). An important ingredient for success,
10
however, is the local retention of at least part of the fees collected, couples with public
11
education and communication on the link between resource management and economic
12
activities.
13
14
Setting user fees requires considerable judgement. In almost all cases the user fee is less
15
that the true value of the resource being used. This is commonly observed in water
16
supply systems where user fees often just cover operations and maintenance (O & M)
17
costs but do not pay any of the initial capital costs. In irrigation systems user fees often
18
do not even cover O & M costs. This is neither surprising nor a major problem. People do
19
not like to pay for the services of any ecosystem (there is a feeling that natural resources
20
are a gift from nature and should be free!). In addition, setting ANY user fee begins to
21
establish the principle that these resources have value (and alternative uses or
22
opportunity costs). Thus implementing even a partial user fee system starts to send the
23
correct market signal and can begin to generate some revenues for improved
24
management.
25
26
Successful introduction of user fees also requires that the population being taxed
27
understand why the fee is being levied and also the population see some result in terms
28
of improved management. If these requirements are not met collection of the fees
29
becomes even more difficult and an adversarial relationship between the users and the
30
decision makers may develop.
31
32
Pollution Charges
33
34
Fees can also be levied on those whose actions potentially damage the lake and its
35
sustainability. Pollution charges or levies are therefore a potential source of funding and
36
serve a double purpose--if there is pollution this charge helps generate revenue to
37
address the pollution issues or compensate those who are hurt by the pollution. In
38
addition, pollution charges also serve as an incentive for polluters to decrease their
39
pollution and therefore avoid paying the pollution charges. In theory pollution charges
Draft Final Report: Not for Quotation or Citation
82
1
could be paid directly by the polluter to those whose welfare is hurt by the pollution. This
2
is administratively very hard to do so usually these charges are collected by some central
3
institution and then payments are allocated to various groups--both those whose welfare
4
is hurt as well as other stakeholders in the basin. In some cases the charges go to the
5
central treasury and the decision makers must fight to get some share back to pay local
6
compensation. (This is also often the case with user fees.) In Lake Dianchi in China,
7
pollution fees are used (in addition to more commonly observed water supply charges),
8
to raise revenues. Box 8.2 discusses the situation in Lake Dianchi.
9
Box 8.2. User fees in Lake Dianchi, China
Lake Dianchi near Kunming, China is the center of a major urban, industrial and tourism region. Pollution from
industry, agriculture and urban sewage was a major problem. The lake authorities have made major
investments in sewage and wastewater control. In the year 2000 they spent over RMB 340 Million (about US$
41.5 million). To address the ongoing problem of industrial pollution, the lake authorities have combined a
pollution levy system with a loan/ grant program for installation of pollution control equipment.
Starting 15 years ago old industries were charged a pollution levy if their discharges exceeded the stated
discharge standard. In addition, the 1988 Dianchi Protection Ordinance prohibits the introduction of any new
polluting industries in the Lake Dianchi catchments.
Existing industries, when taking actions to control pollution, were provided with loans from the government for
the required investments. These loans were funded by a combination of the environmental pollution levy
receipts plus special funds allocated for Lake Basin environmental improvements. As an added incentive, if it
was shown that after the pollution controlling investments were made that the industry could then meet the
pollution discharge standards, the loan was converted to a grant and no repayment was required. By combining
government investments, pollution levies, and a loan/ grant program for pollution controlling investments, the
lake management authorities have begun to tackle the major problem of pollution of this important lake.
10
11
Whether it is a user fee or a pollution charge, the idea is to establish a connection
12
between those who benefit from using the lake resources (or negatively affect its
13
quality), and the costs required to maintain the same resource. These fees and charges
14
help to generate revenue for improved management. A user fee or a pollution charge
15
also reinforces the idea that a lake and its resources have value and therefore have to be
16
used wisely. As was discussed in Chapter 2, free resources and free goods tend to be
17
overexploited and poorly managed. Resource degradation is common. Think of the
18
condition of many open access resources including oceans and seas, lakes and public
19
parks. When money changes hands (and a market is functioning) it sends the correct
20
signal: a lake and its resources are valuable and scarce, and one has to use the lake
21
resources wisely. Fees and charges help to re-enforce this message (it costs you money
22
to use it) and also help provide funds for needed conservation and protection (to ensure
23
availability of the resource over time).
24
25
An independent source of funding?
26
27
In addition to creating a cause-effect link between the resource and those who use the
28
resource, user fees and pollution charges also have the very attractive feature of helping
29
to create local sources of financing, both in terms of collection and control. This is
30
important to any decision maker since these funds are not entirely dependent on
31
requests to the regional or national treasury. And, as was stated at the beginning of this
32
chapter, nationally-allocated funds are never sufficient in amount nor guaranteed over
33
time.
34
35
However, one major potential problem with locally generated financing remains. In many
36
countries the legal framework states that all money collected from user fees have to go
37
to the National Treasury, and money is the re-distributed and allocated based on certain
38
principles. While this approach is the correct one from a pure public finance perspective
39
(taxes and revenues that are collected should be "pooled" and used in their "best and
40
highest valued" uses) the fact is that very little money normally flows back to the lake for
41
improved lake management.
Draft Final Report: Not for Quotation or Citation
83
1
2
The lack of uncertainty of having access to collected money creates an obvious problem
3
with incentives to collect these fees--local managers are unlikely to collect money
4
rigorously if little or none of the money is then available for local purposes. One potential
5
solution to this problem is to devise a revenue sharing scheme whereby any revenue
6
collected is divided between the generating unit (e.g. the lake management authority)
7
and the local or national government. In the case of Laguna de Bay, fees from fish pen
8
operators are in fact split between the lake authority (LLDA) and local governments.
9
Although national government (and Ministries of Finance or the Treasury in particular) do
10
not like "revenue-sharing" proposals, an argument could be made that this approach
11
actually INCREASES resources available at both levels--local and national, since splitting
12
SOME revenue may generate more resources to both sides that not splitting NO
13
revenues! (Put another way--50% of "something" is more than 100% of "nothing"!!!)
14
15
An interesting example of precisely this sort of approach is found in Mexico where user
16
fees for national marine parks in the Yucatan Peninsula are now split between the park
17
managers and the local communities, rather than going directly to Mexico City (and
18
never being sent back for local use). To implement this idea, however, took several years
19
of work and the passage of a law in the Mexican Congress expressly allowing this form of
20
local revenue retention and revenue sharing.
21
22
The Principle of Cross-subsidization
23
24
One well-accepted financing principle is that of cross-subsidization. That is, certain
25
activities (or uses of a lake, for example) can generate a lot of money while other
26
activities generate very little or no money. The principle of cross-subsidization states that
27
"excess" money can be collected from one use to help pay other expenses. Whether or
28
not this should only be done within a sector (e.g. lake fisheries, tourism) or within the
29
lake basin, is a political, not an economic question. Cross-subsidization is justified by the
30
transmissivity of the lake ecosystem and the differing abilities of different parts of that
31
ecosystem to generate revenues to meet the management needs that affect all users.
32
33
Sectoral ministries (e.g. the ministry of fisheries or agriculture) typically only look at their
34
narrow sectoral boundaries. Administrative boundaries are just as much a barrier and
35
only in a few cases are the lake basin and the administrative boundary the same (such as
36
is the case for Lake Biwa). This leads to one of the key lessons from studies of integrated
37
watershed management--plan in an integrated framework and implement along sectoral
38
lines. Lake Basin authorities, especially if they have independent sources of funding, can
39
help promote this process by allocating money across different sectoral needs, but
40
sectoral authorities (like a lake fishing commission) is almost never able to break out of
41
the sectoral approach.
42
43
Should people pay for "gifts of nature/basic human rights"?
44
45
Another issue is whether or not it is appropriate to charge a user fee for a "gift of God" or
46
a basic human need/ right like drinking water. Regardless of ones views on the inherent
47
"right" of people to water, user charges can be justified by the argument that what is
48
being paid for is the service provided (e.g. the costs of supplying water), not the
49
resource itself (the water).
50
51
Merely saying that "water should be free to all" (or parks or open spaces should also be
52
free) does nothing to help ensure its timely provision. Some countries have enshrined
53
certain "human necessities" in their Constitution, but this is a political issue separate
54
from managing and maintaining the resource.
55
56
Draft Final Report: Not for Quotation or Citation
84
1
The special case of the "poorest of the poor"
2
3
It has to be recognized that in some situations part of the stakeholder population is truly
4
so impoverished that they cannot pay anything to help better manage the resource that
5
they depend on. However, rather than starting with this as the assumption for all
6
populations, the special case argument needs to be examined carefully in each case and
7
justified. Often it can be shown that the poor pay more because of the non-delivery of
8
services than would be the case with basic public provision of certain services (such as
9
potable drinking water). In addition, the important point about locally-generated funding
10
is to establish a cause-effect link between the resource and those who benefit from its
11
use. This helps create general public awareness and expectations about appropriate and
12
effective management. Both help create political will to do better resource management.
13
14
In conclusion, it is not possible to say what percent of current lake management funding
15
should be locally generated (and retained). While locally generated funds are probably
16
still only a small share of lake management funding in most places, it is the part of the
17
funding package that has the most potential for future growth. In addition, it is the only
18
source of funding over which decision makers and local authorities have control. As the
19
appreciation of the wide range of lake-associated benefits grows (e.g. see earlier
20
discussions in Chapter 2), new ways to generate funds locally will develop (Chapter 4
21
discussed a number of different policy instruments or tools that can be applied).
22
23
National Funding
24
25
Most lake management programs rely, entirely or in part, on financing from the national
26
(or provincial/state) government, either through sectoral ministry funding or via special
27
appropriations for integrated lake management committees. The Lake Briefs provide
28
details on lake management institutions for lakes as diverse as Victoria, Constance, the
29
Great Lakes, Biwa and Toba. Several of these are international lakes, while Biwa and
30
Toba are national lakes. Still, the intentions are similar--to bring together various
31
interested stakeholders in a meaningful way to improve lake management.
32
33
National level funding (and here this refers to any funding above the local level and
34
implies that funding comes from general tax revenues that are collected and then re-
35
allocated) can be a major source of money but is often insufficient in amount and may
36
not be sustainable over time. This is particularly true if the lake in question is remote or
37
populated with a minority population group.
38
39
One area where national funding mat be both appropriate and essential is capital
40
infrastructure investments. These large, "lumpy" investments--for such things as
41
wastewater treatment or major water supply projects--are rarely funded at the local
42
level. Local resources are often not sufficient or the benefits may be quite wide-ranging
43
and long-term so national level funding is appropriate. See the Lake Dianchi and Lake
44
Toba briefs for examples of national funded infrastructure investments.
45
46
Combining locally generated resources with national funding may be an attractive
47
alternative to relying solely on national funds. National funds are usually more
48
"fungible"--they can be used for any of a variety of purposes, while locally-generated
49
funds may have a narrow sectoral focus. For example, local user fees from fishermen will
50
augment available resources but will probably only be spent on fish management--not on
51
other lake management problems, some of which may actually create more benefits per
52
dollar spent.
53
54
The institutional (and political) issue of separating sources of finance, from the uses of
55
those resources, remains. Although lake basin management authorities (or international
56
lake commissions) have the responsibility to look broadly and identify the most
57
appropriate investments or actions that are needed wherever they occur in the basin, it is
Draft Final Report: Not for Quotation or Citation
85
1
not always easy to do so. There will always be pressures from the sectoral ministries, or
2
the more vocal groups, to focus narrowly. Worldwide, resource allocation decisions are
3
decided as much by political power and political will, as by dispassionate analysis.
4
5
External Funding
6
7
Faced with this funding challenge--to rely on locally generated funds (but a source that
8
may be quite small in total amount), or to rely on national funds and the fierce funding
9
competition between the various sectors, ministries and regions of the country--many
10
decision makers look abroad to external funding.
11
12
External aid is seen as a way around two important financing problems: first, increasing
13
the amount of money/resources available, and second, breaking the link between the
14
sectoral ministry/source of funds and their use and allowing a wider variety of
15
management issues to be tackled. External funding can be either from bilateral (country
16
to country assistance) or multilateral sources (regional blocks like the European
17
Community or United Nations agencies).
18
19
About half or more of lakes in the set of 28 lake briefs have some sort of external
20
support. External funding is often used for infrastructure investments (e.g. sewage and
21
wastewater treatment, water control structures) but also often helps pay research and
22
management costs. The external funding ranges from a marginal share of the total to the
23
bulk of management funding. For these jointly funded activities to be fully effective,
24
there needs to be a clear agreement between the parties about how their respective
25
commitments will be integrated and a mechanism to make sure that each party abides
26
by its commitment. For example, the Japanese government funded the expansion of the
27
Nakuru (Kenya) town water supply and upgraded the town's sewerage treatment plants
28
to treat any consequent increase in effluent being discharged to Lake Nakuru. However,
29
the benefits from these investments are not being fully realized because of limited
30
commitment by the Kenyan government to its obligations to water and wastewater
31
management.
32
33
External support can take the form of loans that have to be repaid (e.g. loans, both
34
"hard" and "soft", from the World Bank to a country for lake management as is being
35
proposed for the Aral Sea). "Hard" loans carry market-determined interest rates; "soft"
36
loans carry below-market, highly subsidized interest rates. More desirable from the
37
perspective of decision makers are grants--money that does not have to be repaid. Most
38
bilateral assistance (such as from the European Community and individual countries) and
39
GEF funding are in the form of grants. Some lake projects combine grants with loans.
40
The first phase of the Lake Victoria Environmental Management Program, for example,
41
has two major sources of external funding, a GEF grant of about $33 million, and a "soft"
42
IDA loan of about $43 million.
43
44
The Special Case of the Global Environmental Facility (GEF)
45
46
While most bilateral or multilateral funding is provided to promote various
47
social/ecological objectives (e.g. poverty alleviation, ecosystem protection, regional
48
development), the Global Environment Facility (GEF) is the only funding that is based
49
solely on the fact that lakes have global environmental benefits (for either biodiversity or
50
the management of international waters) and that their proper management implies
51
management costs that exceed what a country would be willing/able to undertake based
52
on estimates of national benefits and costs. Hence GEF funding is designed to cover the
53
"incremental costs" of an activity--those costs that produce international environmental
54
benefits, as opposed to national-level benefits. The latter, national benefits, are supposed
55
to be paid for by the countries themselves and are not normally eligible for GEF funding.
56
Draft Final Report: Not for Quotation or Citation
86
1
This rationale for GEF funding becomes more complicated in the case of international
2
lakes, since even though the ecosystem may be whole and linked, the management
3
actions, and the incidence of benefits and costs, may vary greatly between riparian
4
countries. If there is a "shared vision" for lake management, and the countries share
5
many other characteristics, the chances for success improve considerably. In the case of
6
Lake Peipsi, the governments of Russia and Estonia have signed three agreements
7
(fisheries, environment and water use) and have set up a Transboundary Water
8
Commission to improve the management of the lake. While these actions may fall short
9
of a formal joint vision for the lake, they represent sectoral agreements and ensure that
10
there are on-going discussions over a wide range of issues so that each country is well
11
aware of the intentions of the other and any problems that may arise. In other cases the
12
riparian countries are still working towards common goals for shared lakes. For example,
13
the development and protection of Lake Victoria has been hampered for many years by
14
the absence of an overarching agreement between the three riparian countries (Tanzania,
15
Kenya, Uganda). However, under the auspices of the East African Community, the three
16
countries are now drafting a Protocol for Sustainable Development of the Lake Victoria
17
Basin and plan to establish a Lake Victoria Basin Commission as part of that Protocol. If
18
successful, this initiative will lay the foundation for a joint approach to managing the lake
19
and much of its catchment (the two upstream countries of Rwanda and Burundi are not
20
yet part of the EAC).
21
22
In still some other cases, the world community seems much more concerned with what
23
happens than the riparian states. Lake Malawi provides a case in point. This lake,
24
recognized to be the most bio-diverse in the world, is central to the economy of Malawi
25
but of less importance to the other two riparian countries--Tanzania and Mozambique.
26
Malawi operates a fishing industry and an aquarium fish trade, the latter of which exploits
27
some of the highly localized and rare fiah species. The latter two countries are developing
28
agriculture and tourism within the lake's catchment with the potential for adding
29
sediment and nutrients to this important international waterbody. There is considerable
30
international concern about the threat to the lake's biodiversity and a number of bi-
31
lateral and multi-lateral projects have been funded to help preserve the biodiversity and
32
promote environmentally responsible fisheries. However, without an agreement (or even
33
a mechanism for discussions) between the three countries these international efforts are
34
unlikely to be beneficial in the long term.
35
36
External funding (bi-lateral, multi-lateral, GEF) has benefits and costs. It allows decision
37
makers to do more by expanding the financial "pie" and therefore helps pay for various
38
new policies and investments, but may come with certain conditions or biases. In
39
addition, external funding is usually not sustainable over time. The average GEF project
40
is a one-off investment over 3 to 5 years.
41
42
External funding--necessary? sufficient?
43
44
Some successful cases of lake management have no or very limited external funding
45
(e.g. Lake Dianchi in China) and, conversely, some lakes with large amounts of external
46
funding have had very little success in implementing effective management plans.
47
48
Funding, either domestic or external, must be seen as a "necessary but not sufficient
49
condition" for effective lake management. And development experience in general has
50
shown that long-term financing commitments have to come from domestic sources.
51
Consequently there are important issues about how external funding can be best used
52
and how to ensure a smooth transition to national or local sources of funding.
53
54
The Sustainability of External Funding, or, is there life after external funding??
55
56
One of the strong lessons from the review of the 28 lake briefs is that it is very important
57
that external funds play a catalytic, rather than an implementing role in lake
Draft Final Report: Not for Quotation or Citation
87
1
management. There are too many examples of foreign donors financing program or
2
project implementation, with the activities ending as soon as the funding from external
3
sources ends. Effective financing requires that foreign resourc es help create the
4
conditions whereby local or national resources can continue with management after the
5
external funding ends. One problem noted in several Lake briefs, is the tendency for the
6
external funds to be used to pay for international consultants and not being used to build
7
capacity in the developing countries. Another related problem is that when externally
8
funded salaries are considerably higher than government salaries, it can be very difficult
9
to retain staff once the external funding ends and salaries revert to the old schedule (e.g.
10
Lake Malawi).
11
12
It has been argued that GEF-type payments for global environmental benefits should be
13
on-going since the benefits are on-going. This argument for "international funding for
14
international lakes" implies a longer-term commitment to international lakes of global
15
importance. Although this is clearly desirable to do and conceptually correct, in practice it
16
is not very feasible. The history of international funding is not very promising for this
17
type of initiative. "Donor fatigue" is observed in all sectors, and what is attractive for
18
international funding today may receive only limited support in a few years time.
19
Sometimes external funding is used to help set up trust funds or other mechanisms to
20
help ensure continued funding. Bi-lateral and multi-lateral donors, however, have not
21
been willing to commit to open-ended funding commitments.
22
23
One potential promising future source of longer term funding is international payment
24
for environmental services. If global markets develop for certain environmental
25
services (such as we see in the earliest stages for carbon sequestration, perhaps for
26
biodiversity protection in the future) these global markets may form a way in the future
27
to ensure continuing external funding for lake management. This has not happened yet,
28
however, and therefore is not yet an appropriate way to plan for longer-term financial
29
support.
30
31
The idea of user fees that was introduced earlier, therefore, offers one avenue for
32
developing new sources of funding. The entire rationale of this report is that healthy
33
lakes provide a wide variety of services and physical products and that decision makers
34
need to do a better job of demonstrating these benefits to the broader community, and
35
eventually to start collecting some payments for these environmental services, payments
36
that can be used to help pay for required management actions. Lake Toba in Indonesia
37
presented one example whereby the lake management authority has been working with
38
various stakeholders to increase its funding base (and its base of political support) for
39
improved lake management. In particular, a major industry, PT Toba Pulp, a pulp
40
producer, is working with the local community to behave in a more "environmentally
41
friendly" manner. In addition, the company will set aside 1% of its net revenue for the
42
use of the local government for improved environmental management in the lake basin.
43
Once implemented, this "user fee" should generate over $500,000 per year for the local
44
resource management authorities.
45
46
Practical Steps towards Securing Additional Funding
47
48
Decision makers seek practical ways to increase the financial resources available to them.
49
Ideal sources of funding are those that are sustainable, easy (and cheap) to collect, and
50
help re-enforce lake management objectives. Since collecting revenue is itself not a
51
costless activity (and it seems counterproductive to spend more to collect the fee than
52
the fee itself generates) astute decision makers look for ways whereby the
53
users/beneficiaries can help share the responsibility for fee collection. This has the
54
greatest possibility when the fee is user-based and the service (fishing, recreation,
55
camping...) is provided by a private business.
56
Draft Final Report: Not for Quotation or Citation
88
1
Of course the ideal financing combination will be unique to each lake, but the following
2
situations are examples where opportunities exist to secure additional funding from local,
3
national or international sources:
4
5
� Lakes with international environmental benefits that make them eligible for GEF
6
funding (c.f. many of the GEF-linked lakes): funding source--external funds
7
� Lakes with major industrial users who can help pay for water management or
8
pollution reduction costs (c.f. Dianchi or Toba): funding source--pollution charges
9
� Lakes with important downstream users who can help pay to ensure their secure
10
water supply and water quality (c.f. Biwa): funding source--user fees
11
� Lakes with well-off lake community user groups who are able and willing to help
12
pay for sustainable resource management (c.f. fishermen in Laguna de Bay;
13
flower growers in Naivasha): funding source--user fees
14
� Lakes with important recreational uses that can be tapped via user fees (c.f.
15
Dianchi, Constance, Great Lakes): funding sources--user fees, property taxes
16
� Lakes with international waters where one partner is more willing (and able) to
17
help pay for improved management (c.f. Peipsi): funding sources--GEF and other
18
bilateral and international transfers
19
� International (external) willingness-to-pay for bequest and/or existence values:
20
funding sources--NGOs, bilateral and international transfer such as from the GEF
21
22
Starting the process of collecting fees where none were collected before is not easy.
23
People would rather have a service provided for free than pay for it. Experience around
24
the world, however, strongly suggests that much more can be done to increase local (and
25
national) revenue collection, and that when the lake users see that they are also
26
receiving improved services and management as a result, there is wide-spread
27
acceptance of these charges. Given that both national level and external funding is
28
available for many lakes, many decision makers have the luxury of starting small with
29
initial revenue enhancement activities and thereby beginning to build public acceptance
30
(if not active support!) for increasing local revenues. Obviously this is a governance issue
31
that requires a partnership between the various lake stakeholders and active public
32
participation. It is worth the effort, however, in order to build a sustainable financial
33
base, and establish a clear link between the users of the lake basin and its resources and
34
a responsibility to help pay for some of the management costs.
35
36
Draft Final Report: Not for Quotation or Citation
89
1
2
3
4
5
6
7
8
9
10
11
12
13
14
15
16
17
18
19
20
21
22
23
Section III. Synthesis
24
25
The report concludes with this section. Chapter 9 on integration of plans brings all the
26
themes of Section II together and discusses how lake basin management is carried out in
27
practice. Chapter 10 recaps the report and puts forth some guidelines for anyone
28
interested in taking action to improve the conditions of a lake and the people and nature
29
which both depend on it.
30
Draft Final Report: Not for Quotation or Citation
91
1
Chapter 9. Plans to Action: Integration of Planning Dimensions
2
3
This chapter introduces how we can go about integrating the basic components of lake
4
basin management and their associated concerns described in Part II into the process of
5
developing lake basin management plans. First, it discusses lake basin management
6
plans in terms of their scope and the associated mode of implementation. Specifically,
7
they are categorized into visions, long-term comprehensive plans, short-term action
8
plans and specific interventions plans. A simple conceptual framework is then introduced
9
to facilitate assessment of the current state of the lake basin and its management as
10
compared to the management needs in future, drawing attention to two overarching
11
requirements, i.e.;
12
13
� development of a social consensus
14
� requirement for knowledge about lake basin biophysical and socio-economic
15
processes.
16
17
The importance of these two requirements permeates many of the Briefs.
18
19
Finally, we discuss how widely differing planning dimensions of lake basin management
20
projects may be meaningfully integrated. Here, emphasis will be placed on the
21
importance of allowing the integration process to take place gradually while keeping in
22
sight the long-range and broad issues typically found in the management of such
23
complex systems as lake basins.
24
25
Lake Basin Planning
26
27
A plan consists of a set of goals and objectives agreed by all stakeholders together with
28
the actions to be taken to reach those goals and objectives. Plans can be developed at a
29
number of levels of generality. Each of them contains the well-recognized stages of
30
planning:
31
32
� establishment of an agreed goal,
33
� development of alternative strategies for reaching the goal,
34
� selection of the preferred strategy based on assessment of feasibility
35
� implementation of that strategy with mobilization of necessary resources,
36
� refinement of the strategy through monitoring and evaluation.
37
38
Generically, these stages exist regardless of scale and scope of the plan.
39
40
The most broad-scoped and generalize form of lake basin plan is a "vision", a
41
declaration with some long-term aspirations to work toward but with little or no binding
42
mandates or resource commitment. The recently completed Vision and Strategy
43
Framework for Management of Lake Victoria Basin is an example. It lays the foundation
44
for the riparian countries to manage the lake jointly, with aspiration to achieve some high
45
level agreed goals. A vision framework such as World Lake Vision
46
(http://www.ilec.or.jp/eg/wlv/WLV_Final.PDF and Box 9.1) can be both inspirational and
47
instrumental in promoting the development of more specific implementation-oriented
48
forms of lake basin management plans as exemplified by Lake George Basin Management
49
Plan (Paper presented at the GEF LBMI African Workshop, Integrated Management of
50
Lake George, Uganda: The Lake George Basin Integrated Management Organisation,
51
LAGBIMO).
52
Draft Final Report: Not for Quotation or Citation
93
1
Box 9.1. World Lake Vision
The World Lake Vision is a call to action made by some 40 local, national as well as international organizations
concerned with sustainable use of lakes and their values. It focuses on their uniqueness, their range of uses,
and their fundamental importance to the human condition and the natural order now and in the future. The
World Lake Vision provides guiding principles or menu of strategies and opportunities, as fundamental
components of an integrative framework for identifying significant lake problems and developing practical
solutions. The seven principles detailed in World Lake Vision document provide a blue print for achieving the
transition to managing lakes for their sustainable use.
Principle 1: A harmonious relationship between humans and nature is essential for the sustainability of lakes.
Principle 2: A lake drainage basin is the logical starting point for planning and management actions for
sustainable lake use.
Principle 3: A long-term, proactive approach directed to preventing the causes of lake degradation is essential.
Principle 4: Policy development and decision making for lake management should be based on sound science
and the best available information.
Principle 5: The management of lakes for their sustainable use requires the resolution of conflicts among
competing users of lake resources, taking into account the needs of present and future generations and of
nature.
Principle 6: Citizens and other stakeholders must participate meaningfully in identifying and resolving critical
lake problems.
Principle 7: Good governance, based on fairness, transparency and empowerment of all stakeholders, is
essential for sustainable lake use.
2
3
For a basin management plan to be mandated for implementation, it has to prescribe
4
details of the structural and non-structural actions to be carried out, as a long-term
5
plan with envisioned implementation provisions, unlike a vision statement
6
discussed above. The long-term goals must be met by a range of relevant organizations.
7
Since the implementation of the plan may span longer than the time frame for usual
8
budgetary considerations, the agencies responsible for to carrying out the plan may or
9
may not be endowed with the needed level of financial and manpower resources. For the
10
plan to be viable, it usually has to be scaled down to meet the budgetary constraints. The
11
plan thus gets revised over time.
12
13
For example, the comprehensive plans for Lake Biwa provide an interesting insight of
14
long-term plans with strong orientation in implementation. The Lake Biwa Comprehensive
15
Plan (1972-1997), that included a large number of lake resource development and
16
regional economic development projects, was originally designed to be completed in 10
17
years the long-term financial commitments coming from the national and downstream
18
local governments through a special legal provision and institutional arrangements (the
19
plan, after two project period extensions with additional resource commitments
20
particularly for environmental components, were completed in 1997). On the contrary,
21
Lake Biwa Comprehensive Conservation Plan (1998 � 2050) of which the first the three-
22
phase planning durations is currently being implemented, does not have a special
23
financial mechanism backed up by the legal provisions involving the national and the
24
downstream local governments, and it is expected that many of the component projects
25
included are likely not to be implemented as envisioned. The Lake Biwa case attests to
26
the fact that implementation of a long-term plan will be significantly affected by the
27
availability of financial resources over time, which will also depend on the long-term
28
sociopolitical interest and commitments. Although not specifically mentioned in the lake
29
briefs, many of the lake-basin plans in North America and Europe that involved
30
infrastructure development such as construction of basin-wide wastewater treatment
31
systems had to have long-term plans with firm resource commitment over a set planning
32
period, with suitable institutional arrangements for project implementation.
33
Draft Final Report: Not for Quotation or Citation
94
1
While such long-term plans with firm resource commitment over time are rare to find in
2
the financially strained developing countries to which many of the 28 lake cases belonged,
3
there are cases of comprehensive plan for lake conservation with multiple intervention
4
projects both of long and short term implementation arrangements such as one for Bhoj
5
Wetland:
6
7
� The Lake Conservation and Management Project also known as Bhoj Wetland
8
Project, envisages tackling of various issues associated with conservation and
9
management of the Upper and Lower Lakes of Bhopal, under a multi-pronged
10
strategy. Although these issues are deeply interrelated and inter-linked, for
11
operational and management convenience, they are addressed under different
12
independently executed sub-projects. The proposed action plan is not one time
13
quick solution but should trigger a chain reaction so as to make the management
14
sustainable. The Project identified 16 sub-projects.
15
16
and one for Lake Dianchi:
17
18
� As required by "The Approval on the 'Ninth-Five-Year Plan and the Tenth-Five-Year
19
Program for Dianchi Basin Water Pollution Prevention and Treatment' by the State
20
Council", Environmental protection department at Provincial and Municipal levels
21
jointly carried out an "Zero O'clock Action" to force 253 major polluters located in
22
the catchment of Lake Dianchi to bring their pollution into control before May 1st,
23
1999.
24
25
which may be regarded as emulation to some extent of the experience in comprehensive
26
lake basin management over the past decades in Japan as well as in countries in North
27
America and Europe.
28
The lake briefs also provided many examples of what may be called the "action plans".
29
These action plans are more directly focused on a particular set of intervention schemes
30
that is likely to bring about tangible improvement on the ground over a period of several
31
years, if not shorter, continued to be upgraded over a longer time period. One such
32
example is Lake Ohrid "Transbouandary Watershed Action Plan". The plan included the
33
following four primary action items:
34
35
� Reduction of point source pollution through actions that stress septic system
36
management and maintenance, homeowner education, and management of solid
37
waste;
38
� Reduction of non-point source pollution through actions that focus on
39
implementing conservation practices on farms and restoring impaired stream
40
reaches;
41
� Habitat protection and restoration through wetlands inventory and the
42
establishment of a no-net-loss policy, identification and protection of fish
43
spawning habitat, and inventories of the native flora and fauna in the watershed;
44
� Comprehensive planning through the establishment of micro-watershed planning
45
committees, and by creating a GIS system and building the planning capabilities
46
within the municipalities.
47
48
While these actions are formulated with mobilization of funds from various external
49
sources in mind, they are also to be coupled with the local actions, initiatives and
50
commitments.
51
52
A more specific type of plan is a short-term management intervention plan
53
developed by a particular sector for either development or conservation/remediation
54
purposes. For example, New York, Vermont, and Qu�bec signed a Water Quality
55
Agreement for Lake Champlain in 1993 that included a phosphorus load reduction
56
strategy from point and non-point sources. A recent (2000) review of progress showed
Draft Final Report: Not for Quotation or Citation
95
1
that the three States had considerably exceeded their reduction commitments. This
2
review also highlighted one of the limitations of such sectoral plans. In this case, the
3
nutrient reductions were being offset by nutrient load increases in other sectors,
4
principally conversion of agricultural land to urban uses.
5
6
These different levels of planning can be nested; i.e. vision exercise can be used to
7
establish the agreed goals prior to a more comprehensive planning exercise, and sectoral
8
management intervention plans can be scaled up to more comprehensive multi-sectoral
9
plans, with a combination of short-term action plans.
10
11
The advantages of taking a planned approach to management, compared to an ad hoc
12
approach, are essentially ones of efficiency and governance. Once the values to be
13
extracted from the lake basin (the goals) and the management actions are agreed, then
14
there is a much higher likelihood that resources will be used more efficiently to achieved
15
these goals if they are expended in a planned way. In addition, if the planning has been
16
carried out transparently and with stakeholder involvement, then there is also a higher
17
likelihood that all parties will feel that their needs have been considered seriously and at
18
least some will have been incorporated into the agreed plan.
19
20
In principle, a planned approach to management is particularly important for lake basin
21
management because of the long time frames and complex dynamics involved in lake
22
basin management. However, there are a number of pragmatic reasons why a
23
comprehensive lake basin plan may be impractical, and why it is more realistic to
24
commence with a more limited approach such as a sectoral development or remediation
25
plan. A common reason is that there is no widespread agreement amongst all the
26
stakeholder groups about sharing the resources of the lake basin--a lack of social
27
agreement. A related reason is a lack of political commitment to implement any agreed
28
actions. This can arise when the lake basin may be shared amongst a number of
29
jurisdictions that have quite different commitments to its management, different levels of
30
resources and different external drivers. Thus, Lake Malawi is of central importance to
31
the economy of Malawi itself but of considerably less importance to the other two riparian
32
countries--Tanzania and Mozambique. Unlike Malawi, the populations of the latter two
33
countries are concentrated in areas away from the lake. Consequently, there is at this
34
stage no shared imperative amongst the countries to manage the lake jointly.
35
36
Another common reason is that it is quite difficult to make an estimate of the potential
37
gain associated with different management interventions. Commonly there is either
38
inadequate knowledge about the long-term consequences of alternative management
39
actions, or there is a disconnection between those who possess this knowledge (usually
40
scientific institutions) and high-level decision makers. That is, decision makers do not
41
understand the implications of the scientific findings or the scientists themselves are
42
unable to articulate their findings in a way that is meaningful to decision makers. Further,
43
the time horizon of policy making is generally much shorter than the time it takes for the
44
lake to respond to interventions. This has been discussed in Chapter 7. Consequently, a
45
lake management plan usually consists of various individual sector and local
46
management interventions and initiatives rather than a self-contained comprehensive
47
plan.
48
49
A Framework for Analyzing Lake Basin Planning
50
51
The level of social consensus and the extent of knowledge about a lake basin are two
52
characteristics that, from the lake briefs, appear to determine the type and degree of
53
integrated planning that can succeed in a lake basin. While these two characteristics form
54
continua--the first runs from independent stakeholder group to societies where there is a
55
high degree of social agreement; and the second runs from little understood lakes to
56
ones where there is an extensive knowledge base about social needs, economic
Draft Final Report: Not for Quotation or Citation
96
1
implications and biophysical processes--it is convenient for discussion to represent them
2
by a simple 2x2 matrix (Figure 9.1).
3
4
Social consensus is an important determinant of integrated planning because of the
5
diversity of stakeholder groups and the importance of ext ernalities in lake basins. It is
6
difficult to maximize the aggregate benefits from a lake basin unless these stakeholder
7
groups appreciate the inter-dependency of their actions and the benefits that can be
8
gained from cooperation. The long time frames and the complex dynamics of lakes make
9
a reliable knowledge base (both socio-economic and biophysical) about a lake basin
10
important at all stages of developing a lake basin plan. It informs the agreement on
11
possible goals, the selection of management actions, and the implementation of those
12
actions, especially monitoring progress in meeting the goals.
13
Extent of Knowledge
Quadrant 1
Quadrant 2
High Consensus
High Consensus
Good Knowledge Base
Limited Knowledge Base
Quadrant 3
Quadrant 4
Low Consensus
Low Consensus
Social Consensus
Good Knowledge Base
Limited Knowledge Base
14
Figure 9.1. The influence of social consensus and state of knowledge on planning
15
16
The top-left quadrant (Quadrant 1) represents an ideal situation where there is social
17
agreement on the goals to be pursued and adequate knowledge on how to implement
18
management actions to reach those goals. Many small-scale sectoral resource
19
development projects with quantifiable objectives (e.g., fishery development, tourism,
20
etc.) fall into this quadrant, as do some conservation/remediation projects. Because of
21
the limited sectoral focus, the social agreement about lake basin management and the
22
ability to use good quality knowledge to guide implementation, sectoral plans in this
23
quadrant tend to be very successful. Thus a series of programs to reduce nutrient loads
24
from point sources in both USA and Canada received widespread public support and were
25
based on a strong scientific knowledge base. These programs have been successful to the
26
point where the majority of nutrients now enter the lake from diffuse sources, including
27
internal sediment loads.
28
29
As the lake resources become scarce and the interactions between these sector-specific
30
or localized developments and other sectors become more apparent, there is likely to be
31
either less social agreement or less knowledge about the long-term effects of
32
development and remediation interventions. Consequently there are fewer examples of
33
cross-sectoral and transboundary lake basin plans that fit into this quadrant. The best
34
examples come from the developed world where there are examples of cross-sectoral
35
and transboundary institutions that have been established to implement the plans for
36
lakes that fall into this quadrant. Thus the International Joint Commission for the
37
Laurentian Great Lakes was established following the 1909 Boundary Waters Treaty
38
between Canada and the United States to resolve disputes and to advise the
39
governments of on a wide range of issues affecting the Great Lakes. It has been effective
40
in promoting cooperative management of a range of pollution and ecological problems
41
facing the Great Lakes. Elsewhere there are examples of cross-sectoral or transboundary
42
institutions, such as the International Fund for Saving the Aral Sea (IFAS) and the Lake
43
Chad Basin Commission, that have been established but which have not been fully
44
effective because the necessary social consensus (and to a lesser extent, the knowledge)
45
has not been present.
Draft Final Report: Not for Quotation or Citation
97
1
2
The top-right quadrant (Quadrant 2) represents the cases where there is good social
3
agreement on the development and management of a lake basin but where there is
4
limited knowledge on which this management can be based. Of course, management
5
plans can be developed for lakes in this quadrant but the limited knowledge base implies
6
that the outcomes of these plans will be difficult to foresee. These lake basin plans would
7
typically include a knowledge development component such as an intensive monitoring
8
program or a scientific or socio-economic research component to reduce the
9
uncertainties. These plans would also be developed under the precautionary principle;
10
i.e. management actions would be conservative so that the chances of causing
11
unforeseen problems would be minimized. Examples of lakes that fit into this quadrant
12
include Tonle Sap, Lake Dianchi, and Lake Issyk-Kul
13
14
Lake Nakuru in Kenya represents an example of a lake basin in the bottom left
15
quadrant (Quadrant 3). There are a number of stakeholders in the lake basin completing
16
for the lake basin's resources (Box 9.2). However, there has also been considerable
17
amount of biophysical research undertaken by Kenyan government authorities with donor
18
assistance, a local University and NGOs into the water quantity and quality problems of
19
the lake and its catchment. The Lake Nakuru brief summarizes the situation as "It is now
20
widely recognized that the constraints to lake basin management are mainly social,
21
economic and institutional." Management plans for lakes in this quadrant tend to remain
22
sectorally fragmented. Thus, the Kenyan Wildlife Service has developed an Ecosystem
23
Integrated Management Plan for the Lake Nakuru National park surrounding the lake and
24
the Nakuru Municipal Council completed a Strategic Structural Plan for the town.
25
However, there is no overall plan for the basin that sets out agreed sharing of the
26
resources of the Basin.
27
Box 9.2. Competition for resources in the Lake Nakuru Basin
Lake Nakuru catchment (1800 km2) lies within the African Rift Valley. It is bounded to the west by the Mau
Ranges, to the north by the Menengai Crater and the Bahati Highlands to the Northeast and the Eburru crater
to the South. There are gently sloping open grasslands to the east. The lake receives water from these
surrounding areas and has no surface outlet. The town of Nakuru abuts the northern end of the lake.
Prior to 1900 the Lake Nakuru basin was sparsely settled with abundant wildlife. During colonial times the area
was occupied by large grazing and cropping properties. Since independence in 1963 there have been dramatic
changes in the land uses in the catchment with consequent pressures on the water resources. Initially, the large
farms were broken up into smaller settlement blocks for the indigenous population. These settlements
continued to expand up into the surrounding ranges. Between 1967 and 1988 the area under forest and natural
vegetation declined from 47% of the catchment to 26%. Even after the remaining forested areas were gazetted
for protection in the late 1980s, the clearing continued. Between 1994 and today a further 30,000 ha of forest
are estimated to have been cleared. Over 30,000 people are estimated to have settled in these areas.
Tourism is a significant industry in the area. The Lake Nakuru National Park was gazetted in 1968 and was
expanded in 1974. This National Park is most famous for the massed gatherings of flamingoes. The Park
receives the largest number of visitors of any National Park in Kenya.
The town of Nakuru has also grown dramatically from its inception in the early 1900s. It now contains over
400,000 people. Most of that growth has occurred in the last 20 years with the average growth rate being about
10% for the last decade. Apart from being a major administrative centre, the town is also an industrial centre
with textiles, fungicide production (since closed), agro-chemical production, and production of household goods.
This rapid development has placed severe strains on the basin's limited water resources. Aquifers supplying
Nakuru town are heavily utilized; rivers flowing into the lake have declined with upstream abstractions; water
quality in the lake is believed to have declined as a result of polluted storm water from the town; and sediments
loads to the lake have increased with the upstream land clearance.
Although there are sectoral plans of management, there is no overall plan of management that sets out how
the further development of the catchment will be controlled and how the existing stresses will be managed so
as to maximize the benefits to all those dependent on the catchment's water resources.
28
29
The bottom right quadrant (Quadrant 4) represents one of the most complicated and
30
difficult situations facing lake basin management. A typical example of when this occurs
31
is when a large-scale irrigation system is proposed upstream of the lake. The
Draft Final Report: Not for Quotation or Citation
98
1
consequences of this development on the inflow of water into the lake can sometimes be
2
difficult to predict if there are other influences on the lake's water level that are not well
3
understood. In the case of Lake Chad, the Lake Chad Basin Commission (established in
4
1964 by Chad, Nigeria, Cameroon and Niger) has been unable to effectively manage the
5
lake because some of the countries have pursued independent development of irrigation.
6
In addition there is only a limited understanding of the combined effects of water
7
withdrawals, climate variability and climate change on the lake's water level so that there
8
is no accepted knowledge base from which management decisions can be made. While
9
management actions will be undertaken in these lakes, it is difficult to develop any
10
coordinated plans in the face of limited knowledge and lack of social agreement.
11
Typically, these actions will be confined to individual sectors, such as fisheries or tourism,
12
and should ideally be based on a careful risk assessment of a particular management
13
intervention. However, this seldom happens.
14
15
It is important to note, however, that the forces (population growth, sectoral
16
development, climate variability, external economic forces) that are driving development
17
in the lake basin will change over time. If there is a sufficiently developed knowledge
18
base (quadrants 1 & 3) then the likely changes in these driving forces can be
19
investigated and absorbed into the planning process. Box 9.3 describes the "scenario
20
planning" process used in the Lake Peipsi/Chudskoe lake basin management program to
21
anticipate and examine the direction of future changes in the basin.
22
Box 9.3. Anticipating Changes in Driving Forces in Lake Peipsi/Chudskoe
Lake Peipsi/Chudskoe is managed by two countries, Estonia and Russia, that are each undergoing profound
economic, social and political change. Newly independent Estonia will soon join the EU, while Russia struggles
to find new political direction and regain economic growth after the collapse of the Soviet Union. Nevertheless,
the two countries established a Transboundary Water Commission in 1997.
Eutrophication is agreed to be the key problem facing the lake. The principle sources of the nutrients causing
eutrophication have been identified. Although there was a solid basis of scientific knowledge for the lake on
which management could be based, a conventional approach to planning did not seem appropriate because of
the high uncertainty about the economic, social and political development of the region. Planners could not
assume that the current drivers of change would remain relevant in the longer term.
Consequently, planners drew up development scenarios for the region for the next 15-20 years. The scenarios
were developed using a story-line methodology using both qualitative and quantitative information about the
lake and the basin. The driving forces included population growth, wastewater treatment improvements,
fertilizer use, livestock numbers, crop yields, atmospheric deposition of nutrients and the extent of agricultural
land use. The five scenarios incorporating these drivers were:
I--Business-as-usual (BAU)--a continuation of present trends;
II--Target/fast development--Estonia makes a fast transition to the EU and Russia experiences rapid economic
growth and social development;
III--Crisis--economic and social conditions in both countries deteriorate radically;
IV--Isolation--Estonia undergoes a slow and unwilling adaptation to the EU and Russia increasingly becomes
isolated from Europe and more nationalistic;
V--A combination of scenarios II and III (Estonia develops rapidly but Russia remains in crisis)
The planners confirmed that, under all these scenarios, eutrophication represented the major threat to the
lake's water quality, and that changes in the amount of land under cultivation was the major factor controlling
nutrient loads to the lake. No scenario predicted a larger nutrient load than had occurred during the communist
period. The Target/fast development scenario (II) resulted in a substantially larger total Nitrogen input to the
lake, while the Crisis scenario (III) resulted in the largest total Phosphorus load.
23
24
The above framework helps categorize and understand the wide range of lake basin
25
management plans reviewed in this project. The framework also helps develop insights
26
into how lake basin planning may be advanced through building of greater social
27
consensus and developing a stronger knowledge base. Development of a management
28
plan is only the initial step in systematically managing a lake basin. The plan has to be
29
implemented through space and time with the involvement of a wide range of
30
stakeholders.
31
Draft Final Report: Not for Quotation or Citation
99

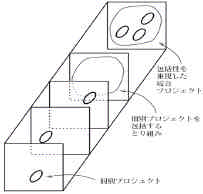
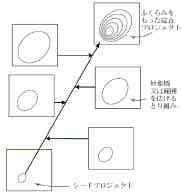
1
Administrative institutions, such as local governments, typically do not have boundaries
2
that follow lake basin boundaries, and management institutions are usually organized on
3
sectoral lines with very specific objectives and mandates to promote the development of
4
those sectors. These separate institutions compete for resources to achieve their
5
objectives, contrary to the reality of lake basins where the resources are interlinked
6
because of the complex dynamics and transmissivity of lakes. Because of these two
7
reasons--the mismatch in management boundaries, and the divisive nature of sectorally
8
based management--the management of ma ny lakes around the world is inefficient and
9
unable to provide the resource values that people require. Clearly an integrated approach
10
is required if these management shortcomings are to be overcome. In fact, the
11
integrated planning of lake basins is just a particular example of integrated water
12
resources management (IWRM). However, achieving a more integrated approach to lake
13
basin management is a great challenge.
14
15
Integration of Management Interventions over Time and Space
16
17
The common ways in which lake basin management is integrated across space and
18
across sectors and institutions is discussed here with a particular focus on the time
19
dimension. This is extremely important in public sector planning in general, but
20
particularly so in lake basin management because of the special characteristics of lakes
21
discussed in Chapter 1.
22
23
Given the way in which lake management problems cannot easily be quarantined
24
because of the transmissivity of lakes, it is desirable that the management of a lake basin
25
should be as integrated as is feasible across sectors, locations and social groups.
26
Integration can be developed through different institutional structures (Chapter 3). Here
27
we describe three ways (Figure 9.2) in which the lake Briefs how that management
28
activities can be integrated over time.
29
Integration by Encompassing
Integration by Unification
Integration by Broadening
Integration
by
Sequential
Broadening
Coverage
Coverage
Project
Integration of
Projects by
Broadening
Unification
of
Project
Coverage
Related but
Independent Project
Encompassing
Provision of
Integration of
Unifying
Projects
Framework
Individual
Project
Individual Project
Seed Project
(a)
(b)
(c)
Figures 9.2 a-c. Three Forms of Integration.
30
31
Integration by Encompassing
32
33
This type of integration (Figure 9.2a) occurs when an "encompassing" project or program
34
is instituted to facilitate coordination of independently developed sectoral programs and
35
projects that are operating at the same time . This kind of integration is usually
36
introduced when it becomes apparent that greater benefits can be gained from
37
coordinating existing activities so that the objectives of more than one beneficiary group
38
can be achieved. Typically, this integration will include cross-sectoral coordination across
39
different government Ministries, and even different countries for transboundary lakes,
Draft Final Report: Not for Quotation or Citation
100
1
when the beneficiaries belong to more than one sector. For example, the Lake Biwa
2
Department of Lake Biwa and the Environment in Shiga Prefecture, Japan was
3
established for the purpose of bringing together and integrating existing projects in the
4
areas of forestry conservation, sewerage construction, environment, and watershed
5
management to implement the "Lake Biwa Comprehensive Conservation Plan".
6
7
Integration by Unification
8
9
Lake management interventions typically take place sequentially and intermittently as
10
problems become apparent and responses become feasible as agreements are reached,
11
funds become available and information on possible actions is acquired. Of course, if
12
these interventions were the result of a plan, then there may be no need for "integration"
13
because the integrative design should be imbedded in the plan. In reality though, these
14
interventions are usually introduced because of changing social needs, deteriorating
15
water quality, shifting ecosystem responses, etc. Consequently, a unifying program is
16
introduced to ensure that these projects all contribute to longer-term goals. The Zoning
17
and Management Plan for Aquaculture (ZOMAP) in Laguna de Bay provides a typical
18
example. The competition for Laguna de Bay's aquatic resources has been fierce for
19
decades, particularly during the 1970's and 1980's. It was due particularly to the
20
introduction of fishpen culture technology during the mid 1970's that immediately
21
became a lucrative operation for the large-scale commercial operations. In 1980s,
22
Laguna Lake Development Authority (LLDA) attempted to introduce various measures
23
both to conserve the fishery resource as well as to support small-scale local fishermen,
24
and specifically in 1983, a zoning plan of the entire lake surfacewas introduced for the
25
first time. It was an early version of more refined ZOMAP to be introduced later, designed
26
to rationalize the management and regulate the utilization of the fishery resources. The
27
comprehensive Master Plan of zoning was approved in 1996. The Plan was later in 1999
28
placed under LLDA's Lake Management Division. ZOMAP acted as a kind of unifying
29
project, providing a basis for the new phase of sustainable fishery resource management
30
for the lake, with clearer delineation of responsibilities and political commitments.
31
32
Integration by Broadening
33
34
The previous types of integration dealt with the pursuit of a specific objective over time.
35
But the breadth of projects being integrated can also expand over time so that a broader
36
and broader range of topics, areas and social groups are encompassed. If this is
37
undertaken in a predetermined and planned way, then this is equivalent to moving from
38
a series of sectoral or local plans to a more comprehensively planned management of a
39
lake basin. For example, fringing wetlands around Lake Constance have been restored for
40
biodiversity conservation over the past decades, with the extent of restored shoreline
41
gradually expanding to provide for natural habitats. This is an example where the
42
broadening has occurred over space. On the other hand, it was the extent of legislative
43
involvement in eutrophication management was broadened considerably with the "soap
44
movement" in Lake Biwa in the late 1970's. Initially this was a local movement that led to
45
a "eutrophication control ordinance" that eventually culminated in the enactment of
46
national legislation, "the Lake Law", that allows for a range of conservation interventions
47
by the national government in lakes throughout Japan. This broadening took place over
48
some decades.
49
50
Draft Final Report: Not for Quotation or Citation
101
1
Integration Lessons
2
3
Three lessons can be drawn from the lake briefs about successful integration;
4
5
(1) integration should first take place where the pressures are greatest
6
(2) integration should be phased over time
7
(3) integration should be pursued by necessity rather than by design
8
9
Integration should first take place where the pressures are greatest
10
11
For integrated lake basin management to be successful there needs to be good
12
governance coupled with the necessary enabling conditions. These include a political
13
commitment to managing the lake basin in the long term for the benefit of all
14
stakeholders, effective institutions, a sense of consensus amongst the stakeholders, and
15
a good level of biophysical and socio-economic knowledge about the lake basin.
16
Experience shows that moving too quickly to integrated lake basin management before
17
these conditions are established does not work (Lake Chad provides an example where
18
the initial enthusiasm for a transboundary commission was not matched by long-term
19
political and financial support). It is better to start small, by bringing together the
20
management agencies and stakeholders where the issues are apparent and there is a
21
developing social consensus that they need to be managed properly. This is often within
22
a sector, such as fisheries, or with a problem such as pathogens from sewage where the
23
pressures on the resources quickly becomes apparent. Success in correcting this problem
24
builds confidence for tackling other problems. Examples of this incremental approach to
25
integration are given in Box 9.4 for Lake Ohrid and Chilika Lake.
26
Box 9.4. Building on Initial Success
Lake Ohrid, Macedonia and Albania
Lake Ohrid, shared by Macedonia and Albania, is an important cultural, economic and environmental resource.
It faces problems from water pollution from old mines, town sewage and stormwater, agriculture and
groundwater inflows from a nearby polluted lake. Lakeshore wetlands and riparian areas are threatened and
exotic fish species have been introduced to the lake. An important commercial and cultural fish species, the
Lake Ohrid trout, is threatened by overfishing as well as by the pollution, loss of breeding grounds and the
introduced species. Both countries have agreed that the fisheries are in immediate danger and rapid
management action is required. Scientific studies show that the fish in the lake are one single, linked
population, and so they must be managed collectively, with similar requirements in both Macedonia and
Albania. With assistance from bi-lateral and multi-lateral donors, Government officials and fisheries experts in
both countries have agreed to a unification of some of the fisheries regulation. For example, in 2001, both
countries agree to the same allowable net size. While there are still significant differences in the organization of
the fishing industries in the two countries, these early successes with fisheries management (coupled with the
establishment of a non-executive Management Board for the lake, and agreements on treating the sewage from
urban areas around the lake) provide a foundation for increasing cooperation in managing the lake.
Chilika Lake, India
Chilika Lake, on the east coast of India, is an estuarine lake system noted for its scenic beauty, its productive
fisheries, its religious significance, and its importance as a resting place for migratory birds. However, due to
diversion of inflowing rivers for irrigation, and increased silt loads from inflowing rivers, the lake exit has
become silted up and fish catches have declined dramatically. Consequently, the overall average salinity was
reduced by 33-34% by late 1995-1996. With the shift towards a more freshwater system fish landings declined
from an average annual yield of 6000-8000 mt during 1970-1990 to 1270-1630 mt in 1990-1997. Over
200,000 people are dependent on this industry. To compound the threat to their livelihoods, the Revenue
department introduced new licensing arrangements in early 1990's that effectively handed over their traditional
fishing rights to investors in prawn farming. Apart from sedimentation and water withdrawals, there are also
threats from wastewater, agricultural chemicals, weeds, and deforestation in surrounding catchments. A
Management Authority was established for the lake in 1992 to coordinate and promote lake restoration and
development across the operational agencies. A new entrance was dredged to the ocean in 2000 to provide
more direct interchange between the lake and the ocean. The results were dramatic � salinity levels in the
northern sector of the lake changed from 0.5 � 2.5 ppt to 0.1-36.00 ppt, and fish landings increased from 1600
mt before intervention to 11,877 mt in 2001-2002. there were other benefits in crab catches and in reductions
in aquatic weeds. The obvious success of this engineering intervention in the lake has provided strengthened
the hand of the Chilka Development Authority in implementing other aspects of lake management, including
non-structural measures.
Draft Final Report: Not for Quotation or Citation
102
1
2
Integration should be phased over time
3
4
This lesson is a corollary of the previous one. It typically takes many years, even
5
decades, for goals to be agreed by the stakeholders in single sector issues, let alone
6
multi-sectoral problems; for sufficient knowledge to be accumulated for effective
7
management; for institutions to be established or coordinated; for laws to be passed and
8
rules developed; etc. Thus, the approach of starting small and building on successes
9
towards a mo re comprehensive lake management plan will take many years. All
10
stakeholders need to be committed for the long-term for these plans to be successful.
11
The Lake Naivasha Riparian Association has evolved over several decades from the
12
earlier Lake Naivasha Riparian Owners Association (1929) to take on an increasingly
13
wider responsibility. Originally formed just to manage the use of the exposed lake bed by
14
riparian owners, it now has a much wider role in environmental management of the lake
15
and contributes to the lake's Management Implementation Committee which is in the
16
process of being gazetted under the Environmental Coordination and Management Act
17
(Box 3.1).
18
19
Externally funded assistance projects typically last for 3-4 years. While, at first sight, this
20
is inconsistent with the need for long-term management, many of these projects include
21
components to help develop the good governance and enabling conditions that are
22
needed for long-term lake management. However, even this focus on establishing the
23
conditions for long-term management needs to be maintained. As some lake briefs make
24
clear (e.g. Lake Malawi) there are often no mechanisms established for sustaining this
25
external assistance beyond the duration of the project.
26
27
Integration should be pursued by necessity rather than integration by design
28
29
Regardless of any of the above modes of integration, we should keep in mind that there
30
will not be any perfectly integrated management plan. Naturally, a management plan that
31
is subjected to only minimal integration may bring about a more desirable outcome than
32
a plan that is subjected to highly complex and difficult integration. In the case of
33
management of a system that is as complex as a the lake basin system, in general,
34
integration by necessity is likely to bear better fruit than integration by design.
35
36
Adaptive Management Planning
37
38
The management plan describes what actions should be taken and activities
39
implemented. A comprehensive management plan would include necessary policy
40
changes, new or revised standards and guidelines, new or revised regulations, new
41
legislation, proposals for the introduction of new technology and practices, and plans for
42
remodeling existing infrastructure and introducing new infrastructure. There are a wealth
43
of such actions and activities that could be included in the plan, but in most cases, skilled
44
human resources, time and money are limited. Hence, the question is what should be the
45
priorities and in what sequence should actions be taken and activities implemented.
46
47
Priorities are important, but there is another equally important problem associated with
48
developing and implementing lake basin management programs. The kind of
49
management plan that lake basin management programs need to focus on in the future
50
is quite unlike traditional, static master plans that are largely based on forecasts and
51
predictions. A blue print for achieving targets and outcomes on this basis is unlikely to be
52
effective in the complex and highly dynamic context of lake basin problems today--there
53
are too many uncertainties, unknowns and untested assumptions. For example,
54
uncertainties about ecological processes and functions, the impact of different patterns of
55
resource use, and uncertainty about political and social development and change in the
56
future and hence what values and conflicts might constitute driving forces. The risk of
57
wasting limited resources on actions and activities that do not bring major benefits in
Draft Final Report: Not for Quotation or Citation
103
1
terms of the agreed targets is large in the face of these kinds of uncertainty. Hence, lake
2
basin management planning in the future should have the character of adaptive
3
management planning.
4
5
Adaptive management planning is a process for developing a management plans based
6
on an explicit set of assumptions and hypothesis about the elements and components of
7
the lake basin natural and man-made system and how they function and interact. In
8
adaptive management, the monitoring program is designed to provide a feedback loop
9
that enables the planning team to assess these assumptions, improve its model of the
10
lake basin system, assess progress towards the targets, and adapt and adjust the plan to
11
reflect what has been learned from the expanding knowledge base. In this approach
12
scientific research, data gathering and monitoring is directly linked to management, and
13
in turn, how resources are allocated to research and knowledge development is driven by
14
management priorities. Adaptive management planning is therefore knowledge and data
15
driven, and analytical because of its reliance on models. But it is also stakeholder based.
16
It relies heavily on the participation of stakeholders to establish goals and targets, to
17
manage competing objectives, and to weigh options and tradeoffs.
18
19
Planning for Sustainable Lake Basin Management Institutions
20
21
A lake basin management program is not a project, it is a long term process. The
22
planning for lake basin management also have to reflect that long term process. It will
23
also have to function in both the biophysical, administrative and political world.
24
Significant amounts of informa tion are needed for the management plan to function
25
effectively, deriving from a knowledge base built over the long term. The changes it is
26
designed to promote occur over long periods during which any number of key factors
27
influencing the outcome and choic e of activity can change dramatically. Hence, how such
28
a long-term program is organized, staffed, resourced, and positioned within the
29
administrative and political system is critical to achieving the desired outcomes of the
30
plan at hand.
31
32
However, an important principle noted in Chapter 3 is that the chosen institutional
33
arrangement, and the roles and responsibilities assigned to that institution, for the plan
34
to bring forth the desired outcome, should be limited to those that cannot be effectively
35
and efficiently done by others. There are several examples among the Briefs of
36
experience in which effective progress has been achieved through local groups,
37
partnerships and organizations--essentially local arrangements developed by
38
stakeholders (including local and central government partners in some cases). This
39
reinforces this principle, suggesting again the necessity of adapting the mandate, role,
40
functions, and powers of a lake basin management organization to fit the particular
41
circumstance and needs of the lake basin, and in doing so, to take advantage of,
42
strengthen and enhance existing arrangements that have been effective.
43
44
There are instance in which governments have established a statutory body with broad
45
functions and powers for lake basin management. However, more generally there are
46
really few examples of effective basin management authorities. Laguna de Bay is an
47
interesting case because this statutory Authority has only gradually exercised their full
48
mandate and powers, allowing time for sufficient growth in capacity, and for learning,
49
evolution of governance arrangements, and the emergence of key networks and
50
constituencies. A lake basin management plan, thus should take into account such
51
evolution in governance, organizational form, mandates and powers that appears to be
52
the norm. Often, time can also be purchased with some early successes in the
53
implementation of a management plan by tackling visible and do-able activities first.
54
55
Regardless whether the lake basin management organization is primarily a coordinating
56
agency, a planning agency with little implementation authority, a regulator, or fully
57
empowered statutory authority or commission, the importance of staff numbers, a lake
Draft Final Report: Not for Quotation or Citation
104
1
basin management plan needs skills mix and continuity over the long term. Short-
2
termism, or ad-hocism--expecting the problems to be solved in a relatively short project
3
period, often with borrowed or seconded staff, is a major risk to the success of lake basin
4
management programs. Projects formulated to promote or support a lake basin
5
management program should, as first priority, invest in people and capacity, and only
6
through that emerging capacity, undertake to implement the functions of the lake basin
7
management organization.
8
9
Further, from a broader perspective, the initial steps and activities for development as
10
well as implementation of a lake basin management plan should focus on establishing
11
three things: effective collaboration with cooperating and partner organizations (even
12
then they initially don't see themselves as partners, or for that matter, even concerned);
13
effective coordination of the activities of agencies active in the lake basin; and a broad
14
consensus on goals and objectives and hence on the option space.
15
16
Many traditional government agencies are not receptive to collaboration, which they see
17
as needless interference in their affairs. Others are reluctant to collaborate because they
18
see the potential to lose prerogatives or future opportunities to expand their activities. In
19
the beginning, therefore, establishing effective collaboration, and hence partnerships, will
20
be based on the persistence, state of mind and attitude of the agency in charge of lake
21
basin management. Much the same can be said about the problem of coordination.
22
Experience suggests coordination is relatively easy when agencies agree on the goals and
23
the broad outlines of what is to be done, i.e., the lake basin management plan. Otherwise
24
it runs aground on the same issues as collaboration. Achieving effective coordination of
25
activities, policies, regulations, etc., often involves establishing formal mechanisms, but
26
at no higher levels or with more overarching authority than is really necessary for
27
effective and efficient action. Consensus building is achieved through a number of
28
different me chanisms generally working at the same time, but the keys are awareness
29
raising, inclusion and informed participation.
30
31
Planning for Lake Basin Governance
32
33
While the above frameworks of analysis are useful for development and implementation
34
of a management plan within the confine of a particular lake basin system, in reality
35
often, the focus of the management plan may have to be shifted to a broader scope of
36
sustainable regional and national development. The policy and institutional context that
37
must be navigated to meet such needs, then, may become daunting. The existing
38
institutional arrangements (laws, policies, development and resource user organizations,
39
and government bodies) in most lake basins, that were established to promote
40
development and use of its natural resources or are intended to regulate these activities,
41
are in most lake basins in the developing world an integral if not major part of the
42
problem. Thus a key lesson is here is that the future of lake basin management in many
43
cases will depend on how well the core partnership can be developed and enhanced
44
about the plan for which governmental organizations at all levels, the private sector,
45
NGOs, and other civil society, as well as resource user and stakeholder groups need to
46
work together.
47
48
As discussed in Chapter 2, the progress of degradation and loss of resource values in a
49
lake basin and the emergence of scarcity as a controlling factor, is often slow and
50
relatively unnoticed. Hence, a decision maker is often the last to arrive on the scene,
51
especially in developing countries. Development of the resource values in the lake basin
52
may have been taking place for a considerable time. As a consequence, much of the
53
governance framework (rights, policies, institutions) associated with the use and
54
development of resources (land, water, forests, grazing land, river channels, etc.) may be
55
well-established and strongly biased towards continued expansion and development.
56
Limits on resources, the costs of externalities such as pollution or erosion, the gradual
57
decline in resource values, or the spread of unsustainable practices caused by increased
Draft Final Report: Not for Quotation or Citation
105
1
vulnerability of livelihoods or poverty may not be recognized. Indeed development and
2
regulatory functions may be so fragmented that each narrow sector perspective is likely
3
to believe that these are the problems of others.
4
5
Much of what is meant for lake basin management will aim to bring about beneficial
6
changes in behavior and policy, the adoption of new technologies and practices,
7
improvement and enforcement of environmental regulations and standards, as well as
8
changes in infrastructure investment. Bringing about these changes depends importantly
9
on the quality of governance, i.e., the accountability of this myriad of organizations,
10
public access to data and information, the transparency with which decisions are taken,
11
the extent to which rights, especially customary rights, are established and respected,
12
and the adherence to policy provided in existing legislation and the regulations and rules
13
that emerge from this legislation (Figure 9.3).
14
Scientific
Technological
knowledge
Response
Funds
Choice of
and
policy mix
financing
Informing
Effective
the public
institutions
A management plan to implement
Governance Considerations:
�
Legitimacy
�
Transparency
�
Accountability
�
Fairness
�
Acceptability
15
Figure 9.3. A Conceptual Framework of Lake Basin Management with Governance
16
Considerations.
17
18
Where governance is especially weak, the lake basin management becomes a daunting
19
task, especially so since it may certainly not be within the realm of lake basin
20
management to pursue such broad and sweeping changes. However, in most developing
21
countries, many of these aspects of governance are already undergoing change, and the
22
decision maker can be a powerful voice in promoting and facilitating the acceleration and
23
broadening of these changes. In doing so lake basin management today has access to
24
several powerful tools whose use is central to management programs --stakeholder
25
participation and partnerships, and an accessible knowledge base.
Draft Final Report: Not for Quotation or Citation
106
1
2
Like any plan for natural resource management, the political support, commitment and
3
will to the success are indispensable for lake basin management. The fostering of political
4
support must also be reinforced with public support, awareness and understanding. For
5
that, the impacts of degradation and the benefits of restoration need to be communicated
6
to the policy makers in terms that they can understand and relate to. In addition, for lake
7
basin management plans to succeed, the role of the "champions" should not be
8
overlooked. Often, they are the one who can provide or mobilize sufficient political will
9
and support. On the other hand, in many developing countries, political factors are
10
frequently subject to radical change. The instabilities can have major adverse effect on
11
sustained lake basin management. Hence, it is important for a lake basin management
12
plan to allow for flexibility as well as risk mitigation and adaptation.
13
14
Draft Final Report: Not for Quotation or Citation
107
1
Chapter 10: Towards the Future
2
3
This report has discussed the major issues facing lake basin management and the range
4
of options that might be considered to address these issues. It has also discussed the
5
unique biophysical characteristics (long retention times, complex biophysical dynamics,
6
and transmissivity) that make sustainable use and management of lake basin resource
7
values a more complex environmental and natural resource management challenge.
8
9
Notwithstanding the unique resource values and character of lakes as a major feature in
10
a river basin, the Report has not focused solely on the problems of lake water bodies.
11
Instead, the Report tries to show how the lake water body and its associated resource
12
conservation problems should be seen and addressed in a larger biophysical, ecological
13
and political context in order to select effective, sustainable and integrated strategies and
14
options that can address the causes of those problems. The Report has therefore focused
15
on the major challenges--institutional arrangements, policy, knowledge and information,
16
participation, and financing--and the broad range of governance considerations
17
characterized with principles and options that emerge from our recent lake basin
18
management experience.
19
20
The 28 Lake Briefs provide ample experience from which to draw lessons. But, it is also
21
important to recognize that in the broader management context of a lake basin, there is
22
much to learn from management efforts of other natural resources. For example, lake
23
basin management has much in common with sustainable management of particular
24
natural resources (land, forests, fisheries, rangelands, wetlands and other environmental
25
values and services), or the sustainable use of multiple resource values within small and
26
even micro-catchments as well as whole river basins. Those who are involved in lake
27
basin management can join networks of these other natural resource managers by many
28
means, but specially through the use of Internet facility.
29
30
Nonetheless, the future of lake basin management, both for individual lakes as well as for
31
lakes across the world, won't become sufficiently promising unless the state of existing
32
lake basin management programs is clearly understood.
33
34
Reassessing Existing Lake Basin Management Programs
35
36
As noted throughout the Report, the lessons and experience learned from the 28 lakes
37
brought forth a comprehensive picture of the global state of lake basin management
38
today. The picture depicted is that among the selected programs, few seem to have
39
succeeded in reversing the trend of lake environment deterioration and the associated
40
degradation in resource values. Many lake basin management programs, however, have
41
advanced far enough to pause and reflect, even though they may be overwhelmed by
42
more roadblocks than they feel they can deal with. For them, the past, ongoing and
43
emerging collective experience in lake basin management does give a great deal of
44
insight in the future course of action that might be usefully undertaken. The lessons
45
obtained suggest that we will have to make sure we understand the problems and issues
46
facing individual programs. Where is the state of the lake today, both biophysically and
47
managerially? What impact has the existing management program in terms of
48
sustainable management of the lake, i.e., development and conservation/remediation of
49
its resource values? Are we moving in the right direction and are we sure we know what
50
that direction ought to be? What do we know now that we didn't know at the beginning?
51
Specifically;
52
� What is the status of the knowledge base? Is a monitoring system in place
53
that would enable you to measure changes in key indicators? Is the data base
54
sufficient? What are the remaining key gaps? Are information management
55
tools in good enough shape to be deployed effectively?
56
� Is the capacity building and training program effective? Still targeted on
57
priority skills? Is it inclusive and open to cooperating agencies, community
Draft Final Report: Not for Quotation or Citation
109
1
groups, etc.? What mid-course corrections are needed, e.g., are there new
2
skills not considered when you started?
3
� Has political will and commitment grown, or has it waned? Is sustaining and
4
building this a part of your program and how well is it working? What can you
5
do more of, what should you do less of, and what can you do better?
6
� Are effective mechanisms in place for effective stakeholder participation? All
7
stakeholders? What has been the change in awareness and understanding of
8
the problems and their linkage to stakeholder activities? What is the
9
perception of stakeholders of the program?
10
� Are the priority elements of management plan properly implemented? Do we
11
have an adequate management plan, or should it be brought up to date? Are
12
priorities and phasing clear? Are resources sufficient? Have we built the
13
coalitions that would enable the required actions to be implemented? Is
14
coordination adequate? Have either technology options or costs changed, and
15
are these changes reflected in the management plan?
16
17
It is comparatively easy to look outward from a program, but much more problematic to
18
look inward with a "collective critical eye". A program might ask itself if we have a
19
sufficient number of the right kind of skills--answers to this question depend not only on
20
current bottlenecks and constraints that can be reasonably attributed to staff skills, but
21
also on reassessing the organizations mandate and objectives, authority (powers and
22
functions), and its work program. Specific questions to ask may include:
23
� Can we keep the staff we have or an expanded staff? Some programs are put
24
together initially in an ad hoc manner with staff seconded from different
25
sources for relatively short periods, an approach that can work relatively well
26
in the short run. Has the program reached the point where a more permanent
27
arrangement is going to be needed to sustain the program over the long-term,
28
and what needs to be done to ensure this?
29
� Do we have an adequate statutory basis to enable us to do what we know
30
must be done in the future? When should these changes be in place?
31
� What is there about the institutional capacity, beyond staffing, that limits
32
achieving effective implementation and constrains choosing the right option
33
among a range of possible actions? What can be done to remove these
34
constraints?
35
� Is there a champion(s) to sustain support and activate political will? Is the
36
champion listened to by politicians and senior officials? How can the situation
37
be dealt with without the champion?
38
39
Dealing With Roadblocks
40
41
There seems to be no end to the range of issues and problems that lake basin
42
management programs face in moving towards their objectives of restoration and
43
sustainable use of lake basin resources. However, the 28 lake briefs gave us clear
44
message that most issues can be overcome by building the knowledge base, effective
45
stakeholder participation, partnerships or collaboration among the concerned agencies.
46
But there are some really difficult issues that seem almost insurmountable. Among these
47
are:
48
� Policy conflicts, especially those that arise from long entrenched sector
49
interests, priorities or prerogatives, and that in many cases are inherent in
50
existing laws and regulations;
51
� Politic al motives and agendas that run counter to the best interests of
52
sustainable use of a lake basin's resources;
53
� Lack of a voice--an unresponsive political system or administration;
54
� Corruption that encourages the particular behaviors and actions the program
55
is trying to change;
56
� Jurisdiction boundaries that are creating barriers to effective and coordinated
57
action;
Draft Final Report: Not for Quotation or Citation
110
1
� Lack of money to do something.
2
3
These appear to be insurmountable questions to those in charge of management of
4
individual lake basins. However, it is clear also that, as this experience and lesson
5
database expands with the participation of other lake basin management organizations, it
6
can be expected that we find and learn of new and even more innovative ways of dealing
7
with these difficult issues. The emerging messages coming from the 28 lake briefs
8
suggest, however;
9
�
Be creative and proactive, with advocacy backed by analysis of good data;
10
�
Help to build coalitions and constituencies for change by intensifying efforts to
11
create awareness and understanding of the situation and the risks--try to put
12
our case in the terms and forms most relevant to those who can support the
13
changes;
14
�
Leverage external support and access that will enable the program to have
15
greater voice;
16
�
Pursue sector policy reform (water, agriculture, forestry, energy, etc.) and
17
seek out the champions of reform in different key sectors, join the reform
18
process, and support it whenever possible. Marshal evidence that care of the
19
lake basin will benefit various sectors dependent on the resources of the lake
20
basin. Critical values can be added to that reform process by showing how
21
additional benefits can be gotten from such reforms (and serious costs and
22
risks of loss avoided), by showing how the special vulnerability and associated
23
risks of lakes and reservoirs can be reduced through the reforms .
24
25
One of the most difficult questions is resolution of conflict over resources or access to
26
resources. These conflicts are causing political bottlenecks to change or creating
27
controversy that is hardening opposing positions and views. Seek if "win-win" solutions
28
can be created by giving opposing sides reason to come to agreement. The lake briefs
29
collectively imply the following;
30
�
Most conflicts over resources or access to resources (even the requirement to
31
reduce pollution discharges) are seen by at least one party to the conflict as a
32
"win-lose" situation--someone else gains but I have to give up resources or
33
incur greater cost, or both--there are many ways around and through this
34
mentality, but the most promising are approaches that work to increase the
35
amount of resource available, or enlarge the idea of what is being shared, i.e.,
36
total benefits rather than water, so that each side feels they gain significantly
37
from the agreement;
38
�
Are there technologies or infrastructure which can change the ways in which
39
resources and especially benefits can be equitably shared (storage, water
40
saving technology, or waste reducing technology are good examples)? Is it
41
possible, for example by improving efficiency to increase the level of resource
42
availability? Who could pay for these changes? Much creative thinking is
43
useful in this regard and there is experience globally on how one side of the
44
dispute could pay for a technological change by the other side in return for a
45
substantial share in the benefits without the other side losing benefits and
46
perhaps even gaining as well.
47
�
Are there policy and legal changes, such as the allocation of secure and
48
tradable rights, or resource pricing, or access charges, that could alter
49
demand and lead to resolution of the conflict;
50
�
Water scarcity conflicts are often exacerbated by the traditional supply side
51
mentality of sector organizations, hence, promoting a shift to demand
52
management on their part may also help to alleviate conflict;
53
�
Creating and sharing revenue streams through the imposition of user or
54
access charges, or pollution charges for example, open new ways for
55
stakeholders to share in the benefits of resource use that opens the door to
56
compromise.
57
Draft Final Report: Not for Quotation or Citation
111
1
From Lake Basin Management Initiative to Global Lake Basin Governance
2
3
Toward Global Stakeholder Participation and Partnerships
4
5
Every global natural resource management experience today points out the importance
6
and the central role of effective stakeholder participation at every step in its process. The
7
central lesson from this Lake Basin Management Initiative (LBMI) project also points to
8
that direction. Essential awareness and understanding to overcome the barriers and
9
opposition can be created only through broad participation of stakeholders. Improved
10
governance, especially in terms of accountability, won't be achievable unless a large and
11
committed constituency with a strong voice for change exists. When stakeholders are
12
able to both understand and have an influence on the choice of goals and options, even
13
those who may initially see themselves as losers can often become proactive supporters.
14
In some contexts, the participatory approach may run counter to existing political,
15
cultural and social norms. In these instances, the lake briefs suggests (Tonle Sap, for
16
instance) that a gradual, very site specific approach that yields quick local benefits can
17
be successful in gradually overcoming these barriers.
18
19
Similarly, the lake briefs illustrated that the typical institutional setting for lake basin
20
management involves a large number of organizations both governmental and non-
21
governmental. Implementation of a management plan thus requires effective
22
partnerships with key organizations. The same is true globally. Most lake basin projects
23
carried out in developing countries are supported in various capacities by more than one
24
agency of technical collaboration and/or financial support, some with catalytic funding
25
coming from GEF. It is evident that the role played by GEF has been extremely important
26
and instrumental. It is also apparent that GEF alone won't be able to meet all the
27
expectation of lakes in the world in need of basin management program. Exploration for
28
new and innovative approaches for partnership among key agencies would become
29
extremely important.
30
31
Toward Enhancement of the Global Lake Basin Management Knowledge Base
32
33
Amply evident throughout the process of LBMI Project was the importance of developing
34
the broad and reliable knowledge base for lake basin management. Development and
35
enhancement of knowledge base for better management of individual lakes is extremely
36
important. However, with limited financial and manpower resources to go around, a great
37
many lakes in developing world will continue to suffer from meager knowledge base that
38
won't be effectively updated or upgraded. The international technical cooperation
39
agencies, scientific communities, local and international NGOs specializing in lake basin
40
management must collectively seek ways to mobilize resources to help those lakes to be
41
able to take advantage of the exiting knowledge base for better management as well as
42
for being able to generate important information resources that will themselves form the
43
knowledge base useful for better management of lake basins elsewhere. This is
44
particularly important today as the threats to lakes in the world have been increasing
45
rather dramatically due to increased global risks leading to increased vulnerability.
46
Perhaps, use of the modern information management technologies, be they planning
47
tools like GIS, remote sensing, database management, computerized models, etc., will
48
greatly facilitate the organization, management and use of the knowledge base as
49
exemplified in many of the lake briefs.
50
51
Draft Final Report: Not for Quotation or Citation
112
1
Appendix A: Economics, Total Value, and Total Economic Value
2
(TEV)
3
4
The concept of Total Value and Total Economic Value (TEV)
5
6
The value, or economic value, of the lake and its resources is composed of many
7
different components. Some components are very tangible and visible (fish caught or
8
water extracted) while other uses may be very intangible or difficult to measure (the
9
cultural benefits of a lake; certain biodiversity values). When all the various uses and
10
benefits are identified and their separate values are included in the analysis (to the
11
extent possible) economists refer to this as the Total Economic Value (TEV) approach.
12
This approach merely recognizes the reality that any natural resource system has many
13
different uses and users, and each use has its own contribution in economic terms to the
14
value of the resource. Whether one calls this approach a Total Valve approach, or a Total
15
Economic Value approach, really does not matter--they are actually the same thing.
16
17
The TEV approach includes both use and non-use values alike (see Figure A.1). Use
18
values are those benefits that come from direct use of, or interaction with the lake (e.g.
19
fishing, extracting water, or transportation on the lake). Non-use values are benefits that
20
do not require any direct interaction with the lake itself. Examples of non-use values
21
include the benefit from just knowing that the lake is there, or the benefit from knowing
22
that one's children will be able to enjoy the lake. Obviously a major challenge to
23
estimating TEV is putting "prices" or economic values on many uses that are not normally
24
bought and sold in the market (this is particularly true for non-use values).
25
26
Modern environmental economics has developed a number of valuation approaches and
27
techniques that can be used to value the different components of TEV, including those
28
that do not normally have a market price (such as the various types of non-use values).
29
Numerous books exist on these techniques and their applications and Box A.1 in
30
Appendix A gives a brief introduction to some of these major valuation approaches.
31
Total Economic Value
Use Values
Non-use Values
Direct Values
Indirect
Option
Bequest
Consumptive
Values
Values
Values
and non-
Ecosystem
Premium
Benefits for
consumptive
functions and
placed on
future
use of
services
possible future
generations
resources
uses
Existence Values
"Knowing that it is
there..."
32
33
Figure A.1. Total Economic Value
34
35
While a complete, formal TEV calculation is rarely done (because of the data and time
36
necessary to do it), the strength of the concept is in reminding us that there are a
37
number of components to the value of any resource--some that are quite easy to
Draft Final Report: Not for Quotation or Citation
113
1
identify and measure, others that may be quite difficult to value in monetary terms. As
2
such, the TEV approach helps the decision maker/planner to think about who are the
3
various stakeholders and whose values (welfare) will be affected by different
4
management options.
5
6
Although doing a complete, formal TEV analysis can be time consuming and difficult, an
7
informal, conceptual TEV analysis can be done quickly and at low cost by using an expert
8
opinion approach (including of course representative stakeholders from the lake basin
9
itself). This conceptual TEV can be done formally in a Delphi type exercise, or more
10
informally in a roundtable guided discussion. (A Delphi approach is an expert-opinion
11
based system where a facilitator is used to reach a consensus and reduce the impact of
12
different experts personality on the final outcome.) Using either approach, reasonable
13
qualitative results can be obtained relatively quickly. Appendix Boxes A.2 and A.3
14
illustrate the use of the TEV approach at Laguna de Bay and Lake Sevan, respectively.
15
The Laguna de Bay lake brief explicitly carried out a TEV exercise and attempted to
16
estimate the economic values for a number of different components of the TEV. In the
17
case of Lake Sevan a TEV exercise was not done but could have been carried out based
18
on the material presented in the lake brief.
19
20
Since the TEV approach is a "social welfare approach"--one in which the "whole" (the
21
total social welfare) is equal to "the sum of the parts" (individual welfare measures)--the
22
differing values and preferences of ALL of the stakeholders in the lake basin should be
23
reflected. The implication of this assumption is that since changes in well-being (or
24
welfare) of ANY stakeholder is part of the total analysis, an appropriate management
25
structure will take into account welfare changes anywhere in the lake basin, not just for
26
any narrowly defined group (e.g. fishermen, water users, transportation providers). As
27
such, the TEV approach is very appropriate when the decision maker is trying to take a
28
lake basin perspective, and reflect the concerns and interests of ALL of the participants/
29
stakeholders in the lake basin economy. Note that the TEV analysis is NOT done by a
30
group process--stakeholders views obviously are crucial in identifying the different
31
components of the TEV but the actual quantitative work is usually done by highly trained
32
economists. The decision makers then uses or presents the results to all stakeholders to
33
receive their comments and reactions.
34
35
TEV is not a short cut analytical approach--it does not come up with any "easy to
36
implement" solutions where everyone will be happy or satisfied. TEV can, however,
37
explicitly (and often quantitatively) identify the causes of problems and who are the likely
38
winners and losers from any proposed changes in policy. As such, a TEV analysis helps
39
identify areas where decision makers need to place special attention.
40
41
In addition to the problem of identifying prices or values (the valuation issue discussed in
42
Box A.1) the implementation of a TEV-type study will also require that the analyst
43
explicitly consider externalities and equity concerns. Externalities are pervasive in the
44
environment and are related to a "dis-connect" between where an action is taken and
45
those affected by the action (see Box 2.1). Equity concerns relate to who benefits and
46
who losses from any change, and the relative economic position of each group (see Box
47
2.2).
48
49
A With-project and Without-project Framework is Applied
50
51
The economic analysis should be done in a with-project/without-project framework. That
52
is, it asks what would happen with the proposed project or policy and what would happen
53
without it. As such the analysis tries to understand the impact of the proposed
54
intervention, not merely describe what will the situation before and after the
55
intervention. This is illustrated by Figure A.2 where the without-project state (perhaps
56
water quality) is seen by line A. Water quality degrades over time. Two with-project
57
outcomes are illustrated. In the outcome shown by Line 1 water quality improves over
Draft Final Report: Not for Quotation or Citation
114
1
time, while with the outcome shown by Line 2 water quality decreases over time, but still
2
is an improvement over the without-project state (Line A).
3
1
Water
Quality
2
A
Time
4
5
Figure A.2. With/Without Project Analysis
6
7
With-project and without-project analysis is very important since in some cases even
8
with a management intervention, the "after" situation is worse than the "before" case.
9
Does this mean the project or new policy was a failure?? No, because, as seen in Figure
10
A.2, the relevant comparison is what will be the "after" situation with and without the
11
project. Although water quality continues to decrease even with the project (Line 2),
12
without the project the "after" would have been much worse (Line A). The economic
13
measure of the benefit of the project is the difference in the space between Line A and
14
either Line 1 or Line 2. Clearly scientific information is needed to draw the without-
15
project line A and project the change in water quality due to the project--either line 1 or
16
line 2. It should be noted, however, that in some cases, the results of a project could
17
actually make things worse than doing nothing: that would be illustrated by line 2 being
18
below line A. While this is certainly not common, it does happen and it reflects the
19
complex properties of lakes and their basins.
20
21
When controlling water pollution in a lake, for example, it may take many years to turn
22
the tide and start to see improvements in water quality (see the discussion of hysteresis
23
in Chapter 2). In Lake Nakuru, sediment loads have begun to decrease many years after
24
the first management interventions were begun. Industrial and municipal pollution, such
25
as measured in Lake Dianchi in China, can take years to clean up (and with rapid
26
population and economic growth, the problem may increase rapidly in the future). But
27
without the investments water quality would never get better.
28
29
A Note of Caution
30
31
Decision makers are cautious about the usefulness of the economic approach. They worry
32
that the data requirements are too large and that the approach does not reflect both
33
their longer time horizon, and the political realities of lake management (which result in
34
very short time horizons). These are real concerns and therefore it has to be stressed
35
again that an economic analysis should be seen as an aid to decision making, not as
36
an analytical approach that gives the definitive answer. Nevertheless the economic
37
approach can be a powerful aid.
38
39
The economic approach can also be applied at several levels. At the more micro, project
40
level the approach is used to make quantitative economic estimates of benefits and costs
41
of proposed alternative policies or interventions and calculate the net benefits (usually
42
measured in terms of money) of the proposed change. This is often done for individual
43
projects (such as World Bank financed irrigation or water treatment projects). At the
44
macro, basin-wide planning level the economic approach is an organized way to think
45
about how people interact within the lake basin and what are the impacts of individual
Draft Final Report: Not for Quotation or Citation
115
1
actions on the whole basin. Actual quantitative analysis (e.g. putting actual numbers on
2
each use) is rarely done.
3
4
The economic framework for evaluating options offers a great deal of flexibility and
5
identifies why the actions of individuals (each of whom we assume is doing the best that
6
they can given the conditions that they face) may result in overall decreases in aggregate
7
well-being (or welfare). The approach also allows consideration of new policies or
8
investments and the potential impacts of them.
9
10
The real strength of an economic framework is probably the insights gained--decision
11
makers gains a deeper understanding of the economic forces driving the system--"why"
12
something happens (identification of the root causes of problems), and the obstacles that
13
have to be overcome at the individual level to implement change--the gains and losses to
14
individuals associated with any policy change. The heavy data requirements of the more
15
detailed, formal approach mean that in practic e a full economic analysis is rarely done.
16
None of the 28 case studies explicitly carried out such a TEV analysis (although Boxes
17
A.2 and A.3 show limited applications of the technique in Laguna de Bay and the
18
potential for Lake Sevan).
19
20
Summary: The Goal of an Economic Analysis
21
22
An economic analysis is not an easy solution to the problems of managing a lake and its
23
resources. It should be considered an aid, an input, into the decision making process and
24
an approach that offers a powerful analytical framework that helps the decision maker to
25
understand a number of important features of lake ecosystems. Even if no numbers are
26
estimated, the process of setting up the analysis and talking through the links can
27
produce valuable insights for improved management. These insights include the
28
following:
29
30
First, who are the stakeholders and who are the likely "winners" and "losers" of any
31
proposed action? How large are the economic values and are these gross values (e.g.
32
value of fish catch) or net values (e.g. the actual "profit" from fishing--that is revenue
33
minus costs) for each affected group?) How much resistance might be expected from any
34
proposed change? (Resistance to change is often closely linked to perceptions of
35
individual loss of income or entitlements.)
36
37
Second, what are the economic (and sustainability) costs of the present situation and
38
what are the potential NET gains from improved management? In theory an improved
39
management structure is one whereby the winners can compensate the losers and still
40
have a "surplus" left over--thereby increasing total social welfare. What transfer
41
mechanisms are needed to help compensate potential losers?
42
43
Third, what policies are needed (and what are their costs) to change the incentives or
44
"rules of the game" so that total well-being (social welfare) is maximized? Remember, the
45
present pattern of mismanagement and resource degradation is the result of many
46
individual decision makers doing the best that they can from their own perspective. They
47
are unlikely to change what they are doing without some change in the "rules of the
48
game" or the costs and benefits that they perceive. This can take the form of economic
49
or institutional measures, incentives or policing.
50
51
Fourth, how are equity and distributional issues addressed in order to insure that those
52
whose well-being has been hurt by any change in management are actually helped in
53
practice (not just in theory) from the proposed changes? It is one thing to say that total
54
social welfare has increased, it is quite another to say that the needed transfers have
55
actually taken place!
56
57
Draft Final Report: Not for Quotation or Citation
116
1
Fifth, the need for trained professionals to do the analysis. As with any other science,
2
economic analysis requires special training. It is important that whoever does an
3
economic analysis should be a trained and experienced economist. The decision maker,
4
however, has an important role to play in setting the boundaries for the analysis, and
5
may want to discuss the following issues in defining the terms of reference for any study:
6
7
� Whose values to include in the analysis and how much weight to give to different
8
stakeholders? Might values differ depending on the social-economic position of
9
different groups (e.g. marginalized groups, citizens vs. non-citizens, differing
10
economic levels)?
11
12
� Where should the physical boundary for the analysis be drawn (that is, how much
13
of the lake basin should be included in the study), and how does one incorporate
14
regional and international concerns?
15
16
� How can both "social" and "economic/financial" objectives be incorporated in the
17
management scheme?
18
19
� How can international concerns from "stakeholders" who are not physically
20
present in the lake basin be recognized or included? This is particularly relevant
21
when there are important biodiversity benefits in the watershed and the non-use
22
values of other global citizens may be important benefit of the lake.
23
24
� How can scientific uncertainty and global change processes be handled (e.g.
25
climate change, protection of genetic diversity, others). Some form of sensitivity
26
analysis may be required to address uncertainty.
27
28
Any economic analysis that is carried out should, of course, have a peer review to
29
validate the results. Fortunately there is a growing international literature and experience
30
on doing analyses of this sort that can be called upon. Among this growing literature are
31
the following references: Pearce and Turner (1990), Tietenberg (1992), Dixon et al.
32
(1994), Kolstad (2000), Field and Field (2002), and Sterner (2003) among others.
33
34
Draft Final Report: Not for Quotation or Citation
117
1
Box A.1. Economic Valuation of Environmental Goods and Services
A wide range of valuation techniques exist that can be used to value environmental goods and services
and the various categories found in the TEV approach. The following paragraphs list some of the most
commonly used valuation techniques and gives a one-sentence description for each technique. For more
information on the techniques see standard references such as Tietenberg (1992), Pearce and Turner
(1990), Winpenny (1991) or Dixon et al (1995). The following typology is from Dixon et al. (1995).
Generally Applicable Techniques (valuation techniques that rely on observed changes in quantities and
market prices):
�
Change in production approach--relies on physical changes in the production of some good and
services (e.g. a fishery; reeds; peat) valued at appropriate market prices.
�
Cost of illness approach--uses information on changes in human health and the costs of
treatment, lost work time and pain and suffering (e.g. from polluted water); does not handle
premature death well.
�
Opportunity cost approach--examines what is given up to protect or conserve some resource
(e.g. a national park or a wetland) by measuring the value of the alternative use that is denied.
�
Preventive expenditures--uses information on expenditures people take to protect themselves or
their property from some environmental problem (e.g. flooding, poor water quality, noise, others)
�
Replacement costs--uses information to estimate the cost of replacing a good or service damaged
by changing environmental conditions (e.g. relocating water intakes or other facilities as a result
of changes in shoreline or aquatic weed infestation).
Potentially Applicable Techniques (valuation techniques that rely on surveys and inferred values):
�
Travel cost approach--uses information on the time and costs of travelers (often to a recreational
site like a park or protected area) to derive a demand curve and estimate unpaid for value
(consumer's surplus) enjoyed by visitors.
�
Property value (hedonic) approaches--uses information on land or property values to estimate
the premium associated with changes in environmental quality (e.g. cleaner lake water, better
views).
� Survey-based valuation techniques--also referred to as contingent valuation methods (CVM),
these techniques use surveys of individuals to estimate willingness-to-pay for various changes (or
states) in environmental quality; commonly used to value such non-use values such as option
value, bequest value and existence value. Also used to value premature loss of life.
2
3
Draft Final Report: Not for Quotation or Citation
118
1
Box A.2. Laguna de Bay Partial TEV Analysis
The only lake brief that attempted even a partial application of the Total Economic Value approach is Laguna de
Bay in the Philippines. The actual analysis focused on the environmental resources in the lake watershed and
estimated changes in their values due to a pollution control project. It used the TEV approach to help organize
thinking about what to include in the project analysis. As the lake brief states (Laguna de Bay brief, p.14):
"the approach started with an examination of the uses of Laguna de Bay, such as for fisheries, irrigation,
sources of domestic water, recreation, bird sanctuary, habitat of a variety of flora and fauna. The notion of "use"
does not imply that absence of "observable" use is no use at all. All resources have a use even if it is not
directly observable, thus the total economic value was computed as:
Total economic Value = Use Value + Non-use Value."
The case study further discussed the ideas of direct uses and indirect uses, as well as non-use value like
existence, option and bequest values. Although the case mentioned the wide range of values usually found in
the TEV framework, the actual analysis was a partial analysis since it confined its estimates to "important direct
uses only and (did) not include other direct and indirect uses, option and non-use values".
As presented in the case study the following economic values were calculated for the Laguna de Bay system for
fisheries and water-related uses (using a with-project and without-project framework and the methodology
described in Table 1 from the Laguna de Bay Brief):
Fisheries: Fish catch were valued using market prices and the values for 1984 (about P53 million)
were compared to the year 2000 (P28 million). A link to increased water pollution was made and the
expected benefits of a pollution control project were estimated. Using a with-project and without-
project framework the value of avoided fishery losses with the project was some P7 million per year
(based on changes in fish catch and market prices for fish).
Irrigation, domestic water supply, and recreation: The TEV analysis also identified benefits from
irrigation, domestic water supply, and recreation as components of the TEV that would be affected by
the project. Using a "cost avoided" approach which looks at the costs savings by not having to supply
water uses from alternative, presumably more expensive, sources, the analysis estimated the benefits
to be P70 million per year for irrigation, P0.5 million per year for domestic water supply, and some
P5 million per year for tourism.
Discussion:
While these estimates have to be considered as "rough", the change in the economic value of these 4 uses due
to the project was estimated at about P82 million per year. The quantitative analysis did not include estimates
in the changes in other values--e.g. indirect use values, or various non-use values. These would have increased
the benefits from the project. Still, this example illustrates how one can apply the concept of values based on
the TEV framework and then carry out a partial analysis on selected values. If the estimates reported in the
study are correct, the analysis points out the economic importance of irrigated agriculture and fisheries, and
their direct link to lake water quality.
Table 1 (from Laguna de Bay Experience and Lessons Learned Brief)
Nature of Direct Use
Method used to compute benefits
Fisheries
Value of fish catch lost without the project
Irrigation
Additional cost of sourcing water without the project
Industrial cooling
No benefits computed, but the benefits equal the additional
cost of adopting alternative technologies for industrial
cooling
Domestic
Cost avoided in extracting drinking water from alternative
source
Recreational activities
Value of recreational benefits lost without the project
Power generation
No economic benefit (for hydropower plants)
2
3
Draft Final Report: Not for Quotation or Citation
119
1
Box A.3. Socio-Economic Valuation in Lake Sevan, Armenia
Lake Sevan and its basin provide numerous services to Armenia. In the Lake Sevan brief the discussion of the
socio-economic values can easily be arranged into different categories used in the Total Economic Value
approach. The main focus in the brief is on direct use values; the brief states "all these products have direct use
values because they have market price(s)". But other types of values are also mentioned. Based on the
information presented in the brief (see pages 9-11) the following groupings of goods and services can be made:
Direct use (consumptive): sand, gravel, mineral water, peat, reeds, willow branches, wood, mushrooms,
other plants, fish, birds, mammals for meat and fur, frogs, and benthic invertebrates.
Direct use (non-consumptive): tourism, water recreation, bird watching, education, research, and aesthetic
appreciation.
Indirect use: hydroelectric power generation, irrigation downstream, water supply for livestock and human
consumption.
Non-use values: option, existence and bequest values related to the cultural and historical importance of Lake
Sevan to Armenians--both in Armenia and abroad.
No quantitative estimate of any of these values is presented in the brief. However by listing these different
categories of use it quickly becomes clear that the lake and its ecosystem provides a wide range of goods and
services, only some of which are captured in market prices. The direct-use values (both consumptive and non-
consumptive) could be calculated fairly easily. It will take more work to estimate the indirect use and non-use
values. However, the cultural/historical values (non-use values) are considered so important that an investment
project to help stabilize and restore the lake level is being re-evaluated incorporating some of these values (the
project originally did not pass a narrow benefit-cost analysis test).
The analysis of Armenian willingness-to-pay for restoration of the lake's level was done using various survey
based techniques (the contingent valuation approach--CVM). Later work will extend the survey to Armenians
living abroad--a very large population (larger than in Armenia itself) and with much higher incomes. The
preliminary results from Armenia (Wang, 2003) indicate an average monthly willingness-to-pay by Yerevan
residents (the capital city) to a special "restore the lake level fund" of about $0.50 per month for 3 years (a
total of about $18 per person). This is largely a payment for non-use values since most Armenians do not visit
the lake frequently. (Lake visitors are expected to have a larger willingness-to-pay since they have direct
interaction with the resource).
Discussion:
The Lake Sevan brief does a good job of discussing the various types of values associated with a healthy Lake
Sevan. Although not done for the brief it would be possible to make monetary estimates of many of the direct
use values (and some of the indirect use values) using available information. The CVM survey to estimate non-
use values yielded useful information on the size of these values. It is expected that if a collection mechanism
could be devised, the expatriate Armenian WTP values would be much larger and could yield a sizeable amount
of money.
The TEV approach has yielded an immediate benefit. The potential funders of several schemes to stabilize or
raise the lake level have decided to re-evaluate their decision NOT to fund these investments, and re-consider
the decision and take into account non-use values. Note that the non-use values themselves may be sufficient
to change the investment decision, even if all the other use values are not included.
2
3
Draft Final Report: Not for Quotation or Citation
120
1
Appendix B: Project Details
2
3
Key Organizations Involved in this Project
4
5
The main sponsor of this project, as well as a funder of projects at half of the lakes
6
studied here, is the Global Environment Facility (GEF: www.gefweb.org). GEF is unique in
7
that it provides co-financing to cover the "incremental cost" of the portion of projects
8
that provides international environmental benefits (such as biodiversity conservation and
9
greenhouse gas reduction). The GEF in principle does not fund the part of projects that
10
provide national-level benefits; this cost is to be met by other co-financers including the
11
national governments themselves. GEF co-financing for this project is based on the
12
assumption that the output of the project will have global benefits for the management
13
of lakes everywhere.
14
15
The GEF has three agencies which implement its co-financed projects: The World Bank
16
(implementing agency for this project: www.worldbank.org), United Nations
17
Development Programme (UNDP; www.undp.org) and United Nations Environment
18
Programme (UNEP; www.unep.org). The World Bank is providing financial support for this
19
project through a grant from the Bank Netherlands Water Partnership Program. Each of
20
these implementing agencies has projects involving lakes in addition to the GEF funded
21
projects described here. Although not a GEF-implementing agency, the RAMSAR
22
Convention on Wetlands (an intergovernmental treaty which provides the framework for
23
national action and international cooperation for the conservation and wise use of
24
wetlands and their resources signed in Ramsar, Iran, in 1971) is an important
25
organization in this project as most of the lakes covered here contain a RAMSAR site.
26
27
The International Lake Environment Committee Foundation (ILEC, www.ilec.or.jp) is the
28
executing agency for this project. ILEC is an international NGO formed in 1986 with the
29
support of Shiga Prefectural Government (along with ILEC, Shiga is also a financial
30
sponsor of this project; www.pref.shiga.go.jp) in order to foster sustainable management
31
of the world's lakes. ILEC has worked in close partnership with LakeNet
32
(www.worldlakes.org), an NGO headquartered in Annapolis, MD, USA, to carry out the
33
project and to produce this report. LakeNet is a global network of over 1000 people and
34
organizations in over 80 countries dedicated to the conservation and sustainable
35
development of lake ecosystems . LakeNet's participation in this project is supported by a
36
grant from USAID (www.usaid.gov).
37
38
All of the agencies discussed above (with the exception of ILEC and LakeNet) are
39
members of the project's Steering Committee, which is chaired by the World Bank, and
40
has approved this document.
41
42
Objectives and Outcomes
43
44
This project draws lessons from the implementation and achievements of lake
45
management projects funded both by the Global Environment Facility (GEF) and by other
46
sources. Its particular objectives are (1) to document the management experiences
47
through lake case studies; (2) to facilitate the sharing of experiences between decision
48
makers and stakeholders; (3) to accelerate learning and implementation of effective lake
49
and reservoir management; and (4) to improve the quality of lake and reservoir
50
management.
51
52
The outcomes of this project include (1) lessons for improving GEF and World Bank-
53
supported lake management projects; (2) improved understanding and enhanced
54
capacity for implementing principles of sound lake management; and (3) improved
55
sharing and dissemination of information on lake management programs to national and
56
local governments, lake management practitioners, non-governmental organizations,
57
donor organizations and other stakeholders in lake basins.
Draft Final Report: Not for Quotation or Citation
121
1
2
Lake Selection and Characteristics
3
4
The project was based on a review of experiences and lessons learned at 28 lake basins
5
around the world. A list of those lakes, along with some basic information, is given in
6
Table B.1. Because there are around five million lakes (the exact count is not established
7
and changes through time ) on the earth, the sample of 28 is unlikely to cover all issues
8
related to lake management. We have tried, however, to select lakes that would yield
9
significant lessons about management while maintaining a good balance among features
10
such as location, climate, water type, and other variables. The 28 lakes nonetheless
11
represent some of the major freshwater and saline lakes in the world and all of the lakes
12
with projects funded by the GEF.
13
14
Table B.1. Characteristics of the 28 Selected Lakes Needs finishing
Lakes
Water type
Origin
Climate
Drainage
Basin
Basin Type
Countries
Africa
Baringo*
Fresh
Tectonic (?)
Semi-arid
Closed
Kenya
(various
types
within
basin)
Chad* Fresh (due to hydrographic?
Closed
Cameroon, Central
high
African Republic, Chad,
groundwater
Niger, Nigeria plus
loss)
others?
Kariba
Fresh
Artificial
Open
Zambia, Zimbabwe
plus up/downstream?
Malawi/Nyasa*
Fresh
Tectonic
Usually open Malawi, Mozambique,
(but with
Tanzania
major
evaporation;
closed 1915-
37)
Naivasha Fresh (due to
Semi-arid
Closed (for
Kenya
high
surface)
groundwater
loss)
Nakuru
Saline
Tectonic
Semi-arid
Closed
Kenya
Tanganyika*
Victoria*
Fresh
Open
Asia
Aral*
Saline
Arid
Closed
Kazakhstan,
Uzbekistan;
Afghanistan, Iran,
Kyrgyz Republic,
Tajikistan,
Turkmenistan
Baikal*
Fresh
Tectonic (rift
Open
Russia; Mongolia
valley)
Bhoj Wetland
Artificial
India
Biwa
Fresh
Tectonic
Temperate
Open
Japan
Chilika
Brakish
Tropical
Coastal
India
Dianchi
Fresh
Tectonic
Open
China
Issyk-kul
Saline
Tectonic
Closed
Kyrgyzstan
Laguna de Bay
Fresh (with
Tropical
Open
Philippines
salinity
intrusion)
Toba
Fresh
Tectonic
Tropical
Open
Indonesia
Tonle Sap*
Fresh
Floodplain
Tropical
Mixed Flow
Cambodia
Xingkai/Khanka*
Fresh
Open
China, Russia
Europe
Draft Final Report: Not for Quotation or Citation
122
Constance
Fresh
Glacial
Temperate
Open
Austria, Germany,
Switzerland;
Liechtenstein
Ohrid*
Fresh
Tectonic
Open
Albania, Macedonia;
Greece
Peipsi/Chudskoe*
Fresh
Open
Estonia, Russia; Latvia
(Or do we say EU,
Russia?)
Sevan
Fresh
Tectonic
Open
Armenia
(Volcanic p3?)
North America
Champlain
Fresh
Glacial
Temperate
Open
Canada, USA
Cocibolca
Fresh
Tectonic
Tropical
Open
Nicaragua; Costa Rica
(see p 9)
Great Lakes
Fresh
Glacial
Temperate
Open
Canada, USA
South America
Titicaca*
Fresh
Tropical
Open
Bolivia, Peru
Mountain
Tucurui
Fresh
Artificial
Tropical
Open
Brazil
1
Note: Lakes with a GEF project are marked with an asterisk. In the list of basin countries, the countries
2
following a semi-colon are non-riparian basin countries.
3
4
Lake Briefs, Thematic Papers and Regional Workshops
5
6
Experience and Lessons Learned Briefs (lake briefs) were developed for the 28 selected
7
lakes. The lake briefs were meant to highlight the management experiences in diverse
8
lake basins, organized in a consistent manner to facilitate comparisons between lakes.
9
The full outline given to the lake brief authors is included on the CD-ROM. A list of
10
authors is also included.
11
12
Three regional review workshops were held in North America (hosted by Saint Michael's
13
College, in Burlington, Vermont in June 2003), Asia (hosted by the Lake Laguna
14
Development Authority in Manila, Philippines in September 2003) and Africa (the Pan-
15
African START Secretariat in Nairobi, Kenya, in November 2003), attracting participation
16
and input from over 200 people representing stakeholders from XXX countries. The
17
workshops were the main opportunity for discussion and debate on the lake briefs.
18
19
A total of 16 Thematic Papers were also prepared during the course of the project in
20
order to compliment the lake briefs and to highlight specific global or regional issues.
21
These papers, as well as a list of authors, are included in the CD-ROM.
22
23
Website Clearinghouse and e-Forum
24
25
To facilitate the widespread dissemination of the lake briefs and thematic papers, the
26
project also supported the enhancement of LakeNet's website, where the documents
27
were posted, and from which a number were downloaded. A e-forum also was developed,
28
although it did not appear to provoke much public comment on the lake briefs or
29
thematic papers.
30
31
Steering Committee
32
33
To be completed.
34
35
Working Group Meetings
36
37
To be completed.
38
Draft Final Report: Not for Quotation or Citation
123
1
Appendix C: List of Experience and Lessons Learned Brief and
2
Thematic Paper Authors
3
4
To be finalized. Approximately 3-4 pages.
5
6
Draft Final Report: Not for Quotation or Citation
124
1
Appendix D: Workshop Agendas and Participant Lists
2
3
To be developed. Approximately 8 pages.
4
5
Draft Final Report: Not for Quotation or Citation
125
1
Appendix E: Summaries of 28 Project Lakes
2
3
2-page summaries of each lake, with a basin map, to be supplied by LakeNet from
4
material on the project website.
5
6
Draft Final Report: Not for Quotation or Citation
126
1
References
2
3
(To be completed and format unified.)
4
5
Bener�a, Lourdes and Martha Rold�n. (1987). The Crossroads of Class and Gender:
6
Industrial Homework, Subcontracting, and Household Dynamics in Mexico City.
7
Chicago: University of Chicago Press
8
9
Berkes, Fikret and Carl Folke. "Linking social and ecological systems for resilience and
10
sustainability," in Fikret Berkes and Carl Folke, eds., Linking Social and Ecological
11
Systems: Management practices and social mechanisms for building resilience
12
(Cambridge: Cambridge UP, 1998): 1-25.
13
14
Clague, Christopher, "The New Institutional Economics and economic development," in
15
Christopher Clague, ed., Institutions and Economic Development: Growth and
16
governance in less-developed and post-socialist countries (Baltimore: Johns
17
Hopkins,1997)
18
19
Dixon, J, LF Scura, R Carpenter, and P Sherman (1994). Economic Analysis of
20
Environmental Impacts. London: Earthscan.
21
22
Duda, Alfred. 2002. Monitoring and Evaluation Indicators for GEF International Waters
23
Projects: Monitoring and Evaluation Working Paper 10. Washington, DC: Global
24
Environment Facility.
25
26
Edmondson, W.T. 1970. Phosphorus, nitrogen and algae in Lake Washington after
27
diversion of sewage. Science 169:690-691.
28
29
Field, Barry C. and Martha K. Field. 2002. Environmental Economics: An Introduction.
30
New York: McGraw-Hill.
31
32
Glantz, M.H. 1999. Creeping Environme ntal Problems and Sustainable Development in
33
the Aral Sea Basin. Cambridge University Press. United Kingdom. 291 p.
34
35
GEF (Global Environment Facility). 2003. International Waters. Operational Strategy of
36
the Global Environment Facility, GEF, Washington, D.C. Chapter 4.
37
38
GWP (Global Water Partnership). 2000. IWRM & the Toolbox. Secretariat, Global Water
39
Partnership, Swedish International Development Cooperation Agency, Stockholm. 5 p.
40
41
GLWQA (Great Lakes Water Quality Agreement). 1978. Great Lakes Water Quality
42
Agreement of 1978. U.S.-Canada International Joint Commission, Great Lakes
43
Regional Office, Windsor, Ontario, Canada.
44
45
Holdren, C. W. Jones, J. Taggart. 2001. Managing Lakes and Reservoirs. North American
46
Lake Management Society: Madision, WI, USA.
47
48
Jorgensen, S.E. XXXX.
49
50
Kolstad, Charles D. 2000. Environmental Economics. Oxford: Oxford University Press.
51
52
Laszlo, J.D., G.N. Golubev and M. Nakayama. 1988. The environmental management of
53
large international basins. The EMINWA Programme of UNEP. Water Resources
54
Development 4:103-107.
55
Draft Final Report: Not for Quotation or Citation
127
1
National Research Council (Committee on Restoration of Aquatic Ecosystems: Science,
2
Technology and Public Policy). 1992. Restoration of Aquatic Ecosystems. National
3
Academy Press: Washington, D.C., USA.
4
5
Ostrom, Elinor. "Investing in capital, institutions, and incentives," in Christopher Clague,
6
ed., Institutions and Economic Development: Growth and Governance in Less-
7
Developed and Post-Socialist Countries (Baltimore: Johns Hopkins, 1997): 153-181.
8
9
Pearce, D and K Turner (1990). Economics of Natural Resources and the Environment.
10
Baltimore: Johns Hopkins University Press.
11
12
Ramsar Bureau. (2001). Additional Guidance on Reviewing and Action Planning for
13
Wetland Communication, Education and Public Awareness (CEPA), to assist
14
Contracting Parties in implementing Resolution VII.9, the Convention's Outreach
15
Program, 1999-2002. [http://www.ramsar.org/outreach_reviewsactionplansI.htm]
16
17
Rast, W. and J.A. Thornton. 2004. The phosphorus loading concept and OECD Eutrophication
18
Programme. Origin, application and capabilities. In: P. O'Sullivan and P. Reynolds, The
19
Lakes Handbook, Vol. 2, Blackwell Science Publishers. IN PRESS.
20
21
Ryding, S.-O. and W. Rast. 1989. The Control of Eutrophication of Lakes and Reservoirs.
22
Man and Biosphere Series, Vol. 1, UNESCO, Paris. 314 p.
23
24
Schindler, D.W. 1977. Evaluation of phosphorus limitation in lakes. Science 195:260-262.
25
26
Sonzogni, W.C., P.D. Uttormark and G.F. Lee. 1976. The phosphorus residence time
27
model. Water Research 10:429-435.
28
29
Sterner, T (2003). Policy Instruments for Environmental and Natural Resource
30
Management. Wshington DC: Resources for the Future.
31
32
Sutherland, William J. (2000). The conservation handbook: research, management and
33
policy. Malden, USA: Blackwell Science, Inc. 278 pp.
34
35
Tietenberg, T (1992). Environmental and Natural Resource Economics. Third Edition. New
36
York: Harper Collins Publishers.
37
38
Trudel, M., E. Wysokinska, W. Williams and W. Rast. 2002. Lakes and Reservoirs: How to
39
involve the public in protecting them from degradation. Kusatsu, Japan: UNEP-IETC
40
and ILEC.
41
42
USEPA and Government of Canada. 1995. The Great Lakes: An Environmental Atlas and
43
Resource Book. Chicago: Great Lakes National Program Office.
44
45
Vollenweider, R.A. 1976. Advances in defining critical loading levels for phosphorus in
46
lake eutrophication. Mem. Ist. Ital. Idrobiol. 33:53-83.
47
48
Wang 2003.
49
50
World Bank. 2000. Participation review. Washington, D.C.: World Bank.
51
52
World Lake Vision Committee. 2003. World Lake Vision. International Lake Environment
53
Committee, Shiga (Japan) Prefectural Government, and International Environment
54
Technology Centre, United Nations Environment Program. 36 p.
55
Draft Final Report: Not for Quotation or Citation
128
1
Glossary
2
3
Draft Final Report: Not for Quotation or Citation
129
1
Draft Final Report: Not for Quotation or Citation
130