


United Nations
UNEP/GEF South China Sea
Global Environment
Environment Programme
Project
Facility
STRATEGIC ACTION PROGRAMME FOR THE SOUTH CHINA SEA
PROPOSED FRAMEWORK FOR MANAGEMENT OF THE MARINE ENVIRONMENT
OF THE SOUTH CHINA SEA
MEMORANDUM OF UNDERSTANDING
SIGNED BY ENVIRONMENT MINISTERS
STRATEGIC ACTION
SUB-REGIONAL AND BI-
NATIONAL ACTION
PROGRAMME
LATERAL AGREEMENTS
PLANS
BASED ON
Sound Science: Ecologically effective action: Cost effective actions: Appropriate
economic valuations: Consensual knowledge base: Knowledge based decision
making: Communication: Periodic assessment: Adaptive Management
August 25th 2008


STRATEGIC ACTION PROGRAMME
First published in Thailand in 2008 by the United Nations Environment Programme.
Copyright © 2008, United Nations Environment Programme
This publication may be reproduced in whole or in part and in any form for educational or non-profit
purposes without special permission from the copyright holder provided acknowledgement of the
source is made. UNEP would appreciate receiving a copy of any publication that uses this publication
as a source.
No use of this publication may be made for resale or for any other commercial purpose without prior
permission in writing from the United Nations Environment Programme.
UNEP/GEF
Project Co-ordinating Unit,
United Nations Environment Programme,
UN Building, 2nd Floor Block B, Rajdamnern Avenue,
Bangkok 10200, Thailand
Tel.
+66 2 288 1886
Fax.
+66 2 288 1094
http://www.unepscs.org
DISCLAIMER:
The contents of this report do not necessarily reflect the views and policies of UNEP or the GEF. The
designations employed and the presentations do not imply the expression of any opinion whatsoever
on the part of UNEP, of the GEF, or of any cooperating organisation concerning the legal status of
any country, territory, city or area, of its authorities, or of the delineation of its territories or boundaries.
Cover Illustration: Proposed Management Framework for Implementation of the Strategic Action
Programme.
For citation purposes this document may be cited as:
UNEP, 2008. Strategic Action Programme for the South China Sea. UNEP/GEF/SCS Technical
Publication No. 16.
STRATEGIC ACTION PROGRAMME
STRATEGIC ACTION PROGRAMME FOR THE SOUTH CHINA SEA
THE DEVELOPMENT OF THE STRATEGIC ACTION PROGRAMME FOR THE SOUTH CHINA SEA ..1
STRATEGIC, PRIORITY ACTIONS FOR MANGROVES IN THE SOUTH CHINA SEA............................3
THREATS TO MANGROVES BORDERING THE SOUTH CHINA SEA .....................................................................3
CURRENT MANAGEMENT OF MANGROVES AND PROPOSED TARGETS.............................................................4
CHALLENGES FOR MANGROVE MANAGEMENT ...............................................................................................6
REGIONAL ACTIONS AND COST ESTIMATES...................................................................................................6
STRATEGIC, PRIORITY ACTIONS FOR CORAL REEFS IN THE SOUTH CHINA SEA..........................9
THREATS TO CORAL REEFS BORDERING THE SOUTH CHINA SEA ...................................................................9
THE MANAGEMENT STATUS OF CORAL REEFS BORDERING THE SOUTH CHINA SEA......................................10
TARGETS ..................................................................................................................................................12
REGIONAL ACTIONS AND COST ESTIMATES.................................................................................................13
STRATEGIC, PRIORITY ACTIONS FOR SEAGRASS IN THE SOUTH CHINA SEA .............................19
CURRENT MANAGEMENT STATUS OF SEAGRASS BEDS BORDERING THE SOUTH CHINA SEA .........................19
THREATS TO SEAGRASS ............................................................................................................................21
CHALLENGES FOR SEAGRASS MANAGEMENT ..............................................................................................21
GOAL AND TARGETS ..................................................................................................................................21
REGIONAL ACTIONS AND COST ESTIMATES.................................................................................................22
STRATEGIC PRIORITY ACTIONS FOR COASTAL WETLANDS BORDERING THE
SOUTH CHINA SEA ..................................................................................................................................27
MANAGEMENT STATUS OF COASTAL WETLANDS BORDERING THE SOUTH CHINA SEA...................................27
THREATS TO COASTAL WETLANDS .............................................................................................................29
GOAL AND TARGETS ..................................................................................................................................29
REGIONAL ACTIONS AND COSTING .............................................................................................................30
MANAGING FISH HABITAT AND FISH STOCKS IN THE SOUTH CHINA SEA ....................................35
FISHERIES MANAGEMENT ISSUES...............................................................................................................35
IMPROVING THE INTEGRATION OF FISHERIES AND HABITAT MANAGEMENT THE REGIONAL FISHERIES
REFUGIA INITIATIVE ...................................................................................................................................35
FISHERIES REFUGIA A UNIQUE RESPONSE TO THE OVER-EXPLOITATION OF FISHERIES..............................36
OBJECTIVES, TARGETS, REGIONAL ACTIONS AND COST ESTIMATES ............................................................39
REGIONAL ACTIONS TO SUPPORT MANAGEMENT OF LAND-BASED POLLUTION
LOADINGS IN THE SOUTH CHINA SEA MARINE BASIN......................................................................45
CURRENT MANAGEMENT OF LAND-BASED POLLUTION AND CHALLENGES TO FUTURE MANAGEMENT.............46
GOAL AND TARGETS ..................................................................................................................................46
REGIONAL ACTIONS AND COST ESTIMATES.................................................................................................47
REGIONAL ECONOMIC VALUES AND COST/BENEFIT ANALYSIS OF SAP ACTIONS.....................51
ECONOMIC VALUATION ..............................................................................................................................51
COST AND BENEFIT ANALYSIS....................................................................................................................53
Cost-Benefit Analysis of Action Versus Non-action in the Strategic Action Programme...............53
Costs and Benefits of Mangrove Interventions ..............................................................................54
Costs and Benefits of Coral Reef Interventions.............................................................................57
Costs and Benefits of Seagrass Interventions...............................................................................59
Costs and Benefits of Wetland Interventions.................................................................................60
REGIONAL CO-OPERATION....................................................................................................................61
RATIONALE ...............................................................................................................................................61
OBSTACLES TO REGIONAL CO-OPERATION AND PROPOSED SOLUTIONS.......................................................61
A PROPOSED FRAMEWORK FOR CO-OPERATION IN THE MANAGEMENT OF THE MARINE ENVIRONMENT
OF THE SOUTH CHINA SEA AND GULF OF THAILAND ....................................................................................62
GOALS AND OBJECTIVES........................................................................................................................62
AREAS FOR CO-OPERATION....................................................................................................................63
MECHANISMS.........................................................................................................................................64
COMPONENTS .......................................................................................................................................64
STRATEGIC ACTION PROGRAMME
Page 1
THE DEVELOPMENT OF THE STRATEGIC ACTION PROGRAMME1FOR
THE SOUTH CHINA SEA2
One of the anticipated outputs from the UNEP/GEF Project entitled "Reversing Environmental
Degradation Trends in the South China Sea and Gulf of Thailand" is an up-dated Strategic Action
Programme, and the present document contains the final text as approved by all countries3 during the
8th meeting of the Project Steering Committee in Hanoi, Viet Nam, 26th August 2008. It is anticipated
that the countries will commence implementation of the envisaged actions in 2008/2009.
The South China Sea is a semi-enclosed sea, which supports a number of unique habitats and
ecosystems that are amongst the most biologically diverse shallow water marine ecosystems globally.
The countries surrounding the South China Sea have undergone very rapid economic development
and rapid population increase in coastal areas over the past two decades resulting in degradation and
loss of coastal habitats and resources.
Recognising that actions were urgently needed to halt degradation of the environment of this marine
basin, the countries of the region sought the assistance of UNEP and the Global Environment Facility
(GEF) in preparing a Transboundary Diagnostic Analysis of the issues and problems and their societal
root causes as the basis for development of a Strategic Action Programme. A proposal was endorsed
by the twelfth intergovernmental meeting of the Coordinating Body for the Seas of East Asia
(COBSEA) in December 1996 and the GEF financial y supported this initiative.
During the Project Development Phase from 1996 to 2001 and in accordance with the GEF
Operational Strategy activities were undertaken at the national and regional level to prepare national
reports of water-related environmental issues and problems; a Transboundary Diagnostic Analysis
(TDA) (UNEP SCS/TDA ver. 3); and a Strategic Action Programme (SAP). These documents were
submitted to the Thirteenth Intergovernmental Meeting of COBSEA (UNEP/(WATER)/EAS IG9/3),
which endorsed the draft SAP. This Strategic Action Programme was prepared in collaboration and
cooperation with other regional institutions, organisations and bodies including: Food and Agricultural
Organisation of the UN; South East Asia (START) Regional Centre; The South China Sea Informal
Working Group at the University of British Columbia; the IOC Sub-Commission for the Western Pacific
(WESTPAC); and the GEF/UNDP/IMO Regional Programme for the Prevention and Management of
Marine Pollution in the East Asian Seas.
The TDA identified the priorities among water-related problems and concerns, their socio-economic
root causes, the sectorial implications of actions needed to mitigate them and the extent to which the
problems were transboundary in either origin or effect. The draft Strategic Action Programme based
on the findings of the regional Transboundary Diagnostic Analysis (TDA) was used as the basis for
preparing the full GEF Project document, which entered the work programme of the GEF in December
2000. Due to the geopolitical sensitivity of the South China Sea marine basin the countries expressed
the wish that no international or regional entities, other than UNEP be involved in the management of
the project.
The actions proposed in the framework of the draft Strategic Action Programme were wide ranging in
both context and proposed areas for action and the key elements of the project included actions that
would lead to the further elaboration and development of the draft Strategic Action Programme.
Experiences over the period 2002 to 2006 in managing appropriate activities at both the national and
regional levels have been utilised in the drafting of the present revised SAP that has been developed
through an iterative process with activities at the national level feeding into the regional review process
which in turn provided advice and guidance to the national entities in finalising their draft inputs to the
regional SAP.
1 No activities shall be undertaken under this Strategic Action Programme in disputed areas of the South China Sea, nor shall
issues of sovereignty be addressed directly or indirectly through project activities.
2 The term "South China Sea" is used in its geographic sense and does not imply recognition of any territorial claims within the
area.
3 Cambodia, People's Republic of China, Indonesia, Malaysia, Philippines, Thailand and Viet Nam.
STRATEGIC ACTION PROGRAMME
Page 2
A key element in this process has been the development of detailed National Action Plans by each
country that address the specific concerns and issues relevant to the components of the draft Strategic
Action Programme. These National Action Plans are at various stages of government approval but it is
anticipated that all will be approved for implementation by the end of 2007.
During the development of the NAPs the regional working groups have analysed their contents and
developed the regional elements for inclusion in the SAP on the basis of the identified national actions
and priorities. These have been aggregated into the present revised draft which therefore presents a
shared vision regarding the actions that need to be undertaken at the regional level in support of
national actions. Regional level actions include inter alia networking, capacity building, public
awareness and education and applied research into management techniques and approaches that
maximise the level of sustainable use without adverse environmental impact.
One significant and perhaps unique element of this Strategic Action Programme is the inclusion of
detailed economic values for coastal habitat goods and services and their use in the determination of
regionally applicable Total Economic Values. These have been subsequently applied in an analysis of
the costs and benefits of the regional actions proposed in this Strategic Action Programme. In some
instances the SAP is clearly cost effective since a modest investment of 3 million US dollars at a
regional level is associated with a net benefit of 1.5 billion US dollars per annum if the mangrove
targets are met over the next five years. It is anticipated that total investment at the national level to
achieve this benefit will be of the order of 300 million US dollars.
The final section examines the need for regional co-operation and suggests that the SAP serve as the
primary instrument for regional co-operation in the management of the marine and coastal
environment, amongst the countries bordering the South China Sea and that this co-operation be
formally established via a Memorandum of Understanding signed by the Ministers4 responsible for the
Environment.
4 In the event that the Memorandum is signed in a meeting and a Minister is unable to be present, his/her representative in the
meeting may sign the Memorandum if authorised to do so by the Minister.
STRATEGIC ACTION PROGRAMME
Page 3
STRATEGIC, PRIORITY ACTIONS FOR MANGROVES IN THE SOUTH CHINA SEA5
Around 30% of the world's remaining mangrove is found in the countries participating in this project
and 8% of the World's total is found along the margins of the South China Sea marine basin. Rates of
loss are generally higher along the South China Sea coastlines than elsewhere in the seven countries
participating in the UNEP GEF project. For example around 80% of the mangrove bordering the Gulf
of Thailand has been lost compared with only around 20% on the Andaman coast of Thailand.
The annual rates of loss in the seven countries, between 1990 and 2000, were greater than the world
average (Table 1). Such losses represent a loss of global biological diversity that must be a matter of
global concern (UNEP, 2004). The total area of mangrove lost in the participating countries over
different time spans (70 years for the Philippines) was estimated in 1998 at 4.2 million ha suggesting
that over half of the original mangrove bordering the South China Sea had been lost during the last
century.
Table 1 Estimates of Area (Ha) and Rates of Loss of Mangrove Habitat in Seven Countries
Bordering the South China Sea, Compared with the World Totals. [Most recent data from
FAO, 2003] (Based on UNEP. 2004. Mangroves in the South China Sea. UNEP/GEF/SCS Tech. Publ. No. 1.)
Most recent Date of
National Estimates of total
Current
% Rates of loss per year
estimate
FAO
mangrove area
South China
FAO
estimate
1980 1990 2000 Sea area
1980 - 1990
1990-2000
Cambodia
72,835
1997 83,000
74,600
63,700
72,350
-1.01 -1.46
China
36,882
1994 65,900
44,800
23,700
23,446
-3.20 -4.71
Indonesia
3,493,110
1988 4,254,000
3,530,700
2,930,000
934,000
-1.70
-1.70
Malaysia
587,269
1995 669,000
620,500
572,100
532,100
-0.72 -0.78
Philippines
127,610
1990 206,500
123,400
109,700
28,014
-4.02 -1.11
Thailand
244,085
2000 285,500
262,000
244,000
62,618
-0.82 -0.69
Viet Nam
252,500
1983 227,000
165,000
156,608
156,608
-2.73 -0.51
Total
4,814,291
5,790,900
4,821,000
4,099,808
1,799,136
-1.67
-1.61
World
15,763,000
1992 19,809,000 16,361,000
14,653,000
15,763,000
-1.74
-1.04
% world total
30.54
29.23
29.47
27.62
11.41
THREATS TO MANGROVES BORDERING THE SOUTH CHINA SEA
The causes of mangrove destruction identified in the TDA (UNEP, 1998) along the coastlines
bordering the South China Sea, included conversion to pond aquaculture, particularly for shrimp, clear
felling of timber for woodchip production, land clearance for urban and port development and human
settlements; and harvest of timber products for domestic use (UNEP, 2004). Present causes of loss of
mangrove habitat are no longer dominated by shrimp culture although this remains one cause of
conversion in China, Indonesia and Viet Nam. Conversion of mangrove to land for industrial purposes
(including harbour construction) has grown over the last ten years, and is now significant in China, but
of low importance in Indonesia, the Philippines and Viet Nam, and not important in Thailand and
Cambodia. Degradation of mangrove habitats as a consequence of chronic pollution from shrimp
farming operations is now more prevalent in China, Indonesia and Thailand, whilst charcoal production
continues to degrade mangrove in Cambodia, Indonesia and the Philippines despite legislation
banning all harvesting of mangroves in Cambodia and the Philippines. At a regional level the following
are seen as the current threats to mangrove systems bordering the South China Sea:
ANTHROPOGENIC THREATS
1. Reclamation and infrastructure development.
2. Pollution from Shrimp farming (China, Indonesia, Thailand).
3. Industrial conversion (China, small in Philippines, Indonesia and Viet Nam, negligible in
Cambodia, and Thailand).
4. Charcoal production (Indonesia, Philippines and Cambodia).
5. Conversion-to shrimp culture potential long-term threat in Viet Nam.
NATURAL THREATS
1. Sea level rise.
2. Episodic events tsunami, typhoon.
5 Initially Malaysia did not participate in this sub-component of the UNEP/GEF Project.
STRATEGIC ACTION PROGRAMME
Page 4
Transboundary influences are seen through the operation of the world markets and global trade for
example, in shrimp. The high global level of demand for shrimp is itself driven by demand in Japan,
North America and Europe which sets the world price such that, economic incentives for the
conversion of "non-productive" mangrove habitats operate at both the individual and national levels in
producing countries. Hard currency income and economic development fuel the motives at the
national level whilst individual producers, at least in the short-term, derive considerable cash income
from cutting mangrove and converting to shrimp ponds.
On a smaller scale, trade in charcoal derived from mangrove in Cambodia to Thailand was a major
cause of mangrove loss in the areas of Cambodia close to the Thai border, in the recent past. This
market appears to have declined somewhat over the last five years under the influence of more
widespread use of cheap and convenient, liquid gas in Thailand.
When mangrove forests are destroyed and replaced by alternative forms of land use, not only are the
species of plants and animals lost but also many services provided by mangrove systems are lost as
well. This is well known in Viet Nam where the function of coastal vegetation, particularly mangroves is
considered a vital service with measurable economic benefits as a protection against hurricane
damage and marine based flooding. Mangrove degradation causes losses in direct and indirect
economic values that support socio-economic development at both local and national scales.
C
6
URRENT MANAGEMENT OF MANGROVES AND PROPOSED TARGETS
Table 2 presents information relating to the management of mangrove areas in six of the seven
countries bordering the South China Sea. Five categories of mangrove forest are recognised in the
region: production forest, used on a sustainable basis for timber and wood chip production; conversion
forest, a category in Indonesia representing areas of mangrove land designated for alternative land
use under current plans; Parks and Protected Areas; and areas in which timber extraction is not
permitted but extractive use of other resources is permitted. In the case of Thailand, another category
is recognised namely "Private land, unregulated use", which accounts for 10,000 hectares.
Table 2
Areas of Mangrove Currently under Different Forms of Land-use Designation and
Management.
Cambodia China Indonesia Philippines Thailand Viet
Nam Total
%
Total area (ha)
72,350
23,446
934,000
28,014
62,616
156,608
1,277,034
100
Production forest
0
0
610,800
0
1,600
18,000
630,400 49.36
Conversion
0 0
165,000
0 0 0
165,000
12.92
Parks & Protected Areas
(Conservation) non-
13,558 15,772 158,200
27,072 11,520 20,000 246,122
19.27
extractive use
Non-use of mangrove but
extractive resource use
58,792 7,674
0
942 39,496
118,608 225,512
17.66
(fish, crabs etc.)
Private land, unregulated
0 0 0
0
10,000 0
10,000
0.78
use
Area currently under
management Regulated in
13,558 15,772 768,800
27,072 11,520 155,000 987,793
77.40
laws/regulations
Areas estimated as
15,772
20,000
currently under sustainable
13,558
158,200
11,520
26,010
18,000
432,078 32.60
8,820
1,0008
100,000
1,600
management7
46,608
This table illustrates the complexity of management regimes in six of the seven countries concerned
but does not provide a mechanism for objectively determining the effectiveness of that management
regime. For example in Cambodia 13,558 hectares of mangrove are contained within Parks and
Protected areas for which there is no legal extractive use of either the mangrove trees or other
resources, this area is also listed as being under a management regime regulated in law, and again
within the areas listed as being sustainably managed at the present time. The assumption is that since
6 These targets were accepted by the sixth meeting of the Regional Scientific and Technical Committee.
7 Areas considered as being sustainably managed at the present time include all lands designated as production forest since
it is a legal requirement that these be replanted; all mangrove lands contained within National Parks and Protected Areas;
and a proportion of the mangrove area subject to extractive use of non-timber resources.
8 Area outside the protected area for which some form of management plans exist estimated.
STRATEGIC ACTION PROGRAMME
Page 5
access to and use of this area is restricted the management is sustainable. In contrast, 58,792
hectares in Cambodia are currently not regulated under the law, and are subject to extractive resource
use other than the mangroves themselves and of this area only 8,820 are considered as being
exploited in a sustainable manner. The target for Cambodia is therefore to ensure that all 49,972
hectares of mangrove outside the legally protected Parks and protected areas are used in a
sustainable manner by 2012. Targets for the six countries are presented in Table 3 below.
Table 3
Targets [Proposed areas in hectares to be subject to changes in designation and/or
management regime] for Future Mangrove Management.
% of total
Cambodia
China
Indonesia
Philippines Thailand Viet Nam
Total
area of
mangrove
Area to be transferred to National
0 5,330 20,000
631 1,400 30,000 57,361
4.49
Parks and Protected Area status
Non-conversion of mangrove but
0 0
165,000 0
1,600 0
166,600
13.05
sustainable use
Improved management relating to
49,972
0 490,800 2,000 10,000 50,000 602,772
47.20
sustainable use
Replanting of deforested
2,500 500
0 2,000 8,000 8,000 21,000 1.64
mangrove land
Enrichment planting to increase
0 5,000
0 1,000 3,200 2,000 11,200 0.88
mangrove biodiversity
Recognising that the existence of a management regime and legal protection do not necessarily reflect
the effectiveness of management the RWG-M developed a set of indicators of the sustainability of
current management. Table 4 presents the indicators of sustainability discussed and agreed during the
seventh meeting of the Regional Working Group. The indicators are grouped into three classes, which
in the case of the management indicators are divided into three sub-groups. In the case of both
"management capacity" and "management tools" if all the indicators are met there is a higher
likelihood that management is more sustainable than if only a few, or none are present.
Table 4
Sustainable Management Indicator Matrix. [A baseline, mid-term and end of first phase of
SAP implementation assessment of these indicators is required to indicate whether or not
the targets have been met.]
Ecological/Environmental
Management Indicators
Socio-Economic Indicators
Indicators
MANAGEMENT CAPACITY
FISHERIES
· Formal
Management
· Catch per unit effort
framework
· Total landing from mangrove
· Trained
Man-power
area
(No./levels)
· Income
·
· Forest
Cover
Facilities
and
equipment
· Nos. people directly involved
·
· Tree density (trees over
Sustainable
Financing
1.5 metres high)
MANAGEMENT APPROACH
TOURISM
· Number of True
· Sectorial
· Number of visitors
Mangrove species
· Integrated
· Number of tourism operators
· Scylla spp (size and
· Community-based
· Income
abundance)
· Multiple-use
· Nos. people directly involved
· Sesarma spp (size and
MANAGEMENT TOOLS
abundance)
FORESTRY
· Licensing and permits
· Volume of timber
· Seasonal
closure
· Weight of charcoal product
· Zoning
· Income
· Nos. people directly involved
STRATEGIC ACTION PROGRAMME
Page 6
CHALLENGES FOR MANGROVE MANAGEMENT
The National Action Plans provide information regarding the challenges for mangrove management at
the national level which centre on:
1. Lack of sustainable financing, Cambodia, Philippines, and Indonesia less so in China,
Thailand and Viet Nam;
2. Poverty of coastal communities in all countries9;
3. Weak or non-existent law enforcement, in all countries;
4. Ineffective management systems and land-use planning (Viet Nam and Indonesia);
5. Lack of experience and techniques for multi-species replanting (in all countries);
6. Lack of long-term regional and international co-ordination and co-operation;
7. Inadequacies and weaknesses in the management systems in Viet Nam and Indonesia;
8. Lack of understanding on the part of the general public and decision makers regarding the
functions and values of mangrove ecosystems.
R
EGIONAL ACTIONS AND COST ESTIMATES
The proposed regional activities to promote sustainable management of Mangroves were elaborated
during the seventh meeting of the Regional Working Group on Mangroves and are presented in Annex
4 of the report of that meeting. Table 5 of this document presents the actions and also includes
preliminary cost estimates prepared by the regional working group during the seventh meeting. A total
of 35 actions are proposed grouped into three components.
1. BUILDING CAPACITY TO ENSURE LONG-TERM SUSTAINABLE USE OF MANGROVE HABITATS AND
RESOURCES
The objective of this component is to increase the knowledge of government officials, managers and
stakeholders regarding the functions, value and approaches to sustainable management of mangrove
ecosystems. The component is divided into two subcomponents the first of which outlines the required
regional mechanisms for information exchange via the World Wide Web, study tours and visits,
periodic meetings and targeted training activities. The second subcomponent focuses on the
development and dissemination of the necessary materials for use at all levels in promoting
knowledge and awareness of sustainable management practices.
2. ENHANCING MANGROVE MANAGEMENT SKILLS THROUGH DEVELOPMENT AND DISSEMINATION OF
REGIONALLY APPLICABLE TOOLS
This component aims to provide a sound scientific and technical basis for sustainable management of
mangrove ecosystems at the regional levels. The two sub-components focus on the development of
guidelines and other tools as information resources, and facilitate their regional dissemination and
adoption by mangrove managers and the second addresses applied research needs, knowledge
management, and monitoring of mangroves for sustainable management.
3. INSTITUTIONAL ARRANGEMENTS AND REGIONAL CO-ORDINATION
The objective of this component is to assist countries in effectively and sustainably managing their
mangrove resources through: the development of mechanisms including policy, where appropriate on
ecological security; the integration of sound science into policy making and management decision
making; and fostering cost effective strategic actions that enhance regional co-operation.
9 Originally listed as Coastal Poverty.
STRATEGIC ACTION PROGRAMME
Page 7
Table 5
Proposed Regional Actions for the Mangrove Component of the Regional Strategic Action Programme.
Component
Sub-Component
Activity
2008 2009 2010 2011 2012 Total
1.1.1 Maintain and expand the existing regional website as a mechanism for programmed
exchange of information and experience between managers, government officials,
20,000
20,000
20,000
20,000
20,000
100,000
teachers, research students, and community leaders
1.1.2 Organise programme of study visits for government officials, community leaders, and
mangrove managers to demonstration sites to study on-going practices in
40,000
40,000
40,000
40,000
40,000
200,000
rehabilitation, management and conservation in the region.
1.1.3 Organize regional forum every two years to share knowledge and experiences on how 30,000 30,000 60,000
1.1 Mechanisms for
to improve government services in managing mangroves in Marine Parks and MPAs
information exchange 1.1.4 Meeting to secure Regional exchange of experience on how to enforce the laws in
18,000
18,000
18,000
18,000
18,000
90,000
practice
1. Building
Capacity
1.1.5 Regional training programme for country trainers on effective monitoring the state of
35,000
35,000
to ensure long-
mangrove ecosystems.
term sustainable
1.1.6 Regional workshop every two years for exchange of experiences of developing
use of mangrove
30,000 30,000 60,000
livelihood and other income generation activities
habitats and
1.1.7 To Establish a network of environmental journalists and educators, and provide them
resources
0
materials of awareness on mangroves.
1.2.1 Develop regional guidelines on establishment of community based micro-credit
24,000
24,000
1.2 Materials for use at all
schemes
levels in promoting
1.2.2 To establish a regional bibliography
148,000
148,000
knowledge and
1.2.3 Produce guide books for mangrove rehabilitation, management and conservation in
144,000
144,000
awareness of
the region
sustainable
1.2.4 To translate relevant national publications to English for regional use
140,000 140,000 140,000 140,000
560,000
management
1.2.5 Development of curricular and materials for use in training programmes relating to
practices
sustainable use and management of mangroves, offered by educational institutions in
97,000
97,000
the region.
STRATEGIC ACTION PROGRAMME
Page 8
Table 5 cont. Proposed Regional Actions for the Mangrove Sub-component of the Regional Strategic Action Programme.
Component
Sub-Component
Activity
2008 2009 2010 2011 2012 Total
2.1.1 To develop regionally applicable standards and criteria for defining sustainability of
2.1 Develop guidelines
41,000
30,000
71,000
mangrove management system.
and other tools as
2.1.2 Document models for sustainable use of mangrove ecosystem
30,000
18,000
48,000
information
2.1.3 Identify and encourage the use of environmental friendly technologies for timber
resources, and
30,000
36,000
66,000
harvesting, fishing and shrimp farming
facilitate their regional 2.1.4 Promote multiple-use of mangrove resources and alternative livelihood
23,000
46,000
69,000
dissemination and
2.1.5 Establish criteria and guidelines for zoning of mangrove ecosystem
29,000
27,000
15,000
71,000
adoption for
mangrove managers 2.1.6 Develop and design standardized methodology and guideline for inventory and
27,000
18,000
45,000
assessment, using skilled managers and community volunteers
2.2.1 Establish a regional system to Periodically Monitor the state of Mangrove Ecosystem
27,000
27,000
15,000
69,000
2. Enhancing
in the region
mangrove
2.2.2 Study the potential impacts of sea level rise, climate change, and episode events on
27,000
66,600
15,000
108,600
management skills
mangrove ecosystems bordering the South China Sea
through
2.2.3 Quantification of mangrove as a carbon sink
27,000 114,200
15,000
156,200
development and
2.2.4 Develop algorithms for interpretation of remotely sense images of mangrove
27,000
36,800
15,000
78,800
dissemination of
2.2 Applied research,
associations and zonation.
regionally
knowledge
2.2.5 Build on the work of the RTF-E of economic value of mangrove goods and services in
applicable tools
management, and
order to determine total economic value of mangrove ecosystems
monitoring of
2.2.6 To establish a mechanism for collection and exchange of regional mangrove data and
29,000
15,000
15,000
59,000
mangroves for
information
sustainable
2.2.7 Establish a web-based regional mangrove information centre
27,000
15,000
42,000
management
2.2.8 Test and elaborate the criteria and indicators of sustainable mangrove management
63,500
63,500
127,000
2.2.9 Develop and test guidelines to strengthen community participation in mangrove
63,500
63,500
127,000
management
2.2.10 Establish guidelines to promote participation of local communities in management of
27,000
18,000
45,000
mangrove habitats
2.2.11 Develop and test specific guidelines for the conduct of environmental impact
63,500
63,500
127,000
assessment in mangrove areas
3.1.1 To maintain the network of communication between policy makers managers, and
3.1 Integration of
scientists as established under the UNEP/GEF/SCS Project, to ensure the inclusion of
72,500
72,500
145,000
Research Programme
new research findings in management and policy making
with Management
3.1.2 Establish an expert group to assist participating countries in meeting their obligations
and Policy Making
under international conventions relating to biological diversity and RAMSAR
25,000
25,000
50,000
3. Institutional
conventions
Arrangement and
3.2.1 To maintain the network of mangrove specialists established under the UNEP/GEF/ 72,500 72,500
145,000
Regional Co-
SCS Project, to advice the governments on sustainable management of mangroves
ordination
3.2.2 Organise periodic regional conference to facilitate cross-sectorial discussion of issues
3.2 International and
25,000
25,000
25,000
75,000
and problems relating to mangrove management.
Regional Co-
3.2.3 Establishment of formal mechanism for cooperation in managing the mangroves of
operation
20,000
20,000
40,000
the South China Sea.
3.2.4 Establish an appropriate mechanism to monitor and evaluate the implementation of
27,000 18,000
45,000
SAP and achievement of the mangrove targets
GRAND TOTAL
765,000 827,600 655,000 710,500 369,500 3,327,600
STRATEGIC ACTION PROGRAMME
Page 9
STRATEGIC, PRIORITY ACTIONS FOR CORAL REEFS IN THE SOUTH CHINA SEA10
Southeast Asia is recognised as the global centre of coral reefs, both in terms of extent and species
diversity. An estimated 1/3 of the earth's coral reefs (91,700 per 284,300sq. km) are located in the
seas of Southeast Asia (Burke et al., in UNEP, 2004). Fringing reefs are well developed away from the
major river estuaries, particularly in the Philippines and the central - southern areas of the South China
Sea. All major reef types fringing, patch or platform reefs, and atolls occur in the South China Sea, with
a total estimated reef area of the order of 10,000km2 (based on aggregation of national statistics -
Spalding et al. 2001). Offshore, a series of large platform reefs and atolls are found; the most well-
known being the Spratly Islands, the Tung-Sha Reefs and the Paracel Islands. These oceanic reefs
are highly diverse and are thought to play a key role in the maintenance and replenishment of regional
biodiversity, and may be particularly important in the replenishment of populations of some harvested
species, such as the giant groupers.
If coral reefs are the most diverse tropical marine ecosystem on earth, then the Indo-Pacific in general
and the South China Sea in particular are home to the most diverse coral reef ecosystems. The South
China Sea is considered as the area with the highest diversity of hermatypic corals in the world
(Veron, 1995). More than 70 hermatypic coral genera are recorded from the reefs of the South China
Sea and hotspots of coral species diversity occur at Nha Trang (Viet Nam) with 351 species and El
Nido (Palawan, Philippines) with 305 species. Records of more than 200 species occur in a number of
sites in Viet Nam, Indonesia, and the Philippines (UNEP, 2004).
Coral reefs are an important marine ecosystem and habitat that provide nurseries and breeding
grounds for coral reef associated species and some pelagic and migratory species. Like an oasis in
the ocean, coral reefs serve as aggregation points for schools of migratory pelagic fish and as much
as a quarter of the diet of pelagic and migratory species such as the yellow fin tuna (Thunnus
albacares) is from reef-associated organism (Grandperin, 1978). The high species richness of corals
and reef-associated fauna and flora in the South China Sea makes this area a valuable source of
genetic and biochemical materials.
THREATS TO CORAL REEFS BORDERING THE SOUTH CHINA SEA
Not only are the coral reefs in South East Asia the most biologically diverse and productive reef
ecosystems in the world but, they are also the most threatened and damaged reefs, with
unprecedented rates of coral reef destruction from anthropogenic pressures that have accelerated
over recent decades (Tun et al., 2004). The Regional Working Group on Coral Reefs, identified
regionally significant threats to coral reefs in the South China Sea, as being over-fishing, use of
destructive fishing techniques, pollution (mainly eutrophication) and sedimentation (Table 6). Indirect
causes of these threats are unsustainable practices in the fisheries sector, coastal development,
deforestation and unsustainable tourism. Coral bleaching is considered as a serious threat to coral
reefs in the region.
Table 6
Prioritisation of the Threats to Coral Reefs Bordering the South China Sea (excluding China).
Cambodia Indonesia Malaysia Philippines Thailand
Viet
Nam
Region
Rank Score Rank Score Rank Score Rank Score Rank
Score Rank Score
Weighted
Score
Direct threats
Over-fishing 1
0.4
1
5.2
5
29.0
1
61.9
7
84.07
1
14.69
195.2
Destructive fishing
2
0.7
2
10.5
2
11.6
2
123.8
5
60.05 2
29.38
236.1
Sedimentation 5
1.9
4
21.0
1
5.8
3
185.7
4
48.04
3
44.04
306.4
Pollution (Eutrophication)
4
1.5
5
26.2
4
23.2
5
309.6
6
72.06 4
58.72
491.2
Coral bleaching
8
3.0
3
15.7
7
40.5
9
557.2
1
12.01 5
73.4
701.8
Indirect threats
Unsustainable fisheries and
3 1.1
8 41.9
9 52.1
4 247.6
8 96.08
8 117.4
556.3
aquaculture
Coastal development
6
2.2
7
36.7
6
34.7
6
371.5
3
36.03 6
88.08
569.2
Unsustainable tourism
9
3.3
9
47.2
3
17.4
8
495.3
2
24.02 9
132.1
719.3
Deforestation on upland areas
7
2.6
6
31.4
8
46.3
7
433.4
9
108.09 7
102.8
724.6
Total area of coral reefs
2,807
39,287
43,411
464,000
90,000
110,000
749,505
Proportion of total coral reef area
0.37
5.24
5.79
61.91
12.01
14.68
10 China did not participate in the Coral Reef Sub-component consequently did not provide and did not review data and
information of this section.
STRATEGIC ACTION PROGRAMME
Page 10
Table 6 presents the threats ranked for each country from 1 to 9, with 1 the most, and 9 the least
serious. The ratio of the coral reef area in each country compared to the total area for the South China
Sea (excluding China) was used to weight the individual country ranks resulting in a regional weighted
score. The weighted scores suggest that on a regional scale the most serious threat is over-fishing;
followed by destructive fishing; sedimentation; pollution; unsustainable fisheries practices; coastal
development; coral bleaching; unsustainable tourism; and finally deforestation on upland areas.
THE MANAGEMENT STATUS OF CORAL REEFS BORDERING THE SOUTH CHINA SEA
Based on the provision of data by the Focal Points of the participating countries a total area of
749,505ha of coral reefs were identified in six countries as follows: Cambodia, 2,807ha; Indonesia,
39,287ha; Malaysia, 43,394ha; Philippines, 464,000ha; Thailand, 90,000ha; and Viet Nam, 110,000ha.
Table 7 provides details of the management status of coral reef target sites bordering the South China
Sea, including inter alia their legal status and effectiveness of management. In the case of Cambodia,
Indonesia, Malaysia and Thailand, the total coral reef area is estimated as being the same as these
areas of targeted sites. The area of coral reefs in the 82 target coral reef sites is 217,390ha (29% of
the total area in the South China Sea, excluding China), of which 99,673ha (13% of the total area) at
61 sites, is under management at the present time. In terms of management effectiveness only around
16% of this area at thirteen sites is considered as being under successful management. Thirty seven
percent of sites are considered to be moderately well managed (medium effectiveness) while for 24%
of the sites management effectiveness is considered low, and 23% have plans but no effective
management.
Table 7
Management Status of Coral Reef Sites in the South China Sea.
Area
Live Coral
Area under
Management
Country & Site Name
Management legal status
(ha)
Cover (%)
Management (ha)
Effectiveness11
Cambodia 2,808
293
Koh Kong
73
47
Fisheries Management Area (FMA)
Koh Sdach
529
29
Proposed MPA
Koh Rong
468
23
Proposed MPA
Koh Takiev
293
58
National Park
293
Medium
Koh Tang
439
38
FMA
Prek Ampil
953
53
FMA
Koh Pouh
53
41
FMA
Indonesia
39,286
12,511
Anambas
6,255
52
Marine Management Area (MMA)
6,255
Low
Bangka 2,934
37
MMA
2,934
Medium
Belitung 2,271
52
MMA
2,271
Low
Karimata 1,041
53
Marine
Reserve
1,041
Medium
Senayang Lingga
4,735
37
Barelang dan Bintan
6,145
44
Natuna 15,905
31
Malaysia
43,394
28,209
Pulau Redang
2,550
Marine Park
1,658
High
Pulau Lima
878
Marine Park
571
High
Pulau Ekor Tebu
812
Marine Park
528
High
Pulau Pinang
978
Marine Park
636
High
Pulau Perhentian Kecil
1,621
Marine Park
1,054
High
Pulau Perhentian Besar
1,824
Marine Park
1,186
High
Pulau Lang Tengah
1,230
Marine Park
800
Medium
Pulau Susu Dara
286
Marine Park
186
Medium
Palau Tenggol
480
Marine Park
312
Low
Palau Nyireh
288
Marine Park
187
Low
Pulau Kapas
427
Marine Park
277
Low
Pulau Tioman
5,023
Marine Park
3,265
High
Pulau Labas
896
Marine Park
582
Medium
Pulau Sepoi
891
Marine Park
579
Medium
Pulau Gut
904
Marine Park
588
Medium
Pulau Tokong Bahara
903
Marine Park
587
Low
11 Categories of Management Effectiveness: Low: Area declared or proposed to be declared for management; Management
Plan developed and approved. Medium: Existing Management Framework is implemented with inadequacy of manpower,
finance and/or equipment: High: Existing Management Framework is implemented with enough trained manpower,
equipment, facilities and sustainable finance.
STRATEGIC ACTION PROGRAMME
Page 11
Table 7 cont.
Management Status of Coral Reef Sites in the South China Sea.
Area
Live Coral
Area under
Management
Country & Site Name
Management type
(ha)
Cover (%)
Management (ha)
Effectiveness
Malaysia continued
Pulau Chebeh
898
Marine Park
584
High
Pulau Tulai
1,272
Marine Park
827
High
Pulau Sembilang
1,212
Marine Park
788
Low
Pulau Seri Buat
1,544
Marine Park
1,004
Low
Pulau Rawa
1,016
Marine Park
660
Medium
Pulau Hujung
1,047
Marine Park
681
Medium
Pulau Tengah
1,030
Marine Park
669
Medium
Pulau Besar
1,683
Marine Park
1,094
Medium
Pulau Tinggi
2,036
Marine Park
1,323
High
Pulau
Aur
1,949 Marine
Park
1,267 Low
Pulau
Pemanggil
1,758 Marine
Park
1,143 Low
Pulau
Harimau
980 Marine
Park
637 Medium
Pulau
Gual
914 Marine
Park
594 Medium
Pulau
Mensirip
932 Marine
Park
606 Medium
Pulau
Sibu
852 Marine
Park
554 High
Pulau Sibu Hujung
237
Marine Park
154
High
Pulau
Mentinggi
880 Marine
Park
572 High
Pulau
Kuraman
1,339 Marine
Park
870 Low
Pulau Rusukan Besar
894
Marine Park
581
Low
Pulau Rusukan Kecil
930
Marine Park
605
Low
Philippines 464,000
2,390
Batanes
2,050 55 Protected
Land/Seascape
40 Medium
Municipal Coastal Development
Bolinao/Lingayen Gulf
9,560
40
750 Medium
Plans & National Park
Protected Land/Seascape & Fish
Masinloc, Zambales
2,000
31
120 Medium
Sanctuary
Batangas Bay,
100 52 Marine
Tourism
Reserve
80 Medium
Maricaban Strait
Puerto Galera, Mindoro
48
22
Man & Biosphere Reserve
20
Medium
Calamianes Group of
18,200 29
300 Low
Islands
El Nido, Palawan
4,250
21
Marine Park
1,000
Medium
Port Barton
454
38.2
80
Low
Environmental Critical Protection
Balabac
2500
Zone
Thailand
90,000
54,000
Mu Koh Chumporn
7,790
55
National Park
7,360
Medium
Mu Koh Chang
18,670
40
Marine National Park
11,780
Medium
Mu Koh Ang Thong
5,110
55
Marine National Park
5,110
Medium
Mu Koh Samui
38,990
40
Marine National Park
22,770
Low
Mu Koh Samet
4,200
35
Marine National Park
3,240
Medium
Sichang
Group
760 20 None
0
Sattaheep
Group
1,670 33 Navy
Control
Area
1,320
Low
Lan and Phai Group
3,910
18
Navy Control Area
1,200
Low
Chao
Lao
860 30 None
0
Prachuab
2,450 40 Marine
National
Park
270
Low
Koh
Tao
Group
2,300 45 None
0
Song
Khla
1,200 20 None
0
Koh
Kra
670 40 None
0
Losin
950 40 Navy
Control
Area
950
Low
Viet Nam
110,000
2,270
Cu Lao Cham
200
34
MPA
100
Medium
Nha Trang bay
570
26
MPA
100
Medium
Con
Dao
1,000 23 National
Park
1,000 Medium
Phu
Quoc
600 42 Proposed
MPA
0
Proposed MPA & Community -
Ninh Hai
1,070
37
1,070 Medium
based Management
Ca Na bay
2,270
41
Proposed MPA
0
Ha Long - Cat Ba
N/A
43
World Heritage & National Park No
Available
Medium
Hai Van - Son Tra
N/A
51 Proposed
MPA
0
Bach Long Vi
N/A
22 Proposed
MPA
0
STRATEGIC ACTION PROGRAMME
Page 12
TARGETS
Table 8 presents general status of coral reef management in the South China Sea geographic region
of the six countries based on information assembled for 82 individual coral reef areas. The area to be
added to the total area managed sustainably by the year 2015 is 54,130ha, thereby increasing the
total area under sustainable management to 153,803ha which represents 20% of the total reef area of
the South China Sea or 71% of the area of the target sites.
Table 8 Status of Coral Reef Management in the South China Sea Biographic Region of the
Participating Countries.
Cambodia Indonesia Malaysia
Philippines
Thailand Viet Nam
Total
Total coral reef area in the South China Sea
2,808 39,286
43,394 464,000 90,000 110,000
749,488
(ha)
Total coral reef area of the 82 target sites
2,808
39,286
43,394
36,662
89,530
5,710
217,390
Coral reef area under existing management at
293 12,511
28,209 2,390 54,000 2,270 99,673
the 83 sites
Number of target sites with management
7 7 36 9
14 9 82
information
No effective management, plans only
6
3
0
1
5
4
19
No. of sites with low management effectiveness
0
2
11
2
5
0
20
No. of sites with medium management
1 2
12 6
4 5 30
effectiveness
No. of sites with high management
0 0
13 0
0 0 13
effectiveness
FMA,
PLS, MCDP,
NP,
MMA,
MPA, NP,
Existing management types12 [1]
MPA,
MP
MTS, MBR,
MNP,
MR
CBM, WH
NP
ECPZ
NCA,
Target area to be added for management by
1,965 5,580
15,185 10,100 18,000 3,300 53,130
2015 (ha)
Total area to be under management by 2015
2,258 18,091
43,394 12,490 72,000 5,570 153,803
(ha)
Coral reef monitoring has expanded over more than last ten years in most countries bordering the
South China Sea and provided technical baselines for long-term coral reef management (Tun et al.,
2004). The data obtained in the framework of the Global Coral Reef Monitoring Network (GCRMN)
indicated that the percentage of reefs in Southeast Asia countries had declined in state from one
quartile category to a lower one, equivalent around 16%, during the period of 1994 2004.
It was noted that setting a target for the total area under management did not represent a target for the
state of the reef although it could be assumed that those under management would, depending on the
management regime, be more likely to sustain their biological diversity than those that were not under
management. Therefore, the Regional Working Group on Coral Reefs considered an additional target
related to the reduction of degradation rate. The focal points of participating countries agreed that
improvement of coral reef management in next ten year could support to reduce decadal degradation
rate of coral reefs in their countries, resulting in a regional estimation as around 5%. The regional
assessment of coral reef status for the next period to 2014 following the GCRMN plan will enable to
follow up this expectation and evaluate management effectiveness during implementing the revised
SAP.
The specific targets for Coral Reef management are:
· By 2015, at least 70% of the existing area of coral reefs in the 82 target coral reef sites
(153,000ha) to be put under an appropriate form of sustainable management;
· By 2015, reduce the regional decadal rate of degradation in live coral cover from the
present rate of 16% to 5%.
12 Cambodia - FMA: Fisheries Management Area, MPA; Marine Protected Area, NP: National Park; Indonesia - MMA: Marine
Management Area, MR: Marine Reserve; Malaysia - MP: Marine Park; Philippines - PLS: Protected Land/Seascape, MCDP:
Municipal Coastal Development Plan, MTS: Marine Tourism Reserve, MBR: Man & Biosphere Reserve, ECPZ:
Environmental Critical Protection Zone; Thailand - NP: National Park, MNP: Marine National Park, NCA: Navy Control Area;
Viet Nam - MPA: Marine Protected Area, NP: National Park, CBM: Community-based Management, WH: World Heritage).
STRATEGIC ACTION PROGRAMME
Page 13
Many of the coral reefs in the region are under existing management with low effectiveness and
criteria for effective management have not been identified or applied. The working group developed a
sustainable management indicator matrix on the assumption that sustainable management of coral
reefs means management of the ecosystem in such a way that the resource(s) can be used
continuously in a cost effective and ecologically friendly manner.
Such a management regime would normally have a formal management framework, clearly
understood at every level by all stakeholders. One approach to assessing management sustainability
is to use indicator(s) and three categories are proposed; namely: management, ecological-
environmental, and socio-economic indicator(s) (Table 9).
The purpose of the defining these indicators is to provide a means of assessing whether an area is or,
is not, under sustainable management in the context of the targets of the SAP, which states that by the
year 2015, 70% of the coral reef area in 82 target sites of the South China Sea shall be under
sustainable management. Depending on the objective(s), management input(s) (column 1) are
expected to produce measurable output(s) which should be reflected through ecological indicator(s)
(column 2) and/or socio-economic indicator(s) (column 3).
Table 9 Sustainable Management Indicator Matrix. [A baseline, mid-term and end of first phase of
SAP implementation assessment of these indicators is required to indicate whether or not the
targets have been met.]
Ecological/Environmental
Management Indicators
Socio-Economic Indicators
Indicators
MANAGEMENT CAPACITY
· Formal
Management
FISHERIES
framework
· Catch per unit effort
· Trained
Man-power
· Total
landing
(numbers/levels)
· Live Coral Cover
· Income
· Facilities
and
equipment · Butterflyfish
(density)
· Number of people involved
· Sustainable
Financing
· Grouper (number of fish
MANAGEMENT APPROACH
larger than 30cm)
· Sectorial
· Sea
Urchin
Diadema
· Integrated
· Giant
clam
Tridacna
TOURISM
· Community-based
squamosa
· Number of visitors
· Multiple-use
· Number of tourism operators
MANAGEMENT TOOLS
· Income
·
Licensing and permits
· Number of people involved
· Seasonal
closure
· Zoning
R
13
EGIONAL ACTIONS AND COST ESTIMATES
During the sixth meeting of the Regional Working Group on Coral Reefs (RWG-CR), a comparative
analysis of the content of the National Action Plans was undertaken to identify common threats to the
habitats and actions needed at the regional level. The seventh meeting of the RWG-CR reviewed and
expanded the text, which is presented in Annex 6 of the meeting report (UNEP/GEF/SCS/
RWG-CR.7/3). The RSTC reviewed the proposed regional actions and suggested a re-arrangement of
the order of components and actions, to ensure that the regional actions address the identified threats
to coral reefs and improve the effectiveness of management. The eight meeting of the RWG-CR in
Phu Quoc, Viet Nam, 4th 7th June 2007 considered and revised the proposed regional actions and
estimated costs required for these actions as presented in Table 10.
A total of 37 regional actions are proposed under the coral reef sub-component of the revised SAP.
The actions are allocated in four components as below.
13 The activities proposed in the coral reef sub-component focus on non-oceanic reef systems outside disputed areas in the
coastal waters of the countries bordering the South China Sea.
STRATEGIC ACTION PROGRAMME
Page 14
1. ENHANCEMENT OF RESOURCE AND HABITAT MANAGEMENT
This component is divided into two sub-components. The first aims to promote good environmental
governance and sustainable management of coral reef ecosystems. Regional actions focus on the
review, synthesis, assessment and dissemination of good experiences and lesson learnt in the
management of coral reefs. The second sub-component is to maintain a regional management
framework to ensure the use of sound science in the sustainable management of coral reefs in the
South China Sea. Regional actions include: maintenance of the regional expert group and coordinating
mechanism, involvement and empowerment of stakeholders and communities and sharing
experiences between countries on coral reef research and management.
2. PUBLIC AWARENESS, COMMUNICATION AND EDUCATION
The objective is to increase awareness of stakeholders regarding the ecological roles, economic
values, and need for sustainable management of coral reefs. This component will facilitate the
mainstreaming of information into educational programmes, develop information campaigns and
sharing of training materials through the regional website.
3. RESEARCH AND MONITORING
The component aims to provide relevant scientific data and information for sustainable management of
coral reefs. A number regional actions are proposed to support the scientific community in: assessing
status of coral reefs; monitoring biological and socio-economic factors; maintaining, updating GIS and
meta-databases and disseminating information for management purpose; and developing mechanism
in environment impact assessment in transboundary areas.
4. SUSTAINABILITY AND CAPACITY BUILDING
The component is developed with the aim to improve regional capacity in management of
transboundary issues regarding coral reefs. Some proposed actions are related to human resource
development by exchanging experts, training trainers, sharing experiences in enforcement and
developing capacity in fund raising and financial sustainability. Other actions focus on maintenance
and improvement of the networks of demonstration sites, research centres and reef management
agencies; and provision guideline for sustainable use of coral reefs and information on value added
benefit derived from transboundary management of reefs.
STRATEGIC ACTION PROGRAMME
Page 15
Table 10
Proposed Regional Actions for the Coral Reef Component of the Strategic Action Programme.
Component
Sub-Component
Activity
Description
2008 2009 2010 2011 2012 2013 2014 2015 Total
2 workshops, 5 days,
1.1.1 Review, synthesis and formulation of good
2 times; consultancy,
44,500
44,500
89,000
practices in coral reef sustainable management
printing and distribution
Workshops, 3 days,
1.1.2 Assessment and advice of technique on
2 times; consultancy,
37,600
37,600
1.1 To promote
enhancement and rehabilitation of coral reefs.
printing and distribution
good
1.1.3 Review and formulation of good practices in
Workshops, 3 days,
environmental
community - based management activities at the 2 times; consultancy,
37,600
37,600
governance and
region
printing and distribution
sustainable
1.1.4 Introduction of cost effective waste management Workshops, 3 days,
management of
34,600
34,600
and environment friendly systems
2 times; consultancy
coral reef
1.1.5 Synthesis of successes on alternative livelihood Workshops, 3 days,
ecosystem
programme, including funding mobilisation &
2 times; consultancy,
18,800
18,800
37,600
technical support
printing and distribution
1.1.6 Review of existing transboundary management
Workshops, 3 days,
practices and identification of priorities in
2 times; consultancy,
37,600
37,600
transboundary management zones
printing and distribution
1.2.1 Regional coral reef expert group maintained to
1. Enhancement of
6 workshops, 3 days,
integrate research programmes and data and
13,950
13,950
13,950
13,950
13,950
13,950
83,700
Resource and
consultancy
information used for coral reef management.
Habitat
1.2.2 Monitor achievement of SAP targets and NAP
Management
Consultancy 18,000
18,000
36,000
objectives every 5 year period.
1.2 To maintain of 1.2.3 Synthesis of laws that contribute effectively to
regional
sustainable coral reef management, emphasizing Workshop, 3 days &
37,950
37,950
management
on rule and regulation for good management
consultancy
framework to
practices
ensure the use 1.2.4 Regional coordinating mechanism to facilitate
2 workshop, 3 days &
of sound
convergence of national and regional action
37,950
37,950
75,900
consultancy
science in the
plans.
sustainable
1.2.5 Information exchange for promotion of
Printing, distribution &
management of
stakeholder involvement in sustaining
14,000
14,000
consultancy
coral reefs in
management.
the South China 1.2.6 Review of traditional value and knowledge, and Printing, distribution &
Sea
application in coral reef management in the
27,000
27,000
consultancy
region
1.2.7 Establishment of recognition and award system Workshop & Award
45,300
45,300
for good management of coral reefs.
1.2.8 Review of level of compliance to various int'l
Consultancy 8,000
8,000
obligations and conventions pertaining coral reefs
1.2.9 Exchange and sharing experience between
2 workshop
13,950
13,950
27,900
nations on coral reef research and management.
STRATEGIC ACTION PROGRAMME
Page 16
Table 10 cont. Proposed Regional Actions for the Coral Reef Component of the Strategic Action Programme.
Component
Sub-Component
Activity
Description
2008 2009 2010 2011 2012 2013 2014 2015 Total
2.1.1 Facilitation of mainstreaming of regional Development, printing,
2.1 Increase awareness
coral reef information and education
distribution & national
14,000
25,000
25,000
64,000
of stakeholders on
programme
workshop
2. Public
the ecological roles, 2.1.2 Development and launching of regional
Awareness,
Consultancy, printing &
economic values of
information campaigns for sustainable
24,160
24,160 48,320
Communication
2 seminars
coral reefs, and need
use of coral reefs.
and Education
for sustainable
2.1.3 Sharing training materials among the
management
countries by dissemination through
No cost
regional website.
Data collection,
3.1.1 Facilitation of and support to assess
6 countries, 2 time,
baseline information and status of coral
55,300
55,300
55,300 165,900
3 workshop, printing and
reefs
distribution
3.1.2 Facilitation of and support to regular
3 workshops & support to
biological and socio-economic
33,950
33,950
33,950 101,850
target sites
monitoring
3.1.3 Analysis of regional socio-economic
status and culture significance of coral
reefs, to provide vital information for
2 workshops, 3 days
13,950
13,950
27,900
sustainable management and use of
coral reefs
3.1 To provide relevant 3.1.4 Management and update of coral reef
Technical staff one
scientific data and
GIS and other databases by SEA
1,000
1,000
1,000
1,000
1,000
1,000
1,000
1,000 8,000
month/year * 8 years
3. Research and
information for
START RC.
Monitoring
sustainable
3.1.5 Prepare a base map of coral reefs in
management of coral
SCS and overlays to reflect indicators
Consultancy 14,000
14,000
28,000
reefs
of sustainable management
3.1.6 Regular analysis, synthesis and update
of databases, and dissemination of
2 workshops & printing,
information to general public, decision
16,950
16,950 33,900
distribution
makers, governments, potential
partners
3.1.7 Develop mechanism for analysis of
impacts of different development
Consultancy 16,000
16,000
32,000
scenarios on coral reef environment.
3.1.8 Develop a research project regarding
economic valuation of coral reefs in the 2 workshops, in-country
38,680
38,680
77,360
South China Sea, focusing on indirect
surveys, 30 sites
values
STRATEGIC ACTION PROGRAMME
Page 17
Table 10 cont.
Proposed Regional Actions for the Coral Reef Component of the Strategic Action Programme.
Component
Sub-Component
Activity
Description
2008 2009 2010 2011 2012 2013 2014 2015 Total
4.11. Exchange of experts for human
Experts, training course,
resource development in coral reef
12,835
12,835
12,835
12,835
12,835
12,835
77,010
administrative cost
management.
4.1.2 Conduct of training of trainers for
2 training courses,
coral reef management at regional
payments for trainers,
64,614
64,614
129,228
level
administrative cost
4.1.3 Exchange of experiences regarding
skill of law enforcement and
Workshop 18,600
18,600
exchange of information, compliance
and effectiveness of enforcement
4.1.4 Review and formulation of
mechanism for financial sustainability Workshop and consultancy
34,600
34,600
for application in the region.
4.1 To improve regional 4.1.5 Development of capacity in fund
4. Sustainability
capacity in
raising and implementation of
Workshop, payment for
and Capacity
management of
29,100
29,100
financial scheme for coordination of
trainers
Building
transboundary issues
coral reef management
regarding coral reefs 4.1.6 Maintenance of demonstration site
network through forum of local
government officials, project
2 fora
27,900
27,900
55,800
management personnel from
demonstration sites
4.1.7 Forum of research centres and reef
2 fora
27,900
27,900
55,800
management agencies
4.1.8 Development of guideline for
Consultancy, printing &
20,500
20,500
sustainable use of coral reefs
distribution
4.1.9 Provision of information on value
added benefit of enhancement of
Workshop & consultancy
34,600
34,600
sustainable use derived from
transboundary management of reefs
Total
135,449 242,915 175,785 295,259 321,335 229,915
94,250 177,310 1,672,218
STRATEGIC ACTION PROGRAMME
Page 18
STRATEGIC ACTION PROGRAMME
Page 19
STRATEGIC, PRIORITY ACTIONS FOR SEAGRASS IN THE SOUTH CHINA SEA
The recently published World Atlas of Seagrass (Green and Short, 2003) provides information on the
world's seagrass habitats globally, incorporating their status in the face of environmental change. This
is part of an ongoing initiative of the UNEP-WCMC to develop a comprehensive global GIS dataset
with data derived from multiple sources. There are however, still substantial information gaps and for
the South China Sea the UNEP/GEF project has already provided the first comprehensive seagrass
data set from China. These data, however, was based on field survey at known sites in SCS countries
and one should be aware that it does not reflect the total distribution of seagrass or seagrass beds in
these countries. Some algorithms for mapping seagrass using remote sensing has been developed
but this has yet to be applied to the entire South China Sea coastline.
Of the approximately 60 seagrass species described worldwide 18 species are found in, the coastal
waters of the South China Sea. The numbers of seagrass species known to occur in each country are:
Cambodia, 9; China, 8; Indonesia, 12; Malaysia, 14; Thailand, 12; Philippines, 15; and Viet Nam, 14.
Halophila is the most diverse and widespread genus in coastal waters throughout the region. Further
taxonomic work is essential to verify the 4 new Halophila species found in Malaysia (Japar et al.
2004).
The coastlines of the northern sub-region, in China and northern Viet Nam, have characteristics of
subtropical areas, and the species include Zostera japonica together with Halophila beccarii, Halophila
ovalis, Halophila decipiens, Enhalus acoroides, Thalassia hemprichii, Halodule pinifolia, Halodule
uninervis, Cymodocea rotundata and Ruppia maritima. All but the first are widespread throughout the
South China Sea region. Additional seagrass species recorded in the tropical zone include Halophila
spinulosa, Halophila minor, Cymodocea serrulata, Halodule pinifolia, Syringodium isoetifolium and
Thalassodendron ciliatum.
The sub-tropical species Zostera japonica often forms mono-specific seagrass beds, and has been
recorded in Tieshan Bay and Pearl Bay, Guangxi Province, and Hong Kong in China. Its distribution
also extends down to northern and central Viet Nam, and its' occurrence in Binh Dinh Province
represents the southernmost limit of this temperate species in the Indo-west Pacific.
Of the tropical species, Thalassodendron ciliatum is generally found in seagrass beds from the
intertidal to the low sub-tidal zone (2 17m) in the eastern part of Indonesia, and the southern and
western shores of the Philippines. This species also occurs in the seagrass beds in Con Dao,
southern Viet Nam. In the Philippines, it has been reported in Cuyo Island, the northernmost limit of its
distribution in the Indo-west Pacific.
CURRENT MANAGEMENT STATUS OF SEAGRASS BEDS BORDERING THE SOUTH CHINA SEA
In the South China Sea region there has been a rapid rate of seagrass loss and decline in recent
years. Indonesia has lost about 30-40% of its seagrass beds, with as much as 60% being destroyed
around Java. In Singapore, the patchy seagrass habitats have suffered severe damage largely
through burial under landfill operations. In Thailand, losses of the beds amount to about 20-30% and
in the Philippines, it is about 30-50%. Very little information on seagrass loss is available from
Cambodia, China, Malaysia, and Viet Nam (UNEP, 2004).
On the basis of data provided by the participating countries in the eighth meeting of the RWG-SG, the
total of 43 target seagrass sites are recorded in the coastal areas bordering the South China Sea with
the details as follows: Cambodia 33,814ha in 4 sites; China 1,960ha from 4 sites; Indonesia 3,035ha
from 7 sites; Malaysia 222ha from 13 sites; Philippines 23,245ha from 5 sites; Thailand 2,553ha from
4 sites; and Viet Nam 13,503ha from 6 sites. Table 11 provides information regarding current
management status indicating that 12,928ha (16.5%) of the total area is currently under some form of
management. The total estimated area of seagrass amounts to 78,332ha of which 25,876ha (33%) is
targeted to be under sustainable management by 2012.
STRATEGIC ACTION PROGRAMME
Page 20
Table 11
Status of Some Seagrass Sites in the South China Sea and Gulf of Thailand. Numbers summed for
each country only reflect the sites shown in this table and do not represent the country totals.
Target for
Area
Area under
Management
Country and Site Name
Legal Status
Management
(ha)
Management
Effectiveness14
by 2012
Cambodia 33,814
2,000
11,446
Kampong Sam Bay
164 None
No
N/A
0
Chroy Pros
3,910 Provincial designated MPA
2,000
Medium
0
Kampot
25,240 Proposed fish Sanctuary
No
N/A
10,096
Kep Beach & Koh Tonsay
4,500 None
No
N/A
1,350
China 1,960
150
700
Hepu seagrass bed
540 National Dugong Reserve
150
Medium
150
Liusha seagrass bed
900 None15 No
N/A
200
LiAn seagrass bed
320 Proposed Marine Park
No
N/A
200
Xincun seagrass bed
200 Proposed Marine Park
No
N/A
150
Indonesia
3,035
0
2,420
Medang-Mesanak 5
None
No
N/A
5
Temiang 5
None
No
N/A
5
East Bintan
2,000 Proposed Marine Management Area
No N/A
1,500
Mapor 275
Proposed Marine Management Area
No N/A
275
Anambas
150 Proposed Marine Management Area
No N/A
35
Bangka-Belitung 350
Proposed Marine Management Area
No N/A
350
Senayang 250
Proposed
MPA
No
N/A
250
Malaysia
222
17
40
Tanjung Adang Laut Shoal
40 None
No
N/A
40
Tanjung Adang Darat Shoal
42 None
No
N/A
0
Merambong Shoal
30 None
No
N/A
0
Sungai Kemaman
17 None
No
N/A
0
Telaga Simpul
28 None
No
N/A
0
Sungai Paka Shoal
43 None No
N/A
0
Pulau Tinggi Mersing
3 Marine Park
3
Medium
0
Pulau Perhentiar
3 Marine Park
3
Medium
0
Pulau Redang
2 Marine Park
2
Medium
0
Setiu Terengannu
3 None No
N/A
0
Pulau Besar Mersing
3 Marine Park
3
Medium
0
Merchang 2 None No
N/A
0
Tunku Abdul Rahman Park
6 State Park
6
Medium
0
Philippines 23,245
6,641
6,920
Cape Bolinao
22,400 Environmentally Critical Area - MPA
6,000 Medium
6,720
Puerto Galera
114 Fish sanctuary part of the Man and
60 Low/Medium
50
Biosphere reserve/
Ulugan Bay
11 Fish sanctuary part of the Man and
11 Medium
0
Biosphere reserve/
Honda Bay
470 Fish Sanctuary part of the Man and
320 Medium
150
Biosphere reserve/
Puerto Princesa
250 Protected Area part of the Man and
250 Medium
0
Biosphere reserve/
Thailand 2,553
1,780
0
Kung Krabane Bay
700 None16 700
High
0
Tungka Bay
1,080 National Park
1,080
Low
0
Sarat Thani
500 None
No
N/A
0
Pattani Bay
273 None
No
N/A
0
Viet Nam
13,503
2,340
5,050
Phu Quoc archipelago
4,600 Phu Quoc Marine Protected17 Area
2,050
Low
3,000
Con Dao Islands
200 National
Park
200
Medium
200
Phu Qui Island
400 Proposed
MPA
No
N/A
0
Thuy Trieu
800 Proposed
MPA
50
N/A
350
Tam Giang
2,000 Proposed
Ramsar
No
N/A
1,000
Cu Lao Cham
40 MPA
40
Medium
0
14 Categories of Management Effectiveness: Low: Area declared or proposed to be declared for management; Management Plan developed
and approved. Medium: Existing Management Framework is implemented with inadequacy of manpower, finance and/or equipment: High:
Existing Management Framework is implemented with enough trained manpower, equipment, facilities and sustainable finance.
15 Local
Reserve.
16 Under King's project.
17 Phu Quoc National Park is an area of designated terrestrial Forest whilst the Marine Protected Area has recently been declared by the
Provincial Government adjacent to the National Park.
STRATEGIC ACTION PROGRAMME
Page 21
THREATS TO SEAGRASS
The Regional Working Group identified six threats to seagrass including: destructive fishing such as
push net, trawler; sedimentation from coastal development; waste water, effluents; nutrients; coastal
construction; and over-fishing. Focal points from each country were asked to rank the relative
importance of these six threats. To determine the regional significance of each threat the rank for each
threat was weighted using the proportion of the area of seagrass in the country concerned compared
with the regional total. The resultant values were summed to produce the regional weighted total,
which is inversely related to the regional significance (small values are more significant than larger
values). The relative importance of the threats from a regional perspective is summarised in Table 12.
Table 12
Regional ranking of threats to seagrass, by the members of RWG-SG, 1=most serious and 6=least
serious. (scoring regionally the threats based on country score provided by the focal points and rate
between seagrass areas of each country and region)
Country Cambodia China Indonesia Malaysia Philippines Thailand Viet
Nam
Total
Area (ha)
33,814 1,960 3,035 222 23,245 2,553 13,503 78,332
Proportion of
regional total
0.458 0.027 0.041 0.003 0.315 0.035 0.121 1.00
Total
Rank
weight
Regional
score
Rank
weight
score
Rank
weight
score
Rank
weight
score
Rank
weight
score
Rank
weight
score
Rank
weight
score
Weight
score
ranking
Destructive
fishing such
as push net,
1 0.432 1 0.025 1 0.039 3 0.009 2 0.593 1 0.033 1 0.172
1.303 1
trawler
Sedimentation
from coastal
4 1.727 3 0.075 3 0.116 4 0.012 3 0.890 2 0.065 2 0.345
3.230 2
development
Waste water
effluent
3 1.295 4 0.100 5 0.194 5 0.015 4 1.187 4 0.130 5 0.862
3.783 3
Nutrients
6 2.590 5 0.125 4 0.155 6 0.018 1 0.297 3 0.098 6 1.034
4.317 5
Coastal
construction
5 2.158 2 0.050 2 0.077 2 0.006 5 1.484 6 0.196 3 0.517
4.488 6
Over-fishing
2 0.863 6 0.150 6 0.232 1 0.003 6 1.780 5 0.163 4 0.690
3.882 4
CHALLENGES FOR SEAGRASS MANAGEMENT
Challenges for sustainable seagrass management (not in order of priority) in the countries bordering
the South China Sea are:
1. Lack of sustainable financing.
2. Lack of awareness among people who are causing damages to seagrass on their
consequences.
3. Coastal development plans, if any, usually do not take seagrass into consideration.
4. Poverty of coastal communities.
5. Lack of effective seagrass management systems.
6. Weak law enforcement.
7. Lack of long-term regional and international cooperation/coordination.
GOAL AND TARGETS
During the 6th meeting of the RWG-SG, there was agreement regarding the goal of the SAP with
respect to seagrass which was defined as:
"To conserve, manage and sustainably utilise seagrass habitats and
resources."
STRATEGIC ACTION PROGRAMME
Page 22
The specific targets for management and conservation of seagrass ecosystems in the SCS are as
follows:
· Twenty-one managed areas totalling 26,576 hectares (approximately 33% of the
78,332 hectares identified as seagrass sites) in the South China Sea, to be brought
under sustainable management by the year 2012.
· Government recognition of the ecological importance of seagrass through
amendment of the management plans for seven existing MPAs with significant areas
of seagrass habitat, to include specific seagrass-related management actions by the
year 2012.
· Adoption of 7 new Marine Protected Areas specifically focussing on seagrass
habitats identified in the prioritised listings of the SCS Project, by the year 2012.
Table 13
Sustainable Management Indicator Matrix. [A baseline, mid-term and end of first
phase of SAP implementation assessment of these indicators is required to indicate
whether or not the targets have been met.]
Ecological/Environmental
Socio-Economic
Management Indicators
Indicators
Indicators
FISHERIES
MANAGEMENT CAPACITY
·
· Catch per unit effort
Formal Management
framework
· Total landing from the
seagrass area
· Trained Man-power
· Proportion of rabbitfish
(No./levels)
·
(siganids) in total landing
Facilities and equipment
· Percent seagrass cover
·
· Income
Sustainable Financing
· Shoot density per sq m
No. people involved
· Abundance of sea urchin,
MANAGEMENT APPROACH
TOURISM
Tripneustes gratilla
·
· Sectorial
Number of visitors
· Abundance of sea
· Number of tourism
· Integrated
cucumber, Stichopus
operators
· Community-based
chloronotus
·
· Income
Multiple-use
No. people involved
AWARENESS
MANAGEMENT TOOLS
Proportion of local people that
are aware of seagrass
· Zoning
ecosystems functions and
values
REGIONAL ACTIONS AND COST ESTIMATES
The overall goal of the proposed regional activities is to enhance the sustainable use and
management of seagrass resources and ecosystems in the region. The activities were elaborated
during the seventh meeting of the Regional Working Group on Seagrass and are presented in Annex
6 of that meeting report. Table 14 of this document itemises the actions and includes preliminary cost
estimates prepared by the regional working group during the seventh meeting. There are 15 actions
proposed, which are grouped into three components.
1. BUILDING CAPACITY AND AWARENESS AT ALL LEVELS TO ENSURE LONG-TERM SUSTAINABLE USES OF
SEAGRASS HABITATS AND RESOURCES
The aim of this component is to increase the knowledge of government officials, managers, and
stakeholders concerning the importance and value, of seagrass resources and ecosystems in the
region. This component is divided into two sub-components; the first of which provides details of the
actions required to maintain and elaborate regional mechanisms for knowledge and information
exchange through training, site visits, meetings, regional symposia, a South China Sea website, and
publications. The second focuses on the production of materials for use in promoting knowledge and
awareness of sustainable practices.
STRATEGIC ACTION PROGRAMME
Page 23
2. ENHANCING MANAGEMENT SKILLS THROUGH DEVELOPMENT AND DISSEMINATION OF REGIONALLY
APPLICABLE TOOLS
This component aims to enhance the management skills and experience of all stakeholders by
providing a sound scientific and technical basis for management of seagrass resources and
ecosystems. The first sub-component involves compiling, developing and enhancing guidelines and
other tools for disseminating and facilitating experiences and good practices at the regional level. The
second sub-component focuses on the application of research and knowledge for monitoring and
sustainable management of seagrass habitats.
3. INSTITUTIONAL ARRANGEMENTS AND REGIONAL CO-ORDINATION
This component aims at assisting the countries in effectively managing their seagrass resources and
ecosystems in a sustainable manner, via the development of mechanisms including policy, where
appropriate for co-ordination of actions. The first sub-component addresses the integration and
promotion of research programmes with policy and decision-making and the second focuses on
international and regional co-operation and co-ordination. This includes the maintenance and
enhancement of the existing regional seagrass network, development and collection of
data/information on seagrass at regional scales, promotion of transboundary management, zoning,
and promotion of regional/sub-regional bodies for joint management of seagrass resources and
ecosystems, where appropriate.
STRATEGIC ACTION PROGRAMME
Page 24
Table 14
Proposed Regional Actions for the Seagrass Sub-component of the Regional Strategic Action Programme.
Costs by Year
Components Sub-components
Activities
Description
Total
Costs
2008 2009 2010 2011 2012
1. Building capacity
1.1 Mechanisms for
1.1.1 Exchange of personnel among
3 pers/country, 7 countries, 2 times, 30 days.
39,900
19,950
19,950
and awareness at all
knowledge and
seagrass sites.
Costs: air fare: US$500, Stipend: US$15/per/day
levels to ensure
information exchange
1.1.2 Regional Training on seagrass
Biennial Trainings: (4 pers/country, 7
210,000
70,000
35,000
70,000
35,000
long-term
management models and National
countries/course) + (National echo-seminars:
sustainable uses of
Echo-seminars.
7 countries, US$5,000 x 2 seminars)
seagrass habitats
1.1.3 Maintain the SCS Website and input
In-kind contribution from the network
and resources
new data and information.
1.1.4 Bi-annual seagrass "YALAMUN"
Translation into 7 languages from in-kind
publication. For example the outputs
contribution. English text to be prepared by a
from 2.1.4.
coordinating entity
1.1.5 Biennial Regional Conference on
2 conferences, 100 pers./conference,
186,000
93,000
93,000
seagrass management.
3 days/conference
1.2 Materials for use at all
1.2.1 National echo-seminars to incorporate 1 seminar, US$5,000/country, 7 countries
35,000
35,000
levels in promoting
seagrass into primary and secondly
knowledge and
school curricula.
awareness of
1.2.2 Compilation, selection, production and In-kind contribution from the national
sustainable management
dissemination of general awareness
government
practices
materials of seagrass through national
media.
2. Enhancing
2.1 Develop and enhance
2.1.1 Further enhance the regional seagrass Updating the GIS database to the regional
12,000
2,400
2,400
2,400
2,400 2,400
management skills
guidelines and other
GIS database (e.g. finer resolutions,
database by SEAs as in-kind contribution.
through
tools as information
using standardized methods,
Maintaining the regional GIS database by a
development and
resources and facilitate
technology.
coordinating entity: 20% of staff of SEA START
dissemination of
their regional
RC (US$200/month, 12 months, 5 years)
regionally applicable
dissemination and
2.1.2 More assessment of baseline
National activities as in-kind contribution from
tools
adoption for seagrass
information on seagrass from
the national governments
management
unstudied areas to find the seagrass
distribution.
2.1.3 Expand and up-date the regional
Updating the meta database to the regional
12,000
2,400
2,400
2,400
2,400 2,400
seagrass meta-database.
database by SEAs as in-kind contribution.
Maintaining the regional meta database by a
coordinating entity: 20% of staff of SEA START
RC (US$200/month, 12 months, 5 years)
2.1.4 Regional synthesis of experiences and A 3-day workshop for participants from national
13,020
13,020
lessons learnt at UNEP/GEF/SCS
echo-seminar and demo-site, 2 per/country, 7
demonstration and other sites; and
countries
replicate models useful in other areas.
2.1.5 Development of criteria and award
It will be discussed during regular meetings of
10,000
10,000
system for successful seagrass
the RWG-SG. Award after 5 years: Total three
management.
prizes: US$10,000
STRATEGIC ACTION PROGRAMME
Page 25
Table 14 cont.
Proposed Regional Actions for the Seagrass Sub-component of the Regional Strategic Action Programme.
Costs by Year
Components Sub-components
Activities
Description
Total
Costs
2008 2009 2010 2011 2012
3. institutional
3.1 Integration of research 3.1.1 Develop guidelines to integrate
These guidelines will be discussed during the
22,320
22,320
arrangement and
results into
research results into management and regular the RWG-SG meetings. A workshop with
regional
Management and policy
policy making
participation of the RWG-SG, policy makers,
coordination
making
invited scientists and legal experts: 3 days, 7
countries, 3 pers/country, 3 invited speakers
3.2 International and
3.2.1 Annual Meetings of the Regional
1 meeting/year, 5 years, 1 per/country, 7
54,250
10,850
10,850
10,850
10,850 10,850
regional cooperation,
Working Group on Seagrass (RWG-
countries, 5 days
and co-ordination
SG)
3.2.2 Promote transboundary management
Five 3-day workshops for the development of
130,000
26,000
26,000
26,000
26,000 26,000
of seagrass for sustainable fisheries
management plans. 1 Cambodia-Viet Nam
and the protection of endangered
(US$6,000*5=30,000), 2.Philippine-Malaysia-
species (dugongs and turtles)
Indonesia (US$10,000*5=50,000), 3.Viet Nam-
China (10,000*5=50,000). 10 pers/workshop
3.3 Improvement of the
3.3.1 Review of existing data and
In-kind co-financing from the government
management plans of
information, legislations and
current seven
regulations related to the
prioritised MPAs
establishment of MPA
3.3.2 Amend the existing management plans In-kind co-financing from the government
to include specific seagrass related
management actions based on results
of the legal review.
4. Strengthening
4.1 Put 23 managed areas 4.1.1 Review and update existing data and
In-kind co-financing from the government
managed seagrass
into sustainable
information on the 23 seagrass areas
areas and
management
4.1.2 Develop sustainable management
In-kind co-financing from the government
establishment of new
plans based existing data and
MPAs with focussing
information
on seagrass habitat.
4.1.3 Implement the management plans
Beyond the target time (after 2012)
4.2 Establishment of 7 new 4.2.1 Development criteria for selecting the
Regional Working Group Meetings.
MPAs focussing on
MPAs focussing on seagrass
seagrass habitat
4.2.2 From the prioritised listings of seagrass Regional Working Group Meetings
areas, select 7 sites for the
establishment of 7 new MPAs (in
regional working meetings)
4.2.3 Development and adoption of
In-kind co-financing from the government
management plans for the 7 MPAs
4.2.4 Implement the 7 MPAs
Beyond the target (after 2012)
Total
724,490 239,650 118,920 124,670
96,600 144,650
STRATEGIC ACTION PROGRAMME
Page 26
STRATEGIC ACTION PROGRAMME
Page 27
STRATEGIC PRIORITY ACTIONS FOR COASTAL WETLANDS BORDERING
THE SOUTH CHINA SEA
MANAGEMENT STATUS OF COASTAL WETLANDS BORDERING THE SOUTH CHINA SEA
Under the UNEP/GEF South China Sea Project, activities in the wetland sub-component focus on five
specific types of wetlands, namely intertidal mudflats, estuaries, lagoons, peat swamps and non-peat
swamp, excluding mangroves, coral reefs and seagrass beds which are the subjects of separate sub-
components. Table 15 summarises the legal and management status of major lagoons, estuaries,
inter-tidal mudflats, peat swamps and non-peat swamps bordering the South China Sea. A total area
of 4,201,145ha of the five specific types of wetland sites has been identified, specifically lagoons
(34,921ha), estuaries (1,203,871ha), inter-tidal flats (691,859ha), non-peat swamps (1,623,567ha),
peat swamps (646,927 ha).
Table 15
Legal and Management Status of some Inter-tidal Mudflats, Estuaries, Coastal Lagoons and
Coastal Peat Swamps bordering the South China Sea.
Legal and Management Status
Name of site
Area (ha)
Protected Non-use
Sustainable
Non-sustainable
(Subsistence/commercial)
use
use
Estuaries
Cambodia
Koh Kapik Ramsar in Koh Kong
12,000
National Park and RAMSAR site
N.A.
N.A.
Province
China
Pearl river
12,783
Wetland Park (200ha)
N.A.
N.A.
Beilun river
1,083
National level nature reserve
N.A.
N.A.
Indonesia
Bakau Selat Dumai
60,000
Yes
Pulau Padang dan Tanjung
111,500 -
Pandan
Muara Sungai Guntung
26,000
Small part
Delta Banyuasin
200,000
Yes
Sembilang 387,500
Yes
-
-
Philippines
Malampaya Sound
24,500
Protected seascape
N.A.
N.A.
Pansipit River Estuary
15
N.A.
N.A.
Thailand
Pattani Bay
6,149
N.A.
N.A.
Ban Don Bay
49,459
N.A.
N.A.
Welu River Estuary
10,400
N.A.
N.A.
Thung Kha Bay-Savi Bay
5,204
National Park
N.A.
N.A.
Pak Phanang Bay
13,597
N.A.
N.A.
Viet Nam
Balat Estuary
26,397
National Park and National Nature Reserve
N.A. N.A.
Tien River Estuary
100,691
Than Phu Nature Reserve small part of the
N.A.
estuary
Dong Nai River Estuary
49,711
Can Gio Biosphere Reserve
N.A.
Van Uc Estuary
6,990
N.A.
N.A.
Bach Dang Estuary
80,358
N.A.
N.A.
Tien Yen Estuary
24,738
N.A.
N.A.
SUBTOTAL 1,203,871
692,184
38,097
328,511
[+137,500]
Peat Swamps
Cambodia
Prek Kampong bay in Kampot
16, 250
National Park
N.A.
N.A.
Province
Prek Kampong Som Shanoukeville
10, 800
National Park
N.A.
N.A.
Indonesia
Berbak
NP
162,700 yes
SM Terusan Dalam
74,750
yes
Way Kambas NP
130,000
yes
Sungai
Merang
150,000 yes
Thailand
Wetlands in Thale Noi Wildlife
45,700
Includes RAMSAR Site
N.A.
N.A.
Non-hunting Area
Phru To Daeng Wildlife Sanctuary
20,120
Wildlife Sanctuary; RAMSAR site
N.A.
N.A.
Wetlands in Thale Sap Wildlife
36,467 Non-hunting
Area
N.A.
Non-hunting Area
Phru Kan Tulee
140
N.A.
N.A.
SUBTOTAL 646,927
564,620
82,307
0
STRATEGIC ACTION PROGRAMME
Page 28
Table 15 cont.
Legal and Management Status of some Inter-tidal Mudflats, Estuaries, Coastal Lagoons
and Coastal Peat Swamps bordering the South China Sea.
Legal and Management Status
Name of site
Area (ha)
Protected Non-use
Sustainable use
Non-sustainable use
(Subsistence/commercial)
Non-peat Swamps
Cambodia
Kampong Trach in Krong Kep
7,500
National Park
N.A.
N.A.
Prek Toek Sap
21,259
National Park
N.A.
N.A.
Indonesia
Tulang Bawang
86,000
Partly
Rawa-rawa Kubu Padang Tikar
1,499,000
-
Thailand
Khao Sam Roi Yot National Park
9,808
National Park
N.A.
N.A.
SUBTOTAL 1,623,567
38,567
[86,000]
0
[1,499,000]
Lagoons
Cambodia
Beoung Ka Chang
4, 503
National Park & RAMSAR site
N.A.
N.A.
China
Wenchang
218
Provincial level nature reserve
N.A.
N.A.
Viet Nam
Tam Giang-Cau Lagoon
21,600
N.A.
N.A.
Tra O Lagoon
2,000
N.A.
N.A.
Degi Lagoon (Binh Dinh
1,600 N.A.
N.A.
Province)
Thi Nai lagoon (Binh Dinh
5,000 N.A.
N.A.
Province)
SUBTOTAL 34,921
4,721
0
30,200
Inter-tidal flats
Cambodia
Ruer Sey Srock Toul Srav
4,890 National
Park
N.A.
N.A.
Gnamin Krong Kep
China
Shantou
1,435
Municipal level nature reserve
N.A.
N.A.
Hepu
3,951
Municipal level nature reserve
N.A.
N.A.
Danzhou
806
Provincial level nature reverse
N.A.
N.A.
Indonesia
CA Pulau Burung
200
yes
Tanjung Datuk
25,000
-
Tanjung Jabung
3,000
yes
Paloh 176,548
yes
Muara Kendawangan
150,000
yes
CA Pulau Dua
30
yes
Pualu Rambut
46
yes
Muara Angke
25
yes
CA Muara Gembong
10,481
yes
Philippines
Balayan Bay Tidal flats
75,000
N.A.
N.A.
Manila Bay Tidal Flat
30,000
N.A.
N.A.
El Nido, Palawan mudflats
54,303
Protected Seascape
N.A.
N.A.
Thailand
Don Hoi Lot
2,409
RAMSAR Site
N.A.
N.A.
Wetlands in Mu Koh Chang
65,000 National
Park
N.A.
N.A.
National Park
Wetlands in Mu Koh Ang Thong
10,200 National Park and RAMSAR Site
N.A.
N.A.
National Park
Thung Kha Bay Savi Bay
5,204 National
Park
N.A.
N.A.
Viet Nam
Ca Mau Southwest Tidal Flat
60,711
National Park
N.A.
N.A.
Kim Son Tidal Flat
12,620
N.A.
N.A.
SUBTOTAL 691,859
487,323
161,712
37620
TOTAL 4,201,145
1,787,415
282,116
[2,032,831]
STRATEGIC ACTION PROGRAMME
Page 29
THREATS TO COASTAL WETLANDS
Population growth, and urbanisation of the coastal fringe, combined with rapid economic growth in this
region places tremendous pressure on coastal wetland ecosystems. Major threats to the coastal
wetlands bordering the South China Sea can be grouped as follows:
1. LOSS OF WETLAND AREAS THROUGH CONVERSION FOR:
· Agriculture
· Aquaculture
· Port and harbour development
· Human
settlement
· Tourist
development
· Urbanization
· Industrialization
2. DEGRADATION OF WETLAND ECOSYSTEMS AS A RESULT OF:
· Over-exploitation of living resources
· Use of inappropriate fishing techniques and gear
· Pollution
· Deforestation in upland area
· Invasive
species
· Global trends and natural episodic events such as sea level rise, typhoons and tsunami
Overall it has been estimated that around 30% of coastal wetlands are lost in Southeast
Asia each decade giving an approximate annual loss in value of 3% per annum.
GOAL AND TARGETS
The ultimate goal of the SAP for wetland management and use is to:
Promote the sustainable use of coastal wetland resources by developing integrated
management plans and enhancing conservation and restoration of coastal wetlands
bordering the South China Sea and the Gulf of Thailand, specifically lagoons, estuaries,
mudflats, peat swamps, and non-peat swamps.
The specific targets for wetland management are:
· By the year 2012, to set up or update management plans for at least three lagoons, nine
estuaries, five tidal flats, one peat swamp and one non-peat swamp in the South China
Sea (See Table 16).
· By the year 2012, to increase by at least 7 wetland areas, the number of sites or specified
wetland areas with protection status (i.e. non-hunting area, nature reserves, protected
areas, Ramsar Sites, etc).
· By the year 2017, to have a regional estuary monitoring scheme implemented in the
participating countries .18
Table 16
list of sites specified in the targets. N = no existing management plan; u = existing but
out-dated plans requiring amendment and up-dating.
Lagoons
Estuaries
Tidal mudflats
Peat swamp
Non-peat swamp
Cambodia Koh
Kapik-N
Pearl river-N;
Shantou-N;
China
Wenchang -N
Beilun river-U
Hepu-N; Zhanzhou-N
Indonesia
Sembilang
NP-U
Malampaya sound-
Philippines
Manila Bay-N
U; Pansipit-N
Thale Noi non
Khao Sam Roi Yot National
Thailand
hunting area U
Park-U
Tamgiang-Cauhai-N; Tien River Estuary;
Viet Nam19
Southwest Ca Mau-U
Thi Nai-N
Dong Nai-U; Balat-U
Total 3
9
5
1
1
18 UNEP, 2005. Reversing Environmental Degradation Trends in the South China Sea and Gulf of Thailand. Report of the
Fifth Meeting of the Regional Working Group on Wetlands. UNEP/GEF/SCS/ RWG-W.5/3.
19 Amendments provided by the Viet Nam Focal Point on 29th May following the 8th meeting of the RWG-W.
STRATEGIC ACTION PROGRAMME
Page 30
Table 17
Sustainable Management Indicator Matrix. [A baseline, mid-term and end of first phase
of SAP implementation assessment of these indicators is required to indicate whether or
not the targets have been met.]
Management Indicators
Ecological/Environmental Indicators
Socio-Economic Indicators
Estuaries:
FISHERIES (Estuaries, Inter-
MANAGEMENT CAPACITY
· Turbidity
tidal mudflats, lagoons,)
· Formal Management
· Water colour
· Catch per unit effort
framework
·
· Absence or presence of oil contamination
· Total
landing
Trained Man-power
·
(No./levels)
Catch
composition
·
Intertidal Mudflat:
·
Facilities and equipment
Income
·
· Mudflat
area
(ha)
·
Sustainable Financing
No people directly
· Abundance of cockle or clam
involved
· Abundance of shore bird
TOURISM
· Amount of litters
· Number of visitors
MANAGEMENT APPROACH
· Erosion/deposit
(progression/regression)
· Number
of
tourism
· Sectorial
operators
· Integrated
Coastal Lagoon:
· Income
· Community-based
· Water area (ha)
· No people directly
· Multiple-use
· Plants reflect salinity change such as Nipa sp.
involved
and Metroxylon sagu)
· Area of associated habitats (seagrass, mangroves)
Peat Swamp:
· Abundance of primary trees
FORESTRY (Peat Swamp &
MANAGEMENT TOOLS
·
Non Peat Swamp)
Freshwater supply (inundation mark)
· Zoning
·
· Volume of timber
Amount of litters
· Regulations and agreements
·
·
Income
Abundance of water birds
(e.g. seasonal closures,
·
No. people directly
licensing, and permits)
Non-peat Swamp:
involved
· Land and water area (ha)
· Turbidity
· Abundance of water birds
REGIONAL ACTIONS AND COSTING
The proposed regional activities are designed to promote sustainable management and use of the
wetland ecosystems are categorised into five main components; namely:
Component 1 Capacity development to enhance sustainable wetland management.
Component 2 Institutional arrangements and international collaboration.
Component 3 Participatory wetlands management and monitoring mechanism.
There are in total 22 actions proposed and these are grouped into three components each of which
contains specific objectives, and activities, while the approximate costs are presented in Table 18.
COMPONENT 1. CAPACITY DEVELOPMENT TO ENHANCE SUSTAINABLE WETLAND MANAGEMENT
The main objective of this component is to enhance and sustain the capacity of wetland management
agencies and strengthen knowledge and public awareness on the wise use of wetlands in the region.
This component is divided into two sub-components; the first of which focuses on the required regional
mechanisms for human resource development through a training programme including study tours
and field visits for wetland managers, community representatives, students, and NGO members. The
second sub-component encompasses the production and dissemination of materials for public
awareness, the development of an educational centre, the development of curricula, and the
production of national newsletters.
COMPONENT 2. INSTITUTIONAL ARRANGEMENTS AND INTERNATIONAL COLLABORATION
This component aims to improve the effectiveness of national policy, legal and institutional
arrangements and co-ordination. It is divided into two sub-components, the first of which involves the
maintenance and strengthening the Regional Working Group on Wetlands, as the regional scientific
and technical advisory body on coastal wetland management. The second sub-component focuses on
establishment of linkages among wetland management institutes or agencies in the region and on the
maintenance of linkages between and within the academic and professional communities.
STRATEGIC ACTION PROGRAMME
Page 31
COMPONENT 3. PARTICIPATORY WETLANDS MANAGEMENT AND MONITORING MECHANISM
The objective of this component is to maintain and update the regional Wetlands GIS database and
meta-database including scientific baseline data for wetland conservation and sustainable use.
Activities are grouped into two sub-components; the first of which involves developing regional
handbooks/manuals, and guidelines; maintaining regional GIS- and meta-databases, developing and
implementing the regional estuary monitoring scheme. The second sub-component involves the
convening of regional meetings among countries to review the status of wetland management plans,
develop manuals/handbooks for sustainable use including restoration of estuaries, coastal lagoons,
etc.
STRATEGIC ACTION PROGRAMME
Page 32
Table 18
Proposed Actions for Coastal Wetland Management and Conservation.
ESTIMATED COST (US$)
Components
Sub-components
Regional Activities
Years
Objectives
Basis for estimation
Total
2008 2009 2010 2011 2012
1. Capacity development 1.1 Human Resource 1.1.1 Training needs assessment (forms
2 times in 10 years x 50,000 first
to enhance sustainable
Development
of training, target audiences,
time of assessment 20,000 for the
50,000 0 0 0
20,000
70,000
wetland management.
places of training, timeframe,
updating of the assessment
existing course programme)
1.1.2 Biennial Training Course; may
include elements on basic ecology,
15/days per course; 3 people per
law enforcement, monitoring,
course from 7 countries. 75,000
0 75,000
0 75,000
0 150,000
To enhance and sustain
valuation, management and
US$ per course Total 150,000
the capacity of wetland
community participation.
management agencies
1.1.3 Regional inter-country training.
and strengthen knowledge
The programme may include study
1 study tour per year, 1 week
and public awareness on
tours, and field visit for wetland
duration 15 participants: S25,000US
25,000 25,000 25,000 25,000 25,000 125,000
wise use of wetland
managers, communities, students,
per year
management in the region
and NGOs
1 person/country/year, up to 2
1.1.4 Personnel exchange programme
months, 5 years ($5000 x 7 X 5=
35,000 35,000 35,000 35,000 35,000 175,000
175,000
1.2 Communication,
National Focal Points and National
education & public
Committees x 7 countries 25 days
1.2.1 Develop regional education and
awareness
In-Kind contribution (7x2 mtgs x
public awareness plan, based on
0 35,000
0
0
0
35,000
10,000 ) = 140,000: 1 regional
national needs assessment
meeting 16 people 8 days to finalise
plan
1.2.2 Edit, Translate, Publish and
disseminate the regional education
Editorial (15,000) and translation
and public awareness plan to
costs (5 x 15,000 US$), Publication
0 0
110,000 0 0
110,000
stakeholders in participating
7 X 3,000 US$ Total 110,000 US$
countries by CD and hardcopy
1.2.3 Develop curricula guidelines
(1 consultant x 3 months x 10,000)
(context, format, directed to
(translation in 7 local languages
0 58,000
0
0
0
58,000
different educational levels, and
x4,000) (made publicly available via
covering different type of wetlands)
the web)
1.2.4 Produce national newsletters to
National Focal Points and National
disseminate within countries in this
0 0 0 0 0
0
Committees x 7 countries
region.
STRATEGIC ACTION PROGRAMME
Page 33
Table 18 cont.
Proposed Actions for Coastal Wetland Management and Conservation.
ESTIMATED COST (US$)
Components
Sub-
Regional Activities
Years
Objectives
components
Basis for estimation
Total
2008 2009
2010 2011 2012
2. Institutional
2.1 Enhancing the
2.1.1 Review the implementation of the
2 meetings of National Focal Points
arrangements and
policy, legal and
NAPs at regional level and review
site managers, practitioners and
international
institutional
and update the existing framework
potential donors; 1 in year 1 the
60,000 0 0 0
60,000
120,000
collaboration
framework
of wetland policy and regulation in
second in year 5, 45 people 6 days
the region.
60,000 per time.
2.1.2 Maintain and strengthen the
To improve the
Regional Working Group on
effectiveness of national
Wetlands to provide policy,
Regional biennial meetings,
20,000
0
20,000 0 0
40,000
policy, legal and
scientific and technical advice on
20,000/meeting
institutional arrangement
coastal wetland management to
and coordination
the participating countries.
2.1.3 Undertake a regional review of
National Focal Points and National
current stakeholders' roles in
Committees x 7 countries 25 days
wetland management and
In-Kind contribution 1consultant x 2
20,000
0
0 0 0
20,000
conservation and Identify good
months x 10,000) = 20,000 Output
practices on community
to be reviewed in the regional
empowerment.
biennial meeting
2.1.4 Promote the replication of good
practices in community
($40,000 per activity x 7 countries) =
0
280,000
0 0 0
280,000
empowerment regionally through
280,000
pilot activities.
2.1.5 Compile and analyse traditional
knowledge and practices and to
(2 consultants x 3 months x 10,000)
0
60,000
0 0 0
60,000
evaluate their utility in the modern
= 60,000
context.
2.2 Promotion of
2.2.1 Organize international conference
international
on wetland management among
(2 conferences x 100,000) =
0 0
100,000 0
10,000
110,000
cooperation
countries in region and
200,000
international agency.
STRATEGIC ACTION PROGRAMME
Page 34
Table 18 cont.
Proposed Actions for Coastal Wetland Management and Conservation.
ESTIMATED COST (US$)
Components
Sub-
Regional Activities
Years
Objectives
components
Basis for estimation
Total
2008 2009 2010 2011 2012
3. Participatory wetlands 3.1 Develop , maintain 3.1.1 Develop a regional
management and
information system
handbook/manual for
(1 consultant X 4 months X 10,000)
monitoring
and disseminate
standardization of techniques for
+ (1 Mtg/country 4 days, 10,000 X 7)
mechanism
products
wetland resource assessment and
110,000 I regional meeting 35,000
0 0
110,000
30,000 0
140,000
the conduct of socio-economic
and publication costs (3,000 copies
surveys economic valuation studies at 10$/copy)
To maintain and update
and cultural assessments.
Regional Wetlands GIS
3.1.2 Develop guidelines on wetland
database and meta-
classification and mapping for
(1 consultants X 3 months X
database including
estuaries and mudflats area and
10,000) + ( 2 Mtgs. X 25,000)
35,000
45,000 0 0 0
80,000
scientific baseline for
develop a regional map of peat-
= 80,000
wetland conservation and
swamps, non-peat swamp and
sustainable use
coastal lagoons.
3.1.3 Regional Wetland data and
(1consultant x 2 weeks per year)
3,000 3,000 3,000 3,000 3,000 15,000
information compilation
= 15,000
(1 consultant x 6months x 8,000)
3.1.4 Develop guidelines for and
(1 regional expert meeting 25
implement a regional estuarine
0 0
48,000
35,000 0
83,000
participants 5 days coordination
monitoring scheme.
35,000)
3.2 Wetland
National Focal Points and National
3.2.1 Develop or update wetland
conservation and
Committees x 7 countries 25 days
management plans for the important
restoration
In-Kind contribution Plans to be
0 0 0 0 0 0
priority coastal wetland sites in the
reviewed regionally during meetings
region.
under 2.1.2
3.2.2 Establish criteria and guidelines for
1 consultant x 2 months x 10,000 I
zoning of wetland ecosystem use for
0 0
55,000 0 0
55,000
regional meeting 35,000
management and conservation.
National Focal Points and National
Committees x 7 countries 25 days
3.2.3 Conduct, pilot tests to elaborate the In-Kind contribution 1 research
criteria and indicators of sustainable
70,000 25,000
0
0
95,000
assistant per country 1 year
wetlands use.
(7 x 10,000) (1 regional mgt
x 25,000) = 120,000
3.2.4 Disseminate environmental friendly Via regional website, loaded by
methods and good practices in the
0 0 0 0 0 0
National Committee members
region.
TOTAL
COSTS 248,000 616,000 506,000 298,000 153,000 1,821,000
STRATEGIC ACTION PROGRAMME
Page 35
MANAGING FISH HABITAT AND FISH STOCKS IN THE SOUTH CHINA SEA2021
The South China Sea and Gulf of Thailand is a global centre of shallow water marine biological
diversity, supporting a significant world fishery of importance to the food security of, and as a source of
export income for, Southeast Asian countries. The fisheries sector is significant since unrefined
estimates of the value of capture production indicate that capture fisheries contribute more than 2.0
percent to total GDP in the majority of countries in the area. Since the majority of fisheries are small-
scale in nature, and land fish in a large number of decentralised landing places for distribution through
complex marketing networks at the community level, estimates of the value of capture fisheries
production are largely underestimates and do not adequately value the artisanal or subsistence part of
the sector.
Landings from the Gulf of Thailand and the South China Sea contribute to approximately 10 percent of
reported global fisheries production per annum. It is considered likely that increased inter-annual
variations in landings will be observed in the future as the fisheries of both areas become increasingly
dependent on small pelagic species. This results from "fishing down the food chain" that has occurred
in both areas. Demersal fisheries in the Gulf of Thailand and South China Sea are fully exploited with
evidence showing that the landings of many species are declining. Declining fish availability, coupled
with over-capacity and the dependence of coastal communities on small scale coastal fisheries for
income generation has led to the adoption of destructive fishing practices such as blast fishing to
maintain short-term incomes and food production. These trends suggest that production from capture
fisheries will wane in coming years unless fishing effort and related over-capacity, are reduced.
FISHERIES MANAGEMENT ISSUES
Fisheries management in the Gulf of Thailand and South China Sea must balance the interests of
multiple jurisdictions, coastal community dependence on fisheries for food security, in the face of
problems resulting from over-fishing, destructive fishing practices, incidental capture of endangered
species, and the inherently complex nature of the tropical multi-species fisheries. Most marine
fisheries in Southeast Asia are characterised by excess competition among fishers, and as such suffer
from the problems of over-capitalisation and over-exploitation. Despite this trend, the management of
the majority of fisheries conducted in the region continues to rely heavily on input control based
approaches.
This situation has provided the impetus for the development of innovative approaches to moderate the
tendency to over-exploit Southeast Asian fish resources. Significant efforts are being made throughout
the region to decentralise the responsibility for fisheries management with the aim of establishing co-
management approaches to fisheries. The notion of rights-based approaches to the management of
the region's small coastal fisheries is also gaining ascendancy. It is also well recognised that coral
reef, seagrass, mangrove, and wetland habitats contribute significantly to the productivity of coastal
fisheries, and act as refuges for the majority of fished species during critical phases of their lifecycles.
Fisheries management involving decentralisation and rights-based systems will need to incorporate
strategies that aim to foster the critical links between the life-cycles of important fish species and
coastal and marine habitats.
IMPROVING THE INTEGRATION OF FISHERIES AND HABITAT MANAGEMENT THE REGIONAL FISHERIES
REFUGIA INITIATIVE
Based on the recognition that coral reef, seagrass, mangrove, and wetland habitats help to sustain
coastal fisheries, and act as refuges for important species during many phases of their life-cycles, new
approaches to fisheries management will need to be supported by initiatives that aim to foster
improved management of critical fish life-cycle and habitat linkages. Such approaches should ensure
adequate cross sectorial consultation between fisheries and environment departments in the countries
bordering the South China Sea and Gulf of Thailand. This is particularly important in relation to the
designation of Marine Protected Areas and Fisheries Management Areas in order to ensure that areas
designated for protection by environment ministries are, whenever possible congruent with critically
important areas for fish stocks.
20 China did not participate in the activities of this component consequently did not provide or review data in this section.
21 Malaysia did not participate initially in the activities of this component but was involved in the review of species of
transboundary importance and future proposed actions in developing the regional refugia system.
STRATEGIC ACTION PROGRAMME
Page 36
In order to develop a mechanism to facilitate this, the Regional Working Group on Fisheries (RWG-F)
has been and is collaborating with the Southeast Asian Fisheries Development Center (SEAFDEC) to:
· Establish a system of fisheries refugia in the South China Sea and Gulf of Thailand that
focuses on the critical links between fish stocks and their habitats.
INFORMATION BOX 1
The RWG-F Definition of Fisheries Refugia
Fisheries refugia in the context of the UNEP/GEF South China Sea Project are defined as:
"Spatially and geographically defined, marine or coastal areas in which specific management measures
are applied to sustain important species [fisheries resources] during critical stages of their life cycle, for
their sustainable use."
Fisheries refugia should:
NOT be "no take zones",
Have the objective of sustainable use for the benefit of present and future generations,
Provide for some areas within refugia to be permanently closed due to their critical importance [essential
contribution] to the life cycle of a species or group of species,
Focus on areas of critical importance in the life cycle of fished species, including spawning, and nursery grounds,
or areas of habitat required for the maintenance of broodstock,
Have different characteristics according to their purposes and the species or species groups for which they are
established and within which different management measures will apply,
Have management plans.
Management measures that may be applied within fisheries refugia may be drawn from the following [non-
exhaustive] list:
Exclusion of a fishing method (e.g. light luring, purse seine fishing),
Restricted gears (e.g. mesh size),
Prohibited gears (e.g. push nets, demersal trawls),
Vessel size/engine capacity,
Seasonal closures during critical periods,
Seasonal restrictions (e.g. use of specific gear that may trap larvae),
Limited access and use of rights-based approaches in small-scale fisheries.
The regional fisheries refugia initiative addresses the present problems by drawing on fisheries
management concepts that are easily understood at the fishing community level, and emphasising
sustainable use rather than prohibition. It focuses on building fishing community support for spatial
planning approaches to coastal and marine resource management. This activity has been recognised
by regional and International fisheries organisations as a unique regional fisheries initiative in that it
represents one of the first attempts to develop integrated fisheries and environmental management for
regional benefit.
FISHERIES REFUGIA A UNIQUE RESPONSE TO THE OVER-EXPLOITATION OF FISHERIES
The effective management of fisheries and their habitats in the South China Sea and Gulf of Thailand
requires an institutional setting in which collaboration and partnership is fostered and encouraged. For
the fisheries sector this requires the establishment of workable mechanisms to effect the integration of
fisheries issues into broader initiatives for marine resource and environmental management. Such
mechanisms should be aimed at:
· Improving the understanding amongst stakeholders, including inter alia fisher folk, scientists,
policy-makers, and fisheries managers, of ecosystem and fishery linkages, as a basis for
integrated fisheries and habitat management; and
· Building the capacity of fisheries ministries and departments to engage in meaningful dialogue
with the environment sector regarding how multiple marine use planning (in whatever form)
can best contribute to improving the state of fisheries in areas of the South China Sea and the
Gulf of Thailand.
STRATEGIC ACTION PROGRAMME
Page 37
In order to provide regional policy support to this activity, regional guidelines on the use of fisheries
refugia for capture fisheries management in Southeast Asia were prepared by the RWG-F, and
subsequently published as part of the ASEAN-SEAFDEC Regional Guidelines for Responsible Fisheries
in Southeast Asia22. Specific resource and institutional objectives for a regional system of fisheries
refugia have been elaborated by the RWG-F (Tables 19 and 20).
Table 19
A Preliminary Set of Performance Assessment Criteria and Means of Verification for the
Resource-related Objectives of a Regional Fisheries Refugia Plans.
Resource-Related Objectives
Performance Assessment Criteria
Means of Verification
Longer-Term Objectives
Biomass trend (multi-year average
Results of abundance surveys employing
1. Biomass of commercially important
annual percentage rate of change)
relative abundance (CPUE), swept area,
fish (pelagic and demersal) and
acoustic, or egg production methods
invertebrate species in the Gulf of
Thailand and South China Sea
maintained
2. Average size of commercially
Average fish size relative to historical
Results of size-frequency analyses of
important fish (pelagic and demersal) average
fish landed at key landing places and in
and invertebrate species caught in
markets
the Gulf of Thailand and South China
Sea maintained or increasing
3. Egg production of commercially
Abundance of eggs and larvae of
Results of surveys of egg and larval fish
important fish and invertebrate
commercially important species in key
density in key spawning areas
species in the Gulf of Thailand and
spawning areas relative to historical
South China Sea maintained or
average
increasing
4. Recruitment of commercially
Year class strength relative to historical
Results of abundance surveys employing
important fish and invertebrate
average
relative abundance (CPUE) or swept
species to fisheries the Gulf of
area methods
Thailand and South China Sea
maintained or increasing
Shorter-Term Objectives
Abundance of juveniles in fishery refugia
a) Results of fishery dependent and
1. Reduced capture of juveniles and
areas
independent surveys
pre-recruits of commercially
a) Fishing effort dynamics in fishery
b) Interviews of fishers, fishing
important fish (pelagic and
refugia areas
communities, and traders
demersal) and invertebrate species, b) Selectivity of fishing operations
c) Results of studies of species and size
as well as endangered species, in
conducted within juvenile refugia
composition conducted within refugia
critical fisheries habitats of the Gulf
c) Frequency of inappropriate fishing
d) Observations/reports of illegal or
of Thailand and South China Sea
operations in fishery refugia areas
destructive fishing in fishery refugia
d) Volume and size composition of
areas
commercially important fish (pelagic
e) Results of studies of the volume and
and demersal) and invertebrate
size of fish landed at main landing
species landed and traded in main
places and traded in main market
markets
2. Reduced targeting and capture of
a) Fishing effort dynamics in fishery
a) Interviews of fishers, fishing
commercially important fish (pelagic
refugia areas
communities, and traders
and demersal) and invertebrate
b) Selectivity of fishing operations
b) Results of studies of species and size
species in spawning condition, and
conducted within spawning refugia
composition of landings during known
when forming spawning
c) Gonosomatic index (GSI) of
spawning seasons
aggregations, in the Gulf of
commercially important fish (pelagic
c) Results of studies of the gonosomatic
Thailand and South China Sea
and demersal) and invertebrate
condition of commercially important
species landed and traded in main
species landed and traded in main
markets
markets
d) Abundance of eggs and larvae of
d) Results of surveys of egg and larval
commercially important species in key
fish density in key spawning areas
spawning areas
3. System of fisheries refugia, including Total number/size of juvenile refugia and
The number and size of fisheries refugia
both juvenile and spawning refugia, spawning refugia:
as defined in refugia management plans
which provides for:
a) Number of species for which a
adopted by national governments
a) networks of fisheries refugia
network of fisheries refugia has been
a) Description of the species specific
across the geographical ranges
developed across its geographical
linkages between refugia in
of individual species,
range
management plans for each refugia in
b) networks of fisheries refugia that
b) Number of fisheries refugia networks
a geographical range based network
include both juvenile and
that include multiple refugia types
b) Description of the life-cycle specific
spawning refugia,
c) Number of fisheries refugia for which
linkages between refugia in
c) fisheries management consistent
management systems have been
management plans for each refugia in
with the RGRFSEA
developed
a life-cycle based network
c) Adoption of refugia management plans
22 SEAFDEC, 2006. Supplementary Guidelines on Co-management using Group User Rights, Fisheries Statistics, Indicators
and Fisheries Refugia. Southeast Asian Fisheries Development Center, Bangkok, Thailand. 84pp.
STRATEGIC ACTION PROGRAMME
Page 38
Table 20
A Preliminary Set of Performance Assessment Criteria and Means of Verification for the
Institutional-related Objectives of a Regional System of Fisheries Refugia.
Institutional-Related Objectives
Performance Assessment Criteria
Means of Verification
1. Integration of fish life-cycle
Preparation and publication of a
Adoption by appropriate regional fora of
considerations in fisheries and habitat management plan for a regional system
a management plan for a regional
management in the Gulf of Thailand
of fisheries refugia.
system of fisheries refugia. Management
and South China Sea
plan to include:
a) goals, objectives, target reference
points, indicators, and performance
measures for each refugia (and
refugia network in the system)
b) system for reporting on results of
analysis of data collected in support of
the regional refugia system
c) criteria for the identification of new
refugia
d) research priorities and national
commitments of support to the conduct
of fisheries research
2. National level commitments to
Preparation and publication of National
Adoption of plans of action by
integrate the fisheries refugia concept
Plans of Action for the Development of
appropriate Government Ministries.
into fisheries and habitat
the Regional System of Fisheries
management
Refugia
3. Regionally agreed fisheries refugia
Preparation and publication of a
Adoption of the programme at a regional
science programme, which details:
fisheries refugia science programme
expert consultation and then
a) Objectives
representatives of five SEAFDEC
b) Decision-support inputs
member countries
c) Strategic research
partnerships/resourcing
d) Research activities
4. Regionally agreed framework of
Preparation of a framework of criteria,
Adoption of the framework at a regional
criteria, target reference points,
target reference points, indicators, and
expert consultation
indicators, and performance
performance measures for identifying
measures for identifying and
and evaluating the performance of
evaluating the performance of
fisheries refugia
refugia that, aim to:
a) reduce the capture of juveniles
and pre-recruits of commercially
important fish, and endangered
species, in critical fisheries
habitats
b) reduce the targeting and capture
of commercially important fish in
spawning condition, and when
forming spawning aggregations
c) contribute to the development of
species-specific networks of
refugia across (i) the geographical
range, and (ii) the life-cycle, of
individual species.
5. Regional agreement on
Preparation and publication of standards
Adoption by appropriate
standardised methodology for the
for refugia identification and evaluation
intergovernmental fora of regional
identification and evaluation of
methods relating to data collection and
standards
important:
storage, and analysis
a) juvenile refugia
b) spawning refugia, and
c) refugia that can assist in building
geographical range and life-cycle
based networks of refugia
6. Regionally agreed guidelines on the
Regional agreement on guidelines for
Adoption by appropriate
use of the fisheries refugia concept
the use of the fisheries refugia concept
intergovernmental fora of regional
in fisheries management.
guidelines
This initiative is considered important regionally because of the potential fisheries benefits associated
with effective fisheries and habitat management at the local level. It is likely that the role of such
approaches to fisheries management will become more important in the region, especially in the light
of the continuing importance of fisheries to food security, nutritional security, and maintenance of
livelihoods. Such approaches may also assist in curbing the effects of trends in regional fisheries
relating to over-capacity and over-exploitation, the use of destructive fishing gear and practices,
habitat destruction and pollution, and illegal fishing.
STRATEGIC ACTION PROGRAMME
Page 39
OBJECTIVES, TARGETS, REGIONAL ACTIONS AND COST ESTIMATES
The general longer-term objectives of this component of the SAP are to:
· Build the resilience of Southeast Asian fisheries to the effects of high and increasing levels of
fishing effort,
· Improve the understanding amongst stakeholders, including fisher folk, scientists, policy-
makers, and fisheries managers, of ecosystem and fishery linkages, as a basis for integrated
fisheries and ecosystem/habitat management,
· Build the capacity of fisheries departments/ministries to engage in meaningful dialogue with
the environment sector regarding the improvement of fisheries and management of
interactions between fisheries and critical marine habitats.
The specific targets identified for the fisheries component of the Strategic Action Programme are:
· By 2012 to have established a regional system of a minimum of twenty refugia for the
management of priority, transboundary, fish stocks and endangered species;
· By 2012 to have prepared and implemented fisheries management systems in the identified
refugia based on, and consistent with, the ASEAN SEAFDEC Regional Guidelines for
Responsible Fisheries in Southeast Asia.
More specifically the planned activities are expected to achieve the following outcomes in addition to
the targets specified above:
· Improved integration of habitat and biodiversity conservation considerations in the
management of fisheries in the South China Sea and Gulf of Thailand;
· Improved national management of the effects of fishing on critical habitats within fisheries
refugia; and,
· Enhanced uptake of good practices in integrating fisheries management and biodiversity
conservation in the design and implementation of regional and national fisheries
management systems, and marine protected areas.
To date 46 known critical spawning and nursery areas for important fisheries species have been
identified in the Gulf of Thailand and the South China Sea. Fourteen of these areas have been
selected for inclusion in an initial regional system of fisheries refugia, and an additional nine sites have
been identified as tentative fisheries refugia sites. Developing a regional and national level system of
refugia requires actions at both national and regional level.
The planned regional activities are outlined in Table 21 however it must be recognised that without
supporting national investments the regional activities will not be sufficient to meet the targets
specified. National level activities will include, but not be limited to the following:
·
Evaluate the effectiveness of fisheries management systems.
· Evaluate the status and trends of fisheries resources in relation to catch efforts and
availability of resources in defined areas.
· Reduce the use of fishing gear and practices that damage ecologically sensitive areas with
the long term aim of removing and replacing them with more environmentally acceptable
fishing gear and practices.
·
Review compliance with international and regional fisheries agreements and guidelines.
· Promote the application of the Regional Guidelines for Responsible Fisheries in Southeast
Asia through workshops, awareness building, translation into national languages and
education of people.
·
Develop educational and public awareness materials on sustainable fishery practices.
· Implement programmes to provide information on sustainable fishery practices among small
and artisanal fishing communities, and commercial fisheries operators as appropriate.
·
Train technical fisheries staff in the identification of fish eggs and larvae.
·
Design and establish a programme for identifying important spawning and nursery areas.
· Establish
refugia in areas identified as critical habitats for the life cycle of fisheries resources.
· Establish
in
selected
refugia sound management systems, which can be tested to determine
if they are leading to sustainable exploitation of resources and reduction of conflicts between
groups of fishermen.
STRATEGIC ACTION PROGRAMME
Page 40
Table 21
Proposed Regional Actions for the Fisheries Component of the Regional Strategic Action Programme.
Sub-
ESTIMATED COST (US$)
Components
Regional Activities
Components
Basis for estimated Costs
2008
2009
2010
2011
2012
TOTAL
1. Development of
1.1 Identification of 1.1.1 Develop criteria for identifying and
a Regional
Fisheries and
delineating the boundaries of critical habitat
(1 person month x 9,000) +
Network of
Critical Habitat
areas that act as fisheries refugia for
(2 regional meetings x 15,000) =
39,000
39,000
Fisheries
Linkages in the
regionally important fish stocks, particularly
39,000
Refugia Sites
South China
those of transboundary importance
Sea and Gulf
1.1.2 Compile National information on the
(2 person months x 9,000) +
of Thailand
boundaries of the 14 sites selected for
(25 x information collection x 3,000)
inclusion in the regional system of fisheries
96,000
96,000
+ (6 NFP co-ordinating x 3,000) =
refugia, and additional 9 sites identified as
96,000
tentative refugia
1.1.3 Compile a regional GIS database of
(3 person months x 9,000) +
national information on known fishing
(1st regional meeting x 10,000) +
grounds, spawning and nursery areas for
(2nd regional meeting x 15,000) +
37,000 15,000 9,000 9,000 9,000 79,000
fishery species of transboundary
(1 person month x 3 years
importance
(2010-2012) x 9,000 = 79,000
1.1.4 Establish a database for the regional
(6 person months x 9,000) +
compilation of National fish egg and larvae
(2 * regional meetings x 15,000) =
24,000 18,000 33,000 9,000
84,000
data generated from samples collected
54,000
during SEAFDEC research cruises
1.1.5 Compile maps of fish egg and larvae
distribution/abundance using data
(6 person months x 9,000) = 54,000
9,000
18,000
18,000
9,000
54,000
generated from samples collected during
SEAFDEC research cruises
(6 person months x 9,000 (2008)) +
1.1.6 Compile regional GIS maps from National
(1 regional mtg. x 15,000 (2008)) +
level information on the distribution of
(3 person months x 9,000 (2010)) +
coastal habitats, and locations of marine
(1 regional mtg. x 15,000 (2010) +
69,000
42,000
24,000
135,000
protected areas and fisheries management
(1 person month x 9,000 (2012)) +
zones
(1 regional mtg. * 15,000 (2011)) =
135,000
1.1.7 Develop a modelling system that links
known sources and sinks of fish larvae to
ocean circulation patterns and
(3 person months x 9,000) = 27,000
27,000
27,000
nutrient/chlorophyll concentrations in the
South China Sea and Gulf of Thailand
1.1.8 Convene annual technical meetings to (a)
review regional findings and national
designations of refugia, and to (b) make
(5 meetings x 20,000) = 100,000
20,000
20,000
20,000
20,000
20,000
100,000
recommendations regarding the adoption
of national refugia as components of the
regional system of fisheries refugia
STRATEGIC ACTION PROGRAMME
Page 41
Table 21 cont.
Proposed Regional Actions for the Fisheries Component of the Regional Strategic Action Programme.
Sub-
ESTIMATED COST (US$)
Components
Regional Activities
Components
Basis for estimated Costs
2008
2009
2010
2011
2012
TOTAL
1. Cont.
1.2 Improving the
(2 person months x 9,000 (2009)) +
1.2.1 Identify in conjunction with SEAFDEC
Development
Management of
(1 regional meeting x 15,000 (2009))
fisheries refugia that require bilateral,
of a Regional
Critical Habitats
+ (1 person month x 9,000 (2010) +
33,000 24,000
57,000
multilateral, and regional management
Network of
for Fish Stocks of
(1 regional meeting x 15,000 (2010))
collaboration
Fisheries
Transboundary
= 57,000
Refugia Sites
Significance
(3 person months x 9,000 x 3 years
1.2.2 Support and guide National Fisheries
(2008-2011) + (6 NFP co-ordinating x
Departments in establishing coastal
5,000/yr (2009-2010)) + (3 regional
27,000 72,000 72,000 42,000
213,000
fisheries management systems in priority
meetings x 15,000 (2009-11) +
fisheries refugia
(National Co-ordination costs) =
213,000 + NC
1.2.3 Select 2 refugia in each country to trial
the use of rights-based and co-
(2 pilot activities x 6 countries x
180,000 180,000 180,000 180,000 720,000
management approaches to fisheries
60,000/activity) = 720,000
refugia management
1.2.4 Select 1 refugia in each country in which
to identify and trial the use of fishing gear
(1 pilot activities x 6 countries x
and practices that reduce the capture of
120,000 120,000 120,000 360,000
60,000/activity) = 360,000
(a) juveniles and pre-recruits, and (b) fish
in spawning condition
1.2.5 Select 1 site in each country in which to
identify and trial approaches to reducing
(1 pilot activities x 6 countries x
120,000 120,000 120,000 360,000
the effects of trawl/push net fishing on
60,000/activity) = 360,000
seagrass communities
1.2.6 Develop national plans for improved
(1 plan per country x 30,000/plan
management of the effects of fishing on
(including publication and national
60,000 60,000 60,000 180,000
critical habitats within fisheries refugia
consultations) = 180,000
Sub-Total
312,000
347,000
698,000
605,000
542,000 2,504,000
STRATEGIC ACTION PROGRAMME
Page 42
Table 21 cont.
Proposed Regional Actions for the Fisheries Component of the Regional Strategic Action Programme.
ESTIMATED COST (US$)
Components
Sub-
Regional Activities
Components
Basis for estimated Costs
2008
2009
2010
2011
2012
TOTAL
2. Establishing
2.1 Developing
(5 x regional training workshops
Training and
Human
2.1.1 Organise annual regional training workshops on
(21 participants) on the management
45,000 45,000 45,000 45,000 45,000 225,000
Public
Resource
fisheries refugia management
of fisheries refugia x 45,000) =
Awareness
Capacity for the
225,000
Programmes
Identification
for a Regional
and
(5 x regional training workshops
2.1.2 Organise annual regional training workshops on
System of
Management of
(21 participants) on fish egg and
larval fish identification and fish early life history
50,000 50,000 50,000 50,000 50,000 250,000
Fisheries
Fisheries
larvae identification x 50,000) =
science
Refugia
Refugia
250,000
2.2 Improving
(2 person months x 2 yrs
Information
(2010&2011) x 9,000) +
2.2.1 Establish in conjunction with SEAFDEC an
Management
(2 x regional meetings (2010&1011)
Information and Education Campaign (IEC) for
and
x 15,000) + (preparation and
33,000
69,000
102,000
small-scale fishing communities on the critical
Dissemination
publication of local language IEC
links between fish stocks and their habitats
material * 6 countries * 6000 (2011))
= 102,000
(2 person months (2010&2011) x
2.2.2 Generate English language guidelines for
9,000) + (2 x regional meetings
translation into local languages on how to
(2010&1011) x 15,000) +
33,000
39,000
72,000
empower communities to enforce agreed
edition/publication of English
management rules in fisheries refugia
language guidelines * 6,000
102,000
(4 person months x 9,000) +
2.2.3 Develop indicators to monitor the effectiveness of (2 x regional meetings (2009&2010)
coastal fisheries management systems
33,000
69,000
102,000
x 15,000) + (1 case study x
established in priority fisheries refugia
6 countries x 6000) = 102,000
2.2.4 Establish in conjunction with SEAFDEC a regional (4 person months x 9,000) +
programme for the compilation of standardized
(2 x regional meetings (2009&2010)
33,000
33,000
66,000
fisheries statistics in support of the identification
x 15,000) = 66,000
and management of fisheries refugia
2.2.5 Develop the online Fisheries Refugia Information
Portal <http://refugia.unepscs.org> as (a) a tool for
enhancing regional communication and the
sharing of information regarding the development
(2 person months x 9,000 x 5 years)
of the regional refugia system, and (b) a regional
+ (website hosting and back-up x
19,000 19,000 19,000 19,000 19,000 90,000
online education and public awareness centre for
1,000/yr) = 90,000
the compilation and dissemination of information
regarding the effects of fishing on coastal habitats
and biodiversity
Sub-Total
114,000
114,000
246,000
324,000
114,000
907,000
STRATEGIC ACTION PROGRAMME
Page 43
Table 21 cont.
Proposed Regional Actions for the Fisheries Component of the Regional Strategic Action Programme.
ESTIMATED COST (US$)
Components
Sub-
Regional Activities
Components
Basis for estimated Costs
2008
2009
2010
2011
2012
TOTAL
3. Development
3.1 Promotion of
3.1.1 Promote in appropriate regional fora
(Representation in 5 regional
of Regional
Regional
and media the role of the regional
meetings/year x
Activities to
Fisheries
system of fisheries refugia in
2000/meeting x 5 years) +
Assist in the
Management
harmonizing fisheries and
14,000 14,000 14,000 14,000 14,000 90,000
(Preparation of 4 popular
Management of
Arrangements
environmental management in order to
articles/year x 1000 x
Fisheries
achieve sustainable fisheries in the
5 years) = 90,000
Refugia at the
South China Sea and Gulf of Thailand
National Level
3.1.2 Establish in conjunction with SEAFDEC
(2 person months x 9,000
a regional collaborative network of
(2008)) + (1 regional meeting
experts to guide the scientific, policy,
x 30,000 (2008)) + (2 person
48,000 48,000 15,000 15,000 15,000 141,000
and legal arrangements for the
months x 9,000 (2009) +
management of fisheries refugia in
(3 regional meeting x 15,000
National waters
(2009-2012)) = 141,000
3.1.3 Plan and establish in conjunction with
SEAFDEC joint fisheries management
(4 person months x 9,000) +
frameworks between and among
(3 x regional meetings
countries which share the use of critical
(2009-2011) x 30,000) +
48,000
78,000
60,000
186,000
habitat areas for fish stocks of
(6 case studies x 10,000) =
transboundary importance and rare and
186,000
endangered species
3.2 Generation and
(2 person months
Uptake of Good
(2010&2011) x 9,000) +
3.2.1 Generate English language guidelines
Coastal
(2 x regional meetings
on managing the effects of fishing on
Fisheries
(2010&1011) x 15,000) +
33,000
39,000
72,000
coastal habitats and biodiversity for
Management
edition/publication of English
translation into local languages
Practices at the
language guidelines * 6,000
National Level
102,000
3.2.2 Develop in conjunction with SEAFDEC
cost estimates for a programme of
(6 person months x 9,000) +
action for future improvements to the
(3 x regional meetings
38,000
38,000
38,000
122,000
management of the effects of fishing on
(2009-2011) x 20,000) =
critical habitats within fisheries refugia
122,000
and on biodiversity (2013-2017)
Sub-Total
62,000
62,000
148,000
184,000
127,000
611,000
TOTAL 488,000 523,000 1,092,000 1,113,000 783,000 4,022,000
STRATEGIC ACTION PROGRAMME
Page 44

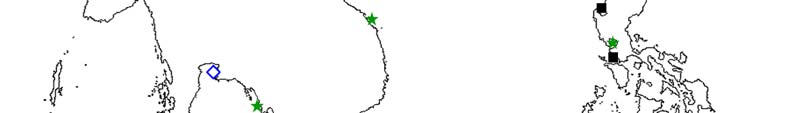
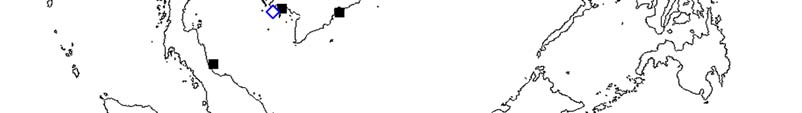


STRATEGIC ACTION PROGRAMME
Page 45
REGIONAL ACTIONS TO SUPPORT MANAGEMENT OF LAND-BASED POLLUTION LOADINGS
IN THE SOUTH CHINA SEA MARINE BASIN
The ultimate causes of land-based pollution in the South China Sea include increases in coastal
population density, increased food production in the agricultural sector, and increasing
industrialisation. The proximate causes include inadequate waste-water treatment whilst intermediate
causes include inadequate standards and lack of capacity to monitor, regulate and control pollution
discharge. A major contributing factor is the lack of financial resources to invest in actions addressing
the causes at all levels. In analysing national information it was apparent that sources of waste ranked
as follows: domestic, agricultural, industrial, poor land-use practices, and urban solid waste.
Excessive nutrient loads and suspended solids are among the most common problems in coastal
waters of countries bordering the South China Sea. High concentrations of suspended solids largely
result from poor land-use practices, including logging activities and conversion of forests in upland
areas. On the other hand, high nutrient loads mainly result from untreated domestic wastes that are
directly discharged into the receiving water bodies. Both contaminants impact the ecological
functioning of coastal ecosystems. In addition, heavy metals such mercury (Hg), Arsenic (As) and
lead (Pb) have tended to increase in both biota and sediments in coastal waters of the South China
Sea during the last decade. These heavy metals have potential negative impact on the health of
marine living resources and human who consume seafood products.
A total of 17 pollution hot spots were characterised using the ranking system agreed at the 2nd
Meeting of the Regional Working Group (Figure 1). Present pollutant and contaminant discharges
may have transboundary consequences in some of the identified "hot spots" and sensitive areas in
terms of increasing the rate of habitat degradation in those coastal ecosystems.
Figure 1
Pollution hotspots in the South China Sea characterised and ranked on the basis
of a combination of ASEAN and China contaminant criteria adopted for the
purpose in the project.
The contents of the National Action Plans indicate that the main contaminants include nutrients,
suspended solids, and heavy metals in sediments and biota, derived from sewage, agricultural runoff,
shrimp farming and industrial sources resulting in impacts such as eutrophication, sedimentation,
living resource and ecosystem degradation and potential impacts on human health and food quality of
export products.
STRATEGIC ACTION PROGRAMME
Page 46
CURRENT MANAGEMENT OF LAND-BASED POLLUTION AND CHALLENGES TO FUTURE MANAGEMENT
Most countries have environmental laws or acts under which environmental standards are in place
with mechanisms for approved enforcement procedures to ensure compliance. In order to meet with
standards and regulations stipulated under the law, structural facilities like waste water treatment
plants are one way to treat waste water before discharging it to the environment. In addition to
enforcement of existing laws and regulations only and building treatment facilities, environment
planning, a part of the development process may prevent and mitigate potential impacts. In line with
this, most countries in the region have Environmental Impact Assessment (EIA) prior to development.
Countries are also working on environmental awareness, communication and education to enhance
public understanding of pollution problem and practices at the individual level that may reduce
contaminant loads to the environment. In addition, monitoring of pollution sites and water quality is
currently undertaken by all countries while some countries include monitoring programmes for
sediment quality and bio-parameters as well.
Although these management practices are in place in most countries, there are many problems in
their implementation. Some countries lack the capacity to enforce the Environmental Acts due to
limited budgets and lack of collaboration with waste producers. The waste producers, are not
equipped with the necessary treatment facilities or have limited facilities resulting in low levels of
compliance with regard to the standards stipulated under the law. Although environment assessment
is incorporated into development planning in most countries, the effectiveness of the plans is
questionable. Monitoring programmes for some countries although extensive as regards the number
of sites, and the data collected, are not used effectively in pollution management. The data is often
only used for the publication and dissemination of annual and environment quality reports. In some
countries, the data obtained from the monitoring programmes are not reliable for decision making.
The following regional challenges were identified from the available National Action Plans and
discussions of the Regional Working Group:
· High population pressure and industrialization causing increased contaminant load;
· Lack of treatment facilities;
· Lack of cooperation and coordination among related sectors at the national level and weak
linkage between central and lower levels of the governments;
· Lack of appropriate legislation and weak law enforcement;
· Low public awareness and lack of (responsible) committed of citizens;
· Lack of government commitment in balancing economic growth and environmental protection
and low priority given to environment protection;
· Lack of research and monitoring resources (man power, facilities);
· Lack of regionally comparable monitoring and analytical methodology; and
· Lack of criteria for sediment quality.
GOAL AND TARGETS
The main goal of the land-based pollution component is to foster regional co-operation in the
identification of sensitive ecosystems, land-based contamination problems, evaluation of their
significance and development of standards for national level adoption within a regional context in
order to develop an appropriate precautionary approach to discharges to the South China Sea marine
basin. The targets for the land-based pollution component are to set and periodically review region-
wide water quality standards and water quality objectives which will assist in maintaining health of the
coastal ecosystems. The specific targets for Land-based Pollution management are:
1. By the year 2012, estimate total contaminant loading to the South China Sea.
2. By the year 2012, agree and adopt regional criteria for contaminants in sediment and biota.
3. By the year 2012, characterise and prioritise all hot spots surrounding the South China Sea.
4. By the year 2012, review and prepare recommendations for application in amending
national/provincial, legislation/regulations in support of all Land-based Pollution targets of the
SAP.
5. By the year 2017, to meet ASEAN seawater quality (14 parameters) criteria (except pollutants
from scientifically identified natural sources, if any) for:
- 90% of monitoring stations in the 17 hot spots characterised by the RWG-LbP between
2002 2004;
STRATEGIC ACTION PROGRAMME
Page 47
- 80% of other monitoring stations (more than 400 at present) in coastal waters of the South
China Sea.
The present monitoring stations and pollution hot spots in the participating countries, and potential
targets to be included in the SAP are presented in Table 22.
Table 22
Monitoring Stations and Pollution Hot Spots in the Participating Countries, and Potential
Targets to be Included in the SAP.
Cambodia China Indonesia
Malaysia
Philippines Thailand Viet
Nam
Monitoring stations
PRESENT
9
Water 8
102
100
128
170 22
(Manila Bay)
15
Sediment 3
>9
n/a
n/a
50 22
(Manila Bay)
Biota
No routine
3
n/a n/a 3 15
(fish/shellfish)
22
monitoring
Hot Spots
3 3 3
n/a 3
2
3
TARGETS
2012
Total contaminant loads
All countries
to SCS be estimated
Criteria for contaminants
in sediment and biota be
All countries
adopted in the region
All hot spots in SCS Sea
be characterised and
All countries
prioritised
National legislation in
support of targets be
All countries
reviewed and amended
TARGETS
2017
90% of hot spots meet
3 3 3
n/a 3
2
3
water quality criteria
80% of water monitoring
stns meet water quality
6 80 80
104 7
136 17
criteria
n/a = not available.
REGIONAL ACTIONS AND COST ESTIMATES
The proposed regional activities to promote sustainable management of Land-based Pollution are
categorised into three main components and together with the cost estimates are presented in Table
23.
COMPONENT 1. BUILDING CAPACITY TO ENSURE SUSTAINABLE USE OF COASTAL WATERS
Activities under the component are arranged in two sub-components and are designed to improve
mechanisms for information exchange and support the development, improvement and dissemination
of regional public awareness and educational materials.
COMPONENT 2. ENHANCE POLLUTION CONTROL AND MANAGEMENT
This component focuses on preparation of marine environment quality guidelines and tools for
dissemination and adoption in the region; and the development of common methodologies that will
generate comparable data among participating countries.
COMPONENT 3. INSTITUTIONAL ARRANGEMENTS AND COORDINATION
The purpose of activities under this component is to support integration of regional science with policy
making in the management of Land-based Pollution and to enhance international and regional
cooperation.
STRATEGIC ACTION PROGRAMME
Page 48
Table 23
Proposed Regional Actions and cost estimates in support of the management of Land-based Pollution.
Cost Estimation (USD)
Components, Sub-component and Actions
Description
2008 2009 2010 2011 2012 Total
Component 1 - Building Capacity to Ensure Sustainable Use of Coastal Waters
Sub-component 1.1 Mechanisms for information exchange
1.1.1 Conduct
workshop/conferences
to review and to transfer clean
2 workshops, 3 days * 21pers.; Consultancy, 1 pers. * 1 month * 2times:
31,680
31,680
63,360
technologies for cost-effective waste management in the region Printing and distribution, 210 copies, 2 times
1.1.2 Conduct workshops for exchange and adoption of existing
2 workshops, 3 days*21pers.,; Consultancy, 1 pers. * 1 month * 2times,
successful management models developed by the countries
31,680
31,680
63,360
Printing and distribution, 210 copies, 2 times
bordering the South China Sea
1.1.3 Conduct regional workshops to share experiences and
1 workshop, 3 days * 35 pers.; Consultancy, 1 pers. * 1 month
41,550
41,550
technologies in establishing integrated waste treatment facilities
1.1.4 Organise
seminar/workshops
for sharing experiences in law
enforcement and cross-cutting issues related to land-based
1 workshop, 3days * 35pers.; Consultancy, 1 per. * 1 month
41,550
41,550
pollution control.
1.1.5 Organise
seminar/workshops
for sharing and dissemination of
experiences and lessons learned on community
2 seminars, 3days * 35 pers.; Consultancy, 1 per. * 1 month * 2 times
41,550
41,550 83,100
participation/empowerment in managing Land-based Pollution
Sub-component 1.2 Development, Improvement, and Dissemination of Awareness Materials
1.2.1 Identify and engage non-government organisations to encourage 1 seminar, 3days* 21pers. * 310; Consultancy, 1 per. * 1 month
28,530
28,530
community participation on marine pollution awareness/advocacy
1.2.2 Develop public awareness materials for different target groups (3 Consultancy for designation & material preparation, 3pers.* 1 month;
video sets, 3 flyers, 3 types brochures & 1 type of poster for use
21,000 55,515
76,515
Support for participating countries in printing and distribution of materials
at the national level)
1.2.3 Develop programmes on Land-based Pollution for journalists and Consultancy for review & preparation of materials, 2 pers. 1 month;
37,700
37,700
broadcasters for dissemination
Seminar, 2days * 35pers.
Component 2 - Enhance Pollution Control and Management
Sub-component 2.1 Develop marine environmental quality guidelines and tools for dissemination and adoption in the region
Consultancy, 2 * 8month; 1st regional workshop/training, 5days,
6pers*7countries; National workshops, 3 days*7 countries,
2.1.1 Develop guidelines or criteria for sediment and biological quality 8000USD/countries;Sediment toxicity testing, 7 parameters * 41,000USD/3
300,600 179,500 104,250 36,000 620,350
for the region (7 parameters: Hg, Cd, Pb, Cu, Cr, As, Zn)
species; 2nd regional workshop/training, 5days, 6pers*7countries; Printing
and distribution, 210 copies
2.1.2 Develop guidelines for spatial planning of coastal land-use and
Consultancy, 1 per. * 4 months; Workshop, 3days, 21pers.; Printing and
58,680
58,680
marine zoning
distribution, 210 copies
2.1.3 Harmonize Standard Operating Procedures (SOPs) for pollution Consultancy, 1 per. * 3 months; Workshop, 3days, 21pers.
46,530
46,530
control and management
2.1.4 Review and synthesise EIA practices from the countries
Consultancy, 1 per. * 2 months; Workshop, 3days, 21pers.
37,530
37,530
bordering the South China Sea
2.1.5 Transfer knowledge on simple waste treatment techniques (man- Study tour for local officials from 6 countries to Batam (2 sites, 2days,
made wetlands and communal septic tanks) for small scale
14,880
14,880
2pers.)
management of pollution.
STRATEGIC ACTION PROGRAMME
Page 49
Table 23 cont. Proposed Regional Actions and cost estimates in support of the management of Land-based Pollution.
Cost Estimation (USD)
Components, Sub-component and Actions
Description
2008 2009
2010 2011
2012
Total
Sub-component 2.2 Develop common methodologies that will generate comparable data among participating countries
2.2.1 Select and adopt key water quality parameters (among the 14 - DO, NO3, NO2,
PO4, NH3, FCB, Hg, Cd, Pb, Cu, Cr, As, Zn, Phenol) to optimise monitoring
Consultancy, 1 per. * 1 month
9,000
9,000
programmes in the region
2.2.2 Estimate total contaminant loading and carrying capacity of the South China Sea Consultancy, 1 per. * 12 months;
73,530
73,530
147,060
basin using quantitative modelling and GIS (7heavy metals)
2 workshop, 3days, 21pers.
Component 3 - Policy, and Institutional Arrangements and Coordination
Sub-component 3.1 Integration of Research Programme with Management and Policy Making
3.1.1 Review of marine sediment and biota quality guideline/criteria for possible
Meeting of stakeholders, 2 days *
8,680
8,680
adoption in the region
21pers.
Meeting of stakeholders, 2 days *
3.1.2 Review, synthesis and dissemination of community based practices in
21pers.; Workshop, 3days, 21pers.;
35,700
35,700
management of wastes from aquaculture and settlement
Printing and distribution, 210 copies
3.1.3 Creation of award programme for local governments for best practices in
7 awards* 2 times* 2000USD;
20,510
20,510
41,020
pollution management every two years
2 ceremonies, 1day, 21pers.
3.1.4 Update and maintain roster of experts that can review and improve legislation as Free of charge
required
3.1.5 Periodic (each five year) evaluation of SAP and NAPs implementation to be
Consultancy, 2 * 1 month
18,000
18,000
conducted by independent experts
Sub-component 3.2 International and Regional Cooperation
2 days' workshop of Int'l
3.2.1 Establishment of Regional Land-based Pollution Funding mechanism
organisations, donors, government,
8,680
8,680
NGOs (7 countries * 2pers.)
3.2.2 Establishment of institutional network for exchange of information and technical Free of charge
x
support.
3.2.3 Maintenance of coordinating framework developed by the SCS Project to ensure Annual meetings, 3 days, 10pers.,
9,300
9,300
9,300
9,300
37,200
SAP implementation
4 yeas
3.2.4 Organisation of a forum for cooperation between and among national and
Cost for participants from developing
international agencies/ institutions such as GPA LBA, IMO, IOC, ASEAN,
countries, 7 countries* 3 pers.*2 days;
17,670
17,670
COBSEA
Administrative cost
Total: 8,680
683,510 533,505 176,910 134,040
1,536,645
STRATEGIC ACTION PROGRAMME
Page 50
STRATEGIC ACTION PROGRAMME
Page 51
REGIONAL ECONOMIC VALUES AND COST/BENEFIT ANALYSIS OF SAP ACTIONS
ECONOMIC VALUATION
Today's society uses and is heavily dependent on the environment as a source of a range of services
and resources, that is, natural capital. At the same time, society uses (or abuses) and depends heavily
upon the environment as a "sink" or repository for its pollution and waste. The source and sink
services are in scarce supply and are continually being degraded and limited by economic activities.
This requires the adoption of more conservative patterns of use that will increase the base of
environmental assets over time, which is related to sustainability of the environments capacity to
provide continued goods and services.
Economic valuation is defined as the attempt to assign quantitative or monetary values to the goods
and services provided by environmental resources, whether or not market prices are available to
assist in the process (Barbier23 and Aylward, 1996; Bateman24 et al., 2002). The National Research
Council25 (1995) defines economic valuation as an attempt to provide an empirical account of the value
of the services and amenities or of the benefits and costs of proposed action (project or policies) that
would modify the flow of services and amenities. Both definitions are in agreement regarding the
quantification of goods and services that provide information about the environmental resources.
Valuation forms a key exercise in economic analysis and provides important information for the
sustainable use of any habitat. The basic aim of valuation is to determine people's preferences how
much they are willing to pay for, and how much better or worse off they would consider themselves to
be as a result of changes in the supply of different goods and services. Valuation provides a means of
quantifying the benefits that people receive from habitats, the costs associated with their loss, and the
relative profitability of land and resource uses which are compatible with habitat conservation vis-ŕ-vis
those economic activities that contribute to habitat degradation. Valuation helps to predict and
understand the consequences of economic decisions and economic activities which impact on the
integrity and status of habitats.
Valuation in the context of habitat management is generally used to indicate the overall economic
efficiency of the various competing uses of habitats and resources. That is, the underlying assumption
is that habitat resources should be allocated to those uses that yield an overall net gain to society, as
measured through valuation in terms of the economic benefits of each use, less its' costs. However,
the valuation should be based on reasonably well-founded methodology and speculative assumptions
will not contribute to decision-making (Munasinghe, 199526).
"Valuing" an ecosystem is essentially valuing the characteristics of a system. Costanza27 et al. (1997)
have made a comprehensive list of ecosystem functions and services and defined ecosystem services
as "flows of materials, energy and information from natural capital stocks which combine with
manufactured and human capital services to produce human welfare".
The concept of Total Economic Value (TEV) provides a framework for valuing natural; systems and is
used to identify and estimate the monetary value of all economic benefits that a society derives from a
particular ecosystem. In some countries this method has been used to improve forest policy, planning,
and management decisions by accounting for all short- and long-term benefits to society from forests,
including alternative options. TEV accounts for a wide variety of market and non-market functions and
services provided by the habitat.
23 Barbier, E.B. and Aylward, B. (1996). Capturing the pharmaceutical value of biodiversity in a developing country.
Environmental and Resource Economics. (8), pp.157-181.
24 Bateman, I.J., Carson, R.T., Day, B., Haneman, M., Hanley, N., Hett, T., Lee, M.J., Loomes, G., Mourato, S., Ozdemiroghu,
E., Pearce, D.W., Sugden, R., and Swanson, J. (2002). Economic valuation with stated preferences techniques - A manual.
Cheltenham, UK: Edward Elgar.
25 National Research Council. (1995). Wetlands characteristics and boundaries. National Academy Press, Washington D.C.
26 Munasinghe, M. (1995). Applicability of techniques of cost-benefit analysis to climate change. In global climate change,
economic and policy issues. Edited by Mohan Munasinghe. World Bank Environment Paper Number 12. The World Bank,
Washington D.C.
27 Costanza, R., d'Arge, R. de Groot, R., Farber, S., Grasso, M., Hannon, B. Limburg, K., Naeem, S., O'Neill, R.B., Paruelo, J.,
Raskin, R.G., Sutton, P. and van den Belt, M. (1997). The Value of the world's ecosystem services and natural capital
Nature 387 (6630) 253-260.
STRATEGIC ACTION PROGRAMME
Page 52
The Regional Task Force on Economic Valuation (RTF-E) developed a procedure and related
methods to derive regional values of the goods and services from coastal habitats bordering the South
China Sea. Values derived at sites in any particular year are standardised using 2005 as the base
year. The Consumer Price Index (CPI) for 2005 in each country is used as the basis for conversion of
the data for other years and all nominal values have been converted to real values using the CPI. This
conversion is effected using the following equation:
In local currency
STANDARD VALUE 2005 (SV2005) = (RAW VALUE DATA*CPI OF 2005)
CPI YEAR OF VALUATION
For comparability all standard values are converted into US dollars as follows:
In US dollars
STANDARD US$ VALUE 2005 (US$SV2005) = (SV2005)*(US DOLLAR EXCHANGE RATE FOR 2005)
At the national level, where several differing values for the same resource or service are available
from one country, a weighted mean national value has been derived based on the economic values
related to the stock at each location, using the following equation:
WEIGHTED MEAN NATIONAL VALUE (US$MV2005) = (US$SV
)
I 2005*SI
( S )
I
where
US$SVI 2005 = Standard US$ Value of 2005 at Location i
Si
= Stock at location i
I =
1......N
N
= Number of values (locations) from the country concerned.
The total economic value in one country is thus the product of the stocks and the weighted mean
national value, i.e.,
TEV = (SI,)* US$MV2005
The regional total economic value is derived in a similar manner to the weighted mean national value28
and in instances where the volume (or weight) of the total stock is not available for all countries then a
surrogate, namely the area of the habitat in each country, has been used to weight the mean national
values in the following equation:
Weighted Mean Regional Value of Resource or Service A1 is:
R
-Kg
VA1
= [(SCa*MVCa)+(SChi*MVChi)+(SIn*MVIn)+(SMa*MVMa)+(SPh*MVPh)+(STh*MVTh)+(SVi*MVVi)]
(SCa + SChi + SIn + SMa + SPh + STh + SVi)
Where S
= The Stock
MV
= Weighted Mean National Value for countries (in US$):
Ca = Cambodia; Chi = China; In = Indonesia; Ma = Malaysia; Ph = Philippines;
Th = Thailand; Vi = Viet Nam.
Thus, the regional total economic value of the stock of the resource is measured by the product of the
total stock with the weighted mean regional value i.e.,
(S
-Kg
Ca + SChi + SIn + SMa + SPh + STh + SVi) * RVA1
28 UNEP/GEF/SCS/RTF-E.5/6 "Derivation of Regional Values of the Goods and Services from Coastal Habitats".
STRATEGIC ACTION PROGRAMME
Page 53
In deriving the regional total economic values the following items should be included in the guidelines
for valuation by resource categories for each ecosystem:
1. Value of Resource i per hectare, i = 1...n at site j [$/ha]
2. Total Value of Resource i for the country: [1 X acreage at site j] over all sites [$]
3. Calculate
the
Weighted
Value of the Resource i for the country per hectare: [2 ÷ total country
acreage] [$/ha]
4. Total Value of Resource i for the region: [2] over all countries [$]
5. Calculate the Weighted Regional Value of the Resource i per hectare: [4 ÷ total regional acreage]
[$/ha]
6. Calculate the Regional Total Value of all resources: [4] over all resources [$}
7. Calculate the Weighted Regional Total Value per hectare: [6÷ total acreage for the region] [$/ha]
The regional total economic values are used in the cost benefit analysis of actions versus non-action
as contained in the revised SAP.
COST AND BENEFIT ANALYSIS
Financial analysis is usually the first step in assessing the monetary costs and benefits of projects or
management options. A financial analysis is taken from the perspective of private investors who are
typically interested in the actual money costs and returns on their projects. It therefore measures
private profits accruing to households or firms based on market prices. While financial analysis can be
invaluable in illustrating the motivations of the private sector, it does not ask whether market price is
the "proper" price and reflects true economic value.
An economic analysis goes beyond a financial analysis to perceive a project's economic costs and
benefits on the welfare of society. It examines all of a project's impacts, including its environmental
consequences. An economic analysis usually requires various adjustments to financial prices to
correct for market imperfections, policy distortions and distributional inequities.
The economic costbenefit analysis is said to provide a better framework for assessing the holistic
profitability of project alternatives by incorporating the environmental costs and benefits of use and
non-use activities. This economic analysis approach departs from the financial analysis because the
latter only accounts for direct transacted cost and benefit elements. The financial values are
inadequate to capture all environmental effects and are inadequate representations of the welfare of
society. Environmental effects increase or decrease welfare even though they may not be traded in
the market with monetary prices. In financial analysis, environmental effects are considered only
when they directly affect revenue streams or cost outlays of the project concerned.
Cost-Benefit Analysis of Action Versus Non-action in the Strategic Action Programme
The benefits derived from action as outlined in the SAP reflect in reality the anticipated change
(decline) in the rate of loss or degradation of the habitat. Each regional working group provided up-to-
date estimates of the rates of loss and degradation of important coastal habitats in order that the costs
of non-action could be estimated. These are then compared with the costs of the actions proposed in
the SAP and a measure of the cost effectiveness of acting derived. The data and information used
include:
1) Time series data of the rates of habitat loss and degradation;
2) Estimated rates of loss and degradation in high-pressure (non-action scenario) and low-
pressured scenarios (action scenario); and
3) Investments and costs needed to undertake the actions and achieve the targets included in
the SAP.
Tables in the preceding chapters of the SAP present a summary of the costs of regional actions
proposed by the regional working groups for inclusion in the SAP. It should be noted that in the case
of the wetlands some attempt was made to cost national level actions and these have been
discounted from the present analysis.
STRATEGIC ACTION PROGRAMME
Page 54
In broad terms the total costs over five years are quite modest when compared with the value of
annual production from each habitat:
·
Mangroves 2.99 million US dollars compared with 5.1 billion US dollars of annual production;
·
Coral reefs 1.67 million US dollars compared with 1.1 billion US dollars of annual production;
·
Seagrass 1.58 million US dollars compared with 87.2 million US dollars of annual production;
·
Wetlands 1.82 million US dollars compared with 1.2 billion dollars of annual production.
Costs and Benefits of Mangrove Interventions
The value of the annual production of goods and services by mangrove habitats bordering the South
China Sea has been established as US$2,872.25 per hectare, giving a total value of
US$5,196,296,711 per annum.
The targets in the SAP are of four types:
1. Areas to be transferred from various categories of use to protected area status.
2. Areas to be transferred from status defined as "conversion" to sustainable use.
3. Areas in which management is to be improved.
4. Areas of deforested mangrove land to be replanted.
5. Areas of degraded mangrove to be subject to enrichment planting to increase the species
diversity.
1. In the first case the rate of mangrove loss in the region over the preceding decade of 1.61% per
annum is used to ascertain the proportion of the mangrove currently not accorded protection status
that will be saved by achieving this target. It is further assumed that the proportion accorded protection
status is equally spread across the first five years of the SAP implementation. The cumulative benefit
is therefore the value of the annual production saved through such a change in designated status.
2. In the second case it is assumed that mangrove forest designated for conversion to alternate
uses will have a change in designation to sustainable use (including sustainable timber extraction) and
that such change in designation will impact areas in equal proportion over the first five years of the
SAP implementation. The cumulative benefit is therefore the value of the annual production saved.
3. In the third case a modest 5% per annum improvement in annual production is projected over the
first five years of the SAP implementation.
4. In the case of areas of degraded mangrove forest that are replanted, no cumulative benefits are
anticipated over the first four years and the first year in which a return is likely to be seen is in year
five. In this year the annual production of the area planted in the first year is assumed to reach one
sixth of the Total Economic Value. This proportion was decided upon based on the harvest cycle of
mangroves under sustainable forestry management, namely a thirty year rotation in the only known
example of sustainable forest management of mangroves at Matang, Malaysia.
5. As in the case of the fourth target it is assumed that no benefit accrues until the final year of the
first phase of SAP implementation. Benefit is calculated in a similar manner to that calculated for the
fourth target.
The costs of the actions contained in the SAP were determined by the Regional Working Group for
mangroves on the basis of experience in implementing the first phase of the UNEP/GEF project
entitled "Reversing Environmental Degradation trends in the South china Sea and Gulf of Thailand"
and are expressed as 2006 costs.
It is important to recognise that the actions costed in the Strategic Action Programme are only those
actions undertaken at a regional level to ensure co-ordination of national actions and the sharing of
experience and expertise across national boundaries. The Regional Task Force on Economic
Valuation is of the opinion that national level management costs might be expected to reach between
15 and 20% and that correspondingly regional management and administrative costs might be
STRATEGIC ACTION PROGRAMME
Page 55
expected to reach a maximum of 1% of the total value of the interventions. Using these figures it is
possible to extrapolate that the costs of national level actions might reach as much 300 million US$ if
the targets of the regional SAP are to be met.
Table 24 presents the costs and benefits with respect to mangroves, over the first five years of SAP
implementation, whilst Table 25 presents a summary of the costs and benefits. From Table 25 it can
be seen that the costs represent 0.2% of the estimated net benefits amortised over the five years.
STRATEGIC ACTION PROGRAMME
Page 56
Table 24
Summary of the Regional Costs and Benefits of Achieving the Mangrove Targets Defined in the Strategic Action Programme.
Values in
YEARS
2008 2009 2010 2011 2012 TOTAL
US$ ha-1
Target 1 Area of mangrove saved Benefit increased i.e. rate of
185 369 554 739 924
loss avoided 1.61 % per annum
i. Value of Mangrove Goods
1,585
292,748
585,496
878,243
1,170,991
1,463,739
ii. Value of Mangrove Services
1,287
237,764
475,527
713,291
951,055
1,188,819
iii.
Total
2,872 530,512 1,061,023 1,591,535 2,122,046 2,652,558
Target 2 Non-conversion of mangrove, sustainable use
33,320
66,640
99,960
133,280
166,600
i. Mangrove
goods
1,585 52,811,200 105,622,401 158,433,601 211,244,802 264,056,002
ii. Mangrove services
1,287
42,892,170
85,784,339
128,676,509
171,568,678
214,460,848
iii.
Total
2,872 95,703,370 191,406,740 287,110,110 382,813,480 478,516,850
Target 3. Improved management relating to sustainable use
0
120,554
241,109
361,663
482,218
602,772
i. Mangrove goods
1,585
9,553,755
19,107,511
28,661,266
38,215,021
47,768,777
ii. Mangrove services
1,287
7,759,363
15,518,727
23,278,090
31,037,454
38,796,817
iii.
Total
2,872 17,313,119 34,626,238 51,939,356 69,252,475 86,565,594
Target 4.Replanting of deforested mangrove land
4,200
8,400
12,600
16,800
21,000
i. Mangrove goods
1,585
0
0
0
0
1,109,479
ii. Mangrove services
1,287
0
0
0
0
901,096
iii.
Total
2,872 0 0 0 0
2,010,575
Target 5.Enrichment planting to increase mangrove
biodiversity
2,240 4,480 6,720 8,960
11,200
i. Mangrove goods
1,585
0
0
0
0
591,722
ii. Mangrove services
1,287
0
0
0
0
480,585
iii.
Total
2,872 0 0 0 0
1,072,307
Total for goods
1,585
62,657,704
125,315,407
187,973,111
250,630,814
314,989,719
total for services
1,287
50,889,297
101,778,593
152,667,890
203,557,187
255,828,164
Grand
total
2,872 113,547,000 227,094,001 340,641,001 454,188,001 570,817,883 1,706,287,886
SUMMARY
COSTS at
2006
prices
765,000 827,600 655,000 710,500 369,500
Discount factor NPV for 2006 i=4%
0.9246
0.8890
0.8548
0.8219
0.7903
Costs 2006 value
707,286 735,733 559,897 583,979 292,021 2,878,916
Compound factor NPV for 2007 i=4%
1.0400
1.0400
1.0400
1.0400
1.0400
Costs
2007
values
735,577 765,163 582,293 607,338 303,702 2,994,073
BENEFITS at 2005 prices
113,547,000
227,094,001
340,641,001
454,188,001
570,817,883
Discount factor for NPV 2005 i=4%
0.8890
0.8548
0.8219
0.7903
0.7599
Benefits 2005 values
100,942,870 194,120,903 279,982,072 358,951,375 433,774,677
Compound factor for NPV 2007 i=4%
1.0816
1.0816
1.0816
1.0816
1.0816
Benefits
2007
values
109,179,808 209,961,169 302,828,609 388,241,807 469,170,691 1,479,382,085
Net
Benefits
108,444,231 209,196,006 302,246,317 387,634,469 468,866,989 1,476,388,012
STRATEGIC ACTION PROGRAMME
Page 57
Table 25 Summary of Benefits in Terms of Cumulative National Production over the First Five
Years of SAP Implementation and Costs of Executing the Mangrove Component of the
Strategic Action Programme.
Total benefit
1,479,382,085
Total cost
2,994,073
Total Net benefit
1,476,388,012
Benefit-Cost ratio
494
Costs as percentage of benefits
0.2 %
Costs and Benefits of Coral Reef Interventions
The total area of coral reefs bordering the South China Sea is estimated at 750,307 hectares of which
the present area under management at 82 identified locations is around 102,105 hectares. The total
value of annual production is estimated at 1,157,393,566 US dollars.
The targets for the coral reef component of the Strategic Action Programme are of two types:
1 Placing additional identified areas under sustainable management regimes bringing the total
management area to 152,057 hectares.
2
At a regional scale reducing the decadal rate of loss of live coral cover from 16 to 5%.
In the case of the first target it is assumed that the areas are brought progressively under sustainable
management of the first five years and consequently the cumulative benefit is represented by a
reduction in the present decadal rate of coral cover from 16 to 0 percent as the areas are brought
under sustainable management.
For the second target the area under consideration is the total coral reef of the region (750,307) of
which 647,195 hectares are currently unmanaged and the cumulative benefits are derived from
reducing the decadal rate of decline from 16% of live coral cover to 5% by 2015. This equals a
reduction in the rate of decline to 1.375% per annum
Table 26 provides details of the costs and benefits to be derived from implementing the coral reef
actions outlined in the SAP as in the case of mangroves it should be noted that the costs do not
include national level costs. Table 27 presents a summary with the benefits for management, i.e. the
first target separated from those for the second target and for the two targets combined (all benefits). It
can be seen that placing a further 50,000 hectares of coral reefs under sustainable management is not
as cost effective as successful achievement of the target to reduce the regional rate of degradation.
The costs expressed as a percentage of benefits are somewhat high which is likely explained by the
low valuation for coral reef goods and services determined during the present study.
STRATEGIC ACTION PROGRAMME
Page 58
Table 26
Summary of the Costs and Benefits of successful implementation of the Coral Reef Activities in the SAP to meet the Coral Reef Targets
2008 2009 2010 2011 2012 2013 2014 2015 Total
Total accumulated new area under
6,244
12,488
18,732
24,976 31,220
37,464
43,708
49,952
management (ha)
Coral reef value 1,542.56 US$ per hectare
1,735
1,805
1,877
1,952 2,030
2,111
2,196
2,283
2005 prices adjusted 4% per annum
Benefit expected from coral reef
management if value increased by 16%
173,333
360,653
562,559
780,050 1,014,026
1,265,384
1,535,724
1,824,647
under management
Costs (at 2006 prices) costs for the last
three years estimated at 5% increase per
135,449
242,916
175,785
295,259 321,335
229,915
94,250
177,310
annum on 2012 costs.
Discount factor (NPV for 2006) i=4%
0.9246
0.889
0.8548
0.8219
0.7903
0.7599
0.7307
0.7026
Costs 2006 value
125,236
215,952
150,261
242,673
253,951
174,712
68,868
124,578
1,356,233
Compound factor (NPV for 2007) i=4%
1.04
1.04
1.04
1.04
1.04
1.04
1.04
1.04
Costs 2007 values
130,246
224,590
156,271
252,380
264,109
181,701
71,623
129,561
1,410,482
Benefits at 2005 prices 16% of total value
173,333
360,653
562,559
780,050 1,014,026
1,265,384
1,535,724
1,824,647
saved
Discount factor for NPV 2005 (i=4%)
0.889
0.8548
0.82193
0.79031
0.75992
0.73069
0.70259
0.67556
Benefits 2005 values
154,093
308,287
462,384
616,482
770,578
924,603
1,078,985
1,232,658
5,548,071
Compound factor for NPV 2007 (i=4%)
1.0816
1.0816
1.0816
1.0816
1.0816
1.0816
1.0816
1.0816
Benefits 2007 values
166,667
333,443
500,115
666,787
833,458
1,000,051
1,167,030
1,333,243
6,000,793
Cumulative benefits at 2005 prices of
reducing the decadal rate of decline from
15,314,711 15,777,627 16,245,834 16,727,386 17,221,510 17,727,434 18,252,696 18,779,815
16% of live coral cover to 5% by 2015.
Equals decline in loss of 1.375% per annum
Discount factor for NPV 2005 (i=4%)
0.889
0.8548
0.82193
0.79031
0.75992
0.73069
0.70259
0.67556
Benefits 2005 values
13,614,778 13,486,715 13,352,938 13,219,820 13,086,970 12,953,259 12,824,162 12,686,892
Compound factor for NPV 2007 (i=4%)
1.0816
1.0816
1.0816
1.0816
1.0816
1.0816
1.0816
1.0816
Benefits 2007 values
14,725,744 14,587,231 14,442,538 14,298,558 14,154,867 14,010,245 13,870,614 13,722,142
113,811,938
Total Benefits
14,892,411 14,920,674 14,942,653 14,965,344 14,988,324 15,010,296 15,037,643 15,055,386
119,812,731
Net Benefits
14,762,165 14,696,084 14,786,382 14,712,964 14,724,215 14,828,595 14,966,020 14,925,825
118,402,249
Table 27
Summary of Costs and Benefits of Coral reef Interventions
Management All
Benefits
Present Value of Benefits
6,000,793 119,812,731
Present Value of Costs
1,410,482
1,410,482
NPV 4,590,311
118,402,249
Benefit-Cost Ratio
4.254
84.94
Cost as percentage of Benefit
23.5
1.18
STRATEGIC ACTION PROGRAMME
Page 59
Costs and Benefits of Seagrass Interventions
Addressing problems regarding the loss and degradation of seagrass habitats in the South China Sea
poses problems unlike those faced in the case of the other coastal habitat types. These include the
absence of good data regarding the actual distribution and abundance of seagrass meadows in the
region; a lack of data regarding the rates of loss and degradation and inadequate understanding of the
economic significance of these habitats as nursery areas for fish and crustaceans of subsistence and
commercial importance. Only 73,769 hectares of seagrass are sufficiently well documented to be
included in the estimations and the value of annual production is estimated at US$1,181.59 per
hectare giving a total value for the region of only US$87,164,402 per annum. This is significantly
smaller that the estimates for coral reef and mangroves which reach 1.1 and 11.6 billion US dollars
respectively.
Costs of action have been estimated by the Regional Working Group on Seagrass in 2006 at 2006
prices, and encompass actions over the first five years of implementation of the Strategic Action
Programme. These costs represent the costs of regional actions and not the cost of the national
actions required to achieve the national targets established within the National Action Plans and
reflected in the SAP. The values used are based on the Total Economic Value of seagrass habitats
derived from the values for goods and services as calculated by the Regional Task Force on
Economic Valuation and are standardised to 2005 prices.
In calculating the benefits of the Strategic Action Programme an average annual loss of seagrass
habitat of 3.5 percent of total area per annum has been assumed. Hence the avoided loss represents
3.5% of the habitat area placed under sustainable management over the five year period. Net benefits
and the cost benefit ratio have been calculated using net present (2007) values
Table 28 presents an analysis of the costs and benefits of the regional actions to address seagrass
degradation in the South China Sea, whilst Table 29 presents a summary of these costs and benefits
which suggests that the costs represent greater than 50% of the benefits over the five years of SAP
Implementation. This almost certainly reflects the gross undervaluation of the seagrass habitat,
particularly with respect to its nursery function for commercial and subsistence fisheries.
Table 28
Costs and Benefits of the Regional Actions to Address Seagrass Loss.
YEARS
2008 2009 2010 2011 2012 Total
Cumulative Target Areas to be Managed
18,151 23,374 28,598 33,821 39,044 142,988
(ha) 2008 onwards
Cumulate benefit in terms of area saved
183
366
548
731
914
Value of Benefits at 2005 prices
216,009
432,018
648,026
864,035 1,080,044
3,240,132
Discount factor for NPV 2005 (i=4%)
0.89
0.85
0.82
0.79
0.76
Benefits 2005 values
192,031
369,291
532,631
682,860
820,745
2,597,557
Compound factor for NPV 2007 (i=4%)
1.08
1.08
1.08
1.08
1.08
Benefits 2007 values
207,701
398,834 575,241
737,488 886,404 2,805,668
Costs at 2006 prices
239,650
118,920
124,670
96,600
144,650
724,490
Discount factor (NPV for 2006) i=4%
0.92
0.89
0.85
0.82
0.79
Costs 2006 value
221,570
105,719
106,568
79,398
114,319
627,575
Compound factor (NPV for 2007) i=4%
1.04
1.04
1.04
1.04
1.04
Costs 2007 values
230,433
109,948 110,831
82,574 118,892
652,678
Net Benefits
-22,732
288,886 464,410
654,914 767,513 2,152,990
Table 29
Summary of Costs and Benefits of Seagrass Interventions.
Total Benefit
2,805,668
Total Cost
652,678
Total Net Benefit
2,152,990
Benefit-Cost ratio
4.30
Cost as percentage of benefit
23%
STRATEGIC ACTION PROGRAMME
Page 60
Costs and Benefits of Wetland Interventions
As in the case of seagrass some difficulties arise in the case of the information assembled by the
Regional Working Group on Wetlands. Initially this group was to have focussed on coastal lagoons,
estuaries and inter-tidal mudflats. Subsequently coastal freshwater, peat and non-peat swamp forests
were added to the range of habitats under consideration. Unfortunately the range of data available for
the economic values of goods and services from these habitats was far less extensive than for the
other habitats resulting in a regional value for annual production of US$295.15 per hectare, which is
absurdly low. This results in a total value of US$1.2 billion for the estimated 4,201,145 hectares of
these habitats bordering the South China Sea. Further work is needed to refine and improve the
estimates of value.
Table 30 provides an analysis of the costs and benefits of the actions proposed in the wetlands
component of the SAP whilst Table 31 provides a summary of the costs and benefits. These tables
suggest that less economic benefit is derived from investing in coastal wetlands than in coral reefs and
mangroves and approximately the same benefit as in the case of seagrass.
Table 30
Costs and Benefits of the Wetlands interventions in the SAP.
Years
2008
2009
2010
2011 2012 Total
Total costs of proposed actions (USD$)
248,000 616,000 506,000
298,000
153,000 1,821,000
Discount factor (NPV for 2006) i=4%
0.92
0.89
0.85
0.82
0.79
1
Costs 2006 value
229,290 547,622 432,531
244,934
120,918 1,575,295
Compound factor (NPV for 2007) i=4%
1.04
1.04
1.04
1.04
1.04
Costs 2007 values
238,462 569,527 449,832
254,732
125,755 1,638,307
Total value per hectare of annual production of
295 US dollars
wetland goods and services 2005 values
Total area to be brought under sustainable
938,261 hectares
management within five years
Total benefits derived from avoiding the annual
830,783 534,694 802,041 1,069,393 1,336,740 4,573,651
losses(USD$) 2005 values
Discount Factor
0.889
0.855
0.822
0.790
0.760
Benefits 2005 values discounted
738,563 457,059 659,219
845,157 1,015,813 3,715,810
Compound factor (NPV for 2007) i=4%
1.082
1.082
1.082
1.082
1.082
Benefits 2007 values (Compound factor i=4%)
798,830 494,355 713,012
914,122 1,098,703 4,019,020
Benefit-Cost (USD$)
560,368
-75,172 263,179
659,390
972,948 2,380,714
Rate of loss assumed as 30% per century = 0.3%
2,815
5,630
8,444
11,259 14,074 42,222
per annum or 0.003 per annum
Costs as percentage of benefits
41%
Table 31
Summary of Costs and Benefits of Wetland Interventions.
Total Benefits
4,019,020
Total Costs
1,638,307
Total Net Benefits
2,380,714
Benefit-Cost Ratio
2.45
Costs as percentage of Benefits
40.76
STRATEGIC ACTION PROGRAMME
Page 61
REGIONAL CO-OPERATION
RATIONALE
The environment of the South China Sea continues to degrade despite actions taken at the national,
sub-regional and regional levels. Part of the problem stems from the transboundary marine problems
in the region and their impact on the ecosystems and resources of the South China Sea. This provides
the ecological impetus for co-operation that is also based on the fact that the region is a large marine
ecosystem with intrinsic integrity and inter-connections between all trophic levels. Fish and other
migratory species do not recognise national boundaries, and the loss of endangered species in one
area has not only regional but global significance. Due to the inherent conflict between the boundaries
of the ecological system and man-made, national boundaries, countries must co-operate to meet the
challenges to managing and sustainably using the shared ecological system.
These ecological issues are compounded by gaps in regional co-operation, which existed despite the
ratification of many international conventions, which contain the legal basis for regional collaboration.
Moreover, the present instruments and mechanisms for regional co-operation in the management of
the marine and coastal environment of the South China Sea area are neither extensive nor well
developed. While a number of sub-regional agreements or soft laws have been developed and
numerous bi-lateral agreements have been entered into by, all governments individually and severally,
there exists no overarching regional agreement governing the management of the marine
environmental in the South China Sea.
The necessity for co-operation is reinforced by the need to prevent wastage of scarce financial
resources that result from duplication of actions by countries in the region and the need to ensure that
regional efforts are co-ordinated and effective. This in turn depends on the efficacy of related national
actions which form the foundations of regional action and co-operation.
OBSTACLES TO REGIONAL CO-OPERATION AND PROPOSED SOLUTIONS
Despite the widespread recognition of the necessity to promote formal inter-governmental regional
co-operation, there exist some common obstacles to strengthening existing mechanisms or forging
new ones for regional co-operation. These identified obstacles include:
· Financial constraints; continued long-term financing;
· Lack of understanding of the root causes of regional marine environmental problems;
· Lack of consideration of long-term impacts;
· Inability to predict the impacts of future threats;
· Lack of a regional and global perspective;
· Lack of respect and recognition of regional expertise among some high-level decision-makers;
· Lack of a regional political consensus;
· Lack of a regional network and mechanism for action; and,
· Lack of understanding of the benefits of regional co-operation.
In identifying ways to overcome the obstacles the Regional Task Force on Legal Matters (RTF-L)
conducted a number of reviews including: a review of states obligations to co-operate regionally under
existing multi-lateral environmental agreements; a comparative review of national legislation relating to
coastal habitats and pollution; a review of existing regional and sub-regional legal agreements in the
field of marine environmental management.
In addition the RTF-L commissioned a study by a regional consultant, of instruments and mechanisms
used elsewhere for strengthening and enhancing regional co-operation in the management of the
marine environment. As part of this study a questionnaire was administered to various regional entities
around the world regarding the effectiveness or otherwise of their existing instruments and
mechanisms, the responses suggest that:
· Regional legal agreements are the most influential instruments, in strengthening regional
co-operation and fostering regional stability and confidence building among the countries;
· The ecological effectiveness and economic efficiency of regional co-operation are necessary
to avoid the waste of scarce financial resources;
STRATEGIC ACTION PROGRAMME
Page 62
· A process-oriented focus to improving the effectiveness of actions and implementation is
appropriate for regional cooperation;
· A strong, proactive institutional mechanism empowered to act effectively, results in the most
effective regional co-operation: and lastly;
· That regional co-operation may take many forms, but it must be appropriate to the regional
ethos and culture.
The RTF-L also conducted a survey and carried out consultations at national level to gauge views
among government and non-government organisations on the level and effectiveness of co-operation
in the South China and whether an alternative mechanism is needed to enhance co-operation in
marine environment management in the region. The results of the surveys and a comparative analysis
of national views is given in Annex 5 "Comparative Analysis of Countries Perspectives from informal
National Consultations" of the Report of the Fifth Meeting of the RTF-L.
Based on the results of the review and national consultation, and notwithstanding the outcomes of the
commissioned study the RTF-L was of the opinion that the optimum way forward in this region at the
present time was the preparation of a non-legally binding framework.
A PROPOSED FRAMEWORK FOR CO-OPERATION IN THE MANAGEMENT OF THE MARINE ENVIRONMENT OF THE
SOUTH CHINA SEA AND GULF OF THAILAND
GOALS AND OBJECTIVES
The overall goals of this framework are: to create an environment at the regional level,
in which collaboration and partnership in addressing environmental problems of the
South China Sea, between all stakeholders, and at all levels is fostered and
encouraged; and to enhance the capacity of the participating governments to integrate
environmental considerations into national development planning.
The medium term objective of the framework is to implement and execute the actions defined in the
Strategic Action Programme (SAP, this document) that encompass specific, targeted and costed
actions for the longer-term, to address the priority issues and concerns. More specifically the proposed
activities are designed to assist countries in executing the existing national action plans and meeting
the environmental targets specified in the SAP.
The recommended framework must be functional and effective in resolving environmental problems
and fostering strong regional cooperation and coordination of appropriate cost-effective actions. The
framework must include, inter alia:
· Sound science. The use of sound science must be incorporated into policy-making processes
and underpin decisions to foster ecological and economic soundness.
· Ecologically effective actions. It is increasingly recognised that many laws, policies and
actions are ineffective in terms of ecological improvements. Ecological ineffectiveness also
results in waste of scarce financial resources. Ecologically effective actions must be based on
sound science and not on perceptions.
· Cost effective actions.
· Economic valuation. Economic valuation of environmental goods and services as a tool for
sound development planning.
· Knowledge-based decision-making. This entails gathering all relevant information for the
purpose of making effective decisions. Studies indicate that working toward a consensual
knowledge-base for decision-making purposes improves the effectiveness of decisions and it
also improves cooperation.
· Consensual knowledge-base. Promoting and building a consensual knowledge base (a base
of information that the parties agree is applicable) facilitates cooperation and decision-making
processes. This is particularly true where progress on regional cooperation is stalled or
slowed due to complexities or uncertainty surrounding the issue.
· Communication. The lack of effective vertical and horizontal communication has been
identified as a serious impediment to effective cooperation.
STRATEGIC ACTION PROGRAMME
Page 63
· Periodic assessment and review and revision or instruments or actions as required.
Significant amounts of money and valuable resources are wasted due to the failure to assess
or review laws, policies, mechanisms and measures to ensure they are effective or even
implemented. Where assessments indicate problems, it is imperative that revisions are
undertaken.
· Adaptive management. This provides a flexible approach that allows for the inclusion of new
information.
AREAS FOR CO-OPERATION
The areas for co-operation to be covered by the framework include:
1. Establishment and management of regional database
2. To identify and collect data & information in the areas of:
· Marine and coastal legislation, regulation and institutional arrangement and coordination
related to the analyse of the contents of the Draft National Action Plan from the Perspective of
the Regional Strategic Action Programme.
· Ratified international and regional conventions and agreements on marine and coastal issues
to find out the similarities and differences of all countries involved for Regional Cooperation
perspectives.
· Scientific and technical data and information, including monitoring data, economic data related
to marine and coastal environment.
· Experts and institutions in the region.
· Experience of each country, including pilot projects that can serve as models.
3. Exchange of data, information and experience
4. Regional prioritisation of environmental issues
The coastal States should cooperate on a sub-regional or regional basis to identify and
prioritize regional and transboundary environmental issues. States should co-operate
with each other in addressing the prioritized marine environmental issues in the South
China Sea.
Each Party should mobilize necessary resources, capacities and services, as well as develop legal,
financial and economic arrangements, including the adoption of a strategic plan for the management
and conservation of coastal and marine resource to reach the targets stated in the South China Sea
SAP.
5. Public Awareness and Education
Public awareness should be raised through countries' education systems, campaigns and other
activities at the regional, national, and local community levels, especially those living along the
coastlines, on the following issues:
· Ecological unity of the South China Sea and Gulf of Thailand;
· Social, economic and environmental benefits arising from the proper exploitation,
management and conservation of marine resources of the South China Sea and Gulf of
Thailand;
· Social, economic and environmental adverse impacts possibly arising from the degradation of
the ecosystems of the South China Sea and Gulf of Thailand; and
· Necessity of regional cooperation on the exploitation, management and conservation of the
marine resources of the South China Sea and Gulf of Thailand.
STRATEGIC ACTION PROGRAMME
Page 64
MECHANISMS
A management framework that:
· Restricts the membership of the policy/decision making body to government representatives
only;
· The policy/decision making body may invite a limited number of observers from regional and
international agencies and institutions as deemed appropriate;
· Includes a high level scientific and technical body that serves: a) as a forum for reconciling
both sectorial and national interests and priorities; and, b) as the source of independent
scientific and technical advice to the policy making body;
· Ensures and maintains a separation between discussions of scientific and technical matters
from discussions dealing with policy and principles at both the national and regional levels;
· Facilitates and ensures the incorporation of sound scientific and technical advice and
information into politically based decision-making;
· Emphasises the use of experts and consultants from the participating countries, having
regional knowledge and perspectives;
· Fosters the establishment of epistemic communities within the region and utilises effectively
their advice and experience;
· Permits and encourages networking and interactions among and between specialist epistemic
communities;
· Emphasises and fosters networking at all levels and amongst all stakeholders;
· Fosters and strengthens both "horizontal" (inter-country) and "vertical" (intra-country)
interactions and networking between individuals at all levels of SAP implementation and
execution;
· Encourages adaptive management, which is subject to periodic review in line with the reviews
of the SAP;
· Is developed through a process of detailed planning and consultation that ensures consensus
regarding the final, agreed management framework; and,
· Is managed and operated by committed, experienced, independent, and full-time
professionals, guided by and responsible to the policy/decision making body.
COMPONENTS
The proposed framework should contain the following components:
Memorandum of Understanding adopted at the ministerial level
The MoU serves as the political instrument for the implementation of the entire Strategic Action
Programme.
Regional Strategic Action Programme
The regional Strategic Action Programme will be the operational arm of the Memorandum of
Understanding and outlines the actions that need to be taken to address environmental degradation in
the South China Sea and Gulf of Thailand. The first draft of the regional SAP was adopted in 1999 and
has been revised and replaced by the present document which will form the basis for action over the
next five years.
Sub-regional and bi-lateral Agreements
Countries are encouraged to enter into sub-regional and bi-lateral agreements to address issues
relating to the implementation of the SAP. The Memorandum of Understanding will form the umbrella
under which these sub-regional and bilateral agreements are negotiated and implemented.
Existing National Action Plans
During the course of the UNEP/GEF project entitled "Reversing Environmental Degradation in the
South China Sea and the Gulf of Thailand", participating countries have prepared National Action
Plans (NAPs) for habitats, fisheries and land-based pollution. The existing NAPs will form the national
basis for action in implementation of the SAP.