


United Nations
UNEP/GEF South China Sea
Global Environment
Environment Programme
Project
Facility
"Reversing Environmental Degradation Trends
in the South China Sea and Gulf of Thailand"
National Reports
on the
Fish Stocks and Habitats of Regional, Global
and Transboundary Significance
in the South China Sea


First published in Thailand in 2007 by the United Nations Environment Programme.
Copyright © 2007, United Nations Environment Programme
This publication may be reproduced in whole or in part and in any form for educational or non-profit
purposes without special permission from the copyright holder provided acknowledgement of the
source is made. UNEP would appreciate receiving a copy of any publication that uses this publication
as a source.
No use of this publication may be made for resale or for any other commercial purpose without prior
permission in writing from the United Nations Environment Programme.
UNEP/GEF
Project Co-ordinating Unit,
United Nations Environment Programme,
UN Building, 2nd Floor Block B, Rajdamnern Avenue,
Bangkok 10200, Thailand.
Tel.
+66 2 288 1886
Fax.
+66 2 288 1094
http://www.unepscs.org
DISCLAIMER:
The contents of this report do not necessarily reflect the views and policies of UNEP or the GEF. The
designations employed and the presentations do not imply the expression of any opinion whatsoever
on the part of UNEP, of the GEF, or of any cooperating organisation concerning the legal status of
any country, territory, city or area, of its authorities, or of the delineation of its territories or boundaries.
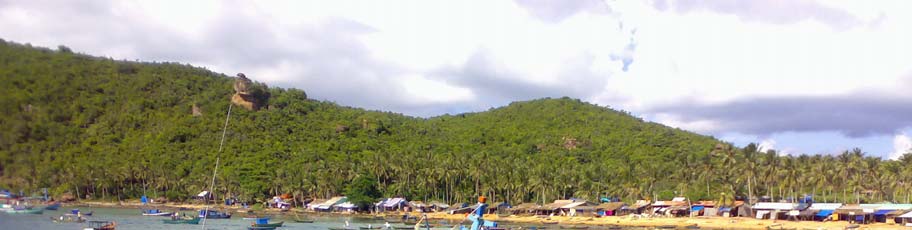
Cover Photo: Coastal fishing village of Phu Quoc Island, Viet Nam by Mr. Christopher Paterson.
For citation purposes this document may be cited as:
UNEP, 2007. National Reports on the Fish Stocks and Habitats of Regional, Global, and
Transboundary Significance in the South China Sea. UNEP/GEF/SCS Technical Publication No. 15.
NATIONAL REPORT ON FISHERIES
INTRODUCTION
The South China Sea and Gulf of Thailand is a global centre of shallow water marine biological
diversity, supporting a significant world fishery that is important to the food security of, and as a
source of export income for, Southeast Asian countries. Landings from this area contribute
approximately 10 percent of reported global fisheries production per annum and make significant
contributions to the economies, of countries bordering the Gulf of Thailand and the South China Sea.
The majority of fisheries are small-scale in nature, and fish are landed in a large number of
decentralised locations for distribution through complex marketing networks at the community level.
As a consequence estimates of fisheries production are considered to be gross underestimates and
do not adequately reflect the importance of the artisanal or subsistence production to the fisheries
sector as a whole.
The majority of Southeast Asian countries are among the top 20 capture fisheries producing countries
in the world, with some experiencing annual increases in production of up to 5 percent. Pelagic fishes
dominate landings by volume and value, as most demersal fisheries are over-exploited. It is well
accepted, however, that regional fisheries statistics rarely reflect: (a) production from small-scale
coastal fisheries, (b) the high level participation of coastal communities in fishing, or (c) the social and
economic importance of artisanal and subsistence fishing to coastal communities.
Fish stocks in the South China Sea and Gulf of Thailand are subject to high levels of fishing effort,
such that stocks of most economically important species are considered to be fully fished or
overexploited. Increasing global demand for fisheries products, and the dependence of coastal
communities on fish for food and income results in a continued increase in fishing effort. This has led
to "fishing down the marine food chain in the region", coupled with an increasing dependence of the
artisanal sector on small pelagic species due to declining availability of demersal species.
The fisheries and habitat components of the UNEP/GEF South China Sea Project focus on the critical
role that habitats such as mangroves, coral reefs, seagrass, and wetlands play in sustaining fisheries
production in the South China Sea and Gulf of Thailand. These habitats are known to act as refuges
for most economically important fish species during critical stages of their life-cycles including as
larvae, for spawning, and for feeding. These habitats therefore play an important role in recruitment
and maintenance of fish stocks.
Declining fish availability, coupled with over-capacity and the dependence of the small-scale sector on
coastal fisheries for income generation, has led to the adoption of destructive fishing practices by
some fishers in order to maintain incomes and food production in the short-term. Fisheries trends
suggest that production from capture fisheries will decline over coming years unless total fishing effort
and capacity are reduced. The obvious problem in the reduction of fishing capacity is that most
fisheries are small-scale with the majority of participants (and their families) being highly dependent
on fisheries for income, food and well-being.
Whilst actions aimed at reducing the rate of loss of coastal habitats of significance to fisheries have
been implemented by the countries bordering the South China Sea, the decadal rates of loss of such
habitats remain high: seagrass (30%); mangroves (16%); and coral reefs (16%) (UNEP, 2007a).
Increasing levels of fishing effort, coupled with continued decline in the total area of habitats critical to
the life-cycles of most species, have raised serious concerns for the long-term sustainability of
artisanal fisheries in the region.
The dilemma for the fisheries and environment sectors is that conservation of habitat does not
necessarily result in increased fish stocks and lowering of fishing effort does not necessarily result in
improved habitat condition. Although fish production is intrinsically linked to the quality and extent of
habitats; and although the dependence of coastal communities on fish for food and income is high;
understanding of this linkage is limited, such that intensive fishing in inshore areas has been identified
as the key factor contributing to the continued loss of habitats and biodiversity in the region (UNEP,
2006a). The use of inappropriate and destructive gear and practices, such as the use of demersal
trawls and push nets in seagrass areas, and the use of poisons and explosives to catch fish in coral
reef areas, is of continuing concern with respect to the degradation and loss of habitats and
biodiversity.
i
NATIONAL REPORT ON FISHERIES
The expert members of the regional working groups on fisheries and coastal habitats of the South
China Sea Project have agreed that intensive, inshore fishing presents numerous threats to coastal
habitats and biodiversity in the South China Sea and Gulf of Thailand including:
· Degradation and loss of habitats and biodiversity caused by intensive use of inappropriate
and destructive fishing gear and practices in sensitive habitat areas;
· Reduced biomass of fish species of transboundary significance caused by growth and
recruitment over-fishing resulting from the targeting and capture of juvenile fish, fish in
spawning aggregations, and pre-recruits;
· Changes in marine community structure caused by direct reductions of populations
representing specific trophic levels of the community; and
· Decreased abundance and geographical range of rare and endangered species caused by
fishing activities conducted in critical habitat areas.
These threats coupled with the fact that many marine fisheries in Southeast Asia are over-capitalised,
unregulated, and subjected to illegal fishing have provided the impetus for the development of
innovative approaches to the management of fisheries in the region. Significant efforts are being
made in most countries to decentralise the responsibility for fisheries management to the local level
with the aim of establishing co-management particularly of demersal fish stocks. However, the
intrinsic relationship between fish stocks and their habitats necessitates that fisheries management
involving decentralised and rights-based systems will need to incorporate strategies that foster the
improved management of fish life-cycle and critical habitat linkages.
The key focus of the fisheries component of the UNEP/GEF South China Sea Project has been to
develop a mechanism to facilitate improved management of the critical linkages between fish stocks
and their habitats in the South China Sea and Gulf of Thailand. In this connection the UNEP/GEF
Regional Working Group on Fisheries has collaborated with SEAFDEC to establish a system of
fisheries refugia in the South China Sea and Gulf of Thailand that focuses on the critical links between
fish stocks and their habitats.
The "National Reports on the Fish Stocks and Habitats of Regional, Global, and Transboundary
Significance in the South China Sea" contained in this publication were prepared during the
preparatory phase of the South China Sea project by the government designated focal points for
fisheries from Cambodia, Indonesia, Philippines, Thailand, and Viet Nam. Each focal point for
fisheries has compiled in their respective National Reports, available information relating to: the status
and threats of important fish stocks; habitats and areas of importance in the maintenance of exploited
fish stocks; and existing management regimes. The reports were utilised during the operational phase
of the project as an important information resource in the identification of fisheries refugia sites and
development of a regional strategy for the establishment and management of fisheries refugia.
Christopher Paterson, Fisheries Expert
UNEP/GEF Project Co-ordinating Unit
United Nations Environment Programme
ii


United Nations
UNEP/GEF South China Sea
Global Environment
Environment Programme
Project
Facility
NATIONAL REPORT
on
The Fish Stocks and Habitats of Regional, Global, and
Transboundary Significance
in the South China Sea
CAMBODIA
Mr. Ing Try
Focal Point for Fisheries
Fisheries Administration, Ministry of Agriculture, Forestry and Fisheries
186 Norodom Blvd.
P.O. Box 582, Phnom Penh, Cambodia
NATIONAL REPORT ON FISHERIES - CAMBODIA
Table of Contents
1. BACKGROUND ............................................................................................................................1
1.1 OVERVIEW OF CAMBODIA'S FISHERIES SECTOR ......................................................................1
1.1.1 Total catch by fishing area, port of landing or province (by species/species
group, 1990 onwards)................................................................................................1
1.1.2 Fishing effort by gear (number of fishing days/number of boats) ..............................4
1.1.2.1 Trawl (Khmer name Uon Ohs)...................................................................... 5
1.1.2.2 Purse seine/ring net (Khmer name Uon Tith) ............................................... 6
1.1.2.3 Gill net (Khmer name Mong Paehk) ............................................................. 7
1.1.2.4 Other (push nets, trolling, hand line, long line, trap)................................... 10
1.1.3 Economic value of catch (estimated or actual)........................................................12
1.1.4 Importance of the fisheries sector in terms of employment and dependence.........13
2.
SPECIES OF REGIONAL, GLOBAL AND/OR TRANSBOUNDARY SIGNIFICANCE.............14
2.1 RANKING OF IMPORTANCE IN TERMS OF LANDINGS, VALUE, STATUS AND FOOD SECURITY ......14
2.1.1 Landings ..................................................................................................................14
2.1.2 Local Market Value (local currency, year) ...............................................................14
2.1.3 Status.......................................................................................................................17
2.1.4 Food security (locally)..............................................................................................18
2.2 BIOLOGY AND ECOLOGY OF THE PRIORITY SPECIES...............................................................18
2.2.1 Pelagic species........................................................................................................20
2.2.2 Demersal species ....................................................................................................22
2.2.3 Commercially exploited invertebrates......................................................................22
3. CURRENT
STATUS & THREATS..............................................................................................22
3.1 STATUS OF THE FISHERY IN TERMS OF CPUE.......................................................................22
3.2 STATUS OF FISH STOCKS BASED ON HISTORICAL REVIEW OF LANDINGS AND CPUE...............23
3.3 THREATS.............................................................................................................................24
3.3.1 Current .....................................................................................................................24
3.3.2 Potential ...................................................................................................................26
4.
HABITATS & AREAS OF IMPORTANCE IN THE MAINTENANCE OF EXPLOITED FISH
STOCKS......................................................................................................................................27
4.1 DESCRIPTION OF THE PHYSICAL, CHEMICAL AND BIOLOGICAL CHARACTERISTICS OF KNOWN
SPAWNING, NURSERY, FEEDING, AND FISHING GROUNDS ........................................................27
4.2 UNKOWN ISSUES SUCH AS STOCKS WITH UNDEFINED SPAWNING GROUNDS .............................30
4.3 THREATS, CURRENT AND POTENTIAL .....................................................................................31
4.4 RANKING OF HABITATS.........................................................................................................31
4.4.1 Ranking for association with species of importance to food security ......................31
4.4.2 Ranking for species of high value............................................................................32
4.4.3 Ranking for endangered, rare and threatened species ...........................................32
5. CURRENT
MANAGEMENT REGIMES......................................................................................32
5.1 LEGAL INSTRUMENTS ...........................................................................................................32
5.2 INSTITUTIONAL ARRANGEMENTS (RESEARCH, MONITORING, CONTROL & ENFORCEMENT) .........33
5.3 OVERVIEW OF PATTERNS OF RESOURCE OWNERSHIP AND TRADITIONAL UTILISATION ...............33
5.4 HUMAN AND INSTITUTIONAL CAPACITY ..................................................................................33
5.5 REVIEW OF STAKEHOLDERS..................................................................................................34
6. RECOMMENDED ACTIONS ......................................................................................................34
REFERENCES......................................................................................................................................35
ii
NATIONAL REPORT ON FISHERIES CAMBODIA 1
1. BACKGROUND
1.1
Overview of Cambodia's Fisheries Sector
Cambodia's fisheries and aquaculture play an important role in the national economy and contribute to
food security. The sector provides employment and economic benefits to Cambodians involved in its
activities. The Ministry of Planning estimated in 2002 that Cambodia derives 16% of its GDP from the
fisheries sector.
During recent decades, the productivity of Cambodia's fisheries resources, including fishes,
crustaceans, and molluscs, has declined significantly. This is largely due to increased pressures on fish
stocks and their habitats associated with burgeoning coastal populations in Cambodia. Increased
demand for fisheries products, and the associated improvements in fishing technology, have
contributed to this problem. Cambodia is an ASEAN country bordering the Gulf of Thailand, with a
coastline of 435km extending from the Thai border in the north to the border with Viet Nam in the south.
Cambodia's fisheries are divided into inland and marine capture fisheries. Inland capture fisheries are
significantly more important to Cambodians than marine fisheries, accounting for more than 70% of
Cambodia's total volume of fish production. In terms of value, however, marine fisheries account for
nearly 40% of the country's fisheries production (Try, 2001).
A few comments regarding the accuracy of Cambodian fisheries statistics are necessary. The statistics
presented in this report are the most accurate available to the Department of Fisheries (DoF), however,
a reliable system for the systematic collection of fisheries information and data has not yet been
established in Cambodia. The fact that fish are not landed at central locations, together with direct
exports by foreign vessels and other factors, contribute to inaccuracies. Fish caught by subsistence
fishers are often not included in the official statistics, and as such, the statistics do not adequately
reflect the importance of fisheries to small-scale subsistence fishers in Cambodia.
1.1.1 Total catch by fishing area, port of landing or province (by species/species group, 1990
onwards)
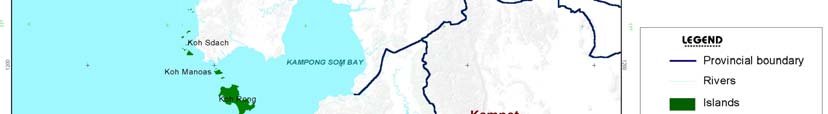
The coastal area of Cambodia is divided into two provinces, Koh Kong in the north and Kampot in the
south, and two municipalities, Sihanoukville and Kep (Figure 1). Cambodia's marine capture fisheries
are characterised by a multitude of species and the use of a range of fishing gears. Reference to DoF
fisheries statistics (Table 1) indicates that fisheries production in Cambodia has developed considerably
since 1988 when changes to government policy created free market and free election systems.
Marine fisheries production as recorded by DoF has not yet shown a decrease by species and landing
place, although anecdotal infromations suggests that the average size of many economically important
fish species traded in domestic markets is declining. The records of production from marine capture
fisheries have been irregular in some periods (Table 1).
Table 1 indicates that total fisheries production increased significantly after 1999. This is a result of
modifications to the DoF's system for the collection of inland fisheries statistics made through the
Freshwater Capture Fisheries Management Project. A corresponding system for the collection of
marine capture fisheries statistics does not exist. The DoF is seeking assistance from NGOs and
regional and international organisations in resolving this problem.
Marine fisheries production by province and municipality from 1992 to 2001 is shown in Tables 2 to 5.
These statistics are not at the species level, but grouped according to higher taxa and commercial or
market names. The data in these tables do not include catches made by local and foreign fleets
operating legally or illegally in Cambodia and then landed in ports of other countries such as Thailand
or Viet Nam. The DoF estimates that fish caught outside Cambodian waters constitute around one
quarter of the recorded production. For Kep municipality there are no data from 1980 to 1996, due to
the institution of the administrative structure for this municipality only occurring in 1996.
The aquaculture of shrimp was introduced to Cambodia in 1993, however, this business collapsed in
1998. At present, all shrimp farms are closed. The culture of seaweed began in 2001.
Reversing Environmental Degradation Trends in the South China Sea and Gulf of Thailand


2 NATIONAL REPORT ON FISHERIES CAMBODIA
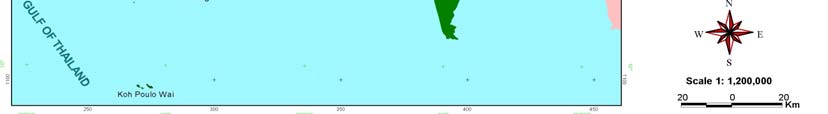
Figure 1
Map of Cambodia's Coastal Waters.
Table 1
Cambodia's fisheries production from 1990 to 2001.
(fish and shrimp unit = tonnes; and crocodile unit = heads).
Total
Inland
Marine
Aquaculture Production
Years
Production
Fisheries
Fisheries
Fishes Shrimp
Crocodile
1990 111,400 65,100 39,900 6,400
5,654
1991 117,800 74,700 36,400 6,700
6,100
1992 111,150 68,900 33,700 8,550
3,664
1993 108,900 67,900 33,100 7,400 500 4,816
1994 103,200 65,000 30,000 7,640 560 6,194
1995 112,510 72,500 30,500 8,779 731
14,691
1996 104,310 63,510 31,200 9,000 600
20,200
1997 114,600 73,000 29,800 11,534 266 17,000
1998 122,000 75,700 32,200 13,903 197 40,700
1999 284,100 231,000 38,100 14,938 62 25,380
2000 296,030 245,600 36,000 14,410 20 26,300
2001 444,500 385,000 42,000 13,682 143 36,000
(Source: DoF 2002)
Reversing Environmental Degradation Trends in the South China Sea and Gulf of Thailand
NATIONAL REPORT ON FISHERIES CAMBODIA 3
Table 2
Marine capture fisheries production in Kampot province from 1992 to 2001 (tonnes).
Low
Cepha - Slipper
Blood
Sea
Fresh-
Year Fishes Value
Shrimp Ray
Crabs Snails
Krill
Total
lopod lobster
cockle
cucum
water
Fishes
-ber
Fish
1992 1,064 1,058 993 669 296 162 1,040 1,346 1,472
- -
- 8,100
1993
654
1,134
229
678
236
156
1,020
1,465
1,507
-
861
-
7,940
1994
2,148
1,430
529
427
418
89
1,531
450
423
132
23
-
7,600
1995
2,895
2,000
625
176
310
36
900
118
180
60
-
-
7,300
1996
3,020
2,125
538
181
284
26
992
104
179
51
-
-
7,500
1997
2,974
2,045
591
167
320
28
1,120
138
172
45
-
-
7,600
1998
2,610
1,620
501
184
291
22
992
144
208
63
15
100
6,750
1999
2,720
3,025
340
135
199
7
801
104
135
34
-
-
7,500
2000
2,600
1,755
402
176
284
-
1,077
129
166
11
-
100
6,700
2001
2,703
1,786
284
165
247
-
870
176
199
-
-
100
8,100
(Source: DoF 2002)
Table 3
Marine capture fisheries production in Sihanoukville municipality from 1992 to 2001
(tonnes).
Low
Sea
Cepha
Slipper
Blood
Fresh
Year Fishes
Value Shrimp Ray
Crabs Snails
Krill
cucum-
Total
-lopod
lobster
cockle
water fish
Fishes
ber
1992
6,132
1,117
600
-
173
-
430
-
48
-
-
100
8,600
1993
6,090
1,004
641
-
146
-
428
-
56
-
-
195
8,560
1994
6,162
999
682
-
161
-
504
-
7
-
-
185
8,700
1995
5,675
1,600
820
50
225
-
610
-
38
-
-
182
9,200
1996
5,780
1,920
1,100
-
290
-
590
-
60
-
200
160
10,100
1997
4,345
3,155
1,150
-
476
-
592
-
54
-
68
160
10,000
1998
6,510
4,840
1,300
-
719
6
719
5
61
60
-
180
14,400
1999
7,295
4,455
1,570
-
1,800
40
1,080
80
150
70
-
260
16,800
2000
6,850
4,690
1,580
-
1,830
45
1,000
120
35
50
-
300
16,500
2001
6,943
4,287
1,730
-
1,496
40
897
1,236
226
210
-
535
17,600
(Source: DoF 2002)
Table 4
Marine capture fisheries production in Koh Kong province from 1992 to 2001 (tonnes).
Low
Fresh-
Cepha-
Slipper
Blood
Mantis
Year Fishes Value
Shrimp Ray
Crabs Snails
water
Total
lopod
lobster
cockle
shrimp
Fishes
fish
1992
5,560 6,485
3,000
318
791
-
700
-
146
-
-
17,000
1993
6,094 6,346
2,368
146
601
925
-
120
-
-
16,600
1994
5,093 4,845
2,395
133
487
-
612
-
135
-
-
13,700
1995
5,230 5,700
2,000
120
450
-
300
-
200
-
-
14,000
1996
5,185 4,997
2,064
110
390
-
644
-
110
-
-
13,500
1997
4,966 3,403
2,380
108
445
-
574
-
194
-
-
12,070
1998
4,020 3,600
1,840
30
510
-
520
-
180
-
-
10,700
1999
7,206 3,317
1,115
40
480
-
458
696
82
-
6
13,400
2000
5,938 3,307
815
69
498
4
1,348
26
325
10
10
12,350
2001
7,104 4,764
1,606
42
604
-
1,410
1,082
762
-
26
17,400
(Source: DoF 2002)
Reversing Environmental Degradation Trends in the South China Sea and Gulf of Thailand
4 NATIONAL REPORT ON FISHERIES CAMBODIA
Table 5
Marine capture fisheries production in Kep municipality from 1996 to 2001
(tonnes).
Low
Cepha-
Slipper
Fresh-
Year Fishes Value
Shrimp Ray
Crabs
Krill
Total
lopod
lobster
water
Fishes
Fish
1996
20 - 5
- 5
-
70 -
- 100
1997
43
5
23
1
5 -
53
- -
130
1998 62 100
30 -
10
- 146 2
-
350
1999 150 70
30 -
6
- 140
-
4
400
2000
138
81
50
-
15 -
168
8 -
460
2001
123
10
42
2
8 -
285
- -
470
(Source: DoF 2002)
1.1.2 Fishing effort by gear (number of fishing days/number of boats)
Fishing Gear
Many types of small-scale or artisanal, middle-scale, and large-scale fishing gear are used in
Cambodia. According to a proclamation made by the Ministry of Agriculture, Forestry and Fisheries,
small-scale or artisanal and middle-scale fishing gears are distinguished by the capacity of boat
engines and fishing gear size. The term commercial fishery is used only for inland fisheries and is rarely
used in relation to Cambodia's marine fisheries.
Marine capture fisheries in Cambodia are divided into two categories, namely middle-scale fisheries
and small-scale or artisanal fisheries. Middle-scale fisheries are those utilising highly efficient fishing
gear and vessels with capacity to fish both offshore and inshore using a variety of gear types, with the
exception of trawling in inshore waters (Table 6). These fisheries are required to pay tax to the
government. After the government declared a reform of the fisheries sector in October 2000, middle-
scale inland fishers do not have to pay tax. However, fishers operating middle-scale fishing gears in
marine waters are required to pay tax as usual, albeit at rates lower than those prior to the government
reform.
Table 6
Commercial fishing gears used in the coastal waters of Cambodia.
Type of Fishing Gear
Type of Fishing Gear
No.
No.
English Name
Khmer name
English Name
Khmer name
1 Trawl
Uon
Ohs
7 Scomberomorus gill net
Mong Trey Beka
2
Purse seine/Ring net
Uon Tith
8
Mackerel gill net
Mong Trey Kamong
Shrimp gill net
3
Anchovy encircling seine
Uon Ka Koeum
9
Mong Bang Kear
or Trammel net
4
Beach seine
Uon Khow
10
Crab gill net
Mong Kdam
5
Encircling seine
Uon Houm
11
Horizontal longline
Santouch Ro Noung
6
Gill net
Mong Paehk
12
Clupea gill net
Mong Trey Kbork
(Source: DoF 2002)
The number of fishing gear units used in any given area varies according to the distribution and
abundance of natural resources, as well as socioeconomic and market conditions. For example,
dredging for short-neck clam began in Cambodia at the end of 1999 following identification of a market
for this species in Thailand. Similarly, the intensity of small trawl fisheries increased in 1997, leading to
serious concern for the longer-term sustainability of marine fish stocks and conflicts over resource use
between small-scale and middle-scale fishers.
The use of trawl nets, mackerel encircling seines, and short-neck clam dredges is most common in
Sihanoukville and Koh Kong as these areas have deep-water areas suitable for the use of these gear
types. In Kep and Kampot, traditional fishing gear, including gill nets, crab nets, and longlines, are more
commonly used.
Small-scale fisheries are those utilising traditional and/or passive fishing gear (Table 7), non-power
boats, or power boats with a capacity lower than 5 HP. Generally, these fisheries operate in inshore
waters up to 3 nautical miles from the shore and small-scale fishers are not required to pay tax.
Reversing Environmental Degradation Trends in the South China Sea and Gulf of Thailand
NATIONAL REPORT ON FISHERIES CAMBODIA 5
Table 7
Small-scale or artisanal fishing gears used in the coastal waters of Cambodia.
No.
English Name
Khmer name
No.
English Name
Khmer name
Gill net (Mong Paehk)
1
Crab gill net
Mong Kdam
3
Fish gill net
Mong Paehk
2
Shrimp gill net
Mong Bang Kear
4
Seabass gill net
Mong Trey Spong
Stationary Gear
5
Squid trap
Lop Meuk
8
Bamboo crab trap
Lop Kdam Roeusey
6
Fish trap
Lop Trey
9
Small winged set bag
Pong Pang
7
Crab trap
Lop Kdam
10
Circular net crab trap
Lop Mong Kdam
Mobile gear
11
Push net
Thnorng Os Ky
13
Drift gill net
Mong Bandet
12 Hook
Santouch
(Source: DoF 2002)
The total number of units for all types of gear commonly used in coastal Cambodia for each year from
1992 to 2001 is shown in Table 8.
Table 8
Number of units of fishing gears used in all coastal provinces and municipalities of
Cambodia combined from 1992 to 2001.
Nº Fishing
gears
Unit 1992 1993 1994 1995 1996 1997 1998 1999 2000 2001
1
Trawl
net
Set 422 442 549 634 560 460 545 654
1,516
1,310
2
Purse
seine Set 13 14 15 16 16 15 15 8 10 10
Anchovy
3
Set 13
13 9
15
10 2 - 3 5 3
encircling seine
4
Beach
seine Set 18 19 6 6 1 26 7 20 26 21
5
Encircling
seine
Set 15 - - 6 1 26 7 7 7 2
6 Gill
net
m
65,180
8,940
6,730 29,991 31,491 13,779 6,200 190,730 231,835 325,500
7
Mackerel gill net
m
3,700
9,800
36,050 12,050 15,550 131,220 140,500 198,200 178,300 64,700
Scomberomorus
8
m 31,403
31,202
59,595 7,000 51,300 66,800 85,000 140,100 148,000 184,000
gill net
9
Shrimp gill net
m
114,705
93,450
110,950 161,486 694,563 469,100 469,050 996,055 653,890 323,200
10
Crab gill net
m
43,852
32,100
37,450
95,728 580,439 393,200 426,000 538,545 961,370 635,200
11
Clupea gill net
m
500
1,200
3,000
8,850 10,250 23,900 23,900 33,600 38,000 27,500
No.
12 Trap
60 637
2,277
1,902
26,761
23,200 23,242 33,960 51,249 66,255
trap
Horizontal
No.
13
16,000 760 920
1,950
14,620
4,750 4,750 8,600
15,360
15,600
longlines
hook
(Source: DoF 2002)
1.1.2.1 Trawl (Khmer name Uon Ohs)
Two types of trawl fishing is conducted in Cambodian waters, namely demersal otter board trawling and
pair trawling. Trawl fishing was introduced to Cambodia in 1960 and was used to target a multitude of
pelagic and demersal species (MoE 1998). Non-commercial species were usually discarded, although
following the establishment of a fishmeal factory in 1993, trawl operators have begun targeting low
value fish for use in the production of fishmeal. Low-value fish is composed of small-size fish that
previously had no value in the market, non-edible species, and juveniles of economically important
species that are unacceptable in the market. During the 1980s, catches of fish in Cambodia's trawl
fisheries contained about 30 to 40% low value fish, although low value fish now represents about 60 to
65% of the total catch.
Approximately 95% of trawl fishing vessels are single trawlers. They typically only spend one or two
days fishing inshore or offshore waters during each fishing trip. Catches of target species are typically
preserved with ice. Some commercial species are kept alive. Trawl fishing is more common in
Sihanoukville (Table 9) as this municipality has a good road (national road number 4) connection with
Phnom Penh. Furthermore, it has tourist facilities, electricity and many fish processing factories,
including the fishmeal factory discussed above. Pair-trawling has been conducted illegally in
Cambodian waters by both local and foreign fishers.
Reversing Environmental Degradation Trends in the South China Sea and Gulf of Thailand
6 NATIONAL REPORT ON FISHERIES CAMBODIA
Table 9
Number of trawl nets used in the coastal provinces and municipalities of
Cambodia from 1992 to 2001 (set).
Province/
1992 1993 1994 1995 1996 1997 1998 1999 2000 2001
Municipality
Kep
- - - - - - 5 7 52
52
Kampot
31 16 5 186 186 20 30 22 89 89
Sihanoukville 227 242 276 262 244 226 296 283 656 756
Koh
Kong
164 184 268 186 130 214 214 342 719 413
Total
422 442 549 634 560 460 545 654 1,516
1,310
(Source: DoF 2002)
1.1.2.2 Purse seine/ring net (Khmer name Uon Tith)
Two types of purse seine are used in Cambodian waters. Purse seining without the use of lights is a
legal fishing method. Cambodian coastal fishers have used this gear for many years, in both shallow
water and offshore areas. The use of light luring purse seines is illegal in Cambodian waters, although
is a method used in offshore water areas of Cambodia largely by fishers from neighbouring countries.
The use of light luring purse seines in Cambodian waters is very difficult to control as fishers typically
use high-powered vessels that can easily leave Cambodian waters upon sighting Cambodian fisheries
inspection vessels. This fishing practice is legal in Thailand and Viet Nam.
Purse seines used in Cambodian waters typically have a mesh size of 1 cm. The main species caught
using this gear type are pelagic fishes such as mackerel (i.e. Rastrelliger spp.), sardines, and other
small fishes, although mackerel comprises around 80 to 90% of the total catch. Purse seines and
anchovy encircling seines are operated in the same manner but differ in mesh size.
Cambodia's purse seine fleet is based in Sihanoukville. The number of units of this gear in use has
decreased (Table 10) due to overexploitation of the target species, and the increased use of pair trawls
and light luring purse seines in the offshore waters of Cambodia. This gear type is now most commonly
used at night, and most fishers using purse seines also use other fishing gear such as trawl or gill nets.
Table 10
Number of purse seine/ring nets used in the coastal provinces and municipalities
of Cambodia from 1992 to 2001. (set)
Province/
1992 1993 1994 1995 1996 1997 1998 1999 2000 2001
Municipality
Kep
- - - - - - - - - -
Kampot
- - - - - - - - - -
Sihanoukvill
13 14 15 16 16 15 15 8 10 10
e
Koh
Kong - - - - - - - - - -
Total
13 14 15 16 16 15 15 8 10 10
(Source: DoF 2002)
Other types of seine used in Cambodian waters are listed below.
Anchovy encircling seine (Khmer name Uon Ka Koeum)
The use of anchovy encircling seines began in Cambodia during the 1960s. This gear type is used to
catch anchovy during the daytime. This gear type is mostly used by fishers based in Sihanoukville and
Koh Kong (Table 11), and is constructed using meshing similar to that of a mosquito net. Anchovy
encircling seines are now rarely used due to the declining availability of target species, and increased
prevalence of pair trawling and light luring purse seines.
Reversing Environmental Degradation Trends in the South China Sea and Gulf of Thailand
NATIONAL REPORT ON FISHERIES CAMBODIA 7
Table 11
Number of anchovy encircling seine nets used in the coastal provinces and
municipalities of Cambodia from 1992 to 2001. (set)
Province/
1992 1993 1994 1995 1996 1997 1998 1999 2000 2001
Municipality
Kep
- - - - - - - - - -
Kampot
- - - 7 7 - - - - -
Sihanoukville 1 - 1 1 1 1 - 1 3 3
Koh
Kong
12 13 8 7 2 1 - 2 2 -
Total
13 13 9 15 10 2 - 3 5 3
(Source: DoF 2002)
Beach seine (Khmer name Uon Khow)
Beach seines are widely used in shallow water or along beaches. Fishers operate this gear with non-
motorised boats or pull them along sandy beaches without the assistance of hauling devices. All beach
seines used in coastal areas of Cambodia have the same design and are effective in capturing small
fishes, including anchovy, sardine, and shrimp inhabiting shallow water areas with sandy substrate.
This fishing gear is most commonly used by fishers based in Kampot province and Kep municipality
(Table 12).
Table 12
Number of beach seines used in the coastal provinces and municipalities of
Cambodia from 1992 to 2001. (set)
Province/
1992 1993 1994 1995 1996 1997 1998 1999 2000 2001
Municipality
Kep
- - - - - - 3 3 3 2
Kampot
3 19 6 - - 22 - 13 19 19
Sihanoukville
14 - - 6 1 4 - - - -
Koh
Kong
1 - - - - - 4 4 4 -
Total
18 19 6 6 1 26 7 20 26 21
(Source: DoF 2002)
Encircling seine (Khmer name Uon Houm)
Fishers use encircling seines to capture a variety of fish species. The use of this gear relies on the
deployment of an anchor lure, or a branch of a tree, to aggregate schools of fish. This fishing gear is
used infrequently in Cambodian waters and only 2 units were recorded to be in use during 2001 (Table
13).
Table 13
Number of units of encircling seine used in coastal provinces and municipalities of
Cambodia from 1992 to 2001. (set)
Province/
1992 1993 1994 1995 1996 1997 1998 1999 2000 2001
Municipality
Kep
- - - - - - 3 3 3 2
Kampot
- - - - - 22 - - - -
Sihanoukville 14 - - 6 1 4 - - - -
Koh
Kong
1 - - - - - 4 4 4 -
Total
15 - - 6 1 26 7 7 7 2
(Source: DoF 2002)
1.1.2.3 Gill net (Khmer name Mong Paehk)
Many types of gill net with various mesh sizes are used in Cambodian waters. The use of gillnets in
Cambodia is common and they are typically used in inshore water areas to target a multitude of
species. For example, drift gill nets are set just below the surface to target and catch various pelagic
species, including mackerel, barracuda, shark, and trevally. Most gill nets are set on the bottom using
anchors or heavily ballasted leadlines to target and catch a variety of demersal species. These fishing
gears are used during the night and day, largely depending on the availability of target resources.
Reversing Environmental Degradation Trends in the South China Sea and Gulf of Thailand
8 NATIONAL REPORT ON FISHERIES CAMBODIA
Table 14
Number of units of gill net used in the coastal provinces and municipalities of
Cambodia from 1992 to 2001. (metres)
Province/
1992 1993 1994 1995 1996 1997 1998 1999 2000 2001
Municipality
Kep
- - -
- 500 700 800 1,000 1,000 4,200
Kampot
61,055 3,940 2,780 27,091 27,091 9,479 1,800 1,800 1,800 20,900
Sihanoukville 4,125 3,200
3,950 2,900 3,900 3,600 3,600 49,100 41,900 50,400
Koh
Kong
- 1,800
-
-
-
-
- 138,830 187,135 250,000
Total
65,180 8,940 6,730 29,991 31,491 13,779 6,200 190,730 231,835 325,500
(Source: DoF 2002)
Species-specific gill nets are also used in Cambodian waters. These fishing gear are typically named
according to the species they are used to target.
Mackerel gill net (Khmer name Mong Trey Kamong)
This fishing gear is designed to catch pelagic species, including mackerel, which represents more than
80 to 90% of the total catch in this gear. Article 27 of Cambodia's Fisheries Law (in Khmer called Kret
Chhbab Lek 33 Kra. Chor), enacted on 9 March 1987, prohibits the fishing for mackerel from 15
January to 31 March each year, as it is believed this is the period in which mackerel spawn. Most
fishers use more than one gear type, enabling them to target other species during the closed season for
mackerel. Mackerel gill nets are mainly used by fishers based in Sihanoukville municipality and Koh
Kong province (Table 15).
Table 15
Number of units of mackerel gill net used in coastal provinces and municipalities
of Cambodia from 1992 to 2001. (metres)
Province/
1992
1993
1994
1995
1996 1997 1998 1999 2000 2001
Municipality
Kep
-
-
-
-
- - - - -
-
Kampot
-
-
9,450
-
- - - - -
-
Sihanoukville 3,700
9,800
26,600
12,050
15,550 17,620 26,900 84,600 64,700
64,700
Koh
Kong
-
-
-
-
- 113,600 113,600 113,600 113,600
-
Total
3,700 9,800 36,050 12,050 15,550 131,220 140,500 198,200 178,300 64,700
(Source: DoF 2002)
Scomberomorus gill net (Khmer name Mong Trey Beka )
This type of gill net is widely used in Sihanoukville municipality and Koh Kong province (Table 16).
Single fishing boats use between 1 to 10km of net, depending on the size of the boat. The nets used by
smaller vessels (10-90 HP) are approximately 9 m in depth, whilst those used by larger vessels (>90
HP) range between 9 and 18 m in depth. Scomberomorus gill nets are set on the seafloor to target and
catch various pelagic fish species. The main species caught by this gill net type are Scomberomorus
spp., scads, and sharks.
Table 16
Number of units of Scomberomorus gill net used in the coastal provinces and
municipalities of Cambodia from 1992 to 2001. (metres)
Province/
1992 1993 1994 1995 1996 1997 1998 1999
2000 2001
Municipality
Kep
- - - - - - -
-
- -
Kampot
-
-
- 1,200 1,200
- 8,700
-
-
-
Sihanoukville
29,600 30,000 44,700 46,600 50,100 43,800 45,800
86,600 100,000 100,000
Koh
Kong
1,800 1,200 14,895 1,200 32,100 23,000 30,500
53,500
48,000 84,000
Total
31,400 31,200 59,595 7,000 83,400 66,800 85,000 140,100 148,000 184,000
(Source: DoF 2002)
Reversing Environmental Degradation Trends in the South China Sea and Gulf of Thailand
NATIONAL REPORT ON FISHERIES CAMBODIA 9
Shrimp gill net or Trammel net (Khmer name Mong Bang Kear)
Trammel nets are widely used throughout Cambodian waters and most commonly in Sihanoukville and
Koh Kong province (Table 17). This gear type consists of two or three panels of netting of different
mesh sizes. In a trammel net with three panels, the two outer panels typically have a mesh size of 8 to
10 cm, whilst the inner panel has a 3.8 to 4.2cm mesh size. Fishers use trammel nets to target and
catch a variety of demersal species of all shapes and sizes, as this gear type is most often set on the
seafloor and is not selective for fish size or shape. Trammel nets are considered highly effective fishing
gear for shrimp, catfish, and silver and black pomfrets.
Table 17
Number of units of shrimp gill net or trammel net used in the coastal provinces and
municipalities of Cambodia from 1992 to 2001. (metres)
Province/
1992 1993 1994 1995
1996
1997 1998 1999 2000 2001
Municipality
Kep
200
300
1,000
1,000
2,000
1,200
Kampot
9,775 4,050 1,600 13,143
13,143
10,500
9,750 4,100
4,100 27,100
Sihanoukville
102,905 86,800 109,350 135,200
168,700
145,700
145,700
121,900
104,900 104,900
Koh Kong
2,025 2,600
13,143
512,520
312,600
312,600 869,055
542,890 190,000
Total
114,705 93,450 110,950 161,486
694,563
469,100
469,050 996,055
653,890 323,200
(Source: DoF 2002)
Crab gill net (Khmer name Mong Kdam)
This is another type of gill net constructed with various mesh sizes and sufficient ballast to enable it to
be set on the seafloor of inshore water areas. Mesh sizes used range from 4 to 10cm depending on
water depth or fishing area. Nets used in shallow water areas have mesh sizes from 4 to 8 cm and 80%
of the nets have a mesh size of 6cm. Approximately 80 to 95% of total catches in this net type is
swimming crab (Portunis pelagicus). For deeper inshore waters, a mesh size of 8-10 cm is used and 80
to 90% of the catch is crab. The length of crab gill nets used in coastal areas is shown in Table 18.
Table 18
Number of units of crab net used in coastal provinces and municipalities of
Cambodia from 1992 to 2001. (metres)
Province/
1992
1993
1994
1995 1996 1997 1998 1999 2000 2001
Municipality
Kep
300
500 20,000 10,000 10,000 10,000
Kampot
34,042
11,500
21,450 30,364 30,364 10,900 24,200 40,755 27,600 27,600
Sihanoukville
7,450
18,000
16,000 35,000 38,500 87,500 87,500 219,500 204,000 225,000
Koh
Kong
2,360 2,600
30,364 511,275 294,300 294,300 268,290 719,770 372,600
Total
43,852
32,100
37,450 95,728 580,439 393,200 426,000 538,545 961,370 635,200
(Source: DoF 2002)
Clupea gill net (Khmer name Mong Trey Kbork)
This is yet another type of gill net constructed with various mesh sizes for use in shallow or inshore
waters. It has a mesh size of 3.5cm and is used to capture demersal and pelagic fishes, especially
Clupea spp.. Single small-scale fishing boats carry 150 to 200m of this gill net and it is used throughout
the year, mainly by fishers based in Sihanoukville municipality (Table 19).
Table 19 Number of units of Clupea gill net used in coastal provinces and municipalities of
Cambodia from 1992 to 2001 (metres).
Province/
1992 1993 1994 1995 1996 1997 1998 1999 2000 2001
Municipality
Kep
2,500
Kampot
5,700
7,600
7,600
Sihanoukville
400 1,200 3,000 8,850 10,250 15,900 15,900 19,900 19,900
19,900
Koh
Kong 100
8,000
8,000
8,000
8,000
Total
500 1,200
3,000
8,850
10,250
23,900
23,900
33,600 38,000
27,500
(Source: DoF 2002)
Reversing Environmental Degradation Trends in the South China Sea and Gulf of Thailand
10 NATIONAL REPORT ON FISHERIES CAMBODIA
1.1.2.4 Other (push nets, trolling, hand line, long line, trap)
Push nets (Khmer name Chhep Yun)
Push nets are recognised as a destructive fishing gear and it is prohibited to deploy this gear using an
engine-powered vessel in Cambodia. Despite this, the illegal use of push nets is widespread. Push nets
usually have a mesh size smaller than 1 cm, and are unselective in terms of the size and species of fish
caught. The use of push nets in areas of sensitive habitat areas is thought to be a key contributing
factor to seagrass loss in Cambodia.
Traps (Khmer name Lop)
There are many types of traps used in Cambodian waters. They are constructed from different types of
material. For example, crab traps (Khmer name Lop Kdarm), previously made from bamboo and very
big, are now made from netting and are collapsible. This enables a single fisher to use more than 100
traps. Bamboo fish traps (Khmer name Lop Trey) are also commonly used. This gear type is
constructed in a variety of sizes and is used in conjunction with a bamboo-fender.
Octopus and squid traps (Khmer name Lop Meuk) are used widely in Cambodia, and bamboo framed
octopus and squid traps are common small-scale fishing gear. In some areas fishers have begun
covering trap frames with netting in order to catch fish. The data recorded by the DoF does not
differentiate between trap types (Table 20).
Table 20
The number of traps (crab trap, squid trap and fish trap combined) used in the
coastal provinces and municipalities of Cambodia from 1992 to 2001.
Province/
1992 1993 1994 1995 1996 1997 1998 1999 2000 2001
Municipality
Kep
- - -
- 100 200
1,000 500
11,550
10,000
Kampot
-
- 997 151 151 2,303 1,745 1,745 1,745 6,175
Sihanoukville
- 320 1,280 1,600 1,450 1,620 1,420 2,300 2,080 2,080
Koh
Kong
60 317
151 25,060 19,077 19,077 29,415 35,874 48,000
Total
60
637
2,277
1,902
26,761
23,200
23,242
33,960 51,249 66,255
(Source: DoF 2002)
Horizontal longlines (Khmer name Santouch Ro Noung)
This is the simplest of fishing gear and requires only a line and a baited hook. The line is equipped with
hooks, which may be single or multiple, big or small, depending on the species desired. Horizontal
longlines are commonly used in Sihanoukville and Koh Kong (Table 21).
Table 21
Number of units of horizontal longlines used in the coastal provinces and
municipalities of Cambodia from 1992 to 2001 (hooks).
Province/
1992 1993 1994 1995 1996 1997 1998 1999 2000 2001
Municipality
Kep
- - - - - - - - - -
Kampot
- - - - - - - - - -
Sihanoukville
- 750 590 1,950 1,650 1,450 1,450 7,500 14,150 14,300
Koh
Kong
16,000
10 330
12,970 3,300 3,300 1,100 1,210 1,300
Total
16,000
760
920
1,950
14,620
4,750
4,750
8,600 15,360 15,600
(Source: DoF 2002)
Ranking by type of fishing gear
The relative importance of fishing gear types to fishing communities and fish production has not been
investigated in Cambodia. The Coastal Zone Management Project ranked major species by specific
fishing gears (Table 22).
Reversing Environmental Degradation Trends in the South China Sea and Gulf of Thailand
NATIONAL REPORT ON FISHERIES CAMBODIA 11
Table 22
The species targeted by different fishing gears in Cambodia.
Fishing gear
Target group
Secondary group
English Name
Khmer Name
Rastrelliger kanagurta,
Mong Trey
Mackerel gill net
Rastrelliger brachysoma
Megalaspis cordyla, Thunnus
Kamong
tonggol
Anchovy encircling
Uon Ka Koeum
Stolephorus indicus
seine
Shrimp gill net
Mong Bang Kear
Penaeus merguiensis
Scomberomorus guttatus, Thannus
Serranidae, Lutjajisdae,
thannus, Ariidae thalassinus,
Nemipteridae, Sciaenidae,
Eleuteronema tetradactilum, Liza
Drepanidae, Siganidae,
Fish gill net
Mong Trey
argentea, Valamugil ceheli, Rastrelliger
Trichiuridae, Stromatoidae,
brachysoma, Rastrelliger kanagurta,
Chirocentridae and
Megalaspis cordyla, Formio niger, Lates
Synodontidae.
calcarifer, Dasyatidae
Crab gill net
Mong Kdam
Portunus spp., Scylla serrata
Crab trap
LopKdam
Portunus spp., Scylla serrata
Squid trap
Lop Meuk
Sepioteuthis lessoniana, Loligo spp.
Fish stake trap
Mixed fish species
Santouch Ro
Orectolobidae, Carcharinidae,
Horizontal longline
Noung
Dasyatidae, Serranidae, Lutjanidae
Mixed fish, Metapenaeus spp.
Push net
Chhep Yun
Sepiolidae, Octopus spp.
Chhneang os
Shellfish dredge
Arcidae, Veneridae
khchorng
Beach seine net
Uon Khow
Mixed fish, Sepiolidae, Loligo spp.
Note: For common names of the species mentioned in Table 22 see Table 28.
(Source: MoE 1996)
Fishing vessel effort
The number of fishing vessels in Cambodian waters fluctuates according to the distribution and
abundance of natural resources and broader socioeconomic, market and political conditions.
Unfortunately, existing data does not enable the estimation of the number of fishing vessels by the
different types of fishing gears used. This is because each fishing vessel may operate more than one
type of fishing gear and they change the type of gear used according to the season. The number of
fishing vessels by coastal province and municipality is summarised in Tables 23 to 26.
Table 23
Number of marine fishing vessels in Kampot province, Cambodia.
Boats without
Boats with engines
engines and
Year
less than 5T
<10 HP
10-30 HP
30-50 HP
>50 HP
Total
Number Stock Unit
HP Unit HP Unit
HP
Unit HP Unit HP
1992 200 - - -
227
-
-
-
-
-
227 -
1993 100
0.2-0.5 64 227
35
560
-
-
2
460 101
1,247
1994 110 -
60 -
23
-
-
-
-
-
83 -
1995 - - - -
-
-
-
-
-
- - -
1996 100 -
50 -
30
-
25
-
-
-
105 -
1997 110
50 -
30
-
25
-
-
-
105 -
1998 110 110 119 810
102
1,408
-
-
-
- 221
2,218
1999 120
- 67 392
111
1,471
-
-
-
- 178
1,863
2000 136
- 67 392
111
1,471
-
-
-
- 178
1,863
2001 133 66 151 823
252
3,379
1
40
12
1,154 416
5,396
(Source: DoF 2002)
Reversing Environmental Degradation Trends in the South China Sea and Gulf of Thailand
12 NATIONAL REPORT ON FISHERIES CAMBODIA
Table 24
Number of marine fishing vessels in Sihanoukville municipality, Cambodia.
Boats without
Marine boats with engines
engines and
Year
less than 5T
<10 HP
10-30 HP
30-50 HP
>50 HP
Total
Number
Stock
Unit HP Unit HP Unit HP Unit HP Unit HP
1992 432 - - -
720
-
187
-
- -
907
-
1993 452
0.2-0.5 - -
552
52,274
163
25,273
- -
715
77,547
1994 391 - - -
656
-
177
-
- -
833
-
1995 423 - - -
646
5,900
174
27,580
- -
820
33,480
1996 180 - - -
692
6,720
167
26,211
- -
859
32,931
1997 310 - - -
654
7,265
150
24,249
- -
804
31,514
1998
237 47 198
1,208 467
6,043
23
875
162
26,630 850
34,756
1999
- - - -
855
10,736
245
34,928
- -
1,100
45,664
2000
-
- 144 894 727
10,111
33
1,223
266
37,417
1,170
49,645
2001
286 57 167
1,054 809
11,503
33
1,223
269
37,415
1,278
51,195
(Source: DoF 2002)
Table 25
Number of marine fishing vessels in Koh Kong province, Cambodia.
Boats without
Marine boats with engines
engines
Year
and less than 5T
<10 HP
10-30 HP
30-50 HP
>50 HP
Total
Number
Stock
Unit HP Unit HP
Unit
HP Unit HP Unit HP
1992
- -
- -
215
1,076
-
-
178
27,765
393 28,841
1993 330
0.2-0.5
1,018
4,120
14
348
87
6,142
111
24,551
1,230 35,161
1994 245 -
1,207 -
26
-
96
-
182
60,200
1,511 60,200
1995 -
-
260
1,820
12
237
71
5,567
138
29,752
481 37,376
1996 2,932 -
282
2,138
132
3,460
8
356
156
26,158
578 32,112
1997 71
-
2,110
22,495
311
6,097
31
1,275
140
18,855
2,592 48,722
1998 71 -
2,110 -
311
-
31
-
140
-
2,592 -
1999 -
-
1,622
9,759
562
7,921
34
1,240
225
35,972
2,443 54,892
2000 19
-
2,787
17,902
406
5,658
32
1,410
271
31,390
3,496 56,360
2001 71
-
2,518
14,723
597
8,446
93
2,920
217
25,861
3,425 51,950
(Source: DoF 2002)
Table 26
Number of marine fishing vessels in Kep municipality, Cambodia.
Boats without
Marine boats with engines
engines and
Year
less than 5T
<10 HP
10-30 HP
30-50 HP
>50 HP
Total
Number Stock Unit HP Unit HP Unit HP Unit HP Unit HP
1996 100 -
60
320
-
-
-
-
-
-
60 320
1997 110 -
60
-
-
-
-
-
-
-
60 -
1998 110
110
61
305
8
116
-
-
-
-
69 421
1999 120 -
60
300
4
60
-
-
-
-
64 360
2000 136 -
135
675
58
870
-
-
-
-
193 1,545
2001 133
66
140
700
52
780
-
-
-
-
192 1,480
(Source: DoF 2002)
1.1.3 Economic value of catch (estimated or actual)
According to the marine fisheries statistics in Table 1, as well as a survey by Tana and Todd (2002), it
can be estimated that the total volume of marine capture fisheries production in Cambodia is between
30,000 to 50,000 tonnes per year.
Seafood from Cambodia is exported to several countries in South-east Asia, including China, Thailand,
Viet Nam, and Singapore. Thus far, many kinds of seafood have been exported (Table 27).
Reversing Environmental Degradation Trends in the South China Sea and Gulf of Thailand
NATIONAL REPORT ON FISHERIES CAMBODIA 13
Approximately 15 to 25% of the total marine catch is exported annually. It should be noted that these
exports are almost exclusively unprocessed (live or chilled) products.
Table 27
Volume and values of marine fishery product exports from Cambodia in 2000.
Export
Items
volume
Total cost (US$)
Total export value (US$)
Value added (US$)
(tonnes)
Chilled shrimp meat
500
625,000
875,000 - 1,000,000
250,000 - 375,000
Chilled crab meat
500
1,500,000
2,250,000
750,000
Frozen pealed shrimp
320
2,400,000
3,000,000
600,000
Frozen squid/octopus
140
140,000
250,000
110,000
Live ornamental fish
10
19,000 - 20,000
29,000 - 31,200
10,000 - 11,200
Live mantis shrimp
10
44,000
66,000
22,000
Live short neck clam
5,000
1,250,000 - 1,500,000
2,500,000 - 2,750,000
1,000,000 - 1,250,000
Live blood cockle spat
500
220,000
475,000
255,000
Dried seaweed
120
50,000
72,000
22,000
Total
7,100
6,250,000 - 6,500,000
9,500,000 - 9,900,000
4,770,000 - 5,420,000
Note: Export values expressed as Free on Board (F.O.B.).
(Source: Tana and Todd 2002)
1.1.4 Importance of the fisheries sector in terms of employment and dependence
The coastal population of Cambodia is approximately 1 million people. Estimates of the number of
people involved in coastal and marine fisheries differ widely. One estimate is that about 40% of the
coastal population are full-time fishers and 30% are part-time fishers. Another estimate is that only 10%
of the coastal population is involved in fisheries, including processing and marketing. The majority of
fishers are operating on the small-scale or subsistence level, and these fishers do not need to be
licensed. Moreover, the majority of fisher households also have small farming plots. The civil war and
the Khmer Rouge regime severely disrupted the traditional fishing community system in Cambodia.
During this period, coastal and marine fisheries were almost completely abandoned and only rice
farming was encouraged. In recent years, there has been a significant migration of poor people from
inland rural areas to the coast. These people mostly engage in fisheries because it requires little
investment and is open access, although they typically have no experience in marine fisheries.
Information regarding the socioeconomic dependence of Cambodians on marine fisheries is scarce. In
terms of income, people in the coastal provinces have average per capita incomes slightly below the
national average of US$21 per month and somewhat above the average for the rural population
(Ministry of Planning 1999). Most households obtain income from more than one occupation, and there
are no estimates of the number of households with fishing as their main source of income.
Cambodian people traditionally prefer freshwater fish to seafood. This is true even in the coastal areas.
It has been estimated that only about 20% of products from marine capture fisheries are used for local
consumption. The shrimp fishery developed rapidly after 1981, but declined dramatically during the
1990s. Most shrimp fishers changed from using trawl nets to gill nets, although catches are continuing
to decline. Due to a lack of infrastructure and the taxation system, a large part of the marine catch in
Koh Kong province is (illegally, and hence unrecorded) exported directly to Thailand. There are very
few facilities for processing of seafood and, with the exception of a Hong Kong based company
operating a factory in Sihanoukville for production and export of frozen shrimp, most are operating on a
small scale. The shrimp factory only operates during the shrimp season. It has about 100 local
employees, mostly women. Other industries include fish-sauce production and processing of steamed
mackerels. There is also a fishmeal factory in Sihanoukville, which produces fishmeal from dried trash
fish, and most of the employees are women.
The Cambodian fishing fleet is generally low technology, and most vessels operate only in inshore
waters on one-day trips. In addition, they use only ice for storing the catch. Interest from foreign and
local private investors in Cambodia's fisheries has mostly focused on freshwater fisheries, due to the
importance and value assigned to this sector. There is very little private sector investment in
Cambodia's marine fisheries, with most vessels operated by the owner and a hired crew.
Reversing Environmental Degradation Trends in the South China Sea and Gulf of Thailand
14 NATIONAL REPORT ON FISHERIES CAMBODIA
A social survey in Kampot province found that from among 26 fishing communities, 70% of 7,001
households were involved in marine fishing. Those families could earn an average monthly income of
US$25 to 30 from fishing, and a maximum of US$64, depending on their ability, capacity, and financial
resources. Incomes are better for fishing communities in Sihanoukville and Koh Kong than those of the
Kampot social survey group, due to the availability of wider and more productive fishing grounds (Tana
and Todd 2002).
2.
SPECIES OF REGIONAL, GLOBAL AND/OR TRANSBOUNDARY SIGNIFICANCE
According to the fisheries statistics collected from provincial and municipal Fisheries Offices and the
DoF, catches are not sorted by species, although some species are sorted by higher taxon. Therefore,
it is difficult to identify trends relating to species of transboundary significance and effects of exploitation
and management. Based on existing data and information collected by the DoF, it may be concluded
that Cambodian waters are characterised by high levels of species diversity, and that this diversity is
similar to that observed for marine areas of other regional countries.
According to Tana (1999), Cambodia's commercially important fish species include about 30 species
from the Mackerel, Scad, Anchovy and Snapper groups. Those species are abundant from September
to January, whereas the peak period for Penaeus and Metapenaeus shrimps is May-August. Blue
swimming crab, squid and cuttlefish are available throughout the year. There is a diverse range of
important mollusc species in Cambodia, and the most important commercial species, such as green
mussel and oysters are mainly found in the Koh Kong estuary. Blood cockle is abundant in Thmar Sar
of Kampong Som Bay and Trapeang Ropov of Kampot Bay. Marine mammals and reptiles, including
dugong, sea turtles and dolphins, also inhabit Cambodian waters. Dugong is usually found in sea grass
beds of Kampot bay from November to December, whilst a variety of dolphin species are present
throughout the year within the region. Sea turtles, especially Hawksbill, Green, and Loggerhead turtles
are observed in inshore waters adjacent to nesting beaches.
2.1
Ranking of Importance in Terms of Landings, Value, Status and Food Security
2.1.1 Landings
As mentioned previously, data on landings is not broken down by species or species group. The total
catch has been broken down by province as shown in Tables 2 to 5. It is very difficult to make any
inferences from these data as the changes may reflect changes in effort and market demand, rather
than changes in stock availability. For example, catch of low value fish in Koh Kong province decreased
drastically in the 1990s, whereas it increased in the other provinces. This probably coincided with the
collapse of shrimp farming in Koh Kong and the declining catches may not be indicative of localised
depletion of finfish stocks in Koh Kong. Overall, finfish rank highest, followed by low-value fish, shrimps,
cephalopods, and crabs.
2.1.2 Local Market Value (local currency, year)
Informal surveys of market prices for marine fishes, crustaceans and molluscs (Table 28) have provided
values in the range of 1,000-28,000 Riels per kg for fish species, and 500-50,000 Riels per kg for
invertebrates (3,800 Riels = 1 US$). These prices only cover species used for human consumption.
Given that up to 60% of the catch is low-value fish, and further assuming an average price for edible
species of US$1 per kg, the total value of the annual marine catch is estimated at US$15 to 30 million.
This value does not include the returns for fisheries products landed outside the country (illegally) nor
the value to the subsistence or artisanal sector.
Only a few species of fish, molluscs, and crustaceans have high value in the domestic market. The
domestic market for reef fish, especially groupers, is very strong. Reef fish are also an important export
commodity. As such, reef fish catches have grown rapidly in Cambodia. Price for reef fish in
Cambodia's domestic markets is responsive to market conditions in Hong Kong, Singapore, Thailand,
Taiwan, and Japan, as these countries represent the major export markets for Cambodian seafood.
Field studies conducted in Sihanoukville municipality by Jensen & Try (2002) found over 21 fish
species, 12 bivalve species, 7 gastropod species, 10 crab species, and 1 horseshoe crab species with
high value in the domestic market (Table 28). Among the molluscs and crustaceans, cephalopods,
short-neck clam, shrimp, mantis shrimp, mud crab and swimming crab are the most valuable products
domestically, as local price is responsive to price for these products in international markets.
International demand and price for these products continues to grow.
Reversing Environmental Degradation Trends in the South China Sea and Gulf of Thailand
NATIONAL REPORT ON FISHERIES CAMBODIA 15
Table 28 The marine fishery resources of high value in the Psar Loeur Market, Sihanoukville,
Cambodia in 2002. (Approximate Exchange Rate: 3850 Riel/USD)
Fishes
Price
No.
Scientific name
Common name
Khmer name
(Riel/Kg)
1
Cromileptes altivelis (Valenciennes, 1828)
Humphack grouper
Trey Tok Ke Chrouk
24,000-28,000
2
Pomacanthus annularis (Bloch, 1787)
Bluering angelfish
Trey Me Ham Boa
23,000-25,000
3
Epinephelus coioides (Hamilton, 1822)
Orangespotted grouper
Trey Tok Ke Koa
22,000-28,000
4
Pampus argenteus (Euphrasen, 1788)
Silver pomfret
Trey Chab Sor
20,000-26,000
5
Epinephelus faciatus (Forsskål, 1775)
Blacktip grouper
Trey Tok Ke Kra horm
18,000-20,000
6
Plectropomus oligocanthus (Bleeker, 1854)
Highfin grouper
Trey Tok Ke Uch Kiev
18,000-25,000
7
Epinephelus quoyanus (Valenciennes, 1830)
Longfin grouper
Trey Tok Ke Para
11,000-16,000
8
Diagramma pictum (Thumberg, 1792)
Yellowdot sweetlips
Trey Ka chii
10,000-15,000
9
Pampus chinensis (Euphrasen, 1788)
Chinese silver pomfret
Trey Chab Khmao
4,000-6,000
10
Atelomycterus marmotatus (Bennett, 1830)
Coral catshark
Trey Chhlam Khla
2,000-3,000
11
Chiloscyllium punetatum Müller & Henle, 1838
Brown-banded catshark
Trey Chham Chhmar
2,000-3,000
12
Scarus quoyi Valenciennes, 1840
Quoy's parrotfish
Trey Sek Khiev
2,000-2,500
13
Himantura imbricata (Bloch & Schneider, 1801)
Scaly whipray
Trey Bor Bel
1,500-2,000
14
Sargocentron rubrum (Forsskål, 1775)
Redcoat
Trey Kror horm sraka tom
1,500-2,000
15
Strabozebrians cancellatus (McCulloch, 1916)
Harrowed Sole
Trey An Dat Chhek
1,500-2,500
16
Siganus virgatus (Valenciennes,)
Doublebarred spinefoot
Trey Korn Taing Tmor
1,500-2,200
17
Cephalopholis formosa (Shaw & Nodder, 1812)
Bluefined grouper
Trey Tok Ke Kroeum
1,300-1,800
18
Diploprion bifaciatum Kuhl & Van Hasselt, 1828
Yellow emperor
Trey Sek Loeung
1,100-1,500
19
Siganus argenteus (Quoy & Gaimard, 1825)
Silver spinefoot
Trey Korn Tang Pe
1,100-1,500
20
Siganus canaliculatus (Park, 1797)
Whitespotted spinefoot
Trey Korn Tang Kro Ub
1,100-1,500
21
Siganus guttatus (Bloch, 1727)
Goldenspotted spinefoot
Trey Korn Tang Phoeung
1,100-1,500
(Source: Jensen and Try 2002)
Bivalves
Price
No.
Scientific name
Common name
Khmer name
(Riel/Kg)
1
Anadara nodifera (Martens, 1860)
Nodular ark
Kreng Chhiem
1,800-3,000
2
Amusium pleuronectes (Linnaeus, 1758)
Asian moon scallop
Khchorng plate
1,800-2,500
3
Meretrix lyrata (Sowerby, 1851)
Lyrate hard clam
Kreng Sor
1,500-2,500
4
Paphia undulata (Born, 1778)
Undulate venus
Krum Kror Lar Hol
1,500-2,500
5
Scapharca inaequivalvis (Bruquière, 1789) Inequivalve ark
Kreng Chheim Meat Viech
1,500-2,500
6
Anadara binakayanensis (Faustino, 1932)
Globose ark
Kreng Chheim Mor Mis
1,500-2,500
7
Pteria penguin (Röding, 1798)
Penguin wing oyster
Krum se
1,500-2,000
8
Pinna bicolor Gmelin, 1791
Bicolor pen shell
Krum Chorb Chik
1,500-2,000
9
Meretrix lusoria (Röding, 1798)
Poker-chip venus
Ngeiv Hol
1,000-2,000
10
Perna viridis (Linnaeus, 1758)
Green mussel
Krum Cham Puch Tea
500-1,000
11
Donax cuneatus Linnaeus, 1758
Cradle or cuneate donax
Ngeav Sor
500-1,500
12
Polymesoda erosa (Solander, 1786)
Common geloina
Ngeav Puok
500-1,500
(Source: Jensen and Try 2002)
Gastropods
Price
No.
Scientific name
Common name
Khmer name
(Riel/individual)
1
Turbo marmoratus Linnaeus, 1758
Green Turbo or Green snail
Khchorng Prak
15,000-30,000
2
Haliotis asinina Linnaeus, 1758
Donkey's ear abalone
Khchorng Pav Hoeur Vieng
7,000-10,000
3
Haliotis ovina Gmelin, 1791
Oval abalone
Khchorng Pav Joeur Khey
7,000-10,000
4
Turbo petholatus Linnaeus, 1758
Tapestry turban
Khchorng Kror La Proum
3,000-6,000
5
Strombus canarium Linnaeus, 1758 Dog conch
Khchorng Choeung Muoy
2,000-4,000
6
Babylonia areolata (Link, 1807)
Maculated ivory whelk
Khchorng Pong Krouch
1,500-3,000
7
Melo melo (Lightfoot, 1786)
Indian volute
Khchorng Dong
1,500-3,000
(Source: Jensen and Try 2002)
Reversing Environmental Degradation Trends in the South China Sea and Gulf of Thailand
16 NATIONAL REPORT ON FISHERIES CAMBODIA
Marine Crabs & Horseshoe crab
Price
No.
Scientific name
Common name
Khmer name
(Riel/Kg)
1
Scylla serrata (Forsskål, 1775)
Giant mud crab
Kdam Thor
45,000-50,000
2
Charybdis feriatus (Linnaeus, 1758)
Crucifix crab
Kdam Khlar
25,000-40,000
3
Thalamita crenata (Latreille, 1829)
Crenate swimming crab
Kdam Thor Kiev
25,000-40,000
4
Charybdis anisodon (de Haan, 1850)
Two spined arm swimming crab
Kdam Dorng Kieb Sor
7,000-20,000
5
Portunus pelagicus (Linnaeus, 1758)
Flower crab or swimming crab
Kdam Se
7,000-20,000
6
Tachypleus gigas (Müller, 1785)
Traingular-tail horseshoe crab
Balang Kak
7,000-15,000
7
Charybdis natator (Herbst, 1789)
Hairy swimming crab
Kdam Neak
4,000-6,000
8
Episesarma singaporenes (Tweedie, 1936) Singapore vinegar crab
Kdam Chorr
4,000-6,000
9
Episesarma versicolor (Tweedie, 1940)
Violet vinegar crab
Kdam Chorr
4,000-6,000
10
Podophthalmus vigil (Fabricius, 1798)
Sentinel crab
Kdam Phneak Vieng
3,000-6,000
11
Ozius quttatus Milne Edward, 1834
Spottedbelly rock crab
Kdam Pkor lienn
1,500-2,500
(Source: Jensen and Try 2002)
A socio-economic survey conducted in Kep, Sihanoukville and Koh Kong found that the price of
commercial fisheries products differs from one location to another, and from one year to the next (CZM
1999). The prices for fish, shrimp and crabs, in the villages selected for the surveys, showed significant
variation due to different size and species compositions of landings. Futhermore, the prices observed
were lower than those of the actual market, because the villages involved in the survey have monopoly
position traders (Khmer and Thai) who come to buy different products. The villagers do not have other
options for selling their products. Some fishers have their own traders, as the traders and fishers can
sell or buy products from one another on a credit basis. In these cases, the fishers know that the price
they obtain for the fishery products sold to traders are lower than the prices they could obtain in the
market. However, they have little choice other than to continue on this basis as they rely on the
availability of credit. The villages involved in the study also have some small processing factories (e.g.
for fish sauce and for packing shrimps, crabmeat and fishes for export to Hong Kong, Taiwan and
Macau).
In Sihanoukville: Six villages participated in this survey, including Village I, Village II, Bot Korki, and
Koh Khchorng villages. The results from the survey are shown in Table 29. Price was not collected at
the species level.
Table 29
The prices of marine fisheries products in six villages of Sihanoukville, Cambodia
in 1998.
Fish
Mantis shrimp
Blood Cockle
Squid
Village
Crab (Riel/Kg)
Shrimp (Riel/Kg)
(Riel/Kg)
(Riel/Kg)
(Riel/Kg)
(Riel/Kg)
Village I, quarter III
600-40,000
2,000-4,000
10,000-40,000 - -
3,000-4,000
Village I, quarter I
300-30,000
-
1,800-40,000 - -
2,000-7,000
Village II, O Tress
F: 7,000-30,000
100-6,000
1,300-2,000
22,000-30,000 -
500-3,000
quarter
D: 22,000-30,000
Village I, Tomnup Rolork
200-7,000
1,000-3,300
1,000-20,000 1,000-8,000
- 500-3,000
Thmei quarter
Bot Korki
200-4,000
2,000-14,000
5,000-30,000 -
700-1,500
3,000-3,500
Koh Khchorng
300-8,000
2,000-15,000
5,000-35,000 -
1,000-2,000
-
(F: Fresh shrimp, D: Dried shrimp)
In Kep municipality: 5 villages participated in the survey, namely Kep, Angkaul, Thmei, O Krosar and
Ampeng (Table 30).
Table 30
The prices of marine fisheries products in five villages of Kep municipality,
Cambodia in 1998.
Village
Fish (Riel/Kg)
Crab (Riel/Kg)
Shrimp (Riel/Kg)
Squid (Riel/Kg)
Kep 300-3,000
F:
1,500-2,500
7,000-1,7000
2,000-3,000
Angkaul 1,000-3,000
F:
3,000-3,500 1,000-13,000
-
Thmei 300-3,000
F:
1,000-3,500 5,000-10,000 2,000-5,000
O Krosa
300-5,000
F: 1,000-3,000
800-8,000
2,000-5,000
F: 800-1,300
Ampeng 200-3,000
1,000-15,000 -
M: 3,800
(F: fresh; M: meat)
Reversing Environmental Degradation Trends in the South China Sea and Gulf of Thailand
NATIONAL REPORT ON FISHERIES CAMBODIA 17
In Koh Kong: 3 villages participated in the survey, namely Koh Sdech, Chhroy Svaiy Khang Lech and
Chhroy Phroh (Table 31).
Table 31
The prices of marine fisheries products in three villages of Koh Kong province,
Cambodia in 1998.
Mud crab
Squid
Village Fish(Riel/Kg)
Crab(Riel/Kg)
Shrimp (Riel/Kg)
(Riel/Kg)
(Riel/Kg)
Koh Sdaech
1,500- 5,000
F: 1,500-4,000
-
4,000-33,000
1,000-5,500
Chhroy Svaiy
M:4,000-7,000
800-2,500
7,000-10,000 7,000-16,000
500-10,000
Khang Lech
F: 6,000
M: 4,000-5,000
Chhroy Phroh
300-3,000
4,000-17,000 4,000-17,000 2,500
F: 2,000
Note: all expenditure in Koh Kong involved Thai Baht (1 Thai Baht = 100 Riel)
2.1.3 Status
Many species of marine living resources are under threat from human activities and natural
phenomena. These species require protection and conservation for future generations. The DoF
considers the CITES resolution as a priority. Therefore, in order to manage, conserve and protect these
resources, the DoF has qualitatively studied marine species diversity in Cambodia. However, there is
insufficient information to determine the status of most marine species in Cambodia, making the
classification of species as endangered, threatened or rare difficult. Some species of fish, reptiles,
marine mammals, and cnidarians (corals) listed in CITES have been recognised as endangered
species and are protected under national law. Several listed species occuring in Cambodian waters are
described below. Table 32 summarises the species occurring in Cambodian waters that were listed on
the IUCN Red List in 2003.
Marine reptiles
Marine reptiles were studied in Cambodian waters during the early 1940s by Bourret (1941) and Le
Poulain (1941). These studies concerned the exploitation, trade, consumption and cultural value of
these species. According to Groombridge and Luxmoore (1989), and Tana (1997), only two species of
sea turtle have been found in Cambodia, namely the hawksbill turtle (Eretmochelys imbricata) and
green turtle (Chelonia mydas). However, a field survey conducted by Try (1999) indicates that there are
five species of sea turtle in Cambodia, namely the olive ridley (Lepidochelys olivacea), hawksbill turtle
(Eretmochelys imbricata), loggerhead turtle (Caretta caretta), green turtle (Chelonia mydas), and
leatherback turtle (Dermochelys coriacea).
Recent surveys resulted in the observation of a number of marine reptiles, including crocodiles and 3
species of sea turtles (hawksbill turtle, green turtle and leatherback turtle), 2 of which (the hawksbill
turtle and green turtle) nest on Cambodia's inshore and offshore islands. The single crocodile was
observed in the coastal area around Sre Ambel. Information from local fishers suggests that this was
either the coastal crocodile species (Crocodylus porosus) or the Siamese crocodile (Crocodylus
siamensis).
Marine mammals
There have been few studies of marine mammals in Cambodia. Tana (1997) reported that there are
three species of marine mammals in Cambodian coastal waters, including the Irrawadi dolphin
(Orcaella brevirostris), Spinner dolphin (Stenella longirostris) and Dugong (Dugong dugon). According
to a recent study, there are 12 species of marine mammals of which 11 species are cetaceans (whales,
dolphins, etc.) and 1 dugong (Annex 4) (Beasley et al. 2001). Longdy (2002) mentioned that otter had
been observed in Koh Kong province, although no information exists regarding otter population size in
that area.
Marine fishes
Several species of sharks, rays and bony fishes occurring in Cambodian waters have been included in
the IUCN Red List, however, there is a paucity of information regarding their local status. Except for the
groupers, there is no specific targeting of listed species in Cambodia.
Cnidaria
According to Tana (1997), 24 species of hermatypic corals and 14 species of soft corals have been
identified in Cambodian waters. This figure is very low if compared to neighbouring countries. According
to an unpublished report of Jensen and Try (2002), the number of hard coral species is 58 (probably
Reversing Environmental Degradation Trends in the South China Sea and Gulf of Thailand
18 NATIONAL REPORT ON FISHERIES CAMBODIA
including non-hermatypic species) and 30 species of soft coral. Corals are threatened by destructive
fishing methods (dynamite), collection for sale to tourists, as well as their crushing for use in the
filtration of water used in holding tanks for live seafood species (fishes, mantis shrimps and slipper
lobsters).
Table 32
Threatened or near threatened marine species in Cambodian waters.
Occurrence in
IUCN
Species Common
name
Cambodia (Jensen &
category
Try, 2002)
Chelonia mydas
Green turtle
common, nesting
En
Eretmochelys imbricata
Hawksbill turtle
present, nesting
Cr
Caretta caretta
Loggerhead turtle
present? (unconfirmed)
En
Lepidochelys olivacea
Olive ridley
present? (unconfirmed)
En
Dermochelys coriacea
Leatherback turtle
present, rare
Cr
Batagur baska
Mangrove terrapin or Royal terrapin
present, rare
Cr
Feresa attenuata
Pygmy killer whale
present
DD
Grampus griseus
Grey dolphin
present
DD
Lagenodelphis hosei
Fraser's dolphin
present
DD
Neophocaena phocaenoides
Black finless porpoise
present
DD
Orcaella brevirostris
Irrawadi dolphin
present
DD
Sousa chinensis
Indo-Pacific Humpback Dolphin
present
DD
Stenella longirostris
Spinner dolphin
present
LR/cd
Tursiops aduncus
Indian Ocean bottlenose dolphin
(as T. truncatus) DD
Dugong dugon
Dugong present
Vu
Atelomycterus marmoratus
Coral catshark
?
NT
Carcharhinus amblyrhynchoides
Graceful shark
?
LR/nt
Carcharhinus amblyrhynchos
Grey reef shark
?
LR/nt
Carcharhinus dussumieri
Whitecheek shark
?
NT
Carcharhinus leucas
Bull shark
?
LR/nt
Carcharhinus limbatus
Blacktip shark
present
NT
Carcharhinus longimanus
Oceanic whitetip shark
?
LR/nt
Carcharhinus melanopterus
Blacktip reef shark
?
LR/nt
Chiloscyllium indicum
Slender bamboo shark
present
NT
Chiloscyllium punctatum
Brownbanded bamboo shark
present
NT
Galeocerdo cuvier
Tiger shark
present, rare?
LR/nt
Isurus oxyrhinchus
Shortfin mako
present, rare?
LR/nt
Prionace glauca
Blue shark
?
LR/nt
Pristis zijsron
Green sawfish
?
En
Rhincodon typus
Whale shark
present, rare
Vu
Scoliodon laticaudus
Spadenose shark
present
LR/nt
Sphyrna lewini
Scalloped hammerhead
present
LR/nt
Stegostoma fasciatum
Leopard shark
present
Vu
Triaenodon obesus
Whitetipped reef shark
?
LR/nt
Aetomylaeus nichofii
Banded eagle ray
present
Vu
Mobula japanica
Japanese devilray
(as Manta birostris) NT
Tæniura lymma
Bluespotted fantail stingray
present, by-catch
NT
Hippocampus kuda
Seahorses
present (+2 other species)
Vu
Cephalopholis boenack
Chocolate hind
present
DD
Cromileptes altivelis
Humpback seabass
present
DD
Source: Jensen and Try (2002) and IUCN (2003)
2.1.4 Food security (locally)
Identification of the fish species important for food security is difficult, as coastal Cambodians typically
select species of lowest market value for consumption purposes, including high value species of low
quality (not fresh). High value species, including grouper, seabass, and mackerel are mostly exported
to foreign markets. Cambodia has a richness of inland fisheries resources, which generally have lower
prices than marine fisheries products. Information regarding the contribution of marine fisheries to food
security in Cambodia is scarce.
2.2
Biology and Ecology of the Priority Species
Fish
A study identified 435 marine fish species from 202 genera and 97 families in Cambodian waters. It is
estimated that approximately 70% of the annual catch is dominated by Atule mate (yellowtail scad),
Selar crumennophthalmus (bigeye scad), Decapterus maruadsi (round scad) and other species of
Leiognathidae (pony fishes), Scombridae (tunas, mackerels) and Lutjanids (snappers).
Reversing Environmental Degradation Trends in the South China Sea and Gulf of Thailand
NATIONAL REPORT ON FISHERIES CAMBODIA 19
Elasmobranchiata (rays and sharks) represented 5.6% of the total catch. A small component of the total
catch in terms of volume included other unidentified fish species and invertebrates. Large fish including
Lutjanidae (snappers), Terapontidae (grunters), Scomberomorus spp. (king mackerels), Thunnus spp.
(tunas), Carangidae (black pomfrets), Platax pinnatus, and Rachycentron canadum (trevally) were
abundant in catches from shallow water areas (20-30m depth). Mackerels and Clupeidae dominated
catches in the northeast part, and Leiognathidae dominated in the southeast part of the Gulf. Stingray
occurred throughout the Gulf during the research period (Tana 1996).
There were 33 fish species that were common in the catches, although only 5 species were very
abundant, namely Megalaspis cordyla (hardtail scads), Scomberomorus commersoni (Spanish
mackerel), Rastrelliger brachysoma (short-bodied mackerel), Rastrelliger kanagurta (Indian mackerel)
and Atule mate (yellowtail scad). In Khmer, the above species are called trey kantuy roeung, trey
sampan, trey camong or phlathu, trey palang and trey kalang, respectively (Tana 1997). According to
Tana (1999), another 39 fish species are present in Cambodian waters. Most of these fishes are coral
and rocky reef dwelling species, such as groupers, parrot fishes and scorpion fishes. The study of
Jensen and Try (2002) identified an additional 17 fish species. A further 80 species have been collected
although are yet to have been identified.
These studies indicate that 520 fish species have been recorded in Cambodian waters, with a number
of species yet to be identified. Scientists have estimated that Cambodian waters contain over 600
species of marine fish, which is similar to that observed for other countries in the region. The fish
species recorded in the above studies are listed in Annex 1.
Echinoderms
According to a survey conducted by Tana (1997), 2 species of sea star, Choriaster granulatus and
Protoreaster nodosus, 3 species of sea cucumber, Holothuria fuscopunctata, H. edulis and H.
leucospilota, and 2 species of sea urchin, Diadema savignyi and D. setosum, are present in Cambodian
waters.
More recent surveys conducted by Jensen & Try (2002), have added several species, including: 3
species of sea star, Astropecten polyacanthus, Luidia maculata, and Craspidaster hesperus; sea
cucumbers, Holothuria scabra, H. fuscogilva, H. spinifera, Actinopyga mauritiana, Stichopus variegatus,
Acaudina molpadioides, Bohadschia marmorata and Actinopyga miliaris; and 5 species of sea urchin, 2
irregular, 1 of which is the sand-dollar, Laganum decagonale, and 3 regular as yet unidentified species.
The total number of echinoderm species recorded in Cambodian waters includes 5 species of sea star,
11 species of sea cucumbers, and 7 species of sea urchins, of which 4 species have not yet been
identified.
Crustaceans
According to Tana (1997) and Jensen and Try (2002), about 50 species of crustaceans are present in
Cambodian waters. Of these, 10 species are shrimps, Penaeus canaliculatus, P. semisulcatus, P.
merguiensis, P. latisulcatus, P. monodon, P. japonicus, Metapenaeus affinis, M. spinulatus,
Parapenaeopsis sculptilis, Parapenaeopsis sp., 1 stomatopod, Miyakea neap, and one slipper lobster,
Thenus orientalis. Approximately 30 species of crabs are present and annex 2 contains a list of these
species. There are 4 species of barnacles, Lepas sp., Tetraclita squamosa, and 2 unidentified, and
several species of hermit crabs.
Molluscs
About 250 species of this group are present in Cambodian waters, although the "Survey of Coastal
Marine Living Resources" and "Tropical Marine Mollusc Programme (TMMP)" identified only 170
species. Of these, about 100 were gastropods, 50 bivalves, and 8 cephalopods. Early collections of
shelled molluscs listed 165 species of gastropods and 63 bivalves (Morlet 1889; Crosse and Fischer
1892; Fischer and Fischer-Piette 1972). Lynge (1909) identified another 360 species of bivalves as
being present in northern Gulf of Thailand waters. However, the number of species identified by the
latter study may be somewhat inflated as new species were described according to a single, very small
shell valve. Mollusca are probably the most well documented marine group in Cambodia. Several of the
very old collections are still present in museums, including the National Museum of Natural History in
Paris, France. Giant clams, Tridacna squamosa and T. gigas, require protection from illegal fishing in
Cambodian waters. Similarly, the large gastropod, Cassis cornuta (horned helmet), is very common in
shell shops. However, it is not possible to determine if fishers collect this species in the dead (shell-
only) or live form. Annex 3 contains a list of mollusc species identified in Cambodia's marine waters.
Reversing Environmental Degradation Trends in the South China Sea and Gulf of Thailand
20 NATIONAL REPORT ON FISHERIES CAMBODIA
Seaweeds
Sixteen species of seaweed have been recorded in Cambodia, of which 1 species has been imported
from Malaysia for culture (Jensen & Try 2002). At present, seaweed culture is a very popular marine
activity. Local intermediaries collect the entire production and export it to Malaysia.
Only 12 of Cambodia's seaweed species have been identified. These include Caulerpa lentillifera,
Caulerpa racemosa, Halimeda sp., Ulva reticulata, Dictyosphaeria cavernosa, Enteromorpha sp.,
Hormophysa cuneiformis, Padina sp., Sargassum polycystum, Turbinaria conoides, Turbinaria
decurrens and Turbinaria ornata. The cultured species is Eucheuma cottonii.
Seagrasses
Nine species of seagrasses are present in Cambodian waters, including Cymodecea rotundata,
Cymodocea serrulata, Halodule pinifolia, Halodule uninervis, Ruppia maritima, Syringodium
isoetifolium, Thalassia hemprichii, Halophila ovalis and Enhalus acoroides (Jensen and Try 2002).
Among these, Halodule pinifolia is an important food source for dugong (Tana 1997). Seagrass beds
exist in sheltered estuaries found along the coastline of Kampot province, and near the mouths of the
Steung Hao and Andong Tuk streams in Kampong Som Bay.
2.2.1 Pelagic species
According to Ibrahim (1999), Cambodia's pelagic fisheries began modestly, using simple fishing gears
such as bamboo stake traps and set bag nets in inshore waters. In 1925, the Chinese purse seine was
introduced to Southeast Asian countries, specifically Thailand, for catching the Indo-Pacific mackerel.
This gear quickly gained popularity in the region and was modified to become the Thai purse seine in
Thailand and purse seine/ring net (Khmer name Uon Tith) and anchovy encircling seine (Khmer name
Uon Ka Koeum) in Cambodia. Since the early 1960s, marine fisheries in the region have rapidly
modified fishing gear, introduced new fishing technology, and improved fishing vessels. Onshore
improvements to facilities and infrastructure have supported these developments. So far, Thailand's
marine fishing sector has developed more rapidly than Cambodia's, partly due to the serious problems
experienced throughout Cambodia's civil war.
Pelagic fisheries intensified during the 1970s and early 1980s, mostly due to the use of luring purse
seines and the 1973 discovery of fishing grounds for round scads in the central part of the Gulf of
Thailand. The use of large purse seines for catching coastal tunas and hard-tail scads in deeper water
areas began in 1982. The use of light luring purse seines to target anchovies began in 1983. It was not
until later that other more modern fishing gears were introduced (Ibrahim 1999). However, the use of
some of these modern fishing gears is illegal in Cambodian waters according to Cambodia's Fisheries
Law (in Khmer called Kret Chhbab Lek 33 Kra. Chor).
The total catch of pelagic fishes in the Gulf of Thailand increased from 63,000 tonnes in 1971 to
676,000 tonnes in 1994. The annual catch increased rapidly from 1971 to 1977, followed by slight
declines in landings until 1980. After 1980, landings increased gradually over time, reaching 676,000
tonnes in 1992. The small decline in pelagic fish catches observed for the few years after 1977 was a
result of a redirection of fishing effort, and increased catches of round scads and sardines by light luring
purse seines. Generally, the recovery of Indo-Pacific mackerel stocks, combined with the introduction of
anchovy encircling seines and regular purse seines for catching anchovies and coastal tunas, were the
key factors contributing to the large increases in total landings of pelagic fish from the Gulf of Thailand
(Ibrahim 1999).
The fisheries statistics of the DoF do not separate pelagic fish landings by species or group of fish.
Therefore, the accurate interpretation of DoF data, and that from other studies, is difficult. Some
investigations have indicated that five species of pelagic fish are often present in trawl catches,
including hard-tail scads (Megalaspis cordyla), yellow queenfish (Scomberoides commersonnianus),
short-bodied mackerel (Rastrelliger brachysoma), Indian mackerel (Rastrelliger kanagurta) and
yellowtail scad (Atule mate) (EVS Environment Consultants 1996).
Studies of the fisheries biology of Cambodia's commercially important fish species, conducted from
1983 to 1986, provide some information about the dynamics of pelagic fish species in Cambodian
waters (Tana 1996). The following is a summary of this information.
Reversing Environmental Degradation Trends in the South China Sea and Gulf of Thailand
NATIONAL REPORT ON FISHERIES CAMBODIA 21
Yellowtail scad (Atule mate) (Khmer Name Trey Kaun Kum)
Yellowtail scad (Atule mate) spawns throughout the year, however, a peak was observed during May
1985 (58.7% of the females in spawning condition) and in April 1986 (26.6% of females in spawning
condition). Sex ratios of this species are observed to vary distinctly, such that during December the
proportion of females is higher than males (1.38:1) and during May the sex ratio is equal. For the
remainder of the year, the proportion of males tends to be higher than females (with ratios ranging from
1:1.1 to 1:1.4).
Stomach content analyses indicate that this species prefers to feed on fish (anchovies and other fish
fingerlings) and squid. Yellowtail scad have been observed to feed most actively from September to
December, and least actively from July to August (Table 33).
Table 33 The percentage fullness of yellowtail scad (Atule mate) stomachs caught in
Cambodian waters from 1983 to 1986.
Fullness of the stomach
Period (Month)
Conclusion
(Food in the stomach)
Jul. to Aug. 1983
24 % full
Inactive feeding as stomachs only 25% of full.
Feb. to Apr. 1985
54 % full
Active feeding as stomachs 50%full.
May to Jun. 1985
83 % full
More active feeding as stomachs over 75% full.
Sep. to Dec. 1985
Full (maximum)
Very active feeding as stomachs 100%full.
Note: All fish were obtained from trawl net catches taken during both the day and night.
(Source: Tana 1996)
Selar scad (Selaroides leptolepis) (Khmer Name Trey Si Ki)
The majority of selar scad spawn from February to April, as 54.4% of mature female specimens
collected during this period were ripe and another 24.3% were spent. From May to June, approximately
21.3% of mature females were ripe, and by July, only 4% of collected mature females contained eggs
and 14% had recently spawned. Selar scad reached an early stage of maturity during September to
December in 1985. The sex ratio observed for this species is nearly equal.
Hard-tail scad (Megalaspis cordyla) (Khmer Name Trey Kantuy Roeung)
Surveys of the hard-tail scad in April 1985 found this species in two different habitats. The study
concluded that juvenile fish prefer to inhabit shallow water due to the domination of juveniles in catches
within this habitat type. In its adult form, this species prefers to inhabit deep-water areas (>40 m).
Juveniles were not caught in water deeper than 30m. This may have been due however, to the
selectivity characteristics of the sampling equipment used.
Stomach content analyses identified a dietary preference for fish (fish fingerlings) and squids. Selar
scad were not observed to be feeding actively from July to August 1983, as gonad development during
this period was at stage II and most specimens had empty stomachs. This species was observed to be
feeding actively from September to December 1985 and February to April 1986, as stomach content
analysis of fish caught during these periods indicated that most fish had full stomachs.
Round scad (Decapterus maruadsi) (Khmer Name Trey Kuon Kum)
The proportion of mature females was 18% in 1983, 6.5% from September to December 1985, and
40.2% from February to April 1986. Sex ratio (male:female) was 1.68:1 in 1983, 1:1.58 in 1985, and
1.28:1 in 1986. Stomachs were half-full during July 1983 and nearly full in September to December
1985. Analyses identified fish fingerlings and zooplankton as the preferred dietary items for this
species.
Jack, Cavalla (Alectis kalla) (Khmer Name not available)
The gonads of this species were at stage II to III from October to December, and by mid-December,
only 6% of specimens were at stage I. In 1985, this species spawned from May to June. During this
period, 54% of mature females were at stage I or II, and 5.8% were recently spent or at stage VI. The
sex ratio at this time was 1.5:1.
The stomachs of this species were full from February to April 1986. The main food items identified
during stomach content analysis of fish collected from May to June 1986 were detritus, phytoplankton,
and copepods.
Trevally (Alectis indicus) (Khmer Name Trey Chen Chas)
Analysis of the stomach contents of specimens of this species collected from May to June 1986
indicated a dietary preference for zoobenthos (small crabs were most abundant).
Reversing Environmental Degradation Trends in the South China Sea and Gulf of Thailand
22 NATIONAL REPORT ON FISHERIES CAMBODIA
Golden toothed trevally (Scomberoides lysan) (Khmer name Trey Kalang)
Studies of this species from February to April 1986 revealed that all the females were at the spawning
stage with an equal male to female sex ratio.
2.2.2 Demersal
species
Demersal fishes are not as significant as pelagic species in terms of their contribution to total fisheries
production in Cambodia. Stingrays are the only demersal fishes listed separately in the official statistics.
However, coral reef fishes have high economical value. Traps and illegal fishing methods, involving
explosives or poisons, are mostly used to catch these species. Fishers use demersal trawls to catch
other important demersal fishes, including snappers and threadfin bream.
2.2.3 Commercially
exploited
invertebrates
Crustaceans
Fisheries for shrimp in Cambodia have high economic value. Prior to 1989, annual production of shrimp
was approximately 10,000 tonnes. Since then, shrimp catches have declined dramatically due to
degradation of habitats and overfishing. Metapenaeus affinis and M. spinulatus comprise around 60%
of the total catch. A large proportion of the shrimp catch is exported in peeled and frozen form. There is
also a considerable fishery for crabs, especially mud crab and swimming crabs. Most of the crab
consumption occurs locally. The fishery for mantis shrimp and slipper lobster is small, although
economically important.
Molluscs
There is an increasingly large fishery for cephalopods in Cambodia. Bigfin reef squid (Sepioteuthis
lessoniana), cuttlefish, and octopus are caught in traps. The capture of Lologinid squid occurs in trawl
nets. Light luring is a banned fishing method in Cambodia, therefore a majority of the squid landings
represent by-catch from pelagic fisheries. Eggs of bigfin reef squid are collected for use as "bait" in
squid traps. The presence of these eggs has led scientists to believe that this species spawns in
Cambodian waters. Dredging and the hand-collection of bivalves are also important fishing methods.
Fishers operate dredges from small "long-tail" canoes, with the target species often representing less
than 50% of the total catch. Women are mostly involved in the hand collection of molluscs. Rock
oysters are an important bivalve species and sold mostly to local restaurants. Some gastropod species,
including abalone (Haliotis spp.) and Strombus spp., are important for human consumption, although
collection of these species is mostly for ornamental purposes (Try 2001). Subsistence fishers use
almost any type of bivalve or gastropod for food (Try 2001).
3.
CURRENT STATUS & THREATS
3.1
Status of the Fishery in Terms of CPUE
So far, there have been no fish stock assessments conducted in Cambodian waters. However,
comments from fishers and the results of several related studies indicate that the threat of overfishing in
the Gulf of Thailand is now at a critical stage.
The collection of catch per unit effort (CPUE) data for Cambodia's marine fisheries does not occur.
Thus, the status of marine fisheries in terms of CPUE is unknown. Surveys from neighbouring
countries, such as Thailand, may give some indication. The results of long-term systematic surveys
conducted by the Department of Fisheries (Thailand) indicate that daytime CPUE in the Gulf of
Thailand declined from 290kg/hr in 1963 to 50kg/hr in 1993. CPUE of night time fishing operations
declined almost 60% from 1976 to 1995 (Ibrahim 1999). Results of studies in Viet Nam also highlight
rapid declines in yield (Ibrahim 1999). However, the scale of operation and types of fishing gears used
differ between Thai and Cambodian fisheries. Hence, Cambodia has decided not to use data available
for Thai fisheries in the Gulf of Thailand to make inferences about the Cambodian fisheries situation.
It is possible to make assumptions about CPUE from socioeconomic surveys and comments from
fishers. For instance, a socio-economic survey conducted by CZM Project in Kep from 1996 to 1998
(CZM 1999a) indicated that there was a significant reduction in abundance of some living marine
resources. The survey found that a reduction in the abundance of shrimp had occurred, such that the
capacity of a typical small fishing boat to catch shrimp had declined from 20kg of shrimp per night to 5
kg per night. In O Krosa village, some species including smaung fish, white sparrow fish, mantis shrimp
and other species of crustaceans have disappeared or become very rare. Similarly, the survey
indicated that it is now very difficult to find mantis shrimp in waters adjacent to Angkaul village. Mantis
shrimp and many species of crabs have disappeared from these areas.
Reversing Environmental Degradation Trends in the South China Sea and Gulf of Thailand
NATIONAL REPORT ON FISHERIES CAMBODIA 23
3.2
Status of Fish Stocks Based on Historical Review of Landings and CPUE
In Cambodia, as in other countries of Southeast Asia, marine capture fisheries are multi-species and
multi-gear. The main fishing gears used are trawls, purse seines, and gillnets. The operation of these
gears mostly occurs in inshore waters. Unfortunately, a paucity of information regarding fish stocks and
CPUE in Cambodia makes it difficult to conduct any historical review of the status of fish stocks.
Results of research conducted from 1983 to 1986 indicate that the total stock of marine fishes in
Cambodia's EEZ is approximately 500,000 tonnes (Tana 1996; 1999). There have been no further
studies of fish stocks in Cambodia, however, total catch is recorded each year by DoF. This information
reveals that production in Cambodia's marine capture fisheries increased from 7,247 tonnes in 1986 to
39,900 tonnes in 1990. Catches then declined from 36,400 tonnes in 1991 to 29,800 tonnes in 1997.
Catches recovered to 32,100 tonnes in 1998, and then increased rapidly to 42,000 tonnes in 2001. No
CPUE data is available for review.
Scientific investigations into Cambodia's commercial fisheries from 1983 to 1986 identified changes in
the species composition of catches during that period (Tana, 1996). It is unclear whether information
regarding low-value fish was recorded during this period. Stingrays and octopus are ubiquitous in
Cambodian waters.
Yellowtail scad (Atule mate)
This is the main species and has a wide distribution in Cambodian marine waters. It was observed to be
most abundant from May to October in 1985 (7.3 to 12.6% of the total catch). In comparison, the
abundance of this species was much lower from December 1985 to April 1986 (3.2 to 4.4% of the total
catch). Furthermore, variations in the length frequency distribution of this species in catches are
interesting. During 1985, 74.6% were 20 to 23cm in length from May to June, 71.1% were 17 to 21cm in
length from July to August, 51% were 20 to 23cm in length from September to December, and from
February to March 1986, 7% were 13 to 20cm in length. The weight of individuals of this species in
catches varies from 80 to 250g, however, the most common weight range is 86 to 113g.
Selar scad (Selaroides leptolepis)
This species comprised 6.8 to 12.7% of the total catch from February to April, and 1.8 to 3.2% during
the winter. This species is common in shallow water and very rare in deep water.
The length of this species in catches varied from 8 to 14cm in July 1983, 4 to 17cm during May to June
1985, 7 to 13cm during September to December 1985, and 6 to 16cm during February to April. During
this latter period, 63.2% of this species were in the 11 to 13cm size range. The weight of individuals
varied from 6 to 70g over the whole study period.
Hard-tail scad (Megalaspis cordyla) (Khmer name Trey Kantuy Roeung)
This study indicated that hard-tail scad comprised 4.9% of the total catch in September 1985, 3.1% of
the total catch in April 1986, 2.2% of the total catch in May 1985, and was very rare (0.1% of the total
catch) in July 1983.
The length of this species ranged from 14 to 21cm from July to August 1983, and their weights ranged
from 50 to 120g. In May to June 1985, lengths ranged from 21 to 36cm, although 75% of individuals
were from 21 to 28cm, with weights between 100 to 480g. During September to December 1985,
lengths ranged from 14 to 28cm, and from February to April 1986, from 19 to 28cm, with individual
weights from 60 to 400g.
Round scad (Decapterus maruadsi) (Khmer Name Trey Kuon Kum)
Between 50 to 68% of round scad were caught in water deeper than 27m and it was most abundant at
depths of 40 to 50m. The size of fish ranged from 11 to 23cm, although fish from 14 to 17cm dominated
catches (71.2%) during July 1983, whilst fish from 16 to 20 cm dominated from 1985 to 1986. The
weight of individual fish ranged from 20 to 180g during 1983 and 1985.
Jack, Cavalla (Alectis kalla)
This species was caught in depths less than 30m and was most abundant from October to December
1985 in southern Cambodian waters. Generally, catches of this species were low during February, with
a catch rate of 0.008 tonnes/hour of trawling close to Kampong Som Bay. In 1986, catch rates reached
0.15 tonnes/hour. During other months of the year, catch of this species was insignificant. Lengths
ranged from 10 to 15 cm during February to April 1985 and May to June 1986.
Reversing Environmental Degradation Trends in the South China Sea and Gulf of Thailand
24 NATIONAL REPORT ON FISHERIES CAMBODIA
Trevally (Alectis indicus) (Khmer Name Trey Chen Chas)
This species occurred at depths of less than 20m in February. In April, the fish moved to depths
between 20 and 27m, and the catch rate observed was approximately 0.014 tonnes/hour of trawling.
During 1985, 1.4% of the total catch occurred at a depth of 35m, with an average catch rate of 0.01
tonnes/hour of trawling.
Lengths ranged from 20 to 104cm, and for the group between 63 and 85 cm, individual weights ranged
between 3.1 and 8.5kg.
Golden toothed trevally (Scomberoides lysan) (Khmer name Trey Kalang)
Golden toothed trevally comprised around 1% of total catches made during the rainy season at depths
of 30m. Average CPUE was 0.008 tonnes/hour trawling. In February 1986, during resource surveys
conducted in waters less than 20 m deep, this species comprised 2.3% of the total catch, with an
average CPUE of 0.012 tonnes/hour. In April, catch rates were highest in depths from 20 to 28m, with
an average catch rate of 0.014 tonnes/hour trawling. Lengths ranged from 32 to 120cm, and weights
ranged from 2.7 to 9kg for individual fish in the size group between 67 and 90cm.
3.3 Threats
3.3.1 Current
Stock depletion
Many indicators are available to identify the problem of overexploitation and threats to marine fisheries
resources. These include increases in fishing effort, decreases in the annual catch, changes in the
species composition of catch, and increases in the percentage of low-value fishes in the catch.
Scientists know the causal relationships between these indicators and overfishing, however, there
remains a need to extend such information to the general community.
Many fishers in Cambodia do not realise that high levels of fishing effort can lead to negative outcomes,
including stock depletion, instead blaming such situations on mistakes made by government or
managers. However, it is becoming clear that both fishers and government officials have played
important roles in the creation of fisheries problems. In Cambodia, questions such as "why is the
production of fish decreasing?" and "how can we solve this problem?" are frequently asked by fishers
and members of the general community.
Typical answers to these questions in Cambodia have referred to fishers breaking fisheries laws, and
the use of illegal fishing gears. However, changes in the distribution and abundance of natural
resources, such as fisheries, are often a result of natural variation in the environment, as well as the
impacts of fishing and other human activities. Examples of phenomena driving this natural variation
include climate change, global warming, El Niño, and sea level rise. According to Ibrahim (1999),
human activities with potential to negatively effect fisheries and other resources include:
a. destruction of habitats for spawning, nursing and feeding due to rapid development of costal
areas and development of new, efficient fishing technology and population growth;
b. land and sea-based pollution that tends to reduce fish recruitment and increase mortalities; and
c. over-capitalisation and exploitation of coastal marine living resources.
As highlighted previously, there is a paucity of information regarding the status of Cambodia's marine
fisheries resources. There are concerns about stock depletion in the marine fishery, although with no
substantial stock assessments conducted, the status of the resource is largely unknown. Catch
statistics have varied substantially, reporting 1,200 tonnes in 1980, 39,900 tonnes in 1990, and 29,800
tonnes in 1997. While the DoF collects harvest data from commercial fisheries, there are concerns
relating to the accuracy of these figures, as they do not include catches from illegal fishing vessels, both
foreign and domestic. Similarly, they do not include catches from fishing vessels that did not land their
catches at Cambodian ports. Finally, there are no reports of the amounts caught by subsistence fishers.
The main threats to fisheries production in Cambodia are habitat destruction, overfishing, and pollution,
which have led to the rapid decline of coastal fish stocks, and the degradation of the marine
environment and other coastal resources. Increased fishing effort, as evidenced by increasingly high
numbers of large fishing boats, has contributed to the recent trend of increasing annual catches.
Reversing Environmental Degradation Trends in the South China Sea and Gulf of Thailand
NATIONAL REPORT ON FISHERIES CAMBODIA 25
Habitat destruction
According to the 1982 United Nations Convention on the Law of the Sea (Law of the Sea Convention),
adopted in Montego Bay, Jamaica on 10 December 1982, Cambodia has rights and responsibilities for
the management and use of marine resources within the Cambodian Exclusive Economic Zone (EEZ).
Cambodia's Fisheries Law (in Khmer called Kret Chhbab Lek 33 Kra. Chor), enacted on 9 March 1987,
aims to reflect the provisions of the Law of the Sea Convention. Article 28 of Cambodia's Fisheries Law
prohibits trawl fishing in waters less than 20 m deep, as these areas typically contain fragile and critical
habitats. In addition, sections D and E of Article 18 prohibit the destruction or cutting of inundated or
mangrove forest, and the transport or sale of inundated or mangrove forest wood.
However, despite Cambodia's Fisheries Law, Royal decrees, sub-decrees and proclamations for
protecting ecosystems and habitats, many illegal activities still take place. According to Tana (1997),
mangrove forests cover an area of 85,100ha, of which approximately 63,700ha are located in Koh Kong
province, 13,500ha in Sihanoukville and 7,900ha in Kep and Kampot provinces (Table 34). So far, 74
species belonging to 35 families and 53 genera of mangrove trees have been identified. From 1993 to
1996, the exploitation of Cambodian mangrove forests for charcoal and firewood production, as well as
the construction of shrimp, salt, and rice farms, was common. Rapid exploitation of mangrove forests
for firewood and charcoal took place during the war after 1979. The introduction of intensive shrimp
culture in Cambodia from 1993 to 1996 resulted in the construction of aquaculture ponds with an
approximate area of 1,000 ha in the mangroves of Koh Kong and Kampot provinces (Table 34).
Table
34 Estimates of mangrove forest degradation in the coastal provinces and
municipalities of Cambodia up to 1996.
Area that has been cleared
Province/
Total area (ha)
Degradation due to firewood
for shrimp farms and other
municipality
(LANDSAT, 1994)
and charcoal production (%)
purposes (ha)
Koh Kong
63,700
1,500
60 - 70
Sihanoukville
13,500
800
35 - 40
Kampot and Kep
7,900
1,000
50 - 60
Total
85,100 3,300
48 - 57
(Source: Tana 1997)
Trawl fishing, push nets, and grouper fishing activities threaten coral reef and seagrass habitats in
Cambodia. Coral reefs are amongst the most diverse marine ecosystems. So far, reductions in species
diversity and the abundance of reef fishes because of overfishing are unstudied in Cambodian waters.
Fishers claim that they have not yet detected a decline in fish abundance in coral reef areas. At
present, approximately 80 to 90% of marine fishing occurs in coastal or inshore areas. Socioeconomic
circumstances, including the financial situation of most fishers, restrict the adoption of new technologies
and the development of offshore fisheries. Similarly, investors focus on freshwater fishing lots and the
dai fishery, and investment in marine fisheries is very rare.
Increases in fishing effort
Historically, consideration was rarely given to small-scale fisheries in Cambodia. Observers never
envisaged serious problems with this type of fishing. However, due to improvements in the efficiency of
fishing gear, living standards and infrastructure, rapid expansion of middle-scale fisheries has occurred.
Many inshore fisheries are facing problems associated with overexploitation and degradation of coastal
habitats.
Recently, there appears to have been a shift in the type of vessels used in marine capture fisheries.
Traditionally, most fishers were small scale, using small, non-motorised vessels in inshore waters.
However, a significant shift from the use of these smaller vessels, to slightly larger motorised vessels,
capable of fishing further offshore and taking larger catches of fish, has occurred. The number of small,
motorised vessels (<30 HP) increased from about 1500 in 1993 to almost 4500 in 2000 (APIP 2001).
There is currently no cap in place on fishing effort for subsistence fishers or licensed small and middle
scale fishers. As such, there appears to be a growing number of fishers participating in the marine
fishery and this is likely to increase further with increases in coastal populations. The low initial
investment and open access nature of fisheries attracts impoverished people to begin fishing for food
and income.
Reversing Environmental Degradation Trends in the South China Sea and Gulf of Thailand
26 NATIONAL REPORT ON FISHERIES CAMBODIA
Illegal fishing
Illegal fishing in Cambodia consists of foreign vessels fishing in Cambodian waters without a licence
and/or using illegal fishing gear. In addition, the use of illegal fishing gear by Cambodian fishers is
becoming more common. The Royal Government of Cambodia prohibits the use of artificial light and
pair trawls to fish in marine waters, although foreign fishers utilise these fishing gear and practices in
offshore waters.
The use of trawls is prohibited in waters less than 20m deep, yet reports of fishers trawling close to
shore are common. Use of illegal mesh sizes in gill nets, and dynamite and cyanide fishing methods are
also common. Illegal fishing activities have led to conflicts within fishing communities, some resulting in
violence. There are many reports of fishers (both foreign and local) operating on an unlicensed basis.
The DoF has very few resources for enforcement and very little capacity to patrol offshore. The size
and seaworthiness of the government vessels is inadequate. The lack of consistent enforcement
between the DoF and other coastal government agencies is resulting in inequitable access to fisheries
resources, community conflicts, reduction in fish stocks through overfishing, and habitat degradation by
allowing fishing activities to continue in areas of sensitive marine habitats.
Effects of trawling
Trawling is a very destructive fishing method in Cambodia. Trawl nets disrupt benthic communities,
especially in areas where the intensity of trawling is high. Trawl fishing is typically not selective for
species or sizes of fish. As a result, trawl vessels are responsible for taking substantial catches of
unwanted catch (bycatch). Whilst fishers in the Sihanoukville area sell unwanted bycatch and low-value
fish to the fishmeal factory in Sihanoukville, fishers from other coastal areas continue to discard
unwanted catch.
Trawlers are also capable of catching large marine mammals and sea turtles. Bycatch is thought to be
one of the main threats to Cambodia's marine mammals and reptiles. Accidental catches of these
species are usually discovered after the animal has died. Other countries have been testing devices to
reduce unwanted capture of sea turtles with some success. However, it is not a requirement for
Cambodia's trawl vessels to be equipped with devices such as Turtle Excluder Devices (TEDs). The
TEDs currently used in the region are not suitable for use aboard Cambodia trawl fishing vessels
because the boats are too small.
Bycatch
A large proportion of fish caught in Cambodia can be categorised as bycatch or low-value fish. Until
recently, unwanted and low-value catch was either discarded at sea or left at the landing-site for people
to rummage through. A fishmeal factory is now in operation, and fishers can sell almost all trash fish to
this factory. In the past, the decomposition of unwanted fish at landing sites contributed to localised
water pollution problems, however, most large landing sites now have areas where fish are set aside for
collection by fishmeal factory trucks.
Ghost fishing
Fishing nets lost at sea often continue to catch fish. This is referred to as ghost fishing. Such nets are
considered a threat to Cambodia's fisheries resources, especially in coral reef areas, where torn nets
are often abandoned. It is estimated that small scale gill net fishers lose about 10 to 20km of
monofilament net/year. Endangered species such as sea turtles can be caught in these unattended
fishing nets.
3.3.2 Potential
The collapse of Cambodia's fisheries
Cambodia is experiencing increases in competition for access to fisheries resources, largely due to
increases in the number of fishers, improvements in gear technology, and the upgrading of fishing
capacity. A continued uncontrolled harvest will most likely lead to the decline and possible collapse of
Cambodia's marine fisheries.
Population growth, pollution and tourism development
Apart from overexploitation of resources, Cambodia's coastal and marine ecosystems face a number of
threats. Population growth in coastal areas is higher than in other parts of the country. This is in part
caused by migration to the coast from further inland. Most fishing communities discharge all sewage
and waste into the sea in an untreated form. This is not only a threat to coastal ecosystems, but also to
human health and the safety of fisheries products.
Reversing Environmental Degradation Trends in the South China Sea and Gulf of Thailand
NATIONAL REPORT ON FISHERIES CAMBODIA 27
There is limited water quality monitoring in coastal areas. Runoff from agricultural land and wastewater
from coastal villages probably contains high concentrations of nutrients and possibly pesticides. Since
there is limited sewage treatment, industrial wastewater is often discharged directly into the sea, or
indirectly via streams. Industrial wastewater may contain heavy metals as well as toxic organic
compounds. So far, there are few large industrial activities in the coastal areas of Cambodia. However,
there is a large oil refinery and storage facility near Steung Hao in Kampong Som Bay, Sihanoukville.
The port of Sihanoukville may also be a pollution hazard. Marine anti-fouling paints leak toxins into the
water, which can cause reproductive disorders such as imposex in many marine organisms. Ballast
water discharged in or near the port may contain alien organisms, which may be a threat to local
communities. At present, development of the port is taking place and it will soon double in size. This
involves significant land reclamation, with associated potential for the suspension of particulate matter
and its transportation outside the port area, where deposition may damage coral reefs and benthic
communities.
Tourism development may also present significant threats. Many hotels are located along the waterfront
and have inadequate facilities for wastewater treatment. Restaurants require increased supplies of
fresh seafood, and tour-boat operations and diving activities may have negative impacts on coastal
ecosystems. However, this tends to be self-regulatory in the sense that tourism benefits decrease if the
environment becomes degraded. In addition, the creation of new job opportunities in the tourism sector
may assist in the reduction of fishing effort if fishers can earn more money in tourism related
employment than from fishing.
4.
HABITATS & AREAS OF IMPORTANCE IN THE MAINTENANCE OF EXPLOITED FISH
STOCKS
The recent surge in development and human settlement along Cambodia's coastline has caused
concern within the Ministry of Environment and amongst biodiversity scientists regarding coastal and
marine habitat degradation. These concerns focus on the environmental impact of logging inundated
forests and mangroves, illegal and destructive fishing, increased inshore fishing pressure, and clearing
of mangrove forests for shrimp farms. The efficacy of existing coastal management arrangements have
also been the focus of concern. Emerging issues include the damming of coastal watersheds, the
careless dumping of solid waste such as plastic bags and containers, and the ghost fishing of nets lost
accidentally at sea.
4.1
Description of the physical, chemical and biological characteristics of known spawning,
nursery, feeding, and fishing grounds
Little information is available about the exact locations of spawning, nursery and feeding grounds of fish
species in Cambodian waters. Hence, we describe the general environments where fishing takes place.
Information about fish habitats for species of transboundary significance has been taken from the
literature, as no information exists for Cambodia.
Pelagic environments
The hydrographical data collected during the 1959 to 1961 Naga Expedition is still the most
comprehensive in existence. Temperature and salinity show only minor variations with either depth or
season. Surface temperatures vary between 27°C and 31°C and salinity between 27.4 and 34
(Tana 2000). Water temperatures at a depth of 30 m off the coast of Koh Kong province varied between
28°C and 28.5°C. Salinity at that depth varied between 31.5 and 33.5. There was a distinct
halocline between 5 and 10m in August 1960 and a thermocline between the same depths in April
1960. There may be oxygen depletion at depths over 30m during the dry season (Robinson 1974).
There are no studies on phytoplankton productivity. Tana (2000) mentions that phytoplankton
comprises only 3 to 5% of the total suspended organic matter. There are no quantitative studies of
zooplankton in Cambodian waters. According to Tana (2000), zooplankton is composed of amphipods,
decapods, and chaetognaths. The Naga Expedition observed plankton densities of 0.6 to 1.9 ppb off
Koh Rong in April 1960, 0.2 ppb in August 1960, and 0.4 ppb in November 1960.
For pelagic species, including anchovies, mackerel, and tuna, there are some studies on the
occurrence of larvae in plankton samples. Cambodia's offshore waters are considered important
spawning and nursing grounds for regional stocks of Indian and short mackerels (Rastrelliger kanagurta
Reversing Environmental Degradation Trends in the South China Sea and Gulf of Thailand
28 NATIONAL REPORT ON FISHERIES CAMBODIA
and R. brachystoma). The 1959 to 1961 Naga Expedition collected 100 to 1000 larvae per 1000m3 just
off Koh Rong in April 1960 (Matsui 1970).
Coral reefs
Many economically important species, such as groupers and snappers, are associated with coral reefs.
Some fishes are permanent reef inhabitants and use the reef for spawning, nursery areas, and feeding.
Other species use coral reefs for feeding or spawning/nursery areas. Coral reefs are part of the
physical and biological environment, and they influence the chemical environment as their
photosymbiosis with zooxanthellae produces oxygen. They also influence precipitation of calcium
carbonate in the structural skeleton of the corals.
Coral reefs occur in many areas of Cambodia's waters. There is very limited information about species
diversity and live coral cover on most reefs. Coral reefs are most common around offshore and inshore
islands, and species diversity appears to be higher offshore. Tana (1997) mentioned that only 24
species of hermatypic corals and 14 species of soft corals (octocorals) had been identified. In 1998, a
limited number of surveys were carried out in the Sihanoukville area (CZM 1999c). Here 45 species of
hermatypic corals were identified. Surveys in Koh Kong province identified 67 species of hard corals
and 17 soft corals (CZM 2002a). A survey around Koh Tang, one of the offshore islands, in 1998,
reported "at least 70 species" of hard corals (Nelson 1999).
Reefs at Risk estimated the total reef area in Cambodia to be less than 50km2, and highlighted that all
coral reefs in Cambodia were at high or very high risk, mostly from overfishing. Other threats are
destructive fishing methods (dynamite and cyanide), sedimentation, and pollution, especially from
marine-based sources (Burke et al. 2002). Based on individual species distributions, Reefs at Risk
estimated that 272 species of coral might be present in Cambodia, although only about 70 to 80
species have been recorded. The reefs are dominated by solid forms, e.g. Porites, which makes
physical damage from blast fishing greater and the time for recovery high. There are some signs of
coral bleaching, but no quantitative data exist. However, it appears that only small local areas are
affected, indicating that this is most likely caused by physical stress from predation (crown-of-thorns
sea stars have been reported), use of cyanide in fishing, and collection for the souvenir trade. Many
high value fish species, including groupers, are associated with coral reefs. Most reef fishes are caught
in traps. Trawling in coral reefs can damage both nets and corals. In addition, invertebrates such as
abalone, some crabs, bigfin reef squid, and octopus species occur on or near coral reefs.
Mangrove forests
Tidal changes in water level and variable salinity characterise mangrove forest habitats. Salinity
generally decreases from the seaward edge of the mangrove forest towards the landward edge.
However, salinity also depends on exposure, air temperature (evaporation), and rainfall. Organisms
living within mangroves are adapted to these changes. Some feed only during low tide, when the
mudflats and sediments between mangrove roots are exposed. Others feed only during high tide.
Many invertebrates burrow into sediments, and some may form deep and complex burrows. This
biological activity is important for the availability of oxygen in the sediment. The high organic content of
mangrove mud usually means that only the upper few millimetres are oxygenated, with anaerobic
processes prevailing underneath this thin surface layer. Bioturbation and permanent burrows bring
oxygenated water into the burrows and, as a result, the walls of burrows usually contain a diverse meio-
and micro-fauna and -flora. Unfortunately, there are no studies of this in Cambodia.
Mangrove forests are important breeding and nursery grounds for many species of fish and
crustaceans. They are resting and feeding grounds for wading and other fish-eating birds. The main
fishing activity in mangrove forests is for crabs, especially mud crab (Scylla serrata). The mudflats in
front of mangrove forests harbour a rich fauna of bivalves, which are commercially exploited in
Cambodia. By collecting spat (juvenile bivalves) and transporting them to enclosed areas, natural
stocks can be enhanced. In Cambodia, there is some dredging for bivalves, including blood cockle
(Anadara spp.), short-neck clam (Paphia undulata), and hard-shelled clams (Meretrix spp.). In brackish
parts of mangrove forests, Polymesoda sp. can be collected.
It is estimated that Cambodia has already lost more than 50% of its mangrove forests. The main causes
of this loss include the cutting of wood for firewood and charcoal production, as well as the clearing of
forests to establish shrimp farms (Talaue-McManus 1999).
Reversing Environmental Degradation Trends in the South China Sea and Gulf of Thailand
NATIONAL REPORT ON FISHERIES CAMBODIA 29
Seagrass beds
Seagrass beds occur on sediments in shallow water areas. In Cambodia, 9 species of seagrasses have
been observed. Seagrass communities are important for stabilising sediments and preventing coastal
erosion. The dense network of rhizomes and roots function as sediment traps, and because seagrasses
are higher plants, the roots can take up nutrients trapped in the sediment. Seagrass beds occur in
several places in Cambodia, mostly in small patches along the mainland coast and around most
islands. There are a few more extensive seagrass beds in waters off Kep municipality near the
Vietnamese border, and along the coast of Kampot province. There are reports that a dense seagrass
bed once covered Kampong Som Bay. Now only a few small patches exist. Unfortunately, quantitative
data about coverage does not exist. Seagrass beds generally have a highly diverse invertebrate fauna,
which forms the food of commercial fishes and crustaceans. Seagrass beds are also the main habitat
for dugong. Stingrays often occur in seagrass beds, and fishers use specialised hooked lines to target
this group. Unfortunately, these lines can entangle sea turtles. Some species of shark are believed to
use seagrass beds for spawning.
Soft bottom communities
The majority of Cambodia's seafloor is composed of soft sediments, ranging from almost pure sand
along exposed beaches to very fine, waterlogged mud. Shell fragments often comprise a high
proportion of the sediment, and clumps of consolidated clay, probably of terrestrial origin, are
encountered in bottom samples. Trawl fishing in Cambodia mostly occurs over soft bottom habitats, and
apart from shrimp and demersal fish species (such as snappers, threadfin breams, and siganids), squid
and cuttlefish, slipper lobster, and mantis shrimps (stomatopods) are important parts of catches taken in
these areas.
The invertebrates living on and in the soft sediments are important as food for commercial species.
Trawling may cause significant impacts on the species composition, growth rate, and maximum size of
these animals. In parts of Kampong Som Bay, the seapen (Pteroides sp.) dominates the invertebrate
community. This may be due to this species having a higher tolerance to repeated disturbances than
most bivalves. Brittlestars, seastars, and predatory gastropods are also very common in these
communities.
According to Tana (2000), there are four main coastal ecosystems in Cambodia, including the:
1. Koh Kong Bay ecosystem;
2. Botum Sakor National Park ecosystem;
3. Kampong Som semi-enclosed bay ecosystem; and the
4. Kampot Bay ecosystem.
- Koh Kong Bay ecosystem
This is the largest estuarine ecosystem in Cambodia. It is influenced by freshwater from the continent
during the rainy season. There are two streams influencing this estuary, namely Dong Tong and
Trapeang Roung. This estuary has a large mangrove forest covered delta with an area of approximately
60,000ha. The species diversity of the estuary is high (74 species). Rhizophora mucronata and
Rhizophora conjugata are significantly important because their roots are the main habitats of green
mussel, mangrove oyster and hermit crabs. Seagrass, especially Enhalus sp., is present at the delta of
Trapeang Roung stream and the muddy beaches of the eastern part of the bay. Halodule sp. occurs in
the area between the shoreline and Koh Kong Island, especially during the dry season. These areas
are important habitat for mud and swimming crabs, cuttlefishes, and Penaeus and Metapenaeus
shrimp. Shallow water mammals, including the Irrawaddy dolphin (Orcaella brevirostris), utilise this area
throughout the year. The collection and culture of the green mussel (Perna viridis) takes place in Peam
Krasob, Koh Kong Bay. Fishers harvest hard-shell clams (Meretrix spp.) and the short-neck clam
(Paphia undulate) in Thmor Sor.
Sea turtles nest in this area. Interviews with experienced fishers in Koh Kapic indicate a dramatic
decrease in sea turtles since 1975. Approximately 100 nesting females existed in the area in 1975;
however, there were only 28 in 1998. More than 1000 hatchlings per year were estimated in 1975
compared to only 200 in 1998 (Try 1999).
- Botum Sakor National Park ecosystem
Reversing Environmental Degradation Trends in the South China Sea and Gulf of Thailand
30 NATIONAL REPORT ON FISHERIES CAMBODIA
Botum Sakor National Park is an excellent habitat for resident and migratory birds and a safe habitat for
the brackish water crocodile (Crocodilus porosus); however, this species has never been positively
identified (see section 2.1.3 Marine Reptiles). The coastal portion of the park is comprised of rocky and
white sandy beaches and is a main location for coral reef habitats, as continental freshwater does not
influence the area. Reef fishes are highly diverse (about 50 species). During November to January, this
area is the main habitat of the Penaeus shrimp species, especially white shrimps, as they seek refuge
from storms and strong northern winds.
- Kampong Som semi-enclosed bay ecosystem
Kampong Som Bay is the deepest of the bay ecosystems but depth does not exceed 20m. The
northeastern coastal habitat is defined as Dong Peng Multiple-Use Area, where 2 major estuaries and
mangrove wetland forest are located. The estuaries are fed by the Andong Tuk and Sre Ambel streams
during the wet season, which leads to reduced salinity levels. These areas are the main habitats of
dolphins, octopus, and other sea animals such as hawksbill, loggerhead, and green turtles. The latter
often enter this area for nesting on the eastern beaches.
These areas are also the main habitat of jellyfish and molluscs. Koh Khchorng is the main harvesting
area for blood cockle (Anadara spp.) and short-neck clam (Paphia undulate). Koh Khchorng is also a
nursing ground for mud crabs. Fishers collect large quantitities of juvenile mud crabs (Scylla serrata) for
fattening in local areas or in Viet Nam. Vinegar crabs (Episesarma spp.) are also caught in this area.
These species spawn in mangrove areas around the full moon during September and October. Fishing
grounds for the sentinel crab (Podophthalmus vigil) and mud crab are inside Kampong Som Bay
(landed in Steung Hao). In offshore waters adjacent to Sihanoukville, fishers target blue swimming crab
(Portunus pelagicus) (Jensen & Try 2002; Fishers pers. comm.). Nesting grounds for sea turtles are
located in Koh Rong, Koh Rong Salem and Koh Polowai. The offshore islands, including Koh Tang and
Koh Pring, are important nesting areas (Try, 1999; 2000; Fishers, pers. comm.).
- Kampot Bay ecosystem
This area is characterised by swampy and rocky habitats with little freshwater influence. Salinity near
the shore varies between 30.5 ppt and 32 ppt during the rainy season and increases up to 32.5 ppt to
33.4 ppt during dry season. The deepest area (< 20m) is in the transboundary water area near Phu
Quoc Island (Koh Tral Island). This bay contains the main area of seagrass, which extends from
Trapeang Ropov and Steung Kampot estuaries. The seagrasses Enhalus and Halodule grow on the
sandy sea floor. They are the main habitat of dugong, which migrates to this area from November to
January. These seagrasses are a main habitat of molluscs such as blood cockle, clam and cone shell,
and the feeding ground for a number of resident and migratory fishes, squids, octopus and crustaceans.
In Kampot province, there are many areas where fish spawn. Koh Kataing Island is the main spawning
ground for crabs and some species of fishes. Koh Tror Ngou is a spawning ground for some species of
fishes and shrimps. Koh Thmey is a major spawning ground for shrimps, fishes, and crabs. Brek Tror
Peng Ror Paov and Koh Ro Si Ta are also major spawning grounds for shrimps, crabs, molluscs, and
some species of fish such as snappers (CZM 2002b). The Brek Ampil area contains habitats important
to sea turtles, dugong, and molluscs. Chong Kos Prek Tnout is a key habitat area for shrimps, crabs,
and some species of fish.
4.2
Unkown issues such as stocks with undefined spawning grounds
The section above describes the information known about important spawning and fishing grounds.
However, a paucity of information exists for most commercial fish species. This issue will need
addressing via future research projects or increased use of fisher knowledge in fisheries management.
Typically, fishers possess considerable knowledge about the distribution and abundance of different
species, and in many cases, where and when these species spawn. However, fishers are often
reluctant to provide this information, mostly due to concerns regarding increased competition and the
introduction of fishing restrictions in their important fishing areas.
In order to solve this problem and obtain information regarding CPUE, Cambodia's DoF aims to
collaborate with foreign experts and donor agencies in seeking financial assistance for the development
of research facilities and activities. In addition, the collaboration of countries bordering the Gulf of
Thailand in managing exploited fish stocks should be a key priority for the future.
Reversing Environmental Degradation Trends in the South China Sea and Gulf of Thailand
NATIONAL REPORT ON FISHERIES CAMBODIA 31
4.3
Threats, current and potential
The current and potential threats and impacts to coastal and marine habitats in Cambodia are
summarised in Table 35. The coastal provinces of Cambodia are separated from the remaining part of
the country by the mountains of the Cardamom and Elephant ranges. Only a few small rivers and
several streams enter the sea through shallow semi-enclosed bays. Slope from mountain to coastline
differs widely between the provinces. Mountainous areas are characterised by dense forest, however,
agricultural activities dominate the lower catchments. Population density is low. Koh Kong province has
a population density of only 12 persons/km², Kampot province 108 persons/km², Sihanoukville
municipality 179 persons/km², and Kep municipality 85 persons/km² (country average is 64
persons/km²). Migration to coastal areas is high and development of new settlements is rather
haphazard. Property value has increased significantly for waterfront land in Sihanoukville in recent
years, partly because of perceived opportunities for developing facilities for tourism. The construction of
new buildings directly on the beach is common, although concrete or brick seawalls often protect them.
The landowners are often high-ranking government officials, so local authorities are usually powerless
in attempting to prevent such activities. So far, there is little or no sewage treatment, and in many
cases, there are only open sewers, which discharge directly into streams, rivers, or the sea. This may
present health problems especially in densely populated fishing villages.
All freshwater discharge to the sea is via shallow semi-enclosed bays. This means that all suspended
particulate material remains trapped in these bay areas for some time. Increased siltation and
particulate organic material increase turbidity, leading to reductions in primary production, especially
that of benthic plants such as seagrass. Deposition of organic particles may provide an additional food
supply for benthic deposit-feeders such as polychaete worms and some species of bivalves. However,
such particles tend to decrease growth rates in suspension feeding bivalves, including oysters and
mussels. Generally, increased levels of organic matter may result in an increased biological oxygen
demand leading to diminished dissolved oxygen concentrations in the water column.
There are two zones concerning fisheries in Cambodia's EEZ: (1) from the high water mark to a depth
of 20m is the inshore zone; and (2) from the outer boundary of the inshore zone to the border of the
claimed EEZ is the offshore zone. As maximum depth in the Gulf of Thailand is only 80m, there is no
true offshore zone (deeper than 200m).
Table 35
Summary of threats and impacts to marine and coastal habitats in Cambodia.
Zone
Inland (coastal provinces)
Coastal (0-20m)
Offshore (>20m)
Threats
Land development
Fishing
Fishing
Agriculture
Illegal gears & vessels
Illegal gears & vessels
Tourism
Aquaculture
Oil & gas exploitation
Freshwater supply
Mangrove cutting
Marine transport
Waste disposal
Port activities
Damming
Land reclamation
Sewage discharge
Sewage discharge
Tourism
Impacts
Habitat destruction
Stock depletion
Stock depletion
Pollution
Habitat destruction
Pollution
Eutrophication
Eutrophication
Eutrophication
Flooding or lack of freshwater
Pollution
Oxygen depletion
Siltation
Siltation
Health problems
Oxygen depletion
Alien species
Red tides/algal blooms
Health problems
4.4 Ranking
of
Habitats
4.4.1 Ranking for association with species of importance to food security
Habitats can be ranked according to several different criteria. Due to lack of information about species
that are important for local food security, it has not been possible to rank Cambodia's marine habitats
according to their usage by species of importance to food security.
Reversing Environmental Degradation Trends in the South China Sea and Gulf of Thailand
32 NATIONAL REPORT ON FISHERIES CAMBODIA
4.4.2 Ranking for species of high value
The fish that have the highest market value are the groupers, angelfish, and silver pomfret. The first two
species are associated with coral reefs. Similarly, the gastropods of highest economic value are
associated with coral reef habitats. Hence, coral reefs should be given the highest rank. Mud crab is the
most highly valued crab species. This species depends heavily upon mangrove habitats. Mangroves
are also an important nursery area for shrimp. Hence, mangroves received the second highest rank.
Clearly the majority of commercial fisheries, and hence the highest total value, arises from benthic soft
bottoms and pelagic environments. Although trawling is a highly destructive fishing method, it is difficult
to impose protective measures for open water over soft bottom habitats. Regulation should occur in
recognition of the total number of licences issued or the maximum number of fishing days in a given
area.
4.4.3 Ranking for endangered, rare and threatened species
The DoF and the Ministry of Environment have prioritised the protection of habitats important to
endangered and threatened species, especially those relevant to key international conventions such as
CITES, Ramsar, CMS, and others. At present, there are 2 National Parks (Ream or Preah Sihanouk
and Botum Sakor) containing coastal components. Similarly, the Multiple Use Area of Dong Peng
includes some mangrove forests. The identification of several sites as potential Marine Protected Areas
has occurred. These sites contain important nesting areas for sea turtles, coral reefs, and seagrass
beds. They are located around barrier islands, including Koh Rong, Koh Rong Saleum and Koh Sdach.
Hence, coral reef habitats again receive the highest ranking. Clean sandy beaches suitable for the
nesting of sea turtles and horseshoe crabs are given high priority in this connection. The protection of
some of Cambodia's mangrove sites does occur on paper, although enforcement of regulations has
been weak.
5.
CURRENT MANAGEMENT REGIMES
5.1 Legal
instruments
Following the Pol Pot regime, there was a complete restructure of Cambodia's legal and administrative
arrangements for natural resource use. Therefore, in order to manage and control the use of
Cambodia's natural resources, specifically aquatic resources, the DoF instituted Cambodia's Fisheries
Law (in Khmer called Kret Chhbab Lek 33 Kra Chor) for the Management and Administration of
Fisheries Resources in Cambodia. The DoF administered this law, which aimed to conserve and
regulate the exploitation of Cambodia's fishery resources. It represents a modified and upgraded
version of Cambodia's fisheries law of 1965. The enactment of this legal instrument occurred on 9
March 1987.
This law aims to enable the achievement of Cambodia's obligations under the 1982 United Nations
Convention on the Law of Sea. This international instrument gives the rights and responsibilities for the
management and use of marine resources within the Cambodian EEZ to the Cambodian Government.
The modification of Cambodia's law has occurred in response to changes in political situations. This law
is currently under review and it is aimed that a draft will be finished, signed, and come into force during
2004. Similarly, other existing legal instruments instituted prior to 1993 are under revision. A revised
version is in the process of community and stakeholder consultation. Several sub-decrees,
proclamations, and other regulations are being drafted.
The existing law provides a broad legislative framework for the management and development of
marine capture fisheries in Cambodia. Management tools such as the requirement to licence boats of a
specified size, closures to protect some species during their spawning seasons, and gear restrictions
are commonly used. The law contains some conservation measures such as banning the use of trawls
in inshore areas less than 20 meters deep, and the prohibition of the use of explosives and poisons for
commercial fish capture.
There are many legislative instruments and regulations currently in force for the management,
conservation, and sustainable development of Cambodia's fisheries resources. These include:
- Fishing permits for commercial fishing
- Boat licenses (see above)
- Licences for foreign vessels fishing inside Cambodian EEZ
- Prohibition of illegal fishing gears such as electro-fishing, explosives and poisons (see above)
Reversing Environmental Degradation Trends in the South China Sea and Gulf of Thailand
NATIONAL REPORT ON FISHERIES CAMBODIA 33
- Prohibition of trawling in water less than 20m deep (see above)
- Protection of mangrove areas and fish sanctuaries (spawning areas)
- Closed season during the spawning season of mackerels from 15 January to 31 March
- Listing of nationally threatened wildlife species for which collection/harvesting is prohibited
- Prohibition of the trade in Cambodia's reptiles
- Prohibition of exploitation and harvesting of corals and other species in the CITES appendices
5.2
Institutional arrangements (research, monitoring, control & enforcement)
There are 4 provincial/municipal fisheries offices in the coastal areas of Sihanoukville, Koh Kong,
Kampot and Kep. One marine inspection unit is located at Sihanoukville to control all illegal activities
along the Cambodian coastline. The marine inspection unit consists of 2 vessels, each about 14 to 15
metres in length, with maximum speeds of 12 to 15 knots. The vessels are often unable to match the
speed of foreign fishing vessels (APIP 2001), and the unit has insufficient funds to operate and maintain
the vessels. In 2002, about 80 staff were employed within the inspection sector. This includes all staff in
the coastal provinces/municipalities and the marine inspection unit.
There is no research and monitoring unit for marine fisheries within the DoF, although there are some
specific research projects now underway in collaboration with donor agencies. A marine research group
is operating under the DoF, but unfortunately, the members have to attend to other duties as well, and
may be transferred (promoted) to inland provinces. So far, the DoF has proposed the establishment of
a marine and coastal national research institute in Sihanoukville municipality. The project is now
seeking assistance from donors. A small marine reference collection in Sihanoukville has been
established under the DoF mandate. This reference collection will extend its activities for public
awareness and may become a marine natural museum in the future.
There is some institutional overlap between the DoF and Ministry of Environment (MoE). The MoE is
responsible for the conservation of biodiversity and protected areas. However, the DoF, as part of the
Ministry of Agriculture, Forestry, and Fisheries, is responsible for the protection and sustainable use of
marine natural resources and for establishing fisheries management areas.
5.3
Overview of patterns of resource ownership and traditional utilisation
Marine fishers in Cambodia are generally from poor communities, operating on a subsistence level or
as small-scale commercial fishers. In the late 1970s, the Cambodian population was moved from the
larger metropolitan areas into the provinces. Under the Khmer Rouge rule period (from 1975 to 1979),
government was likewise moved from the big cities to the rural areas. Farming rice and clearing forests
for the development of rice fields were the main priorities of the government, whereas fisheries had low
priority and very little fishing or aquaculture was conducted. Political instability and lack of resources in
the following years resulted in only small amounts of marine production and management by
government.
Today, the marine fishery remains largely open access. Middle to large-scale participants require a
licence, which provides them with a 1-year access right to the resource (within the conditions of their
licence). However, subsistence and small-scale fishers are not required to be licensed and have no
defined resource access rights. These fishers mostly use traditional methods. However, more fishers
are adopting modern methods to maximise their catches.
There are increasing numbers of migrants from poorer rural areas moving to coastal areas to start new
livelihoods as fishers. These people have very few traditional ties to marine fisheries. Efforts should be
made to find alternative employment for these people to ease the pressure on fisheries resources.
5.4
Human and Institutional Capacity
The mandate of DoF is to be responsible for aquatic fauna and flora. This means that the DoF is
responsible for managing Cambodia's marine and inland fisheries resources, including management of
fishers, information, and operations. The DoF employed 1557 staff throughout Cambodia in 2000, with
845 of those holding a qualification.
Reversing Environmental Degradation Trends in the South China Sea and Gulf of Thailand
34 NATIONAL REPORT ON FISHERIES CAMBODIA
There are few research activities conducted in the coastal areas. Most research (and qualified staff) is
conducted for freshwater fisheries. There is very little capacity within the DoF to assist in the
management and research of marine fisheries. There are also very few institutional resources,
particularly in provincial offices, to assist in resource management and research. The staff of
provincial/municipal fisheries offices are responsible for all fisheries activities, including aquaculture and
inland fisheries in the coastal provinces. Most of them have little formal training, although DoF has
recently increased educational opportunities for provincial staff.
There have been several projects conducted that have assisted in building government level human
resource capacity. These projects have focused on community fisheries development (capacity building
within government and communities), marine living resources or marine biodiversity, mangrove
rehabilitation, coral and seagrass research, marine mammal and turtle research. All of these projects
have received financial assistance from donor agencies and have been implemented in collaboration
with either the Department of Fisheries or the Ministry of Environment. Unfortunately, most of the
projects stop when donor funding runs out. There are no incentives and insufficient local capacity to
continue successful projects.
5.5
Review of stakeholders
There are a wide range of participants and interested stakeholders in Cambodia's marine fisheries.
Community members, large and middle scale fishers, processors, traders, transporters, provincial and
national government staff, local and international NGOs, and scientists are increasingly being involved
in government decision-making processes. However, it will be important to include the participation of
small-scale commercial fishers as well as subsistence fishers in the future. It appears that most private
sector stakeholders, including large and middle-scale fishers, are mostly interested in getting maximum
profits in a short time, even if they know that this will damage the environment and eliminate their future
possibilities of utilising these resources. Marine fishers in Cambodia do not form fisher associations,
and so it is up to each individual to make decisions about when and how often to fish, as well as
appropriate times to take up loans for investing in improved technology.
6. RECOMMENDED
ACTIONS
Research and monitoring
This report has identified some major gaps in scientific knowledge about marine fisheries resources.
This highlights the importance of initiating collaborative research activities in the Cambodian section of
the Gulf of Thailand. Areas of specific importance are reproductive biology, population dynamics, and
ecology of commercial fish species. In addition, quantitative studies of benthic and pelagic
invertebrates, which constitute food for commercial species, should be given high priority.
Fisheries dependent and independent surveys should be conducted at regular intervals to assess
CPUE for commercially important species. Where possible, this should be carried out in collaboration
with Thai, Vietnamese, and regional fisheries research institutions.
A regular monitoring program should be established for water quality parameters, hydrography,
phytoplankton production, and zooplankton biomass. In order to carry out all these activities, a marine
research facility should be established in the coastal area of Cambodia.
Education and Public Awareness
The educational level of fishers and their families is typically low. It is important that information about
marine ecosystems and biodiversity be disseminated to these people. Increased community
participation in fisheries management requires that stakeholders make informed decisions, and this is
only possible if the stakeholders have all the available information. Due to the prevalence of illiteracy
among subsistence fishers, all information should be given as visual presentations, such as videos.
Fishers should also be offered training about boat handling, safety, and navigation.
It is important that the educational level of the staff of the provincial fisheries offices be improved. Junior
staff with reasonable English skills can receive formal training abroad if scholarships are available.
However, senior staff members often have little or no command of English, and will need to be trained
locally. Special training should be given to technical staff in connection with implementation of a
monitoring program, for handling accidental catches of endangered species and other special issues.
Reversing Environmental Degradation Trends in the South China Sea and Gulf of Thailand
NATIONAL REPORT ON FISHERIES CAMBODIA 35
There is also an urgent need to change the catch recording system in order to ensure the reliability of
fisheries statistics. This will probably require international assistance as well as special training of
technical staff, especially in the provincial offices and the Marine Fisheries Inspection Unit.
Management measures
The DoF needs to change the recording system for official fisheries statistics. Catches need to be
separated to species (for the most abundant ones) or groups of species. In addition, the value for each
of these categories needs to be recorded.
The DoF should also allocate qualified technical staff with specific responsibilities for the marine
fisheries sector. Problems and issues within this sector differ from those of the freshwater fisheries
sector, and with the current staff rotation system, knowledge gained by some staff members
"disappears" when they are promoted to other duties.
Management measures should be implemented to conserve endangered species, and protocols should
be established for the handling of accidentally captured cetaceans, dugongs and sea turtles. Support
from the UNEP/GEF South China Sea Project should facilitate the establishment of management areas
to safeguard important species during critical phases of their life-cycles, such as when they form
spawning aggregations or utilising inshore coastal nursery areas.
As overfishing is already prevalent in Cambodian waters, measures should be taken to regulate
catches. This will likely be best achieved throigh the establishment of spatial and temporal management
measures, and the regulation of the number of licences issued. Efforts should also be taken to reduce
the use pair-trawlers and light-luring purse seine methods by foreign fishers in Cambodian waters.
Law enforcement
At present, there is little compliance with existing regulations. Trawling takes place in shallow water,
illegal gears are used, and catches are landed outside the country. It is therefore important that
measures be taken to ensure adequate monitoring, control, and surveillance of fishing activities in
Cambodia's EEZ.
Economic measures
To control or reduce the number of subsistence fishers, alternative income sources should be explored.
The establishment of processing facilities for marine fisheries products should be promoted. Presently,
most of the fisheries products are exported fresh, chilled or frozen. Processing generally adds value to
landings and it creates local employment opportunities.
REFERENCES
APIP (2001) Marine Fisheries Review. The Department of Fisheries. Technical Paper No. 3: 40pp. (in English)
Beasley, I., Davidson, P., Somany, P. and Samath, L. (2001) Abundance, distribution and conservation
management of marine mammals in Cambodia's coastal waters. Wildlife Conservation Society of Cambodia
and Department of Fisheries. 31pp. (in English)
Bourret, R. (1941) Les tortues de l' Indochine. Institut Oceanographique de l' Indochine. Station Maritime de Cauda
(Nhatrang) 38:1-235. (in French)
Burke, L., Selig, E. and Spalding, M. (2002) Reefs at Risk in Southeast Asia. World Resources Institute,
Washington, DC. USA. 72pp. (in English)
Crosse, H. and Fischer, P. (1892) Note sur les Mollusques marins du Golfe de Siam (Côte O. du Cambodge).
Journal de Conchyliologie 40: 71-77. (in French)
CZM (1999a) Socio-Economic and Natural Resources Studies in Five Villages of Kep Municipality. Ministry of
Environment of the Kingdom of Cambodia. Cambodian Socio-Economist and International Sociologist.
pp. 1-25. (in English)
CZM (1999b) Socio-Economic and Natural Resources Studies in Six Villages in Kampot Province. Ministry of
Environment of the Kingdom of Cambodia. Cambodian Socio-Economist and International Sociologist.
pp. 1-23. (in English)
CZM (1999c) Socio-Economic and Natural Resources Studies in Six Villages in Sihanoukville Municipality. Ministry
of Environment of the Kingdom of Cambodia. Cambodian Socio-Economist and International Sociologist.
pp. 1-27. (in English)
CZM (1999d) Socio-Economic and Natural Resources Studies in Six Villages in Koh Kong Province. Ministry of
Environment of the Kingdom of Cambodia. Cambodian Socio-Economist and International Sociologist.
pp. 1-23. (in English)
CZM (2002a) State of Environment Report for Koh Kong Province (English Version). Ministry of Environment of
Kingdom of Cambodia. Koh Kong Working Group: 30pp. (in English)
Reversing Environmental Degradation Trends in the South China Sea and Gulf of Thailand
36 NATIONAL REPORT ON FISHERIES CAMBODIA
CZM (2002b) State of Environment Report for Kampot Province (English Version). Ministry of Environment of
Kingdom of Cambodia. Kampot Working Group: 42pp. (in English)
DoF (2002) Fisheries Data Collection 1980-2001. Department of Fisheries, Ministry of Agriculture Forestry and
Fisheries, Kingdom of Cambodia. (in English)
EVS Enviroment Consultants (1996) Coastal and Marine Environmental Management for Kingdom of Cambodia.
Asian Development Bank. 327pp. (in English)
Fischer, P. H. and Fischer-Piette, E. (1972) Recolte de mollusques lamellibranches sur la cote du Cambodge.
Journal de Conchyliologie 110: 22-30. (in French)
Groombridge, B. and Luxmoore, R. (1989) The green turtle and hawksbill (Reptilia: Cheloniidae): World status,
exploitation and trade. CITES Secretariat, Lausanne, Switzerland. 601pp. (in English)
Ibrahim, H. M. (1999) Overfishing in the Gulf of Thailand: Issues and Resolution. In: Johnston, D. M. (ed.). Seapol
Integrated Studies of the Gulf of Thailand. Southeast ASIAN Programme in Ocean Law, Policy and
Management. Vol. 2, pp. 55-93. (in English)
IUCN (2003) 2003 IUCN Red List of Threatened Species. (www.redlist.org/ accessed on 29 January 2004).
Jensen, K. R. and Try. I. (2002) Report on Marine Living Resources of Cambodia. (1st Draft) (in English)
Le Poulain, F. (1941) Note sur les tortues de mer du Golfe de Siam, Annexe, -pp. 216-218. in: (Bourret, R.(ed.),
Les tortues de l' Indochine. Institut Oceanographique de l' Indochine. Station Maritime de Cauda (Nhatrang).
No. 38. (in French)
Longdy, V. (2002) Status of Cetaceans in the Coastal Areas of Koh Kong Province, Cambodia. Department of
Fisheries, Cambodia. 6pp. (in English)
Lynge, H. (1909) The Danish Expedition to Siam 1899-1900. IV. Marine Lamellibranchiata. - Det Kongelige Danske
Videnskabernes Selskabs Skrifter, 7. Række, Naturvidenskabelig og mathematisk Afdeling V. 3: 1-203, plates
1-5, 1 map [pp. 99-299] (in English)
Matsui, T. (1970) Description of the larvae of Rastrelliger (mackerel) and a comparison of the juveniles and adults
of the species R. kanagurta and R. brachysoma. Naga Reports, Vol. 5, Part 1, pp. 1-33. University of
California, La Jolla, California. (in English)
Ministry of Planning (1999). Report on the Cambodia Socio-Economic Survey 1999. Phnom Penh: National
Institute of Statistics.
Ministry of Planning (2002). Second Five Year Socio-economic Development Plan 2001-2005. Royal Government
of Cambodia, Phnom Penh.
MoE (1996) Coastal Zone Management in Cambodia. In: Book 1: Current Conditions, Part 1b: Review of the
Oceanography, Natural Resources and Fisheries of the Coastal Zone of Cambodia. pp. 1-41. Royal Kingdom
of Cambodia, Ministry of Environment. (in English)
MoE (1998) Coastal Fisheries Management. In: National Environmental Action Plan 1998-2002. pp. 29-34. Ministry
of Environment, Kingdom of Cambodia. (in English)
Morlet, L. (1889) Catalogue des coquilles recueillies, par M. Pavie, dans le Cambodge et le Royaume de Siam, et
description d'espèces nouvelles. Journal de Conchyliologie 37: 121-199, plates 6-9. (in French)
Nelson, V. (1999). Draft Coastal Profile: Volume 1. The Coastal Zone of Cambodia: Current Status and Threats.
Phnom Penh, MoE & Danida.
Robinson, M.K. (1974) The physical oceanography of the Gulf of Thailand, Naga Expedition. Naga Reports Vol 3,
Part 1, pp: 5-110. University of California, La Jolla, California. (in English)
Talaue-McManus, L. (2000) Transboundary Diagnostic Analysis for the South China Sea. EAS/RCU Technical
Report Series No. 14. UNEP Bangkok, Thailand. 106pp. (in English)
Tana, T.S. (1996) Result from the scientific research on commercial fishery biology of the Cambodia sea
(1982-86). Report. Cambodia. 20pp. (in English)
Tana, T.S. (1997) Status of marine biodiversity of Cambodia. Phuket Marine Biological Center Special Publication
17(1): 175-180. (in English)
Tana, T.S. (1999) Review on previous and present ichthyology works on marine fish of Cambodia. 29pp.
(in English)
Tana, T. S. (2000) Cambodian Sea. In: Sheppard C. R. C. (ed.). Seas at the Millennium: An Environmental
Evaluation. Vol. II, Regional Chapters: The Indian Ocean to the Pacific, Pergamon, New York, pp. 569-578.
(in English)
Tana, T.S. & Todd. B. H. (2002) The inland and marine fisheries trade of Cambodia. Oxfam America, Cambodia.
147pp. (in English)
Try, I. (1999) Status of sea turtle in Cambodia. Report of the SEAFDEC- ASEAN regional workshop on sea turtle
conservation and management: 72-74pp. (in English)
Try, I. (2001) Utilization of marine bivalves and gastropods in Cambodia. Phuket Marine Biological Center Special
Publication 25(2): 387-404. (in English)
Reversing Environmental Degradation Trends in the South China Sea and Gulf of Thailand
NATIONAL REPORT ON FISHERIES CAMBODIA
ANNEX 1 PAGE 1
ANNEX 1
List of Marine Fish Species of Cambodia
(Sources: Tana, 1998; Jensen & Try, 2002)
No.
Scientific name: (Species)
Vernacular name
Local name
Rhincodontidae
1
Rhincodon typus Smith, 1828
Whale shark
Chlarm Yaak
Hemiscylliidae
Longtail carpetsharks
2
Chiloscyllium indicum (Gmelin, 1789)
Slender bamboo shark
Chlarm sangha
3
Chiloscyllium griseum (Muller & Henle, 1839)
Grey bamboo shark
Chlarm russey
4
Chiloscyllium puntatum Muller & Henle, 1818
Brown-banded catshark
Chlarm Chkuot
5
Chiloscyllium plagiosum (Bennett, 1830)
Stegastomatidae
Zebra sharks
6
Stegostoma varium (Seba, 1761)
Chlarm
Chkuot
7
Stegostoma fasciatum (Hermann, 1783)
Leopard shark
Chlarm Chkuot
Ginglymostomatidae
Nurse sharks
8
Nebrius ferrugineus (Lesson, 1830)
Tawny nurse shark
Chlarm
Lamnidae
Mackerel sharks
9
Isurus oxyrhinchus Rafinesque, 1809
Shortfin mako
Chlarm
Scyliorhinidae
Catsharks
10
Cephaloscyllium fasciatum Chen, 1966
Reticulated Swellshark
Chlarm Chkuot
Carcharhinidae
Ground or Requiem sharks
11
Galeocerdo cuvier (Peron & LeSueur, 1822)
Tiger shark
Chlarm kla
12
Scoliodon laticaudus (Muller & Henle, 1838)
Spadenose shark
Chlarm
13
Scoliodon sorrakowah (Civier, 1829)
Shark Chlarm
14
Scoliodon walbeehmi (Bleeker, 1856)
Blacktail reef shark
Chlarm Chkuot
15
Carcharhinus limbatus (Valenciennes, 1839)
Blacktip shark
Chlarm
16
Carcharhinus sorrah (Valenciennes, 1839)
Spottail shark
Chlarm och kantuy
Triakidae
Houndshark
17
Mustelus kaneckonis ?
Shark Chlarm
18
Negogaleus longicaudatus ?
Shark Chlarm
Sphyrnidae
Hammerhead sharks
19
Sphyrna zygaena (Linnaeus, 1758)
Smooth Hammerhead shark
Chlarm Ek
20
S. lewini (Griffith & Smith, 1834)
Scalloped hammerhead
21
Rhinobatidae
22
Rhinobatos typus Bennett, 1830
Giant Shovelnose Ray
Chlarm Truoch
23
Aptychotrema sp.?
Spotted shovelnose Ray
Chlarm Truoch
24 Rhynchobatidae
25
Rhynchobatus djiddensis (Forsskal, 1775)
White-spotted Shovelnose Ray
Chlarm Truoch Och Sar
Dasyatidae
Ray Bobel
26
Dasyatus akejei ?
27
Dasyatus kuhlii (Muller & Henle, 1841)
Blue-spotted Stingray
28
Dasyatus uarnak (Forsskal, 1775)
29
Dasyatus zugei (Muller & Henle, 1841)
30
Dasyatus leylandi Last, 1987
Brown reticulated stingray
Bobel Spoan
31
Dasyatus bennetti (Muller & Henle, 1841)
32
Himantura toshi Whitley, 1939
Black-spotted Stingray
33
Himantura undulata (Bleeker, 1852)
Leopard Whipray
34
Pastinachus sephen (Forsskal, 1775)
Cowtail Stingray
35
Tæniura melanospila (Bleeker,1853)
36
Tæniura lymma (Forsskal, 1775)
Blue-spotted Fantail Stingray
Bobel Khla
37
Urolophus flavomosaicus Last & Gomon, 1987
Patchwork Stingray
Gymnuridae
38
Gymnura australis (Ramsay & Ogilby, 1886)
Rat-tailed Ray
Myliobatidae
39
Aetomyleus nichofii (Bloch & Schneider, 1801)
Barbless Eagle Ray
40
Æ. milvus ?
41
Aetobatus narinari (Euphrasen, 1790)
Spotted Eagle ray
42
Myliobatis
tobijei
?
43
Rhinoptera javanica (Muller & Henle, 1841)
Spotted eagle Ray
Bobel Ork
Reversing Environmental Degradation Trends in the South China Sea and Gulf of Thailand
NATIONAL REPORT ON FISHERIES CAMBODIA
ANNEX 1 PAGE 2
No.
Scientific name: (Species)
Vernacular name
Local name
Mobulidae
44
Manta birostris (Donndorff, 1798)
Manta Ray
Torpedinidae
45
Narcine timlei (Bloch-Schneider, 1801)
46
Narcine lingula (Richardson, 1846)
47
Narcine
maculata
?
Megalopidae or Elopidae
48
Megalops cyprinoides (Broussonnet, 1782)
Indo-pacific tarpon or Oxeye Herring
Clupeidae
49
Anadontostoma chacunda (Hamilton, 1822)
Chacunda gizzard-shad
Trey Yipun
50
Dussumieria acute (Valenciennes, 1822)
Round Herring or Rainbow sardine
51
Ilisha elongata (Bennett, 1830)
Elongate ilisha
52
I. melastoma (Schneider, 1801)
Indian ilisha
53
Pellona ditchela Valenciennes, 1847
Indian pellona
54
Pellona amblyuropterus (Bleeker, 1852)
Javan ilisha
55
Ilisha macrophthalma (Swainson, 1838)
Bigeyes Ilisha
Trey Sloeuk Russey
56
Ilisha sladeni ?
57
Sardinella albella (Valencienness, 1847)
White sardinella
58
Sardinella
aurita
?
59
Sardinella brachysoma (Bleeker, 1852)
Deepbody sardinella
60
Sardinella (Amblygaster) clupeoides (Bleeker, 1849)
Bleeker's smoothbelly saedinella
Trey Kun
or Round belly Sardinella
61
Sardinella
fimbriata
62
Sardinella gibbosa (Bleeker, 1849)
Goldstripe sardinella
63
Sardinella [?Amblygaster] leiogaster (Valenciennes, 1847) Smoothbelly sardine
64
Sardinella longiceps (Valenciennes, 1847)
Indian oil-sardinella
65
Sardinella melanura (Cuvier, 1829)
Blacktip sardinella
66
Sardinella sirm (Walbaum, 1792)
Spotted sardinella
67
Sardinella jussieui (Valenciennes, 1847)
68
Herklotsichthys punctatus (Ruppell, 1837)
Spotted herring
Engraulidae
69
Stolephorus bataviensis (Hardenberg, 193?)
Batavian anchovy
70
Stolephorus commersoni (Lacepede, 1803)
Commerson's anchovy
71
Stolephorus indicus (van Hasselt, 1823)
Indian anchovy
Trey Kakeum
72
Encrasicholina heterolobus (Ruppell, 1837)
Shorthead anchovy
73
Thryssa hamiltonii (Gray, 1835)
Hamilton's anchovy
74
Thryssa mystax (Schneider, 1801)
Moustached Thryssa
75
Thryssa vitrirostris (Gilchrist & Thompson, 1908)
Orange-mouth thryssa
76
Thryssa setrirostris (Broussonet, 1782)
Longjaw thryssa
Chirocentridae
Wolf-herring
77
Chirocentrus dorab (Forsskal, 1775)
Dorab-wolf Herring
Trey Srom Dav
78
Chirocentrus nudus (Swainson, 1839)
Whitefin wolf-herring
Trey Srom Dav
Synodontidae
Lizardfish
79
Saurida micropectoralis (Shindo & Yamada, 1972)
Shortfin Lizard fish
80
Saurida tumbil (Bloch, 1795)
Greater lizardfish or Common
Grinner
81
Saurida gracillis (Quoy & Gaimard, 1824)
Gracile lizardfish
82
Saurida undosquamis (Richardson, 1848)
Brushtooth Lizard fish
Trey Kdor Chein
83
Saurida longimanus (Norman, 1939)
Longfin lizardfish
84
Trachinocephalus myops (Bloch & Schneider, 1801)
Bluntnose lizardfish
Ariidae
Sea catfish
85
Arius caelatus (Valenciennes, 1840)
Engraved catfish
86
Arius venosus (Valenciennes, 1840)
Veined catfish
87
Arius maculatus (Thunberg, 1792)
Spotted catfish
88
Arius thalassinus (Ruppell, 1837)
Salmon catfish
Trey Kaok
89
Arius sagor (Buchanan, 1822)
Sagor catfish
90
Osteogeniosus militaris (Linnaeus, 1758)
Soldier catfish
Plotosidae
Stinging catfish, Coral catfish, Eel
Trey Andeng samot
catfish or barbel eels
91
Plotosus lineatus (Thunberg, 1787)
Striped eel catfish
Trey Andeng Karang
Reversing Environmental Degradation Trends in the South China Sea and Gulf of Thailand
NATIONAL REPORT ON FISHERIES CAMBODIA
ANNEX 1 PAGE 3
No.
Scientific name: (Species)
Vernacular name
Local name
92
Plotosus canius (Hamilton-Buchanan, 182?)
Eel catfish
Trey Andeng poy
Muraenidae
Morays
93
Siderea thrysoidea (Richardson, 1844)
Antong
Samot
94
Siderea picta (Ahl, 1789)
Speckled siderial moray
Antong Samot
95
Lycodontis [?Gymnothorax] fimbriatus (Bennett, 1831)
Antong
Samot
96
Lycodontis [?Gymnothorax] undulatus (Lacepede, 1803)
Mottled moray
Antong Samot
Muraenesocidae
Pike congers
97
Congresox talabon (Cuvier, 1829)
Yellow pike conger
98
Muraenesox cinereus (Forscal, 1775)
Daggertooth pike conger
Ophichthidae
Snake eels and worm eels
99
Pisodonophis boro (Hamilton, 1822)
Rice-paddy eels or estuarine
Antong
snake eel
Belonidae
Needlefish Trey
Phtong
100
Ablennes hians (Valenciennes, 1846)
Flat needlefish or Barred Longtom
Trey Phtong Sampet
101
Strongylura strongylura (van Hasselt, 1823)
Spottail needlefish
Trey Phtong Samot
Bregmacerotidae
Codlets,
Codlings
102
Bregmaceros macclellandi (Thompson, 1840)
Spotted codlets
Fistulariidae
Cornetfish, flutemouth
103
Fistularia petimba Lacepede, 1803
Red cornetfish or Rough Flutemouth
104
Fistularia serrata (Cuvier, 1817)
Centriscidae
Razorfish
105
Aeoliscus strigatus (Gunther, 1860)
Razorfish Chay
Krapeu
106
Centriscus scuttatus Linnaeus, 1758
Grooved razorfish
Syngnatidae
Sea Horse, pipefishes
107
Hippocampus japonicus ?
Ses
Samot
108
Hippocampus kuda Bleeker, 1852
Spotted seahorse
Ses Samot
109
Syngnathus acus ?
Ses
Samot
Holocentridae
Squirrelfish, soldierfish
110
Holocentrus ruber ?
Squirrelfish
111
Myripristis murdjan (Forsskal, 1775)
Pinecone soldierfish or Crimson
Trey Krahom
Soldierfish
Monocentridae
Pineapplefish, Pinecone fish,
Knight fish
112
Monocentrus japonicus (Houttuyn, 1782)
Japanese Pineapplefish
Trey Manaas
Sphyraenidae
113
Sphyraena barracuda (Walbaum, 1792)
Great barracuda or Spotbase
Trey Ang Re Kantuy
Burrfish
Khmao
114
Sphyraena forsteri (Cuvier, 1829)
Bigeye barracuda or forster's
Trey Ang Re Chnuot
barracuda
115
Sphyraena jello (Cuvier, 1829)
Pickhandle barracuda, Banded
Trey Ang Re
barracuda or Giant seapike
116
Sphyraena obtusata (Cuvier, 1829)
Obtuse barracuda or striped seapike Trey Ang Re Loeung
117
Sphyraena langsar ?
Trey Ang Re
118
Sphyraena pinguis ?
Trey Ang Re
119
Sphyraena qenie Klunzinger, 1870
Military Seapike
Trey Ang Re
Mugilidae
Mullets
120
Liza alata (Steindachner, 1892) = L. vaigiensis (Quoy &
Diamond scaled grey mullet
Trey Kbak Khmok
Gaimard, 1824)
121
Valamugil ceheli (Forsskal, 1775)
Bluespot grey mullets
Trey Kbak Kong Kang
122
Valamugil speigleri (Bleeker, 1858)
Speigler's mullet
Trey Kbak Samot
Polynemidae
Threadfins, tasselfishes
123
Eleutheronema tetradactylum (Shaw, 1804)
Fourfinger threadfin or Giant
Trey Karav
Threadfin
124
Polydactylus sextarius (Bloch & Schneider, 1801)
Blackspot threadfin
125
Polydactylus plebius Broussonet, 1782
Striped threadfin or Northern
threadfin
Centropomidae
Barramundis, sea perches
126
Lates calcarifer (Bloch, 1790)
Barramundi or Giant sea perch
Trey Spong Prak
127
Psammoperca waigiensis (Cuvier, 1828)
Waigeu sea perch or Sea Bass
Trey Spong Toch
Serranidae
Groupers, rockcod, hind, comber,
Trey Tocke
coral trout, lyretail
128
Anyperodon leucogrammicus (Valenciennes, 1828)
Slender grouper or white-lined
Trey Tocke
rockcod
129
Cephalopholis analis (Valenciennes, 1828)
Strawberry hind
Trey Tocke
Reversing Environmental Degradation Trends in the South China Sea and Gulf of Thailand
NATIONAL REPORT ON FISHERIES CAMBODIA
ANNEX 1 PAGE 4
No.
Scientific name: (Species)
Vernacular name
Local name
130
Cephalopholis argus Bloch & Schneider, 1801
Peacock grouper
Trey Tocke
131
Cephalopholis aurantia (Schneider, 1801)
Golden hind
Trey Tocke
132
Cephalopholis boenack Bloch, 1790
Brown-barred grouper or chocolate Trey Tocke
hind
133
Cephalopholis formosa (Shaw & Nodder, 1812)
Bluelined hind
Trey Tocke
134
Cephalopholis hemistiktos (Ruppell, 1830)
Yellowfin hind
Trey Tocke
135
Cephalopholis leopardus (Lacepede, 1802)
Leopard grouper or leopard hind
Trey Tocke
136
Cephalopholis miniata (Forsskal, 1775)
Coral grouper or vermilion seabass Trey Tocke
137
Cephalopholis nigripinnis (Valenciennes, 1828)
Duskyfin hind
Trey Tocke
138
Cephalopholis oligosticta Randall & Ben Tuvia, 1983
Roughcheek hind
Trey Tocke
139
Cephalopholis sexmaculata (Ruppell, 1830)
Sixspot grouper or sixblotch hind
Trey Tocke
140
Cephalopholis sonnerati (Valenciennes, 1828)
Tomato grouper or tomato hind
Trey Tocke
141
Cephalopholis pachycentron (Valenciennes, 1828)
Brown-banded seabass
Trey Tocke
142
Cromileptes altivelis (Valenciennes, 1828)
Barramandi cod or Polkadot
Trey Tok Ke Chrouk
grouper or humpback seabass
143
Variola louti (Forsskal, 1775)
Coronation Trout
Trey Tocke
144
Epinephelus andersoni (Boulenger, 1903)
Catface grouper
Trey Tocke
145
Epinephelus awoara (Temminck & Schlegel, 1842
Yellow grouper
Trey Tocke
146
Epinephelus bleekeri (Vaillant, 1877)
Duskytail grouper
Trey Tocke Khmao
147
Epinephelus brunneus (Bloch, 1793)
Mud grouper
Trey Tocke
148
Epinephelus caeruleopunctatus (Bloch, 1790)
White-spotted grouper or
Trey Tocke
Ocellated Rockcod
149
Epinephelus chlorostigma (Valenciennes, 1828)
Brown-spotted grouper
Trey Tocke
150
Epinephelus cyanopodus (Richardson, 1846)
Blue Maori grouper
Trey tocke
151
Epinephelus diacantus (Valenciennes, 1828)
Thorny cheek grouper
Trey Tocke
152
Epinephelus epistictus (Temminck & Schlegel, 1842)
Broken-line grouper
Trey Tocke
153
Epinephelus fasciatus (Forsskal, 1775)
Black-tipped grouper or redbanded
Trey Tocke Krahom
grouper
154
Epinephelus fuscoguttatus (Forsskal, 1775)
Brown-marbled grouper or Flowery
Trey Tocke
cod
155
Epinephelus guaza (Linnaeus, 1758)
Trey
Tocke
156
Epinephelus hexagonatus (Bloch & Schneider, 1801)
White-specked grouper or
Trey Tocke
Hexagon Rockcod
157
Epinephelus maculatus (Bloch, 1790)
Bar-Cheeked Coral Trout
Trey Tocke Ach Phkay
158
Epinephelus malabaricus (Bloch & Schneider, 1801)
Malabar grouper
Trey Tocke Thmar
159
Epinephelus megachir (Richardson, 1846)
Honeycomb grouper
Trey Tocke
160
Epinephelus merra Bloch, 1793
Dwaft-spotted grouper or Honey
Trey Tocke
comb cod
161
Epinephelus microdon (Bleeker, 1856)
Camouflage grouper
Trey Tocke
162
Epinephelus ongus (Bloch, 1790)
White-streaked grouper or
Trey Tocke
Spekled-fin Rockcod
163
Epinephelus sexfasciatus (Valenciennes, 1828)
Six-banded rockcod
Trey Tocke
164
Epinephelus summana (Forsskal, 1775)
Summan grouper
Trey Tocke
165
Epinephelus tauvina (Forsskal, 1775)
Greasy grouper or Reef cod
Trey Tocke Khmao
166
Epinephelus tukula Morgans, 1959
Potato grouper
Trey Tocke och Thom
167
Epinephelus undulosus (Quoy & Gaimard, 1824)
Midwater grouper
Trey Tocke
168
Diploprion bifasciatum (Kuhl & van Hasselt, 1928)
Yellow emperor
169
Plectropomus aerolatus (Ruppel, 1775)
Polkadot cod
Trey Tocke phkay
170
Plectropomus leopardus (Lacepede, 1802)
Coral trout or Leopard grouper or
Trey Tocke och khiev
bluedotted coral-trout
171
Plectropomus maculatus (Bloch, 1790)
Spotted coral trout
172
Plectropomus punctatus (Quoy & Gaimard, 1824)
Mottled coral-trout
173
Plectropomus truncatus Fowler & Bean, 1930
Squaretail coral-trout
Trey Tocke
174
Promicrops lanceolatus (Bloch, 1790)
Brindle grouper
175
Variola louti (Forsskal, 1775)
Moontail seabass or Coronation
grouper
Teraponidae
Therapons, terapon-perches
176
Pelates quadrillineatus (Bloch, 1790)
Fourlined terapon or Trumpeter
Trey Trasak trachiek
khmao
177
Pelates oxyrhynchus (Temminck & Schlegel, 1842)
Blotched therapon
Trey Trasak
178
Terapon theraps Cuvier, 1829
Largescaled terapon or Banded
Trey trasak Pruy Khmao
grunter
179
Terapon jarbua (Forsskal, 1775)
Jarbua therapon or Crescent perch Trey Trasak Thom
180
Terapon puta Cuvier, 1829
Smallscaled terapon or trhee-lined
Trey Trasak
Grunter
Reversing Environmental Degradation Trends in the South China Sea and Gulf of Thailand
NATIONAL REPORT ON FISHERIES CAMBODIA
ANNEX 1 PAGE 5
No.
Scientific name: (Species)
Vernacular name
Local name
Priacanthidae
Bigeye snappers
Trey Krahom Phnek
181
Priacanthus blochii (Bleeker, 1853)
Bloch's big eye or Paeony bulleye
Thom
182
Priacanthus hamrur (Forsskal, 1775)
Crescent-tail bigeye or Moontail
Trey Kahom
bulleyes
183
Priacanthus macracanthus Cuvier, 1829
Red bigeye snapper
Trey Krahom
184
Priacanthus sagittarius Starnes, 1988
Robust bigeye
Trey Krahom
185
Priacanthus tayenus Richardson, 1846
Purple spotted bigeye snapper or
Trey Krahorm Phnek
Threadfin bigeye
Thom
Apogonidae
Cardinalfishes
186
Apogon lineatus ?
187
Apogon semilineatus Temmink & Schelgel, 1843
Black-tipped cardinalfish
188
Apogon thermalis Valenciennes, 1829
Thermal cardinalfish
189
Apogon notatus (Houttuyn, 1782)
Spotnape cardinalfish
190
Apogon aureus (Lacepede, 1802)
Ring-tailed cardinalfish
191
Apogon
fleurieu
?
192
Apogon niger ?
Sillaginidae
Sillago whitings
Trey Prolos Phka
193
Sillago maculata burrus Richardson, 1842
Trumpeter whiting
Trey Prolos och
194
Sillago sihama (Forsskal, 1775)
Silver sillago or Northern whiting
Trey Prolos
Lactariidae
195
Lactarius lactarius (Bloch & Schneider, 1801)
False Trevally
Rachycentridae
Cobias
196
Rachycentrum canadus (Linnaeus, 1766)
Cobia
Carangidae
Round scads
197
Alectis ciliaris (Bloch, 1788)
African pompano or Pennantfish
Trey Chein Chas
198
Alectis indicus (Ruppell, 1828)
Indian threadfin or diamond
Trey Cheim Chas
trevally
199
Atule mate (Cuvier, 1833)
Yellowtail scad
Trey Kuon Kum kantuy
loeung
200
Atule djedaba (Forsskal, 1775)
Solar scad or Shrimp scad
Trey kuon kum
201
Caranx para Cuvier, 1833
Banded scad
202
Alepes melanoptera (Swainson, 1839)
Blackfin trevally or Small mouth
scad
203
Atropus atropus (Bloch & Schneider, 1801)
Kuweh trevally
204
Carangoides cilliarius (Ruppell, 1830)
Longfin Cavalla
Trey Kalock Boeuv ?
205
Carangoides chrysophrys (Cuvier, 1833)
Longnose trevally or Club-nosed
Trey Kaloch Boav
trevally
206
Carangoides equula (Temminck & Schlegel, 1844)
Whitefin trevally
207
Carangoides ferdau (Forsskal, 1775)
Blue trevally
208
Carangoides fulvoguttatus (Forsskal, 1775)
Yellow spotted trevally
209
Carangoides malabaricus (Bloch & Schneider, 1801)
Malabar trevally
210
Carangoides caeruleopinnatus (Ruppell, 1830)
Coastal trevally
211
Carangoides dinema (Bleeker, 1851)
Shadow trevally
212
Carangoides plagiotaenia (Bleeker, 1857)
Barcheek trevally
213
Caranx ignobilis (Forsskal, 1775)
Giant trevally
214
Caranx
helvolus
Trevally
215
Caranx sexfasciatis Quoy & Gaimard, 1824
Bigeye trevally
Trey Chuor Khmao
216
Caranx tille Valenciennes, 1833
Tille trevally
217
Caranx lugubris Poey, 1860
Black jack
218
Caranx melampygus Cuvier, 1833
Bluefin trevally
219
Caranx speciosus (Forsskal, 1775)
Golden toothed trevally
Trey Kam Kuoch
220
Decapterus maruadsi (Temminck & Schlegel, 1842)
Round scad
Trey Kaun Kum
221
Megalaspis cordyla (Linnaeus, 1758)
Torpedo scad or Hard-tail scad
Trey Kantuoy Roeung
222
Scomberoides commersonnianus Lacepedes, 1802
Yellow queenfish or Talang
Trey Sampan / Kalang
queenfish
223
Scomberoides lysan (Forsskal, 1775)
Double-spotted queenfish
Trey Kalang
224
Scomberoides tol (Cuvier, 1832)
Needle-scaled queenfish
225
Selar crumenophthalmus (Bloch, 1793)
Bigeye scad or Purse-eyed scad
226
Selar tala (Cuvier, 1832)
Barred queenfish
227
Chorinemus sanctipetri (Cuvier, 1832)
Spotted queenfish
228
Selaroides leptolepis (Kuhl & Van Hasselt, 1833)
Yellow-stripe scad or Smooth-
tailed trevally
Reversing Environmental Degradation Trends in the South China Sea and Gulf of Thailand
NATIONAL REPORT ON FISHERIES CAMBODIA
ANNEX 1 PAGE 6
No.
Scientific name: (Species)
Vernacular name
Local name
229
Seriolina nigrofasciata (Ruppell, 1829)
Black-banded trevally
230
Trachinotus blochii (Lacepede, 1801)
Snubnose pompano or Snub-
nosed dart
231
Ulua mentalis (Cuvier, 1833)
Long-rakered trevally
232
Uraspis helvola (Forster, 1801)
White-tongue jack
Carangidae
233
Parastromateus niger (Bloch, 1795)
Black Pomfret
Trey Chap Khmao
Menidae
Moonfish
234
Mene maculata (Bloch & Schneider, 1801)
Moonfish
Caesionidae
235
Dipterygonatus balteatus (Valenciennes, 1830)
Mottled fusilier
236
Pterocaesio chrysozona (Cuvier, 1830)
Goldband fusilier
237
Caesio coerulaureus Lacepede, 1801
Blue and gold fusilier
238
Caesio erythrogaster (Cuvier, 1830)
Yellow tail fusilier
Lutjanidae
Snappers, jobfishes
239
Lutjanus argentimaculatus (Forsskal, 1775)
Mangrove red snapper
Trey Spong Krahom
240
Lutjanus bohar (Forsskal, 1775)
Twospot red snapper or Red bass
Trey Spong Krahom
241
Lutjanus fulviflammus (Forsskal, 1775)
Blackspot snapper
Trey Ang Koeuy
prachruy
242
Lutjanus lineolatus (Ruppell, 1828) = Lutjanus lutjanus
Bigeye snapper
Trey Krahom
Bloch, 1790
243
Lutjanus malabaricus (Bloch & Schneider, 1801)
Malabar red snapper or Saddle-
Trey Spong Krahom
tailed seaperch
244
Lutjanus johni (Bloch, 1792)
John's snapper or Fingermark
trey Spong
seaperch
245
Lutjanus russelli (Bleeker, 1849)
Russell's snapper
246
Lutjanus sanguineus (Cuvier, 1828)
Blood snapper
Trey Krahom
247
Lutjanus sebae (Cuvier, 1828)
Emperor red snapper
trey Korm
248
Lutjanus vitta (Quoy & Gaimard, 1824)
Brown striped snapper
Trey Krahom
249
Lutjanus erythropterus Bloch, 1790
Crimson snapper
Trey Ang Koeuy Krahom
Khnaong
250
Lutjanus gibbus (Forsskal, 1775)
Humback red snapper or
Trey Ang Koeuy Krahom
Paddletail snapper
251
Lutjanus lemniscatus (Valenciennes, 1828)
Yellow-streaked snapper or Dark-
Trey Ang Koeuy Kantuy
tailed seaperch
Kramao
252
Pinjalo pinjalo (Bleeker, 1850)
Pinjalo snapper
253
Pristipomoides typus (Bleeker, 1852)
Sharptooth snapper
254
Pristipomoides filamentosus (Valenciennes, 1830)
Blue-spotted jobfish or Rosy
snapper
Nemipteridae
Threadfin breams
Trey krahom
255
Nemipterus bathybius Snyder, 1911
Yellow-belly threadfin bream
Trey Krahom
256
Nemipterus bleekeri (Day, 1875)
Delagoa threadfin bream
257
Nemipterus flavivantris ?
258
Nemipterus hexodon (Quoy & Gaimard, 1824)
Ornate threadfin bream
Trey Krahom
259
Nemipterus japonicus (Bloch, 1791)
Japanese threadfin bream
260
Nemipterus marginatus (Valenciennes, 1830)
Pale-finned threadfin bream
261
Nemipterus mesoprion (Bleeker, 1853)
Redfilament threadfin bream
262
Nemipterus metopias (Bleeker, 1852)
Slender threadfin bream
263
Nemipterus nemurus (Bleeker, 1857)
Redspine threadfin bream
264
Nemipterus nematophorus (Bleeker, 1853)
Doublewhip threadfin bream
265
Nemipterus peronii (Valenciennes, 1830)
Rosy threadfin bream
266
Nemipterus tambuloides (Bleeker, 1853)
Fivelined threadfin bream
267
Nemipterus tolu (Valenciennes, 1830)
Notched threadfin bream
Trey Krahom
268
Nemipterus virgatus (Houttuyn, 1782)
Golden threadfin bream
269
Scolopsis bilineatus (Bloch, 1793)
Twolined monocle bream
270
Scolopsis bimaculatus (Ruppell, 1828)
Thumbprint monocle bream
271
Scolopsis monogramma (Kuhl & van Hasselt, 1830)
Monogrammed monocle bream
272
Scolopsis frenatus (Cuvier, 1830)
Seychelles monocle breams
273
Scolopsis taeniopterus (Kuhl & van Hasselt, 1830)
Lattice or Redspot monocle bream
274
Scolopsis vosmeri (Bloch, 1792)
Whitecheek monocle bream
275
Pentapodus porosus (Valenciennes, 1830)
False Whiptail
Lobotidae
Tripletails
276
Lobotes surinamensis (Bloch, 1790)
Tripletail
Reversing Environmental Degradation Trends in the South China Sea and Gulf of Thailand
NATIONAL REPORT ON FISHERIES CAMBODIA
ANNEX 1 PAGE 7
No.
Scientific name: (Species)
Vernacular name
Local name
Leiognathidae
Ponyfishes
277
Gazza minuta (Bloch, 1797)
Toothed ponyfish
Trey Sambor Hea / Kie
278
Leiognathus bindus (Valencienes, 1835)
Orangefin ponyfish
279
Leiognathus daura (Cuvier, 1829)
Goldstripe ponyfish
280
Leiognathus elongatus (Gunther, 1874)
Slender ponyfish
281
Leiognathus equulus (Forsskal, 1775)
Common ponyfish
282
Leiognathus fasciatus (Lacepede, 1803)
Striped ponyfish
283
Leiognathus leuciscus (Gunther, 1860)
Whipfin ponyfish
284
Leiognathus smithursti (Ramsay & Ogilby, 1886)
Smithurst's ponyfish
285
Leiognathus splendens (Cuvier, 1829)
Splendid ponyfish
286
Leiognathus sp.
Yellowspot ponyfish
287
Leiognathus elociscus ?
288
Leiognathus linealatus ?
289
Leiognathus nuchalis ?
290
Leiognathus rivulatus ?
291
Secutor insidiator (Bloch, 1787) ?S. ruconius (Hamilton,
Pugnose ponyfish
1822?)
Gerreidae
Mojarras, silver-biddies
292
Gerres abbreviatus (Bleeker, 1850)
Deepbody mojarra
293
Gerres filamentosus Cuvier, 1829
Whipfin mojarra
Trey Do Angkor
294
Gerres oyena (Forsskal, 1775)
Common mojarra
295
Gerres poiti ?
296
Pentaprion longimanus (Cantor, 1850)
Longfin mojarra
Haemulidae
Grunters, Sweetlips
297
Plectorhinchus nigrus ?
298
Plectorhinchus pictus (Thunberg, 1792)
Yellowdot sweetlips
299
Plectorhinchus lineatus (Linnaeus, 1758)
Diagonal-banded sweetlips
300
Pomadasys guoraka ?
301
Pomadasys hasta (Bloch, 1790) =P. kaakan (Cuvier,
Lined silver grunt
1830)
302
Pomadasys maculatum (Bloch, 1797)
Blotched grunt or Blotched
javelinfish
303
Pomadasys opercularis (Playfair, 1866)
Small-spotted grunt
Sciaenidae
Croakers, drums
304
Pennahia argentata (Houtuyn, 1782)
Silver pennah croaker
305
Pennahia macrocephalus (Tang, 1937)
Big-head pennah croaker
306
Pennahia pawak (Lin, 1940)
Pawak croaker
307
Pennahia macrophthalmus (Bleeker, 1850)
Bigeye croaker
308
Aspericorvina jubata (Bleeker, 1855)
Prickly croaker
309
Dendrophysa russelli (Cuvier, 1830)
Goatee croaker
310
Johnius vogleri (Bleeker, 1853)
Sharp-toothed hammer croaker or
Little jewfish
311
Johnius belangerii (Cuvier, 1830)
Belanger's croaker
312
Johnius dussumieri (Valenciennes, 1833)
Bearded croaker
313
Nibea semifasciata Chu, Lo & Wu, 1963
Sharpnose croaker
314
Nibea soldado (Lacepede, 1802)
Soldier croaker
315
Otolithes ruber (Schneider, 1801)
Tiger-toothed croaker
Trey Chang-caum Bey
316
Otolithes cuvieri (new name proposed here by E.
Lesser tiger-toothed croaker
Trey Chang-caum Bey
Trewavas)
Toch
317
Protonibea diacanthus (Lacepede, 1802)
Spotted croaker or Black jew
Trey Pama Samot
318
Pseudosiaena polyatis ?
Lethrinidae
Emperors, scavengers
trey Kroab Khnuor or
Ang Koeuy
319
Lethrinus baematopterus ?
320
Lethrinus choerorhynchus (Bloch & Schneider, 1801)
Bluestreak emperor
Trey Ang Koeuy
321
Lethrinus harak (Forsskal, 1775)
Blackspot emperor or Thumbprint
Trey Ang Koeuy Khnao
emperor
khmao
322
Lethrinus lentjan (Lacepede, 1802)
Redspot emperor or Purple-
Trey Ang Koeuy Sar
headed emperor
323
Lethrinus miniatus (Schneider, 1801)
Longface emperor or Sweetlip
Trey Ang Koeuy
emperor
324
Lethrinus ornatus Valenciennes, 1830
Ornate emperor
Trey Spong Chnot
Reversing Environmental Degradation Trends in the South China Sea and Gulf of Thailand
NATIONAL REPORT ON FISHERIES CAMBODIA
ANNEX 1 PAGE 8
No.
Scientific name: (Species)
Vernacular name
Local name
Pentapodidae
Large-eye breams
325
Gymnocranius griseus (Schlegel, 1843)
Grey large-eye bream
326
Gymnocranius robinsoni (Gilchrist & Thompson, 1908)
Blue-lined large-eye bream
Mullidae
Goatfishes
327
Parupeneus cyclostomus (Lacepede, 1801)
Goldsaddle goatfish
328
Parupeneus heptacanthus (Lacepede, 1801)
Spotted golden goatfish
329
Parupeneus indicus (Shaw, 1903)
Indian goatfish
330
Parupeneus chrysopleuron (Schlegel, 1843)
Yellow striped goatfish
331
Parupeneus barberinoides (Bleeker, 1801)
Swarthy-headed goatfish
332
Parupeneus rubescens (Lacepede, 1801)
Rosy goatfish
333
Upeneus bensasi (Temminck & Schlegel, 1842)
Bensasi goatfish
334
Upeneus sulphureus Cuvier, 1829
Yellow goatfish
335
Upeneus sundaicus (Bleeker, 1855)
Ochrebanded goatfish
336
Upeneus tragula Richarson, 1846
Freckled goatfish or darkband
goatfish
337
Upeneus taeniopterus (Cuvier, 1829)
Fin-stripe goatfish
338
Upeneus vittatus (Forsskal, 1775)
Yellow-striped goatfish
Ephippidae
Spadefishes
339
Ephippus orbis (Bloch, 1787)
Spadefish
Platacidae
Batfishes
340
Platax pinnatus (Linnaeus, 1758)
Pinnate batfish or Long-finned
batfish
Drepanidae
Sicklefishes
341
Deprane longimana (Bloch & Schneider, 1801)
342
Deprane punctata (Linnaeus, 1758)
Spotted Sicklefishes
Trey Trachiek Damrey
Scatophagidae
Scats
343
Scatophague argus (Linnaeus, 1766)
Spotted scat
Chaetodontidae
Butterflyfishes
344
Chaetodon collare Bloch, 1787
Collare butterflyfish
345
Chaetodon modestus (Temminck & Schlegel, 1842)
346
Chaetodon ornatissimus Cuvier, 1831
Ornate butterflyfish
347
Parachaetodon ocellatus (Cuvier, 1831)
Ocellate coralfish
348
Heniochus acuminatus (Linnaeus, 1758)
Longfin bannerfish
349
Coradion chrysozonus (Cuvier, 1831)
Orange-banded coralfish
Pomacanthidae
Angelfishes
350
Pomacanthus annularis (Bloch, 1787)
Blue-ringed angelfish
Trey Me Ham Boa
351
Pomacanthus imperator (Bloch, 1787)
Emperor angelfish
352
Pomacanthus semicirculatus (Cuvier, 1831)
Semicircle angelfish or Blue
angelfish
Cepolidae
Bandfishes
353
Cepola
schlegeli
?
Pomacentridae
Damselfishes
354
Pomacentrus planifrons ?
355
Pomacentrus tripunctatus Cuvier, 1830
Threespot damsel
356
Neopomacentrus cyanomos (Bleeker, 1856)
Regal demoiselle
357
Abudefduf sordidus Forsskal, 1775
Blackspot sergeant major
Labridae
Wrasses, hogfishes, razorfishes,
coris, tuskfishes
358
Bodianus macrourus (Lacepede, 1801)
Black-banded hogfish
359
Choerodon anchorago (Bloch, 1791)
Orange dotted tuskfish
360
Choerodon robustus (Gunther, 1862)
Robust tuskfish
361
Choerodon sp.
Tuskfish
362
Labroides dimidiatus (Valenciennes, 1839)
Cleaner wrasse
363
Pseudolabris gracillis ?
Scaridae
Parrotfish
364
Scarus ghobban Forsskal, 1775
Yellowscale or Blue-barred
Trey Sek Loeung
parrotfish
365
Hipposcarus harid (Forsskal, 1775)
Candelamoa parrotfish
Trey Sek
Pinguipedidae
Sandmelts, sandperch, grubfishes
366
Parapercis nebulose (Quoy & Gaimard, 1824)
Barfaced sandmelts or Red-barred
grubfish
367
Parapercis pulchella (Temminck & Schlegel, 1843)
Reversing Environmental Degradation Trends in the South China Sea and Gulf of Thailand
NATIONAL REPORT ON FISHERIES CAMBODIA
ANNEX 1 PAGE 9
No.
Scientific name: (Species)
Vernacular name
Local name
Uranoscopidae
Stargazers
368
Uranoscopus guttatus (Cuvier, 1829)
Champsodontidae
Gapers
369
Champsodon snyderi ?
370
Champsodon microphthalmus (Regan, 1908)
Callionymidae
Dragonets
371
Callionymus calliste ?
Blenniidae
Combtooth and sabertoot blennies
372
Salarias fasciatus (Bloch, 786)
Banded blenny
373
Xiphasia setifer Swainson, 1839
Hair-tail blenny
Derepodichthydae
Cutlassfishes, hairtailtail fish, frost
fishes, scabbardfish
374
Derepodichthys alepidotus ?
Brotulidae
375
Hoplobrotula armata ?
Siganidae
Spinefeet, Rabbit fishes
376
Siganus canaliculatus (Park, 1797)
White-spotted spinefoot or
Trey Kantang Ploeung
Smudgespot spinrfoot
377
Siganus javus (Linnaeus, 1766)
Streaked spinefoot or Java
Trey Kantang
spinefoot
378
Siganus fuscescens (Houttuyn, 1782)
Black spinefoot
Trey Kantang Phes
Trichiuridae
Hairtails
379
Trichiurus lepturus Linnaeus, 1758
Largehead hairtail
Trey Kok
380
Eupheurogrammus muticus (Gray, 1831)
Smallhead hairtail
Scombridae
Tunas
381
Auxis rochei (Risso, 1810)
Corseletted frigate mackerel
Trey Chheam
382
Auxis thazard (Lacepede, 1803)
Frigate mackerel, Bullet tuna
383
Rastrelliger brachysoma (Bleeker, 1851)
Short-bodied mackerel
Trey Kamong / Pla Thu
384
Rastrelliger kanagurta (Cuvier, 1817)
Indian mackerel
Trey Palang
385
Scomberomorus commerson (Lacepede, 1800)
Narrow-barred Spanish mackerel
Trey Beka
386
Scomberomorus guttatus (Bloch & Schneider,
Indo-Pacific Spanish mackerel
Trey Beka
1801)
387
Scomberomorus lineolatus (Cuvier, 1831)
Streaked Spanish mackerel
Trey Beka
388
Scomberomorus
sinensis
?
Trey
Beka
389
Sarda orientalis (Temminck & Schlegel, 1844)
Striped bonito or Oriental bonito
Trey Chheam
390
Thunnus maccoyii (Castelnau, 1872)
Southern bluefin tuna
Trey Beka
Xiphiidae
Indo-Pacific swordfishes,
Sailfishes, Marlins
391
Xiphias gladius Linnaeus, 1758
Swordfish
Stromateidae
White pomfrets
392
Pampus argenteus (Euphrasen, 1788)
White pomfret, Silver pomfret
Trey Chap Sar
Ariommidae
Ariommas
393
Ariomma indica (Day, 1870)
Indian ariomma(= Indian driftfish)
Gobiidae
Gobies
394
Gobiodon histrio (Valenciennes, 1837)
Broad-barred Maori goby
395
Acentrogobius gracilis (Bleeker, 1875)
Mangrove goby
396
Istigobius ornatus (Ruppell, 1830)
Ornate goby
Gobioididae
397
Ctenotrypauchen microcephalus ?
398
Laenioides gracilis ?
399
Odontamblyopus rubicunchus ?
Scorpaenidae
Scorpion fishes
400
Apistops coloundra (De Vis, 1886)
Shortfinned waspfish
401
Pterois antennata (Bloch, 1787)
Ragged-finned firefish
402
Pterois russellii Bennett, 1831
Plaintail turkeyfish or Spotless
firefish
403
Synanceja verrucosa (Bloch & Schneider, 1801)
Reef stonefish
Trey Khmoch
404
Sinanceja horrida (Linnaeus, 1766)
Estuarine Stonefish
405
Sebastapistes cyanostigma (Bleeker, 1856)
Yellow- spotted scorpionfish
406
Scorpaena aquabe (Flower & Steinitz, 1956)
Scorpion fish
Trey King Kuok
407
Scorpaenodes littoralis (Tanaka, 1917)
Shore scorpionfish
Trey King Kuok
408
Scorpaenopsis gibbosa (Bloch & Schneider, 1801)
Humpbacked scorpionfish
Trey King Kuok
Reversing Environmental Degradation Trends in the South China Sea and Gulf of Thailand
NATIONAL REPORT ON FISHERIES CAMBODIA
ANNEX 1 PAGE 10
No.
Scientific name: (Species)
Vernacular name
Local name
409
Inimicus sinensis (Valenciennes, 1833)
Spotted Stinger
Triglidae
Gurnards & Searobin
410
Lepidotrigla argus Ogilby,1910
Long-Finned Gurnard
Platycephalidae
Spiny flatheads
411
Cociella crocodilus (Tilesius, 1812)
Crocodile flathead
Trey Kantuy Krabey
412
Platycephalus indicus (Linnaeus, 1758)
Bartail flathead
Trey Kantuy Krabey
413
Suggrundus macracanthus (Bleeker, 1869)
414
Trysanophrys cirronasus ?
415
Trudis arenarius ?
416
Plalycephalidae gen sp. ?
Exocoetidae
417
Cypselurus sp. ?
Flyingfish Trey
Chap
Dactylopteridae
Flying gurnards
Trey Chap
418
Dactyloptaenia orintalis (Cuvier, 1829)
Oriental flying gurnard
419
Dactyloptaenia peterseni (Nystrom, 1887)
Starry flying gurnard
Psettodidae
Spiny turbots, halibut
420
Psettodes erumei (Bloch & Schneider, 1801)
Indian spiny turbots, Indian
Trey Oob Tuuk Kmao
halibuts
Bothidae
Lefteye Flounders
Trey Andat Chke
421
Arnoglossus profundud (Kotthaus, 1977)
422
Chascanopsetta lugubris (Alcock, 1894)
Pelican flounder
423
Engyprosopon grandisquama (Temminck &
Largescale flounder
S hl
l 1846)
424
Grammatobothus polyophthalmus (Bleeker,1866)
Three-spot flounder
425
Pseudorhombus arsius (Hamilton, 1822)
Largetooth flounder
Trey Oob Tuuk Krahom
426
Pseudorhombus dupliocellatus (Regan, 1905)
Ocellated flounder
427
Pseudorhombus elevatus Ogilby, 1912
Deep flounder
428
Pseudorhombus javanicus (Bleeker, 1853)
Javan flounder
429
Pseudorhombus malayanus (Bleeker, 1866)
Malayan flounder
430
Pseudorhombus quinquocellatus (Weber & de
Fivespot flounder
B
f t 1929)
431
Pseudorhombus triocellatus (Gilchrist, 1905)
Natal flounder
Pleuronectidae
Righteye flounders
432
Samaris cristatus Gray, 1831
Cockatoo flounder
433
Samariscus inornatus (Lloyd, 1909)
Soleidae
Soles
434
Aseraggodes cyaneus (Alcock, 1890)
435
Pardachirus pavoninus (Lacepede, 1802)
Peacock sole
436
Solea ovata (Richardson, 1849)
437
Zebrias quagga (Kaup, 1858)
Fringefin zebra sole
Cynglossidae
Tongue soles
Trey Andat Chke
438
Cynoglossus abbreviatus (Gray, 1834)
Threelines tongue sole
Trey Andat Chke
439
Cynoglossus bilineatus (Lacepede, 1802)
Fourlined tongue sole
Trey Andat Chke
440
Cynoglossus cynoglossus (Ham. Buch., 1822)
Bengal tongue sole
Trey Andat chke
441
Cynoglossus puncticeps (Richardson, 1846)
Speckled tongue sole
Trey Andat Chke
Echeneidae
Remoras, sharksucker, discfishes
442
Echeneis naucrates Linnaeus, 1758
Live sharksucker or Slender
suckerfish
443
Remora remora (Linnaeus, 1758)
Remora
Triacanthidae
Tripodfish, triplespine
444
Triacanthus strigilifer (Cantor, 1849)
Long-spined tripodfish
Balistidae
Triggerfish
445
Abalistes stellatus (Bloch & Schneider, 1801)
Starry trigger fish
Trey Kuor
446
Balistapus undulatus (Park, 1797)
Red-lined triggerfish
447
Balistes fuscus ? Pseudobalistes fuscus (Bloch &
Yellow-spotted triggerfish
Schneider, 1801)
448
Melichthys vidua (Solander, 1844)
Pinktail triggerfish
Monacanthidae
Filefishes, leather jackets
449
Chaetoderma penicilligera (Cuvier, 1817)
Prickly leatherjacket
450
Paraluteres prionurus (Bleeker, 1851)
Mimic leatherjacket
451
Aluterus monoceros (Linnaeus, 1758)
Yellow finned or Unicorn
Trey Kuor
leatherjacket
452
Aluterus scriptus (Osbeck, 1765)
Scribbled leatherjacket
Reversing Environmental Degradation Trends in the South China Sea and Gulf of Thailand
NATIONAL REPORT ON FISHERIES CAMBODIA
ANNEX 1 PAGE 11
No.
Scientific name: (Species)
Vernacular name
Local name
453
Paramonacanthus japonicua (Tilesius, 1809)
Psilocephalidae
454
Psilocephalus barbatus ?
Ostraciidae
Boxfishes, cowfishes
Trey Kuor
455
Lactoria cornuta (Linnaeus, 1758)
Longhorn cowfish
456
Ostracion cubicus Linnaeus, 1758
Yellow boxfish
457
Ostracion gibbosus ?
458
Tetrasomus gibbosus (Linnaeus, 1758)
Hunchback boxfish or Black-
blotched turretfish
Tetraodontidae
Puffer fish, blow fish, tobies
Trey Kampot
459
Arothron hispidus (Linnaeus, 1758)
Bristly puffer or Stars and Stripes
toadfish
460
Arothron stellatus (Bloch & Schneider, 1801)
Star puffer
461
Arothron leopardus (Day, 1878)
462
Chelonodon patoca (Hamilton-Buchanan, 1822)
Milk-spotted toadfish
463
Fugu rubrispes ?
464
Fugu oblongus (Bloch, 1786)
465
Fugu niphobbes ?
466
Lagocephalus inermis (Temminck & Schlegel,
Smooth golden toadfish
1844)
467
Lagocephalus lunaris (Bloch & Schneider, 1801)
Rough golden toadfish
468
Lagocephalus scleratus (Gmelin, 1788)
Silver toadfish
Diodontidae
Porcupine fishes
469
Diodon holacanthus (Linnaeus, 1758)
Freckled porcupine fish
470
Diodon hystrix Linnaeus, 1758
Porcupine fish
Batrachoididae
Frogfishes
471
Batrichthys
grunniens?
Antennariidae
Frogfishes (also sea mice,
anglerfish)
472
Antennarius hispidus (Bloch & Schneider, 1801)
Shaggy anglerfish
473
Histrio histrio (Linnaeus, 1758)
Sargassum fish
Pegasiidae
474
Pegasus elongatus ?
475
Apogon volitans (Linnaeus, 1758) = Pegasus
Slender seamoth
volitans Linnaeus, 1758
476
Apogon umitengu ?
Reversing Environmental Degradation Trends in the South China Sea and Gulf of Thailand
NATIONAL REPORT ON FISHERIES CAMBODIA
ANNEX 2 PAGE 1
ANNEX 2
List of Marine Crabs of Cambodia
(Sources: Jensen & Try, 2002)
No. Scientific name
Common name
Khmer name
1
Chryptopodia fornicate (Fabricius, 1781) Kdam
Snok
2
Ozins quttatus Milne Edward,1834
Spottedbelly rock crab
Kdam Phkor Loin
3
Scylla serrata (Forsskål, 1775)
Giant mud crab
Kdam Thmor
4
Thalamita crenata (Latreille, 1829)
Crenate swimming crab
Kdam Thmor khiev
Episesarma singaporenes (Tweendie,
5
Singapore vinegar crab
Kdam Choi
1936)
6
Episesarma versicolor (Tweendie, 1940) Violet vinegar crab
Kdam Choi
7
Matuta victor (Fabricius, 1781)
Common moon crab
Kdam Sor/Loeng Khchal
8
Dorippe frascome (Herbst, 1785)
Kdam Saka Do
9
Parthenope longispinis (Mier, 1879)
Kdam Ping Peang Ban Lar
10
Charybdis natator , Hrebst
Hairy swimming crab
Kdam Neak
11
Podophthalmus vigil (Fabricius, 1798)
Sentinel crab
Kdam Phnek Veng
12
Charybdis feriatus (Linnaeus, 1758)
Crucifix crab
Kdam Khla
13
Portunus pelagicus (Linnaeus, 1758)
Flower crab
Kdam Ses
Kdam Ping Peang Kut
14
Doclea tetraptera Walker, 1890
Srouch
Two spined arm swimming
15
Charybdis anisodon (de Haan, 1850)
Kdam Dang Kieb Sor
crab
16
Dorippe granulate de Hann, 1841
Kdam Saka Do
17
Lincosia rhomboidalis de Hann, 1850
Haswell's button crab
Kdam Khlok
18
Hyastenus pleione (Herbst, 1803)
Kdam Ping Peang
19
Ixa cylindricus (Fabricius, 1777)
Kdam Dom Bong
20
Arcania sagamiensis Sakai, 1969
Khdam Pong Peang
Reversing Environmental Degradation Trends in the South China Sea and Gulf of Thailand
NATIONAL REPORT ON FISHERIES CAMBODIA
ANNEX 3 PAGE 1
ANNEX 3
List of Marine Molluscs of Cambodia
(Sources: Jensen & Try, 2002)
MARINE BIVALVES
No.
Scientific name
Common name
Khmer name
1
Amusium pleuronectes (Linnaeus, 1758)
Asian moon scallop
Khchorng/Krom Plet
2
Malleus albus Lamarck, 1819
White hammer oyster
Khchorng/Krom PoThav Dai
3
Trisidos tortuosa (Linnaeus, 1758)
Prepellor ark
Kreng Chheam Korng Har
4
Placamen calophyllum (Phillipi, 1846)
Frilled venus clam
Ngeav/Krom Sror kar Neak
5
Anadara nodifera (Martens, 1860)
Nodular ark
Kreng Chheam
6
Pteria penguin (Röding, 1798)
Penguin wing oyster
Khchorng/Krom Tror Ses
7
Pinna bicolor Gmelin, 1791
Bicolor pen shell
Khchorng/Krom Chorb Chik
8
Tridacna squamosa Lamarck, 1819
Fluted giant clam
Krom Yaik
9
Vepricardium sinese (Sowerby, 1841)
Chinese cockle
Kreng Chheam Moit Viech
10
Meretrix lyrata (Sowerby, 1851)
Lyrate hard clam
Kchorng/Kreng Sor
11
Perna viridis (Linnaeus, 1758)
Green mussel
Khchorng/Krom Chom Pus Tea
12
Scapharca inaequivalvis (Bruquière, 1789)
Inequivalve ark
Kreng Chheam Moit Viech
13
Pharella javanica (Lamarck, 1818)
Javanese razor clam
Khchorng Bam Pung/Krom Veng
14
Anadara binakayanensis (Faustino, 1932)
Globose ark
Kreng Chheam Mo Mis
15
Meretrix lusoria (Röding, 1798)
Poker-chip venus
Ngeav Sor/Ngeav Hol
16
Polymesoda erosa (Solander, 1786)
Common geloina
Ngeav Phouk
17
Donax cuneatus Linnaeus, 1758
Cradle or cuneate donax
Ngeav Sar/Lies Sa Mort
18
Paphia undulata (Born, 1778)
Undulate venus
Ngeav/Krom Kra la Hol
19
Anomalocardia squamosa (Linnaeus, 1758)
Squamose venus
Ngeav Khloy/Kreng Moit Viech
20
Gafrarium tumidum Röding, 1798
Tumid venus
Ngeav Phlet
21
Modiolus metcalfei (Henley, 1843)
Yellowbanded horse mussel
Krom Chorng Chak/ Ta Puk
22
Asaphis violascens Forsskåll, 1775
Pacific asaphis
Kreng Chheam/Sor
23
Grassostrea belcheri (Sowerby, 1871)
Belcher's oyster
Khchorng Dam Rey/Bei Dom
24
Anadara granosa (Linnaeus, 1758)
Blood cockle or Granular ark
Kreng Chheam
MARINE GASTROPODS
No.
Scientific name
Common name
Khmer name
1
Turbo marmoratus Linnaeus, 1758
Green Turbo or Green snail
Khchorng Brak/Kuch
2
Turbo petholatus Linnaeus, 1758
Tapestry turban
Khchorng Kror La Prum
3
Rapana rapiformis (Born, 1778)
Turnish shaped rapa
Khchorng Ban La Choeung Muoy
4
Strombus canarium Linnaeus, 1758
Dog conch
Khchorng Choeung Muoy
5
Haliotis asinina Linnaeus, 1758
Donkey's ear abalone
Khchorng Pao Hoeu Veang
6
Haliotis ovina Gmelin, 1791
Oval abalone
Khchorng Pao Hoeu Khley
7
Cypraea tigris Linnaeus, 1758
Tiger cowrie
Khchorng Beer Leak
Reversing Environmental Degradation Trends in the South China Sea and Gulf of Thailand
NATIONAL REPORT ON FISHERIES CAMBODIA
ANNEX 3 PAGE 2
No.
Scientific name
Common name
Khmer name
8
Strombus luhuanus Linnaeus, 1758
Strawberry conch
Khchorng Thnot/Khbal Khla
9
Harpa major Röding, 1798
Major harp
Khchorng Kam Bau/Spoeu
10
Cypraea talpa Linnaeus, 1758
Mole cowrie
Khchorng Beer Thnot
11
Turritella terebra (Linnaeus, 1758)
Screw turret
Khchorng Sang/Dek Kol
12
Vexillum taeniatum Lamarck, 1811
Banded vexillum
Khchorng Dek Khoung Poir
13
Phallium glaucam (Linnaeus, 1758)
Grey baonnet
Khchorng Kan Dul
14
Cymbiola nobilis (Lightfoot, 1786)
Nodle volute
Khchorng Thnot
15
Lambis chiragra chiragra (Linnaeus, 1758)
Chiragra spider conch
Khchorng Bat Dai/Ban La
16
Ellobium aurisjudae (Linnaeus, 1758)
Judas ear cassidula
Khchorng Moit Viech
17
Melo melo (Lightfoot, 1786)
Indian volute
Khchorng Dong
18
Natica lineata (Röding, 1798)
Lined moon snail
Khchorng Phnek Broeus Chnot
19
Cassis cornuta (Linnaeus, 1758)
Horned helmet
Khchorng Khla/Som Bol Bei
20
Chicoreus ramosus (Linnaeus, 1758)
Ramose murex
Khchorng Ban La/Khchorng Sang
21
Cellana testudinaria (Linnaeus, 1758)
Turtoiseshell limpet
KhchorngDong/Dors Kra Mom
22
Cellana radiata (Born, 1778)
Indo-Pacific limpet
Khchorng Doun/Dors Kra Mom
23
Ficus subintermedia (Orbigny, 1852)
Underlined fig shell
Khchorng Choeung Moiy Kror La Sam
Nanh
24
Bufonaria ranaLinnaeus, 1758
Common frog shell
Khchorng Ban La Kley
25
Conus straitus Linnaeus, 1758
Straited cone
Khchorng Thnot Kror La Kom
26
Conus textile Linnaeus, 1758
Textile cone
Khchorng Kror La Sam Nanh
27
Babylonia areolata Link, 1807
Maculated ivory whelk
Khchorng Pong Kroch
28
Conus betulinus Linnaeus, 1758
Beech cone
Khchorng Ang Re
29
Strombus urceus (Linnaeus, 1758)
Little pitcher conch
Khchorng Sang Toch
30
Chicoreue brunneus (Link, 1807)
Adusta murex
Khchorng Ban La Teal
31
Phalium bisulcatum (Schuber&Wagner, 1829)
Sophia's bonnet
Khchorng Huch
32
Murex trapa Röding, 1798
Rarespined murex
Khchorng Ban La Vieng
33
Telebralia palustris (Linnaeus, 1758)
Mud creeper
Khchorng Deak Kol
34
Cerithidae quadrata (Sowerby, 1866)
Quadrate horn shell
Khchorng Chak Chreang
35
Archetectonica perspectiva (Linnaeus, 1758)
Clear sundial
Khchorng Rong Vel
36
Pugilina cochlidium (Linnaeus, 1758)
Spira melongena
Khchorng Ban La Teal
37
Polinices didyma Röding, 1798
Bladde moon snail
Khchorng Phnek Broeus Leat
38
Turbo bruneus (Röding, 1798)
Brown pacific turban
Khchorng Brak
39
Natica vitellus (Linnaeus, 1758)
Calf moon snail
Khchorng Phneak Broeus/ Khchorng
Pong Chab
40
Monodonta labio (Linnaeus, 1758)
Labio monodont
Khchorng Kror Ob Moit Chrok
41
Pugilina ternatana (Gmelin, 1791)
Ternate melongena
Khchorng Kam bor
42
Pugilina colosseus (Lamarck, 1860)
Colossal melongena
Khchorng Kam Bor Kout Moul
Reversing Environmental Degradation Trends in the South China Sea and Gulf of Thailand
NATIONAL REPORT ON FISHERIES CAMBODIA
ANNEX 4 PAGE 3
ANNEX 4
List of Marine Mammals of Cambodia
(Sources: Tana, 1997; Beasley et al., 2001; Longdy & Sokhannaro 2002)
No.
Scientific name
Common name
Khmer name
1
Orcaella brevirostris
Irrawaddy dolphin
Psoit Kbal Trorlok
2
Neophocaena phocaenoides
Finless porpoise
Psoit Oet Bruy Khanorng
3
Sousa Chinensis
Indo-Pacific Hump-backed dolphin
Psoit Khaleach
4
Dugong dugon
Dugong Chrouk
Toeuk
5
Tursiops aduncus
Indo-Pacific bottlenose dolphin
Psoit Chror Mos Dorb Chompus Khley
6
Tursiops truncatus
Common bottlenose dolphin
Psoit Chror Mos Dorb Chompus Veng
7
Stenella attenuata
Pantropical spotted dolphin
Psoit Uch
8
Delphinus capensis
Long-beaked common dolphin
Psoit Khamao Leoung
9
Stenella longirostris
Dwarf spinner dolphin
Psoit Chhanaut Phanek
roseinventris
10
Globicephala macrorhynchus
Short-fined pilot whale
Ba Lenn Kbal Thom
11
Balaenoptera edeni
Bryde's whale
Ba lenn Yairk
12
Pseudorca Crassidens
False killer whale
Ba LennKam Nach or Ba Lenn Kror Bey
Reversing Environmental Degradation Trends in the South China Sea and Gulf of Thailand


United Nations
UNEP/GEF South China Sea
Global Environment
Environment Programme
Project
Facility
NATIONAL REPORT
on
The Fish Stocks and Habitats of Regional, Global, and
Transboundary Significance
in the South China Sea
INDONESIA
Mr. Parlin Tambunan
Focal Point for Fisheries
Directorate General of Capture Fisheries
Ministry of Marine Affairs and Fisheries
Jl Medan Merdeka Timur No. 16, Jakarta Pusat 10110, Indonesia
PREFACE
This National Report is based on the results of the study completed by the UNEP/GEF
consultant into Reversing Environment Degradation Trends in The South China Sea and Gulf of
Thailand, with the title "Fish Stocks and Habitats of Regional, Global and Transboundary Significance in
the South China Sea - Indonesia".
The review is based on previous studies, secondary data, and information gained from a
number of linked institutions as previously agreed by the RWG-F.
The Editorial Team would like to thank: (i) the Director of Fisheries Resources, Directorate
General of Capture Fisheries as the Fisheries Focal Point for his support to the team in finishing the
report; (ii) the National Committee of Fisheries and other linked institutions that have provided valuable
inputs and other assistance so that we could complete this National Profile on fisheries together.
Finally, we hope that this report may be useful as a source of information regarding Indonesian
fisheries for interested parties.
NATIONAL REPORT ON FISHERIES INDONESIA
Table of Contents
1. BACKGROUND ............................................................................................................................1
1.1 OVERVIEW OF THE FISHERIES SECTOR ...................................................................................1
1.1.1 Total catch by fishing area, port of landing or province (by species/species group).1
1.1.2 Fishing effort by gear .................................................................................................3
1.1.2.1 Trawl .............................................................................................................4
1.1.2.2 Purse seine/ring net......................................................................................5
1.1.2.3 Gill net...........................................................................................................6
1.1.2.4 Traps.............................................................................................................6
1.1.3 Economic value of catch............................................................................................6
1.1.4 Importance of the Fisheries Sector in Terms of Employment & Dependence ..........7
2.
SPECIES OF REGIONAL, GLOBAL AND/OR TRANSBOUNDARY SIGNIFICANCE...............8
2.1 RANKING OF IMPORTANCE IN TERMS OF...................................................................................8
2.1.1 Landings (by site or province)....................................................................................8
2.1.2 Local market value...................................................................................................10
2.1.3 Status (endangered, threatened, rare etc.) .............................................................10
2.1.4 Food security (locally)..............................................................................................11
2.2 BIOLOGY & ECOLOGY OF THE SPECIES (FROM AVAILABLE INFORMATION).................................11
2.2.1 Large pelagic fishes.................................................................................................11
2.2.2 Small pelagic species ..............................................................................................11
2.2.3 Demersal fish species..............................................................................................13
2.2.4 Commercially exploited invertebrates......................................................................13
2.2.4.1 Penaeid shrimps .........................................................................................13
2.2.4.2 Squids .........................................................................................................14
2.2.4.3 Sea urchins.................................................................................................14
3. CURRENT
STATUS & THREATS..............................................................................................14
3.1 STATUS OF THE FISHERY IN TERMS OF CPUE .......................................................................14
3.2 STATUS OF FISH STOCKS BASED ON HISTORICAL REVIEW OF LANDINGS AND CPUE...............15
3.3 THREATS.............................................................................................................................15
3.3.1 Current .....................................................................................................................15
3.3.2 Potential ...................................................................................................................16
4.
HABITATS & AREAS OF IMPORTANCE IN THE MAINTENANCE OF EXPLOITED
FISH STOCKS ............................................................................................................................16
4.1 PHYSICAL, CHEMICAL, AND BIOLOGICAL CHARACTERISTICS.....................................................16
4.1.1 Spawning and nursery grounds ...............................................................................17
4.1.2 Fishing grounds .......................................................................................................19
4.2 STOCKS WITH UNDEFINED SPAWNING GROUNDS ....................................................................19
4.3 THREATS (CURRENT AND POTENTIAL)....................................................................................19
4.4 RANKING OF HABITATS .........................................................................................................19
4.4.1 Association with species of importance to food security .........................................19
4.4.2 Association with high values species ......................................................................19
4.4.3 Association with endangered, rare, threatened species..........................................19
5. CURRENT
MANAGEMENT REGIMES......................................................................................19
5.1 LEGAL INSTRUMENTS ...........................................................................................................19
5.2 INSTITUTIONAL ARRANGEMENTS (RESEARCH, MONITORING, CONTROL, & ENFORCEMENT) ........20
5.3 THE GOVERNMENT OF INDONESIA'S POLICY TO OVERCOME IUU FISHING PRACTICES ..............21
5.4 OVERVIEW OF PATTERNS OF RESOURCE OWNERSHIP AND TRADITIONAL UTILISATION ...............22
6. RECOMMENDED ACTIONS ......................................................................................................22
6.1 FISH RESOURCES ................................................................................................................22
6.2 HABITAT DEGRADATION........................................................................................................23
6.3 HUMAN RESOURCES ............................................................................................................23
REFERENCES......................................................................................................................................24
ii
NATIONAL REPORT ON FISHERIES INDONESIA 1
1.
BACKGROUND
1.1
Overview of the Fisheries Sector
The objectives of capture fisheries management in Indonesia are to improve the welfare of the fishers,
conserve fisheries resources and their environments, and increase foreign exchange earnings. The
fisheries sector not only plays an important role in providing food for the nation, it also serves as a
source of employment, income, and foreign exchange.
Small-scale fisheries play a dominant role in contributing fish for the domestic market or local
consumption. On the other hand, landings for export are mostly derived from semi-industrial fisheries.
Most inshore fish resources have been more intensively exploited than those offshore have.
Accordingly, fisheries in the South China Sea waters of Indonesia require sound management aimed at
rebuilding resources and sustaining marine and coastal ecosystem integrity. The central and provincial
governments have established a number of fisheries regulations, although they need to be
implemented more vigorously. In managing the country's fisheries, the Code of Conduct for
Responsible Fisheries has been used as a prime reference by government.
Over the 10-year period from 1991 to 2001, Indonesian fisheries have demonstrated slight increases in
landings and their contribution to the national economy. Fish production from both capture fisheries and
aquaculture in the South China Sea area increased at an average of 4.47% per annum during the
period. Marine capture fisheries increased as much as 2.05% per annum. Fish landings for export of
tunas and shrimps increased by an average of 8.49% and 5.48% per annum, respectively. During the
same period, the contribution of fisheries to GDP increased at an average of 4.27% per annum.
1.1.1 Total catch by fishing area, port of landing or province (by species/species group)
During the last 10 years, Indonesia's landings of marine fishes from the South China Sea and its
adjacent waters, as part of the Sunda Shelf, have increased at an average of 2.05% per annum. It is
surprising that during the same period, landings of skipjack tuna increased by more than 20%. So far,
landings of other tunas have been variable, decreasing slightly from 1997 to 1998, followed by slight
increases in recent times.
There are a number of landing places for the fleet fishing in the South China Sea, namely those located
on the Island of Sumatra (Provinces of Riau, Jambi, South Sumatra and Bangka Belitung) and
Kalimantan (Province of West Kalimantan). Figures 1 provides a map of Indonesian waters, whilst
Figure 2 shows the Indonesian provinces that border the South China Sea. On average, fish landings in
each province are approximately 200,000 tonnes per year, except in Jambi where landings are rarely
more than 50,000 tonnes in a year.
Growth in total marine landings from the South China Sea accelerated from 1991 to 2000, although
declined to approximately 0.5 million tonnes in 2001. In 2001, the total marine landings of 516,671
tonnes consisted of 40.27% (208,080 tonnes) demersal fishes, 31.15% (160,944 tonnes) pelagic fishes,
18.73% (96,783 tonnes) crustaceans, 6.13% (31,653 tonnes) molluscs, and 0.24% (1,237 tonnes)
miscellaneous species or groups. Table 1 presents the landings of each group from the South China
Sea from 1991 to 2001. Note that the catch of demersal fish levelled off since 1996. Similarly, the catch
of pelagic fishes was stable from 1996 to 1999. Landings of demersal fish declined from 2000 to 2001.
In light of increased levels of fishing effort, these catch trends indicate overfishing, especially for
demersal fish stocks.
Reversing Environmental Degradation Trends in the South China Sea and Gulf of Thailand
2 NATIONAL REPORT ON FISHERIES INDONESIA
100°
110°
120°
130°
140°
N
W
E
10°
S
10°
PACIFIC OCEAN
SOUTH CHINA SEA
SULAWESI SEA
SU
M
0°
AT
KALIMANTAN
0°
ER
A
SULAWESI
P A P U A
JAVA SEA
BANDA SEA
J A V A
FLORES SEA
I
ARAFURA SEA
NDI
10°
AN
10°
OCEA
N
100°
110°
120°
130°
140°
Figure 1
Map of Indonesian Waters, including the South China Sea, Java Sea, Flores Sea,
Sulawesi Sea, Pacific Ocean, Banda Sea, Arafura Sea, and Indian Ocean.
100°
104°
108°
112°
116°
M
N
ALA
W
E
CCA S
SOUTH CHINA SEA
S
TRA
IT
4°
4°
NO
S
R
U
T
M
H
ATE
RA
R
EAST
I
KALIMANTAN
A
W
U
S E
0°
U S
WEST
M T
0°
AT
KALIMANTAN
ERA
CENTRAL
J A M B I
KALIMANTAN
BANGKA
SOUTH
I
B
N
E
SOUTH
BELITUNG
D
NG
KALIMANTAN
K
SUMATERA
IA
UL
4°
N
U
4°
OCE
AN
LAMPUNG
JAVA SEA
100°
104°
108°
112°
116°
Figure 2
Indonesian provinces bordering the South China Sea, including the provinces of
Riau, Jambi, South Sumatra, Bangka-Belitung, and West Kalimantan.
Reversing Environmental Degradation Trends in the South China Sea and Gulf of Thailand
NATIONAL REPORT ON FISHERIES INDONESIA 3
Table 1 Total landings of fish groups in the South China Sea from 1991 to 2001 (tonnes).
Category
1991 1992 1993 1994 1995 1996 1997 1998 1999 2000 2001
Demersal
377,760 404,995 417,069 426,244 462,487 510,777 529,461 526,491 566,019 668,992 208,080
Pelagic
749,593 803,873 827,928 846,208 918,877
1,014,588
1,050,817
1,044,774
1,123,784
1,332,128 160,944
Crustaceans
27,907 29,257 29,237 30,966 30,640 32,487 41,865 51,704 45,800 51,224 96,783
Molluscs
11,679 12,566 15,597 14,687 18,494 16,626 20,231 15,797 22,432 25,793 31,653
Other
0 3,280 2,361 472 1,261 1,334 262
0
0
23 1,237
Total
1,166,939 1,253,971 1,292,192 1,318,577 1,431,759 1,575,812 1,642,636 1,638,766 1,758,035 2,078,160 498,697
Source: Directorate General of Fisheries (DGF) (1993; 2003)
The bag gillnet (a gillnet fitted with a bag and pulled by a fishing boat) and fish net are commonly used
by the commercial sector to exploit demersal fishes. Whilst set gillnets, hook and lines, and tidal-traps
are most commonly used by fishers to catch demersal fish, especially in the eastern areas of Sumatra,
including Riau, Jambi, South Sumatra, and Bangka-Belitung provinces. Sumiono et al. (2003) provide
a review of the demersal fishery in the South China Sea, particularly the assessment of the distribution
and abundance of demersal fish resources. Assessment of the status of currently fished demersal
stocks indicates that these resources are biologically fully-exploited.
In 2001, marine fisheries in the South China Sea area contributed 516,671 tonnes, or about 13%, to the
total landings of marine fish in Indonesia. Total landings in Riau Province were 306,092 tonnes (59.24%
of the total landings in the South China Sea), followed by West Kalimantan with 65,049 tonnes
(12.59%), Bangka-Belitung with 54,223 tonnes (10.49%), South Sumatra with 46,192 tonnes (8.94%),
and Jambi with 45,115 tonnes (8.73%) (Table 2).
Table 2
Marine fish landings (tonnes) in Indonesian provinces adjacent to the South China
Sea in 2001.
Category
Province
Total
Demersal Pelagics Crustaceans Molluscs Others
Riau 116,644
116,544
51,175 20,492
1,237
306,092
Jambi 16,677
6,878
19,009
2,551
0
45,115
South Sumatera
24,718
14,799
6,154
521
0
46,192
Bangka-Belitung 26,961 17,974
3,525
5,763
0 54,223
West Kalimantan
23,080
22,723 16,920
2,326
0
65,049
Source: DGF (2003)
1.1.2 Fishing effort by gear
The distribution of fish resources in Indonesian waters of the South China Sea is concentrated in
inshore waters. The bulk of marine fish landings are derived from small-scale fisheries conducted in
coastal waters. Fishing activities are significantly influenced by the occurrence of the two monsoon
periods that alternate on a biannual basis.
The fisheries statistics published annually by the Directorate General of Fisheries (DGF) highlight the
wide range of gear types and fishing boats employed in Indonesian fisheries. Specifically, 29 fishing
gear types are used, ranging from simple traditional gears, including hand lines, to more complex
"modern" gears, including purse seines and longlines.
For planning purposes, Indonesia's marine fisheries sector is divided into small, medium, and large-
scale fisheries. Both medium and large-scale fisheries are distinguished from small-scale fisheries by
the use of inboard engine powered boats. Similarly, large-scale fisheries are differentiated from
medium-scale fisheries based on investment levels and the areas in which they are permitted to
operate. In this report, fishing activities are divided into 2 categories.
According to DGF, all boats powered by inboard engines (typically diesel) can be classified as either
medium or large-scale. Small-scale fisheries, which are the most important in terms of employment,
number of fishing units, and quantity of landings, are distinguished from the other categories by type of
boat employed.
Indonesian marine fisheries in the South China Sea are mostly small-scale. Small-scale fisheries are
defined as those in which fishing is conducting using boats powered by sail or outboard engines.
Reversing Environmental Degradation Trends in the South China Sea and Gulf of Thailand
4 NATIONAL REPORT ON FISHERIES INDONESIA
Fishers operating fishing gear without boats are also classified as small-scale. So far, Indonesia's
small-scale fishing fleet has been divided into the following 3 categories:
(i) Dug out boat, i.e., boat made of hollowed-out logs. In 2001, only 0.02% of this boat type in
Indonesia was observed in the South China Sea.
(ii) Non-powered plank built boats are divided into small (<7 m in length); medium (7 to 10m), and
large (>10 m) categories. In 2001, the combined total number of these boats was 40,470, or
15.49% of the total fishing boats in Indonesia.
(iii) Out-board motor powered boats have engines attached to the rear of the boat. Some of these
boats use modified gasoline or diesel generators with a long trailing propeller shaft and engine
from 2 to 15 HP. In 2001, there were 230 boats of this type, or 0.22% of the total fishing boats
in Indonesia.
The numbers of units of each fishing boat type are presented in Table 3.
At present, marine capture fisheries in the Indonesian part of the South China Sea are characterised by
the use of various types of fishing gear to catch a diverse range of Indonesian fish species. These
fishing gears are categorised into commercial fishing gears, including Danish seines, purse seines,
drift/gillnets, and traditional fishing gears, including hook and line, trammel nets, liftnets, and traps.
However, the fishing gears contributing to the bulk of the landings include Danish seines, purse seines,
drift/gill nets, hook and line, and tidal-trap nets. Table 4 provides the number of fishing gear units used
in the Indonesian part of the South China Sea.
Table 3
Number of fishing boats by sub-sector and size used in Indonesian waters of the
South China Sea in 2001.
Boat type
Boat number
Percentage
1. Small-scale fishery
dug-out boat
19
0.03
plank-built boat
- small
5,592
9.61
- medium
5,831
10.02
- large
1,055
1.81
out-board motor
4,979
8.56
Sub total
17,476
30.03
2. Medium-scale fishery
In-board powered boats:
- less than 5 GT
29,208
50.20
- 5 to 10 GT
9,243
15.87
- 10 to 20 GT
1,522
2.62
- 20 to 30 GT
501
0.86
Sub total
40,474
69.55
3. Large-scale fishery
- 30 to 50 GT
110
0.19
- 50 to 100 GT
75
0.13
- 100 to 200 GT
44
0.08
- 200 to 300 GT
1
0.001
Sub total
230
0.42
T o t a l
58,180
100
Source: DGF (2003)
1.1.2.1 Trawl
As trawl fishing has been banned in Indonesian waters since 1980, except in the Arafura Sea, there is
no trawling conducted legally in the Indonesian part of the South China Sea. The Indonesian
Government is now combating illegal fishing in its territorial waters and exclusive economic zone (EEZ).
It is also working with neighbouring countries to curb regional problems with illegal fishing.
Reversing Environmental Degradation Trends in the South China Sea and Gulf of Thailand
NATIONAL REPORT ON FISHERIES INDONESIA 5
Table 4
The number of fishing gear units used in Indonesian waters of the South China Sea
from 1991 to 2001.
Fishing
gear
1991 1992 1993 1994 1995 1996 1997 1998 1999 2000 2001
Payang (included
1,094 817 1,233 1,208 1,146 1,239 2,005 3,282 35,375 3,764 543
Lampara)
Danish
seine
240 296 297 281 240 201 221 241 241 241 375
Beach
seine
1,140 1,122 1,154 1,114 2,117 2,168 1,741 1,782 16,975 1,952 1,726
Purse
seine
71 62 62 77 129 155 734 840
1,011
1,210
1,187
Drift
gill
nets
7,397 7,493 7,724 8,202 7,808 8,233 9,531 10,202 10,372 10,281 7,486
Encricling
gill
nets
432 465 478 491 583 549 343 608 428 248 277
Shrimp
gill
nets
2,423 2,852 3,120 2,491 1,935 2,099 1,449 2,444 20,995 1,858 597
Set
gill
nets
3,359 3,358 3,453 3,529 5,148 5,175 4,481 4,966 4,973 5,098 5,135
Trammel
nets
2,267 1,969 1,823 1,713 1,772 1,820 4,667 2,629 2,591 2,103 2,878
Boat/Raft
nets
828 1,213 900
0 932 1,015 1,069 1,030
0
0
0
Bagan
(included
Kelong) 2,366 2,459 3,056 4,138 3,621 3,783 4,501 5,107 4,437 4,689 3,115
Scoop
nets
1,316
1,085 805 558
1,103 796 796
1,293 690 279 512
Other
lift
nets
3,915 1,330 1,290 1,200 1,184 1,157 1,149 1,050 893 1,114 1,515
Tuna
long
line
0 0 0 0 0 0 0 0 0 0 0
Drift
long
line
639 709 596 394 306 325 358 179 592 464 526
Set
long
line
2,249 1,945 2,258 2,468 3,263 6,093 6,475 6,736 7,585 4,772 4,748
Skipjack
pole
and
line 0 0 0 0 0 0 0 0 0 0 0
Other
pole
and
line
9,468 9,393 10,106 10,428 8,241 11,595 12,238 13,752 10,760 9,916 8,107
Troll
line
830 889 1,210 1,202 760 877 1,295 1,362 1,217 1,269 1,236
Guiding
barriers
1,100 1,603 1,569 1,855 2,795 2,680 3,281 3,650 3,125 2,675 1,996
Stow
nets
2,996 3,380 2,342 2,642 2,793 2,738 3,816 3,006 3,710 5,852 5,534
Portable
traps
792 364 882 714 1,367 2,827 1,687 1,851 1,570 1,368 1,390
Other
traps
1,435 1,649 1,505 1,880 2,429 2,466 2,436 2,184 21,355 2,204 1,735
Shell
fish
collection
2,744 2,327 4,356 2,636 1,462 1,515 1,342 1,389 1,280 1,678 1,998
Sea
weed
collection
77 0 0 36 0 0 0 0 0 99 0
Muroami
33 0 0 0 0 0 0 0 0 21
100
Cast
nets,
Harpon,
etc. 956 806
1,138 573 53 134 412 409 322 477 534
Source: DGF (1993;2003)
1.1.2.2 Purse seine/ring net
Since the banning of trawl fishing in the 1980's, landings from the purse seine fleet have played a
significant and dominating role in Indonesia's fish production. Purse seines are commonly used in all
Indonesian waters to catch small tunas and other pelagic fishes. However, purse seine use is
particularly prevalent in the Sunda Shelf area of Indonesia. The number of purse seine boats operating
in the Indonesian part of the South China Sea increased from 71 units in 1991 to 1,187 units in 2001.
Purse catches have increased accordingly from 2,141 tonnes in 1991 to 35,935 tonnes in 2001 (DGF
1993; 2003). Despite this growth trend, the catch per unit effort (CPUE) of purse seine operations has
steadily declined over the last five years.
According to Potier and Sadhotomo (1994), 3 kinds of purse seine boats are used in the Java Sea, the
South China Sea, and the Makassar Strait. Mini-purse seine fisheries use wooden boats with semi
dugout and planked boats. The fishing areas are located along the coast, approximately 30 miles
offshore. They stay at sea for 1 to 3 days. The medium sized purse seine fisheries use wooden boats
fitted with inboard engines of 35 to 100 HP. Boat lengths range from 15 to 20m, with a capacity to hold
between 20 and 25 tonnes of fish. They stay at sea for 8 to 15 days. The large purse seine fisheries
use flat bottom boats fitted with inboard engines of at least 160 HP. These boats typically have a fish
holding capacity of 50 to 80 tonnes, and are operated by a crew of 30 to 40 fishers.
The large purse seine boats usually operate in the Indonesian part of the South China Sea. Most of the
purse seine boats in the South China Sea area are wooden, with a size range from 80 to 100 GT. Most
boats are equipped with electronic and mechanical devices, including a generator (6000 watt), sonar,
depth sounder, radar, direction finder, and power block. In general, 1 to 3 deployments are conducted
per boat per night. The purse seine itself is usually 400 to 750m long, 50 to 100m deep, with a mesh
size of 0.75 inches in the bunt area. Purse seine catches are dominated by shortfin scad (Decapterus
macrosoma), followed by Indian mackerel (Rastrelliger kanagurta).
Reversing Environmental Degradation Trends in the South China Sea and Gulf of Thailand
6 NATIONAL REPORT ON FISHERIES INDONESIA
1.1.2.3 Gill net
Gill nets are single-walled nets found in various mesh sizes. Fish of different body shapes and sizes are
gilled, wedged, or entangled in gillnets as they attempt to swim through them. Trammel nets are
included in this group. These are passive gear, but fishers may drive or herd fish into gill nets. The use
of drifting gill nets is widespread and most common in the Indonesian part of the South China Sea. The
netting material is monofilament for small-scale gill nets, and multifilament for large-scale gill nets.
Drifting gill nets hang on floats just below the surface and are used to capture various pelagic species.
Gill nets used to catch demersal species are set on the seafloor with the use of anchors and ballast.
However, trammel nets are increasingly replacing set gill nets. Trammel nets consist of 3 panels of
netting of different mesh size. The primary target species of trammel nets are shrimp.
Drifting gillnets are commonly used to catch pelagic fish in coastal waters adjacent to Riau and West
Kalimantan Provinces. The number of units of this gear type used in the Indonesian part of the South
China Sea increased from 7,397 units in 1991 to 10,281 units in 2000. However, the number of trammel
nets used remained relatively stable during the same period.
1.1.2.4 Traps
This gear category includes large stationary gears (guiding barriers and stow nets) and various small
traps. Guiding barriers (sero) consist of a long stationary barrier set perpendicular to the current.
Generally, guiding barriers are used along the coast of eastern Sumatra and the Malacca Straits.
Typically, these gears consist of a series of four enclosed chambers, flanked by two wings and a
prolonged leader. This arrangement is made of bamboo poles and slabs of split bamboo. It is regarded
as a traditional fishing gear, and is used to catch demersal finfish and shrimps in shallow protected
waters. Stow nets (jermal), or filter bag nets, are set or towed against a current. They usually have
wings made of netting, bamboo matting, or leaves and branches. In the waters of East Sumatra and
West Kalimantan, the wings of jermal are made from bamboo poles. In these areas, this gear is set
semi-permanently in relatively deep waters, with the bamboo pole wings leading into the trap mouth.
A survey was conducted during a series of high tides in the coastal waters of Riau from October to
November 1998. Badrudin et al. (2001) reported that the catches of guiding barrier and stow nets
ranged from 100 to 200 kg per haul. The net was usually hauled twice a day.
1.1.3 Economic value of catch
The total value of Indonesian marine fish landings from the South China Sea was 3,345,864 million
Rupiah. From the view point of value, Riau Province generated revenues as high as 1,201,802 million
Rupiah in 2001, followed by Bangka-Belitung Province with 728,041 million Rupiah, West Kalimantan
Province with 946,282 million Rupiah, South Sumatra Province with 270,311 million Rupiah, and Jambi
Province with 199,426 million Rupiah (Table 5).
Table 5
Volume and value of Indonesian marine fish landings from the South China Sea in
2000 and 2001.
2000 2001
Province
Volume
Value
Volume
Value
(ton)
(Rp. 1,000.-)
(ton)
(Rp. 1,000.-)
Riau 286,290
1,163,592,330 261,519 120,1802356
South Sumatera
157,530
394,821,930 46,192 270,311,450
Jambi 41,106
308,375,005 44,935 199,426,680
West Kalimantan
61,503
766,724,585 64,616 946,282,452
Kepulauan Bangka Belitung*)
107,409
728,041,855
Total 546,429
2,633,513,850 524,671 3,345,864,793
*) New province since 2001.
Source: DGF (2003) (1 US$ = 8,500 to 9,500 Rupiah)
Reversing Environmental Degradation Trends in the South China Sea and Gulf of Thailand
NATIONAL REPORT ON FISHERIES INDONESIA 7
During 1999, the main fish groups exported from Indonesia's catches in South China Sea areas were
penaeid shrimp and tuna, including skipjack tuna and eastern little tuna. Riau Province made the
largest contribution to fish exports (87,935 tonnes), followed by the provinces of South Sumatra (9,690
tonnes), West Kalimantan (2,829 tonnes), and Jambi 2,068 (tonnes). Of the total 102,522 tonnes of fish
product exports, penaeid shrimps and tuna contributed 11,024 tonnes and 2,656 tonnes, respectively.
The remaining 88,842 tonnes was comprised of `other' non-specified species (Table 6).
Table 6
Fishery exports from Indonesian provinces bordering the South China Sea in 1999
(tonnes).
South
West
Fish resources
Riau
Jambi
Total
Sumatra
Kalimantan
Penaeid shrimps
4,667
1,866 1,812 2,679
11,024
Tunas 2,636
0
20
0
2,656
Others 80,632
202
7,858
150
88,842
Total 87,935
2,068
9,690 2,829
102,522
Source: DGF (2001).
1.1.4 Importance of the Fisheries Sector in Terms of Employment & Dependence
The province of Riau has Indonesia's largest South China Sea fishing area. As a result, Riau is the
largest fish producing and exporting province adjacent to the South China Sea. Additionally, Riau
Province has the largest number of fisheries labourers. In 2001, this province provided employment for
94,502 full-time and 33,109 part-time fishers. At that time, the number of full-time and part-time fishers
employed in other provinces was: South Sumatra Province, 9,121 and 10,462; West Kalimantan
Province, 17,409 and 24,887; Jambi Province, 2,382 and 1,283; and Bangka-Belitung Province, 32,228
and 8,229 (Table 7).
Table 7
Number of full-time and part-time fishers in Indonesian provinces adjacent to the
South China Sea in 2001.
Province Full-time Part-time Total
Riau 94,502
33,109
127,611
Jambi 2,382
1,283
3,665
South Sumatra
9,121
10,462
19,583
West Kalimantan
17,409
24,887
42,296
Bangka-Belitung
32,288
8,229
44,517
Total 146,634
69,768
216,402
Source: DGF (2003).
There are many small fishing boats working in Indonesian areas of the South China Sea, namely: (i)
non-powered boats; (ii) boats with outboard engines; and (iii) boats with inboard engines. In 2001, there
were 29,208 fishing boats with inboard engines and a size of 5 GT or less, 12,497 non-powered boats,
and 9,243 boats with inboard engines and a size from 5 to 10 GT (Table 8).
Riau and West Kalimantan Provinces own more boats than the other provinces. A number of large
inboard engine fishing boats (100 to 200 GT) are based in West Kalimantan Province.
Table 8
Number of different sized fishing boats operating in Indonesian waters of the
South China Sea in 2001.
Province Non-
Outboard
<5 GT
5 10
10-20
20-30
30-50
50-100
100-200
powered
engine
GT
GT
GT
GT
GT
GT
Riau
8,193 1,808
17,385
6,366 787 101 74 31 29
Jambi
107
0
3,570
408
167
147 1 0 0
South
Sumatra
910 100
2439
410 46 132 12 17
0
West Kalimantan
1,685
1,66
1,652
1,367 317 121 23 27 16
Bangka-Belitung Isl.
1,602
1,807
4,162
683
205 0 0 0 0
Total 12,497
4,979
29,208
9,243
1,522 501 110 75
45
Source: DGF (2003).
Reversing Environmental Degradation Trends in the South China Sea and Gulf of Thailand
8 NATIONAL REPORT ON FISHERIES INDONESIA
2.
SPECIES OF REGIONAL, GLOBAL AND/OR TRANSBOUNDARY SIGNIFICANCE
2.1
Ranking of importance in terms of
2.1.1 Landings (by site or province)
The 208,080 tonnes of demersal fish landed in 2001 was 29% higher than the total volume of pelagic
fish landings. Approximately 70% of demersal fish landings were derived from commercial fishing.
Traditional fishing gears, especially tidal trap-nets, are the main fishing gear types used to catch
demersal fish species in eastern Sumatran waters. Within the last decade, i.e., from 1991 to 2001,
demersal fish catches were dominated by red snappers (7.48%), followed by sea catfish (6.55%),
croakers (4.90%), Bombay-duck (4.50%), threadfin bream (4.37%), sharks (3.64%), and rays (3.31%)
(Table 9). The remaining groups of demersal fish belonged to the 'others' category that composed
about 43.46% of total catch (DGF 1993; 2003).
So far, the category of 'other' has been used for demersal fish of poor commercial value, including
species of the families of Apogonidae, Plotosidae, Pomacanthidae, Platycephalidae, Tetraodontidae,
and Ophiidae, as well as juveniles of commercially important species such as the white pomfret
(Pampus argenteus). This category dominated catches in the tidal trap-net fishery conducted along the
east coast of Sumatra and the west coast of Kalimantan. According to Badrudin et al. (2001), the
catches of tidal trap-nets in coastal waters of Riau Province were dominated by juveniles of Bombay-
duck (Harpodon nehereus), hair-fin anchovy (Setipinna spp.), small individuals of black pomfret (Formio
niger), marine catfish (especially Arius caelatus), and shrimps.
Based on the results of a trawl survey conducted in Indonesia's South China Sea areas, there are a
number of demersal species, including red eyes fish (Priacanthus tayenus), red seabreams (Scolopsis
taeniopterus, Nemipterus tambuloides, and Nemipterus peronii), lizardfish (Saurida undosquamis), and
goatfish (Upeneus bensasi), that are almost always present in landings.
Table 9
Catch composition by group of species of demersal fish (tonnes) in Indonesian
waters of the South China Sea from 1991 to 2001.
Common
names
1991 1992 1993 1994 1995 1996 1997 1998 1999 2000 2001 Ave.
(%)
Indian
halibuts
559 556 941 369 627 958 1,279
1,772 1,446
1,373 1,541 0.50
Flat
fishes
154 172 427 24 102 437 1,046 783 767 273 287 0.19
Bombay
duck 13,784
11,188
11,018
10,765
9,538
8,622 9,346
9,613 6,763
6,785 6,093 4.50
Pony
fishes
1,726 1,840 1,959 2,837 3,517
2,882 5,123
4,617 5,913
6,229 1,555 1.66
Sea
catfishes
10,418 10,250 11,668 12,696 15,464 16,379
16,803 16,785 15,061 14,073 110,130
6.55
Lizard
fishes
0 0 0 0 0 0
0 0 0 0 0
0.00
Goat
fishes
201 200 154 137 353
1,183
748 850 857
1,149 1,288 0.31
Grunters
2,152 2,144 2,809 2,783 2,953 3,370
3,901 3,886 3,230 3,581 3,400 1.49
Red
snappers
12,948 14,586 13,574 14,002 14,693 17,840
18,556 18,912 18,642 14,848 13,585
7.48
Groupers
1,572 3,286 5,837
16,509 4,837 5,274
5,525 5,852 5,941 7,129 6,933 2.99
Emperors
850 429 866 826
1,640
2,276 2,568
2,995 2,994
3,172 2,413 0.91
Barramundi
2,747 2,114 2,364 2,064 6,305 4,906
5,066 7,924 8,156 5,944 6,115 2.33
Treadfin
breams
8,292 8,672 8,181 8,996 9,400
13,003 8,956
10,315 9,903
8,531 6,229 4.37
Big
eyes
341 273 12 8
119 6 357 7 0
463 0
0.07
Yellow
tails/Fusiliers 3,894 3,064 2,055 4,138 3,296 7,814 10,747 10,240 10,211 9,097 8,956 3.19
Croakers/Drums 6,795 8,502
10,012 6,312 7,524
12,802 11,906
11,739 14,226
11,482 11,436 4.90
Sharks
6,372 7,396 9,084 6,964 8,082 7,627
7,489 7,690 7,841 8,265 6,859 3.64
Rays
5,372 5,904 6,128 5,350 6,382 7,606
8,114 8,780 9,333 8,506 4,730 3.31
Black
pomfret
3,918 3,714 4,035 5,844 4,063 4,934
5,360 4,751 4,904 4,935 5,314 2.25
Silver
pomfret
2,046 2,191 2,234 2,450 2,895 4,041
3,972 4,560 5,593 6,311 5,509 1.82
Threadfins
3,425 2,536 2,418 2,662 8,016 4,828
6,156 6,309 7,243 7,150 7,320 2.52
Hair
tail
1,720 2,362 1,838 1,129 1,931
15,482
1,942 2,609 2,501 1,977 2,520 1.57
Others
87,045 90,327 90,788 88,766 83,718 89,519
88,746 88,440 101,744 122,848 68,023 43.46
Total
176,331 181,706 188,402 195,631 195,455 231,789
223,706 229,429 243,269 254,121 280,236
100
Source: DGF (1993; 2003).
The landing of pelagic fishes from the South China Sea was 160,944 tonnes in 2001. Most of the
landings, about 72%, came from Riau Province, 14% from West Kalimantan Province, 11% from
Bangka-Belitung Province, 9% from South Sumatra Province, and 6% from Jambi Province. Landings
of pelagic fish from the South China Sea from 1991 to 2001 are presented in Table 10.
Eastern little tuna (10.43%), fringescale sardinella (8.99%), Indian mackerel (7.65%), narrow-barred
king mackerel (6.49%), wolf herring (6.41%), and anchovies and trevallies (5.98%) dominated catches
of pelagic fish. The remainder of the catch was recorded under the category of 'others', representing as
much as 30.83% of total pelagic landings (Table 10).
Reversing Environmental Degradation Trends in the South China Sea and Gulf of Thailand
NATIONAL REPORT ON FISHERIES INDONESIA 9
Table 10
Catch composition of pelagic fish (tonnes) in Indonesian waters of the South China
Sea from 1991 to 2001.
Ave.
Common
names
1991 1992 1993 1994 1995 1996 1997 1998 1999 2000 2001 (%)
Barracudas
898
1,051 970 183
1,181 749 716 957 995 804 796
0.03
Scads
285
0 199 202 1,669 2,180 2,907 3,624 4,048 6,592 6,685 1.37
Trevallies
9,345 9,497 8,020 8,985 11,709 12,969 13,342 13,910 14,019 14,557 7,289 5.98
Jacks trevallies
1,462 1,845 1,914 2,931 2,229 2,882 2,373 3,954 4,068 3,427 2,441 1.43
Hjardtail scads
792 892 1,078 1,004 830 1,222 1,323 2,148 2,353 2,436 552 0.71
Queen fishes
2,008 2,127 2,300 1,819 3,262 2,927 3,067 3,737 4,843 4,138 2,901 1.60
Rainbow runner
120 122 147 268 287 190 0
0
0 0
0
0.05
Flying fish
0
0
0 0 176 283 396 470 510 0
0
0.09
Mullets
2,879 4,018 4,191 4,280 4,314 5,236 5,080 4,892 5,281 5,143 4,077 2.39
Needle fishes
70
89 407 583 992 1,386 1,049 1,434 1,475 1,550 4,573 0.66
Anchovies
8,043 8,581 8,378 8,787 11,030 10,756 18,298 15,966 13,777 16,131 3,845 5.98
Rainbow sardine
2,288 2,336 4,358 4,290 5,108 5,391 3,303 5,932 5,742 5,882 9,484 2.62
Fringescale sardinella
16,236 16,688 15,186 14,579 14,962 16,368 15,621 20,487 23,339 23,196 9,161 8.99
Indian sardinella
8,126 8,250 7,352 8,444 9,522 9,544 8,591 9,709 11,446
11,545 278 4.49
Wolf herrings
8,979 7,933 8,447 9,212 12,978 13,589 15,393 13,566 14,424 14,762 13,289 6.41
Chinese herrings
0 0 0 0 0 0
68
100 96
40
920
0.06
Indian mackerels
9,959 10,082 11,027 16,807 19,689 20,558 18,423 13,119 15,740 16,192 6,539 7.65
Indo-pacific king mackerel
568 581 629 630
1,098 954 808
1,011 612
1,137
1,241
0.45
Narrow barred king mackerel
10,843 10,160 9,824 10,334 14,281 14,389 16,913 13,246 13,575 12,036 8,631 6.49
Tunas
91 93 0 0 0 0 0 64 0 0
433
0.03
Skipjack tuna
6 473
0 0 763 717
3,198
3,536
3,649
4,446
4,685
1.04
Eastern little tuna
13,642 14,715 14,830 16,475 19,764 19,252 20,881 21,301 18,790 28,354 27,595 10.43
Others
52,226 55,805 53,973 54,147 51,629 57,105 56,817 61,107 66,290 78,503 45,529 30.63
Total
148,866 155,338 153,230 163,960 187,473 198,647 208,567 214,270 225,072 250,871 160,944
100
Source: DGF (1993;2003)
Atmadja (1999) described the scad population that is fished in the southern part of the Sunda Shelf, i.e.,
the Java Sea. In general, the distribution of Decapterus russelli was concentrated in the southern part
of the South China Sea. It was found that the scads (Decapterus spp.) provided the major component
of the small pelagic fish resources in those areas. Additionally, Wagiyo and Nurdin (2002) describe the
small pelagic fish resources of northern Indonesia waters, adjacent to Anambas and Natuna Islands.
According to this study, a number of species of Clupeidae and Carangidae dominate the small pelagic
fish fauna in this part of the South China Sea. Trolling has recently been conducted to catch large
pelagic species such as tuna, whilst fish nets are used in waters less than 40 m deep to catch demersal
fish.
The other important fisheries resource landed in Indonesian waters of the South China Sea is shrimp.
Shrimp fisheries in this area are still limited to waters less than 20m deep. The gears used to catch
shrimp by small-scale and medium-scale fishers include Danish seines, trammel nets, lift nets, and
tidal-trap nets. In 2001, 43,974 tonnes of shrimp were caught in the South China Sea area. These
catches were comprised of white shrimps (17.36%), endeavor shrimps (17.29%), tiger shrimps (8.98%),
and smaller sized shrimps (other shrimps) (56.37%). The smaller sized shrimp catch was composed of
the genera of Metapenaeus, Parapenaeopsis, and Metapenaeopsis. These species dominate shrimp
catch in almost all Indonesian provinces bordering the South China Sea. The total landings by shrimp
categories are presented in Table 11.
Table 11
Catch of shrimp in Indonesian waters of the South China Sea from 1991 to 2001
(tonnes).
Ave.
Category
1991 1992 1993 1994 1995 1996 1997 1998 1999 2000 2001 (%)
Tiger
1,950 1,634 1,753 1,640 1,736 1,287 1,581 3,522 3,412 4,116 3,950 6.40
White
5,209 6,086 6,179 5,978 6,548 6,418 7,124 9,919 11,632 13,380 7,635 20.75
Endeavor 2,937 2,927 2,819 3,289 3,696 3,946 10,099 19,006 8,530 12,000 7,605 18.52
Other
17,811 18,610 18,487 20,059 18,661 20,836 23,061 19,257 22,226 21,728 24,784 54.33
Total
27,907 29,257 29,238 30,966 30,641 32,487 41,865 51,704 45,800 51,224 43,974 100
Source: DGF (1993; 2003).
Reversing Environmental Degradation Trends in the South China Sea and Gulf of Thailand
10 NATIONAL REPORT ON FISHERIES INDONESIA
2.1.2 Local market value
The development of fish price in the South China Sea and its adjacent waters is as follows:
In the province of North Sumatra from January to July 2002, the price of tuna-like fishes and lobsters
decreased from 10,250 Rupiah/kg and 80,000 Rupiah/kg to 6,250 Rupiah/kg and 70,000 Rupiah/kg,
respectively. On the other hand, the price of shrimp increased from 22,000 Rupiah/kg in January to
25,000 Rupiah/kg in July.
During the same period, price for tuna-like species also decreased in the Provinces of South Sumatra,
Jakarta, West Java, Central of Java, and East Java. Whilst in the provinces of West and South
Kalimantan, tuna prices increased to 14,000 Rupiah/kg. In Jakarta, the price of yellowfin tuna from
March to June 2002 was 3,500 Rupiah/kg, whilst that for albacore and skipjack declined from 8,000
Rupiah/kg and 4,000 Rupiah/kg to 6,000 Rupiah/kg and 3,000 Rupiah/kg, respectively. The price of
tuna-like fishes declined drastically from January to July. i.e., from 9,500 Rupiah/kg to 2,200 Rupiah/kg.
The price of shrimp in West Java Province was stable at 50,000 Rupiah/kg, although in Central Java it
increased from 47,850 Rupiah/kg to 52.000 Rupiah/kg 1.
Related to the above condition, and the positive demand for fish, the future for Indonesia's fish markets
is positive. Even during the national economic crisis, when the price of chicken meat and eggs
increased drastically, Indonesians, especially low-income earners, preferred to purchase relatively low
cost fish products.
With increased fish production, and the export and import of fish and fishery products, the per capita
consumption of fish reached 19.04kg/person/year in 1997, representing an annual average increase of
0.89% from 1994 to 1997. The per capita supply of fish has recently increased at an annual average of
4.63%, or from 19.98 kg/person/year in 1998 to 21.87 kg/person/year in 2000.
Increases in fish consumption, mostly driven by improved income levels in Indonesia, will have the
additional benefits of improving the diet and overall well being of Indonesians. Indonesians are now
aware of the importance of a healthy diet in maintaining or improving quality of life, and fish and related
products are increasingly being recognised as healthy food options.
Importantly, Indonesians view fish as a source of high quality protein, essential amino acids, and
minerals such as iodine. The omega-3 amino acid in fish, is thought to have a range of health benefits,
including: (a) the prevention of arteriosclerosis, hypertension, and heart attack; and (b) enhancement of
intelligence, and neural, and eye function.
2.1.3 Status (endangered, threatened, rare etc.)
Six sea turtle species occur in Indonesia, including the green (Chelonia mydas), hawksbill
(Eretmochelys imbricate), olive ridley (Lepidochelys olivaceae), leatherback (Demochelys coriceae),
loggerhead (Caretta caretta), and flatback (Natator depressus) turtles, all of which may nest on
Indonesian beaches. Table 12 shows the protection status of sea turtles in Indonesian waters.
The green turtle is the most abundant species. The meat and eggs of this species are highly valued in
Muslim communities, where the consumption of some other meat products is forbidden. There are
several major nesting localities throughout Indonesia, and it appears that more than 25,000 females
breed annually in western Indonesia.
The hawksbill turtle is also abundant, and is taken mostly for its shell. There are some valuable nesting
sites for the rare leatherback turtle, and this species is hunted in several parts of the country, including
the important Kai and Aru Island region. The major nesting site of this species at northern beach bird's
head of Papua is the fourth largest in the world after Trengganu beach in Malaysia.
There is a paucity of information regarding the olive ridley, loggerhead, and flat back turtles. There is
evidence of significant decline in green turtle populations connected with sites of heavy meat in Bali,
Manado, and Ambon. Exploitation of the hawksbill turtle is increasingly high. This is especially the case
in Makassa, where this species is harvested for its shell. More than 15,000 green turtles are brought
annually into Bali alone, and there is a store of approximately 15 tonnes of hawksbill turtle shells in
Makassar at any one time.
1 Rate of exchange for 1 US Dollar ranged from 9.000 to 10,000 Rupiah (Rp is Indonesian currency).
Reversing Environmental Degradation Trends in the South China Sea and Gulf of Thailand
NATIONAL REPORT ON FISHERIES INDONESIA 11
Table 12
The protection status of sea turtles that occur in Indonesian waters.
Common
Local
Status
No Family
Species
name
name
Cites INA IUCN
1 Chelonidae
Caretta caretta
Loggerhead
Penyu
App 1
V
P
turtle
tempayan
2
Chelonia mydas
Green turtle
Penyu hijau
App 1
E
-
C. mydas
C. mydas
japonica
3
Eretmochelys imbricata
Hawksbill turtle
Penyu Sisik
App 1
E
P
4
Lepidoche lysolivacea
Olive Ridley turtle
Penyu Lekang
App1
E
P
5
Natator depressa
Flatback turtle
Penyu pipih
App 1
E
P
6 Dermochelydae Dermochelys lyscoriacea
Leatherback turtle
Penyu blimbing
App 1
E
P
D. coriacea
D. schlegelli
Notes: INA = Indonesian Government Regulation; App 1 = Endangered species, not for commercial use; E = Endangered
species; V = Vulnerable species; P = Protected.
The uncontrolled hunting and collection of protected species, including cetaceans, turtles, and seabirds,
is a problem. Indonesia has trouble controlling the exploitation of marine resources and protecting
endangered species in marine areas, as some species are highly migratory and may straddle national
boundaries. For instance, populations of turtles, dolphins, and whales may be exploited across the
entire area of their distribution, which may include the waters of multiple nations.
2.1.4 Food security (locally)
The per capita fish consumption in 1998 was 19.25kg/person/year. This represents 72.5% of the
26.55kg/capita/year, which the National Food and Nutrition Meeting in 1993 defined as the average
dietary requirement. The per capita fish consumption in 1998 was below normal (i.e., per capita fish
consumption in Japan is approximately 100 kg/person/year).
2.2
Biology & ecology of the species (from available information)
2.2.1 Large pelagic fishes
A number of species comprise the oceanic tuna and billfish resource of Indonesia's South China Sea
area. They include swordfish (Xiphias) of the family Xiphiidae, sailfish and marlins (Makaira,
Istiophorus, and Tetrapturus) of Istiophoridae, and tunas (Euthynnus, Katsuwonus, and Thunnus) of
Scombridae. Several species of smaller tuna-like fishes are more important in continental shelf areas
than the open ocean, including frigate and bullet tunas (Auxis spp.) and bonito (Sarda spp.).
The actual tuna species occurring in the South China Sea area include skipjack tuna (Katsuwonus
pelamis), kawa-kawa (Euthynnus affinis), longtail tuna (Thunnus tonggol), and frigate tuna (Auxis
thazard).
2.2.2 Small pelagic species
Taxonomically, the small pelagic fish occurring in Indonesia's South China Sea area can be classified
into two orders. The first are the herring-like Clupeiformes, including wolf-herring of the family
Chirocentridae, sardines, shads and gizzard shads of the Clupeidae family, and anchovies of
Engraulidae. The second are the perch-like Perciformes, including the carangid scads, jacks, and
trevallies of the Carangidae family, and the mackerels of the Scombridae family (Widodo 1997).
Clupeoids
Clupeoids are shoaling fishes that inhabit waters of the inshore continental shelf. Although they are
typically pelagic, they may also be benthopelagic during certain seasons or times of the day. Therefore,
it is rather difficult to categorise this group as either pelagic or benthopelagic. Clupeoids and Engraulids
occur frequently in demersal trawl catches in areas of the South China Sea.
Among the clupeoids, the anadromus Tenualosa macrura and Anadontostoma chacunda belong to the
river ascending shads. Most of the 20 species of anchovies (Stolephorus spp. and Encrasicholina spp.)
are coastal shoaling species. Some of them (e.g. Stolephorus commersonii and S. indicus) enter
brackish waters occasionally. The strictly coastal and neritic species include S. heterolobus and S.
bataviensis. Stolephorus tri is most abundant near river mouths and frequently enters brackish water
areas.
Reversing Environmental Degradation Trends in the South China Sea and Gulf of Thailand
12 NATIONAL REPORT ON FISHERIES INDONESIA
In addition to the sardinellas, a number of commercially important clupeoids, belonging to 6 families,
exist in Indonesian waters. From these 6 families, 3 occur in the Indonesian part of the South China
Sea. These include herring (Chirocentridae), sardines, shads and gizzard sardines (Clupeidae), and
anchovies (Engraulidae).
Chirocentridae
Chirocentrus dorab (dorab wolf-herring): inhabit coastal waters. Common size: 30-50cm.
Clupeidae
Anadontostoma chacunda (chacunda gizzard shad): inhabit coastal waters. Common size: 15 to
30cm.
Dussumieria accuta (rainbow sardine): inhabit coastal waters and form shoals. Common size: 10
to 15cm.
Tenualosa macrura (longtail shad): inhabits coastal waters, estuaries, and rivers. Common size:
15 to 25cm.
Sardinella fimbriata (fringescale sardinella): inhabits coastal waters. Common size: 10 to 15cm.
S. brachysoma (deepbody sardinella): inhabits coastal waters. Common size: 12 to 16cm.
S. gibbosa (goldstripe sardinella): inhabits coastal waters. Common size: 12 to 18cm.
S. albella (white sardinella): inhabits coastal waters. Common size: 5 to 10cm.
Amblygaster sirm (spotted sardinella, sardine): inhabits coastal waters. Common size: 15 to
20cm.
Engraulidae
This family consists of a number of anchovy species, including Stolephorus spp. and Encrasicholina
spp. Anchovies inhabit coastal water, river mouth, neritic, and continental shelf areas.
Carangoids
Most of the carangid and scombroid mackerels inhabit coastal waters, and are very important to pelagic
fisheries in the South China Sea. The smaller scombroids are less diverse than the carangids, but of
greater fisheries importance. Rastrelliger spp. are very important to small pelagic fisheries in the region.
Many species of carangoids occur in continental shelf and coastal waters. Among them, scads, jacks,
and trevallies are prominent.
Carangidae
Scomberoides commersounnianus (talang queenfish): inhabits coastal and neritic waters to the
edge of the continental shelf.
Selaroides leptolepis (yellowstripe scad): inhabits shallow coastal areas, benthopelagic.
Selar crumenophthalmus (bigeye scad): inhabits coastal water areas up to 80m deep,
benthopelagic. Lmax 26.7cm (Pauly et al. 1996).
Megalaspis cordyla (torpedo scad): inhabits coastal waters up to 60m deep, pelagic.
Decapterus russelli (Indian scad): inhabits coastal and offshore continental shelf waters, pelagic.
Lmax 35.0cm (Pauly et al. 1996).
D. macrosoma (shortfin scad): inhabits continental shelf waters, pelagic. Lmax 29.0cm (Pauly et al.
1996).
Caranx spp. (trevallies): inhabit shallow waters of coral rocky reefs, benthopelagic.
Scombroids
Scombroid mackerels and neritic tunas occur throughout South China Sea waters. They are
represented by the following species:
Rastrelliger kanagurta (Indian mackerels) and R. faughni (Island mackerel): form large shoals in coastal
waters, pelagic.
Rastrelliger brachysoma (short mackerel): form large shoals in coastal waters, pelagic.
Scomberomorus commerson (narrow-barred Spanish mackerel): inhabits coastal and offshore
continental shelf waters, pelagic.
S. guttatus (Indo-Pacific king mackerel): inhabits coastal and offshore continental shelf waters, pelagic.
Reversing Environmental Degradation Trends in the South China Sea and Gulf of Thailand
NATIONAL REPORT ON FISHERIES INDONESIA 13
According to Yanagawa (1997), Indonesia's South China Sea fisheries for Indian mackerels, eastern
little tuna, and narrow barred Spanish mackerel, were stable from 1976 to 1993. Comparatively, the
fishery for round scad experienced significant fluctuations in catches during the same period. In
general, during the 18-year period discussed here, catches of the 12 main small pelagic species tended
to increase, especially after 1987. At present, catches of all species, except for hardtail, are higher than
the average observed during the 18-year period discussed.
2.2.3 Demersal fish species
Among of the order of Clupeiformes there is a great diversity and range of genera, in both pelagic and
benthic-demersal areas. According to Longhurst and Pauly (1987), it is not satisfactory to categorise
fish of this order into pelagic or benthopelagic groups, as clupeids and engraulids very often occur in
catches from both pelagic and demersal parts of tropical seas.
The Perciformes are a significant group of fish in the region. Of the 150 families making up the order, a
dozen families dominate the continental shelf fisheries of the tropics (Longhurst and Pauly 1987).
Based on habitat associations, the tropical Perciformes represent 3 main groups, including: (i) species
associated with inshore muddy substrate; (ii) those associated with sandy bottom substrate; and (iii)
those associated with rocky substrate.
The Sciaenidae family (28 genera, 160 species) tends to dominate the fish fauna associated with areas
characterised by substrates that are muddy, and waters that are brackish and turbid. Some of the
drums and croakers, including Sciaena, Pseudotolithus, Johnius, and Umbrina may attain large sizes.
Occurring with these croakers are golden-brown threadfins (Polynemidae, 35 species of 7 genera) and
laterally flattened spadefishes (Ephippidae, 15 species of 7 genera) (Longhurst and Pauly 1987).
In sandy bottom areas, a wider range of Perciformes families are present. Breams (Sparidae, 100
species of 30 genera), threadfin breams (Nemipteridae, 175 species of 21 genera), and grunts
(Pomadasyidae, 175 species of 21 genera) dominate. A range of genera of groups of mostly smaller
sized fish, including Priacanthidae, Mullidae, Gerreidae, and the ponyfish (Leiognathidae, 20 to 30
species of 3 genera) also occur (Longhurst and Pauly, 1987).
Finally, 3 families of large bass-like fishes, including groupers (Serranidae) and snappers (Lutjanidae)
dominate the fisheries resources associated with rocky grounds. Species of these groups may attain
very large sizes, and represent many genera, including Epinephelus, Plectropomus, Serranus, Caesio,
Lutjanus, and Ocyurus (Longhurst and Pauly 1987).
Pleuronectiform flatfish also occur in Indonesia's South China Sea area. These include the left-eyed
flounders (Psettodidae), the right-eyed flounders (Pleuronectidae), soles (Soleidae). and tongue soles
(Cynoglossidae). Finally, a number of highly evolved groups of fishes, including Balistidae
(triggerfishes), Tetraodontidae (puffers), Ostraciontidae (boxfish), and Zeidae (John Dories) are part of
the fisheries resources of the continental shelf (Longhurst and Pauly 1987).
Elasmobranchs are ubiquitous in South China Sea waters. The larger species are usually pelagic,
whilst smaller species of Squalidae occur in all tropical oceans. Several families of bottom-dwelling rays
(Rajidae), guitarfish (Rhinobathidae), and stingrays (Dasyatidae) make up part of Indonesia's South
China Sea resource base.
Regarding demersal fish communities, Longhurst and Pauly (1987) identified 4 basic kinds of
assemblages: (i) those of inshore/estuarine muddy habitats and turbid waters, dominated by sciaenids;
(ii) those of sandy habitats and clearer waters, dominated by sparids; (iii) those of rocky reefs,
dominated by lutjanids; and (iv) those of coral reefs with no single dominating family.
2.2.4 Commercially
exploited
invertebrates
2.2.4.1 Penaeid shrimps
Penaeid shrimps play an important role in the economies of some tropical nations, including those
countries bordering the South China Sea. Consequently, shrimps of the family Penaeidae have been
studied intensely, and many aspects of their biology and population dynamics are clear (Gulland 1971;
Holthuis 1980; Garcia & LeReste 1981; International Development & Research Council 1982).
Reversing Environmental Degradation Trends in the South China Sea and Gulf of Thailand
14 NATIONAL REPORT ON FISHERIES INDONESIA
Many countries adjacent to the South China Sea aim to increase shrimp exports via the intensification
of fishing effort and aquaculture. However, other than possibly saturating shrimp markets, the feasibility
of these plans depends on 2 key factors. The first is the resilience of wild shrimp stocks to fishing effort
increases. The second is the capacity of the natural environment to sustain further modifications to
coastal wetland habitat for the expansion of aquaculture activities. A key risk associated with the
second factor is that the environmental effects of shrimp aquaculture may be sufficient to dimish the
productive capacity of wild shrimp populations.
Penaeid shrimps are short-lived, with recruitment to the fishery occurring as soon as 4 months after
spawning. Stock recruitment relationships play a critical role in maintaining the quality of shrimp stocks
in the region, and there is a need to better understand spatial and temporal variations in parental stock
and recruitment.
2.2.4.2 Squids
Squids (Cephalopoda and Teuthoidea) are important components of tropical marine ecosystems, both
neritic and oceanic. The true magnitude of their biomass and level of exploitation has become apparent
with the extension of Japanese squid fisheries beyond the northwestern Pacific Ocean in the 1980s. A
phenomenon that has recently attracted much scientific attention is the explosive growth of cephalopod
populations following the reduction in abundance of other species. This is believed to have occurred in
the Gulf of Thailand (Pauly 1979; Caddy 1983).
As there are now several known instances of tropical squid outbursts following the reduction of fish
biomass by commercial fishing, it is important to understand the trophic relationships that exist between
squid and other commercially important species. Cephalopods are capable of capturing unusually large
prey, frequently including smaller individuals of the same species. Specifically, squid feed on
crustaceans, fishes, and squids, and are an important dietary item for many other fish species. They
are usually exploited with demersal fishes and penaeid shrimps. The increase in regional squid
populations is most probably a consequence of a reduction in predation on their young.
2.2.4.3 Sea urchins
The harvesting of sea urchins for their gonads is an economically important activity. Sea urchins also
play an important role in the grazing of algae. These algae may be those that are harvested
commercially, or those that act to shape the structure of shallow water tropical ecosystems (Gomez et
al. 1983). Therefore, the biology and dynamics of sea urchin populations have received considerable
attention in recent years, especially the factors controlling their recruitment and fluctuations in
abundance.
3.
CURRENT STATUS & THREATS
3.1
Status of the Fishery in terms of CPUE
Available data do not enable an accurate assessment of the status of important fish stocks in terms of
CPUE. The number of fishing boats in Indonesia's South China Sea area was 58,180 in 2001, slightly
higher than in 2000. The number of boats by size and by province from 1991 to 2001 presented in
Table 13 provides some insight into the rate at which fisheries have developed over the past 10 years.
Reversing Environmental Degradation Trends in the South China Sea and Gulf of Thailand
NATIONAL REPORT ON FISHERIES INDONESIA 15
Table 13 The number of marine fishing boats by size of boat in Indonesia's South China Sea
from 1991 to 2001.
Size of fishing
1991 1992 1993 1994 1995 1996 1997 1998 1999 2000 2001
boats
Non
powered
boat 18,066 18,243 18,475 19,704 20,250 27,872 23,992 23,655 20,708 13,028 12,497
Outboard
motor
4,026 4,335 5,249 6,030 7,018 6,425 8,418 8,773 6,864 7,550 4,979
<5 GT
13,416 14,124 15,937 16,523 17,211 17,736 20,097 21,287 18,111 25,959 29,208
5 - 10 GT
1,435
1,578
2,567
1,576
1,718
1,671
3,730
4,037
6,348
7,663
9,243
10 - 20 GT
171
230
226
237
500
616
641
772
1,184
1,069
1,522
20 - 30 GT
116
121
163
166
59
62
313
241
349
184
501
30 - 50 GT
20
27
17
25
12
0
0
19
18
28
110
50
-100
GT
1 0 0 3 7 0 0 0 0 0 75
100
-200
GT
0 0 0 0 0 0 0 0 0 0 44
200
-300
GT
0 0 0 0 0 0 0 0 0 0 1
Total
37,251 38,658 42,634 44,264 46,775 54,382 57,191 58,784 53,582 55,481 58,180
Source: DGF (1993; 2003)
3.2
Status of Fish Stocks Based on Historical Review of Landings and CPUE
(i) Pelagic
fishes
A fishery acoustic survey carried out in September 2001 indicated that the density of fish stocks ranged
between sampling location from 101 to 920 individual fish per 1000m3, with an average of 162. By
converting the acoustic target strength to the biomass, it was found that the density of small and large
pelagic fishes in the South China Sea was 2.26 and 1.10 tonnes per km2, respectively.
Trevallies (14.9%), anchovies (15.6%), sardinella (8.4%), wolf herring (21.0%), and mackerels (10.7%)
dominated catches of small pelagic fishes. The main fishing season for small pelagics in Indonesia's
South China Sea area is from October to December.
(ii) Demersal
fish
Bottom trawl sampling indicates that the density of demersal finfish and penaeid shrimps is
approximately 1.2 tonnes/km³. The area of distribution of demersal finfish and shrimps in Indonesia's
part of the South China Sea is 558,000km2 and 337,000km², respectively (Widodo 1998). Accordingly,
potential yields are estimated at 334,800 tonnes/annum for demersal finfish and 6,720 tonnes/annum
for penaeid shrimps that constituted by 10% of tiger shrimp, 28% of banana shrimps and others.
The estimated density of lobsters was 1.34 tonnes per km2, with a potential yield of 400 tonnes per
year. The total catch of lobsters in 1997 was 272 tonnes.
Fish stock assessments were conducted in 1997 and 2000. The results indicate that a number of fish
resources have been exploited at levels close to or beyond their productive capacity. The resources
that appear to have no further room for development include demersal finfish, coral reef fishes, penaeid
shrimps, and squids. There is potential to develop the remaining fish resources in a precautionary
manner
3.3 Threats
3.3.1 Current
Destructive fishing practices have been adopted in Indonesia for many years; however, demand for reef
fish in Asian markets may have contributed to a proliferation of such practices. Cyanide and explosives
are mainly used for capturing coral reef fishes, including groupers, snappers, Napoleon wrasse, and
ornamental fishes.
Almost all of Indonesia's coastal fish resources in the South China Sea area have been overexploited.
Smaller sized fish from lower trophic levels, and typically of lower commercial value, are beginning to
dominate catches previously composed of large fish from high trophic levels. This is especially the case
for the longtail shad (Hilsa toli) in waters of Riau province. This species, exploited for its roe for many
decades, is now almost commercially extinct.
Reversing Environmental Degradation Trends in the South China Sea and Gulf of Thailand
16 NATIONAL REPORT ON FISHERIES INDONESIA
In some important areas, overfishing is causing catches to decline in volume and value, and smaller
sized fish are increasingly dominating landings. This is especially common along the coasts of Java,
eastern Sumatra, and the Celebes region. Furthermore, the overexploitation of molluscs and
ornamental coral fish for the souvenir and aquarium industries may have serious consequences for the
ecological balance of reefs.
3.3.2 Potential
Demand for live reef fish and penaeid shrimp in Asian markets has increased rapidly, perhaps beyond
the productive capacity of wild stocks. Accordingly, fishers are expending excessively large amounts of
effort towards the capture of these species, which has often led to the neglect of resources and the
environments upon which they depend.
The main depleted groups of fish species include the groupers, snappers, Napoleon wrasse, pomfrets,
and rabbit fish. The tiger and banana shrimp (Penaeus monodon and P. merguiensis) are the Penaeid
shrimp species most extensively exploited. Populations of mangrove crab have also suffered the
negative consequences of overexploitation, especially in areas adjacent to high population centres.
4.
HABITATS & AREAS OF IMPORTANCE IN THE MAINTENANCE OF EXPLOITED FISH
STOCKS
The Sunda Shelf of the South China Sea extends through the Java and Timor Seas, and after an
interruption by the deep basin of the Banda Sea, extends to the Sahul Shelf of Northern Australia
(Longhurst and Pauly 1987). This shelf is usually shallow: the central part is less than 100 m deep,
whilst between Sumatra and Kalimantan it is only 10 to 40 m deep.
As part of the Southeast Asian region, double monsoons, as well as the effects of climate change on
sea level in the Pacific Ocean, and Pacific to Indian Ocean through flows, significantly influence the
South China Sea (Sharp 1966). The north monsoon starts in October and peaks in January, pushing
surface currents in a southerly direction until they reach the equator, where they are deflected
southeastward.
Rates of through flow depend on both sea level and surface wind speed and direction. The south
monsoon peaks in July and August, when southward transport dominates the water column. This is
because surface winds affect the surface currents, and there is always a substantial sea level
difference driving the movement of water from the Pacific Ocean to the Indian Ocean. Year to year
climate-driven ocean variability, at both local and regional scales, plays an important role in fisheries of
the South China Sea region.
The fishery situation in the South China Sea region is further complicated by the dominance of shoal
topography, dominated by either coral reef or mangrove ecosystems. Both are affected by the strong
vertical stratification set up by monsoonal rainfall and the large seasonal inflow of fresh water from
rivers of the Sumatra and Kalimantan Islands. Accordingly, ecological dynamics of the South China Sea
area reflect regional climate dynamics.
4.1
Physical, chemical, and biological characteristics
Some topographical features of Southeast Asia favour the development of strong surface circulation.
The main feature is associated with the area formed by the South China Sea, the straits between
Sumatra and Kalimantan, the Java Sea, the Flores Sea, and the Banda Sea, which has its main axis
aligned with wind flux during both monsoons. This, along with the relative constancy of the winds,
favours the development of surface circulation patterns strongly connected to the wind regime (Roy
1996).
High sea surface temperature (SST) (>25oC) and low seasonal amplitude (<3oC) are the dominant
characteristics of Southeast Asian waters. Moreover, the spatial distribution of water temperature is
relatively uniform, with a small gradient over the entire region. SSTs are high all year round with
maximum values of 27.5oC observed during January and February in the southern part of the South
China Sea. Maximum values are observed to be between 29.2oC (Sunda Strait) and 29.8oC (Malacca
Strait).
Reversing Environmental Degradation Trends in the South China Sea and Gulf of Thailand
NATIONAL REPORT ON FISHERIES INDONESIA 17
High annual rainfall, largely exceeding evaporation, causes an average salinity of less than 34ppt. This
rainfall, the river runoff it causes, and the archipelagic nature of the South China Sea region are
responsible for an extremely variable spatial distribution of surface salinity. River runoff into the South
China Sea drives low salinity levels in many coastal waters, even in some offshore areas. Low salinity
levels are most common in April and May when water masses are transported from the Java Sea into
the southern South China Sea. In June, water of higher salinity (>32ppt) enters the Java Sea from the
east, and then moves further north into the southern part of the South China Sea. During the northeast
monsoon, relatively high salinity levels are observed in the South China Sea.
Sediments are extremely sandy (mostly made up biogenic materials from coral reefs) in the straits
between some of the major islands, such as the Malacca Strait. In the deeper areas to the north, as the
Sunda Shelf slopes into the South China Sea basin, sediments are mostly soft mud (Longhurst and
Pauly 1987).
The fish communities, on which tropical fisheries are based, typically follow the distribution and
abundance patterns of their main dietary items, including benthic and pelagic invertebrates (Longhurst
and Pauly 1987). The demersal fish fauna of Indonesia's South China Sea area is determined by
environmental factors, including the amount of organic mud in the substrate, the occurrence of isolated
patches of rocky or biogenic reefs, the occurrence of brackish, estuarine conditions associated with
river mouths, and the nature of the oceanic water mass lying over the waters.
There is a great wealth and diversity of pelagic fish in the South China Sea, and important fisheries are
based upon them. Pelagic fisheries in the South China Sea are based on a variety of different
taxonomic groups, some of which belong to stocks shared by a number of regional nations.
The marine habitats of the South China Sea and its adjacent waters are unique. Here, the interaction of
land and sea creates complex systems where local processes may prevail over global dynamics. In
addition, the monsoon regimes create such a strong seasonality of the characteristic of the
environment. The alternation of the north and south winds completely reorganise surface circulation,
which can be expected to significantly influence environmental conditions.
4.1.1 Spawning and nursery grounds
Fishes are well known for their high fecundity, with most species releasing thousands to millions of
eggs annually (Bond 1979). Since each fish species occurs under a unique set of ecological conditions,
it has a unique reproductive strategy, with special anatomical, behavioral, pysiological, and energetic
adaptation. The success of any fish species is ultimately determined by the ability of its members to
reproduce successfully in a fluctuating environment, thereby maintaining viable populations. Based on
their reproductive strategy, fishes can be categorised into egg-layers (oviparous condition) and live-
bearers (ovoviviparous, viviparous).
Some fishes engage in mass spawning. Spawning often occurs after migration to a suitable site, and
into a current that will carry eggs and larvae to a nursery area. Pelagic spawners spawn in open waters,
often near the surface. Many such spawners are schooling fishes, such as tuna (Scombridae) and
sardines (Sardinella). Although pelagic spawning is most often associated with pelagic fishes, many
benthic fishes temporarily rise off the bottom to spawn. Benthic spawners are of three basic types,
those that spawn on gravel or rocks, those that spawn on aquatic plants, and those that spawn on
sand.
Spawning grounds of demersal species are close to coastal waters of the South China Sea, where
eggs can settle on the substrate or adhere to vegetation. Demersal fish spawning grounds are
concentrated along the east cost of Sumatra, coastal waters adjacent to the many islands of Riau
Province, Bangka and Belitung Islands province, and along the west coast of Kalimantan. Whilst
pelagic fish spawning and nursery grounds are scattered in the `open waters' of the South China Sea,
specifically from the north of the southern Bangka and Belitung Islands to Natuna Islands in the north
(Figures 4.1 and 4.2).
Reversing Environmental Degradation Trends in the South China Sea and Gulf of Thailand
18 NATIONAL REPORT ON FISHERIES INDONESIA
103 °
1 0 5 °
107°
109°
111°
N
4 °
4 °
Natuna
M
A L A YSIA
2 °
2 °
LAUT CINA SELATAN
#
S Pemangkat
#
S Pontianak
0 °
0 °
SU M
A T E R A
#
S Ketapang
2 °
2 °
4 0 0 40 8 0 K m
103 °
1 0 5 °
107°
109°
111°
Figure 4.1
Spawning areas of demersal finfish and small pelagic fish species in Indonesia's
South China Sea area (Sumiono and Widodo 2003).
5
4
3
2
1
0
- 1
- 2
- 3
100
102
104
106
108
110
112
= spawning ground = nursery area
= nursery areas of Sardinella
Figure 4.2
Spawning and nursery grounds of small pelagic fishes in Indonesia's South China
Sea area (Haryati et al. 2003).
Reversing Environmental Degradation Trends in the South China Sea and Gulf of Thailand
NATIONAL REPORT ON FISHERIES INDONESIA 19
4.1.2 Fishing
grounds
Most fisheries in Indonesia and, in particular, the pelagic fisheries in the South China Sea are seasonal
(Bailey et al. 1987). The fish resources of the South China Sea can be classified as small pelagic
fishes, large pelagic fishes, and demersal finfish and invertebrates. Most of the central part of the
Indonesian South China Sea is a trawlable area suitable for demersal fishing. Additionally, demersal
fishing grounds are also located in the coastal waters along the east coast of Sumatra and west coast
of Kalimantan Islands.
Small pelagic fishes can be harvested almost anywhere in the South China Sea, including coastal and
offshore waters. Fishing grounds for large pelagic species are concentrated in northern waters,
especially oceanic waters of high salinity (Figure 4.2).
4.2
Stocks with undefined spawning grounds
The spawning grounds of some species of small pelagic fishes, including Decapterus spp. and
Rastrelliger kanagurta, and some large pelagic species, including skipjack and other tuna, have not yet
been determined.
4.3
Threats (current and potential)
Coastal sand mining is being conducted on several islands of Riau Province. These activities can
potentially threaten the spawning, feeding, and fishing grounds of fish caught by artisanal fishers.
Additionally, deforestation of mangroves is occurring, especially on the eastern coast of Sumatra Island.
Finally, destructive fishing practices are used throughout Indonesia, especially in coral reef areas.
4.4
Ranking of habitats
4.4.1 Association with species of importance to food security
Habitats along the eastern coast of Sumatra Island and the western coast of Kalimantan Island play a
significant role in sustaining populations of fish important for food security. In these coastal areas, there
are a large number of artisanal fishers. Artisanal fisheries are an important source of food, income, and
employment in these regions.
4.4.2 Association with high values species
Habitats along the eastern coast of Sumatra Island and western coast of Kalimantan Island play an
important role in preserving high value fish species, including large demersal reef fish and a number of
penaeid shrimps species. Wild shrimp production still exceeds that from aquaculture.
4.4.3 Association with endangered, rare, threatened species
Habitats along the eastern coast of Sumatra Island, western coast of Kalimantan Island, and north of
the Bangka and Belitung Islands, are important habitats for endangered, rare, and threatened species,
especially reef fishes.
5.
CURRENT MANAGEMENT REGIMES
5.1
Legal instruments
A large number of laws and regulations comprise Indonesia's legal framework for fisheries. Many of
these regulations are valid for some parts of the South China Sea under Indonesia's jurisdiction.
Indonesia is an archipelagic State made up more than 17,500 islands. With a vast mass of water
surrounding small pockets of land, Indonesia's marine and coastal areas contain a diverse and rich
range of living aquatic resources. Approximately 8,500 fish species, 2,000 crustacean species, 20,000
mollusc species, 30 marine mammals species, and 6 species of sea turtles inhabit Indonesian waters.
All of these species are fisheries resources according to Act No.9 of 1985 concerning fisheries.
According to this law, the fishery sector is responsible for the management of these species. This basic
Act should be read together with law no.5 of 1983, which, among other things, designates the officers
qualified to enforce fisheries laws within Indonesia's EEZ, and defines law enforcement procedures.
Reversing Environmental Degradation Trends in the South China Sea and Gulf of Thailand
20 NATIONAL REPORT ON FISHERIES INDONESIA
The Fisheries Act no.9 of 1985 established a licensing regulation, whereby any individual or legal entity
wishing to engage in fishing activities in Indonesian waters is required to be properly licensed.
Subsistence fishers are not subject to this requirement. As a rule, fishing in Indonesian waters is
restricted to Indonesian nationals or Indonesian legal entities, unless the national fleet does not have
the capacity to harvest the total allowable catch as set by the minister with responsibility for fisheries
management.
Furthermore, the Government Regulation no. 15 of 1990, juncto Government Regulation no. 141 of
2000 concerning Fisheries Business, and some other Ministerial Decrees, such as the Ministerial
Decree no.15 of 1990 juncto the Ministerial Decree no 428 of 1999, were issued to detail the rules and
procedures governing the licensing system.
The issuance of Act no.22 of 1999 concerning Regional Administration caused some modification to Act
no.9 of 1985, including regulations for "Fishing Zones" and "Fish Aggregating Devices".
Following recent discussions with all Provincial Fisheries Services of Indonesia, and officials within the
Ministry of Marine Affairs and Fisheries, the Act no.9 of 1985 is currently being revised.
The management and protection of Convention on International Trade in Endangered Species of Wild
Fauna and Flora (CITES) listed species is the responsibility of the Directorate General of Forest
Protection and Nature Conservation (PHPA), Ministry of Forestry.
5.2
Institutional arrangements (research, monitoring, control, & enforcement)
The rapid economic development and population growth of Indonesia over the past several decades
has accelerated the loss of natural habitat and biodiversity. This is particularly evident in the coastal
zone, where human populations are growing at more than twice the national average. Historically,
coastal economies have prospered from trade and fisheries.
Coastal economies are now more diverse, including extraction of oil and minerals, aquaculture, forestry,
recreation and tourism. However, the diverse needs of a large and growing coastal population,
especially in the coastal areas of western Indonesia, are limited by a fixed supply of coastal resources
(carrying capacity).
Based on information from the Central Research Institute of Marine Fisheries of Indonesia (CRIFI), the
study of small pelagic fishes and fish stock abundance began in 1972. The occurrence of pelagic fishes
around Karimata Island was detected during collaborative trawl surveys conducted by Indonesian and
German Governments in 1975 and 1978.
Acoustic surveys of pelagic fish stocks were conducted during late 1985 in the waters adjacent to
Natuna and Anambas Islands. The estimated pelagic fish stock in both areas was 150,000 tonnes and
183,000 tonnes, respectively.
Indonesia's South China Sea area is 550,000km2, with a potential annual yield of small pelagic fishes of
506,000 tonnes. Based on research conducted by CRIFI, it is believed that 30% of this potential yield is
caught annually
The result of acoustic surveys conducted in September and October 2001 showed a density of small
pelagic fishes in Indonesia's South China Sea waters of approximately 162 fishes per 1000m3. The high
density of the fish occurred in surrounding islands was low density occurred in certain areas. The
average density of large pelagic fishes was 0.32 tonnes per km2 or 1.1 tonnes per km3, whereas the
small pelagic density was 2.26 tonnes per km2.
The results of these surveys also indicated that small pelagic fishes had been overexploited in several
areas, especially in traditional fishing areas including eastern Sumatra in the South China Sea area.
The Javanese purse-seine fleet has intensely exploited the pelagic resources of Indonesia's territorial
waters and EEZ since 1983. This has been accompanied by investment in new large vessels (80 to 100
GT) and improvement in fishing methods, including the use of artificial light and fish aggregating
devices (FADs). During 2000, the number of fishing boats in West Kalimantan was 216 units (10 to 20
GT), 54 units (20 to 30 GT), and 28 units (30 to 50 GT). Of these fishing boats, 110 used purse seines.
Reversing Environmental Degradation Trends in the South China Sea and Gulf of Thailand
NATIONAL REPORT ON FISHERIES INDONESIA 21
Monitoring, Control, and Surveillance (MCS) is a very important part of Indonesian fisheries
management. Despite there being very few rules or regulations pertaining to fisheries in Indonesia,
compliance levels are low and enforcement is weak.
Monitoring: implementation based on the Ministerial Decree no.03 of 2002, which requires the use of
a fisheries logbook by certain sizes of fishing boats.
Control: implementation based on various legal instruments, including 4 Acts, 7 Government
Regulations, 5 Presidential Decrees/Instructions, and more than 20 Ministerial Decrees.
Surveillance: Surveillance is conducted by WASKI. WASKI in cooperation with the Navy and Police
Enforcement, Law Enforcement is being implemented through PPNS in cooperation
with the Attorney General.
Recently, the abundance of some of these species has declined at an alarming rate, whilst some others
have suffered depletion. Despite the importance of marine resources to Indonesia's economy and
environment, the sustainable management of these resources has not occurred. The pressure on
marine resources is growing rapidly, and many fishers have adopted the use of destructive, non-
sustainable fishing methods in the race for fish. The result thus far, has involved the degradation of
aquatic habitats and the overexploitation of fisheries resources.
Realising that demand for fish resources is probably greater than the productive capacity of Indonesia's
waters, the Government of Indonesia has instituted a range of initiatives aimed at sustaining
biodiversity. These include the:
a. Establishment of artificial rearing and restocking programs for endangered species;
b. Establishment and management of conservation areas;
c. Use of restocking in fisheries management;
d. Preparation of a gene bank as a buffer for species of high economic value;
e. Establishment of quotas and methods for controlling fishing effort appropriate to these; and
f. Development of a network of researchers (Indonesian Network on Fish Genetic Research and
Development).
5.3
The Government of Indonesia's Policy to Overcome Iuu Fishing Practices
A key problem encountered in the development of marine affairs and the fisheries sector in Indonesia is
that of illegal fishing, particularly in the Indonesian EEZ. The utilisation of fish resources within
Indonesia's EEZ is high, although the benefits accrued by Indonesia are insufficient. At present,
approximately 70% of the 7000 fishing boats licensed to operate in Indonesia's EEZ are foreign owned.
In this setting, Indonesia may incur losses as a result of the following:
Foreign fishing boats (licensed to fish in Indonesian vessels) buying diesel fuel at domestic
prices (Indonesian Rupiah) that are relatively low.
The loss of export earnings since large volumes of catch are landed in foreign jurisdictions.
Foreign fishing boats using foreign crews, causing the skill development fund obtained by the
Government to be lower than it should be.
Foreign fishing boats not paying fees as appropriate.
Foreign fishing boats violating fisheries rules and regulations by catching fish in territorial
waters.
Losses are estimated to be US$1.36billion per year. Specific losses include:
-
Loss of fuel price differences: US$ 0.24 billion
-
Loss of country earnings: US$ 1.00 billion
-
Loss of skill developing fund: US$ 0.02 billion
-
Loss of unpaid fees: US$ 0.10 billion
In reference to an FAO report, up to 1.5 million tonnes (or US$1 to 4 billion) of fish are caught illegally
each year. Other losses include those relating to national sovereignty and pride.
Reversing Environmental Degradation Trends in the South China Sea and Gulf of Thailand
22 NATIONAL REPORT ON FISHERIES INDONESIA
5.4
Overview of patterns of resource ownership and traditional utilisation
As mentioned previously, Indonesian fishers operating in the South China Sea are mainly based in the
Provinces of Riau, Jambi, South Sumatra, and West Kalimantan.
In the Indonesian sense, traditional or small-scale fisheries involve fishers using only 1 fishing boat,
either non-powered, or powered by an out-board or an in-board motor less than 5 GT, and fishing only
for subsistence purposes.
In some parts of Indonesia, there is traditional community based fisheries management, such as in
Maluku and Aceh provinces. However, in case of the South China Sea, there is an Indonesia - Malaysia
Agreement on Malaysian Traditional Fishing Rights in the Indonesian Archipelagic Waters and EEZ
1982.
The Agreement defined "traditional fishing" as "fishing by Malaysian traditional fishermen using
traditional methods in the traditional areas" within the archipelagic waters. Point 7 of the Record of
Discussion, dated February 25 1982, between the 2 countries, also states that the fishing area "shall
not include maritime belts of 12 nautical miles, measured from the law water mark, around Indonesian
Islands". Point 9 of the Record states that Malaysian traditional fishing rights shall also be exercised "in
the designated area in the EEZ" of Indonesia in the South China Sea (see map 2 as attached).
In terms of ownership and exploitation rights, it should be emphasised that, based on the concept of
Mare Liberum, the sea including the fish within it, is by nature Common and not susceptible to
possession. Neither individuals nor governments can claim fish, and their possession is limited only
through their being caught. It is a concept that continues to prevail today in Indonesia, despite the
number of property rights (e.g. Individual Transferable Quotas) and regulatory regimes that have been
adopted in response to the growing awareness of the tendency to overexploit in the open access
setting. Therefore, transfer of authority over the exploration, exploitation, and management of fishery
resources from the central government to regional and local government does not amount to a transfer
of ownership of the fishery resources. Field interviews have revealed that the fundamental distinction
between ownership and rights in relation to fishery resource use is not clear. It is therefore important
that the central government launch an awareness campaign aimed at explaining the nature of the
authority to be transferred to regional and local levels of government.
6. RECOMMENDED
ACTIONS
A number of recommendation regarding management action required at the national and regional level
have been prepared. These relate to fish resources, habitat degradation, and human resources.
6.1 Fish
Resources
Recommendation:
National fisheries statistics are collected and analysed mainly based upon the reports delivered by
provincial fisheries offices. The main sources of the fisheries data are those of fisheries reports from a
large number of fish landing sites. The reporting system from landing sites to local fisheries offices
should be improved in order to obtain continuous data that meets quantitative and qualitative standards.
National Plan of Action:
(i) Detailed regional level fisheries statistical data, especially relating to catch and effort, should be
collected from Indonesia's South China Sea area at least once every 5 years, in order to enable
the assessment of changes in the total catch (species and size compositions), catch per unit
effort, and species diversity, abundance and distribution.
(ii) Special surveys on the spawning, feeding, and nursery areas of economically, ecologically, and
regionally important species need to be carried out in South China Sea areas subjected to high
levels of fishing effort and habitat alteration or degradation
Reversing Environmental Degradation Trends in the South China Sea and Gulf of Thailand
NATIONAL REPORT ON FISHERIES INDONESIA 23
Regional Plan of Action:
(i) It is necessary to carry out a regional survey concerning transboundary, migratory, straddling,
shared, and endangered species. The results of this survey may assist the formulation of
management strategies for fisheries involving these species.
(ii) A regional institutional arrangement should be established to implement management
measures for transboundary fish stocks (including combating IUU fishing in the region) that
have been agreed to by countries bordering the South China Sea.
6.2 Habitat
Degradation
Recommendation:
Rehabilitation of habitats used for spawning, feeding, nursery areas, and fishing for transboundary
species of the South China Sea needs to be carried out as soon as possible. Involvement of local
communities should be encouraged through targeted educational programs.
National Plan of Action
In reversing the degradation of habitats used for spawning, feeding, nursery, and fishing for
transboundary species, it is urgent that institutions are empowered to enforce laws relating to the
deforestation of mangroves, destructive fishing practices, and sand mining. Involvement of local
communities should be encouraged through targeted educational programs.
Regional Plan of Action
A regional institutional arrangement may play an important role in reversing the habitat degradation that
is having wide-ranging negative impacts on the spawning, feeding, nursery, and fishing grounds for
transboundary species in the region.
6.3 Human
Resources
Recommendation:
Institutional arrangements are needed to avoid the conflicts of interest among national and regional
fishers exploiting similar and limited transboundary fish resources in South China Sea waters.
National Plan of Action
The fish resources of the South China Sea are not only being harvested by local fishers, but also by
fishers from other part of Indonesia. Institutional arrangements are needed to avoid the conflicts of
interest among fishers exploiting similar and limited fish resources in South China Sea waters.
Regional Plan of Action
(i) Regionally, fishers of different nations exploit the fish resources of the South China Sea.
Institutional arrangements are needed to avoid the conflicts of interest among fishers exploiting
similar and limited transboundary fish resources in South China Sea waters.
(ii) Regional training in fisheries statistics, especially regarding sampling techniques, and data
management needs to be carried out in order to obtain fisheries data that is compatible across
the whole South China Sea area.
Reversing Environmental Degradation Trends in the South China Sea and Gulf of Thailand
24 NATIONAL REPORT ON FISHERIES INDONESIA
REFERENCES
Atmadja, S.B., 1999. Geographical variation of scads catch in the waters of the southern part of Sunda Shelf.
Jurnal Penelitian Perikanan Indonesia. Pusat Penelitian dan Pengembangan Perikanan Jakarta. Vol. V (3): 62-
70 [in Bahasa Indonesia. abstract in English]
Badrudin, B. Sumiono., T.S.Murtoyo.,2001. Species composition and diversity of tidal trap net catches in the
waters of Indragiri Hilir, Riau, Indonesia. Indonesian Fisheries Research Journal, Agency for Marine and
Fisheries Research, Jakarta. Vol. 7 (1): 47-53.
Bailey, C., A. Dwiponggo, and F. Maharudin., 1987. Indonesian marine capture fisheries. ICLARM Stud. Rev. 10.
196p.
Bond, C.E. 1979. Biology of fishes. Sounders College Publishing. Philadelphia. USA. 514p.
Caddy, J.F., 1983. The cephalopods: factors relevant to their population dynamics and to the assessment and
management of stocks. FAO Fish. Tech. Pap. 231. 452p.
Garcia, D. & L. LeReste., 1981. Life cycle, dynamics, exploitation and management of coastal penaeid shrimp
stocks. FAO Fish. Tech. Pap. 203. 215p.
Directorate General of Fisheries, 1993. Fisheries Statistics of Indonesia, 1991.
Directorate General of Fisheries, 2003. Statistical of Capture Fisheries of Indonesia, 2001.
Gomez, E.D., R.A. Gueib, and E. Aro., 1983. Studies on the predators of commercially important seaweeds.
Fisheries Research J. Philipp. 8:1-17.
Gulland, J.A., 1971. The fisheries resources of the oceans. Fishing News Books. West Byfleet. England.
Haryati,T., S.B. Atmadja, Suwarso.,2003. Review of habitat of spawning ground and nursery areas of small pelagic
fish in the South China Sea. Research Institute for Marine Fisheries: 17p. [in Bahasa Indonesia, unpublished].
Holthuis, L.B. 1980. Shrimps and prawns of the world an annotated catalogue of species of interest for fisheries.
FAO Fish. Synopsis 124. 271p.
International Development & Research Council. 1982. Fish bycatch bonus from the sea. Can. Int. Dev. & Res.
Council. Ottawa.
Longhurst, A.R. and D. Pauly. 1997. Ecology of Tropical Ocean. Acad. Press. Inc. N.Y. 407p.
Moyle, P.B. and J.J. Cech, Jr., 1982. Fishes: an introduction to ichthyology. Prentice-Hall, Inc. Englewood Cliffs.
NJ. USA. 593p.
Pauly, D., 1979. Theory and management of tropical multispecies stocks: A review with emphasis on the
Southeast Asia demersal fisheries. ICLARM Stud. Rev. 1. 35p.
Pauly, D., A. Cabanban and F.S.B. Torres. 1996. Fishery biology of 40 trawl-caught teleosts of western Indonesia.
p. 135-216. In D. Pauly and P. Martosubroto (Eds.) Baseline studies of biodiversity: the fisheries resources of
Western Indonesia. ICLARM Stud. Rev. 23. 312p.
Potier, M and B. Sadhotomo.,1994. Seiners fisheries in Indonesia In Potier. M and S. Nurhakim (Eds.):
BIODYNEX. Biology, Dynamics, Exploitation of the Small Pelagic Fishes in the Java Sea. AARD-ORSTOM-
EU : 49-95.
Roy, C., 1996. Variability of sea surface features in the Western Indonesian Archipelago: Inference from the
COADS Dataset. p. 15-23. In D. Pauly and P. Martosubroto (eds.) Baseline studies of biodiversity: the fish
resources of Western Indonesia. ICLARM Stud. Rev. 23. 312p.
Sharp, G.D., 1996. Oceanography of the Indonesian Archipelago and adjacent areas. p. 7-14. In D. Pauly and P.
Martosubroto (eds.) Baseline studies of biodiversity: the fish resources of Western Indonesia. ICLARM Stud.
Rev. 23. 312p.
Sumiono,B., Badrudin, and A. Widodo.. 2003. The assessment of the density and distribution of demersal fish
resources in the water of South China Sea. Proceeding Forum Stock Assessment on Marine Fish 2003.
Research Institute for Catch Marine Fisheries : 57-65 [in Bahasa Indonesia].
Sumiono, B. and A. Widodo, 2003. Review of habitat of spawning ground and nursery areas of penaeid shrimp in
the South China Sea. Research Institute for Marine Fisheries: 15p [in Bahasa Indonesia, unpublished].
Wagiyo, K. and E. Nurdin., 2002. Survey on small pelagic and demersal fish resources in the waters of South
China Sea. Survey report. Research Institute for Catch Marine Fisheries. Jakarta: 15p [in Bahasa Indonesia.
interim report].
Widodo, J., 1997. Review of the smal pelagic fisheries of Indonesia. p. 199 226. In Devaraj, M & P.
Martosubroto (Eds.) Small pelagic resources and their Fisheries in the Asia-Pacific region. Proceedings of the
APFIC Working Party on Marine Fisheries. First Session,13 16 May 1997. Bangkok, Thailand. RAP
Publication 1997/31. 445p.
Widodo, J., 1998. Potential yield, exploitation rate, and development of the marine fish resources in Indonesia (in
Bahasa Indonesia). National Committee of Marine Fishery Stock Assessment. Jakarta, Indonesia.
Yanagawa, H., 1997. Small pelagic fisheries in the South China Sea. p. 365 380. In Devaraj, M & P.
Martosubroto (Eds.) Small pelagic resources and their Fisheries in the Asia-Pacific region. Proceedings of the
APFIC Working Party on Marine Fisheries. First Session, 13 16 May 1997. Bangkok, Thailand. RAP
Publication 1997/31. 445p.
Reversing Environmental Degradation Trends in the South China Sea and Gulf of Thailand


United Nations
UNEP/GEF South China Sea
Global Environment
Environment Programme
Project
Facility
NATIONAL REPORT
on
The Fish Stocks and Habitats of Regional, Global, and
Transboundary Significance
in the South China Sea
PHILIPPINES
Mr. Noel Barut
Focal Point for Fisheries
National Fisheries Research and Development Institute
Department of Agriculture
940 Kayumanggi Press Building, Quezon Avenue, Quezon City 1103, Philippines
Reversing Environmental Degradation Trends in the South China Sea and Gulf of Thailand
NATIONAL REPORT ON FISHERIES PHILIPPINES
Table of Contents
1. BACKGROUND
INFORMATION..................................................................................................1
1.1 GEOGRAPHIC AND OCEANOGRAPHIC DESCRIPTION...................................................................1
1.2 BIOGEOGRAPHIC AND DEMOGRAPHIC FEATURES......................................................................2
1.3 OVERVIEW OF THE FISHERIES SECTOR ....................................................................................2
1.3.1 Total landings by fishing area ....................................................................................5
1.3.2 Fishing effort by gear .................................................................................................5
1.3.3 Economic value of fisheries production ...................................................................10
1.3.4 Importance of the fisheries sector in terms of employment and dependence.........11
2.
SPECIES OF REGIONAL, GLOBAL, AND TRANSBOUNDARY SIGNIFICANCE ..................11
2.1 RANKING OF IMPORTANCE ....................................................................................................11
2.1.1 Ranking in terms of landings ...................................................................................11
2.1.2 Local market value...................................................................................................12
2.1.3 Status.......................................................................................................................13
2.1.4 Food Security...........................................................................................................13
2.2 BIOLOGY AND ECOLOGY OF THE PRIORITY SPECIES ................................................................13
2.2.1 Large pelagic fishes.................................................................................................14
2.2.2 Small pelagic fish species........................................................................................20
2.2.3 Demersal fish species..............................................................................................20
2.2.4 Commercially exploited invertebrates......................................................................21
3. STATUS
AND THREATS ...........................................................................................................22
3.1 CURRENT STATUS ...............................................................................................................22
3.1.1 Fisheries Status in terms of CPUE ..........................................................................22
3.1.2 Status of fish stocks based on historical review of fish landings and CPUE...........24
3.2 CURRENT AND POTENTIAL THREATS .....................................................................................25
3.2.1 Current threats .........................................................................................................25
3.2.2 Potential threats.......................................................................................................26
4.
HABITATS AND AREAS OF IMPORTANCE IN THE MAINTENANCE OF EXPLOITED
FISH STOCKS ............................................................................................................................27
4.1 BIOPHYSICAL PROFILE..........................................................................................................27
4.1.1 Known spawning grounds........................................................................................30
4.1.2 Known nursery areas and feeding grounds.............................................................33
4.1.3 Known fishing grounds ............................................................................................34
4.2 UNKNOWN ISSUES SUCH AS STOCKS WITH UNDEFINED SPAWNING GROUNDS ...........................35
4.3 CURRENT AND POTENTIAL THREATS ......................................................................................35
4.4 RANKING OF HABITATS .........................................................................................................36
4.4.1 Association with species of importance to food security .........................................36
4.4.2 Association with high-value species ........................................................................39
4.4.3 Association with endangered, rare, or threatened species .....................................40
5. CURRENT
MANAGEMENT REGIME ........................................................................................40
5.1 LEGAL INSTRUMENTS ...........................................................................................................40
5.2 INSTITUTIONAL ARRANGEMENTS (RESEARCH, MONITORING, CONTROL, AND ENFORCEMENT).....44
5.3 OVERVIEW OF PATTERNS OF RESOURCE OWNERSHIP AND TRADITIONAL UTILIZATION ...............46
5.4 HUMAN AND INSTITUTIONAL CAPACITIES ................................................................................46
5.5 REVIEW OF STAKEHOLDERS..................................................................................................47
6. RECOMMENDATIONS...............................................................................................................49
6.1 RECOMMENDATIONS FOR GOVERNMENT FOLLOW-UP ACTION..................................................49
6.2 RECOMMENDATIONS FOR REGIONAL COLLABORATIVE EFFORTS ..............................................49
7. REFERENCES............................................................................................................................50
ii
NATIONAL REPORT ON FISHERIES PHILIPPINES 1
1. BACKGROUND
INFORMATION
1.1
Geographic and oceanographic description
The Philippines (Figure 1) is an archipelago with an Exclusive Economic Zone (EEZ) of
2,200,000km2, of which 266,000km2 is coastal (12%) and 1,934,000km2 is oceanic (88%). Its shelf
area covers 184,600km2, with the coral reefs spanning 30,000km2. Four major water bodies surround
the archipelago: the Pacific Ocean in the east; the Celebes Sea in the south; the South China Sea
(SCS) in the west; and the Philippine Sea in the north. Its bathymetric features are complex,
consisting of various trenches, submarine ridges, deep-sea basins, island arcs, and plateaus.
The North Pacific Equatorial Current mainly influences the properties and dynamics of eastern
Philippine waters. This current flows from the Pacific Ocean toward the eastern coast of the
archipelago and then splits into a northward branch generating the Kuroshio Current and a southward
branch that deflects eastward across the Pacific Equatorial Counter Current, with a minor stream
forming the Mindanao Current flowing toward the Celebes (or Sulawesi) Sea. On the other hand,
seasonal monsoon winds have the dominant effects on the surface circulation of western Philippine
waters. An eddy reportedly forms on the western side and encloses a warm water patch whose
position shifts with the season; such an eddy is vertically smaller than the eddy that dominates the
water circulation off eastern Luzon (Ronquillo 1975). Eddies in the SCS are predominantly cyclonic in
winter and anticyclonic in summer, with sizes from small to medium scale. During the northeast
monsoon (October to March), a southwesterly flow, originating from a cyclonic pattern of surface
water movements in the SCS, develops along the coast of Luzon and Palawan. In the same season,
Wyrtki (1961) found that surface water masses from the Pacific Ocean are transported into the SCS
through the Luzon Strait, mainly along the western side of the SCS at depths from 400 to 900m. This
condition reverses during the summer season; Western Pacific waters enter the northern SCS
through the Luzon Strait and, after mixing, form distinct water masses. Continental freshwater runoff is
also very significant. The dominant current during the southwest monsoon (AprilAugust) flows in a
northeasterly direction through the Luzon Strait and into the West Philippine Sea (Wyrtki 1961; Barut
et al. 1997).
The marine environment of the Philippines is typically tropical, with relatively warm and less saline
waters. Sea surface temperature varies between 24 and 30ºC, depending on the season but with
mean values varying slightly between 27 and 28ºC. Mean annual range in the temperature of waters
west of Luzon is around 5ºC. Salinity variations are relatively narrow; in the west-northwest part of the
Philippines, sea surface salinity ranges from 33.7 to 34.6 psu (Rojana-anawat et al. 2000). The South
China Sea portion exhibits a marked reduction in surface salinity during the southwest monsoon as
the western part of the archipelago experiences the rainy season. Temperature decreases with depth
by 0.03ºC/m from the surface to 200 m depth. The thermocline layer, ranging from 12 to 15ºC, occurs
at 150m depth on the western side (Rojana-anawat et al. 2000), which is thinner and shallower than
the thermocline formation on the eastern side of the archipelago. Recent estimates of primary
productivity in the northern SCS portion ranged from 0.10 to 1.53gC/m2/d (Furio and Borja 2000).
Water quality of the western Philippines has shown signs of deterioration. Saramun and Wattayakorn
(2000) found DDPH (dissolved dispersed petroleum hydrocarbons) in the area, at concentrations of
0.03 to 0.47 g/l and 0.02 to 1.47 g/l for the nearshore and offshore zones, respectively. The DDPH
were attributed to maritime and shipping activities, as well as oil exploration and production in the
west and northwest area of the Philippines. Several areas along the SCS side of the Philippines are
identified as pollution hotspots (Talaue-McManus 2000). Pollutive effects have been attributed to high
sediment loading and waste disposal, mostly of anthropogenic origin, that may severely affect marine
habitats in the SCS. Various forms of waste come from domestic, industrial, and agricultural sources,
causing the degradation of aquatic environments. The possible eutrophication effect of agricultural
runoff, which may trigger harmful algal blooms, is a major concern. The pollution threat of Manila Bay,
Subic Bay, and Batangas Bay to the waters of the SCS is clear, given the presence of industrial
estates and oil refineries/depots around these bays. Other areas at high risk and exhibiting a strong
sensitivity to pollution include Masinloc Bay (Zambales), Bacuit Bay (Palawan), and Apo Reef
(Mindoro).
Reversing Environmental Degradation Trends in the South China Sea and Gulf of Thailand
2 NATIONAL REPORT ON FISHERIES PHILIPPINES
1.2
Biogeographic and demographic features
The South China Sea portion of the Philippines is geographically delimited by western Luzon,
Palawan, and Mindoro Occidental, covering administrative regions I and III, and parts of Region IV
and the National Capital Region (NCR). In dealing with aquatic resources in the area, especially
fisheries, data constitute those obtained from the extensive coast and several embayments along
western Luzon, including the Batanes Islands further north, as well as from western Palawan waters
and the northern Mindoro coast (Figures 1 and 14). A review of demographic profile, resource
accounting, and environmental assessment of the area is provided in Talaue-McManus (2000), with
related data on other countries bordering the SCS. The SCS portion of the Philippines, excluding
Batanes Islands, is around 50,000km2, harbouring 16 cities and a total population of 26.3 million
people (from 1996 data in Talaue-McManus 2003). Population density in the same year stands at 472
persons/km2, with a finite growth rate of 2.1%. The area has a watershed spanning 27,500km2, with
five major rivers emptying into the SCS.
Mangroves, coral reefs, and seagrasses abound along the South China Sea side of the archipelago,
but measures of total coverage of these resources for the SCS sub-region are lacking. These vital
resources, which serve prominently as crucial habitats for diverse marine life, have been under severe
stress and the threats of further destruction remain unabated. Nationwide, the total cover of
mangroves in the Philippines has declined by 60%, with only 160,000ha remaining at present. Over a
70-year period, a mean loss rate of 460ha/y translates to around US$1.7 million that is lost to the local
economy. Two-thirds of the mangrove forests around the entire SCS, including those found in other
countries, have been decimated due to human utilisation and intervention. Coral reefs along the SCS
coast of the Philippines exhibit a degradation rate ranging from 10 to 30%, and about 50% of the
remaining stands are at high-risk. Similarly, around 30 to 50% of Philippine seagrass beds have been
severely damaged, with the SCS-wide meadows experiencing the same rates of loss. The rampant
destruction of these resources is mostly attributed to irresponsible resource-use practices, reflecting a
widespread disregard of their crucial ecological roles.
The distribution and condition of mangroves, corals, and seagrasses, along with their associated
fauna and flora, within the Philippine territory of the South China Sea are detailed below. The
transboundary relevance of these resources mainly pertains to the cross-border effects of losses in
biodiversity and fisheries productivity, along with issues associated with the trade of threatened
species (e.g. seahorses and marine turtles) and the sharing of responsibilities for conservation and
management in the region.
1.3
Overview of the fisheries sector
The fisheries sector of the Philippines is composed of culture and capture sub-sectors. Fishing is
classified into municipal or commercial type, depending on the gross tonnage (GT) of the boats used.
Municipal fishing includes activities not requiring the use of boats and those using boats not more
than 3 GT. Commercial fishing involves the use of boats more than 3 GT. The Philippine Fisheries
Code, enacted in 1998, prohibits commercial fishing within municipal waters whose designated
offshore boundary is 15 km from the shoreline. This practically grants the right of access to nearshore
fishing grounds exclusively to municipal fishers, whose population far exceeds that of commercial
fishers. However, with this right comes greater accountability and regulatory control. Municipal fishers
secure licences to fish from local government units (LGUs), whereas commercial fishers obtain
licences from the Bureau of Fisheries and Aquatic Resources (BFAR), which also issues licences to
fish in international waters.
Reversing Environmental Degradation Trends in the South China Sea and Gulf of Thailand
NATIONAL REPORT ON FISHERIES PHILIPPINES 3
Figure 1
Philippine Marine Jurisdictional Boundaries.
Reversing Environmental Degradation Trends in the South China Sea and Gulf of Thailand
4 NATIONAL REPORT ON FISHERIES PHILIPPINES
Table 1
Total fish landings (MT) by region in 1997 to 2001. Regions that interact with the
South China Sea, wholly or partly, are highlighted.
Region
1997 1998 1999 2000 2001
CAR
1,417 1,650 3,318 3,279 3,570
I
41,308 48,871 52,972 60,805 63,617
II
21,542 22,187 30,475 35,202 38,417
III
121,752 112,333 116,138 136,810 181,364
NCR
215,114 220,395 165,517 147,959 146,487
IV
607,184 588,866 613,107 643,315 619,858
V
119,352 113,282 111,947 115,065 150,514
VI
320,961 309,174 337,070 356,998 357,596
VII
153,970 152,332 159,243 164,545 191,531
VIII
73,707 72,312 76,200 78,728 91,318
IX
392,526 409,750 405,181 407,220 398,083
X
56,949 57,539 63,746 67,738 84,187
XI
41,996 41,141 44,481 45,170 49,180
XII
100,256 142,805 180,927 188,323 192,508
ARMM
455,893 468,790 482,907 453,912 505,096
CARAGA
69,629 68,093 80,543 88,263 93,204
Total
2,793,556 2,829,520 2,923,772 2,993,332 3,166,530
COMMERCIAL
MUNICIPAL
TOTAL
2,250,000
2,000,000
1,750,000
1,500,000
1,250,000
1,000,000
750,000
Landings MT
500,000
250,000
-
1980
1981
1982
1983
1984
1985
1986
1987
1988
1989
1990
1991
1992
1993
1994
1995
1996
1997
1998
1999
2000
2001
2002
Year
Figure 2
Total marine fish landings (MT) of the Philippines by sector in 1980 to 2002.
Reversing Environmental Degradation Trends in the South China Sea and Gulf of Thailand
NATIONAL REPORT ON FISHERIES PHILIPPINES 5
1.3.1 Total landings by fishing area
Fisheries constitute an important component of the agricultural sector in the Philippines. Total fish
landings increased steadily from 1980 to 2002, with the commercial yield increasing from 488,478 MT
in 1980 to 1,042,193 MT in 2002 (Figure 2). In contrast, total municipal landings declined from the
early 1990s until 1998, but peaked slightly from 1999 to 2002 (Figure 2). The total marine fish
landings by administrative region are presented in Table 1. Fish landings from Regions I and III,
including parts of Region IV and the NCR, constitute the catches from the SCS area (Figures 3 and
4). Figure 5 shows the different fishing grounds, which in Philippine waters are designated into
statistical areas, including the SCS sub-region. The landing sites monitored by the National Stock
Assessment Program are also indicated.
The SCS is one of the most important fishing grounds in the country. Although continuous fishing
takes place during the first semester of each year, the volume of fish catch contributes significantly to
total fish production. During the second semester, inclement weather associated with the southwest
monsoon hinders commercial fishing, thus commercial operations occur during periods of calm
weather conditions while municipal fishing takes place throughout the year. There are no direct
records of landings from the SCS portion of the Philippines. To provide a rough picture of fisheries
exploitation in the area, marine landings of Regions I and III, as well as those of Manila Bay and West
Palawan, in 1992 to 1995 are shown in Table 2. Although records of landed catch for Regions I and III
exist only until 2001, data for Manila Bay and West Palawan are available only until 1995.
Capture fisheries production in the SCS area during 1992 to 1995, ranged from 12 to 17% of total
annual production in the Philippines, and was much higher than the 1996 value of 120,592 MT/y
reported by Talaue-McManus (2000). As shown in Table 2, the commercial sub-sector made the
greatest contribution to total marine landings from the SCS, mostly from activities in the West
Palawan area. This reflects the relative superiority of commercial fishing technology (e.g. purse seines
and ringnets). Municipal landings, however, surpassed the commercial landings in West Luzon,
except in Manila Bay, possibly due to a large difference in the number of fishers.
Table 2
Philippine marine landings (MT) from the South China Sea area in 1992 to 1995.
Values in parenthesis indicate the share (%) of commercial and municipal sub-
sectors, respectively.
Year
Region I
Region III
Manila Bay*
West Palawan
Total (SCS area)
Nationwide
1995
23,172 (16/84)
28,607 (21/79)
22,836 (100/na)
162,420 (81/19)
229,786 (68/32) 1,889,226 (49/51)
1994
23,686 (10/90)
17,888 (31/69)
30,386 (100/na)
198,448 (82/18)
260,762 (73/27) 1,838,325 (46/54)
1993
25,364 (10/90)
23,853 (39/61)
38,417 (100/na)
191,110 (79/21)
266,549 (71/29) 1,851,906 (45/55)
1992
21,726 (6/94)
21,908 (37/63)
36,695 (68/32)
234,676 (80/20)
315,005 (71/29) 1,820,275 (43/57)
*- Municipal landings in 1992 to 1994 not available (na) for Manila Bay.
Commercial fish landings by the major fishing gears are presented in Figure 6. At the national level
and in terms of total production, purse seine is the most important commercial fishing gear,
contributing 47 to 58% of the total marine fish landings in 1992 to 1995, followed by ringnet that
contributed 14 to 21% (Figure 6). In the case of municipal landings by gear type during the same
period, gillnet accounted for 31 to 33% of the total, followed by line gears (hook and line, handline)
with 18 to 24% (Figure 7). To extract the same data for the SCS-wide fisheries, a ratio and proportion
scheme was employed with the assumption that the gear types used and the percent composition of
each gear are the same for the nationwide and SCS-wide scales. The gears used specifically within
the SCS sub-region must be verified in the future. Considering the limitations of the data used in
Figures 6 and 7, there is an apparent increase in the landings from purse seines and ringnets for the
commercial sub-sector, and gillnets and hook and line for the municipal sub-sector from the SCS
area. The dominant municipal gears are relatively size and species selective, and conceivably more
suited to the rough sea conditions and the hard ground relief on the SCS side of the archipelago.
1.3.2 Fishing effort by gear
So far, the available records on fishing effort in the SCS area only pertain to registered commercial
fishing vessels from Regions I and III (Table 3), without indicating the kind of fishing gears used.
Concerning the latter, preliminary inventory indicates that the major gears used in the SCS area are
ringnets, purse seines, modified Danish seines, gill nets, handlines, bagnets, and pushnets. Similar
Reversing Environmental Degradation Trends in the South China Sea and Gulf of Thailand
6 NATIONAL REPORT ON FISHERIES PHILIPPINES
data on municipal vessels for the SCS area are unavailable since their registration/licensing are the
responsibility of the respective local government units. Table 3 therefore underestimates the nominal
effort for the SCS sub-region; fishing boats from Region IV and the NCR must also be taken into
account. Attempt to disaggregate the fishing effort cannot be made without any baseline data on total
vessels and gears from the localities constituting the SCS sub-region. This highlights the need for an
improved and expanded collection of catch and effort statistics specific to the area.
56,000
Commercial
Municipal
Total
48,000
40,000
32,000
24,000
Landings MT 16,000
8,000
-
1992
1993
1994
1995
1996
1997
1998
1999
2000
Year
Figure 3
Marine fish landings from western Philippine waters (Regions I and III).
300,000
Commercial
Municipal
Total
270,000
240,000
210,000
180,000
150,000
120,000
Landings MT
90,000
60,000
30,000
-
1992
1993
1994
1995
Year
Figure 4
Marine fish landing from western Philippine waters (Manila Bay and West Palawan).
Reversing Environmental Degradation Trends in the South China Sea and Gulf of Thailand
NATIONAL REPORT ON FISHERIES PHILIPPINES 7
22.00
21.00
20.00
19.00
18.00
17.00
16.00
15.00
14.00
13.00
12.00
11.00
10.00
9.00
8.00
7.00
6.00
5.00
4.00
114.00 115.00 116.00 117.00 118.00 119.00 120.00 121.00 122.00 123.00 124.00 125.00 126.00 127.00 128.00
Figure 5
Map of the Philippines showing the different statistical fishing areas (enclosed by
lines) and sampling sites per administrative region (arrowheads).
Reversing Environmental Degradation Trends in the South China Sea and Gulf of Thailand
8 NATIONAL REPORT ON FISHERIES PHILIPPINES
500,000
450,000
400,000
350,000
300,000
250,000
200,000
150,000
100,000
50,000
-
1992
1993
1994
1995
140,000
120,000
100,000
80,000
60,000
40,000
20,000
-
1992
1993
1994
1995
Purse Seine
Ring Net
Trawl
Danish Seine
Bag Net
Hook & Line
Others
Figure. 6 Commercial marine fish landings (MT) by major fishing gear for the entire
Philippines (upper panel) and the SCS sub-region (lower panel) in 1992 to 1995. SCS
sub-region constitutes landings from Regions I and III, Manila Bay, and West
Palawan waters. Gear type and composition (%) per gear assumed the same for the
nationwide and SCS-wide scales.
Reversing Environmental Degradation Trends in the South China Sea and Gulf of Thailand
NATIONAL REPORT ON FISHERIES PHILIPPINES 9
300,000
250,000
200,000
150,000
100,000
50,000
-
1992
1993
1994
1995
80,000
70,000
60,000
50,000
40,000
30,000
20,000
10,000
-
1992
1993
1994
1995
Gil Net
Hook & Line
Beach Seine
Fish Corral
Ring Net
Baby Trawl
Spear
Long Line
Danish Seine
Fish Pot
Bag Net
Crab Lift Net
Purse Seine
Others
Figure 7
Municipal marine fish landings (MT) by major fishing gear for the entire Philippines
(upper panel) and the SCS sub-region (lower panel) in 1992 to 1995. SCS sub-region
constitutes landings from Regions I and III, Manila Bay, and West Palawan waters.
Gear type and composition (%) per gear were assumed the same for the nationwide
and SCS-wide scales.
Reversing Environmental Degradation Trends in the South China Sea and Gulf of Thailand
10 NATIONAL REPORT ON FISHERIES PHILIPPINES
Table 3
Total Number and Gross Tonnage (GT) of Commercial Fishing Vessels In Regions I
and III from1990 to 2002. Na Not available.
Region I
Region III
Total
Year
Number Total
GT Number Total GT
Number
Total GT
1990 3
41
27 628
30 668
1991 na
na
na na
na na
1992 67
1,366
50 808
117 2,174
1993 na
Na
na na
na na
1994 59
1,229
298
4,815
357 6,044
1995 59
1,229
298
4,815
357 6,044
1996 59
1,229
298
4,815
357 6,044
1997 73
1,286
35 981
108 2,268
1998 60
1,232
32 866
92 2,089
1999 113
1,833
40 1,081
153 2,914
2000 113
1,833
40 1,081
153 2,914
2001 113
1,833
40 1,081
153 2,914
2002 113
1,833
40 1,081
153 2,914
1.3.3 Economic value of fisheries production
Fisheries contribution to total Gross Domestic Product (GDP) in 2002 was 2.2% at current prices and
4.0% at constant prices. Philippine GDP in 2002 was US$356 billion. On the other hand, the
contribution of the fisheries sector to the Gross Value Added (GVA) in agriculture, fishery, and forestry
by industry group for 2002 is shown in Table 4. Fisheries GVA amounts to PhP90,180 million (15.2%)
at current prices, whereas PhP41,772 million (20.3%) at constant prices. Nationwide, the total value of
fisheries production, both sub-sectors and aquaculture included, increased steadily from PhP70,215
million in 1993 to PhP113,244 million in 2002 (Table 5). For the SCS sub-region, the economic value
of landings was estimated using the average contribution of each sub-sector to total capture fisheries
production, i.e. excluding aquaculture, in 1992 to1995. The four-year average contribution of the SCS
municipal sub-sector and commercial sub-sector to nationwide total production was 7.8% and 22.5%,
respectively. Thus, municipal and commercial landings from the SCS sub-region in 1993 were valued
at PhP1,718 million and PhP4,055 million, respectively (Table 5). In 2002, the value of the SCS
landings increased to PhP2,976 million and PhP8,928 million for the municipal and commercial sub-
sectors, respectively. By aggregation, the total value of marine landings from the SCS sub-region
increased from PhP5,773 million in 1993 to PhP11,904 million in 2002 (Table 5).
Regarding the balance of trade, national fishery exports in 2002 (182,032 MT valued at US$506
million) were higher than in 2001 (159,069 MT valued at US$459 million). The volume of fisheries
imports for both years was higher than the volume of exports. Nevertheless, there was a positive
balance of trade for both years in terms of value (Table 6).
Table 4
Agriculture, fisheries, and forestry contribution to the Gross Value Added (GVA) by
industry group. Prices are in PhP million.
% to
% to Agricultural
At Constant
Industry Group
At Current Prices
Agricultural
Sector
Prices
Sector
Agricultural crops (Palay, corn,
343,295 58.0 105,163 51.0
coconut, etc.)
Livestock
78,983 13.3 26,580 12.9
Poultry 50,960
8.6
23,611
11.5
Agricultural
activities
27,920 4.7 8,737 4.2
Fishery
90,180 15.2 41,772 20.3
Forestry
803 0.1 335 0.2
TOTAL
592,141 100
206,198 100
Reversing Environmental Degradation Trends in the South China Sea and Gulf of Thailand
NATIONAL REPORT ON FISHERIES PHILIPPINES 11
Table 5
Value (PhP million) of nationwide and SCS-wide (landings from Regions I and III,
Manila Bay, and West Palawan) fish production in 1993 to 2002. Ppreliminary.
NATION-WIDE SCS-WIDE*
Year
Culture
Municipal
Commercial
Total
Municipal
Commercial
Total
(PhP)
(PhP)
(PhP)
(PhP)
(PhP)
(PhP)
(PhP)
2002 35,404 38,159
39,681
113,244
2,976 8,928
11,904
2001 36,634 34,222
36,089
106,945
2,669 8,120
10,789
2000 32,148 32,595
33,879 98,622
2,542 7,623
10,165
1999 29,046 31,034
32,242 92,322
2,420 7,254
9,674
1998 26,430 28,966
29,737 85,133
2,259 6,691
8,950
1997 27,289 27,393
25,935 80,617
2,137 5,835
7,972
1996 33,347 25,373
24,555 83,275
1,979 5,525
7,504
1995 33,658 26,464
23,065 83,187
2,064 5,190
7,253
1994 35,003 24,475
20,714 80,192
1,909 4,539
6,448
1993 30,163 22,031
18,021 70,215
1,718 4,055
5,773
* The estimator for the SCS-wide sub-sector value was the ratio of SCS-wide landings over the nationwide landings for each
sub-sector from 1992 to1995; estimation was limited to that period due to data limitation in the SCS sub-region. Estimator
values were 0.078 for the municipal sub-sector and 0.225 for the commercial sub-sector.
Table 6
Balance of trade for the fisheries sector in 2001 and 2002.
2002 2001
Category
Quantity
FOB Value
Quantity
FOB Value
(MT)
(PhP M)
(US$ M)
(MT)
(PhP M)
(US$ M)
Fishery
Export
182,032 26,178 506 159,069 22,723 459
Fishery
Import
218,585 5,073 97
179,994 3,815 76
Trade
Balance
36,553 21,105 409 20,925 18,908 383
1.3.4 Importance of the fisheries sector in terms of employment and dependence
The fisheries sector employs around a million people broken down into following: municipal 68%;
aquaculture 26%; and commercial 6%. This constitutes 3 to 4% of the national labor force. Assuming
that a typical family is comprised of 5 to 6 persons, then around 5 to 6 million people are directly
dependent on fisheries. In addition, the fisheries sector indirectly provides employment to those
engaged in fish distribution, marketing, processing, operation of ice plants and cold storage, and
related industries such as net-making, boat-building, and boat-engine sales and repairs.
2.
SPECIES OF REGIONAL, GLOBAL, AND TRANSBOUNDARY SIGNIFICANCE
2.1
Ranking of Importance
The Regional Working Group on Fisheries identified 13 pelagic and 9 demersal fish species, 10
cephalopods, and 11 crustaceans to be considered in the initial review as species with transboundary
significance (see Tables 1a, 2a, 3a, and 4a of Annex 4 UNEP/GEF/SCS/RWG-F 2/3). The 13 pelagic
species belong to four major groups under the ISSCAAP (International Standard Statistical
Classification of Aquatic Animals and Plants) classification system: Selar crumenophthalmus,
Decapterus macrosoma, and D. maruadsi under Group 34 (Jacks, Mullets, Sauries, etc.); Sardinella
spp. and Stolephorus spp. under Group 35 (Herrings, Sardines, Anchovies, etc.); Scomberomorus
commerson, S. guttatus, Auxis thazard, A. rochei, Euthynnus affinis, and Thunnus tonggol under
Group 36 (Tunas); and Rastrelliger kanagurta and R. brachysoma under Group 37 (Mackerels). On
the other hand, the 9 demersal species are lumped under Group 33 (Red fishes, Basses, Congers,
etc.).
2.1.1 Ranking in terms of landings
In the Philippines, the Bureau of Agricultural Statistics (BAS) of the Department of Agriculture (DA)
generates the statistics for aquaculture, commercial, and municipal fisheries. Species-specific
information for marine fish is limited to the top 30 species. These 30 species belong to eight groups
under the ISSCAAP system and account for almost 68% of nationwide fish production (Table 7).
Hence, any significant fluctuation in total fish landings, especially of the pelagic species, would
definitely affect the country's position as a global fish producer. Further, almost half of the top 30
Reversing Environmental Degradation Trends in the South China Sea and Gulf of Thailand
12 NATIONAL REPORT ON FISHERIES PHILIPPINES
species are in the priority list and they form the bulk of species traditionally harvested/landed in
areas/regions facing the SCS. The proportion of the eight species groups in fish catches from the
SCS area is much higher compared to the national average (Table 8), except for Group 42 (Crabs).
This could be explained by the fact that West Palawan, which is part of Region IV, is a major
contributor to commercial fish production (~19%) in the Philippines.
2.1.2 Local market value
Wholesale and retail prices of selected fish species groups are given in Table 9. Except for Groups 57
(Squids) and 45 (Acetes), price data are available for representative species of all groups. Although
the traditional group with the highest local market value is crabs, only Groups 33 and 37 are the fish
groups typically consumed locally and command a high price. This is possibly attributed to the high
price of some demersal species, e.g. threadfin bream and fusilier in Group 33, compared to the small
pelagics.
Table 7
Average landings (MT) and percentage share to total marine fish production of the
priority species groups.
Share
Productiona
Valueb
ISSCAAP Code
(%)
(MT)
(PhP million)
Group 33
(Slipmouth, Threadfin bream, Fusilier,
Goatfish, Grouper, Snapper, Siganid,
8.8
195,864
5,254
Parrotfish, Porgies)
Group 34
(Roundscad, Big-eyed scad, Crevalle, Flying
18.0 403,030
10,812
fish, Cavalla, Mullet)
Group 35
(Indian sardine, Fimbriated sardine,
17.3 386,314
10,364
Anchovy, Round herring)
Group 36
(Skipjack, Frigate tuna, Yellowfin tuna,
15.4 344,078
9,231
Eastern little tuna, Spanish mackerel)
Group 37
(Indian mackerel, Indo-Pacific mackerel,
3.9 88,090
2,363
Hairtail)
Group 42
(Blue crab)
1.4
32,326
867
Group 45
(Acetes) 0.7
15,890
426
Group 57
(Squid)
2.2
48,916
1,312
Total 67.8%
1,514,508
40,630
a Refers to yearly production from 1997 to 2001 as reported by the Bureau of Agricultural Statistics (BAS).
b Refers to the Weighted average value.
Table 8
Percentage share of priority species caught from selected areas/regions facing
the South China Seaa in 1992 and 1995 in comparison with the national average.
ISSCAAP Code
Nat'l Average
1992 Catch
1995 Catch
Group 33 (Slipmouths, etc.) 8.77
12.36
12.61
Group 34 (Roundscads, etc.)
18.01 32.95 29.67
Group 35 (Indian sardines, etc.) 17.32 14.34 25.32
Group 36
(Tunas)
15.40 18.51 16.47
Group 37 (Mackerel, etc.)
3.94 9.44 7.40
Group 42 (Blue crab)
1.44
0.56
0.80
Group 45 (Acetes)
0.71 3.90 2.21
Group 57
(Squid)
2.20 3.54 3.19
Total 67.79%
95.61
97.67
aRefers to landings from Lingayen Gulf, Manila Bay, Batangas Coast, and West Palawan.
Table 9
Wholesale (W) and retail (R) prices for selected fish species in Philippine peso.
1997 1998 1999 2000 2001
ISSCAAP Code
W R W R W R W R W R
Group 33 (Demersalsa)
45.4 70.3 46.8 72.1 50.9 76.1 54.1 80.7 57.4 85.3
Group 34
(Roundscad)
31.9 45.0 34.4 47.4 40.0 53.4 41.5 54.9 44.4 59.4
Group 35
(Anchovies)
28.1 44.1 31.2 44.9 32.6 46.7 35.8 48.0 36.0 50.2
Group 36
(Frigate
tuna)
35.3 46.3 36.4 49.0 42.4 51.3 43.5 52.6 48.0 57.3
Group 37
(I.
mackerel)
47.9 60.9 49.3 61.7 53.6 64.8 56.8 67.5 60.2 70.7
Group 42
(Blue
Crab)
51.6 74.2 58.4 77.4 61.6 82.2 61.5 88.8 62.4 98.0
aAverage price for threadfin bream, slipmouth, and fusilier.
Reversing Environmental Degradation Trends in the South China Sea and Gulf of Thailand
NATIONAL REPORT ON FISHERIES PHILIPPINES 13
2.1.3 Status
IUCN (International Union for the Conservation of Nature, presently World Conservation Union)
classifies species into 9 categories: Extinct (EX); Extinct in the Wild (EW); Critically Endangered (CR);
Endangered (EN); Vulnerable (VU); Near Threatened (NT); Least Concern (LC); Data Deficient (DD);
and Not Evaluated (NE). So far, none of the 43 species identified by the Regional Working Group on
Fisheries are listed on the IUCN Red List of Threatened Species.
2.1.4 Food
Security
Local fish production exhibited a steady increase from 1997 to 2001, accounting for 96% of the
national fish supply, while the contribution of food fish imports averaged about 4% (Table 10).
Assuming such rates to remain constant while population increases by 2% and per capita
consumption remains at 2000 level, domestic fish production will have to increase, with necessary
reinforcement by imports.
Table 10
Annual fish supply and consumption (MT) from 1997 to 2001.
Item
1997 1998 1999 2000 2001
Production 2,136,264
2,144,184
2,227,660
2,286,293
2,380,735
Food Fish Import
118,069
51,893
120,586
120,180
68,388
Apparent Food Use
1,894,210
1,837,612
1,984,944
2,034,235
2,088,499
Per Capita Use (kg)
26.62
25.32
26.81
26.59
26.80
Population 71,145,556
72,581,223
74,045,637
76,498,735
77,925,894
Total Fish Supply
2,254,333
2,196,077
2,348,246
2,406,473
2,449,123
2.2
Biology and ecology of the priority species
About 2,400 fish species have been recorded in the Philippines, but the number occurring along the
western (South China Sea) portion of the country is still unknown. It is therefore likely that the number
occurring in the Philippines, and in other countries in the region, is much larger than that currently
recorded.
The Regional Working Group (Fisheries) has issued a comprehensive list of demersal and pelagic
fish, as well as invertebrates, with defined levels of transboundary significance. Information on the
biology and ecology of the listed species occurring in the Philippines were derived largely from
databases, particularly FISHBASE and CEPHBASE, and from available reports and publications.
Table 11 shows those species in the comprehensive list that have been recorded in the Philippines.
Several species have no records of occurrence in areas along the South China Sea, although they
have been observed at several localities in the country. In such cases, the locality/area where they
have been observed is indicated. Most of the listed species, however, occur in areas bordering the
South China Sea.
Depending on the availability of references, the information includes: a) geographical distribution of
the stock; b) migration pattern; c) size-related aspects of the stock; d) growth parameters; e)
reproductive biology; f) spawning time (season); g) spawning areas; h) nursery grounds (areas); and i)
food and feeding habits.
Most data regarding commonly occurring species pertain to relative abundances in catches and
estimates of population parameters; reproductive biology (particularly spawning areas) and feeding
habits are relatively scarce, although useful insights may be provided by data on related species or
the same species from other fishing grounds in the country or region. Any local (Philippine)
information is therefore vital and incorporated into the sheets. The lack of information is usually
remedied by citing relevant data from the next most similar area. Focus is placed on two major areas,
Lingayen Gulf and Manila Bay, mainly because of available information. Relevant areas include the
Batanes Islands, Ilocos Coast, Subic Bay and Zambales coast, BatangasMindoro waters,
Malampaya area and northern Palawan, and the Kalayaan (Spratlys) Islands Group.
Reversing Environmental Degradation Trends in the South China Sea and Gulf of Thailand
14 NATIONAL REPORT ON FISHERIES PHILIPPINES
2.2.1 Large pelagic fishes
This group includes the various tuna species. In the Philippines, there are a total of 21 tuna and tuna-
like species, but only six are caught in commercial quantities (PCAMRD 1993). The six species
include the highly migratory Thunnus albacares (yellowfin) and Katsuwonus pelamis (skipjack), which
are normally caught in offshore waters, and Thunnus obesus (big-eyed), Euthynnus affinis (eastern
little), Auxis thazard (frigate), and A. rochei (bullet), which are more frequently caught in inshore
waters.
Tuna spawning grounds are located throughout Philippine waters (Figure 8), including the waters off
West Palawan, Mindoro Strait, and West Luzon. The major spawning ground, however, is the Celebes
Sea in the south. Migration through the Sulu Sea (Figure 9) allows the mixing of stocks between the
Pacific Ocean (via the Celebes Sea) and the SCS.
The prevalence of young tuna (TL<30 cm) in commercial and municipal catches has been a major
concern since the 1980s because it may lead to growth overfishing (Aprieto 1982). Worse, the use of
fish aggregating devices (FADs), locally called "payaos", tends to enhance cannibalism thus
exacerbating the above situation (PCAMRD 1993). Of the six tuna species mentioned above, only T.
obesus is believed to be facing a high risk of extinction and is thus listed under the vulnerable
category.
Large pelagics typically include other oceanic fish such as Makaira spp. (marlin), Xiphias gladius
(swordfish), Istiophorus platypterus (sailfish), Scomberomorus commerson (Spanish mackerel),
Elopidae (tenpounder), Sphyraenidae (barracuda), Coryphaenidae (dolphinfish), large Caranx spp.
(cavalla), Elagatis bipinnulatus (rainbow runner), and Chanos chanos (milkfish). As a group, these fish
contribute around 7% to total landings of pelagic fish (Pagdilao et al. 1991), but little is known about
their biology or ecology in local waters. Milkfish are extensively cultured in the Philippines, but only
those caught in the wild are included as large pelagics.
Reversing Environmental Degradation Trends in the South China Sea and Gulf of Thailand
NATIONAL REPORT ON FISHERIES PHILIPPINES 15
Pacific
South
China
Sea
Ocean
Sulu
Sea
Celebes
Sea
Figure 8
Tuna spawning grounds in the Philippines (Wade 1951).
Reversing Environmental Degradation Trends in the South China Sea and Gulf of Thailand
16 NATIONAL REPORT ON FISHERIES PHILIPPINES
South
Pacific
China
Sea
Ocean
Sulu Sea
Celebes Sea
Figure 9
Tuna migration routes to the South China Sea.
Reversing Environmental Degradation Trends in the South China Sea and Gulf of Thailand
NATIONAL REPORT ON FISHERIES PHILIPPINES 17
Table 11
Species of transboundary significance and their recorded occurrences in waters of the South China Sea side of the Philippines.
SPECIES Common
name
Occurrence
Aetobatus narinari
Spotted eagle ray
Manila Bay
Dasyatis kuhlii
Blue-spotted stingray
Lingayen Gulf; Manila Bay; Cavite
Manta birostris
Giant manta ray
No information
Taeniura lymma
Blue-spotted ribbontail ray
Ulugan Bay, Palawan
Alopias pelagicus
Pelagic thresher shark
No information
Alopias vulpinus
Thintail thresher shark
No information
Carcharhinus dussumieri
Whitecheek shark
Dumaguete, Negros Oriental (*)
Carcharhinus limbatus
Blacktip shark
Pilas Is., Basilan, Sulu Sea (*)
Carcharhinus longimanus
Oceanic whitetip shark
No information
Carcharhinus melanopterus
Blacktip reef shark
Manila (market)
Carcharhinus sorrah
Spottail shark
Cavite
Chiloscyllium indicum
Bamboo shark
Manila Bay
Chiloscyllium griseum
Bamboo shark
Sim Sim Laut Is., Sulu Sea (*)
Chiloscyllium plagiosum
Bamboo shark
Manila Bay; Calapan, Mindoro
Chiloscyllium punctatum
Bamboo shark
Manila Bay
Rhicodon typus
Whale shark
Mariveles Bay, Bataan; Manila Bay; Batangas Bay and Bauan, Batangas
Sphyrna lewini
Scalloped hammerhead shark
No information
Sphyrna zygaena
Smooth hammerhead shark
Cavite; Taytay, Palawan
Istiophorus platypterus
Indo-pacific sailfish
Makaira indica
Black marlin
Makaira mazara
Indo-pacific blue marlin
Makaira nigricans
Atlantic blue marlin
Xiphias gladius
Swordfish
Manila Bay; Western Philippines
Auxis rochei
Bullet tuna
Western Philippines
Auxis thazard
Frigate tuna
Nasugbu and Balayan Bay, Batangas Province, Luzon,
Euthynnus affinis
Kawakawa Western
Philippines
Katsuwonus pelamis
Skipjack tuna
Taal and Balayan Bay, Batangas
Thunnus albacares
Yellowfin tuna
Western Philippines
Thunnus tonggol
Longtail tuna
Western Philippines
Rastrelliger brachysoma
Short mackerel
Bauang, La Union; Manila Bay; Calapan, Mindoro
Rastrelliger faughni
Island mackerel
Visayan Sea (*)
Rastrelliger kannagurta
Indian mackerel
Nasugbu, Batangas Province, Luzon;
Reversing Environmental Degradation Trends in the South China Sea and Gulf of Thailand
18 NATIONAL REPORT ON FISHERIES PHILIPPINES
Table 11 cont.
Species of transboundary significance and their recorded occurrences in waters of the South China Sea side of the
Philippines.
SPECIES Common
name
Occurrence
Scomberoides commersonnianus
Talang queenfish
No information
Scomberoides lysan
Double-spotted queenfish
Vigan, Ilocos Sur; Manila Bay; Bolbok, Batangas; Malampaya Sound, Palawan
Scomberoides tala
Barred queenfish
Manila Bay; Cavite
Scomberomorus commerson
Narrow-barred spanish mackerel San Fabian, Pangasinan; Manila Bay
Scomberomorus guttatus
Indo-pacific king mackerel
Guinlo, Malampaya Sound, Palawan
Scomberomorus lineolatus
Streaked seerfish
No information
Coryphaena hippurus
Common dolphin fish
Fortune Is., Nasugbu, Batangas; Naujan, Mindoro; Malampaya Sound, Palawan
Cypselurus spp.
Flying fish
Batangas; Manila Bay
Alepes djedaba
Shrimp scad
Samar Sea; San Pedro Bay
Atule mate
Yellowtail scad
Bauang, La Union; Manila Bay
Decapterus macrosoma
Shortfin scad
Manila Bay
Decapterus maruadsi
Japanese scad
Amurang, North Celebes
Decapterus russelli
Indian scad
Iloilo (*)
Bauang, La Union; Mariveles, Bataan; Balayan Bay, Batangas; Linapacan Island,
Megalaspis cordyla
Torpedo scad
Palawan
Selar crumenopthalmus
Bigeye scad
Bangui, Ilocos Norte; Orion, Bataan; Manila Bay; Calapan, Mindoro
Selaroides leptolepis
Yellow-stripe scad
Bauang, La Union; Manila Bay
Amblygaster sirm
Spotted sardinella
No information
Santa Maria, Ilocos; San Fernando, La Union; Lingayen Gulf; Orani and Orion,
Anadontostoma chacunda
Chacunda gizzard shad
Bataan; Manila Bay; Cavite; Balayan Bay, Batangas
Chirocentrus dorab
Dorab wolf herring
Vigan, Ilocos Sur; Rosario, La Union; San Fabian, Pangasinan; Manila Bay; Cavite
Chirocentrus nudus
Whitefin wolf herring
No information
Basud River and Port Jamelo, Luzon; Sta. Cruz, Marinduque; Panabutan Bay,
Sardinella albella
White sardinella
Zamboanga (*)
Sardinella brachysoma
Deepbody sardinella
Manila Bay, Luzon
Sardinella fimbriata
Fringescale sardinella
Bauang, La Union; Manila Bay; Nasugbu, Batangas
Sardinella gibbosa
Goldstripe sardinella
Vigan, Ilocos Sur; Orani and Orion, Bataan; Manila Bay
Encrasicholina devisi
Devi's anchovy
No information
Encrasicholina heteroloba
Shorthead anchovy
No information
Encrasicholina punctifer
Buccaneer anchovy
No information
Stolephorus commersoni
Commerson's anchovy
Manila Bay
Reversing Environmental Degradation Trends in the South China Sea and Gulf of Thailand
NATIONAL REPORT ON FISHERIES PHILIPPINES 19
Table 11 cont.
Species of transboundary significance and their recorded occurrences in waters of the South China Sea side of the
Philippines.
SPECIES Common
name
Occurrence
Stolephorus indicus
Indian anchovy
Balayan Bay, Batangas; Puerto Galera, Mondoro
Epinephelus akaara
Hongkong grouper
No information
Dagupan, Pangasinan; Subic Bay, Zambales; Calapan, Mindoro; Linapacan Is. and
Epinephelus bleekeri
Duskytail grouper
Ulugan Bay, Palawan
Epinephelus fuscoguttatus
Brown-marbled grouper
Manila Bay; Puerto Galera, Mindoro; Ulugan Bay, Palawan
Epinephelus malabaricus
Malabar grouper
Cavite; Calapan, Mindoro; Cuyo Is., Palawan
Epinephelus sexfasciatus
Sixbar grouper
Bauang, La Union; Manila Bay; Nasugbu and Lemery, Batangas
Epinephelus tauvina
Greasy grouper
Cavite, Cavite Province
Plectropomus aereolatus
Squaretail coral grouper
No information
Plectropomus leopardus
Leopard coral grouper
Manila Bay; Port Hamilo, Batangas; Bolalo Bay and Endeavor Straits, Palawan
Plectropomus maculatus
Spotted coral grouper
Verde Is. Passage; Endeavor Strait, Palawan
Lutjanus argentimaculatus
Mangrove red snapper
Camiguin Is., Batanes; Mariveles, Bataan; Cavite; Pagapas, Batangas
Mariveles, Bataan; Port Jamilo, Batangas; Calapan, Mindoro; Quiminatin and Cuyo
Lutjanus lutjanus
Bigeye snapper
Is., Palawan
Lutjanus malabaricus
Malabar blood snapper
Dagupan, Pangasinan; Manila Bay; Batangas
Lutjanus sanguineus
Humphead snapper
Manila bay; Balayan Bay, Batangas
Lutjanus sebae
Emperor head snapper
Linapacan and Cuyo Is., Palawan
Lutjanus vitta
Brownstripe red snapper
Manila Bay; Cavite
Pristipomoides filamentosus
Crimson jobfish
Cebu; Dumaguete, Negros Oriental; Balabac Strait (*)
Pristipomoides typus
Sharptooth jobfish
Manila (market); Nasugbu, Batangas
Port Matalvi, Zambales; Limbones Cove, Cavite; Nasugbu, Pagapas Bay and Port
Caesio cuning
Redbelly yellowtail fusilier
Hamilo, Batangas; Taytay, Palawan
Bauang, La Union; Cape Bolinao, Pangasinan; Manila Bay; Balayan Bay, Batangas;
Saurida spp.
Lizardfish
Cuyo Is., Palawan
Curimao, Ilocos Norte; San Fernando, La Union; San Fabian, Pangasinan; Orion,
Nemipterus spp.
Threadfin breams
Bataan; Manila Bay
Priacanthus macracanthus
Red bigeye
Tayabas Bay, Quezon (*)
Priacanthus tayenus
Purple-spotted bigeye
San Fernando and Bauang, La Union; Mansalay, Mindoro
Trichiurus lepturus
Largehead hairtail
No information
(*) Indicates areas not bordering the South China Sea.
Reversing Environmental Degradation Trends in the South China Sea and Gulf of Thailand
20 NATIONAL REPORT ON FISHERIES PHILIPPINES
2.2.2 Small pelagic fish species
Small pelagic is an arbitrary category of various fishes that are generally surface dwelling within
continental shelf waters. Most of these small, fast-growing, and short-lived species belong to 13
families: Scombridae (mackerels), Carangidae (crevalles and other jacks), Clupeidae (herrings and
sardines), Engraulidae (anchovies), Chirocentridae (wolf herring), Trichiuridae (hairtails), Atherinidae
(silversides), Hemiramphidae (halfbeaks), Exocoetidae (flying fish), Mugilidae (mullets), Strongyluridae
(garfish), Megalopidae (tarpon), and Caesionidae (fusiliers) (Dalzell and Ganaden 1987).
As a group, small pelagics comprise 40% of the total fish landings. The dominant groups are anchovies
(Stolephorus spp.), sardines (Sardinella spp.), roundscads (Decapterus spp.), and mackerel
(Rastrelliger spp.). Population parameter estimates for small pelagic stocks from different fishing
grounds are available in Ingles and Pauly (1984), Corpuz et al. (1985), Lavapie et al. (1987), and
several unpublished reports from 1990 to 2000.
A recent review of their general biology and ecology is given in Calvelo (1997). Small pelagic fish
generally attain a maximum weight of not more than 500 g. They are generally short-lived, with lifespan
of two to three years, although the round scads may live to about four years (Calvelo 1997). Many
exhibit inshore-offshore migrations, but most are limited to the neritic zone. Because of the difficulty in
identifying their larvae to the genus or species level, specific spawning locations are unknown. Previous
studies, however, point to such areas as Mindoro Strait and the waters off Manila Bay as likely
spawning grounds for some pelagic fish in the South China Sea (Ronquillo 1975). Most pelagic species
are planktivorous, although some are carnivorous particularly on the young of other species. As
planktivores, they are known to live near the water surface and are therefore strongly influenced by
environmental conditions (PCAMRD 1993). The high seasonal variation in their abundance is attributed
to environmental influences such as monsoons, rainfall, salinity regimes, and plankton biomass.
2.2.3 Demersal fish species
A total of 46 species groups comprise the demersal landings in the Philippines, with the Leiognathidae
(slipmouths) comprising about 15% of the total (Pagdilao et al. 1991). Others groups include the
Nemipteridae (threadfin breams), Mullidae (goatfish), and Synodontidae (lizardfish), which are common
in soft-bottom areas, and Lutjanidae (snappers), Lethrinidae (emperor fish), Siganidae (rabbitfish), and
Serranidae (groupers), which are generally associated with reefs. Also included in this category are the
many species of sharks, skates, and rays (elasmobranchs). Together, these nine groups represent over
50% of demersal fish landings in the Philippines (Pagdilao et al. 1991). Because of their diversity in
form, feeding, and behavior, demersal fish are exploited with various gears over different substrate
types, including mangrove swamps, seagrass beds, and coral reefs. As bottom-dwellers, their food
includes seaweeds and seagrasses, worms, small shrimps, small fish, and even shelled organisms and
corals.
The classification of elasmobranchs as by-catch is typical in most fisheries of the Philippines. As a
result, their catches are likely underreported. Little is known about their biology and ecology in local
waters because fishers usually discard their carcasses at sea after removing and retaining their fins. Six
rays and 43 sharks that reportedly occur in the Philippines, although not necessarily in the SCS area,
are included in the Red List. Of the rays, Urogymnus asperrimus (porcupine ray) and Aetomylaeus
nichofii (banded eagle ray) are vulnerable (at high risk of becoming extinct in the wild), another two
species are near threatened (likely to be vulnerable in the future), whereas data are deficient for both
Aetobatus narinari (spotted eagle ray) and Manta birostris (manta ray). Of the 43 sharks in the Red List,
only Carcharhinus hemiodon (pondcherry shark) is listed as critically endangered (extremely at high risk
of extinction in the wild), 4 other species are endangered (facing a very high risk of extinction), 10 are
vulnerable, including Rhincodon typus (whale shark), 7 are near threatened, 15 are almost nearly
threatened, while 6 have insufficient data for categorizing.
Reef-associated fish are also included in this category. While the higher valued species, such as
groupers and snappers, are exploited for human consumption, a number of species not consumed by
humans have also been exploited for the live aquarium fish trade (Nañola and Aliño 1999). The more
commonly targeted aquarium fish include chaetodontids (butterflyfish) and pomacanthids (angelfish).
Seahorses and pipefishes (syngnathids) are also exploited and marketed as "aphrodisiacs" in other
countries (Nañola and Aliño 1999). Among the syngnathids, nine species (including two pipefish) are
Reversing Environmental Degradation Trends in the South China Sea and Gulf of Thailand
NATIONAL REPORT ON FISHERIES PHILIPPINES 21
redlisted, five as vulnerable, and four with insufficient data. Those categorised with insufficient data are
species whose biology and ecology are prone to disruption from observed levels of exploitation.
Syngnathids brood their eggs in male abdominal pouches, and as such, the number of eggs produced
per female is very limited.
Aside from seahorses, eight other bottom dwelling fish are included in the Red List, inlcuding three
groupers (Cephalopolis boenak, Cromileptes altivelis, and Epinephelus lanceolatus), the humphead
wrasse (Cheilinus undulatus), two dragonfishes (Pegasidae), and two gobiiform fish.
2.2.4 Commercially
exploited
invertebrates
The commercially exploited invertebrates in the country include species of molluscs, crustaceans, and
echinoderms. Each of these groups is very diverse. A listing of species would be too extensive to
include in this review. For several invertebrates, rearing and culture techniques have been investigated
and developed for the purpose of propagation. As such, susceptibility to local extinction would be
negligible. These include sea urchins (Tripneustes gratila) (Juinio-Meñez et al. 1998), sea cucumbers,
shrimps, crabs, and several molluscs, including giant clams. The latter group is of special conservation
concern as most are slow-growing and have reduced abundances in the wild. Six species of locally
occurring giant clams are included in the Red List, categorised as either vulnerable (Tridacna derasa
and T. gigas) or least risk (Hippopus hippopus, H. porcellanus, Tridacna maxima, and T. squamosa),
although the vulnerability of the least risk group to current exploitation levels cannot be ignored. Some
biological information on the 15 cephalopod species occurring in the SCS area is provided in Table 12.
Table 12
Summary of biological and ecological information for cephalopod species with
transboundary significance in the South China Sea.
Species
Max. Size
Prey Items
Other Information
References
Octopus (Octopus)
120150cm
hermit crab, blue
Boletzky and Hanlon (1983); Roper
macropus
TL
crab, shrimp
et al. (1984)
O. (O.)
membranaceus
O. (O.) aegina
30cm ML
Roper et al. (1984)
Sepia
10cm ML
Roper et al. (1984)
(Acanthosepion)
brevimana
S. (A.) lycidas
38cm ML
shrimp
Boletzky and Hanlon (1983)
S. (A.) aculeata
23cm ML
prawn, mysid
Boletzky and Hanlon (1983); Roper
et al. (1984)
S. (Sepia) pharaonis
43cm ML
Hatching
size:0.1g
Roper et al. (1984); Wood and O'Dor
33cm ML
Size/age at maturity: 84.1g,
(2000)
110d; 3300deg-d
Sepiella inermis
prawn,
crab,
Hatching size: 0.01g
Boletzky and Hanlon (1983); Wood
fish,
Size/age at maturity: 36.6g,
and O'Dor (2000)
90d; 2700deg-d
Sepioteuthis
36cm ML
fish, mysid,
Hatching size: 0.044g
Boletzky and Hanlon (1983); Wood
lessoniana
shrimp,
Size/age at maturity: 122.7g,
and O'Dor (2000)
90d; 2700deg-d
Uroteuthis
30cm ML
Roper et al. (1984)
(Photololigo)
chinensis
U. (P.) duvauceli:
29cm ML
Roper et al. (1984)
U. (P.) edulis
40cm ML
Roper et al. (1984)
Nototodarus
15.2cm
Caught in depths up to 710m
Nateewathana et al. (2000)
hawaiiensis
Sthenoteuthis
18cm ML
Abound in W. Phil. at 50
Siriraksophon et al. (2000);
oualaniensis
26cm ML
100m; lifespan ~1yr; >75%
Nateewathana et al. (2000); Basir
diet comprised of fish and
(2000); Zakaria (2000)
cephalopods; size at 1st mat.
: 11cm ML
Thysanoteuthis
100cm ML
Generally caught in upper
Nateewathana et al. (2000)
rhombus
50m of water column
Reversing Environmental Degradation Trends in the South China Sea and Gulf of Thailand
22 NATIONAL REPORT ON FISHERIES PHILIPPINES
3.
STATUS AND THREATS
3.1
Current Status
In this section, the Philippines part of the South China Sea is categorised into two sectors: western
Luzon, including the Batanes Islands and the major fishing grounds of Lingayen Gulf and Manila Bay,
and western Palawan, including the western coast of Mindoro, Calamianes Islands, and the
embayments of Malampaya Sound, Bacuit Bay, and Ulugan Bay.
3.1.1 Fisheries Status in terms of CPUE
Fishing effort data are not regularly and adequately included in the published statistics for Philippine
fisheries, thus assessment of catch per unit effort (CPUE) is difficult. This section presents information
for the years where the computation of CPUE is possible, as well as that stemming from site-specific
studies.
At present, CPUE in the SCS area depends on the location and habitat where fishing takes places. In
the waters adjacent to Batanes Islands, pelagic fisheries exhibited high levels of CPUE levels in 1997 to
2002 (Table 13). The trend observed is that catch rates have either increased (e.g. simple handline,
drift gillnet) or remained constant (e.g. multiple handline, drift lines for flying fish), thus suggesting that
the area is still in good condition for pelagic fisheries. This may be attributed to the distance of the
fishing grounds from the major fishing ports and the limited fishing period (MarchJune) imposed by
perennially rough sea conditions, which both serve as a natural stopgap mechanism to fishing activities
in the area. This is in contrast to its reef fisheries, where exploitation occurs year round. Although catch
rates there are mostly higher than elsewhere in the country, latest figures (19982002) indicate
decreasing CPUE for spear fishing and octopus fishing (Table 13). The high CPUE observed for many
gear types in the area may have driven increases in total fishing effort levels. The total number of
fishers operating in the area increased 8% from 1997 (1330) to 2002 (1431). Similarly, the number of
fishing gear units increased 741% from 423 in 1997 to 3557 units in 2002. A possible cause of the large
discrepancy in the effort (boats and gears) data is the change in the survey method.
Most fisheries, especially demersal fisheries, in enclosed bays and gulfs along the SCS indicate an
overfished status. In Manila Bay, only 10% of the 1947 level of demersal fish population remained in
1993 (Armada 1993). From a high catch rate of 44kg/h for trawls in 1947, it decreased to only 10kg/h in
1993. Fugure 10 shows the CPUE trend of trawls in Manila Bay. In Lingayen Gulf, catch rates of trawls
are even lower at 4.4kg/h in 2002, a huge reduction from the 67.7kg/h observed in 1947.
Table 13
Catch rates (kg/h) of fishing gears used in Batanes waters (from Villarao et al. 2003).
Demersal
Reef
Pelagic
BS
Multi
Octo
Simp
Troll
Anch
Surf
Drift
Mod
Gar
Year
Hookah Spear
Jigger
FF Dline
Gnet
HL
Jig
HL
Line
DInet
Gnet
Gnet
Egnet
TL
1997
3.0
1.8
3.9
1.1
3.4
1.7
5.9
4.3
1998
4.4 2.7
6.6 1.1 2.0
5.0 10.4 1.2
1999
5.1 2.7
5.7 1.2 4.3 0.6 8.9 17.7 2.4 0.6
2000
2.3
3.1 22.2
4.7 1.2
1.8 3.7 4.6
2.2
1.5
0.4
2001
2.6
3.3 14.8
1.9 0.2
1.9 4.1
6.0
7.7
14.9
1.9
0.4
2002
4.6
2.9
19.7
3.7
0.7
2.7
3.9
6.5
5.6
15.6
2.7
0.7
Legend: BS Gnet, bottom-set gillnet; Mutli HL, multiple handline; Octo jig, octopus jig; Simp HL, simple handline;
Anch DInet, anchovy drive-in net; Surf Gnet, surface gillnet; Drift Gnet, drift gillnet; Mod Egnet, modified encircling
gillnet; Gar TL, garfish troll line; FF Dline, flying fish drift line.
Reversing Environmental Degradation Trends in the South China Sea and Gulf of Thailand
NATIONAL REPORT ON FISHERIES PHILIPPINES 23
50
y = 6E+160x-48.41
40
r = 0.680
30
20
CPUE (kg/h)
10
0
1940
1950
1960
1970
1980
1990
2000
Year
Figure 10
Catch per unit effort (CPUE) of trawls in Manila Bay (from Armada 1993).
40
Danish Seine
Trawl
30
20
CPUE (MT/boat/y)
10
1998
1999
2000
2001
2002
Year
Figure 11
Catch per unit effort (CPUE) of Danish seines and trawls in Lingayen Gulf
(from Gaerlan et al. 2003).
There appears to be a succession of fish populations in overfished areas, in which pelagic species
replace lost demersal biomass. This has been observed in Manila Bay and Lingayen Gulf, where an
increase in pelagic catch replaced the loss in demersal stocks. For instance, data from Lingayen Gulf
indicate that from 1998 to 2002, CPUE (tons/boat/y) of Danish seines, which exploit both pelagic and
demersal fish, increased by 20.8% while trawl CPUE declined by 26.8% over the same period (Figure
11) (Gaerlan et al. 2003). In Manila Bay, the high variability of trawl CPUE is attributed to seasonal
catches of small pelagics within trawl nets constructed with large mouth openings.
Reversing Environmental Degradation Trends in the South China Sea and Gulf of Thailand
24 NATIONAL REPORT ON FISHERIES PHILIPPINES
In western Palawan waters, pelagic resources remain in good condition, with ringnets and purse seines
yielding an average of 42 tons per lunar cycle (~1416 d/mo) (Ingles 2000). However, in nearby coastal
waters adjacent to Busuanga Island, Palawan, small pelagics seem to have disappeared. In this case,
catch rates of bagnets have dropped from 15 tons/lunar cycle in 1988 to 0.2 tons/lunar cycle in 1998. At
present, the use of bagnets has totally ceased in Coron Bay, Palawan.
In summary, the following generalisations may be drawn from the status and levels of CPUE in the
Philippines portion of the SCS:
1. Commercial fishing continues to observe high CPUE and is profitable for two reasons: (a) the
offshore relocation of the fleet; and (b) the use of aggregating devices. Fishing fleets based in the
SCS area are now fishing further offshore, mostly in lightly exploited western Palawan waters.
Whereas vessels using ringnets and purse seines in nearshore areas employ efficient FADs and
high-intensity artificial lighting on their boats to attract and concentrate large volumes of pelagic
fish. The aggregating devices tend to herd fish into fishable quantities within the zone of action of
the netting gears, thus increasing their vulnerability to capture even in highly depleted coastal
areas.
2. All nearshore fishing grounds, particularly those within embayments, are overfished. These areas
(e.g. coral reefs, shallow soft-bottom areas) are characterised by diminishing catch rates, increased
units of most gears, decreasing sizes of fish, and a reduced number of fish species in the fishery.
Notable exceptions include the waters adjacent to Batanes Islands, Lubang Island, and some
protected areas in west Palawan.
3. In highly exploited and overfished areas such as Manila Bay and Lingayen Gulf, the decline in
demersal resources has led to an abundance of pelagic species triggering a massive shift in fishing
gears and fish catching techniques.
4. There is a need for new measures of fishing effort that reflect actual and effective fishing capacity
and exploitation rates. The use of conventional effort units (e.g. horsepower, gross tonnage) seems
inappropriate due to the use of FADs in fishing.
3.1.2 Status of fish stocks based on historical review of fish landings and CPUE
Generally, CPUE exhibited a gradual increase from 1967 to 1987 (Barut et al. 1997). This trend,
however, may not portray the true state of fisheries, as the calculation of CPUE relied on the
relationship between total yield and total gross tonnage. Boat tonnage is a coarse and perhaps
inappropriate indicator of fishing effort. A separation of the data by habitat/ecosystem type indicates
that, during the same period, CPUE for small pelagic and demersal fish exhibited a decreasing trend
(Figure 12) (Dalzell and Ganaden 1987). The large tuna handline fishery conducted in the southern
waters of the Philippines, whose fleet at one time reached ~ 20,000 units, distorted this general trend.
The entry of highly efficient Danish seines to the fishery may also have influenced this situation. Both of
these gears have very high catch rates using low tonnage boats.
For traditional fishing grounds, including Lingayen Gulf and Manila Bay, historical CPUE data describe
the various states of the fishery through time. In Lingayen Gulf, the number of boats in the commercial
fishing sub-sector remains very high. From three units of Danish seines operating in 1988 (Silvestre et
al. 1991), the number increased to 42 units in 2002. Similarly, the 23 units of trawlers in 1985 (Mines
1986) increased to 48 units in 2002. It is important to note that observers in 1985 considered Lingayen
Gulf to be overfished. While the combined numbers of commercial boats increased from 1998 to 2002,
total gross tonnage actually decreased (Figure 13). This is possibly a result of an increase in the
number of Danish seiners and a decrease in the number of larger trawlers.
Manila Bay is one of the oldest fishing grounds in the country and its history of fishing could be used to
infer the status of Philippine fisheries in general and the fisheries along the South China Sea in
particular. The historical trend of trawl catch rates in Manila Bay (Figure 10) indicates that the demersal
stock observed in 1993 represents just 10% of the total biomass level of demersal species observed in
1947. However, the CPUE of catches of pelagic fish have recently increased, thus indicating that
pelagic fish now dominate the area's fish fauna. In addition, a unit of drift gillnet in 1993 landed an
average of 19.1 kg/d whilst a unit of a high bottom-set gillnet averaged 10.4 kg/d, with the catch in the
latter gear type mostly being composed of small pelagic species.
Reversing Environmental Degradation Trends in the South China Sea and Gulf of Thailand
NATIONAL REPORT ON FISHERIES PHILIPPINES 25
Palawan, which is noted for its pristine waters, is experiencing the same plight. Data in Ingles (2000)
indicates a rapid decrease in CPUE for both small- and large-scale fishing gears in West Palawan.
Reduced catch rates are common in many small-scale, reef-based fishing gear operations. For
instance, catch rates in fisheries supporting the trade of live reef fish, typically groupers and wrasses,
have declined in areas depending on reefs that are highly accessible; sighting surveys in 1998 support
this observation (Ingles 2000). Fisheries have greatly reduced the population densities of groupers,
lobsters, and octopuses on the reefs of Calamianes Islands, Palawan.
3.2
Current and potential threats
3.2.1 Current
threats
Legal fishing
The absence of a national policy to regulate effort is one of the main causes of resource depletion. In
practice, fisheries policies and laws are formulated as a reaction to the current fisheries situation
instead of taking into account future needs and trends. Fisheries management as practiced in many
areas of the country is "self regulating", i.e. if the resource collapses, the fishery simply stops.
120000
700,000
Fisheries Production (MT)
100000
600,000
500,000
80000
400,000
60000
300,000
40000
200,000
20000
Commercial Effort (GT)
GT
prodn
100,000
0
0
1967
1972
1977
1982
1987
Year
3.5
3.0
)
Small Pelagics
Demersal
2.5
2.0
1.5
1.0
CPUE (MT/hp/y
0.5
0.0
1965
1970
1975
1980
1985
Year
Figure 12
Total fisheries production (metric tons, MT) and fishing effort (gross tonnage,
GT) (upper panel; from Barut et al. 1997) and catch per unit effort (CPUE) of
small pelagic and demersal fish (lower panel; from Dalzell and Ganaden 1987) in
the Philippines.
Reversing Environmental Degradation Trends in the South China Sea and Gulf of Thailand
26 NATIONAL REPORT ON FISHERIES PHILIPPINES
2000
100
1600
95 Number of Boats
1200
90
800
85
Total Tonnage
Total tonnage
400
80
Total Number
0
75
1998
1999
2000
2001
2002
Year
Figure 13
Total number and gross tonnage of fishing boats in Lingayen Gulf.
Illegal fishing
Destructive fishing methods, particularly in reef areas, are still commonly used. These methods include
the use of toxic chemicals, explosives, and fine mesh nets.
Market forces
The global demand for specific fishery products could drive a fishery to be profitable despite very low
population levels of the target species. High prices for invertebrates (e.g. shrimps, crabs, octopuses,
lobsters) and other key species (live groupers, Napoleon wrasses) in export markets may encourage
fishers to fish out populations, despite low catch rates.
3.2.2 Potential
threats
Fisheries development in the Philippines is characterised by the gradual expansion of the fishing
grounds at a pace that is dictated by the rate of resource depletion (Ingles 2000). This is also true for
the Philippine areas facing the South China Sea. At present, both the municipal and commercial fishers
are tending to operate in less fished areas further from the shore, thus catch rates remain constant as
the fleet moves to more productive areas. In this setting, the continuous and perhaps increased
exploitation of fish resources occurs until reaching the open access limit.
Handline fishers, muro-ami operators, and even spear fishers now regularly visit reef patches as far as
the Kalayaan Islands. This practice, if not stopped, would continue until the very last of those few
remaining pristine areas is overexploited.
Pollution
Marine pollution, including marine debris, could be a potential threat to the fisheries of the area. Oil
spills from oil rigs/depots and maritime accidents could result in irreversible ecodisasters with dire
consequences for fisheries production. With oil and gas resources recently discovered in western
Palawan waters, the threat of oil spills may escalate in the future. Similarly, the high intensity of
shipping activities and oil transport may pose similar dangers. The area is indeed a busy sea-lane for
the constant movement of both people and potential pollutants.
Population increase
The current rate of population growth is 2.1%, implying that the Philippine population will double in 23
years. Hence, the number of fishers would proportionately increase. With the current state of fisheries
resources and without any actions aimed at rebuilding depleted stocks, population increases will
exacerbate the current pressure on fisheries resources.
Climate change
Global warming and the impacts of sea-level rise may also affect fisheries. There are studies that
demonstrate how ENSO events influence fisheries. Coral bleaching during the 1998 El Niño episode
has devastated wide coral reef areas on the western side of the country. In El Nido, Palawan, many of
these reefs failed to recover. The effects of coral bleaching on fisheries need to be further studied and
better understood.
Reversing Environmental Degradation Trends in the South China Sea and Gulf of Thailand
NATIONAL REPORT ON FISHERIES PHILIPPINES 27
Market forces
The globalisation of trade in fisheries products may be advantageous to some fishing sectors but
disadvantageous to others. The reduction of trade barriers is expected to have short-term impacts on
Philippine capture fisheries. Subsidies to fisheries by many developed countries will have a pronounced
impact on the competitiveness of Philippine fisheries products. There is likewise a tendency to the
imposition of non-tariff barriers (e.g. ecolabeling, sanitary and phytosanitary restrictions) upon fisheries
products from developing countries.
4.
HABITATS AND AREAS OF IMPORTANCE IN THE MAINTENANCE OF EXPLOITED FISH
STOCKS
In discussing habitats and areas important in the maintenance of fish stocks, particularly those with
transboundary relevance, it is necessary to examine things on a large, at least basin-wide, scale since
the focus is on species occurring over a wide geographical range and thus subject to large-scale
dispersal mechanisms and other processes. Furthermore, plankton investigations showing spatial egg
and larval distributions typically cover large areas rather than specific localities or habitats. Hence, the
following discussion deals primarily with fishing grounds or basins rather than specific localities and
their habitat characteristics.
In this respect, certain portions of the western Philippine coastline stand out due to coastal topography
and available fisheries information. These include Lingayen Gulf and Manila Bay, and a group of
islands with high topographic complexity, namely Northern Palawan and the Calamianes Islands
(Figure 14).
4.1 Biophysical
profile
Mangroves, seagrass beds, and coral reefs comprise the most productive shallow water habitats in the
marine environment. Besides having their respective resident fauna and flora, they may also serve as
habitats for different life stages (e.g. spawning grounds for adults, nursery grounds for juveniles) of
various fish and invertebrates. As such, the ecological interconnections between these habitats serve a
major role in the productivity of coastal and offshore waters.
The overall distribution of coral reefs in the country is shown in Figure 15, covering about 30,000km2
(McManus 2002) or about 5% of the world's coral reefs. This includes the double barrier reef system
north of Bohol (Danajon Reef) and the barrier reef system several kilometers off the west coast of
Palawan in the South China Sea. Other extensive reef areas (not adequately shown in the figure)
include the northern Palawan Shelf, the Surigao Shelf, and the Bicol Shelf. Overall, about 400 coral
species (Licuanan 2000) and over 1000 reef-associated fish species (Hilomen et al. 2000) have been
recorded in the country. Along the western Philippines, coral reefs are most extensive in Palawan,
where reef cover is estimated at about 9,800km2, or about 1/3 of the country's total reef area (PCSD
2000). The northernmost portion of Palawan (Calamianes Islands) ranks as one of the highest in terms
of hard coral diversity (305 species) in the country (Werner and Allen 2000; Capili et al. 2002. Other
reef areas of high biodiversity significance include the Balabac Strait in Southern Palawan, Southern
Mindoro, portions of Batangas and Zambales coasts, western Lingayen Gulf, northern Batanes,
Scarborough Reef, and the Kalayaan Island Group (CI 2002).
Maps of the overall distribution of mangrove forests and seagrass beds in the country are unavailable,
although maps showing high priority areas in terms of biodiversity conservation are given in Figures
16a and b. At least 50 mangrove and mangrove-associated species have been reported in the country,
although the total cover of mangrove forests has been drastically reduced from about 500,000 ha in
1920 to around 100,000ha in 1997 (Calumpong and Meñez 1997). Much of this is attributed to forest
conversion to fishponds and other shoreline development activities. Along the western Philippines,
priority areas of high biodiversity conservation for mangroves include the entire province of Palawan
and a few remaining stands along the coast of Batangas, southeastern Lingayen Gulf, and on the
northern coast of Cagayan province (Figure 16a).
Reversing Environmental Degradation Trends in the South China Sea and Gulf of Thailand
28 NATIONAL REPORT ON FISHERIES PHILIPPINES
Batanes
Ilocos
Ilocos
Coast
Lingayen Gulf
Lingayen
Gulf
SubicBa
Subic Ba yy,
Zambales
Manila
Manila Bay
Bay
Batangas
Mindoro
Coast
Strait
Malampaya
Sound
Malampaya
Calamianes
No. Palawan
Islands
KIG
KIG
Northern
Palawan
Figure 14
Map of western Philippines showing locations of main embayments (red squares)
and other coastal areas of transboundary significance in the South China Sea.
KIGKalayaan (Spratlys) Islands Group.
Reversing Environmental Degradation Trends in the South China Sea and Gulf of Thailand
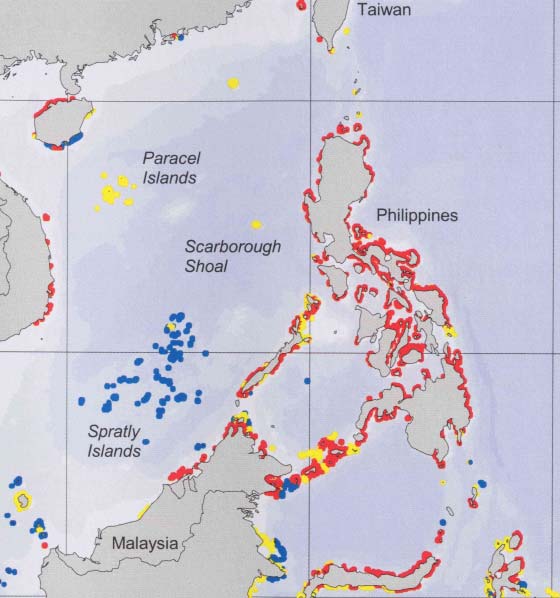
NATIONAL REPORT ON FISHERIES PHILIPPINES 29
Low risk
Moderate risk
High risk
Figure 15
Overall distribution of coral reefs of various risk levels in the Philippines. Areas
along the western coast with highest priority in terms of reef biodiversity and
conservation are indicated by ellipses or squares.
At least 13 species of seagrasses have been recorded in the country (Calumpong and Meñez 1997).
Similar to mangroves, the habitat offered by seagrass beds is more important than the species richness
of the grasses themselves. In both ecosystems, it is the primary producers themselves (i.e. mangroves
and seagrasses) that form and provide the bulk of physical habitat for the diverse faunal and floral (i.e.
seaweeds) assemblages commonly found in them. Primary production in both ecosystems is consumed
primarily through the detritus pathway, which involves several levels of benthic consumers that in turn
serve as (protein-rich) prey for the more mobile and visible invertebrates (e.g. crabs, lobsters, molluscs,
and echinoderms) and fish (Odum 1971; Mann 1982). The natural abundance of small benthic
detritivores, the physical protection provided by the grasses and the mangrove roots/trees, and the
physiological requirements of these shallow water coastal ecosystems make them ideal nursery
grounds for a diversity of marine animals.
Reversing Environmental Degradation Trends in the South China Sea and Gulf of Thailand
30 NATIONAL REPORT ON FISHERIES PHILIPPINES
4.1.1 Known
spawning
grounds
Several ichthyoplankton surveys have been conducted in various parts of the country wherein
information regarding spawning grounds is available. However, since larvae are generally only
identifiable to family level, species-specific spawning grounds cannot be identified. Spawning grounds
for tuna (Figure 8) include the west coast of Palawan, Mindoro Strait extending further into the Sulu
Sea, the offshore areas of Manila Bay-Zambales, and the Ilocos coast. Findings that are more recent
consider the Celebes Sea, including Moro Gulf, as the major spawning grounds for tuna, with
subsequent migration through the Sulu Sea via Balabac Strait, Northern Palawan, and Mindoro Strait
(Figure 9). This migration facilitates mixing of tuna stocks from the South China Sea with those from
the Celebes Sea, the major spawning ground.
a) Mangrove
b) Seagrass
Priority
Priority
Areas
Areas
Figure
16 Areas of highest priority for a) mangrove and b) seagrass biodiversity and
conservation along the coast of the western Philippines.
Reversing Environmental Degradation Trends in the South China Sea and Gulf of Thailand
NATIONAL REPORT ON FISHERIES PHILIPPINES 31
Lingayen
Gulf
Pacific
South
China
Ocean
Sea
Mindoro
Strait
Malampaya
Sound
Sulu
Sea
Celebes
Sea
Figure 17 Major area
s of intense fish spawning based on Magnusson (1970) and Tan (1970).
Table 14 provides a summary of zooplankton biomass and ichthyoplankton density in various areas
along the western Philippines and adjacent internal waters. Both fish egg and larval density estimates
are highest in Malampaya Sound (Estudillo et al. 1980), a rather deep embayment on the west coast of
northern Palawan (Figure 14). Zooplankton biomass for the same year was likewise high in this area.
Recent estimates of zooplankton density in the Sound (Ingles 2002) also show high values (Table 15).
If a zooplankton biomass of 0.01ml/m3 is considered typical of oceanic waters (Hermes and Villoso
1985), then based solely on plankton densities, Malampaya Sound is likely a spawning ground for
various fish species. Unfortunately, species composition of ichthyoplankton is not reported.
Ordoñez et al. (1975) reported concentration of fish larvae in Mindoro Strait (Figure 17) during their
survey, although reported values were much lower than that recorded in Malampaya Sound (Table 15).
Because larval densities have large differences with those observed in internal waters (Batangas
Coast/Manila Bay), the area was thus considered a spawning ground, especially for Thunnidae,
Carangidae, Serranidae, and Mullidae, which comprised over 75% of the ichthyoplankton in the area.
Reversing Environmental Degradation Trends in the South China Sea and Gulf of Thailand
32 NATIONAL REPORT ON FISHERIES PHILIPPINES
Specific areas of high larval densities may not necessarily be the area where the spawning actually
took place, but more likely at the downstream portion of the latter due to the displacement by water
currents. Local hydrography (current speed and direction) would then determine the magnitude of the
displaced distance. What is perhaps more relevant is that locations for both spawning (i.e. high egg
concentrations) and settlement (high larval concentrations) are equally important for the survival and
continued reproduction of fish stocks. In the marine environment, both locations are more likely found
within at least a portion of a fishing ground rather than in a single specific habitat within the fishing
ground (e.g. specific reef or seagrass bed).
Table 14
Comparison of zooplankton biomass (ml/m3) and fish egg and larval densities
(ind/100 m3) at locations along the South China Sea side of the Philippines.
Egg
Larvae
Peak
Location Biomass
References
Density
Density
Density
Chamchang and Chayakul
South China Sea (W. Phil.)
-
18.4
11.9
-
(2000)
Lingayen Gulf
0.6
115.4
53.6
DecApr
Estudillo (1985)
Malampaya Sound (Inner)
5.1
1126.7
575.0
MaySep
Estudillo et al. (1980)
Malampaya Sound (Outer)
3.6
1081.7
465.2
MaySep
Estudillo et al. (1980)
Mindoro Strait
1.926
1.08
2835
-
Ordoñez et al. (1975)
Northern
Palawan
-
- 10-50 -
Armada
(1997)
Northern Palawan
0.2
41.2
12.3
-
Campos (2000)
Batangas Coast/Manila Bay
-
-
1.2
-
Ordoñez et al. (1975)
Sulu Sea
0.030.25
-
-
-
Hermes and Villoso (1985)
Visayan Sea
0.86
339.6
67.9
-
Campos et al. (2002)
Table 15
Comparison of net primary production (gC/m2/d) and zooplankton density (ind/m3)
in the South China Sea and some coastal areas of the Philippines.
Net 1o
Zooplankton
Area
Production
Density
Reference
South China Sea (Western Philippines)
0.11.53
4464,683
Furio and Borja (2000)
Relox et al. (2000)
South China Sea (NW Palawan)
0.40.5
San
Diego-McGlone
et al. (1999)
South China Sea (North of KIG*)
4114±256
Palermo
et al. (2003)
Lingayen Gulf
0.52.8
1,0009,000
MERF (2002)
Manila Bay
0.73.8
2206240
MADECOR (1995)
Malampaya Sound (Northern Palawan)
1,90010,700
Ingles (2002)
Visayan Sea
11,700
Campos et al. (2002)
*Kalayaan (Spratlys) Islands Group.
Comparable larval densities have also been recorded in Lingayen Gulf (Estudillo 1985), the SCS
(Chamchang and Chayakul 2000), and Northern Palawan (Armada 1997; Campos 2000) (Table 14). In
Lingayen Gulf, eggs and larvae were concentrated along the coast from the southern central to the
eastern portions of the Gulf. Low ichthyoplankton densities were recorded at the mid-Gulf stations
(Estudillo 1985). Unfortunately, the survey did not include the western Gulf area, which includes much
of the reefs in there. A more recent plankton survey (MERF 2002) reported a hundredfold difference in
zooplankton biomass between the high concentrations in the Western Gulf region extending from
Bolinao to the Hundred Islands Reef system, and the rest of the Gulf. Water circulation in Lingayen Gulf
(Figure 18) is forced by the northward shelf current passing Cape Bolinao, resulting in a wake feature
that forms an eddy across the mouth of the Gulf (Altemerano and Villanoy 2002). Dispersal modeling
showed that most particles (i.e. larvae) released near the Bolinao Reef Flat are entrained in the
headland eddy, favoring settlement and recruitment along the western Gulf region. Therefore, it is more
likely that the latter region is a major spawning ground for reef and other fish within Lingayen Gulf.
In the SCS, highest egg concentrations were recorded at about 100nm off the coasts of Ilocos
southward to Zambales, whereas the highest larval densities occurred further south and in internal
waters of Mindoro and Northern Palawan (Chamchang and Chayakul 2000). The latter is consistent
with the results of Ordonez et al. (1975). The dominant fish groups in more recent surveys include the
gobiids, carangids, and apogonids, which were found closer inshore, whereas the scombrids and
thunnids were found further offshore (Chamchang and Chayakul 2000).
Reversing Environmental Degradation Trends in the South China Sea and Gulf of Thailand
NATIONAL REPORT ON FISHERIES PHILIPPINES 33
In northern Palawan, spawning and settlement grounds are likely further inshore, particularly within the
numerous embayments and indentations along the coast (Campos 2000). The major pelagic groups in
the area include the carangids, clupeids, scombrids, and engraulids, whereas the most common
epibenthic groups are the gobiids, mugilids, and the reef-associated haemulids, monacanthids, and
lutjanids. Collectively, these groups comprised about 65% of the larval assemblage in the area (Floro
2003).
From the foregoing discussion and based on available data from plankton surveys, three major
spawning areas are identifiable: (a) the western portion of Lingayen Gulf; (b) Mindoro Strait; and (c)
Northern Palawan including the Calamianes Islands. While it is believed that Scarborough Shoal and
the Kalayaan Island Group (KIG) are major sources of propagules for the country's archipelagic waters
(and fishing grounds), comparable information (e.g. plankton) useful for more definitive examination are
lacking.
4.1.2 Known nursery areas and feeding grounds
There is a paucity of available information regarding the potential productivity of waters along the
western Philippines. Investigations in 1998 show that the area south of Subic Bay extending to waters
west of northern Palawan has higher phytoplankton biomass, as indexed by chlorophyll
concentrations, than waters further north (Bajarias 2000; Furio and Borja 2000). Relatively high
concentrations of chlorophyll have also been reported for the shelf, shoal, and oceanic areas west of
northern Palawan (San Diego-McGlone et al. 1999). An overall distribution of chlorophyll ,
zooplankton, and small pelagic fish abundance indicators is shown in Figure 19. High zooplankton
biomass is also closely associated with areas of high chlorophyll concentrations (Relox et al. 2000).
Purse seine fishing experiments conducted in the vicinity in 1998 showed that catch rates for small
pelagic fish, primarily Decapterus spp., were at least tenfold higher just off the Bataan Peninsula than in
other coastal areas further north or south (Pastoral et al. 2000), thus showing a good spatial
correspondence with the concentrations of phytoplankton and zooplankton.
High fish biomass is normally supported by high primary and secondary plankton production. From the
information presented above, it can also be inferred that, within the SCS sub-region, high fish
abundance is in close spatial correspondence with both high zoo- and phytoplankton biomass. Hence, it
follows that higher concentrations of nutrients are required to sustain the primary and secondary
production, which in turn supports the fisheries production capacities, in coastal embayments. A
comparison of net primary production and zooplankton concentrations in the SCS area (Table 15)
highlights the large difference. This implies that if early developmental stages (e.g. larvae) of coastal
stocks were to benefit from areas that provide natural protection from open water predation, and from
those where productivity adequately supports high consumption and rapid growth rates, Lingayen Gulf
and Manila Bay would likely serve as important nursery grounds.
The prevalence of juveniles in trawl catches in Lingayen Gulf (MERF 2002) and Manila Bay (Armada
1995) is a clear indication that both areas serve as nursing and feeding grounds for many coastal
stocks, including those of transboundary significance. Definitely, for some species, these areas would
be important spawning grounds as well, although for migratory species such as tuna and other large
pelagics, their dependence on such areas for spawning is uncertain.
Reversing Environmental Degradation Trends in the South China Sea and Gulf of Thailand
34 NATIONAL REPORT ON FISHERIES PHILIPPINES
17
16.75
16.5
Cape
16.25
Bolinao
Bolinao
Reef Flat
Hundred
Islands
16
119.5
119.75
120
120.25
120.5
Figure 18
Water circulation in Lingayen Gulf showing eddy formation at the mouth and
entrainment within the western portion of the Gulf (Altemerano and Villanoy 2002).
Figure
19 General distribution of chlorophyll (green: concentration increases with
darkness), high zooplankton concentrations (blue), and highest catch rates for
small pelagics (red) in western Philippines during AprilMay 1998.
4.1.3 Known
fishing
grounds
Figure 20 shows the major areas where soft-bottom demersal fishing (e.g. trawling) has traditionally
been conducted, along with areas where primarily hard-bottom (reef) demersal fisheries normally
operate (Simpson 1979). Trawl fishing is concentrated around the two major embayments, with
activities in northern and northwestern Palawan restricted to the trawlable portions. Reef fishing only
covers a limited area along the Luzon coast.
Reversing Environmental Degradation Trends in the South China Sea and Gulf of Thailand
NATIONAL REPORT ON FISHERIES PHILIPPINES 35
In contrast, traditional fishing grounds for pelagic species, particularly small pelagics, cover almost the
entire coastline from Ilocos to Batangas, including Verde Island Pass, Lingayen Gulf, and Manila Bay,
and further south into Palawan (Simpson 1979). The major fishing grounds for round scads based on
landing statistics are located mostly in interisland waters (Figure 21), with the exception of waters
around northern Palawan, the coast of Batangas, and in Manila Bay. For small pelagics as a whole, the
major fishing grounds along the western Philippines include western Palawan and the waters around
Manila Bay (Figure 22). In contrast, the most productive tuna fishing grounds are located in the
southern portion of the country (Figure 23), except the coast of Batangas.
In the open waters of the SCS, there is meager information on the spatial distribution of fish catch rates.
From historical accounts, however, there have been numerous reports of foreign vessels fishing in the
area of Scarborough Shoal, a disputed area about 150nm west of Zambales (Thomas 1999). The
structure of shoals, including reef habitats that provide shelter and prey for a variety of fish species and
shallow areas that permit benthic primary production to enhance the carrying capacity of the immediate
environment, makes them attractive fishing grounds. Also, the topography in and around shoal areas
increases the potential for physical entrainment features, which tend to concentrate plankton. Thus, it is
theoretically valid to claim that Scarborough Shoal may serve as a source of eggs and larvae of fish
and invertebrate stocks along the coast, although there have been no systematic investigations on this
matter.
4.2
Unknown issues such as stocks with undefined spawning grounds
There is scarce information about the spawning grounds for elasmobranchs (sharks and rays) and
invertebrate groups. In general, elasmobranchs either deposit benthic egg cases or carry their eggs.
They have very low fecundity so that protection of their spawning and nursing grounds is necessary to
prevent further depletion of their stocks. Little is known about elasmobranchs in the country, even along
the SCS coast, maybe due to the absence of a directed fishery for them. Elasmobranchs are still
considered as bycatch in fisheries, and the practice of discarding much of the bycatch at sea, except for
shark fins, hampers taxonomic identification and measurement of catch.
In the case of invertebrates, there is more information on crustaceans (shrimp and crabs), although
most are from the interisland waters. Similar to fish, many invertebrates are broadcast spawners with
planktonic early life stages. Thus, their propagules are also subject to dispersal by currents. However,
for the less motile invertebrates, such as sea urchins, sea cucumbers, gastropods, and bivalves, it is
likely that their stocks are dependent on recruitment from local spawners. This is one of the reasons
why developing culture, larval rearing, and reseeding techniques remain a viable option for managing
such stocks. Larval rearing techniques have been developed for species of giant clams, some bivalves,
and the sea urchin Tripneustes gratila, while the procedures for sea cucumber are still being refined.
Cephalopods, except for Sepioteuthis lessoniana, are lesser studied due to an excessive interest in
fish. Even in scientific surveys, most cephalopod species are often unidentified and simply lumped
together as squid, octopus, or cuttlefish. There is some data for oceanic squids Tysanoteuthis rhombus
and Sthenoteuthis oualaniensis from exploratory fishing cruises in the SCS (Dickson et al. 2000;
Siriraksophon et al. 2000).
4.3
Current and potential threats
Threats to the habitats of fishing grounds are summarised in Tables 16 to 19. Lingayen Gulf and
Manila Bay are bordered by high population centres, although there are fewer industrial operations
around Lingayen Gulf. Since both have extensive shallow areas (reef flats and mudbanks in Lingayen
Gulf, but mostly mudbanks in Manila Bay), they are vulnerable to global increases in temperature and
the consequent rise in the sea level. This is especially true for the coral reef habitats of Lingayen Gulf.
Both Lingayen Gulf and Manila Bay are considered overexploited (Armada 1994; MERF 2002) to a
point where drastic shifts in the species composition of faunal assemblages have occurred (Armada
1999). Similarly, fisheries in Malampaya Sound have also shown signs of overfishing (Ingles 2002). The
latter, together with Calamianes Islands (also located in Palawan) is known to be some of the remaining
pristine natural marine habitat in the Philippines. Aside from its high biodiversity and endemicity, the
Sound is also a refuge for endangered species, including the dugong and the Irrawady dolphin (Ingles
2002). Unfortunately, even these supposedly pristine areas have exhibited declines in fish catches, an
Reversing Environmental Degradation Trends in the South China Sea and Gulf of Thailand
36 NATIONAL REPORT ON FISHERIES PHILIPPINES
indication of overfishing (Werner and Allen 2000). Hence, the greatest immediate threat in northern
Palawan is the lack of proper fisheries/habitat management. In the densely populated waters of
Lingayen Gulf and Manila Bay, the immediate threats are numerous and the persistent problem has
been inadequate management of marine resources. The coast of Mindoro facing the Mindoro Strait is
economically underdeveloped due to its exposure to rough (sea and land) conditions. As such, many of
the perceived threats associated with human activities in this area would be of much lesser magnitude,
although the downstream effects of logging and mining are likely considerable.
4.4
Ranking of habitats
4.4.1 Association with species of importance to food security
In terms of total fisheries production and fishing effort, both Lingayen Gulf and Manila Bay would rank
high, since proper resource management is most needed in both areas. More people are, and will
remain, dependent on fisheries production in both areas. Hence, there is a greater need for sustainable
use in light of an ever-increasing human population. Northern Palawan and Mindoro Strait are not as
heavily populated, although the former is already heavily fished. The areas with greatest need and
priority remain to be both Lingayen Gulf and Manila Bay.
Figure 20
Distribution of soft-bottom (trawlable: blue) and hard-bottom (reef: red) fishing
grounds along the country's South China Sea coast (Simpson 1979).
Reversing Environmental Degradation Trends in the South China Sea and Gulf of Thailand
NATIONAL REPORT ON FISHERIES PHILIPPINES 37
South
Pacific
China
Ocean
Sea
Sulu
Sea
Celebes
Sea
Figure 21
Most important fishing grounds for round scads from 1956 to 1970 based on
Ronquillo (1975) and PCAMRD (1993).
Reversing Environmental Degradation Trends in the South China Sea and Gulf of Thailand
38 NATIONAL REPORT ON FISHERIES PHILIPPINES
Table 16 Present and future threats to Manila Bay based on information from MADECOR
(1995) and Armada (1999).
Future
Future
Threats Present
Threats Present
(next 10 y)
(next 10 y)
Destructive harvest
Global changes
Bottom trawl
Thermal
Use of Explosives
Sea level rise
Plant/animal removal
Coastal development
Pollution
Land
fill
Sediment
Dredging
Heavy metals
Coastal erosion
Oil
Upland development
Organic pollutants
Changing discharge/runoff
Eutrophication
Salinity change
Pesticides
Natural disasters
Storms
Flood
Drought
Land subsidence
Table 17 Present and future threats to Lingayen Gulf based on information from various
references including McManus et al. (1992), UPMSI (1999), and MERF (2002).
Future
Future
Threats Present
Threats Present
(next 10 y)
(next 10 y)
Destructive harvest
Global changes
Bottom trawl
Thermal
Use of Explosives
Sea level rise
Plant/animal removal
Coastal development
Pollution
Land
fill
Sediment
Dredging
Organic pollutants
Coastal erosion
Eutrophication
Upland development
Salinity change
Changing
discharge/runoff
Natural disasters
Storms
Flood
Drought
Land subsidence
Reversing Environmental Degradation Trends in the South China Sea and Gulf of Thailand
NATIONAL REPORT ON FISHERIES PHILIPPINES 39
Table 18
Present and future threats to Northern Palawan (including Calamianes Islands)
based on Estudillo et al. (1980), Werner and Allen (2000), and Ingles (2002).
Future
Future
Threats Present
(next 10 y)
Threats Present
(next 10 y)
Destructive harvest
Global
changes
Bottom trawl
Thermal
Use of Explosives
Sea level rise
Plant/animal removal
Coastal development
Pollution
Tourism
Sediment
Coastal erosion
Natural disasters
Upland development
Storms
Changing discharge/runoff
Table 19
Present and future threats to Mindoro Strait.
Future
Future
Threats Present
Threats Present
(next 10 y)
(next 10 y)
Destructive harvest
Global changes
Use of Explosives
Thermal
Plant/animal removal
Sea level rise
Pollution
Coastal development
Sediment
Coastal erosion
Oil (from collisions)
Upland development
Natural disasters
Changing
discharge/runoff
Storms
4.4.2 Association with high-value species
Both Lingayen Gulf and Manila Bay show clear signs of ecosystem overfishing (Pauly et al. 1989), as
shown by the prevalence of fast growing, small, omnivorous, and low-valued fish such as herring and
anchovies, and invertebrates such as shrimps and squids (Armada 1999). This is attributed to the loss
of large predatory (high-valued) fish (e.g. lutjanids, haemulids, serranids, flatfish, etc.) from the fish
community, thus allowing the fast-growing omnivorous prey species to dominate in abundance.
In contrast, such high-valued fish are still common in northern Palawan (Werner and Allen 2000),
although the live fish trade (for juvenile groupers especially) will likely take its toll if allowed to continue
unabated. Overall, because of less human activities, habitat conditions are healthier and more pristine
in northern Palawan than in most other areas in the country. It is likely that the production capacity of
the area, including high-valued species, is still high and may be sustained if managed properly.
Mindoro Strait is relatively deep with very narrow shelves on either side of the Strait. Its natural
productivity is likely to be influenced more by hydrographic processes (e.g. convergence of water
masses) than by the shallow water features (reefs, coastal indentions, seagrass beds, mangroves, etc.)
and processes (interconnections between habitats), which are rather more important in northern
Palawan. Thus, the Strait has a more physically driven environment where the limits to productivity are
natural and generally beyond the scope of management interventions.
Reversing Environmental Degradation Trends in the South China Sea and Gulf of Thailand
40 NATIONAL REPORT ON FISHERIES PHILIPPINES
4.4.3 Association with endangered, rare, or threatened species
Due to less disturbed conditions, northern Palawan is among the very few areas in the country where
rare and uncommon species can still be found. The high scleractinian coral diversity in the Calamianes
Islands (Capili et al. 2002) reflects such conditions. The area is also considered as one of the eight
important marine corridors, which serve to maintain the marine biodiversity in the Philippines (Ong and
Ibuna 2000). Together with Mindoro Strait, the Mindoro-Calamianes Corridor allows the free movement
of stocks, propagules, and ultimately genetic materials between the SCS and the Sulu Sea and nearby
internal waters (Figure 24) (Endriga 2003). Faunal affinities (Juinio-Meñez et al. 2003) and similarities
in fish species composition (Dantis et al. 1999) have been found between the two areas. In addition, the
corridor also serves as a connection between the Kalayaan Island Group and the Tubbataha Reef
System, both of which are believed to be major sources of fish and invertebrate larvae for the country's
internal waters (McManus 1994; Dantis et al. 1999). It has been suggested that Palawan likewise
serves as an important source of propagules for the SCS (DENR 1997). Thus, whether as corridor or
source, the northern Palawan area is of special interest from both conservation and management
standpoints.
5.
CURRENT MANAGEMENT REGIME
This part discusses the basic instruments and support mechanisms for managing marine habitats and
populations. It deals with legal instruments, e.g. national laws that also serve as the basis for local
ordinances and for the country's commitment to international agreements, and institutional
arrangements in support of fisheries or coastal resources management initiatives, including the roles of
various government agencies, research and academic institutions, and the local government units in
monitoring, control, and enforcement. This section also examines patterns of resource ownership, the
capacity of human resources and institutions to perform research, monitoring, control, and surveillance,
as well as the role of management bodies and stakeholders in managing fisheries and coastal
resources.
5.1 Legal
instruments
A number of legal instruments form the basis for managing the country's fish stocks and marine
habitats. National laws define the limits and management responsibilities for the use of fishery
resources. These laws are mirrored through fishery ordinances at the local level.
Various aspects of fish stock, marine habitat, and coastal resources management are articulated in the
1987 Constitution of the Philippines, the Local Government Code of 1991 (Republic Act 7160), the
Agriculture and Fisheries Modernization Act of 1997 (RA 8435), and the Fisheries Code of 1998 (RA
8550).
Reversing Environmental Degradation Trends in the South China Sea and Gulf of Thailand
NATIONAL REPORT ON FISHERIES PHILIPPINES 41
Pacific
South
Ocean
China
Sea
Sulu
Sea
Celebes
Sea
Figure 23
Top 10 tuna fishing grounds in the country with mean annual landings >30,000 MT
from 1983 to 1987 (PCAMRD 1993).
Reversing Environmental Degradation Trends in the South China Sea and Gulf of Thailand
42 NATIONAL REPORT ON FISHERIES PHILIPPINES
SOUTH
CHINA
SEA
SULU
SEA
Figure 24
Predominant sea surface currents (broken arrows; from Juinio-Menez et al. 2003)
and inferred direction of mixing (red arrows) of stocks of fish and invertebrates in
the southeastern SCS area of western Philippines (Endriga 2003).
The Philippine Constitution articulates general principles for the management and use of all natural
resources in the Philippines. In the case of fish stocks, aquatic habitats, and coastal resources, the
following are the pertinent provisions:
· The State shall protect and promote the right to health of the people; the State shall protect and
advance the right of the people to a balanced and healthful ecology in accord with the rhythm
and harmony of nature.
· The exploration, development, and utilization of natural resources shall be under the full control
and supervision of the State. The State shall protect the nation's marine wealth, and exclusive
economic zone, and reserve its use and enjoyment exclusively to Filipino citizens.
· The state shall protect the rights of subsistence fishers, especially of local communities, to the
preferential use of the communal marine and fishing resources, both inland and offshore. It
shall provide support to such fishers through appropriate technology and research and other
services.
· The right of the people and their organisations to effective and reasonable participation at all
levels or social, political, and economic decision-making shall not be abridged.
Reversing Environmental Degradation Trends in the South China Sea and Gulf of Thailand
NATIONAL REPORT ON FISHERIES PHILIPPINES 43
The Local Government Code forms the basis for transferring (devolving) national level responsibilities
to local government units (LGUs). It places the responsibility for the development and delivery of basic
services with LGUs. In managing fish stocks and coastal habitats, it incorporates the following:
· Management of fishery resources within the 15-km limit of the coastal waters.
· Enhancement of the right of the people to a balanced ecology.
· Provision of extension and on-site research services and facilities related to agriculture and
fishery activities.
· Provision of solid waste disposal system or environmental management system and services
and facilities related to general hygiene and sanitation.
· Enforcement of forestry laws limited to community-based projects, pollution control law, small
mining law, and other laws on the protection of the environment.
· Enactment and enforcement of necessary fishery ordinances and other regulatory measures in
coordination with non-governmental organisations and people's organisations in the
community.
· Forging of joint ventures to facilitate the delivery of certain basic services, capability-building,
and livelihood development.
· Cooperative undertakings among LGUs for purposes commonly beneficial to them.
· Share in the Internal Revenue Allotment (IRA) to enable them to provide the basic services and
perform fundamental functions (including fisheries management) at their level.
The Fisheries Code provides the basis for the development, management, and conservation of the
country's fisheries and aquatic resources. It is essentially a consolidation of previous fishery laws and
an update of existing laws related to fisheries at the time of its enactment. Pertinent provisions cover
various aspects of fisheries, exploitation of fish resources, and their management, namely:
· Enactment of appropriate fishery ordinances in accordance with the national fisheries policy.
· Enforcement of all fishery laws, rules and regulations as well as valid fishery ordinances
enacted by the municipal council.
· Integration of the management of contiguous fishery resources/areas, which must be treated as
a single resource system.
· Granting of fishing permits and privileges to duly registered fisherfolk organizations/
cooperatives.
· Ensuring that the municipal waters are utilised by municipal fisherfolk or
organisation/cooperatives except when an appropriate fishery ordinance is enacted to allow
commercial fishing within the municipal waters.
· Maintenance of a registry of municipal fisherfolk for monitoring fishing activities and for other
related purposes.
· Issuance of permits to municipal fisherfolk and organisations/cooperatives that will be engaged
in fish farming, seaweed farming, etc.
· Granting of demarcated fishery rights to fishery organisations/cooperatives for mariculture
operation.
· Provision of support to municipal fisherfolk through appropriate technology research, credit,
production, and marketing assistance and other services.
· Provision of support for the creation of the Fisheries and Aquatic Resources Management
Councils (FARMCs) at national, regional and local levels.
The major concern of the Agriculture and Fisheries Modernization Act is not just to modernise
agriculture and fisheries. It also aims to serve as a framework for a sustained increase in the production
of goods and services and for a more equitable distribution of opportunities, income, and wealth. Its
provisions intend to attain the following:
Reversing Environmental Degradation Trends in the South China Sea and Gulf of Thailand
44 NATIONAL REPORT ON FISHERIES PHILIPPINES
· Modernise the agriculture and fisheries sectors by transforming them from a resource-based to
a technology-based industry.
· Enhance profits and incomes in the agriculture and fisheries sectors, particularly the small
farmers and fisherfolk, by ensuring equitable access to assets, resources, and services, and
promoting higher-value crops, value-added processing, agribusiness activities, and agro-
industrialisation.
· Ensure the accessibility, availability, and stable supply of food to all at all times.
· Encourage horizontal and vertical integration, consolidation, and expansion of agriculture and
fisheries activities, groups, functions, and other services through the organisation of
cooperatives, farmers' and fisherfolks' associations, corporations, nucleus estates, and
consolidated farms, and to enable these entities to benefit from economies of scale, afford
them a stronger negotiating position, pursue more focused, efficient, and appropriate research
and development efforts, and enable them to hire professional managers.
· Promote people empowerment by strengthening people's organisations, cooperatives, and
NGOs, and by establishing and improving mechanisms and processes for their participation in
government decision-making and implementation.
· Pursue a market-driven approach to enhance the comparative advantage of our agriculture and
fisheries sectors in the world market.
· Induce the agriculture and fisheries sectors to ascend continuously the value-added ladder by
subjecting their traditional or new products to further processing in order to minimise the
marketing of raw, unfinished, or unprocessed products.
· Adopt policies that will promote industry dispersal and rural industrialisation by providing
incentives to local and foreign investors to establish industries that have backyard linkages to
the country's agriculture and fisheries resource base.
· Provide social and economic adjustment measures that increase productivity and improve
market efficiency while ensuring the protection and preservation of the environment and equity
for small farmers and fisherfolk.
· Improve the quality of life of all sectors.
The Philippines, together with Brunei Darussalam, Indonesia, Japan, Malaysia, Singapore, Thailand,
and Viet Nam, forms the working group that is drafting guidelines so that the provisions of the Code of
Conduct for Responsible Fisheries (CCRF) will be implemented at the regional level. This is realised
through coordination with the Southeast Asian Fisheries Development Center (SEAFDEC). As an active
participant in the regionalisation of the CCRF, the Philippines also acts to ensure that provisions of the
Code of Conduct are incorporated into policies that guide fish stock utilisation and management in the
Philippines.
5.2
Institutional arrangements (research, monitoring, control, and enforcement)
Various national government agencies are concerned, directly or indirectly, with fisheries utilisation and
management. These include the following:
1. The Department of Agriculture (DA) is responsible for the promotion of agricultural development
and growth through increased productivity. Among the primary objectives of the DA is to increase
the real incomes of farmers and fisherfolk. The following agencies under the DA are concerned with
fisheries, fish utilisation, management, and other support services:
· Bureau of Fisheries and Aquatic Resources (BFAR). It recommends plans, programs, policies,
rules, and regulations on matters related to fisheries and marine resources, and provides
technical assistance in the implementation of these policies;
· National Agricultural and Fishery Council (NAFC). It acts as an advisory body to the DA and
serves as a forum for continuing consultative discussions within the agricultural and fishery
sectors. NAFC is the DA's main agency in charge of coordinating private sector participation in
the development of agricultural and fisheries sectors. It builds partnerships between the
government and the private sector, as well as between the DA and LGUs.
Reversing Environmental Degradation Trends in the South China Sea and Gulf of Thailand
NATIONAL REPORT ON FISHERIES PHILIPPINES 45
· Philippine Fisheries Development Authority (PFDA). It promotes growth of the fishing industry
and improves efficiency in the handling, preserving, marketing, and distribution of fish and
fishery products through the establishment of fish ports, fish markets, and other infrastructures
necessary for the progressive advancement of the fishing industry. It has joint management
agreement with coastal LGUs for the management of municipal fish ports.
2. The Department of Environment and Natural Resources (DENR) promotes the well-being of
Filipinos through the sustainable development of forest and marine resources, optimal utilization of
land and minerals, and effective environmental management. The DENR also has several agencies
under it that are directly or indirectly concerned with the management of marine habitats.
3. Agencies involved in research and scientific coordination work include the Department of Science
and Technology Philippine Council for Aquatic and Marine Resources Development (DOST
PCAMRD), a policy-formulating and coordinating body for aquatic and marine science and
technology development; the DA Bureau of Agricultural Research (BAR), the main coordinating
body for all research conducted by the DA; and the DENR Ecosystem Research and
Development Bureau (ERDB), which is DENR's research coordinating unit. There are likewise
academic institutions that focus their scientific work on fish and aquatic organisms, including the
various institutes under the College of Fisheries and Ocean Sciences (CFOS); the Marine Science
Institute (MSI) of the University of the Philippine System (UPS); the Marine Laboratory of Siliman
University; the Marine Biology Department of San Carlos University; and various fisheries colleges
and departments of other state universities.
4. Other national government agencies concerned with the enforcement of fishery and environment
laws include the Department of Interior and Local Government (DILG); the Maritime Group of the
Philippine National Police (PNP); the Department of Tourism (DOT)' the Department of National
Defense (DND); the Department of Transportation and Communication (DOTC); and the Philippine
Coast Guard (PCG).
5. Other national government agencies mandated to coordinate national activities include the National
Economic Development Authority (NEDA), which coordinates various social and economic plans,
policies, programs, and projects on national and sectoral levels, and the Department of Foreign
Affairs (DFA), which heads the Cabinet Committee on Marine Affairs and addresses the various
concerns regarding the implementation of the 1982 United Nations Convention on the Law of the
Sea (UNCLOS).
6. The Congress of the Philippines, particularly the Committees on Agriculture, Ecology, and Natural
Resources of the House of Representatives, and the Committees on Environment, Agriculture, and
Food of the Senate.
7. The Local Government Units, which by virtue of the devolution of the responsibilities of the national
government under the Local Government Code of 1991, had been given the exclusive authority to
grant fishery privileges in municipal waters and the responsibility to manage its fish stocks and
aquatic resources.
Although it appears that there are many agencies involved, directly and indirectly, in the management
of fisheries resources, the immediate burden still lies with the local government or the municipality. The
municipality, however, cannot conduct research and monitoring concerning the management of fish and
invertebrate resources. This activity is usually performed in collaboration with BFAR, DENR, DOST,
and various research and academic institutions in the form of projects usually funded by international
agencies or in the form of loan. A number of similar initiatives are also being conducted in collaboration
with non-governmental organisations (NGOs). For the gathering and monitoring of baseline data by
these institutions or organisations, an institutional capability-building component is usually included to
ensure the continuation of activities even beyond the life of the project.
In some initiatives, support for the development of a legal basis for the management of coastal and
aquatic resources is also given. The products are municipal ordinances governing the proper utilisation
of resources or, in most cases, a codified set of fisheries ordinances covering all aspects of utilisation
and management of fish and other aquatic resources.
The municipality also carries the burden of enforcing fishery laws. In most cases, a composite team of
civilian volunteers, police, and military personnel is formed to conducts sea patrols and apprehend
violators of fishery laws or, at least, deter illegal fishing activities. Many of these sea patrols, locally
Reversing Environmental Degradation Trends in the South China Sea and Gulf of Thailand
46 NATIONAL REPORT ON FISHERIES PHILIPPINES
called bantay dagat, were created with external help from NGOs and other institutions, as part of
project interventions. Members of the composite team also receive training in enforcement procedures,
such as proper boarding, collection, and evidence preservation.
Municipalities sharing a common resource system, like bays and gulfs, unite and form an Integrated
FARMC. Initiatives among these municipalities are harmonised to achieve proper utilisation of the
common resource system. The Municipal Fisheries Ordinances (MFO) of participating municipalities
are also harmonised and coastal resources management plans are coordinated by a governing body or
council. Although municipal authorities manage their respective sea patrols, attempts are also made to
coordinate enforcement of fishery laws.
5.3
Overview of patterns of resource ownership and traditional utilization
Traditionally, the Philippines has had open access fisheries. Fishing of all forms used to be allowed in
all waters of the archipelago, ultimately leading to the overfishing of all accessible fishing grounds and
major fish stocks of the country. This prompted the government to rethink its policies, resulting in a
gradual shift in recent years to a limited access regime. Initial attempts to limit access to fisheries
included a ban on the operation of commercial fishing boats (more than 3 GT) in waters 7 fathoms deep
or shallower, or within 7 km from the coastline. This ban was later extended to within 15 km of the
coastline, which is considered as municipal waters.
Limiting access to fisheries is also integrated with the establishment of marine protected areas (MPAs).
MPAs take the form of fish sanctuaries, marine reserves, marine parks, or mangrove reserves as no-
take zones, regulated-use zones, or both. The establishment of MPAs is embodied in the Fisheries
Code, usually implemented through community-based organisations. Another innovative endeavor by
NGOs to limit access to fisheries involves the use of community property rights (CPR), which is seen as
a viable option for coastal resources management that will benefit the most marginalised fisherfolk.
CPR makes the community a part of the decision-making process in the design and implementation of
coastal resources management activities.
5.4
Human and institutional capacities
The Philippines is a recipient of various grants and loans intended for the development of the fisheries
sector. A large portion of these grants and loans was allotted to human and institutional development.
Major banks and donor agencies include, among others, the World Bank (WB), Asian Development
Bank (ADB), Food and Agriculture Organization (FAO), United Nations Development Programme
(UNDP), United States Agency for International Development (USAID), German Agency for Technical
Cooperation (GTZ), Canadian International Development Agency (CIDA), and Japan International
Cooperation Agency (JICA). Through these and other foreign donor institutions, the country's human
resources and institutions in fisheries research and development are strengthened.
A major recipient is the BFAR and its personnel. Many research and extension personnel of BFAR are
recipient of scholarships and grants both locally and abroad in connection with the performance of their
duties. This includes graduate studies, training, and exchange visits in fields including capture fisheries,
aquaculture, and fish processing. Loans and grants are also used to develop the research and other
scientific capabilities of educational institutions, primarily colleges, institutes, and departments of state
universities and private universities that are mandated to promote fisheries and marine science through
instruction, research, and extension. Institutions were also developed and strengthened through
financial support for infrastructures and equipment.
The implementation of a number of projects, funded through either grants or loans, has gradually
developed the capacity of human resources and institutions to manage fish stocks, aquatic habitats,
and coastal resources. Although these projects were site-specific, experiences from them served a
basis for replication in other areas of the country and even as model for other developing countries.
Normally these projects were implemented by various government agencies in partnership with local
and international NGOs, people's organisations (POs), the academe, LGUs, and the community.
Projects conducted in coastal areas of the Philippines' side of the SCS include:
· Fisheries Sector Program (FSP): 1990 to 1995. The program was implemented by DA through
BFAR and had several components: fishery resource and ecological assessment (REA), coastal
resources management, income diversification, research and extension, law enforcement, credit,
Reversing Environmental Degradation Trends in the South China Sea and Gulf of Thailand
NATIONAL REPORT ON FISHERIES PHILIPPINES 47
and infrastructure. Manila Bay was the only SCS site included in the project. At various levels of
success, the program was able to encouraged LGUs to adopt Coastal Resources Management
(CRM) planning as a basic tool for resource management. Results of REA conducted on selected
priority bays provided the scientific basis for the formulation of baywide management plans. FSP
also claimed to have developed a high level of awareness and knowledge about the resources
among stakeholders and enabled them to actively participate in resource management activities.
· Coastal Environment Program (CEP): 1993 to onwards. This environment program of DENR aims
to institutionalise CRM in organisational structures based on the principles of sustainable
development, biodiversity, and resource sharing. It also aims to strengthen the link between upland
and coastal ecosystems under a watershed-based management approach. CEP is being
implemented throughout the country through DENR's regional and provincial activities. It is relying
on sharing with other stakeholders, especially communities and LGUs, the responsibility to manage
natural resources. It also works through a decentralised structure at the local level.
· Fisheries Resource Management Project (FRMP): 1998 to 2003. This is the continuation of the
FSP, with three components: fisheries resource management, income diversification, and capacity
building. The management component was designed to strengthen fisheries regulation, rationalise
the utilisation of fisheries resources, and rehabilitate damaged habitats. The income diversification
component promotes income diversification for municipal fisherfolk by organising self-reliant
community groups, promoting micro enterprises, and supporting mariculture development. The
capacity building component aims to strengthen, in the long term, the capacity of agencies for
fisheries resource management at the national, regional, and local levels.
· Marine Science and Resource Development: 1985 to 1995. This UNDP-funded project
implemented by the UPMSI was designed to advance marine science in the Philippines, to link
marine science research and development programs with the end-users of information and
technology, to upgrade the capability of the UPMSI to conduct basic and applied research and
instruction at the graduate level, and to develop and promote new technologies or the adaptation of
existing ones for the effective utilisation, management, and conservation of the marine resources.
In addition, there are a number of fisheries and coastal resource management initiatives undertaken by
local and international NGOs and the academe, together with POs, LGUs, and the community, that
focus on common property rights, MPAs, participatory resource assessment and management,
integrated habitat management, and livelihood diversification.
5.5 Review
of
stakeholders
Municipal and commercial fishers, defined in Section 1.2 above, represent stakeholders in the
Philippines' capture fisheries. Municipal fishers are equivalent to the small-scale or sustenance fishers
of other countries, whose primary motivation in fishing is subsistence. The commercial fishers, on the
other hand, operate larger fishing boats mostly for profits. Fishers may be temporarily employed in the
commercial sector while they are usually owners and operators in the municipal sector.
Fishing and farming are the dominant sources of livelihood in most Philippine fishing communities along
the SCS coast. On small islands, fishing usually dominates, although there are cases where fishing and
farming activities are not well differentiated. Farming is the major occupation during the wet season, but
gradually shifts to fishing leading up and during the dry season. Manufacturing and other industries also
provide employment opportunities in coastal communities, especially those located in or near urban
centers. Ecotourism and outdoor recreation is also becoming another source of livelihood. Other
sources of livelihood are aquaculture, fish handling and processing, fish distribution and marketing, boat
construction and maintenance, gear construction and repair, salt making, as well as quarrying of corals
and sand.
The Local Government Code, aside from defining the basic mandates of the LGUs, also increased the
financial resources available to them through Internal Revenue Allotment (IRA) shares, which are
proportionate to their contribution to the national coffers. In addition, it recognises the need for civil
society involvement in local governance by allocating certain seats for direct people's participation in
local policy and planning bodies, such as the local development councils and the local legislative
bodies. It also emphasises the role of LGUs in sharing with the national government the responsibility of
protecting the ecological balance of natural environments within their jurisdictions.
Reversing Environmental Degradation Trends in the South China Sea and Gulf of Thailand
48 NATIONAL REPORT ON FISHERIES PHILIPPINES
The implementation of resource management activities follows a holistic approach. Although some
services and many of responsibilities were already devolved to the local government, the management
of resources takes a broader perspective. It recognises the interrelationships and interdependencies of
the physical, biological, sociocultural, economic, legal, and institutional factors affecting the entire
ecosystem. Coastal communities, government agencies, LGUs, NGOs, POs, FARMCs, and other civic
organisations play important, intertwining roles. Although management is implemented at the lowest
LGU level, policies and the underlying framework cover a larger ecosystem (bay, gulf, or sea).
Some of the policies relevant to fisheries management include:
· Decentralisation of the management of nearshore fisheries resources to municipalities and local
fishing communities.
· Strengthening of fisheries law enforcement by organising municipal-based inter-agency law
enforcement teams composed of representatives from fisherfolk association, NGOs, LGUs,
Philippine Maritime Police (PMP), PCG, BFAR, DENR, the private sector, and other concerned
agencies or institutions.
· Promotion of community-based initiatives to rehabilitate, conserve, and protect the coastal
resources.
· Diversification of the source of income of fisherfolk toward other income opportunities.
· Expansion of extension services to form closer linkages between and among the fisherfolk,
research institutes, and other beneficiaries.
Embodied in the Fisheries Code is the creation of the FARMCs at the national and local levels. This
recognises the need to coordinate resource management activities at various levels and to ensure the
participation of LGUs, coastal communities, government agencies, NGOs, and POs in the management
of coastal resources. Three levels were established: national (NFARMC), municipality/city
(MFARMC/CFARMC), and integrated (IFARMC).
Most municipalities bounding the South China Sea have established their MFARMCs because the law
mandates it. Some were organised through the assistance of NGOs, but mostly through the regular
program of BFAR in its respective regional units. Each BFAR regional unit has a FARMC coordinator
whose main task during the past few years was to help each municipality or city establish their
respective FARMCs.
Many municipalities also formed smaller units of FARMCs at the barangay level (BFARMCs). Though
not mandated by the Fisheries Code, the formation of BFARMCs is being encouraged to institute
fisheries resource management initiatives at the community level. This also facilitates the replication of
efforts by the MFARMC at the community level. Also, since many management initiatives, such as the
establishment of MPAs, take place at the community level, the creation of BFARMCs reinforces
initiatives concerning the implementation of MPA management plans and enforcement of agreed rules
regarding resource utilisation. BFARMC can also be an effective partner in fishery law enforcement.
Although sea patrols are based in the municipality, BFARMCs can act as community lookouts for illegal
fishing activities.
Many fisheries and aquatic resource management schemes in the coastal areas along the SCS coast
were initiated independent of the creation of FARMCs and were started even before the
institutionalisation of the various levels of FARMCs. These initiatives range in scope, from large-area
coastal management interventions involving stakeholders of an entire body of water to concerted
fisheries management activities of a fishers organisation.
On a larger scale, Lingayen Gulf became the subject of an integrated coastal resources management
initiative through the participation of the Philippines in the ASEAN-USAID Coastal Resources
Management Project (1986 to 1988). The then six member-nations of the Association of South East
Asian Nations (ASEAN) each piloted a Coastal Resource Management Project (CRMP) in a selected
site in each country (Scura et al. 1992) and Lingayen Gulf was chosen for the Philippines. This led to
the creation of the Lingayen Gulf Coastal Area Management Commission (LGCAMC), a coordinating
body for the integrated management of the coastal resources of the gulf.
On a smaller scale, the municipalities of Mabini and Tingloy, Batangas formed the MaTinCADC
(Mabini-Tingloy Coastal Area Development Council) (White and Meneses 2003). Prior to this, a
chronology of interventions by various government and non-government institutions had taken place.
This included the establishment of marine sanctuaries, conservation projects, CRM activities, coral reef
monitoring, and ecotourism.
Reversing Environmental Degradation Trends in the South China Sea and Gulf of Thailand
NATIONAL REPORT ON FISHERIES PHILIPPINES 49
Several coral reef areas were declared as marine parks, marine reserves, marine sanctuaries, or fish
sanctuaries. These include marine sanctuaries declared through a municipal ordinance in Mabini,
Batangas (White and Meneses 2003); a biosphere reserve managed by the Philippine Tourism
Authority in Puerto Galera, Oriental Mindoro (Rañola et al. 2003); a marine park established with the
assistance of the USAID/DENR Coastal Resource Management Project in San Vicente, Palawan
(Uychiaoco et al. 2003); and a fish sanctuary established with the assistance of the Haribon Foundation
and US Peace Corps in San Salvador Island, Masinloc, Zambales (Arceo and Alano 2003).
Some management actions were part of on-going government projects, like the Coastal Environment
Program (CEP) site of DENR in Telbang, Alaminos, Pangasinan (Orallo et al. 2003a). UPMSI maintains
a research station in Bolinao, Pangasinan, which became the source of information derived from
various research activities. The area also became the recipient of community-based coastal resource
management (CB-CRM) initiatives (Ferrer et al. 1996). Even fisher associations can initiate fisheries
resources management activities, as in the case of the Nagabugan Fishermen Association of Davila,
Pasuquin, Ilocos Norte. This NGO-organised association has planted 25 hectares of mangroves,
initiated alternative livelihood projects, and undertaken coastal and marine resources management
activities (Orallo et al. 2003b). The entire island of San Salvador, Masinloc, Zambales, a reservation
area, is managed by a local people's organisation (Samahang Pangkaunlaran ng San Salvador) with
considerable support from the local government (Arceo and Alano 2003).
6. RECOMMENDATIONS
6.1
Recommendations for government follow-up action
· Activities under the monitoring, control, and surveillance (MCS) system should be strongly
implemented and executed.
· Implementation of specific projects in fulfillment of commitments and in compliance with various
international conventions, such as the FAO Code of Conduct for Responsible Fisheries.
· Collaborative interagency efforts and activities must address and incorporate relevant concerns,
e.g. environmental impact assessments, biodiversity conservation, marine protected areas,
biosafety protocols, etc.
6.2
Recommendations for regional collaborative efforts
· Concerns for the international waters should also include:
a. Highly migratory and transboundary aquatic species (e.g. fishes, marine mammals, marine
turtles, invertebrates).
b. Monitoring and evaluation of catches, including bycatch and discards, in the high seas by
commercial fishing fleets.
c. Bilateral fisheries cooperation in several themes, including utilisation, management, research,
and development.
· Stock assessment and studies delineating populations and stocks of shared fishery resources
using available technologies, e.g. surveys, tagging, morphometrics, and molecular studies.
· Establishment of a joint fisheries management framework between and among neighbouring
countries that are sharing and utilising common resources.
· Joint management and research for shared stocks of threatened or endangered marine species,
e.g. marine mammals and whale shark.
Reversing Environmental Degradation Trends in the South China Sea and Gulf of Thailand
50 NATIONAL REPORT ON FISHERIES PHILIPPINES
7. REFERENCES
Allen, G.R. 1985. FAO species catalogue. Snappers of the world. An annotated and illustrated catalogue of lutjanid
species known to date. FAO Fisheries Synopsis 125(6): 208p.
Altemerano, A.M. and C.L. Villanoy. 2002. Influence of the Western Luzon Shelf Current on larval dispersal in
Lingayen Gulf based on Langrangian dispersal experiments. UPV Journal of Natural Science 7: 103119.
Anonymous. 1979. Report of the BFAR/SCSP workshop on the Fishery Resources of the North and western
coasts of Luzon. South China Sea Fisheries Development and Coordinating Programme. Manila, Philippines.
Aprieto, V.L. 1982. Philippine tuna fishery management. Fisheries Research Journal Of the Philippines 7: 3850.
Aprieto, V.L. 1988. The Philippine Tuna Fisheries and Development Program. In Report of the Second Southeast
Asian Tuna Conference IPTP/88/GEN/15.
Arceo, H.O. and H.G. Alano. 2003. Chapter 6: San Salvador Island, Masinloc, Zambales. Pp. 2628 in Philippine
Coral Reefs through time: Workshop Proceedings. Second of the Atlas of the Philippine Coral Reefs Series.
Coral Reef Information Network of the Philippines (PhilReefs), University of the Philippines, Marine Science
Institute, Quezon City, Philippines and the Marine Parks Center, Tokyo, Japan.
Armada, N.B. 1993. Capture Fisheries of Manila Bay. Resource and Ecological Assessment of Manila Bay. Final
Report. Fisheries Sector Program, DA-BFAR, Quezon City.
Armada, N.B. 1994. Effects of excess fishing effort on catch composition. Paper presented at the ASEAN-CIDA-
Thai government sponsored Conference on Fisheries Management and Development Strategies for ASEAN
Region Year 2000. 2629 July 1994, Bangkok, Thailand. 6p.
Armada, N.B. 1995. Resource and ecological assessment of Manila Bay: Capture Fisheries. Fisheries Sector
Program, DA-BFAR, Quezon City. 50p.
Armada, N.B. 1997. Larval and early juvenile fishes of the Sulu Sea and adjacent waters. UPV Journal of Natural
Science 2: 102137.
Armada, N.B. 1999. Effects of excessive fishing on the composition of demersal resources in Manila Bay.
Pp. 7476 in Campos, W.L. (ed.) Proceedings of the Symposium on Marine Biodiversity in the Visayas and
Mindanao. University of the Philippines in the Visayas, Miag-ao, Iloilo, Philippines.
Bajarias, F.F.A. 2000. Phytoplankton in the surface layers of the South China Sea, Area III: Western Philippines.
Pp. 220234 in Proceedings of the Third Technical Seminar on Marine Fishery Resources Survey in the South
China Sea, Area III: Western Philippines. SEAFDEC Special Paper No. SEC/SP/41. Southeast Asian
Fisheries Development Center, Bangkok.
Balgos, M.C. 1990. Age and Growth of the squid Sepioteuthis lessoniana (Lesson 1830) in Bolinao, Pangasinan by
Statolith Observation and Length Frequency Analysis. Unpublished Master Thesis submitted to the Marine
Science Institute, College of Science, University of the Philippines, Diliman, Quezon City.
Balgos, M.C. and D. Pauly. 1998. Age and growth of the squid Sepioteuthis lessoniana in the N.W. Luzon,
Philippines. In Payne, A.I.L., Lipinski, M.R., Clarke, M.R., and M.A.C. Roeleveld (eds.) Cephalopod
Biodiversity, Ecology and Evolution. South African Journal of Marine Science 20: 449452.
Barut, N., M. Santos, and L. Garces. 1997. Overview of Philippine marine fisheries, p.6271. In G. Silvestre and D.
Pauly (eds.) Status and management of tropical coastal fish stocks in Asia. ICLARM Conference
Procroceedings 53: 208p.
Basir, S. 2000. Biological feature of an oceanic squid Sthenoteuthis oualaniensis. Proceedings of the SEAFDEC
Seminar on Fishery Resources in the South China Sea, Area III: Western Philippines.
Blaber, S.J.M., D.A. Milton, N.J.F. Rawlinson, G. Tiroba, and P.V. Nichols. 1990. Diets of lagoon fishes of the
Solomon Islands: Predators of tuna baitfish and trophic effects of bait fishing on the subsistence fishery.
Fisheries Research 8: 263286.
Boletzky, S.V. and R.T. Hanlon. 1983. A review of the laboratory maintenance, rearing and culture of cephalopod
molluscs. In Roper, C.F.E., C.C. Lu, and F.C. Horchberg (eds.) Proceedings of the workshop on the biology
and resource potentials of cephalopods. Memoirs of the National Museum of Victoria 44: 147187.
Caces-Borja, P. 1975. On the ability of otter trawl to catch pelagic fish in Manila Bay. Philippine Journal Fisheries
10: 3956.
Calvelo, R. 1997. Review of the Philippine small pelagic resources and their fisheries. Pp. 259299 in Proceedings
of the 1st session of the APFIC Working Party on Marine Fisheries. 1316 May 1997, Bangkok, Thailand.
Calvelo, R.R. 1978. The biology and relative abundance of yellow-striped crevalle, Selaroides leptolepis
(Cuv. &Val.) in Manila Bay. Philippine Journal of Fisheries. Vol. 16, No. 2.
Calumpong, H. and E. Meñez. 1997. Field guide to common mangroves, seagrasses and algae of the Philippines.
Bookmark, Makati City. 197p.
Campos, W.L. 2000. Ichthyoplankton abundance and distribution around northern Palawan. UPV Journal of
Natural Science 5(2). [in press]
Campos, W.L., R.F.C. Canto, and D.G. Estremadura. 2002. Abundance, composition, and distribution of major
zooplankton taxa in the interisland waters. UPV Journal of Natural Science 7: 6680.
Reversing Environmental Degradation Trends in the South China Sea and Gulf of Thailand
NATIONAL REPORT ON FISHERIES PHILIPPINES 51
Capili, E.B., W.Y. Licuanan, and M.C. Quibilan. 2002. Distribution patterns and diversity of scleractinian corals in
the Philippines: An initial assessment. UPV Journal of Natural Science 7: 179191.
Carpenter, K.E. 1987. Revision of the Indo-Pacific fish family Caesionidae (Lutjanoidea) with descriptions of five
new species. Indo-Pacific Fisheries (15): 56.
Chamchang, C. and R. Chayakul. 2000. Composition, abundance and distribution of ichthyoplankton. Pp. 148163
in Proceedings of the SEAFDEC Seminar on Fishery Resources in the South China Sea, Area III: Western
Philippines.
Collette, B.B. and C.E. Nauen. 1983. FAO species catalogue. Scombrids of the world. An annotated and illustrated
catalogue of tunas, mackerels, bonitos and related species known to date. FAO Fisheries Synopsis 125(2):
137 p.
Collette, B.B. and C.R. Aadland. 1996. Revision of the frigate tunas (Scombridae, Auxis), with descriptions of two
new subspecies from the eastern Pacific. Fisheries Bulletin 94: 423441.
Colman, J.G. 1997. A review of the biology and ecology of the whale shark. Journal of Fish Biology 51: 12191234.
Compagno, L.J.V. 1984. FAO species catalogue. Sharks of the world. An annotated and illustrated catalogue of
shark species known to date. Part 1. Hexanchiformes to Lamniformes. FAO Fisheries Synopsis 125(4): 249.
Compagno, L.J.V. 1984. FAO species catalogue. Sharks of the world. An annotated and illustrated catalogue of
shark species known to date. Part 2. Carcharhiniformes. FAO Fisheries Synopsis 125 (4): 655p.
Corpuz, A., J. Saeger, and V. Sambilay, Jr. 1985. Population parameters of commercially important fishes in
Philippine waters. Department of Marine Fisheries Technical Report 6: 199.
Dalzell P. and P. Corpuz 1988. Management of Philippine small pelagic fisheries. Presented at the PCAMRD
Seminar-Workshop on Tuna and Small Pelagic Fisheries: Their status and propects for development. 2729
July 1988, Zamboanga, Philippines.
Dalzell, P. and Ganaden, R.A. 1987. A review of the fisheries for small pelagic fishes in Philippine waters. ICLARM
Technical Paper Series No. 1. Bureau of Fisheries and Aquatic Resources.
Dantis, A.L., C.L. Nanola, F. Castrence Jr., J.P. Cabansag, D.V. Valles, M.C. Ranola, W.L. Campos, V.V. Hilomen,
H.B. Hernandez, and P.M. Aliño. 1999. Distribution patterns and community structure of fishes in some
offshore and shelf reefs of the Philippines. Pp. 8693 in Campos, W.L. (ed.) Proceedings of the Symposium
on Marine Biodiversity in the Visayas and Mindanao, U.P. in the Visayas, Iloilo.
del Mundo, C.M., E.V. Agasen, and T.P. Ricablanca. 1990. The Marine Shrimp Resources of Luzon. Philippine
Journal of Fisheries. Vol. 21.
DENR. 1997. Philippine biodiversity: An assessment and plan of action. Bookmark, Makati City. 298p.
Dickson, J.O., R.V. Ramiscal, and S. Escobar, Jr. 2000. Tuna Resource Exploration with Longline. Pp. 3948 in
Proceedings of the SEAFDEC Seminar on Fishery Resources in the South China Sea, Area III: Western
Philippines.
Endriga, M.A. 2003. Water circulation patterns influence population structuring in fish. in P.M. Alino and M.C.
Quibilan. (eds.) The Kalayaan Islands. Marine Science Institute, University of the Philippines, Diliman, Quezon
City and the Department of Environment and Natural Resources, Visayas Avenue, Diliman, Quezon City. 54p.
Estudillo, R.A. 1985. The seasonal variation and distribution of zooplankton, fish eggs and fish larvae in
Malampaya Sound. Philippine Journal of Fisheries 20: 143.
Estudillo, R.A., L.T. Daya, and R.R. Apilado. 1985. Oceanographic Investigation of Lingayen Gulf. Technical Paper
Series, Bureau of Fisheries and Aquatic Resources. 8 (2): 39p.
Ferrer, E.M., L.T. McManus, and L.P. dela Cruz. 1996. The Bolinao community-based coastal resource
management project (Initial Phase) towards an interdisciplinary approach. Pp. 159185 in Ferrer, E.M., L.P.
dela Cruz, and M.A. Domingo (eds.) Seeds of Hope. College of Social Work and Community Development,
University of the Philippines and NGO Technical Working Group for Fisheries Reform, Quezon City,
Philippines.
Floro, C. 2003. Taxonomy and distribution of fish larvae in northern Palawan. Unpublished Special Problem
submitted to the Division of Biological Sciences, College of Arts and Sciences, University of the Philippines in
the Visayas, Miag-ao, Iloilo.
Furio, E. and V. Borja. 2000. The Primary Productivity in the South China Sea, Area III: Western Philippines. p.
235250 in SEAFDEC. Proceedings of the Third Technical Seminar on Marine Fishery Resources Survey in
the South China Sea, Area III: Western Philippines. Special Paper No. SEC/SP/41. Southeast Asian Fisheries
Development Center, Bangkok, Thailand.
Gaerlan, R., N. Barut, B. Bugaoan, and F. Buccat. 2003. An Assessment of the Lingayen Gulf Fisheries. Paper
presented to the NSAP pre-workshop evaluation. 2224 April 2003, Manila. 28p.
Heemstra, P.C. and J.E. Randall. 1993. FAO species catalogue. Groupers of the world. (Family Serranidae,
Subfamily Epinephelinae). An annotated and illustrated catalogue of the grouper, rock cod, hind, coral grouper
and lyre tail species known to date. FAO Fisheries Synopsis 125 (16).
Hermes, R. and E. Villoso. 1985. Zooplankton biomass distribution in Sulu Sea (West Central Pacific) during
October 1982 and February 1987. UPV Fisheries Journal 1 (1): 112.
Reversing Environmental Degradation Trends in the South China Sea and Gulf of Thailand
52 NATIONAL REPORT ON FISHERIES PHILIPPINES
Hernando, A. M. Jr. and E.C. Flores (1981). The Philippines squid fishery: A review. Pp. 1320 in Marine Fisheries
Review, January 1981.
Herre, A.W. 1953. Check list of Philippine Fishes. Fish and Wildlife Service Research Report 20, US Department of
Interior. 977p.
Hilomen, V.V., C.L. Nañola, Jr., and A.L. Dantis. 2000. Status of Philippine reef fish communities. In: Proceedings
of the workshop on the status of Philippine reefs. Marine Science Institute, University of the Philippines,
Diliman, Quezon City. 14p.
Ingles, J. 2000. Fisheries of the Calamianes Islands, Palawan. Pp. 4564 in Werner, T.B. and G.R. Allen (eds.)
A rapid marine biodiversity assessment of the Calamianes Islands, Palawan Province, Philippines.
RAP Bulletin of Biological Assessment 17. Washington DC. Conservation International.
Ingles, J.A. 2002. Conservation or fisheries: A case study of the Irrawady dolphins in Malampaya Sound, Palawan,
Philippines. Kabang Kalikasan ng Pilipinas (KKP), Quezon City. 24 p.
Ingles, J. and D. Pauly. 1984. An atlas of the growth, mortality and recruitment of Philippine fishes. ICLARM
Technical Report 13, Manila. 127p.
Juinio-Meñez, M.A., N.N.D. Macawaris, and H.G.P Bangi. 1998. Community-based sea urchin (Tripneustes
gratila) grow-out culture as a resource management tool. Canadian Special Publication on Fisheries Aquatic
Science 125: 393399.
Juinio-Meñez, M.A., R.M. Magsino, R. Ravago-Gotanco, and E.T. Yu. 2003. Genetic structure of Linckia laevigata
and Tridacna crocea populations in the Palawan shelf and shoal reefs. Marine Biology 142: 717726.
Kingsford, M. 1992. Spatial and temporal variation in predation on reef fishes by coral trout (Plectropomus
leopardus, Serranidae). Coral Reefs 11: 193198.
Lavapie-Gonzales, F., S.R. Ganaden, and F.C. Gayanilo, Jr. 1997. Some population parameters of commercially-
important fishes in the Philippines. Bureau of Fisheries and Aquatic Resources, Philippines. 114p.
Lewis, A.D., L.B. Chapman, and A. Sesewa. 1983. Biological notes on coastal pelagic fishes in Fiji. Technical
Report of the Fisheries Division (Fiji) (4): 68p.
Licuanan, W.Y. 2000. Coral communities of the Philippines: A status report. In: Proceedings of the workshop on
the status of Philippine reefs. Marine Science Institute, University of the Philippines, Diliman, Quezon City.
13p.
Lopez, M.D.G. 1986. An invertebrate resource survey of Lingayen Gulf, Philippines. Pp. 402409 in G.S. Jamieson
and N. Bourne (eds.) North Pacific Workshop on stock assessment and management of invertebrates.
California Special Publications on Fisheries and Aquatic Science 92.
MADECOR. 1995. FSP-Resource ecological assessment of Manila Bay. Fisheries Sector Program, Bureau of
Fisheries and Aquatic Resources, Q.C., Philippines. 157p.
Magnusson, J. 1970. Report on assignment as marine Fisheries Biologist with the UNDP (SF)/FAO Deep Sea
Fishing Development Project in the Philippines. (January 1966June 1969) FAO Report. 86p. [mimeo]
Mamhot, J.R. 2001. The biology of skipjack, Katsuwonus pelamis, and the yellowfin, Thunnus albacares, collected
from the landing sites in northwestern coast of Luzon. UPV Journal of Natural Science 6: 146156.
Mann, M.F. 1982. Ecology of coastal waters. Blackwell Science Publishing, Boston, Massachussetts. 322p.
McManus, J.W. 1994. The Spratly Islands: A marine park? Ambio 23(3): 181186.
McManus, J.W. 2002. The global importance of Philippine coral reefs. In P.M. Aliño, E.F.B. Miclat, C.L. Cleto, H.A.
Roa-Quiaoit, and R.T. Campos. (eds.) Atlas of Philippine coral reefs. Philippine Coral Reef Information
(Philreefs). Goodwill Trading Co., Inc. (Goodwill Bookstore), Quezon City, Philippines. xvi + 264p.
McManus, J.W., C.L. Nañola, R.B. Reyes, and K.N. Kesner (eds.). 1992. Resource ecology of the Bolinao Coral
Reef System. ICLARM Studies Review 22. International Center for Living Aquatic Resources Management,
Manila, Philippines. 117p.
MERF. 2002. Lingayen Gulf RSA Terminal Report. Fisheries Resource Management Project, Bureau of Fisheries
and Aquatic Resources, Quezon City. 61p.
Mines, A. 1986. Assessment of the fisheries of Lingayen Gulf. Terminal Report submitted to PCARRD. Los Baños,
Laguna, 86p.
Motoh, H. 1980. Field guide for the edible crustacea of the Philippines. SEAFDEC, Aquaculture Department, Iloilo,
Philippines.
Myers, R.F. 1991. Micronesian reef fishes. 2nd Edition. Coral Graphics, Barrigada, Guam. 298p.
Nañola, C.L. Jr. and P.M. Alino. 1999. Is the Philippine aquarium fish trade industry sustainable? Pp. 94101 in
Campos, W.L. (ed.) Proceedings of the Symposium on Marine Biodiversity in the Visayas and Mindanao.
University of the Philippines in the Visayas, Miag-ao, Iloilo, Philippines.
Nateewathana, A., A. Munprasit, and P. Dithachey. 2000. Systematics and distribution of oceanic cephalopods. Pp.
76100 in Proceedings of the SEAFDEC Seminar on Fishery Resources in the South China Sea, Area III:
Western Philippines.
Odum, E.P. 1971. Fundamentals of ecology. 3rd Edition. W.B. Saunders Co., Philadelphia. 574p.
Reversing Environmental Degradation Trends in the South China Sea and Gulf of Thailand
NATIONAL REPORT ON FISHERIES PHILIPPINES 53
Ong, P.S. and N. P. Ibuna. 2000. Highlights of the national biodiversity conservation priority-setting workshop.
Sizing the hottest of the hotspots. Conservation International, Philippines. 98p.
Orallo, C.A., M.C. Calpito, J.C. Pagan, F. Anacta, C. Domingo, C. Nacar, E. Acosta, and D. Milan. 2003a. Chapter
5: Telbang, Alaminos, Pangasinan. Pp. 2425 in Philippine Coral Reefs through time: Workshop Proceedings.
Second of the Atlas of the Philippine Coral Reefs Series. Coral Reef Information Network of the Philippines
(PhilReefs), University of the Philippines Marine Science Institute, Quezon City, Philippines and the Marine
Parks Center, Tokyo, Japan.
Orallo, C.A., M.C. Calpito, J.C. Pagan, F. Anacta, C. Domingo, C. Nacar, E. Acosta, and D. Milan. 2003b. Chapter
2: Davila, Pasuquin, Ilocos Norte. Pp. 1012 in Philippine Coral Reefs through time: Workshop Proceedings.
Second of the Atlas of the Philippine Coral Reefs Series. Coral Reef Information Network of the Philippines
(PhilReefs), University of the Philippines Marine, Science Institute, Quezon City, Philippines and the Marine
Parks Center, Tokyo, Japan.
Ordoñez, J.A., R.M. Legasto, and N. Metrillo, Jr. 1975. Zooplankton distribution off Mindoro Island and Bantayan
Bay, Luzon Island, Philippines--South China Sea. Philippine Journal of Fisheries 11 (1): 2329.
Pagdilao, C.R., W.L. Campos, and S.S. Salacup. 1991. Status of nearshore fisheries in the Philippines. Pp. 461
in Proceedings of the Seminar-Workshop on the Management of Nearshore Fishery Resources. PCAMRD,
Los Banos, Laguna, Philippines.
Palermo, J.D., C. de Castro, C.L. Villanoy, L. Talaue-McManus, N.A. Khang, and N. Cho. 2003. Spatial variability
of plankton assemblages, biomass, and productivity in the South China Sea.
Pastoral, P.C., S.L. Escobar, and N.J. Lamarca. 2000. Roundscad exploration by purse seine in the South China
Sea, Area III: Western Philippines. Pp. 4964 in Proceedings of the Third Technical Seminar on Marine
Fishery Resources Survey in the South China Sea, Area III: Western Philippines. SEAFDEC Special Paper
No. SEC/SP/41. Southeast Asian Fisheries Development Center, Bangkok, Thailand.
Pauly, D., G. Silvestre, and I.R. Smith. 1989. On development, fisheries and dynamite: a brief review of tropical
fisheries management. Natural Resource Modeling 3(3): 307329.
Paxton, J.R., D.F. Hoese, G.R. Allen, and J.E. Hanley. 1989. Pisces. Petromyzontidae to Carangidae. Zoological
Catalogue of Australia, Vol. 7. Australian Government Publishing Service, Canberra, Asutralia. 665p.
PCAMRD. 1993. Status of the Philippine Tuna Fisheries. PCAMRD-DOST Primer No. 18, Philippine Council for
Aquatic and Marine Research and Development (PCAMRD) University of the Philippines at Los Baños (UPLB)
WorlFish CenterPhilippine Office, Los Baños, Philippines. 19p.
PCSD. 2000. Status of reef and reef fishes in Palawan. URL:
http://www.pcsd.ph/Study%20and20findings/Sea%Assessment.html.
Prado, V.V. 2001. Evaluation of the major tuna fisheries along the northwestern coast of Luzon, Philippines.
UPV Journal of Natural Science 6: 228238.
Rañola M.C., P. Aliño, C. Nañola, H. Hernandez, V. Hilomen, and A. Saji. 2003. Chapter 8: Puerto Galera, Oriental
Mindoro. Pp. 3538 in Philippine Coral Reefs through time: Workshop Proceedings. Second of the Atlas of the
Philippine Coral Reefs Series. Coral Reef Information Network of the Philippines (PhilReefs), University of the
Philippines Marine Science Institute, Quezon City, Philippines and the Marine Parks Center, Tokyo, Japan.
Relox, J.R., E.F. Furio, and V.M. Borja. 2000. Abundance and distribution of zooplankton in the South China Sea,
Area III: Western Philippines. Pp. 164176 in Proceedings of the Third Technical Seminar on Marine Fishery
Resources Survey in the South China Sea, Area III: Western Philippines. SEAFDEC Special Paper No.
SEC/SP/41. Southeast Asian Fisheries Development Center, Bangkok, Thailand.
Rimmer, M.A., R.N. Garrett and M.A. Samoilys. 1994. In vitro fertilization of eggs of coral trout, Plectropomus
leopardus (Serranidae), collected from an aggregation site on the Great Barrier Reef, Australia. Bulletin of
Marine Science 54: 356358.
Rojana-anawat, P., N. Sukramongkol and S. Pradit. 2000. Characteristics of water in the South China Sea, Area III:
Western Philippines. Pp. 291307 in Proceedings of the Third Technical Seminar on Marine Fishery
Resources Survey in the South China Sea, Area III: Western Philippines. Special Paper No. SEC/SP/41.
Southeast Asian Fisheries Development Center, Bangkok.
Ronquillo, I. A. (1975). A review of the roundscad fishery in the Philippines. Philippine Journal of Fisheries 2:
86126.
Ronquillo, I.A., P. Caces-Borja, and A. Mines (1960). Preliminary observations on the otter trawl fishery of Manila
Bay. Philippine Journal of Fisheries 8: 4256.
Roper C.F.E., M.J. Sweeney, and C.E. Nauen. 1984. Cephalopods of the world. FAO Rome, Italy. Vol. 3, 277p.
Salini, J.P., S.J. Blaber, and D.T. Brewer. 1992. Diets of sharks from estuaries and adjacent waters of the north-
eastern Gulf of Carpentaria, Australia. Australian Journal of Marine and Freshwater Research 43: 8796.
San Diego-McGlone, M.L., G.S. Jacinto, V.C. Dupra, I.S. Narcise, D.O. Padayao, and I.B. Velasquez. 1999.
A comparison of nutrient characteristics and primary productivity in the Sulu Sea and South China Sea.
Acta Oceanographica Taiwanica 37(3): 219229.
Reversing Environmental Degradation Trends in the South China Sea and Gulf of Thailand
54 NATIONAL REPORT ON FISHERIES PHILIPPINES
Saramun, S. and G. Wattayakorn. 2000. Petroleum Hydrocarbon Contamination in Seawater along the Western
Coast of the Philippines, Pp. 316320 in Proceedings of the Third Technical Seminar on Marine Fishery
Resources Survey in the South China Sea, Area III: Western Philippines. Special Paper No. SEC/SP/41.
Southeast Asian Fisheries Development Center, Bangkok, Thailand.
Scura, L.F., T.-E. Chua, M.D. Pido, and J.N. Paw. 1992. Lessons for integrated zone management: the ASEAN
experience. Pp. 170 in T.-E. Chua and L.F. Scure (eds.) Integrative framework and methods for coastal area
management. ICLARM Conference Proceedings. Vol. 37.
Silvestre, G., M. Soriano, and D. Pauly. 1991. Sigmoid selection and the Beverton and Holt equation.
Asian Fisheries Science 4(1): 8598.
Simpson, A.C. 1979. Report of the BFAR/SCSP workshop on the fishery resources of the north and western coasts
of Luzon (SCS/GEN/79/22). South China Sea Fisheries Development and Coordinating Programme, Manila,
Philippines. 57p.
Siriraksophon, S., Y. Nakamura, S. Pradit, and N. Sukramongkol. 2000. Ecological aspects of oceanic squid,
Sthenoteuthis oualaniensis (Lesson) in the South China Sea, Area III: Western Philippines. Pp. 101-117 in
Proceedings of the SEAFDEC Seminar on Fishery Resources in the South China Sea, Area III: Western
Philippines.
Talaue-McManus, L. 2000. Transboundary diagnostic analysis for the South China Sea. EAS/RCU Technical
Report Series No. 14. UNEP, Bangkok, Thailand. 105p.
Tan, E.O. 1970. Notes on the biology of chub mackerel, Rastrelliger brachysoma (Bleeker), in Manila Bay. Pp.
479480 in J.C. Marr (ed.) The Kuroshio: A symposium on the Japan Current. Hawaii University Press,
Honolulu.
Thomas, F.C. 1999. The Commercial Fishery Sector of the Philippines: A Centennial Chronicle 1898-1998. LDC
Printers, Quezon City. 170p.
Tiews, K., A. N. Mines, and I. A. Ronquillo. 1972. On the biology of Saurida tumbil (Bloch 1801) Family
Synodontidae in Philippine waters. Philippine Journal of Fisheries 10: 129.
UNEP. 2001. UNEP Project to reverse environmental degradation trends in South China Sea and Gulf of Thailand.
Press Release UNEP/87. 29 March 2003.
UPMSI. 1999. Economic evaluation and biogeochemical modeling of the Lingayen Gulf in support of management
for sustainable use. Marine Science Institute, University of the Philippines. Diliman, Quezon City.
Uychiaoco, A.J., H.O. Arceo, J. Resurrection, R. Alarde, M. Comer, B. Francisco, A. Socrates, S. Curran, P.A.
Gaite, E. Calagui, J. Philibottle, D. Mangus, E. Dumadaug, and R. Villamor. 2003. Pp. 3941 in Chapter 9:
Port Barton Marine Park, San Vicente, Palawan. Philippine Coral Reefs through time: Workshop Proceedings.
Second of the Atlas of the Philippine Coral Reefs Series. Coral Reef Information Network of the Philippines
(PhilReefs), University of the Philippines Marine Science Institute, Quezon City, Philippines and the Marine
Parks Center, Tokyo, Japan.
Villarao, V., L. Mijares, L. Palolan, L. Estamo, and M. Aragon. 2003. Marine fisheries stock assessment in Batanes
waters. Paper presented to the NSAP pre-workshop evaluation. 2224 April 2003, Manila. 48p.
Villoso, E.P. and V.L. Aprieto. 1983. On the relative abundance and distribution of Slipmouths (Pisces:
Leiognathidae) in Lingayen Gulf, Philippines. Fisheries Research Journal of the Philippines 8 (1): 2643.
Werner, T.B. and G.R. Allen (eds.). 2000. A rapid marine biodiversity assessment of the Calamianes Islands,
Palawan Province, Philippines. RAP Bulletin of Biological Assessment 17. Washington, D.C. Conservation
International.
White, A. and A Meneses. 2003. Chapter 7: Mabini and Tingloy Batangas. Pp. 2934 in Philippine coral reefs
through time: workshop proceedings. Second of the Atlas of the Philippine Coral Reefs Series. Coral Reef
Information Network of the Philippines (PhilReefs), University of the Philippines Marine Science Institute,
Quezon City, Philippines and the Marine Parks Center, Tokyo, Japan.
Whitehead, P.J.P., 1985. FAO species catalogue. Clupeoid fishes of the world. An annotated and illustrated
catalogue of the herrings, sardines, pilchards, sprats, shads, anchovies and wolf-herrings. Part 1:
Chirocentridae, Clupeidae, and Pristigasteridae. FAO Fisheries Synopsis 125(7): 303p.
Whitehead, P.J.P., G.J. Nelson, and T. Wongratana. 1988. FAO species catalogue. Vol. 7. Clupeoid fishes of the
world (Suborder Clupeoidei). An annotated and illustrated catalogue of the herrings, sardines, pilchards,
sprats, shads, anchovies and wolf-herrings. Part 2: Engraulidae. FAO Fisheries Synopsis 125(7): 579p.
Wood J.B. and R.K. O'Dor. 2000. Do larger cephalopods live longer? Effects of temperature and phylogeny on
interspecific comparisons of age and size at maturity. Marine Biology 136(1): 9199.
Wyrtki, K. 1961. Physical oceanography of the southeast Asian waters. NAGA Report, Vol. 2. Scientific results of
marine investigation of the South China Sea and Gulf of Thailand, Scripps Institution of Oceanography.
La Jolla, California. 195p.
Zakaria, M.Z. 2000. Age and growth studies of oceanic squid Sthenoteuthis oualaniensis using statoliths.
Pp. 135147 in Proceedings of the SEAFDEC Seminar on Fishery Resources in the South China Sea, Area
III: Western Philippines.
Reversing Environmental Degradation Trends in the South China Sea and Gulf of Thailand


United Nations
UNEP/GEF South China Sea
Global Environment
Environment Programme
Project
Facility
NATIONAL REPORT
on
The Fish Stocks and Habitats of Regional, Global, and
Transboundary Significance
in the South China Sea
THAILAND
Mr. Pirochana Saikliang
Focal Point for Fisheries
Chumphon Marine Fisheries Research and Development Center
408 Moo 8, Paknum Sub-District, Muang District, Chumphon 86120, Thailand
NATIONAL REPORT ON FISHERIES THAILAND
Table of Contents
1. MARINE
FISHERIES DEVELOPMENT........................................................................................2
1.1 O
/
VERVIEW OF THE FISHERIES SECTOR ...................................................................................2
1.1.1 Total catch by fishing area, port of landing or province (by species/species group).7
1.1.2 Fishing effort by gear (no. of fishing days, or no. of boats) .......................................7
1.1.2.1 Trawl ...........................................................................................................10
1.1.2.2 Purse seine/ring net....................................................................................10
1.1.2.3 Gill net.........................................................................................................12
1.1.2.4 Other gears.................................................................................................12
1.1.3 Economic value of catch..........................................................................................14
1.1.4 Importance of the fisheries sector in terms of employment & dependence ............14
1.1.4.1 Contribution of the fisheries sector to GDP ................................................14
1.1.4.2 Contribution of the fishing industry to income and employment.................18
1.1.4.3 Contribution of the fisheries sector to foreign exchange earning ...............18
1.1.4.4 Contribution of the fishery sector to domestic nutrition ..............................19
2.
SPECIES OF REGIONAL, GLOBAL AND/OR TRANSBOUNDARY SIGNIFICANCE.............20
2.1 RANKING OF IMPORTANCE IN TERMS OF LANDINGS, VALUE, AND STATUS..................................22
2.1.1 Landings (by site or province) (mt) ..........................................................................22
2.1.2 Local market value (Local currency, note year).......................................................22
2.1.3 Status (endangered, threatened, rare etc. IUCN criteria)........................................22
2.1.4 Food security (locally)..............................................................................................26
2.2 BIOLOGY & ECOLOGY OF THE PRIORITY SPECIES (FROM AVAILABLE INFORMATION) ..................26
2.2.1 Large pelagic fish (FAO)..........................................................................................26
2.2.2 Small pelagic fish species........................................................................................35
2.2.3 Demersal fish species..............................................................................................39
2.2.4 Commercially exploited invertebrates......................................................................46
3. THREATS
&
CURRENT STATUS..............................................................................................51
3.1 STATUS OF FISHERY IN TERMS OF CPUES ............................................................................51
3.2 STATUS OF FISH STOCKS BASED ON HISTORICAL REVIEW OF LANDINGS AND CPUES................52
3.3 THREATS.............................................................................................................................54
3.3.1 Current (e.g. destructive fishing practices, overfishing) ..........................................54
3.3.2 Potential (project market demand, increased coastal population)...........................56
4.
HABITATS & AREAS OF IMPORTANCE IN THE MAINTENANCE OF EXPLOITED
FISH STOCKS ............................................................................................................................56
4.1 THE PHYSICAL, CHEMICAL, AND BIOLOGICAL CHARACTERISTICS OF THE GULF OF THAILAND .....56
4.1.1 Known spawning grounds........................................................................................57
4.1.2 Known nursery areas...............................................................................................60
4.1.3 Known fishing grounds ............................................................................................60
4.1.4 Seawater quality and pollutants...............................................................................61
4.1.5 Biological parameters ..............................................................................................61
4.1.6 Bottom sediment......................................................................................................63
4.2 UNKNOWN ISSUES SUCH AS STOCKS WITH UNDEFINED SPAWNING GROUNDS ...........................64
4.3 THREATS, CURRENT AND POTENTIAL (COASTAL DEVELOPMENT, POLLUTION, OIL SPILLS) ..........64
4.3.1 Coastal development ...............................................................................................64
4.3.2 Oil spills....................................................................................................................64
4.3.3 Pollution ...................................................................................................................64
4.3.4 Plankton blooms ......................................................................................................65
4.4 RANKING OF HABITATS .........................................................................................................67
4.4.1 Association with species of importance to food security .........................................67
4.4.2 Association with high value species ........................................................................67
4.4.3 Association with endangered, rare, threatened species..........................................68
ii
NATIONAL REPORT ON FISHERIES THAILAND
5. CURRENT
MANAGEMENT REGIME(S) ...................................................................................68
5.1 LEGAL INSTRUMENTS ...........................................................................................................68
5.2 INSTITUTIONAL ARRANGEMENTS (RESEARCH, MONITORING, CONTROL & SURVEILLANCE)..........69
5.3 OVERVIEW OF PATTERNS OF RESOURCES OWNERSHIP AND TRADITIONAL UTILISATION .............70
5.4 HUMAN & INSTITUTIONAL CAPACITY......................................................................................71
5.5 REVIEW OF STAKEHOLDERS (E.G. FISHERS, NATIONAL AND/OR PROVINCIAL/LOCAL
MANAGEMENT BODIES, NGOS) .............................................................................................72
6. PROBLEMS,
CONSTRAINTS
AND RECOMMENDED ACTIONS............................................78
6.1 PROBLEMS AND CONSTRAINTS .............................................................................................78
6.2 RECOMMENDATIONS ............................................................................................................79
7.
REFERENCES............................................................................................................................80
APPENDEX 1 Rates of Exchange of Commercial Bank in Bangkok Metropolis
APPENDEX 2 Extinct, Extinct in the Wild, Critically Endangered, Vulnerable, and Threatened
Marine Species in Thailand
APPENDEX 3 Fishes Found in Habitats of the Gulf of Thailand
APPENDEX 4 The Organisational Structure of the Department of Fisheries (DOF)
APPENDEX 5 The Organisational Structure of the Department of Marine and Coastal
Resources (DMCR)
iii
NATIONAL REPORT ON FISHERIES THAILAND 1
Fish Stocks & Habitats of Regional, Global, and Transboundary Significance
in the South China Sea
Case Study: Gulf of Thailand
INTRODUCTION
The Gulf of Thailand (Figure 1) covers an area of approximately 350,000km2. The Gulf is a shallow
arm of the South China Sea, adjoining it over a distance of 200 nautical miles. It is approximately 450
nautical miles long, 300 nautical miles wide, with a maximum depth, in the central portion, of slightly
more than 80m. The central depression extends for 60 nautical miles near Cape Liant at the
southeast corner of the Bangkok Bight. The northeast coast is slightly shallower and flatter than the
southwest coast.
The deeper central Gulf is separated from the South China Sea by 2 ridges. The first has a depth of
less than 25m and extends southwest for more than 60 nautical miles from the Cape of Camau
(Robinson 1974). The other has a deeper ridge, less than 50 m, which extends northeast of Kota
Bharu for a distance of 90 nautical miles. Subsequent to the Naga Expedition, a further regional
bathymetric survey was conducted by the DODO expedition of the Scripps Institution of
Oceanography. In the narrow, deeper channel between the ridges, a still depth of 67 m was observed.
These general features play an important role in regional oceanography. In general, the Gulf of
Thailand is divided into 2 parts:
1.
The Upper or Inner Gulf starts from latitude 12o30N and extends up to the Chao Phraya
Estuary, forming a U-shape. This 100x100km2 area, with an average water depth of 15m, can contain
about 131km3 of water (calculated at the MSL). The northern part is shallow, gradually sloping to a
depth of 25m near the opening between Sattahip, Chonburi province, and Hua Hin, Prachuap Khiri
Khan province.
2.
The Lower or Outer Gulf starts from latitude 12o 30 N and extends down to Cape Camau
and the Kotabaru Estuary, with an average water depth of 45m. A large number of ridges and shallow
valleys dominate the continental shelf next to the Gulf of Thailand and southern Viet Nam coast,
where water depth gradually increases to about 130m (Siripong, 1985).
The Gulf of Thailand is considered one of the most productive marine areas of the world, with a high
level of primary production and diverse range of flora and fauna. It is abundant in marine fishery
resources, typical of Indo-Pacific fish fauna. Thailand's marine fish fauna includes some 1,337
species from 141 families. There are 618, 350, and 379 species of economically important marine
fish, aquarium fish, and low-value fish known to occur in Thai waters, respectively (Sukhavisidth,
1996). The greatest species diversity exists within the demersal fish fauna. A high degree of
intermixing is also common among the demersal species, such that no single species or group of
species is observed to dominate catches. The pelagic species are somewhat less diverse than the
demersal species, and are less likely to be so highly intermixed.
Reversing Environmental Degradation Trends in the South China Sea and Gulf of Thailand
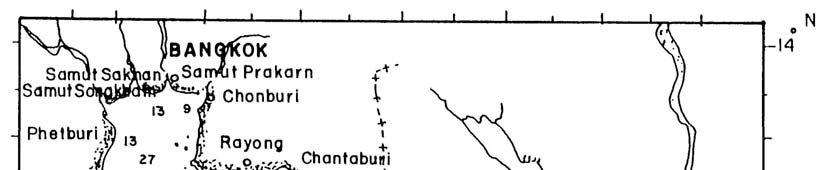
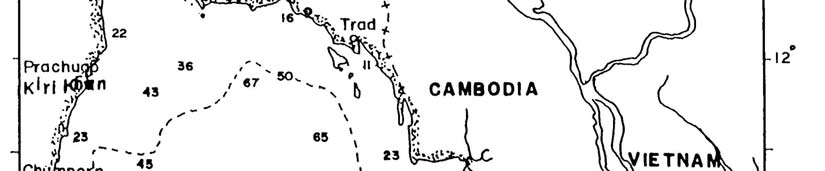
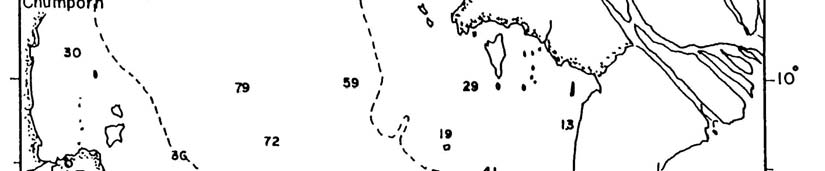
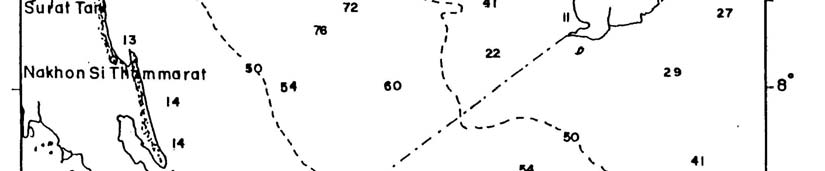
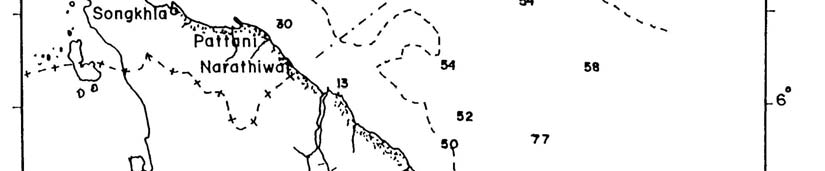
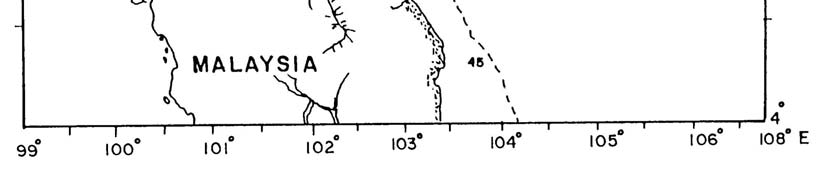
2 NATIONAL REPORT ON FISHERIES THAILAND
Figure 1
The Gulf of Thailand.
1.
MARINE FISHERIES DEVELOPMENT
1.1
Overview of the fisheries sector 2/
Marine fisheries are an important contributor to Thailand's economy. They are not only an important
source of animal protein, but also a source of employment. Similarly, the export of fishery products is
a major source of foreign exchange earnings for Thailand. Various types of fishing gear are used to
exploit marine fish resources in the Gulf of Thailand, with at least 150 fishing gears being widely
utilised by Thai fishers (Okawara et al. 1986). It is well known that there is no particular fishing gear
used to catch one single species. Thai Fisheries have developed progressively, especially with regard
to the adoption of fishing gears and techniques. Historically, the development of Thailand's fisheries
can be categorised into the following 3 periods:
2/ Data for the South China Sea coastline only.
Reversing Environmental Degradation Trends in the South China Sea and Gulf of Thailand
NATIONAL REPORT ON FISHERIES THAILAND 3
Pre 1960 This was the initial development phase for Thailand's fisheries. Most fishing gear was of
the artisanal type, including harpoons or spears, and stone block traps. Stationary fishing gear,
including the bamboo stake trap, set bag net, and wing set bag, were introduced in 1897. Fishing gear
were small-scale and operated with non-powered boats.
The use of the Chinese purse seine by 2 row boats was introduced to Thailand in 1925. This gear
was rapidly accepted due to its efficiency in catching Indo-Pacific mackerel. By 1930, fishers had
begun using the Chinese purse seine with boats powered by Japanese motors, and had redesigned
their boats for the efficient capture of pelagic fishes.
In 1947, there were 2,615 units of fishing gear used in Thai waters. This number had increased to
11,560 by 1959 (Table 1). Set bag nets and bamboo stake traps were the main gears used. For seine
nets, the total number of units increased from 177 in 1947 to 379 in 1959, and the total annual marine
fish production ranged from 150,000 to 230,000 metric tonnes, or approximately 73 percent of total
fisheries production (Table 2). Most of the marine fish caught were pelagic species for domestic
consumption, including Indo-Pacific mackerel, Indian mackerel, sardines, and anchovies.
1960 to 1980 - This period involved the rapid expansion of Thailand's trawl fisheries, particularly
during the early 1960s as a result of the introduction of German type otter board trawling. The total
number of registered fishing gear units increased from 17,790 in 1960 to almost 20,000 in 1980,
whilst the number of trawl gear units increased from 99 to 10,428 during the same period. Nylon was
also introduced during this period as a material for fishing gear such as gill nets, push nets, and squid
nets. The period involved a rapid decline in the total number of previously popular gears, including the
bamboo stake trap and set bag net. This was largely due to the popularity and rapid uptake of trawl
fishing gear and technology.
The development of fisheries in Thailand during this period focused on both demersal and pelagic
species. The significant expansion of Thai fisheries during the period 1960-80 was mainly due to the:
1. Introduction of new technology and fishing gears, including the use of nylon nets in small scale
fisheries, and otter board trawls in commercial fisheries;
2. Improved seaworthiness of both non-powered to engine powered fishing vessels;
3. Technical support from developed countries and international organisations;
4. Investment and/or financial support from industrial countries for the development of infrastructure,
including fish processing, cold storage, and ice plant;
5. Exploration of new fishing areas, especially in the South China Sea; and
6. Government policy that supported the development of offshore fisheries.
All of these factors led to a significant increase in the total quantity of marine fish caught since 1960.
According to fisheries statistics, total annual catch increased from about 150,000 metric tonnes in
1960 to more than 2 million metric tonnes in 1977, making Thailand one of the top 10 fishing nations
since 1973. Furthermore, the contribution of marine fish production to Thailand's total fisheries
production increased from 66.87% to over 90%. Total production decreased slightly to 1.8 million
metric tonnes in 1980, however, due to the country's oil crisis. Pelagic fisheries also developed rapidly
during this period. The uptake of luring purse seines in the 1970s, and the discovery of fishing
grounds for round scads in the central part of the Gulf in 1973, were key contributing factors to this
growth. The development of light luring fishing techniques to catch small pelagic fish has resulted in
significant increases in landings of small pelagic fishes since 1978.
Panayotou and Songpol (1987, cited in Johnson 1997) identified 3 factors influencing the rapid rise of
Thai fisheries since the early 1960s. These include the introduction of new technology, notably the
trawl, the purse seine, and the motorised boat; a "laissez-faire attitude" of the Thai Government
towards fisheries development, allowing private investors virtually a free-hand in resource
exploitation; and the demand for fisheries products in global and domestic markets. Thailand has
been one of the world's most important producers and exporters of seafood since 1972.
Reversing Environmental Degradation Trends in the South China Sea and Gulf of Thailand
4 NATIONAL REPORT ON FISHERIES THAILAND
Table 1
Number of fishing gear units registered in Thailand from 1947 to 2000.
Year Trawlers Seine Gill
Squid
Bamboo
Set
Set net
Hook &
Push
Other
Grand
Nets
Nets
Nets
Stake Trap Bag Net
Line
Net
Nets
Total
1947
177 823
1,615
2,615
1948
222
1,177
3,682
5,081
1949
151
1,160
2,999
4,310
1950
181
1,047
3,379
4,607
1951
164
1,003
2,370
3,537
1952
253
1,263
4,247
5,763
1953
259
1,334
2,238
827
4,537
9,195
1954
346
1,460
2,318
988
5,819
10,931
1955
314
1,462
2,260
843
6,082
10,961
1956
381
1,579
2,390
764
7,218
12,332
1957
324
1,287
2,813
636
7,282
12,342
1958
182
1,344
2,505
977
6,429
11,437
1959
379
1,470
2,043
618
7,050
11,560
1960 99
345
2,064
3,429
1,234
10,799
17,790
1961 201
275
1,484
2,623
365
10,654
15,602
1962
1,103
220
1,319
2,318
747
15,694
21,401
1963
2,327
242
1,528
2,674
608
13,484
20,863
1964
2,457
215 863
2,323
730
10,742
17,330
1965
2,606
218 949
2,310
625
8,085
14,793
1966
2,870
243 869
2,034
6,377
7,079
13,732
1967
1,872
324 559
1,580
591
6,935
11,861
1968
2,926
400 516
1,684
516
6,299
12,341
1969
2,602
398 451
1,522
329
5,135
10,401
1970 3,082 976 569
632
1,296
313
354
5,065 12,287
1971 3,607 718 563
398
1,420
308
610
4,364 11,988
1972 4,487 759 582
288
1,368
291
1,327 81 9,183
1973 5,837 908
1,391
281
1,262
239
1,628 49 11,595
1974 5,271 854
1,104
189
-
-
6
1,213 56 8,693
1975 4,961 812
1,050
229
-
-
16
1,075 48 8,191
1976 5,204 952
2,198 44
262
-
-
47
844 100 9,651
1977 6,288
1,020
2,611 0
222
-
-
71
1,177 240 11,629
1978 6,576
1,112
3,281 34
242
-
-
33
1,426 190 12,894
1979 8,747
1,038
4,526 12
250
-
-
210
1,923 213 16,919
1980 10,428
1,058
4,926 230
258
-
-
222
2,262 162 19,546
1981 7,525
1,091
3,893 470
264
-
-
44
1,216 79 14,582
1982 11,475 1,078 4,522 1,274 -
-
-
33
1,899 111 20,392
1983
9,390 980 5,028 1,038 -
-
-
54
1,236 165 17,891
1984
9,131 1,206 3,767 1,064 -
-
-
46
960 364 16,538
1985 8,325
1,260
4,536 663 -
-
-
63
759 362 16,158
1986 7,407
1,199
5,654 654 -
-
-
51
664 287 15,916
1987 7,343
1,397
5,492 794 -
-
-
53
624 351 16,054
1988
6,950 1,602 4,932 1,171 -
-
-
142
531 222 15,550
1989 13,119 1,551 3,107 1,055 -
-
-
50
1,904 187 20,973
1990 12,905 1,730 3,702 1,088 -
-
-
48
1,879 195 21,547
1991 10,298 1,702 3,680 1,363 -
-
-
47
1,047
33 18,170
1992
9,465 1,524 3,307 1,591 -
-
-
68
818
47 16,820
1993
9,086 1,603 4,759 1,895 -
-
-
59
808
30 18,146
1994
8,346 1,610 4,980 2,059 -
-
-
36
651
74 17,657
1995
7,995 1,479 5,228 1,894 -
-
-
53
634
80 17,281
1996
8,972 1,456 4,966 1,747 -
-
-
48
722
39 17,950
1997
8,885 1,652 4,644 1,945 -
-
-
47
901 108 18,182
1998
9,161 1,445 5,035 1,545 -
-
-
41
861 351 18,439
1999
8,324 1,670 4,214 1,232 -
-
-
53
660 768 16,921
2000
8,008 1,585 3,686 2,096 -
-
-
65
638 1,217 17,295
Source : Saikliang (1995a, cited Department of Fisheries, Fisheries Statistics Sub-Division) DOF, 1995 to 2002.
Note: 1947 to 1969 = Number of fishing gears registered
1970 to 2000 = Number of fishing boats registered by type of fishing gears
Reversing Environmental Degradation Trends in the South China Sea and Gulf of Thailand
NATIONAL REPORT ON FISHERIES THAILAND 5
Table 2
The quantity and value of Thailand's fisheries production from 1947 to 2000.
Production (mt)
Total
% of total
Value (million baht)
Year
Marine Freshwater (mt)
Marine Marine
Freshwater Total
1947
120,173
40,851
161,024
74.63
- - -
1948
151,380
44,460
195,840
77.30
- - -
1949
108,800
44,900
153,700
70.79
- - -
1950
115,600
42,200
157,800
73.26
- - -
1951
141,000
46,000
187,000
75.40
- - -
1952
138,500
53,000
191,500
72.32
428 324 752
1953
148,200
56,300
204,500
72.47
507 313 820
1954
166,400
63,400
229,800
72.41
581 347 928
1955
151,400
61,570
212,970
71.09
604 372 976
1956 152,240
65,720 217,960
69.84
684
462
1,146
1957 170,900
63,670 234,570
72.86
735
455
1,190
1958 145,000
51,300 196,300
73.87
725
428
1,153
1959 147,770
57,124 204,894
72.12
754
479
1,233
1960 146,471
72,574 219,045
66.87
832
580
1,412
1961 233,275
72,475 305,750
76.30 1,029
542
1,571
1962 269,709
70,079 339,788
79.38 1,106
537
1,643
1963 323,374
70,481 393,855
82.10 1,167
768
1,935
1964 494,196
82,790 576,986
85.65 1,835
655
2,490
1965 529,483
85,637 615,120
86.08 1,798
672
2,470
1966 635,165
85,117 720,282
88.18 1,903
675
2,578
1967 762,188
85,256 847,444
89.94 2,309
738
3,047
1968 1,004,058
85,245 1,089,303
92.17
3,251
786
4,037
1969 1,179,595
90,439 1,270,034
92.88
4,011
787
4,798
1970 1,335,690
112,714 1,448,404
92.22
4,097
906
5,003
1971 1,470,289
116,788 1,587,077
92.64
4,554
974
5,528
1972
1,548,157
131,383
1,679,540 92.18
4,936 1,371 6,307
1973
1,538,016
140,885
1,678,901 91.61
6,562 1,647 8,209
1974
1,351,590
158,876
1,510,466 89.48
4,094 1,890 5,984
1975
1,394,608
160,692
1,555,300 89.67
5,102 2,092 7,194
1976
1,551,792
147,294
1,699,086 91.33
5,969 2,152 8,121
1977 2,067,533
122,374 2,189,907
94.41
8,622
2,038
10,660
1978 1,195,785
141,496 2,099,281
93.26 11,459
2,369
13,828
1979 1,813,158
133,176 1,946,334
93.16 11,318
2,686
14,004
1980 1,647,953
144,995 1,792,948
91.91 10,508
3,560
14,068
1981 1,824,444
164,581 1,989,025
91.73 13,213
3,921
17,134
1982 1,986,571
133,562 2,120,133
93.70 14,246
4,685
18,931
1983 2,099,986
155,447 2,255,433
93.11 15,236
4,002
19,238
1984 1,947,019
161,819 2,108,838
92.33 14,541
3,796
18,337
1985 2,057,751
167,453 2,225,204
92.47 15,651
4,135
19,786
1986 2,352,204
187,763 2,539,967
92.61 18,883
4,005
22,888
1987 2,601,929
177,142 2,779,071
93.63 23,083
4,558
27,641
1988 2,446,100
183,600 2,629,700
93.02 28,039
4,383
32,422
1989 2,539,200
200,800 2,740,000
92.67 31,429
4,441
35,870
1990 2,555,400
231,000 2,786,400
91.71 35,492
5,904
41,396
1991 2,709,000
258,700 2,967,700
91.28 46,766
6,260
53,026
1992 2,965,700
274,100 3,239,800
91.54 59,068
6,477
65,545
1993 3,048,100
337,000 3,385,100
90.04 69,828
8,579
78,407
1994 3,150,200
373,000 3,523,200
89.41 77,299
9,702
87,001
1995 3,184,900
387,700 3,572,600
89.15 86,222
9,890
96,112
1996 3,112,100
437,100 3,549,200
87.68 88,845
11,781
100,626
1997 2,979,200
405,200 3,384,400
88.03 97,533
11,109
108,642
1998 3,076,700
429,200 3,505,900
87.76 109,907
14,640
124,547
1999 3,166,600
459,500 3,625,900
87.33 118,947
15,175
134,122
2000 3,240,700
472,500 3,713,200
87.28 132,004
15,457
157,462
Sources: DOF 1996; 2000a; Saikliang 1995a.
Coastal aquaculture were included.
Reversing Environmental Degradation Trends in the South China Sea and Gulf of Thailand
6 NATIONAL REPORT ON FISHERIES THAILAND
1980 to present: during this period, the use of the otter board trawl has remained very popular
among Thai fishers. Total production has increased dramatically, however, this has unfortunately
taken place without efficient control strategies. As a result, it is believed that Thailand's fisheries
resources have been subjected to biological overfishing for more than 3 decades. During this time,
the abundance of fish, as indicated by catch per unit effort (CPUE), has continuously declined,
leading Thai fishing fleets to seek new fishing areas in the South China Sea, the Indian Ocean, and
other high sea areas. With the establishment of the 1982 United Nations Convention on the Law of
the Sea, many of Thailand's neighbouring countries declared an "Exclusive Economic Zone" (EEZ),
including India (15 January 1977), Myanmar (9 April 1977), Cambodia (15 January 1978), Philippines
(11 June 1978), Indonesia (21 March 1980), Malaysia (25 April 1980), and Singapore (15 September
1980). Thailand declared its EEZ on 23 February 1981. The EEZ regime has had far-reaching
impacts on Thailand's fishing fleet, initially restricting the area of the fleets operations to Thai waters.
However, some Thai fishing boats continued to operate in the EEZs of other coastal States under joint
venture arrangements. This led to conflicts between commercial and small-scale fishers in
neighbouring countries, including Malaysia, Indonesia, Cambodia, Viet Nam, India, and Myanmar.
This development caused a decrease in total fishing area of approximately 300,000 square nautical
miles (Vetchakaran 1987), resulting in a 10% decrease in production after 1977 (Phasuk 1987).
Fisheries resources in the Gulf of Thailand have been overused in relation to their natural rate of
regeneration. The number of fishing boats far exceeds existing resource capacity. The critical state of
these resources is illustrated by the ongoing reduction in CPUE observed during surveys conducted
by the research vessel of the Department of Fisheries. CPUE has declined from 294.92kg per hour in
1963 to 25kg per hour at present. Furthermore, approximately 40% of marine catch consists of low-
value and juvenile fish. When demersal fish production declined, Thai fishers began targeting pelagic
fish using light luring purse seine techniques. Since 1982, coastal tuna and anchovy fisheries have
expanded dramatically due to improvements in fishing gear and methods. Similarly, new large fishing
boats installed with freezers have been built in order to enable boats to stay at sea for extended
periods. In other words, there has been a transition from coastal fisheries to offshore fisheries in
Thailand during this period. The increasing production from offshore fisheries is derived mainly from
areas of the Gulf of Thailand.
Table 2 shows Thailand's marine fisheries production in terms of quantity and value from 1952 to
2000. Both quantity and value of production has increased markedly since 1980, despite some minor
fluctuations in 1983 to 1984 due to increased fuel prices. Since 1986, marine fishery production has
been maintained at above 2.5 million metric tonnes per annum. Thailand has also been the largest
manufacturer and exporter of tuna since 1982 and prawns since 1993. Fishery products are one of
Thailand's top 10 export products, representing 10% of Thailand's export income. In 2000, production
was 3,713,200 metrics tonnes, made up of 3,240,700 metric tonnes (87.28%) of marine fish and
472,500 metric tonnes (12.72%) of freshwater fish. In 2000, approximately 2,020,876 metric tonnes
(72.86%) of the total production was derived from the Gulf of Thailand.
Of Thailand's 76 provinces, 17 are located along the coast of the Gulf, providing good maritime
access to Thai fishers. The Gulf of Thailand is divided into the Inner Gulf and the Outer Gulf as
mentioned earlier. The Outer Gulf extends into the South China Sea, and the Gulf as a whole is
divided into 7 areas for statistical data collection (Figure 2).
Reversing Environmental Degradation Trends in the South China Sea and Gulf of Thailand
NATIONAL REPORT ON FISHERIES THAILAND 7
E
N
Figure 2
The statistical fishing areas in the Gulf of Thailand.
1.1.1 Total catch by fishing area, port of landing or province (by species/species group)
Marine fisheries production, as reported by the Department of Fisheries, has yet to be classified by
species/species group and landing port. Marine fishing in the Gulf of Thailand is conducted from 37
major fishing ports and several hundred fishing villages scattered along the Gulf of Thailand coast.
The catch of important species/species groups in the Gulf of Thailand from 1990 to 2000 is shown in
Table 3. Catch of important pelagic and demersal fish, as well as invertebrates, in each fishing area
by fishing gear type, is highlighted in Appendix 1 (Tables 1 to 3).
1.1.2 Fishing effort by gear (no. of fishing days, or no. of boats)
The rapid expansion of the Thai fishing fleet relates to the increase in the number of fishing boats, as
well as their size and catching capacity. Most large registered fishing boats, especially those larger
than 18 m in length, are equipped with advanced fishing and navigation technology, including sonar
systems, echo sounders, radios, radar, and satellite navigation. There are at least 150 fishing gears
that are widely utilised by Thai fishers in the Gulf of Thailand (Okawara et al. 1986). The fishing gears
are classified into 2 main types, namely small-scale fishing gears and commercial fishing gears.
Commercial fishing gears can be classified by type and by size of fishing boat. However, small-scale
fishing gears, normally used by small boats in inshore waters, have not been classified by fishing boat
size.
Data regarding fishing effort in terms of number of different sized fishing boats and type of fishing
gear, including otter board trawl, pair trawl, luring purse seine, Thai purse seine, anchovy purse seine,
gill net, push net, and other small fishing gears are presented in Tables 4 to 9.
Reversing Environmental Degradation Trends in the South China Sea and Gulf of Thailand
8 NATIONAL REPORT ON FISHERIES THAILAND
Table 3
Catch of important marine fishes in the Gulf of Thailand from 1990 to 2000.
Unit: Metric tonnes
Species
group\Year
1990 1991 1992 1993 1994 1995 1996 1997 1998 1999 2000
Grand
total
1,923,163 1,820,687 2,081,528 1,929,672 1,996,542 2,012,013 1,903,555 1,831,129 1,802,422 1,919,564 2,020,876
Sub-total
fishes
1,552,050 1,430,115 1,643,683 1,605,030 1,612,501 1,695,892 1,589,603 1,515,889 1,435,786 1,560,720 1,581,754
Sub-total
pelagic
fishes
582,192 559,502 700,149 612,301 643,855 690,744 629,355 590,619 606,651 639,828 642,472
Indo-Pacific
mackerel
78,279 64,156 96,598 76,997 82,021 112,280 92,765 91,622 107,083 125,175 120,882
Indian
mackerel
22,176 17,849 31,577 35,986 50,898 45,338 21,328 19,276 19,393 26,912 21,902
King
mackerel
9,995 7,549 8,414 11,085 9,904 10,660 9,360 8,875 9,480 9,826 8,566
Longtail
tuna
101,397 79,227 72,277 39,396 32,006 38,824 32,347 29,127 34,805 45,818 53,407
Eastern
little
tuna+Frigate
tuna
54,915 58,763 84,887 67,402 67,827 48,121 47,125 42,557 44,027 56,888 46,054
Round
scads
10,676 22,747 42,525 46,186 38,394 54,641 52,648 47,498 57,893 56,461 67,902
Hardtail
scad
13,884 12,335 18,067 18,581 20,809 9,723 5,217 4,027 7,981 7,374 7,433
Trevallies
38,841 35,928 42,531 42,224 55,616 47,456 44,365 41,356 35,599 35,668 30,831
Big-eye
scad
19,972 15,451 21,851 19,581 37,080 36,449 24,533 22,188 24,931 25,966 29,075
Sardinellas
92,281 115,641 142,634 113,860 125,179 141,180 161,771 151,708 129,045 128,492 121,738
Anchovies
123,176 115,082 123,288 123,751 102,729 123,095 122,423 117,229 121,443 103,445 117,025
Other
pelagics
fishes
16,600 14,774 15,500 17,252 21,392 22,977 15,473 15,156 14,971 17,803 17,657
Sub-total
demersal
fishes
105,740 113,769 155,886 202,875 191,348 245,483 235,700 239,833 209,806 277,645 272,521
Treadfin
breams
26,282 34,125 51,655 57,903 55,850 71,637 64,749 62,944 59,683 69,949 74,544
Lizard
fishes
13,169 19,750 31,840 42,486 35,593 58,482 51,004 62,397 35,289 60,534 52,601
Snappers
3,447 2,878 5,300 10,815 8,105 8,796 9,180 8,469 11,559 8,961 5,242
Big-eyes
21,219 25,269 36,221 49,710 44,680 57,723 67,411 62,675 64,873 71,127 65,168
Grouper
1,781 1,928 3,142 2,948 5,679 5,431 5,847 5,649 5,020 5,465 5,035
Reversing Environmental Degradation Trends in the South China Sea and Gulf of Thailand
NATIONAL REPORT ON FISHERIES THAILAND 9
Table 3 cont. Catch of important marine fishes in the Gulf of Thailand from 1990 to 2000.
Species
group\Year
1990 1991 1992 1993 1994 1995 1996 1997 1998 1999 2000
Other
demersal
fishes
39,842 29,819 27,728 39,013 41,441 43,414 37,509 37,699 33,382 61,609 69,931
Other
food
fishes
89,244 96,481 127,439 123,128 116,218 109,437 122,017 123,923 104,078 159,838 148,433
Trash
fishes
774,874 660,363 660,209 666,726 661,080 650,228 602,531 561,514 515,251 483,409 518,328
Sub-total
shrimp
&
prawn
93,848 103,598 96,270 97,709 103,244 103,096 102,600 96,323 73,474 62,248 69,673
Banana
shrimp
8,649 7,733 7,486 8,130 9,928 9,226 7,132 7,169 7,648 8,206 10,385
Jumbo
tiger
prawn
121 223 274 277 488 373 631 572 341
1,043
1,580
Tiger
shrimp
312 315 325 323 642 711
1,042
1,068 839 609 714
King
prawn
1,364 1,271 1,624 1,399 1,304 1,486 1,600 1,838 1,775 2,546 3,400
Other
shrimp
82,210 92,866 85,630 86,344 89,622 89,386 89,298 82,715 59,409 47,334 50,844
Flathead
Lobster
903 807 766 1,067 861 1,730 2,716 2,785 3,005 1,760 2,289
Mantis
shrimp
289 383 165 169 399 184 181 176 457 750 866
Sub-total
crabs
34,306 35,149 34,831 38,066 39,881 39,820 38,856 37,515 40,852 39,137 39,137
Swimming
crabs
30,402 31,190 31,784 33,059 35,157 35,414 36,219 34,916 37,281 33,864 37,219
Mud
crabs
2,358 3,159 2,463 3,555 2,530 2,313 1,716 1,610 1,848 3,763 3,426
Other
crabs
1,546 800 584
1,452
2,194
2,093 921 989
1,723
1,510 788
Sub-total
squid
&
cuttlefish
119,091 120,281 113,893 114,004 109,031 115,810 115,966 116,277 130,554 119,742 120,485
Squid
57,608 56,551 51,209 55,867 55,762 59,624 56,006 55,740 68,788 62,613 64,671
Cuttlefish
45,655 50,077 48,036 44,456 41,987 45,358 47,239 48,344 44,847 45,009 44,927
Octopus
15,828 13,653 14,648 13,681 11,282 10,828 12,721 12,193 16,919 12,120 10,885
Sub-total
molluscs
109,873 76,137 90,672 65,006 53,577 40,727 38,574 42,700 62,591 53,163 70,974
Others
13,995 55,407 102,179 9,857 78,308 16,668 17,956 22,425 59,165 84,554 138,855
Source: DOF 1988 to 2002; 2003a.
Reversing Environmental Degradation Trends in the South China Sea and Gulf of Thailand
10 NATIONAL REPORT ON FISHERIES THAILAND
1.1.2.1 Trawl
As mentioned above, there are 3 types of trawl used in Thai waters. These include the otter board
trawl, pair trawl, and beam trawl. Beam trawls are mostly used to catch shrimp and the total number of
units of this gear type is low. Table 4 shows the number of otter board trawls and pair trawls
registered in key provinces along the coast of the Gulf of Thailand from 1980 to 2000. The number of
pair trawlers varied little during this period. However, the number of otter board trawls decreased from
1980 to 1988 as some trawl boats began using squid light luring cast nets to catch squid. The
development of this technique gained popularity due to the high price of, and the relative fuel
efficiency of the methods. From 1989 to 1990, the number of trawlers increased due to consent being
given to the registration of trawlers and push netters in 1989.
Table 4 Number of trawls registered along the coast of the Gulf of Thailand from 1980 to 2000.
Otter board trawl
Pair trawl
Grand
Year
< 14 m
14-18 m
18-25 m > 25 m
Total
< 14 m 14-18 m 18-25 m > 25 m
Total
Total
1980
4,038
1,768 1,189 187
7,182
54
476
567
5 1,102 8,284
1981 2,762 1,479 866 171
5,278
53
358
489
10 910
6,188
1982
4,719
1,897 1,227 185
8,028
44
528
727
7 1,306 9,334
1983
3,636
1,773 1,274 165
6,848
38
498
636
8 1,180 8,028
1984
3,608
1,681 1,286 170
6,745
40
428
598
6 1,072 7,817
1985
3,099
1,603 1,235 171
6,108
35
469
615
3 1,122 7,230
1986
2,629
1,518 1,132 137
5,416
29
440
585
6 1,060 6,476
1987
2,514
1,542 1,155 132
5,343
30
427
617
4 1,078 6,421
1988
2,339
1,491 1,057 110
4,997
31
387
628
0 1,046 6,043
1989 3,571 2,691
2,455 117
8,834
70
563
1,312
0
1,945
10,779
1990 3,302 2,804
2,457 119
8,682
84
571
1,269
5
1,929
10,611
1991
2,613
2,134 2,063 129
6,939
77
534
1,199
12 1,822 8,761
1992
2,370
2,051 1,852 101
6,374
54
475
1,117
15 1,661 8,035
1993
2,231
2,184 1,745
82
6,242
37
439
1,054
9 1,539 7,781
1994
1,870
1,965 1,624
72
5,531
34
404
1,063
7 1,508 7,039
1995
1,890
1,972 1,529
72
5,463
31
372
983
6 1,392 6,855
1996
2,098
1,976 1,746
92
5,912
25
381
1,189
15 1,610 7,522
1997
1,970
2,165 1,761 140
6,036
29
466
1,051
15 1,561 7,597
1998
2,048
2,064 1,853 144
6,109
13
345
1,221
17 1,596 7,705
1999
1,761
1,918 1,751 138
5,568
17
320
1,159
18 1,514 7,082
2000 1,742 1,829
1,634 139
5,344
16
290
1,144
14
1,4640
6,796
Source: DOF 1982 to 2002.
1.1.2.2 Purse seine/ring net
Purse seines are the major fishing gear used to exploit pelagic fish resources. Table 5 highlights
increased use of purse seines. Registered purse seines are classified as Chinese purse seines
(CPS), anchovy purse seines (APS), Thai purse seines (TPS), and luring purse seines (LPS).
Nowadays, CPS are not used in the Gulf of Thailand, however, APS are commonly used to catch
anchovy. The purse seines used to catch mixed pelagic fish species in the Gulf of Thailand are the
TPS and LPS. These 2 types of purse seine were combined after 1992. In the Gulf of Thailand, the
registered number of purse seines (TPS and LPS) increased from 602 units in 1980 to 1,013 units in
1988, again peaking at 1026 units in 1991. During the 1990s, the total number of purse seine units
gradually decreased. However, it is apparent that purse seine use is increasing, especially by larger
boats (Table 5).
Purse seines are used to catch pelagic fishes such as the Indo-Pacific mackerel, sardines, trevallies,
and scads. The Thai purse seine is used to catch free-swimming fishes that are usually small and
form species-specific schools. The luring purse seine, operated in conjunction with coconut leaf fish
aggregating devices (FADs) or artificial lights to attract fish, was also developed to catch small pelagic
fish, and has become extremely popular amongst Thai fishers. The number of purse seines registered
by the type and size of fishing boats in the Gulf of Thailand from 1980 to 2000 is shown in Table 5.
Reversing Environmental Degradation Trends in the South China Sea and Gulf of Thailand
NATIONAL REPORT ON FISHERIES THAILAND 11
Table 5 Number of purse seines registered by type and size of fishing boat in the Gulf of
Thailand from 1980 to 2000.
Luring purse seine
Thai purse seine
Grand
Year
<14 m
14-18 m 18-25 m
>25 m
Total
<14 m
14-18 m 18-25 m
>25 m
Total
Total
1980 59 150
294 3
506
40
51
5
0 96 602
1981 75 189
330 8
602
9
28
3
0 40 642
1982 59 154
362 7
582
21
19
2
0 42 624
1983 42 124
377 13
556
20
17
3
0 40 596
1984 25 34
197 6
262
26
116
218
3 363 625
1985 19 33
159 5
216
27
144
270
7 448 664
1986 27 42
183 2
254
18
108
286
13 425 679
1987 16 61
274 2
353
19
108
333
8 468 821
1988 79 45
303 0
427
28
156
392
10 586
1013
1989 45 32
369 7
453
58
88
206
5 357 810
1990 29 30
271 3
333
69
112
459
17 657 990
1991 6 18
252 6
282
88
130
512
14
744
1026
1992 6 16
228 3
253
29
91
516
21 657 910
1993*
76 118
705 26
925
0
0
0
0
0
925
1994* 45 132
704 33
914
0
0
0
0
0
914
1995* 35 87
636 27
785
0
0
0
0
0
785
1996* 29 76
579 23
707
0
0
0
0
0
707
1997* 49 106
557 26
738
0
0
0
0
0
738
1998* 68 92
590 24
774
0
0
0
0
0
774
1999* 79 74
624 24
801
0
0
0
0
0
801
2000* 62 68
569 34
733
0
0
0
0
0
733
Source : DOF 1982 to 2002. 1993*-2000* = Luring purse seine and Thai purse seine were combined.
Previously, anchovy purse seine was operated only during the daytime. However, this gear type is
now also operated during the night with artificial light to attract schools of fish. Fishing effort for this
gear type increased markedly following the introduction of the light fishing technique in 1985. The
number of anchovy purse seines in operation has increased steadily. However, the use of this gear
type at night has been illegal since 1990, when the Ministry of Agriculture and Cooperatives issued a
regulation prohibiting the use of small mesh (less than 2.5cm) purse seines during the night. The
number of anchovy purse seines registered by fishing boat size in the Gulf of Thailand from 1980 to
2000 is shown in Table 6.
Table 6 Number of Anchovy purse seines registered by fishing boat size in the Gulf of
Thailand from 1980 to 2000.
Year
Anchovy purse seine
< 14 m
14-18 m
18-25 m
> 25 m
1980
28
14
14
5
0
1981
13
6
4
3
0
1982
24
12
6
6
0
1983
37
21
11
5
0
1984
53
24
15 14
0
1985 118
51
22 40
0
1986
91
28
25 38
0
1987
47
21
13 13
0
1988
68
31
18 19
0
1989
76
35
25 16
0
1990 105
43
36 25
1
1991 237
93
90 51
0
1992 228
92
83 50
0
1993 255
90
84 81
0
1994 285
112
89 84
0
1995 323
193
74 54
4
1996 370
245
67 57
2
1997 419
285
91 43
0
1998 290
170
71 49
0
1999 333
177
91 64
0
2000 403
222 104 77
1
Source : DOF 1982 to 2002.
Reversing Environmental Degradation Trends in the South China Sea and Gulf of Thailand
12 NATIONAL REPORT ON FISHERIES THAILAND
1.1.2.3 Gill net
Table 7 shows the number of gill nets registered by size of fishing boat in the Gulf of Thailand from
1980 to 2000. Thai fishers commonly use 2 types of gill net, namely the Spanish mackerel drift gill net
and the mackerel encircling gill net. The Spanish mackerel drift gill net, which is usually 5 to 10km
long, is used to catch Spanish mackerel and small tuna. The number of fishing boats using this gear
has been relatively constant. The mackerel encircling gill net is popular for catching Indo-Pacific
mackerel, and is operated in a fashion similar to the purse seine, although without purse line. The use
of this gear has declined since 1987.
1.1.2.4 Other gears
Most other fishing gears are small scale and operated in shallow coastal waters. These gears include
push nets, trolled lures, hand lines, longlines, traps, and small gill nets. The number of push net units
decreased from 1,644 in 1980 to 490 in 1988, although after consent was given to the registration of
trawlers and push netters in 1989, total push net use increased significantly (Table 8). Table 9
contains information regarding the number of other small scale fishing gears, including crab gill nets,
shrimp trammel nets, others gill nets, squid falling nets, anchovy falling nets, and longline.
Interestingly, the use of shrimp trammel nets decreased, whilst that of squid and anchovy falling nets
increased. Trap fisheries for squid and crab play an important role in the Gulf of Thailand's small-
scale fisheries, however, the registration of traps is not required under Thai fisheries law.
Table 7
Number of gill nets registered by size of fishing boat in the Gulf of Thailand from
1980 to 2000.
Spanish mackerel drift gill net
Mackerel encircling gill net
Grand
Year
<14 m
14-18 m 18-25 m
>25 m
Total
<14 m
14-18 m
18-25 m
>25 m
Total
Total
1980 86 142
44 0
272
174
73
58
0 305 577
1981 53 166
82 0
301
125
76
56
0 257 558
1982 47 148
55 0
250
103
70
54
0 227 477
1983
40
134
60
0
234
36
57
48
0
141
375
1984
50
116
76
1
243
87
40
40
0
167
410
1985 45 135
75 1
256
113
48
49
0 210 466
1986 37 148 106 6
297
106
41
45
0
192
489
1987 36 152 138 1
327
97
36
86
0
219
546
1988 45 172 175 9
401
54
28
46
0
128
529
1989
29
116
71
0
216
52
33
25
0
110
326
1990 36 112
85 6
239
44
21
35
0 100 339
1991 45 119 105 10
279
41
21
26
0
88
367
1992 45 120 124 11
300
40
19
12
0
71
371
1993
32
86
77
3
198
43
25
24
0
92
290
1994
21
96
96
7
220
36
34
28
1
99
319
1995
26
88
155
18
287
29
21
27
0
77
364
1996
24
82
111
15
232
84
21
19
0
124
356
1997
51
91
81
11
234
86
28
30
0
144
378
1998
21
72
106
10
209
75
25
28
2
130
339
1999
23
62
90
6
181
41
35
37
1
114
295
2000
21
44
65
2
132
19
23
36
1
79
211
Source : DOF 1982 to 2002.
Reversing Environmental Degradation Trends in the South China Sea and Gulf of Thailand
NATIONAL REPORT ON FISHERIES THAILAND 13
Table 8 Number of push nets registered by size of fishing boat in the Gulf of Thailand from
1980 to 2000.
Year
< 14 m
14-18 m
18-25 m
> 25 m
Total
1980 1,579
64
1
0 1,644
1981
853
30
0
0
883
1982 1,209
35
0
0 1,244
1983
890
51
0
0
941
1984
750
27
0
0
777
1985
635
28
0
0
663
1986
536
32
11
0
579
1987
524
27
3
0
554
1988
458
30
2
0
490
1989
859
190
61
0
1,110
1990
868
193
58
0
1,119
1991
594
123
51
0
768
1992
436
96
30
0
562
1993
524
98
41
0
663
1994
451
68
24
0
543
1995
413
85
36
0
534
1996
488
93
39
0
620
1997
637
95
39
0
771
1998
590
125
61
0
776
1999
504
76
44
0
624
2000
493
81
39
0
613
Source: DOF 1982 to 2002.
Table 9 Number of other small scale fishing gears registered in the Gulf of Thailand from
1980 to 2000.
Year Crab Shrimp
Other
Squid
Anchovy
Long line
T o t a l
Gill Nets
Trammel Nets
Gill Nets
Falling Nets
Falling Nets
1 9 8 0
8 6 8
2 , 1 7 5
7 7 0
1 1 5
0
2 2 2
4 , 1 5 0
1 9 8 1
4 8 9
2 , 2 2 9
6 1 0
2 3 5
0
4 4
3 , 6 0 7
1 9 8 2
7 3 4
2 , 3 6 4
4 2 3
6 3 7
0
3 3
4 , 1 9 1
1 9 8 3
1 , 0 6 3
2 , 3 9 6
6 2 2
5 1 4
0
3 9
4 , 6 3 4
1 9 8 4
8 7 9
1 , 6 5 8
4 4 5
5 2 1
0
4 4
3 , 5 5 5
1 9 8 5
6 2 9
2 , 2 4 0
3 9 6
6 6 2
0
5 2
3 , 9 7 9
1 9 8 6
1 , 2 6 6
2 , 0 4 4
8 2 3
6 5 2
0
4 8
4 , 8 3 3
1 9 8 7
9 0 7
2 , 6 4 1
6 2 3
7 7 5
0
4 7
4 , 9 9 3
1 9 8 8
9 9 5
1 , 9 0 3
6 8 4
1 , 1 0 2
0
1 1 5
4 , 7 9 9
1 9 8 9
4 6 0
1 , 0 8 4
4 6 3
9 1 5
0
3 1
2 , 9 5 3
1 9 9 0
9 1 1
1 , 1 4 1
5 4 9
1 , 0 2 7
0
3 0
3 , 6 5 8
1 9 9 1
1 , 1 8 5
9 7 3
4 6 3
1 , 2 4 2
0
3 3
3 , 8 9 3
1 9 9 2
7 3 1
9 3 7
4 6 7
1 , 4 3 5
0
5 7
3 , 6 2 7
1 9 9 3
1 , 0 5 1
1 , 4 1 1
7 2 4
1 , 7 2 3
0
5 0
4 , 9 5 9
1 9 9 4
1 , 2 6 1
1 , 0 9 9
6 8 8
1 , 8 8 1
0
2 7
4 , 9 5 6
1 9 9 5
1 , 3 9 6
7 5 0
5 6 5
1 , 7 5 6
0
3 8
4 , 5 0 5
1 9 9 6
1 , 3 1 8
7 5 5
5 7 7
1 , 5 8 4
0
3 7
4 , 2 7 1
1 9 9 7
1 , 1 4 7
5 3 0
6 0 8
1 , 6 6 2
0
3 8
3 , 9 8 4
1 9 9 8
9 7 5
6 2 4
6 0 5
1 , 3 5 6
3 5 8
3 4
3 , 9 5 2
1 9 9 9
7 6 2
4 1 6
8 1 0
1 , 0 9 5
5 0 7
3 5
3 , 6 3 5
2 0 0 0
8 1 6
5 2 8
1 , 2 3 1
1 , 8 8 0
7 7 8
3 2
5 , 2 6 5
Source: DOF 1982 to 2002.
Reversing Environmental Degradation Trends in the South China Sea and Gulf of Thailand
14 NATIONAL REPORT ON FISHERIES THAILAND
1.1.3 Economic value of catch
The value of catch from commercial and small-scale fisheries has followed an increasing trend. This
was especially the case during the 1990s, when total catch value increased by 105%. Commercial
fishing contributes to about 90% of marine catch, with the balance flowing from small-scale/artisanal
fisheries. In 2000, the percentage contribution to total catch value by key groups of marine fish was
pelagic fish (28.69%), demersal fish (13.63%), other food fish (7.75%), trash fish (4.45%), shrimps
(18.97%), crabs (6.63%), cephalopods (18.75%), and molluscs (0.22%) (Table 10). The species of
main economic importance are Indo-Pacific mackerel and longtail tuna.
1.1.4 Importance of the fisheries sector in terms of employment & dependence
1.1.4.1 Contribution of the fisheries sector to GDP
Thailand's gross domestic product (GDP) was estimated at 4,598 billion baht in 1996, of which the
fishery sector contributed 87.8 billion baht or 1.9%, representing a decline from the 2% average
observed from 1994 to 1996. The key factor driving the diminished contribution of the fisheries sector
to GDP was rapid growth in the manufacturing and service sectors. These factors were partially offset
by increases in real fish prices. Although the fisheries sector makes a relatively small contribution to
Thailand's GDP, it makes an important contribution to export earnings and employment. Fish is also a
central part of the diet of most Thai people (Table 11).
Reversing Environmental Degradation Trends in the South China Sea and Gulf of Thailand
NATIONAL REPORT ON FISHERIES THAILAND 15
Table 10
Value of production of important marine fishes from the Gulf of Thailand from 1990 to 2000.
Value: 1,000 baht
Species
group\Year
1990 1991 1992 1993 1994 1995 1996 1997 1998 1999 2000
Grand total
16,978,200
19,667,600
25,323,400
25,450,674
25,377,702 31,019,319
29,819,652
30,304,144
30,807,616
32,615,351
34,732,645
Sub-total fishes
9,373,500
10,176,000
15,624,500
16,039,783
13,984,172 17,058,748
16,537,016
16,061,191
16,880,065
19,412,177
18,936,415
Sub-total pelagic fishes
5,631,400
6,244,200
8,038,700
7,226,628
8,203,193
9,110,821
8,354,057
8,734,353
9,901,435
10,465,862
9,964,142
Indo-Pacific mackerel
1,032,900
759,000
1,425,700
1,124,009
1,638,035
2,341,053
2,178,558
2,528,946
3,392,963
3,327,371
3,032,544
Indian mackerel
228,400
141,900
338,700
369,353
897,246
716,346
418,439
330,464
347,620
491,934
467,949
King mackerel
353,100
299,600
372,200
545,590
438,122
509,769
522,453
641,813
601,352
698,370
608,466
Longtail tuna
1,618,100
1,877,800
1,589,600
1,194,876
415,882
582,360
646,380
757,746
973,679
1,170,055
1,204,216
Eastern little tuna+Frigate tuna
685,300
940,200
1,358,200
1,011,030
952,295
580,340
733,024
638,355
792,648
911,549
784,776
Round scads
64,500
255,900
415,000
461,865
392,754
597,776
611,245
618,255
824,978
832,235
804,643
Hardtail scad
111,400
104,600
178,900
191,954
225,923
135,353
97,616
69,283
136,080
126,322
154,469
Trevallies
283,000
574,900
566,600
517,132
727,948
676,728
694,325
639,483
578,409
572,608
463,714
Big-eye scad
136,900
100,700
160,100
130,664
363,445
337,880
245,330
199,904
174,503
253,549
290,690
Sardinellas
356,600
346,900
498,400
401,610
597,445
681,897
823,417
829,242
771,474
638,854
675,249
Anchovies
363,000
402,800
478,400
481,987
487,825
718,879
541,109
441,234
543,033
546,384
606,145
Other pelagics fishes
398,200
439,900
656,900
796,558
1,066,273
1,232,440
842,161
1,039,628
764,696
896,631
871,281
Sub-total demersal fishes
1,043,400
1,495,800
2,072,500
2,918,868
3,249,117
4,318,443
4,266,125
4,094,028
4,161,258
4,987,303
4,732,770
Treadfin breams
213,600
426,500
657,100
741,749
772,307
1,230,729
1,205,649
856,062
943,757
1,075,892
1,122,468
Lizard fishes
73,100
152,100
224,500
317,848
248,534
518,740
482,506
684,501
351,921
586,302
392,126
Snappers
100,000
122,800
225,900
473,263
389,988
472,251
526,294
462,981
677,911
515,427
286,138
Big-eyes
112,200
173,100
250,700
368,889
396,249
516,626
703,093
668,733
791,212
726,711
507,446
Grouper
67,700
98,600
200,500
202,689
490,088
458,000
409,290
441,374
446,547
502,858
449,440
Reversing Environmental Degradation Trends in the South China Sea and Gulf of Thailand
16 NATIONAL REPORT ON FISHERIES THAILAND
Table 10 cont. Value of production of important marine fishes from the Gulf of Thailand from 1990 to 2000.
Value: 1,000 baht
Species
group\Year
1990 1991 1992 1993 1994 1995 1996 1997 1998 1999 2000
Other demersal fishes
476,800
522,700
513,800
814,430
951,951
1,122,097
939,293
980,377
949,910
1,580,113
1,975,152
Other food fishes
632,000
771,800
4,033,500
4,094,427
1,051,659
2,003,807
2,169,473
1,800,653
1,324,253
2,499,315
2,692,976
Trash fishes
2,066,700
1,664,200
1,479,800
1,799,860
1,480,203
1,625,677
1,747,361
1,432,157
1,493,119
1,459,697
1,546,527
Sub-total shrimp & prawn
2,906,400
2,849,300
3,080,200
3,175,616
4,591,440
5,460,029
4,809,660
5,661,549
4,890,473
4,659,472
6,589,409
Banana shrimp
1,274,300
903,100
1,125,000
1,029,841
1,758,716
1,769,205
1,245,736
1,405,857
1,677,719
1,829,478
2,389,591
Jumbo tiger prawn
19,100
40,200
50,900
52,789
92,086
88,899
149,360
147,950
87,119
290,324
549,430
Tiger shrimp
57,100
47,500
50,000
49,009
141,609
155,606
232,689
267,281
232,403
181,543
254,453
King prawn
109,500
121,500
156,900
119,569
195,670
242,366
210,050
196,690
148,813
167,252
274,643
Other shrimp
1,382,300
1,637,600
1,622,400
1,817,504
2,319,616
3,035,584
2,692,477
3,371,045
2,443,166
1,969,421
2,816,882
Flathead Lobster
58,400
89,100
70,000
101,449
71,931
161,929
272,108
265,686
281,772
183,954
265,429
Mantis shrimp
5,700
10,300
5,000
5,455
11,812
6,440
7,240
7,040
19,481
37,500
38,981
Sub-total crabs
900,000
1,307,000
1,330,000
1,296,410
1,549,157
1,935,011
1,837,952
1,685,555
1,694,761
1,950,597
2,304,265
Swimming crabs
784,800
1,086,600
1,136,600
1,028,739
1,308,186
1,615,230
1,539,411
1,549,096
1,537,582
1,646,697
2,046,076
Mud crabs
94,300
208,400
184,900
240,147
202,458
277,560
275,000
107,485
100,809
253,018
237,295
Other crabs
20,900
12,000
8,500
27,524
38,513
42,221
23,541
28,974
56,370
50,882
20,894
Sub-total squid & cuttlefish
3,207,100
4,769,300
4,599,700
4,679,596
4,910,351
6,315,248
6,359,422
6,539,379
6,891,823
6,147,804
6,511,065
Squid
1,578,000
2,302,600
2,132,100
2,375,625
2,484,167
3,352,074
3,153,216
3,365,433
3,975,005
3,573,316
3,682,020
Cuttlefish
1,473,800
2,182,000
2,244,800
2,094,437
2,319,147
2,763,305
2,935,618
2,851,561
2,247,935
2,212,092
2,533,609
Octopus
155,300
284,700
222,800
209,534
107,037
199,869
270,588
322,385
668,883
362,396
295,436
Sub-total molluscs
584,700
538,900
637,500
251,134
283,193
225,908
249,123
304,805
343,252
287,909
287,909
Others 6,500
27,100
51,500
8,135
59,389
24,375
26,479
51,665
107,242
157,392
77,762
Source : Source: DOF 1988 to 2002; 2003a. (rate of exchange; See Annex 1)
Reversing Environmental Degradation Trends in the South China Sea and Gulf of Thailand
NATIONAL REPORT ON FISHERIES THAILAND 17
Table 11
Contribution of fisheries and other sectors to the GDP of Thailand from 1989 to 1996.
1989 1990 1991 1992 1993 1994 1995 1996
Industrail Origin
%
%
%
%
%
%
%
%
M.bahts
M.bahts
M.bahts
M.bahts
M.bahts
M.bahts
M.bahts
M.bahts
Gross Domestic Production (GDP)
1,620,882 100.0 1,895,034 100.0 2,506,635 100.0 2,830,914 100.0 3,170,258 100.0 3,630,805 100.0 4,188,929 100.0 4,598,288 100.0
Agriculture
279,094 17.2
273,973 14.5
317,085 12.6
348,127 12.3 329,878 10.4
390,233 10.7
464,171 11.1
507,339
11.0
Crops
174,809 10.8
159,992 8.4
181,918 7.3
197,058 7.0 166,564 5.3
206,264 5.7
258,432 6.2
289,570
6.3
Livestock
29,797 1.8
32,770 1.7
37,430 1.5
35,001 1.2 32,275 1.0
35,802 1.0
42,599 1.0
44,457
1.0
Fisheries
27,449 1.7
32,214 1.7
43,139 1.7
55,764 2.0 67,410 2.1
76,138 2.1
83,097 2.0
87,800
1.9
Forestry
8,181 0.5
6,665 0.4
7,110 0.3
6,705 0.2 6,443 0.2
6,145 0.2
6,098 0.1
6,291
0.1
Agricultural services
10,678 0.7
10,795 0.6
10,958 0.4
11,525 0.4 11,149 0.4
12,477 0.3
12,779 0.3
13,519
0.3
Simple agricultural and processing
products
28,180 1.7
31,537 1.7
36,530 1.5
42,074 1.5 46,037 1.5
53,407 1.5
61,166 1.5
65,702
1.4
Source : NESDB.
Reversing Environmental Degradation Trends in the South China Sea and Gulf of Thailand
18 NATIONAL REPORT ON FISHERIES THAILAND
1.1.4.2 Contribution of the fishing industry to income and employment
Thailand's labour force was estimated at 35.6 million in 1998, of which some 15.4 million (43%) were
employed in the agricultural sector (including fisheries). Results from the 1995 Marine Fishery Census
indicated that the total number of fishers and employees involved in Thailand's marine capture
fisheries was 111,479. There were 45,898 persons engaged in coastal aquaculture (Table 12).
Table 12
Thailand's fisheries sector employment in 1995.
Type of employment
No. of Fishers, Fish farmers and Employees
Marine capture 1/
111,479
Coastal aquaculture 2/
45,898
Inland aquaculture 3/ 404,334
Related fisheries industry 4/ 220,370
Total 782,091
Sources: 1/, 2/ The 1995 Marine Fishery census 3/ No. of farmer = (no. of fishfarm x 2 persons)
4/ Ministry of Labour and Social Welfare
On the other hand, no fishery census has been conducted for Thailand's inland fishery, thus no data
has been compiled for reference. It is difficult to estimate employment in Thailand's inland fisheries.
However, most rice-growing farmers catch fish, and could potentially be categorised as part-time
inland fishers. Millions of farmers catch freshwater fish for household consumption.
A survey regarding freshwater fish farm production has been conducted since 1974. However, the
number of aquaculturists and employees were not included in the survey, and information was not
collected for many farms. The survey did indicate that the number of freshwater fish farms increased
continuously from 61,980 farms in 1990 to 202,167 farms in 1995. On the basis that each farm
provides employment for 2 people, approximately 404,334 persons were involved in freshwater
aquaculture in 1995.
Additionally, the fisheries sector supports substantial levels of employment in related industries,
including fish processing, cold storage, fishmeal, ice making, and boat construction. Total
employment in these industries was estimated at 211,682 in 1995.
1.1.4.3 Contribution of the fisheries sector to foreign exchange earning
The contribution of Thailand's fishing and fish-processing industries to export earnings has increased
steadily in recent years (Table 13). The positive trade balance in fish and fish products increased from
6,874 million baht in 1980 to 151,755 million baht in 2000. Although the industry relies on imported
inputs such as diesel fuel and netting material, earnings remain substantial, particularly in relation to
the level of employment in the industry. Fishery product exports in 2000 totalled 185,750 million baht,
equivalent to 69% of total agriculture exports (200,795 million including fish), and 7.3% of total exports
(1,898,276 million baht).
Table 13
The trade balance of Thailand's fisheries sectors from 1980 to 2000.
Import
Export
Trade
balance
Year
Q (tonnes)
(million baht)
Q (tonnes)
(million baht)
Q (tonnes)
(million baht)
1980
43,777
551.7
274,753
7,425.7
230,976
6,874
1981
47,174
550.0
320,325
9,102.3
273,151
8,552
1982
46,215
725.5
316,679
11,230.7
270,464
10,505
1983
58,942
1,093.2
344,899
12,677.2
285,957
11,584
1984
119,064
2,119.3
411,722
15,080.9
292,658
12,962
1985
152,707
3,857.5
466,219
18,527.7
313,512
14,670
1986
268,089
7,590.0
602,486
26,829.4
334,397
19,239
1987
227,327
7,016.9
663,650
32,654.3
436,323
25,637
1988
347,666
14,713.1
798,572
44,437.3
450,906
29,724
1989
455,755
19,066.7
875,293
53,704.9
419,538
34,638
1990
507,737
20,652.7
904,973
61,070.5
397,236
40,418
1991
724,668
27,352.9
1,087,395
78,463.2
362,727
51,110
1992
714,012
24,568.7
1,106,141
82,469.3
392,129
57,901
1993
760,919
21,629.4
1,115,078
910,18.3
354,159
69,389
1994
893,588
21,328.9
1,214,946
110,285.2
321,358
88,956
1995
872,818
21,924.7
1,192,560
116,577.8
319,742
94,654
1996
797,389
22,425.0
1,146,949
110,781.3
349,560
88,356
1997 710,115
27,438.9
1,181,255
138,624.0
471,140
111,185
1998 728,960
36,497.2
1,312,250
176,311.0
583,290
139,814
1999 930,885
33,289.3
1,394,104
165,718.1
463,219
132,429
2000 842,676
33,995.4
1,356,734
185,750.4
514,058
151,755
Sources: DOF, 1996; 2003a.
Reversing Environmental Degradation Trends in the South China Sea and Gulf of Thailand
NATIONAL REPORT ON FISHERIES THAILAND 19
1.1.4.4 Contribution of the fishery sector to domestic nutrition
The contribution of fish and other foods to the Thai diet in 1995 is shown in Table 14a. Fish is the
primary source of animal protein for most Thai people, particularly in coastal provinces. From 1980 to
1997, the apparent annual per capita consumption of fish in Thailand averaged 24 kg, fluctuating
between highs of 32.8 to 33.8kg in 1994 and 1995, and lows of 18.8 to18.9kg in 1987 and1988
(Table 14b).
Table 14a
Thailand's per capita food intake in1995.
Items
Whole country
Urban area
Rural area
grams/day % grams/day % grams/day %
Cereals, roots and tubers
305.7
41.4
281.4
37.4
312.3
42.4
Sugar and honey
13.7
1.9
14.6
1.9
13.4
1.8
Pulses, nuts and oil seeds
17.1
2.3
19.7
2.6
16.3
2.2
Vegetables
113.2 15.3 101.4 13.5 116.7 15.9
Fruits
76.8
10.4
93.9
12.5
72.0
9.8
Oils and fats
14.0
1.9
12.3
1.6
14.4
2.0
Meats
71.4
9.7
83.4
11.1
68.1
9.3
Fish
46.6
6.3
47.3
6.3
46.5
6.3
Eggs
21.4
2.9
17.2
2.3
22.5
3.1
Milk
29.3
4.0
44.6
5.9
25.1
3.4
Others
29.9
4.0
35.8
4.8
28.4
3.9
Total 739.1
100.0
751.6 100.0 735.7 100.0
Source: Department of Health, 1997.
Table 14b
Apparent consumption of fish in Thailand from 1980 to 1997.
Year Total Fish used
Trade Apparent
consumption
production
for
Import
Export
Total
Population
Consumption
(1,000 tonnes)
fishmeal
(1,000 tonnes) (1,000 tonnes)
consumption
(million)
per capita
(1)
(1,000 tonnes)
(3)
(4)
(1,000 tonnes)
(6)
(kg)
(2)
(5)=(1)-(2)+(3)-(4)
(7)=(5)/(6)
1980
1,792
773
140
227
932.3
47.0
19.8
1981
1,989
797
152
269
1,076.1
47.6
22.6
1982
2,121
813
128
338
1,098.4
48.4
22.7
1983
2,255
803
116
405
1,162.4
49.5
23.5
1984
2,135
758
166
547
996.4
50.5
19.7
1985
2,225
776
207
639
1,015.8
51.5
19.7
1986
2,536
976
362
847
1,074.2
52.5
20.4
1987
2,779
1,106
220
881
1,012.7
53.5
18.9
1988
2,630
956
343
993
1,023.8
54.6
18.8
1989
2,740
980
436
1,095
1,100.7
55.2
19.9
1990
2,786
978
475
1,174
1,108.7
56.1
19.8
1991
2,958
982
664
1,359
1,281.0
56.9
22.5
1992 3,240
1,001
637
1,393
1,482.6
57.6
25.7
1993 3,385
1,027
788
1,438
1,708.5
58.5
29.2
1994
3,523
930
883
1,535
1,940.5
59.1
32.8
1995
3,573
916
864
1,510
2,010.7
59.5
33.7
1996
3,500
900
737
1,438
1,899.5
60.1
31.6
1997*
3,460
900
728
1,645
1,642.7
60.8
27.0
Avg.
2,684
903
426
911
1,295.4
53.5
24.0
Source: Department of Fisheries, 1982 to 1999.
Note: * Preliminary data.
Reversing Environmental Degradation Trends in the South China Sea and Gulf of Thailand
20 NATIONAL REPORT ON FISHERIES THAILAND
2.
SPECIES OF REGIONAL, GLOBAL AND/OR TRANSBOUNDARY SIGNIFICANCE
According to the National Fisheries Statistics collected by the Fisheries Economics Division of the
Department of Fisheries, catches are sorted by species and species group. The quantities and values
of 11 pelagic fish groups, 5 groups of demersal fish, 7 groups of shrimps and lobsters, 3 groups of
crabs, and 3 groups of cephalopods are shown in Tables 3 and 10. The important landing ports of the
Fish Market Organization (FMO) are shown in Figure 3. However, there are many private landing
ports scattered along the Gulf of Thailand coast.
In terms of transboundary significance, a joint Thai-Malaysian-German trawl survey was conducted off
the eastern coast of the Malaysian Peninsular in 1967. The survey area extended from the Thai-
Malaysian border to the southernmost tip of the Malaysian Peninsular. The results of the survey
indicated that catches declined as the survey moved northward to the Thai border. Throughout the
survey, a total of 380 species were collected, of which 42 species (including Chiloscyllium griseum,
Carcharinus spallanzani, and Rhinobatus ligonifer) were caught only in Thai waters, whilst another 42
species (including Dasyatis brocki, Sardinella melanura, Batrachphalus mino, and Lutianus rangus)
were caught only in Malaysian waters. The rest of the species were caught in both regions
(Wongratana 1968). However, in both Thai and Malaysian waters the most prevalent group of fish
included species of Leiognathidae, inhabiting depths from 10 to 50m. Next to this, in terms of
abundance, were fish of Trygonidae, which were found mainly in Malaysian waters in depths ranging
from 10 to 40m. In Thai waters, Nemipterus spp. was the next most prevalent group. During the
survey, tagging of some important demersal fish was also conducted. 23 Nemipterus hexodon, 2 N.
furcosus, 85 Priacanthus spp., 342 Scolopsis cancellatus, and Lutianus malabaricus were tagged and
released in Malaysian waters (Marine Fisheries Laboratory and Fisheries Research Institute 1967).
However, there are no reports of these fish being recaptured. The results of acoustic surveys
conducted by the Exploratory Fishing Division of Thailand's Department of Fisheries in the southern
part of the Gulf in 1979, very clearly showed that the pelagic traces consisted of a mixture of
Rastrelliger kanagurta, Caranx crumenophthalmus, Decapterus resselli, and Sardinella sp.
(SEAFDEC 1981a). Rastrelliger spp., Scomberomorus spp., Decapterus spp., Sardinella spp.,
Stolephorus spp., Megalaspis cordyla, Selar spp. and Selaroides spp. are economically important in
both Thailand and Malaysia. It is also well known that mackerels (Rastrelliger spp.) and round scads
(Decapterus spp.) are widely distributed in areas of the South China Sea.
In 1993, a joint survey was carried out in the Joint Development Area (JDA) between Thailand and
Malaysia by research trawlers of both countries at depths from 40 to 70m. More than 8 species of
Nemipterus were found, including Nemipterus mesoprion, N. hexodon, N. marginatus, N.
nematophorus, N. nemuerus, N. peronii, N. tolu and Nemipterus spp. The most common species was
N. mesoprion, followed by N. nematophorus and N. marginatus (Uraiwan and Boonvanich 1993).
Reversing Environmental Degradation Trends in the South China Sea and Gulf of Thailand

NATIONAL REPORT ON FISHERIES THAILAND 21
99° 100° 101°
104°
102° 103°
105°E
14°N
BANGKOK
Samut Prakan
Samut Sakhon
Chachoengsao
Samut Songkhram
Chon Buri
13°
Phetchaburi
Rayong Chanthaburi
Hua Hin
Trat
Pran Buri
12°
Prachuap Khiri Khan
11°
Chumphon
Langsuan
10°
9°
Surat Thani
Nakhon Si Thammarat
8°
7°
Songkhla
Pattani
Narathiwat
Landing Port
6°
Figure 3
The important fish landing ports (FMO) along the coast of the Gulf of Thailand.
A joint fishery resources survey in the former overlapping jurisdictional area between Thailand and
Viet Nam was conducted in 1997 and 1998 using bottom trawl and bottom vertical longline. The
survey showed clear evidence of transboundary significance for many dominant species/species
group that are distributed throughout Thai and Vietnamese waters. The dominant economically
important species in waters of both countries included Selar ctuminophthalmus, Rastrelliger
kanagurta, Saurida elongata, S. undosquamis, Priancanthus macracanthus, P. tayenus, Nemipterus
nematophorus, Upeneus sulphurus, Siganus oramin, Seriolina nigrofasciata, Lutjanus sanguineus,
Pristipomoides multidens, Ophisurus crocodilinus, Loligo chinensis, L. duvauceli, and Sepia spp.
Reversing Environmental Degradation Trends in the South China Sea and Gulf of Thailand
22 NATIONAL REPORT ON FISHERIES THAILAND
2.1
Ranking of importance in terms of landings, value, and status
2.1.1 Landings (by site or province) (mt)
Data regarding economically important species/groups of species landed by site or province, as well
as by major fishing port for the year 2000 are provided in Table 15. The ranking of importance is
based on the magnitude of catch. In terms of quantity, threadfin bream, Indo-Pacific mackerel, coastal
tuna, bigeye snapper, squids, sardines, round scad, and anchovies are important. In terms of both
quantity and value of landings, Songkhla, Pattani, Samutprakan, Nakorn Si Thammarat, Trat, and
Samut Sakhon are the most important landing ports. It is usually clear that Thai fishing boats landing
their catch in these ports have been fishing in transboundary areas.
2.1.2 Local market value (Local currency, note year)
The identification of species or species groups of economic importance involves consideration of
wholesale value and export potential. Some resources have not yet been exploited commercially,
however, may have potential for future development; they are also included in the list of commercially
important species or species groups in Thailand. According to the 2000 National Fisheries Statistics,
squid, cuttlefish, Indo-Pacific mackerel, shrimps, coastal tunas, and threadfin bream were important in
terms of local market value (Table 16).
In 2000, marine capture fishery production accounted for 85.6% of the total marine fishery production,
which amounted to 3.24 million metric tonnes with a value of 142,004 million baht. The utilisation of
marine fishery products included fresh consumption (18.8%), fresh, chilled and frozen (23.8%),
canned (19.7%), steamed or smoked (0.4%), fish sauce (3.2%), shrimp paste (0.1%), salted (5.7%),
dried (2.0%), fish meal (25.8%), and other (0.5%). The important marine fish species with relatively
high prices at major landing ports in 2000 are shown in Table 17.
2.1.3 Status (endangered, threatened, rare etc. IUCN criteria)
Several species of marine resources in the Gulf of Thailand are becoming rare, endangered, and
perhaps threatened with extinction, due to increased human use, the resultant changes in the
environment, and ineffective conservation and/or enforcement measures.
Assessment of the potential yields of fish stocks in the Gulf of Thailand has clearly shown that
demersal fishery resources, particularly those in coastal areas, have been overexploited since 1973.
Populations of dominant demersal species in the area, namely Nemipterus hexodon, Priacanthus
tayenus, Saurida undosquamis and S. elongate, all show signs of overexploitation. Among the pelagic
fish species, Indo-Pacific mackerel, sardines, anchovies, round scad, and coastal tuna stocks have
been fully exploited since the early 1980s. However, from a survey conducted in 1995, it is unclear
whether the reduction in catches of a number of species collected during the survey indicates that
those species are becoming endangered or vulnerable.
Regarding threatened species of marine fauna, even though only higher groups of animals such as
reptiles and mammals have been listed as rare or threatened species, it is believed that several
species of marine fish and invertebrates are becoming rare, particularly those inhabiting coral reefs
that are being destroyed by intense or destructive fishing practices.
The marine fauna officially listed as being threatened is highlighted in Appendix 2. This list is based
on IUCN criteria. There is a paucity of information regarding the life history and population dynamics
of threatened species, which hinders the formation, and implementation of effective conservation
programmes.
Marine mammals: including whale, dolphin, and dugong. 3 species are critically endangered. 18
species are endangered.
Dugong: due to their gentle nature and slow movement, they may be accidentally caught by fishing
nets. This species is considered very rare. One of these is a critically endangered species.
Reptiles: among them, marine turtle are considered important. The 5 species of reptile are critically
endangered species.
In the Gulf of Thailand, the abundance of many fish species has declined. 3 species are endangered,
36 species are vulnerable, and 3 species are threatened.
Reversing Environmental Degradation Trends in the South China Sea and Gulf of Thailand
NATIONAL REPORT ON FISHERIES THAILAND 23
Table 15
Landings in metric tonnes for main species/group of species in each province in 2000.
Unit: Metric tonnes
Province-port
Total
Indo-
Indian
King
Coastal
Round
Hardtail Trevallies Sardinellas Anchovies Threadfin Lizard
Snapper Big-eye Banana School
Other
Crabs Squid Cuttlefish Octopus
Others
Species
(mt)
Pacific
mackerel mackerel
tuna
scads
scads
bream
fish
shrimp
prawn shrimps
mackerel
Trat 95,228
603
225
174
126
8
224
309
41
45,636
4,552
58
0
2,033
80
332
1,651
503
1,095
1,408
1,076
35,094
(5)
(9)
(8)
(9)
(9)
(9)
(10)
(8)
(10)
(1)
(5)
(9)
(7)
(8)
(7)
(6)
(6)
(8)
(7)
(4)
(6)
Chanthaburi 2,931
45
19
11
0
0
0
27
0
6
684
60
12
400
53
84
75
19
113
105
39
1,107
(14)
(13)
(9)
(11)
(11)
(5)
(9)
(8)
(8)
(9)
(10)
(11)
(16)
(13)
(12)
(13)
(12)
(15)
Rayong 78,501
4,603
6,880
456
11,981
2,701
716
13
2,309
6,051
3,487 1,770
267
2,659
16
11
81
102
2,701
375
215
31,107
(7)
(7)
(2)
(7)
(2)
(2)
(5)
(12)
(6)
(2)
(6)
(5)
(6)
(6)
(12)
(15)
(15)
(11)
(6)
(10)
(10)
(7)
Chonburi 25,657
159
0
0
481
0
256
3,730
733
1,496
60
0
0
100
307
525
5,798
492
1,886
1,608
585
7,441
(10)
(10)
(7)
(9)
(3)
(7)
(3)
(14)
(10)
(4)
(4)
(1)
(7)
(7)
(6)
(7)
(11)
Chachoengsa
2,247
0 0 0
0
0
0
0
0
0
0
0
0
0
97
199
327
0
19
17
0
1,588
o
(15)
(7)
(8)
(12)
(15)
(16)
(14)
Samut
213,944
1,323
1,076
2,215
2,554
1,382
987
3,236
0
0
17,032 11,924
2,807
13,626
12
662
611
1,084 10,657
8,881
1,104 132,771
prakan
(3)
(8)
(7)
(1)
(4)
(3)
(4)
(4)
(2)
(2)
(1)
(2)
(13)
(3)
(9)
(2)
(3)
(3)
(5)
(2)
Samut
87,489
8,214
1,163
911
0
17
1,519
2,664
605
1,215 1,327
759
4,465
12
65
1,038
544 11,969
9,746
5,126
36,130
sakhon
(6)
(3)
(5)
(5)
(8)
(2)
(5)
(8)
(7)
(6)
(5)
(4)
(13)
(12)
(7)
(5)
(2)
(2)
(1)
(5)
Samut
5,357
121
0 1
0
0
0
96
246
4
73
0
6
27
58
106
403
118
429
179
132
3,358
songkram
(12)
(12)
(12)
(10)
(9)
(6)
(12)
(9)
(12)
(9)
(10)
(11)
(10)
(10)
(11)
(11)
(12)
Phetchaburi 1,543
0 0 0
0
0
0
0
0
0
59
0
0
0
0
39
205
19
14
125
14
1,068
(16)
(13)
(14)
(13)
(13)
(16)
(12)
(14)
(16)
Prachuap
43,936
9,859
1,102
387
944
148
385
2,544
8,129
0
174
0
0
97
0
0
2,315
11
59
44
0
17,738
Khiri
(9)
(2)
(6)
(8)
(6)
(7)
(7)
(6)
(4)
(11)
(11)
(4)
(15)
(14)
(14)
(9)
Khan
Chumphon 61,328
7,917
1,480
623
274
816
363
2,017
10,949
0
1,001
347
31
1,619
433
449
2,290
278
851
569
295
28,726
(8)
(4)
(4)
(6)
(8)
(5)
(8)
(7)
(2)
(8)
(7)
(7)
(8)
(3)
(5)
(5)
(9)
(9)
(9)
(9)
(8)
Surat Thani
18,616
0 0 0
0
0
0
0
0
0
218
0
0
0
31
971
4,827
661
348
658
410
10,492
(11)
(10)
(11)
(2)
(2)
(4)
(11)
(8)
(8)
(10)
Nakhon Si
170,695
6,306
0 1,841
2,464
0
448
0
21,487
0
5,767 9,358
1,156
8,568
1,398
1,441
3,784
1,590
6,326
5,036
4,186
89,539
Thammarat
(4)
(5)
(4)
(5)
(6)
(1)
(3)
(3)
(3)
(3)
(1)
(1)
(3)
(1)
(4)
(4)
(2)
(4)
Songkhla 296,733
5,225
2,585
1,873
10,667
955
3,090
9,783
8,254
102
36,226 18,324
767
26,918
870
50
962
1,081 18,691
10,159
3,784 136,367
(1)
(6)
(3)
(3)
(3)
(4)
(1)
(1)
(3)
(4)
(1)
(1)
(4)
(1)
(2)
(13)
(8)
(3)
(1)
(1)
(3)
(1)
Pattani 280,108
22,765
10,720
2,212
35,733
47,427
1,411
5,153
4,567
0
5,289 1,897
1,912
2,678
274
360
610
458
4,099
3,734
872 127,937
(2)
(1)
(1)
(2)
(1)
(1)
(3)
(2)
(5)
(4)
(4)
(2)
(5)
(5)
(6)
(10)
(8)
(5)
(5)
(6)
(3)
Narathiwat 3,764
144
0 110
61
185
114
101
1
0
33
2
0
0
112
109
135
44
70
26
17
2,500
(13)
(11)
(10)
(10)
(6)
(11)
(9)
(11)
(15)
(10)
(6)
(9)
(14)
(12)
(13)
(15)
(13)
(13)
TOTAL
1,388,077
67,284 25,250 10,814
65,285
53,639
9,513
29,673
57,321
53,295
75,870 45,067
7,717
63,190
3,753
5,403 25,112
7,004 59,327
42,670 17,855 663,035
Source: DOF 2003b.
Reversing Environmental Degradation Trends in the South China Sea and Gulf of Thailand
24 NATIONAL REPORT ON FISHERIES THAILAND
Table 16
Ranking of local species market value by species/group of species for each province in 2000.
Unit: 1,000 baht
Province-port
Total
Indo-
Indian
King
Coastal
Round
Hardtail Trevallies Sardinellas Anchovies
Threadfin
Lizard
Snapper Big-eye Banana School
Other
Crabs Squid Cuttlefish Octopus Others
Species
(mt)
Pacific
mackerel mackerel
tuna
scads
scads
bream
fish
shrimp
prawn
shrimps
mackerel
Trat 863,870
6,415
2,369
6,823
1,911
71
2,335
3,230
205
232,155
56,597
290
0
20,701
19,124
57,380
36,360
9,688
46,736
53,132
24,607
285,652
(8)
(11)
(8)
(10)
(9)
(9)
(10)
(9)
(10)
(1)
(5)
(9)
(8)
(8)
(5)
(7)
(9)
(8)
(6)
(6)
(6)
Chanthaburi 64,062
680
450
500
0
0
0
480
0
36
11,143
878
777
5,504
11,955
13,111
3,484
364
3,621
3,219
821
5,200
(15)
(13)
(9)
(11)
(11)
(5)
(9)
(8)
(8)
(9)
(10)
(11)
(14)
(15)
(12)
(13)
(13)
(16)
Rayong 1,000,791
81,207 102,325
22,886
198,514
27,529
4,870
203
9,985
36,293
38,734
13,233
11,548
23,893
3,421
1,086
1,839
4,288
120,858
13,125
5,172
279,782
(6)
(6)
(2)
(6)
(3)
(2)
(7)
(12)
(6)
(2)
(6)
(5)
(6)
(6)
(12)
(15)
(16)
(11)
(6)
(10)
(10)
(7)
Chonburi 569,390
6,452
0
0 8,658
0
2,830
42,148
4,347
6,735
624
0
0
384
78,214
89,815 157,562
16,826
75,744
45,630
11,017
12,404
(10)
(9)
(7)
(8)
(4)
(7)
(3)
(13)
(11)
(5)
(3)
(2)
(6)
(7)
(7)
(7)
(12)
Chachoengsao 65,994
0
0
0
0
0
0
0
0
0
0
0
0
0
21,950
20,598
13,740
0
380
510
0
8,816
(14)
(7)
(8)
(11)
(16)
(16)
(15)
Samut prakan
4,978,271
34,927
21,305
67,454
50,569
16,377
11,611
52,457
0
0
199,276 185,708 126,315
109,008
2,605
219,044 182,430
65,944
597,317
499,450
43,135 2,393,339
(3)
(8)
(5)
(2)
(4)
(3)
(3)
(3)
(2)
(1)
(1)
(2)
(14)
(1)
(1)
(1)
(2)
(1)
(4)
(3)
Samut sakhon
2,252,016
167,732
18,307
59,215
0
238
10,633
39,960
4,143
16,258
11,282
44,022
44,650
3,060
9,550
58,858
21,508
533,065
419,505 179,979
610,051
(5)
(3)
(7)
(4)
(8)
(4)
(5)
(7)
(7)
(6)
(5)
(4)
(13)
(12)
(6)
(5)
(3)
(2)
(1)
(5)
Samut
99,869
4,414
0 21
0
0
0
920
1,500
21
891
0
540
355
14,875
14,303
8,727
4,663
20,635
8,531
3,790
15,683
songkram
(13)
(12)
(12)
(10)
(9)
(6)
(13)
(9)
(12)
(9)
(10)
(12)
(10)
(10)
(11)
(11)
(14)
Phetchaburi 34,208
0
0 0 0
0
0
0
0
0
590 0
0
0
0
3,967
2,761
1,024
472
4,977
380
20,037
(16)
(14)
(14)
(15)
(13)
(15)
(12)
(14)
(13)
Prachuap Khiri
632,200
288,998
19,779
15,394
22,528
2,582
4,904
30,644
56,595
0
2,088
0
0
970
0
0
32,467
495
2,456
1,254
0
151,046
Khan
(9)
(2)
(6)
(8)
(6)
(7)
(6)
(6)
(4)
(11)
(10)
(8)
(14)
(14)
(14)
(9)
Chumphon 916,385
164,492
23,653
22,361
5,484
12,188
5,151
30,634
59,915
0
13,462
4,659
1,854
22,397
90,831
39,802 151,727
12,303
35,155
23,226
8,909
188,182
(7)
(4)
(4)
(7)
(8)
(4)
(5)
(7)
(2)
(8)
(7)
(7)
(7)
(3)
(7)
(3)
(7)
(9)
(8)
(9)
(8)
Surat Thani
265,217
0
0 0 0
0
0
0
0
0
4,880 0
0
0
6,402
99,751
81,496
11,867
7,586
13,797
9,347
30,091
(11)
(10)
(11)
(2)
(4)
(8)
(11)
(9)
(8)
(11)
Nakhon Si
2,421,618
51,981
0 66,208 23,050
0
1,792
0
82,663
0
62,950
80,233
76,677
75,988 304,285
86,460
77,787
30,521
333,325
238,636 104,921
724,141
Thammarat
(4)
(7)
(3)
(5)
(11)
(1)
(4)
(3)
(3)
(3)
(1)
(4)
(5)
(3)
(4)
(4)
(3)
(4)
Songkhla 5,811,274
111,828
57,890
39,333
396,879
5,700
67,735 219,376
57,778
513
315,767 145,745
46,908
235,180 198,096
5,800
24,018
57,597
809,064
387,317 108,657 2,517,093
(2)
(5)
(3)
(5)
(2)
(5)
(1)
(1)
(3)
(4)
(1)
(2)
(4)
(1)
(2)
(13)
(9)
(2)
(1)
(3)
(2)
(2)
Pattani 6,126,522
641,687 263,864 200,773
802,662 408,948
29,966 110,845
45,256
0
150,213
14,253 148,144
44,145
90,675
50,396
22,011
27,407
226,014
187,084
28,830 2,633,349
(1)
(1)
(1)
(1)
(1)
(1)
(2)
(2)
(5)
(3)
(4)
(1)
(5)
(4)
(6)
(10)
(4)
(5)
(5)
(5)
(1)
Narathiwat 140,308
6,425
0 11,692
1,620
3,178
2,587
3,617
7
0
1,348
20
0
0
34,087
19,158
7,676
1,497
3,334
1,085
1,053
41,924
(12)
(10)
(9)
(10)
(6)
(9)
(8)
(11)
(12)
(10)
(6)
(9)
(13)
(12)
(13)
(15)
(12)
(10)
TOTAL 26,241,995 1,567,238 509,942 612,660 1,511,875 479,811 144,414 534,442
322,394
275,753
874,821 456,301 456,785
583,175 879,580
730,221 862,943 265,992 2,815,762 1,900,478 530,618 9,926,790
Source: DOF 200b.
Reversing Environmental Degradation Trends in the South China Sea and Gulf of Thailand
NATIONAL REPORT ON FISHERIES THAILAND 25
Table 17 Average price of important marine fishes landed at major landing ports along the coast of the Gulf of Thailand by
species/species group in 2000.
Unit: baht/kg
Province-port/
Indo-Pacific
Indian
King
Coastal Round Hardtail Trevallies Sardinellas Anchovies Threadfin Lizard Snapper Big-eye Banana School
Other
Crabs Squid Cuttlefish Octopus
Others
Species
mackerel
mackerel mackerel
tuna
scad
scads
bream
fish
shrimp
prawn shrimps
Trat
10.64 10.53 39.21
15.17
8.88
10.42
10.45
5.00
5.09
12.43 5.00
...
10.18 239.05 172.83
22.02
19.26 42.68
37.74
22.87 8.14
Chanthaburi
15.11 23.68 45.45
...
...
...
15.11
...
6.00
16.29 14.63
64.75
13.76 225.57 156.08
46.45
19.16 32.04
30.66
21.05 4.41
Rayong
17.64 14.87 50.19
16.57
10.19
6.80
15.62
4.32
6.00
11.11 7.48
43.25
8.99 213.81
98.73
22.70
42.04 44.75
35.00
24.06 8.99
Chonburi
40.58 ... ...
18.00
...
11.05
11.30
5.93
4.50
10.40 ...
...
3.84 254.77 171.08
27.18
34.20 40.16
28.38
18.83 3.01
Chachoengsao ...
...
...
...
...
...
...
...
...
...
...
...
... 226.29 103.51
42.02
... 20.00
30.00
0.00 5.55
Samut
prakan
26.40 19.80 75.60
19.80
11.85
11.76
16.21
...
...
11.70 15.57
45.00
8.00 217.08 330.88 298.58
60.83 56.05
56.24
39.07 18.03
Samut
sakhon
20.42 15.74 65.00
... 14.00
7.00
15.00
6.85
...
13.38 8.50
58.00
10.00 255.00 146.92
56.70
39.54 44.54
43.04
35.11 16.88
Samut songkram
36.48
...
21.00
...
...
...
9.58
6.10
5.25
12.21 ...
90.00
13.15 256.47 134.93
21.66
39.52 48.10
47.66
28.71 4.67
Phetchaburi ...
...
...
...
...
...
...
...
...
10.0 0
...
...
...
... 101.72
13.47
53.89 33.71
39.82
27.14 18.76
Prachuap Khiri
29.31 17.95 39.78
23.86
17.45
12.74
12.05
6.96
...
12.00 ...
...
10.00
...
...
14.02
45.00 41.63
28.50
... 8.52
Khan
Chumphon
20.78 15.98 35.89
20.01
14.94
14.19
15.19
5.47
...
13.45 13.43
59.81
13.83 209.77
88.65
66.26
44.26 41.31
40.82
30.20 6.55
Surat Thani
...
...
...
...
...
...
...
...
...
22.3 9
...
...
... 206.52 102.73
16.88
17.95 21.80
20.97
22.80 2.87
Nakhon Si
8.24 ...
35.96
9.35
...
4.00
...
3.85
...
10.92 8.57
66.33
8.87 217.66
60.00
20.56
19.20 52.69
47.39
25.06 8.09
Thammarat
Songkhla
21.40 22.39 21.00
37.21
9.11
21.92
22.42
7.00
5.03
8.72 7.95
61.16
8.74 227.70 116.00
24.97
53.28 43.29
38.13
28.71 18.46
Pattani
28.19 24.61 90.77
22.46
8.62
21.24
21.51
9.91
...
28.40 7.51
77.48
16.48 330.93 139.99
36.08
59.84 55.14
50.10
33.06 20.58
Narathiwat 44.62
...
106.29
26.56
17.18
22.69
35.81
7.00
...
40.85 10.00
...
... 304.35 175.76
56.86
34.02 47.63
41.73
61.94 16.77
Average
19.99 10.35 39.13
13.06
7.01
8.99
12.52
4.27
1.99
14.64 6.17
35.36
7.87 211.56 131.24
49.15
36.37 41.59
38.51
26.16 10.64
Source: DOF 2003b.
Reversing Environmental Degradation Trends in the South China Sea and Gulf of Thailand
26 NATIONAL REPORT ON FISHERIES THAILAND
2.1.4 Food security (locally)
The fisheries sector provides an important supply of animal protein to Thai people. From 1980 to 2000,
the average yearly increase in per capita fish consumption was about 2 percent. In 2000, per capita fish
consumption was 32.7kg, which is relatively high compared to consumption of other main animal protein
commodities, including pork, beef, and chicken. Price is a decisive factor influencing Thai consumer
choice, and prices of fish are generally lower than other sources of animal protein. However, the level of
per capita fish consumption varies among Thai people. This could be due to variations in household
income, species preference, and geographic location, not failing to mention that fish is not a homogenous
commodity (Day 2000; Smith et al. 1998; Westlund 1995).
Piumsombun (2003) reported that demand for fish amongst Thailand's highest income earners has
almost no variation relative to their incomes. However, the lowest income group has high income
elasticity, especially for shrimp and high value fish. Therefore, increased purchasing power of low-income
groups may lead to increased demand for fish. In order to increase fish consumption amongst higher
income groups, it is necessary to improve fish quality, develop more innovative products (such as those
that are easy to prepare, serve, and consume), and to promote the health benefits of seafood.
2.2
Biology & ecology of the priority species (from available information)
Marine fisheries resources in the Gulf of Thailand can be divided into 2 categories, i.e., pelagic and
demersal resources. Pelagic fish are those that dwell and feed at the surface or in the water column.
They are usually fast swimming with a fusiform body and fork or lunate tail. The species typically form
species-specific schools in the upper part of the water column, which usually has, a temperature range
from 26 to 30oC. It is well known that coastal pelagic species frequently inhabit nutrient-rich inshore and
shelf waters, whilst oceanic species are usually observed in deep, clear, offshore waters.
Small pelagic fish are exploited frequently with shallow-water purse seines (i.e., Thai, Chinese, and luring
purse seines), surface and mid-water gillnets, lift nets, and other surrounding nets. Shallow-water fishing
grounds are generally highly productive and account for much of the Gulf's total pelagic catch.
The commercially important pelagic fish species classified by the Department of Fisheries' taxonomist
include 48 species of the Carangidae family, 30 species of Engraulidae, 28 species of Clupeidae, 19
species of Scombridae, and 14 species of Mugilidae (Sukhavisidth 1996). There are 17 economically
important species/groups of species of pelagic fish in Thai fisheries statistics. However, the most common
groups of small pelagic fish species with substantial catch volume and value are Indo-Pacific mackerel,
Indian mackerel, sardines, anchovies, round scads, bigeye scad, and trevallies.
Information regarding the geographical distribution, fishing grounds, abundance, spawning grounds,
egg/larvae surveys, and migratory patterns of known small pelagic fish are shown in Figures 4 to 13.
Migratory pattern information is only available for Rastrelliger brachysoma/neglectus in the Gulf of
Thailand. Figure 4 indicates that the 2 main spawning grounds for this species are offshore from Surat
Thani province and Prachuap Khiri Khan province. Young fishes migrate from these spawning grounds to
the inner Gulf of Thailand for feeding, moving back inshore early in the year. The results of intensive
tagging experiments carried out by the Department of Fisheries from 1960 to 1965 (26,864 fish released
vs. 4,191 recaptured), highlighted that there were 3 types of movement, i.e., feeding, spawning and
seasonal migration (Somjaiwong and Chullasorn 1974). The results are presented in Figure 5.
2.2.1 Large pelagic fish (FAO)
Mackerels
There are 5 main species of mackerels in the Gulf of Thailand (Sukhavisidth 1996). These include the
Indo-Pacific mackerel (Rastrelliger neglectus), Indian mackerel (R. kanagurta), Faughn's mackerel (R.
faughni), shortbody mackerel (R. brachysoma), and slender mackerel (Rastrelliger sp.1). The first and
fourth species are abundant in coastal waters, whilst the second, third, and fifth species are ubiquitous in
the Gulf's offshore waters. They are mainly caught by purse seine, encircling gillnet, and occasionally pair
trawl. These 5 species are combined in Thai fisheries statistics as coastal mackerel (R.
neglectus/brachysoma) and offshore mackerel (R. kanagurta/faughni/sp.1). Fishing grounds extend from
inshore waters to the central part of the Gulf (Figures 4, 5a, b, and 6a, b).
Reversing Environmental Degradation Trends in the South China Sea and Gulf of Thailand
NATIONAL REPORT ON FISHERIES THAILAND 27
RAYO
Figure 4 Life cycle of Indo-Pacific mackerel (Rastrelliger neglectus) in the Gulf of Thailand
(courtesy of the Marine Fisheries Division)
Reversing Environmental Degradation Trends in the South China Sea and Gulf of Thailand

28 NATIONAL REPORT ON FISHERIES THAILAND
99°
100° 101°
104°
102° 103°
105°E
14°N
BANGKOK
Samut Prakan
Samut Sakhon
Chachoengsao
Samut Songkhram
Chon Buri
13°
Phetchaburi
Rayong
Chanthaburi
Trat
12°
Prachuap hiri khan
11°
Chumphon
10°
9°
Surat Thani
Nakhon Si Thammarat
8°
7°
Songkhla
Position of release
Pattani
Narathiwat
Position of recapture
Route of migration
6°
Figure 5a The migratory route of tagged Indo-Pacific mackerel (Rastrelliger neglectus) in the
Gulf of Thailand (Somjaiwong and Chullasorn 1974).
Reversing Environmental Degradation Trends in the South China Sea and Gulf of Thailand

NATIONAL REPORT ON FISHERIES THAILAND 29
99° 100° 101°
104°
102° 103°
105°E
14°N
BANGKOK
Samut Prakan
Samut Sakhon
Chachoengsao
Samut Songkhram
Chon Buri
13°
Phetchaburi
Rayong Chanthaburi
Trat
12°
Prachuap Khiri Khan
11°
Chumphon
10°
9°
Surat Thani
Nakhon Si Thammarat
8°
7°
Songkhla
Position of release
Pattani
Narathiwat
Position of recapture
Route of migration
6°
Figure 5b
The migratory route of tagged Indo-Pacific mackerel (Rastrelliger neglectus) in the
Gulf of Thailand (Somjaiwong and Chullasorn 1974).
Neritic tunas
Neritic tunas in the Gulf Thailand include longtail tuna (Thunnus tonggol), kawakawa (Euthynnus affinis),
and frigate tuna (Auxis thazard). They are widely distributed throughout the Gulf. When demersal fish
production declined, Thai fishers turned to pelagic fish species with the use of seine nets and artificial
light to attract schools of fish. Stimulated by strong demand for canned tuna, fishing for neritic tunas has
become an important commercial activity in Thailand (Figure 6c).
Reversing Environmental Degradation Trends in the South China Sea and Gulf of Thailand

30 NATIONAL REPORT ON FISHERIES THAILAND
Figure 6a Fishing grounds for Indo-Pacific mackerel (Rastrelliger neglectus) in the Gulf of
Thailand (Tantisawetrat et al. 1994).
Reversing Environmental Degradation Trends in the South China Sea and Gulf of Thailand

NATIONAL REPORT ON FISHERIES THAILAND 31
99° 100° 101°
104°
102° 103°
105°E
14°N
BANGKOK
Samut Prakan
Samut Sakhon
Chachoengsao
Samut Songkhram
Chon Buri
13°
Phetchaburi
Rayong Chanthaburi
Trat
12°
Prachuap Khiri Khan
11°
Chumphon
10°
9°
Surat Thani
Nakhon Si Thammarat
8°
7°
Songkhla
Pattani
Narathiwat
6°
Figure 6b Fishing grounds for Indian mackerel (R. kanagurta) in the Gulf of Thailand (SEAFDEC
1981b).
Reversing Environmental Degradation Trends in the South China Sea and Gulf of Thailand

32 NATIONAL REPORT ON FISHERIES THAILAND
99° 100° 101°
104°
102° 103°
105°E
14°N
BANGKOK
Samut Prakan
Samut Sakhon
Chachoengsao
Samut Songkhram
Chon Buri
13°
Phetchaburi
Rayong
Chanthaburi
Trat
12°
Prachuap Khiri Khan
11°
Chumphon
10°
9°
Surat Thani
Nakhon Si Thammarat
8°
7°
Songkhla
Pattani
Narathiwat
6°
Figure 6c
Fishing grounds for neritic tuna in the Gulf of Thailand (Klinmuang 1981).
Bigeye scad
Bigeye scad (Selar crumenophthalmus) is a species of the family Carangidae. It is abundant and widely
distributed in offshore waters (Figure 7a). It is often caught with round scads in purse seines, and
substantial quantities have been caught by trawl nets. Due to the rapid increase in the catch of bigeye
scad associated with the development of luring purse seine fisheries, collection of information on this
species has been carried out by the Department of Fisheries species since 1980.
Reversing Environmental Degradation Trends in the South China Sea and Gulf of Thailand

NATIONAL REPORT ON FISHERIES THAILAND 33
99° 100° 101°
104°
102° 103°
105°E
14°N
BANGKOK
Samut Prakan
Samut Sakhon
Chachoengsao
Samut Songkhram
Chon Buri
13°
Phetchaburi
Rayong Chanthaburi
Trat
12
Prachuap Khiri Khan
11
Chumphon
10°
9°
Surat Thani
Nakhon Si Thammarat
8°
7°
Songkhla
Pattani
Narathiwat
6°
Figure 7a. Fishing grounds for bigeye scad (Selar crumenopthalmus) in the Gulf of Thailand
(SEAFDEC 1981b).
Carangids
The carangids are fish of the family Carangidae, excluding Decapterus spp., Megalaspis cordyla and
Selar crumenophthalmus, which have already been dealt with separately. The 39 species in Thai waters
represent a number of genera such as Atule, Carangoides, Scomberoides, Selar, and Selaroides. This
group of fish is considered important in terms of volume of landings, and information regarding this
species is usually collected on a combined-species basis due to the difficulties associated with identifying
individual species in the field. Therefore, research conducted thus far has been limited by this situation.
However, some biological research activities regarding important species such as Atule mate (yellowtail
scad), Selaroides leptolepis (yellow stripe scad), and Megalaspis cordyla (hardtail scad) have been
carried out to some extent. The fishing grounds for Atule mate are shown in Figure 7b.
Reversing Environmental Degradation Trends in the South China Sea and Gulf of Thailand

34 NATIONAL REPORT ON FISHERIES THAILAND
99° 100° 101°
104°
102° 103°
105°E
14°N
BANGKOK
Samut Prakan
Samut Sakhon
Chachoengsao
Samut Songkhram
Chon Buri
13°
Phetchaburi
Rayong Chanthaburi
Trat
12°
Prachuap Khiri Khan
11°
Chumphon
10°
9°
Surat Thani
Nakhon Si Thammarat
8°
7°
Songkhla
Pattani
Narathiwat
6°
Figure 7b
Fishing grounds for yellowtail scad (Atule mate) in the Gulf of Thailand (SEAFDEC
1981b).
Round scads
Round scads found in the Gulf of Thailand are represented by 8 species of the genus Decapterus. The
most common species was formerly identified as Decapterus maruadsi (white tip round scad), however,
Thai taxonomists confirm that D. maruadsi is found only in Japanese waters. The most common round
scads found in the Gulf of Thailand are Decapterus dayi and D. killiche. Another species of round scad
commonly caught in the Gulf is the shortfin or slender round scad (D. macrosoma).
Round scads are widely distributed in offshore waters and they are very abundant in the central part of
the Gulf (Figure 7c). They are mainly caught by purse seine, especially the luring purse seine type. Catch
statistics for round scad are complied on a species-combined basis as Decapterus spp.
Reversing Environmental Degradation Trends in the South China Sea and Gulf of Thailand

NATIONAL REPORT ON FISHERIES THAILAND 35
99° 100° 101°
104°
102° 103°
105°E
14°N
BANGKOK
Samut Prakan
Samut Sakhon
Chachoengsao
Samut Songkhram
Chon Buri
13°
Phetchaburi
Rayong Chanthaburi
Trat
12°
Prachuap Khiri Khan
11°
Chumphon
10°
9°
Surat Thani
Nakhon Si Thammarat
8°
7°
Songkhla
Pattani
Narathiwat
6°
Figure 7c Fishing grounds for round scads (Decapterus spp.) in the Gulf of Thailand
(Chullasorn and Yusuksawad 1978) (Lined areas are the main fishing grounds)
2.2.2 Small pelagic fish species
Sardines
Sardines are composed of various genera of clupeoids. There are 4 main sardine genera found in the
Gulf of Thailand, including Sardinella spp., Amblygaster spp., Dussumieria spp., and Herklotsichthys spp.
Among these, goldstriped sardine (Sardinella gibbosa), fringescale sardine (S. fimbriata), and spotted
sardinella (Amblygaster sirm) are most common. However, they are grouped together in Thai fisheries
statistics as sardines (Sardinella spp.). Sardines are widely distributed throughout the Gulf, with high
concentrations in coastal areas (Figure 8). They are mainly caught by purse seines and encircling and
drift gillnets.
Reversing Environmental Degradation Trends in the South China Sea and Gulf of Thailand

36 NATIONAL REPORT ON FISHERIES THAILAND
99° 100° 101°
104°
102° 103°
105°E
14°N
BANGKOK
Samut Prakan
Samut Sakhon
Chachoengsao
Samut Songkhram
Chon Buri
13°
Phetchaburi
Rayong Chanthaburi
Trat
12°
Prachuap Khiri Khan
11°
Chumphon
10°
9°
Surat Thani
Nakhon Si Thammarat
8°
7°
Songkhla
Pattani
Narathiwat
6°
Figure 8 Fishing grounds for sardines (Sardinella spp.) in the Gulf of Thailand (SEAFDEC
1981b).
Anchovies
The fish of family Engraulidae are represented by several genera, including Coilea, Setipinna, Thryssa,
Thrissina and Stolephorus. Among them, 12 species of Stolephorus spp. are most abundant. In the Gulf
of Thailand, the shorthead anchovy (Stolephorus heterolobus) and Indian anchovy (S. indicus) are
considered important and are very abundant in inshore waters (Figure 9). Recently, Stolephorus
heterolobus has been reidentified and named Encrasicholina heteroloba (Whitehead et al. 1988).
Therefore, Encrasicholina heteroloba is a synonym of Stolephorus heterolobus.
As anchovies are very small-sized pelagic fish and commonly distributed in inshore waters, small-meshed
purse seines (so-called anchovy purse seine), lift nets, falling nets, set bag nets, push nets, trawl nets,
and bamboo stake traps are commonly used to catch them.
Reversing Environmental Degradation Trends in the South China Sea and Gulf of Thailand

NATIONAL REPORT ON FISHERIES THAILAND 37
99° 100° 101°
104°
102° 103°
105°E
14°N
BANGKOK
Samut Prakan
Samut Sakhon
Chachoengsao
Samut Songkhram
Chon Buri
13°
Phetchaburi
Rayong Chanthaburi
Trat
12°
Prachuap Khiri Khan
11°
Chumphon
10°
9°
Surat Thani
Nakhon Si Thammarat
8°
7°
Songkhla
Pattani
Narathiwat
Heavy exploited fishing
ground
6°
Figure 9 Fishing grounds for anchovy in the Gulf of Thailand (Saikliang 1995b; Supongpan et al.
2000).
Biological features and parameters of important pelagic fishes collected from previous and ongoing
studies is summarised in Table 18.
Reversing Environmental Degradation Trends in the South China Sea and Gulf of Thailand
38 NATIONAL REPORT ON FISHERIES THAILAND
Table 18
Key biological features and parameters for small pelagic fish species in the Gulf of Thailand.
(Body size refers to total length unless specified as FL: fork length or SL: standard length; sexes are combined unless specified as M: male or F: female)
Vertical
Body size
Spawning Recruitment
Size at
Area
distribu-
captured
Sex
Growth
Life
first
Mortality
Food
Length-weight
Species
(country)
tion
Fecundity
ratio
(rate or
span
maturity
(coefficient)
organisms
relationship
surveyed
range
Mean Maximum
Season
Size
Season
Area
(M:F)
coefficient)
(year)
(cm)
(m)
(cm)
(cm)
(month)
(cm)
(month)
FAMILY
SCOMBRIDAE
Rastrelliger
Gulf of
20-40
15.0
20.95
10-40 mi
2-4,
egg = 9x10⁻⁸
10.25
1-3,
17.5
1:1
0.33
z=1.06
2-3
Phyto-planktons,
W =0.006138L3.215
brachysoma
Thailand
21.5
off
6-8
L4.8356
7-9
zoo-planktons
M : W =
Prachuap
20,000-30,000/
0.000005732L3.1235
Surattani
batch
F : W =
0.000006578L3.1235
R. kanagurta Gulf
of 30-60 16.0 22.9
-
2-4
200,000 7.5 5-6
18.6
1:1 k=2.76 M=3.75 2-3 Phyto-,
M : W =
Thailand
7-8
F=4.973
zoo-planktons,
0.0000001958L3.7653
Z=8.733
diatoms,
F : W =
copepods
0.000009454L3.0375
Auxis thazard
Gulf of
20 35.0 -
-
4-6
- 19.0
8-11
34.1 1:1
-
-
3-4
Fish W = 0.00002L2.99
Thailand
8-9
27.0
2, 4-5
crustacean
Euthynnus
Gulf of
20 37.0 -
-
1-3,
1,730,000 21.0 2-4,
37.5 1:1
-
-
-
Fish W = 0.000015L2.979
affinis
Thailand
6-7
26.0
6.12
crustacean
Thunnus
Gulf of
20 38.5
-
-
3-5
1,400,000 22.0- 1-2,
39.6 1:1 1.5
cm/
-
4 Fish
W = 0.000021L2.979
tonggol
Thailand
7-12
26.0
4-6
month
crustacean
Scomberomorus
Gulf of
20-60 50.0 92.0
-
2-3,
6-9
500,000-3,800,000
11.0-21.0 3-5, 58.6 1:1.6 0.12
- 4-5
Fish,
molluses,
W=0.01302L2.8843
commerson
Thailand
7-10
3.4 cm/month
crustaceans
FAMILY
ENGRAULIDAE
Stolephorus
Gulf of
5-50
4.5
8.89
30 mi
3-4,
2,000-4,000
2.8-4.0
All
5.5 - 6.0
1:1
k=0.198
Z=13.50
1-1.5
Phyto-
M:W =
heterolobus
Thailand
off
7-9
around
k=1.8/ year
M=3.54
planktons
2.064x10⁻⁶L3.2494
Prachuab
4-12
F:W =7.089x10⁻⁶L2.932
FAMILY
CLUPEIDAE
Sardinella
Gulf of
15-40
10.0
18.4
entire coastal
All around
-
12.9
-
-
-
0.33
-
1-2
Phyto-plankton
W=9.28*10-6 * L3.0047
gibbosa
Thailand
zone
3-4, 7-8
FAMILY
CARANGIDAE
Decapterus
Gulf of
30-40
13.2
23.1
Central Gulf.
2-3, 7-8
38,000-515,000
5.5-6.5
1-2, 6-8
16.1
1:1.2
0.11
-
2-3
crustaceans,
W=0.00005L2.811
maruadsi
Thailand
1-2 cm/month
copepods
D.
Gulf of
30-60
-
-
-
12-5
-
-
-
16.5
1:0.9
-
-
-
-
-
macrosoma
Thailand
Atule mate
Gulf of
15-45
16.0
25.8
30 mi off
3-4 - 5.5-6.5
1-3,
- -
0.8
cm/ - 2-3
- -
Thailand
Chumporn
6-9
k=0.107
Nakorn Si
Thammarat
Selar
Gulf of
30-60 20-25 28.4
-
-
-
10.0
-
19.4 1:1.3 k=2.4 Z=9.7
- -
-
crumenophthal
Thailand
M=3.3
mus
F=6.5
Selaroides
Gulf of
20-50 12 19.2-
- All - 4.0-5.5
6,
11
F:15.4
1:
k=0.128 -
- Zooplanktons,
M: Log W = 3.257Log
leptolepis
Thailand
21.0
around 3,
1.02
phytoplanktons,
L-5.567
7-8
molluscs
F: Log W = 3.629Log
L-6.369
Megalaspis
Gulf of
20-50 22.0 28.8
-
12-5,
- 10.5-11.5
5,
9
-
1:0.8
1.2cm/month
- -
Fish,
crustacean
W=0.144L2.9785
cordyla
Thailand
8-11
0.2
Source: Chullasorn and Martosubroto, 1986.
Reversing Environmental Degradation Trends in the South China Sea and Gulf of Thailand
NATIONAL REPORT ON FISHERIES THAILAND 39
2.2.3 Demersal fish species
Demersal fish species live at or near the bottom of the sea, although some groups may also inhabit
the middle or upper layers of the water column. They may by divided into 2 groups: (1) demersal fish;
and (2) invertebrates, including crustaceans and molluscs. They are caught by bottom trawl nets,
bottom gill nets, push nets, longlines, and traps.
Fishing grounds for demersal fish are generally located in coastal waters of the Gulf of Thailand. Otter
board trawls are highly effective in catching demersal fish. Otter board trawls, pair and beam trawls,
and push nets are most commonly used to catch demersal fish. However, otter board trawls are the
most important gear type in demersal fisheries. The areas fished using otter board and pair trawls by
various sizes of fishing boats are depicted in Figures 10a to d and 11.
There are a large number of demersal fish species in Thai waters. More than 500 species have been
caught and commercially utilised, however, demersal fish catches usually contain more than 50% low-
value fish. These low-value fish include 3 groups: (1) non-edible species; (2) edible species of low
commercial value or low quality; and (3) juveniles of commercially important species.
Based on trawl surveys conducted in the Gulf of Thailand, there are 7 species of lizardfish. The two
most commonly found species are brushtooth lizardfish (Saurida undosquamis) and S. elongata.
Sirapakavanich (1990) reported that brushtooth lizardfish was found along the coast of the Gulf, and
that the length frequency distribution of catches vary according to depth. Generally, small fish are
caught in shallow water, whereas the capture of larger fish occurs further offshore. S. elongata has
been shown to be very abundant at depths from 10 to 20m.
Threadfin bream are demersal fish distributed throughout coastal waters to depths of 60 m. The most
common species are Nemipterus hexodon, N. mesoprion, N. japonicus, N. nematophorus, and N.
peronii. N. hexodon is most common at depths from 10 to 40m, N. mesoprion and N. japonicus are
abundant from 15 to 50m, and N. mesoprion and N. peronii are commonly found in deeper areas from
30 to 60m.
Bigeye (Priancanthus tayenus) is a ubiquitous demersal species in the Gulf of Thailand (Prachuab
Khiri Khan and Chumphon provinces) at depths greater than 40m. It is carnivorous, feeding mostly on
fish, shrimps, and squids (Jiraphanpiphat 1987).
Information regarding important demersal fishes collected from previous and ongoing studies is
summarised in Table 19.
Reversing Environmental Degradation Trends in the South China Sea and Gulf of Thailand

40 NATIONAL REPORT ON FISHERIES THAILAND
99° 100° 101°
104°
102° 103°
105°E
14°N
BANGKOK
Samut Prakan
Samut Sakhon
Chachoengsao
Samut Songkhram
Chon Buri
13°
Phetchaburi
Rayong Chanthaburi
Trat
12°
Prachuap Khiri Khan
11°
Chumphon
10°
9°
Surat Thani
Nakhon Si Thammarat
8°
7°
Songkhla
Pattani
Narathiwat
6°
Figure 10a
The fishing grounds of otter board trawl (boat length <14 m) (FAO 1996).
Reversing Environmental Degradation Trends in the South China Sea and Gulf of Thailand

NATIONAL REPORT ON FISHERIES THAILAND 41
99° 100° 101°
104°
102° 103°
105°E
14°N
BANGKOK
Samut Prakan
Samut Sakhon
Chachoengsao
Samut Songkhram
Chon Buri
13°
Phetchaburi
Rayong Chanthaburi
Trat
12°
Prachuap Khiri Khan
11°
Chumphon
10°
9°
Surat Thani
Nakhon Si Thammarat
8°
7°
Songkhla
Pattani
Narathiwat
6°
Figure 10b
The fishing grounds of otter board trawl (boat length 14 to 18 m) (FAO 1996).
Reversing Environmental Degradation Trends in the South China Sea and Gulf of Thailand

42 NATIONAL REPORT ON FISHERIES THAILAND
99° 100° 101°
104°
102° 103°
105°E
14°N
BANGKOK
Samut Prakan
Samut Sakhon
Chachoengsao
Samut Songkhram
Chon Buri
13°
Phetchaburi
Rayong
Chanthaburi
Trat
12°
Prachuap Khiri Khan
11°
Chumphon
10°
9°
Surat Thani
Nakhon Si Thammarat
8°
7°
Songkhla
Pattani
Narathiwat
6°
Figure 10c
The fishing grounds of otter board trawl (boat length >18 m) (FAO 1996).
Reversing Environmental Degradation Trends in the South China Sea and Gulf of Thailand

NATIONAL REPORT ON FISHERIES THAILAND 43
99° 100° 101°
104°
102° 103°
105°E
14°N
BANGKOK
Samut Prakan
Samut Sakhon
Chachoengsao
Samut Songkhram
Chon Buri
13°
Phetchaburi
Rayong Chanthaburi
Trat
12°
Prachuap Khiri Khan
11°
Chumphon
10°
9°
Surat Thani
Nakhon Si Thammarat
8°
7°
Songkhla
Pattani
Narathiwat
6°
Figure 10d
The fishing grounds of pair trawls (boat length >18 m) (FAO 1996).
Reversing Environmental Degradation Trends in the South China Sea and Gulf of Thailand

44 NATIONAL REPORT ON FISHERIES THAILAND
99° 100° 101°
104°
102° 103°
105°E
14°N
BANGKOK
Samut Prakan
Samut Sakhon
Samut Songkhram
Chon Buri
13°
Phetchaburi
Rayong
Chanthaburi
Trat
12°
Prachuap Khiri Khan
11°
Chumphon
10°
9°
Surat Thani
Nakhon Si Thammarat
Fishing ground of otterboard
8°
Trawler
Heavy fishing ground of OBT
7°
Songkhla
Pattani
Narathiwat
6°
Figure 11 The fishing grounds of commercial trawls (otter board and pair trawl) in the Gulf of
Thailand (FAO 1996).
Reversing Environmental Degradation Trends in the South China Sea and Gulf of Thailand
NATIONAL REPORT ON FISHERIES THAILAND 45
Table 19
Key biological features and parameters of demersal fish in the Gulf of Thailand.
(Body size refers to total length unless specified as FL: fork length or SL: standard length; sexes are combined unless specified as M: male or F: female)
Vertical
Body size
Spawning Recruitment
Size at
Area
distribu-
captured
Sex
Growth
Life
first
Mortality
Food
Length-weight
Species
(country)
tion
Fecundity
ratio
(rate or
span
maturity
(coefficient)
organisms
relationship
surveyed
range
Mean
Maximum
Season
Size
Season
Area
(M:F)
coefficient)
(year)
(cm)
(m)
(cm)
(cm)
(month)
(cm)
(month)
FAMILY
LUTJANIDAE
Lutjanus
Gulf of
20-50
13.9
M:18.0
-
10-6
-
8.0
1-4
-
1:1
1-2 cm
-
-
Fish,Shrimps,
M:W=0.0263L2.754
lineolatus
Thailand
F:19.0
/month
squids
F:W=0.0668L2.412
FAMILY
NEMIPTERIDAE
Nemipterus
Gulf of
10-40
M:16.46
M:27.3
-
All around
-
11.0,
5, 9, 11
-
1:0.97
(1-2)
-
-
Fish
M:W=0.1161L3.04
hexodon
Thailand
F:15.12
F:24.4
1-4, 6-8
12.0
Crustaceans
F:W=0.0176L2.924
Nemipterus
Gulf of
25-50 - M:25.6
-
- -
10.0
- - -
M:k=0.1599
M:Z=5.482
- -
-
japonicus
Thailand
F:23.3
F:k=0.1207
F:Z=4.814
Nemipterus
Gulf of
15-50
- M:13.34
-
1-4, 8, 11
-
-
-
11.7
1:0.85
M:k=0.1436
- - -
-
nematophorus
Thailand
>40
F:17.8
F:k=0.2275
Nemipterus
Gulf of
30-60 M:13.0 M:19.51
-
2-4
-
6.5-7.0
3, 5, 6
-
1:1.1
M:k=0.179
- - Fish,
M:W=0.18*10-5L2.93
mesoprion
Thailand
F:11.1
F:15.52
(1.08)
molluscs,
F:W=7.8*10-5L3.10
F:k=0.224
crustaceans
(0.85)
Nemipterus
Gulf of
M:22.9
M:27.5
- 2-4 -
15.2,
15.5,
3, 7, 9,
- 1:0.84
-
-
- Worms,
M:W=0.0122L2.988
peronii
Thailand
30-40
F:21.6
F:27.0
15.7
12
fish, squid
F:W=0.0199L3.004
crustaceans
Scolopsis
Gulf of
10-40 M:21.7 M:27.0
- All
around
- -
6-7,
11-
- 1:0.8
-
-
-
Crustaceans,
M:W=1.08*10-4L2.6201
taeniopterus
Thailand
F:14.6
F:25.0
12-1, 4-8
12
fish
F:W=6.17*10-5L2.718
FAMILY
PRIACANTHIDAE
Priacanthus
Gulf of
40-50
M:27.0
-
-
All around 56,000-
11.0,
3, 5, 10,
14.0
1:1
2.0 cm/month
-
-
Crustaceans
M:W=3.16*10-6L2.919
tayenus
Thailand
F:25.0
1-3
152,00
12.0, 10.5
12
Fish, squid
F:W=2.606*10-6L2.891
0
FAMILY
Fish,
SERRANIDAE
Crustaceans
-
Epinephelus
Gulf of
20-70
-
-
-
-
-
-
-
-
-
-
-
-
Molluscs,
sexfasciatus
Thailand
polychaetae
FAMILY
M: k=0.103
SYNODONTODAE
1.4 cm/ month
Saurida
Gulf of
10-20
M:26.3
M:37.7
-< 30
1-3, 8-9
-
-
5-7, 11
-
-
F:k=0.099
M:Z=5.622
-
-
M:W=5.644*10-6L3.054
elongata
Thailand
F:30.6
F:41.6
mi
1.5 cm/ month
F:Z=5.278
F:W=6.565*10-6L3.024
Saurida
Gulf of
- M:26.31
M:34.0
- 1-3 -
- 5-7,
12 - 1:1
-
-
-
- -
tumbil
Thailand
F:30.56
F:40.0
Saurida
Gulf of
41-50 M:17.8 M:36.5
-
12-1, 5-9
-
12.0-14.0
6, 12, 2
-
1:0.57 2.0cm/
month
-
-
-
W=0.00000292L3.163
undosquamis
Thailand
F:18.31
F:26.5
Source: Chullasorn and Martosubroto, 1986.
Reversing Environmental Degradation Trends in the South China Sea and Gulf of Thailand
46 NATIONAL REPORT ON FISHERIES THAILAND
2.2.4 Commercially
exploited
invertebrates
Thailand's marine invertebrate resources are highly valuable. They include shrimps (economically
important penaeid shrimps and miscellaneous penaeid shrimps), cephalopods (squid, cuttlefish, and
octopus), swimming crab, sergestid shrimp, jellyfish, and others.
Shrimps
More than 50 species of shrimp are found in the Gulf of Thailand and Andaman Sea (Chaitiamvong
and Supongpan 1993). The economically important species are those of the penaeid group, with 9
important species (Penaeus merguiensis, P. monodon, P. semisulcatus, P. japonicus, P. latisulcatus,
P. longistylus, Metapenaeus affinis, M. intermedius, and M. ensis) and more than 10 miscellaneous
species (including Metapenaeopsis spp., Trachypenaeus spp., Parapenaeopsis spp., M. lysianassa,
and M. brevicornis).
Vibhasiri (1984) reported that Ban Don Bay off Surat Thani province is considered one of the most
productive shrimp fishing areas. M. affinis is the most abundant species of large-sized shrimp in this
area. Thubthimsang (1981) noted that this species is found in this area all year round.
The economically important penaeid shrimps are sold in a wide variety of forms in domestic and
export markets. Wild caught penaeid shrimp are mostly consumed domestically in the fresh or dried
form, although some are frozen, or processed and canned as cocktail shrimp, for important export
markets.
Shrimps are mainly caught by trawl nets of various types. Subsistence fishers use gill nets and push
nets in inshore waters. Small trawls and beam trawls are used to catch shrimp in coastal waters of the
Gulf of Thailand. The main species caught are white shrimp (Penaeus merguiensis), green tiger
shrimp (P. semisulcatus), and Metapenaeus spp. Penaeid shrimp catch from the Gulf of Thailand
fluctuated between 16,000 to 19,000 metric tonnes from 1985 to 1991. The major fishing gears are
otter board trawls and shrimp gill nets, which are used to catch about 78% and 10% of the total
shrimp production, respectively (Vibhasiri 1993).
Cephalopods
The 3 major groups of cephalopod caught for commercial utilisation are squid (Loligo chinensis, L.
duvauceli, L. sumatrensis, and Sepioteuthis lessoniana), cuttlefish (Sepia pharaonis, S. aculeata, S.
recurvirostra, S. lycidas, S. brevimand, and Sepiella inermis) and octopus (Octopus membranaceous,
O. doffusi, and Octopus spp.). These species are distributed in coastal waters of both the Gulf of
Thailand and Andaman Sea, except for S. lycidas, which is only distributed in the Andaman Sea and
the lower part of the Gulf of Thailand.
Cuttlefish are economically important in the Gulf of Thailand. There are 7 species of the Family
Sepiidae found in the Gulf of Thailand, including Sepia aculata, S. kopiensis, S. recurvirostra, S.
pharaonis, S. brevimana, S. lycidas, and Sepiella inermis (Chotiyaputta et al. 1992). Cuttlefish are
generally distributed in inshore areas, spending much of their lives on or near the seabed (Voss 1973,
cited in Bakhayokho 1983). Therefore, cuttlefish are mostly caught by traps, push nets, and trawls
operated in inshore areas. All species are widely distributed in the Gulf of Thailand, except for S.
lycidas, which is only found in the southern part of the Gulf up to Chumphon province (Supongpan
1988). Results of a resource survey conducted in the Upper Gulf of Thailand with an otter board trawl
from 1999 to 2000 indicate that the distributions of S. lycidas and S. kopiensis may not extend to
these waters (Anugul 2002).
Supongpan (1988) reported that the distribution and abundance of cuttlefish varies by water depth.
Sepiella inermis and S. lycidas were abundant in depths ranging from 10 to 20m. S. aculata was most
abundant at a depth of 10 to 30 meters, whereas S. pharaonis and S. recurvirostra were most
abundant from 20 to 30m. Nabthitabhata (1997) reported that Sepiella inermis is abundant in shallow
estuarine areas at a depth of approximately 20m.
Reversing Environmental Degradation Trends in the South China Sea and Gulf of Thailand
NATIONAL REPORT ON FISHERIES THAILAND 47
Jindalikit and Sereeruk (2004) report that the habitats of cuttlefish species are related to distance from
shore and bottom depth. High abundances of S. aculata were observed between 3 and 7 nautical
miles offshore at a depth from 20 to 25m. S. recurvirostra was highly abundant more than 7 nautical
miles offshore at a depth between 21 and 40m, whilst Sepiella inermis was found 3 to 5 nautical miles
offshore at a depth of 10 to 15m. S. aculata was abundant at 3 nautical miles from shore at a depth of
10 to 20m, S. recurvirostra at more than 7 nautical miles offshore and a bottom depth from 31 to 40
m, and Sepiella inermis at 3 nautical offshore and a bottom depth of 10 to 15m.
The total production of cephalopods during 1991 was 154,402 metric tonnes, comprised of squid,
cuttlefish, and octopus at 69,367, 65,029, and 20,006 metric tonnes, respectively. Squids are mainly
caught by trawls, light luring cast nets, and squid traps. The fishing grounds where these gears are
used are presented in Figures 12a and b.
Shortnecked clam
The fisheries for shortnecked clam differ from other fisheries, especially in relation to species and
gear selection. Fishers group together to harvest this resource on an intensive basis until either catch
rates decline or the resource is depleted. The fishers then move onto other areas. Previously
harvested fishing grounds usually require 4 to 5 years to recover. Shortnecked clam fishing grounds
are distributed throughout the Gulf of Thailand and the Andaman Sea. The productive areas are
concentrated on the eastern, upper, and western coasts of the Gulf. A problem that usually occurs is
the inundation of shortnecked clam fishers to new inshore areas, often leading to conflicts with local
fishers due to the use of small meshed dredges in the inshore waters assigned for the use of small-
scale fishers only. Production of shortnecked clam from the Gulf ranged from 18,300 to 130,000
metric tonnes between 1985 and 2000. Peak production was observed in 1987, after which catches
followed a decreasing trend until reaching the lowest recorded production in 1996. Harvests have
since recovered, and a total production of 25,964 metric tonnes was recorded in 2000. The clams are
mostly exported in a range of forms, including fresh and frozen whole clams, fresh and frozen meat,
and boiled and canned product.
Sergestid shrimp
Sergestid shrimp include 5 species of Acetes (A. erythreus, A. japonicus, A. indicus, A. vulgaris, A.
sibogae) and 2 species of shrimp-like (Mesopodophsis orientalis, Rhopalopthalmus phyllodus), and
Lucifer hanseni. Acetes sibogae is found only in the Andaman Sea. Total production in 1991 was
21,753 metric tonnes, with a value of 108.7 million baht. Sergestid shrimp and shrimp-liked are mostly
utilised for domestic consumption in the form of shrimp paste and small dried shrimp. Production
derived from the Gulf of Thailand represents approximately 87% of Thailand's total production of this
group. From 1985 to 2000, Gulf of Thailand production ranged between 6,400 and 21,400 metric
tonnes.
Jellyfish
There are 2 economically important species of jellyfish in Thai waters, Rhopilema hishidum and
Lobonema smithi. Rhopilema is treated with local wood and dried for export, whereas Lobonema is
treated with salt and dried for local consumption. Production from both the Gulf and Andaman Sea
fluctuated between 6,500 and 138,600 metric tonnes between 1985 and 2000.
Reversing Environmental Degradation Trends in the South China Sea and Gulf of Thailand

48 NATIONAL REPORT ON FISHERIES THAILAND
99° 100° 101°
104°
102° 103°
105°E
14°N
BANGKOK
Samut Prakan
Samut Sakhon
Chachoengsao
Samut Songkhram
Chon Buri
13°
Phetchaburi
Rayong Chanthaburi
Trat
12°
Prachuap Khiri Khan
11°
Chumphon
10°
9°
Surat Thani
Nakhon Si Thammarat
8°
Number of fishing boats
7°
Songkhla
20 of small size
Pattani
20 of medium size
Narathiwat
20 of large size
Fishing ground
6°
Figure 12a Area of light luring fishing for squid in the Gulf of Thailand (Supongpan 1996).
Reversing Environmental Degradation Trends in the South China Sea and Gulf of Thailand

NATIONAL REPORT ON FISHERIES THAILAND 49
99° 100° 101°
104°
102° 103°
105°E
14°N
BANGKOK
Samut Prakan
Samut Sakhon
Chachoengsao
Samut Songkhram
Chon Buri
13°
Phetchaburi
Rayong Chanthaburi
Trat
12°
Prachuap Khiri Khan
11°
Chumphon
10°
9°
Surat Thani
Nakhon Si Thammarat
8°
Songkhla
7°
Fishing ground
Pattani
50 of fishermen
Narathiwat
25 of fishermen
12.5 of fishermen
6°
Figure 12b
Area of squid trap fishing in the Gulf of Thailand (Supongpan 1996).
Swimming crab
The swimming crab (Portunus pelagicus) is distributed throughout the Gulf and Andaman Sea. The
areas in which this species is abundant include the eastern, upper, and western coasts of the Gulf.
From 1985 to 2000, total production of this species from the Gulf ranged between 19,000 and 37,300
metric tonnes. The species is thought to have been overexploited. It is mostly consumed locally, in the
fresh and boiled form. The major fishing gears used to catch swimming crabs are trawls, push nets,
and gill nets. Conflicts usually arise between gill net and trawl fishers targeting this species in the
same areas. Another problem involves the catch of immature crabs by push nets and small mesh
trawl fishing gear operated in inshore waters.
The key biological features and parameters of important invertebrates collected during previous and
existing studies are summarised in Table 20.
Reversing Environmental Degradation Trends in the South China Sea and Gulf of Thailand
50 NATIONAL REPORT ON FISHERIES THAILAND
50
Table 20
Key biological features and parameters of small invertebrates in the Gulf of Thailand.
(Body size refers to total length unless specified as FL: fork length or SL: standard length; sexes are combined unless specified as M: male or F: female)
Species Area
Vertical
Body size
Spawning Recruitment
(country)
Size at
Growth
Mortality
distribu-
captured
surveyed
Fecundity
first
Sex
(rate or
(coefficient)
Life
Food
Length-weight
tion
Mean
Maximum
Area
maturity
ratio
coefficient)
span
organisms
relationship
range
(cm)
(cm)
Season
Size
Season
(cm)
(M:F)
(year)
(m)
(month)
(cm)
(month)
FAMILY
Polychaetae
M:W=
PENAEIDAE
-
-
-
1-3, 9-12
129 650-960 950
-
-
13.0-14.2
-
-
-
-
Fish larvae,
0.000010L2.963
Penaeus
Gulf of
15-30
Copepods
F:W=
merguiensis
Thailand1
euphausis
0.0000049L3.113
Penaeus
Gulf of
10-19 12.9 20.9
All
257 889- 1 009 459
7.0
Shrimps
M:W=
japonicus
Thailand1
-
around
-
14.0
1:1
-
-
-
larvae,
0.0000712L2.5703
1-3, 7-8
crabs
F:W=
larvae,
0.0000149L2.9018
cephalopod
s larvae,
molluscs
larvae
Loligo duvauceli
Gulf of
Shallow
6-30 30 Prachuap All
1,500-10,000 0.5-5.0 1,3-6,9 6.5-7.0 F>M M:0.0083
1
Fish, M:W=
Thailand2
to depth
Khiri Khan-
around
day-1
molluse and
0.9594L1.73509
:East
over 50 m
Chumphon
1, 3-4, 6-
or 2.52 year
shrimp
F:W=
coast
7, 12
0.1829L2.16290
F:0.0069
day-1
L. chinensis
Gulf of
>30 6-42 42 South
of All
3,000-11,000 0.5-6.5
1,
3-6, 10
8.5
-
M:0.0072
1
Fish, M:W=
Thailand2
Ko Chang,
around
day-1
mollusce
0.2134L2.11948
:East
off shore of
3-4, 6-7,
Or 2.62 yr-1
and shrimo
F:W=
coast
Chumphon
11-12
0.051L2.42078
and
F:2.704
Pracuap
day-1
Khiri Khan
or 2.70 yr-1
Sepia aculata
Gulf of
1-7 nmi
5-16.9 -
-
3-4,7-8
4,547
-
-
8.1 -
Crustacean, M:W=
Thailand
or
fish
0.00099L2.5032
Upper3
20-25 m
F:W=
0.000722L2.5919
S. recurvirostra
Gulf of
>7 nmi
- - -
-
-
- - - - -
- -
Crustacean, M:W=
Thailand
or
fish
0.00191L2.3579
Upper4
21-40 m
F:W=
0.001984L2.3579
S. pharaonis
Gulf of
10-
- -
1-2,7-8
1,400 - -
M:13.7
- - - -
Crustacean, W=
Thailand
24.5
(900-2,700)
F:14.2
fish
0.4118ML2.4233
Upper5
1 Chullasorn and Martosubroto, 1986.
2 Chotiyaputta. 1995b.
3 Chotiyapunta, 1977; 1978.
4 Chotiyapunta, 1977.
5 Chotiyapunta, 1980; 1982; Nabthitabhata, 1997.
Reversing Environmental Degradation Trends in the South China Sea and Gulf of Thailand
NATIONAL REPORT ON FISHERIES THAILAND 51
3.
THREATS & CURRENT STATUS
3.1
Status of fishery in terms of CPUEs
A commonly used indicator of changes in abundance of fisheries resources is catch rate, or the
quantity of catch per unit of fishing effort (CPUE). From 1966 to 1996, the Marine Fisheries Division,
using Research Vessels Pramong 2 and 9, conducted monthly surveys of demersal fisheries
resources in the Gulf of Thailand. Prior to 1966, a catch rate of 297.80kg/hr was reported in 1961. In
1966, the sampling protocol survey of demersal resources was initiated. The fixed stations in the Gulf
of Thailand were designed by separating the area into grids, leading to the establishment of more
than 700 grid stations. From survey data collected in 1966, catch rate was 177.42kg/hr. Primarily, a
codend mesh size of 4cm was used for the surveys, although in 1971 the codend was covered with
an additional net of 2.5cm mesh, which is a mesh size commonly used by fishers. This modified
method has been followed to the present day, however, the number of stations have been reduced
due to budget limitations. The surveys were conducted on a bi-monthly basis. The results show that
catch rate declined from 177.42 kg/hr in 1966 to 77.51kg/hr in 1976. It is noteworthy that the oil crises
of 1973 and 1975 resulted in some trawl fishers suspending their fishing activities. During this period,
catch rates fluctuated from 60 to 80kg/hr (Figure 13).
Catch rate of RV 2&9 (kg/hr)
200
180
160
140
120
100
80
60
40
20
0
1966
1968
1970
1972
1974
1976
1978
1980
1982
1984
1986
1988
1990
Year
Figure 13
The catch rate (CPUE) for demersal resources caught in the Gulf of
Thailand from 1966 to 1991 during surveys conducted from Research
Vessels Pramong 2 and 9 (National Seminar 1999).
As mentioned above, catch rates have continuously declined since the introduction of trawl fishing in
Thai waters. The catch rate of 177.42kg/hr observed in 1966 fell to 17.9kg/hr in 1998 (National
Seminar 1999). It is likely that catch rate may fall to near zero if there is no proper management. In
recognition of this situation, DOF has introduced many management measures aimed at regulating
and controlling the exploitation of fish resources. However, significant difficulties have been
experienced in taking action to enforce regulations due to concerns regarding potential
socioeconomic impacts and political intervention.
Reversing Environmental Degradation Trends in the South China Sea and Gulf of Thailand
52 NATIONAL REPORT ON FISHERIES THAILAND
3.2
Status of fish stocks based on historical review of landings and CPUEs
Marine catches in recent years have been dominated by pelagic species, including mackerel, round
scads, anchovies, sardines, and neritic tunas, as well as some demersal fish species such as
threadfin bream, lizard fish, and big-eye, and invertebrates, including shrimp, squid, and swimming
crabs (DOF 1996).
The present level of exploitation of demersal fisheries resources in the shallow (less than 50m)
coastal waters of the Gulf of Thailand is higher than the estimated Maximum Sustainable Yield (MSY)
for this area. It is clear that this overfishing is a result of intensive trawl fishing in the area. The current
situation is clearly reflected in the index of abundance or CPUE, which has declined significantly
during the past 3 decades. At the same time, the amount of low value fish in demersal catches has
increased significantly. On the other hand, catches of a number of other species, particularly
demersal resources, have declined. Catches of both pelagic and demersal stocks have long
surpassed their estimated MSYs. In 2000, catches were nearly twice the estimated MSY levels
(Table 21). Actual catch may be, for many reasons, higher than that reported.
Table 21
Maximum Sustainable Yields and actual catches in Thai waters during 2000.
Fish Category
Maximum Sustainable Yields1/
Actual Catches (2000)2/
Pelagic fishes
624,318 metric tonnes
642,472 metric tonnes
Demersal fishes
970,905 metric tonnes
939,282 metric tonnes
Total Gulf.
1,595,223 metric tonnes
1,581,754 metric tonnes
Source: 1/Kongprom et al in press and 2/DOF 2003a.
A review of the status of small pelagic fisheries resources in the Gulf of Thailand highlights that the
development of pelagic fisheries has occurred since 1973. It shows a marked (almost 4 fold) increase
in pelagic fish production from 141,608 metric tonnes in 1973 to 614,814 metric tonnes in 1994.
However, almost all species of pelagic fish are fully exploited, whilst some species, including the
round scads, have been depleted. This situation has mainly arisen due to the efficacy of new fishing
methods, involving the use of artificial light and FADs to attract fish during both the night and day.
Large scale purse seine operations have been modernised and most boats are equipped with colour
echo-sounder or sonar for fish school detection; power saving devices (e.g. purse line winch, power
block) that enable vessels to reduce man power; radar; wireless communication equipment; satellite
navigation; and refrigeration. Purse seine boats may now travel further and stay at sea longer. These
may lead to the rapid depletion of resources. Nevertheless, the Gulf of Thailand's pelagic fish
resource is comprised of a multitude of species. This enables fishers to redirect fishing effort from
heavily to less fished species. Therefore, the problem of resource depletion for pelagic resources is
not as serious as it should be.
Of the 17 species/groups of species of pelagic fish that appear in national fisheries statistics,
6 species/groups of species of small pelagic fish are considered important, and various aspects of
their populations have been studied. The results of these studies will now be briefly summarised.
Indo-Pacific mackerel (Rastrelliger brachysoma/neglectus)
The Indo-Pacific mackerel is one of the most economically important pelagic fish in the Gulf of
Thailand. The main fishing grounds for this species are located in coastal waters, especially between
Chonburi to Surattani provinces. This area provides approximately 80% of the total catch taken from
the Gulf.
The annual catch of Indo-Pacific mackerel in the Gulf of Thailand ranged from 26,129 metric tonnes in
1971 to 99,638 metric tonnes in 1994. A stock assessment conducted for this species indicated that
its MSY in the Gulf is about 104,000 metric tonnes, equivalent to approximately 146,600 days of Thai
purse seine fishing effort (Tantisawetrat 1994). It indicated that Indo-Pacific mackerel has been fully
exploited in the Gulf of Thailand since 1984. An increase in fishing effort beyond the maximum level of
146,600 fishing days is inadvisable, especially in light of the potential for effort creep.
Reversing Environmental Degradation Trends in the South China Sea and Gulf of Thailand
NATIONAL REPORT ON FISHERIES THAILAND 53
Indian mackerel (Rastrelliger kanagurta)
The fisheries for Indian mackerel have been significant since 1973, mostly due to the development
and expansion of luring purse seine fisheries in offshore areas. Since then, substantial quantities of
Indian mackerel have been caught, with catches increasing from 12,690 metric tonnes in 1973 to a
peak of 50,574 metric tonnes in 1983. After that, catch has followed a fluctuating and slightly
decreasing trend. Tantisawetrat (1996) estimated MSY for the Indian mackerel using data relating to
catches made from 1984 to 1993 in waters adjacent to the western coast of the Gulf of Thailand
(areas II, III and VI). MSYs estimated from the use of virtual population analysis and the surplus
production model, were 32,866 and 32,533 metric tonnes, respectively. The analysis indicated an
optimum fishing effort level of 112,500 days of luring purse seine fishing. No definite sign of
overfishing has been observed for this species yet. However, it is suggested that an increase in luring
purse seine mesh size from 2.5 cm to 3 cm would increase yield per recruit by approximately 20%.
Sardines (Sardinella spp.)
Sardines are mainly caught by purse seines, particularly luring purse seine in both coastal and
offshore areas. The development of large-scale fishing for sardines has followed a trend similar to that
for Indian mackerel. Fishing effort levels increased significantly after 1973, resulting in a peak landing
of 203,364 metric tonnes in 1977. After that, catches declined gradually to 68,447 metric tonnes in
1985, which then slowly recovered to a range from 110,000 to 140,000 metric tonnes per annum.
From 1983, the number of purse seines increased, although the production of sardines did not
increase accordingly. The estimated MSY for sardines in the Gulf of Thailand is 104,000 metric
tonnes, with an optimum fishing effort level of approximately 190,000 days of luring purse seine
fishing. It is clear that fishing effort levels for sardine have exceeded the optimum since 1988. Hence,
sardine stocks have shown signs of overfishing. It is recommended that fishing effort levels be
reduced by 14% in order to prevent further stock depletion.
Round scads (Decapterus spp.)
It is well known that the development of purse seine fisheries in Thailand depended significantly on
the discovery of new fishing grounds for round scads in the middle of the Gulf of Thailand in 1973.
This resulted in the abrupt increase in the catch of these species from 660 metric tonnes in 1972 to
12,690 metric tonnes in 1973, which then increased steadily to reach a maximum catch of 129,800
metric tonnes in 1977. Catches then declined gradually and have fluctuated between 20,000 and
40,000 metric tonnes for the past 15 years. Although the number of luring purse seines increased
from 505 units in 1977 to 730 units in 1981 and 1982, catches were extremely low during this latter
period when compared to the high catches observed in 1977 and 1978.
Anchovies (Stolephorus spp.)
Anchovies are very small pelagic fish that are widely distributed in inshore waters. In the Gulf of
Thailand, 12 species are observed in catches, although the most dominant is Stolephorus heterolobus
(or Encrasicholina heteroloba). This species constitutes about 87% of the total anchovy catch. The
main fishing gears used in anchovy fisheries include the small-meshed purse seine (or anchovy purse
seine), push net, bamboo stake trap, and luring lift net or luring falling net. However, the most
important fishing gear is the anchovy purse seine, which is utilised both during the day and night time.
The catch of anchovies increased markedly after 1981, mostly in response to the use of artificial light
to attract schools of fish at night and a redirection of fishing effort to offshore waters. These factors
contributed to increases in catch levels from approximately 15,000 metric tonnes to 103,101 metric
tonnes in 1985. Catches of anchovies have been maintained at a level from 110,000 to 120,000
metric tonnes for the past 5 years. The estimated MSY for anchovies in the Gulf is 104,000 metric
tonnes. This means that anchovy resources have been heavily exploited since 1985 and that any
increases in fishing effort should be carefully considered.
Bigeye scad (Selar crumenophthalmus)
Bigeye scad is a member of the Carangidae family. Previously, fishery statistics for bigeye scad were
compiled at the species combined level due to mixed catches and the difficulties associated with
species identification at-sea. After the development of luring purse seine fisheries and the redirection
of fishing effort to offshore waters, bigeye scad have been caught in large quantities. Since 1980,
statistics for bigeye scad have been compiled at the species level and some research into the species
has been conducted. The catch of bigeye scad from 1980 to 1993 ranged between 15,000 and
26,000 metric tonnes. However, catches increased significantly in 1994, peaking at 37,080 metric
tonnes. Assessment of the status of this species indicates that it is fully exploited in the Gulf, with an
Reversing Environmental Degradation Trends in the South China Sea and Gulf of Thailand
54 NATIONAL REPORT ON FISHERIES THAILAND
estimated MSY of 18,500 metric tonnes and optimal fishing effort level of 125,000 days of luring purse
seine fishing (Isara 1993).
Neritic tunas (Thunnus tonggol, Euthynnus affinis and Auxis thazard)
Prior to the 1980's, neritic tuna catches in the Gulf of Thailand were relatively low, ranging from 3,298
to 19,929 metric tonnes. However, fisheries for these species developed rapidly after 1982, mostly in
response to strong demand for tuna for canning. Expansion has also been driven by improvement in
fishing gear and methods, including purse seine technology, new larger fishing boats, and use of
refrigeration. Accordingly, catches increased from 39,368 metric tonnes in 1982 to 157,163 metric
tonnes in 1992, which also depended on promoting fisheries outside Thai waters through joint
ventures or fisheries agreements with neighbouring countries, and the exploration of new fishing
grounds. The MSY for neritic tuna has been estimated at 86,000 metric tonnes (Chuenpun 1996).
Demersal fish
Attempts have been made to assess the state of demersal fish and trawl fisheries in the Gulf of
Thailand. Gulland (1972) estimated the total potential of the waters along the coast of Thailand as
500,000 metric tonnes. Boonyubol and Pramokchutima (1982) estimated the potential yield at
750,000 metric tonnes per year at 8.6 million hours of fishing effort. Boonwanich (1993) estimated a
maximum sustainable yield of demersal resources at 893,000 metric tonnes, with optimal fishing effort
levels of 22 million hours. However, total catch and effort in 1989 was 843,300 metric tonnes and 34
million hours, respectively. The results of these studies indicate that demersal fisheries resources
have been overexploited.
Shrimps
The potential yields and optimal fishing effort levels (otter board trawl boat <18 m) for economically
important and miscellaneous penaeid shrimp from 1971 to 1990 were estimated to be 22,000 metric
tonnes at 25 X 106 hrs and 110,000 metric tonnes at 44 X 106 hrs, respectively. The overexploitation
of shrimps has taken place since 1981 (Vibhasiri 1993).
Cephalopods
In the Gulf of Thailand, squid production increased from 21,000 metric tonnes in 1971 to 72,000
metric tonnes in 1983. This increased production relied on the use of artificial light to attract squid for
capture, as well as a highly developed fishing practice known as "light luring squid fishing". At present,
4 types of net are used to catch squid, including cast nets, stick-held dip nets, stick-held cast nets,
and stick-held box nets, among which the stick-held cast net is the most popular (Supongpan et al.
1992). From 1984 to 1991, production ranged between 57,000 and 68,000 metric tonnes (Supongpan
1993). It was estimated that Loligo duvauceli has been fully exploited since 1984 (Supongpan 1988;
FAO 1993) and Loligo chinensis was overexploited around 20% of the present catch of the year 1984
(Supongpan 1988).
The production of cuttlefish from the Gulf of Thailand from 1971 to 1991, ranged from 12,000 to
50,000 metric tonnes. The highest recorded production was 50,077 metric tonnes in 1991. Cuttlefish
are thought to be overexploited (Supongpan 1995). According to statistics, cuttlefish production
increased annually from 1985 to 1991. This was mainly a result of the development and expansion of
squid traps, which catch bigfin reef squid and cuttlefish. The statistical records for cuttlefish include
bigfin reef squid due to the similarity in appearance between it and cuttlefish.
Octopus production from the Gulf of Thailand ranged between 500 and 16,000 metric tonnes from
1971 to 1991. The highest recorded production was 15,828 metric tonnes in 1991. Octopus is thought
to be overexploited (Supongpan 1993). The statistical records show increases in production from
1985 to 1990. This was mostly due to improved utilisation and processing of octopus, which resulted
in fishers sorting octopus from catches of trash fish.
3.3 Threats
3.3.1 Current
(e.g. destructive fishing practices, overfishing)
The rapid development of both pelagic and demersal fisheries has resulted in reduced abundances of
fisheries resources. Many of the coastal and inshore fisheries resources are fully utilised, and some
groups, especially demersal species, have been depleted due to intense exploitation and the use of
destructive fishing gears and methods, including trawls, push nets, shortnecked clam dredges,
Reversing Environmental Degradation Trends in the South China Sea and Gulf of Thailand
NATIONAL REPORT ON FISHERIES THAILAND 55
dynamite blasting, and chemical poisoning. These fishing methods have direct and indirect
implications for living resources and their habitats.
The use of destructive fishing gears and illegal fishing methods are problems that require law
enforcement. As the use of various types of fishing gear has increased, conflicts have arisen between
commercial and small-scale fishers, and even among small-scale fishers themselves. These conflicts
have revolved around competition for scarce resources in inshore and coastal waters. Trawls and
mechanised push nets often damage small-scale fishing gears, such as gill nets and traps. Such
occurrences exacerbate conflict situations.
Thailand's marine capture fisheries face many problems associated with law enforcement in the EEZs
of neighboring countries. Many of these areas were fishing grounds for Thai fishers prior to the
adoption of the EEZ regime, which has resulted in a reorientation/realignment of their traditional
fishing grounds and decreases in available fishing areas and resources.
The impacts of human and economic activities on the coastal zone are visible in the form of resource
degradation or depletion either by direct exploitation or indirectly through pollution. Mangroves, which
serve as nurseries for marine juveniles and protect shorelines, have been reduced to less than half of
their area in 1961. This has mainly been due to their use for charcoal making, and destruction for road
and port construction, human settlements, agriculture, fishing gear, and aquaculture. Coral reefs and
seagrass beds have also been extensively damaged in many areas by fishing activities, however,
inadequate data makes estimation of exact losses difficult. Beaches have also been degraded by
development activities, notably tourism. The expansion of industrial, urban, tourism, agriculture, and
aquaculture activities in coastal areas have all contributed to intensified resource use and pollution.
The agents of coastal resource degradation are not confined to coastal areas themselves. The rapid
industrial, urban, and agricultural growth experienced during the economic boom of the last decade,
has resulted in increased pollution loads entering the sea via river runoff. Deforestation in upper
watersheds has increased sediment loads in river discharge, causing sedimentation and the clogging
of harbours and estuaries, requiring frequent dredging. Some 70% of pollution in the Gulf of Thailand
is attributed to land-based activities (OEPP 1995). Pollution was implicated as one of the main factors
responsible for the shrimp production crash in the upper Gulf of Thailand area during 1989 and 1990
(Briggs 1994). Nutrient-rich agricultural and domestic waste may also play a major role in the frequent
algal blooms (red tide) and fish mortalities observed along the eastern and southern Gulf coasts.
As most shrimp farms are located on mangrove sites, the highest rates of mangrove destruction
occurred from 1979 to 1986. During this period, many mangrove areas were converted to shrimp
farms, with mangrove losses averaging almost 13,000 ha/year (Tongchai and Jirawan 1997 cited
Aksornkoae 1998), or 4.5% annually (Isvilanondas and Tokrisna 1994). As much as 93% of the
mangrove destruction observed during this period has been attributed to conversion to shrimp farms
(Aksornkoae 1989).
Time series trends for a number of industry indicators have raised increasing concerns about the
sustainability of the sector. These include:
· Rapidly declining catch rates (CPUE), which are now only 7% of the levels in the early 1960s;
· Fish catches from the Gulf of Thailand are well above the estimated MSYs, and catch rates
(CPUE, kg/hr) have declined significantly;
· Nearly 40% of the catch from Thai waters consists of low value fish; the demand from a
heavily protected local fishmeal industry is at least partly responsible for the continued
exploitation of an otherwise uneconomical fishery. A significant portion of the trash fish catch
consists of juveniles of important species, indicating non-compliance with mesh size
regulations;
· The actual numbers of boats fishing is much higher than that registered, since many boat
owners tend to avoid registration and fish illegally. Annual fluctuations in the number of
registered boats are due to many factors, including termination of licences for old boats, new
licences issued to ageing vessels, licences being revoked for violators, and reluctance of
some boat owners to renew licences;
· An unknown quantity of fish caught illegally by commercial operators in coastal waters
reserved for small-scale fisheries, generating conflict within coastal fishing communities; and
Reversing Environmental Degradation Trends in the South China Sea and Gulf of Thailand
56 NATIONAL REPORT ON FISHERIES THAILAND
· The degradation of coastal and marine environments associated with the development of
infrastructure, urbanisation, industry, land-based agriculture, and aquaculture.
Declines in marine fisheries resources can be attributed to a number of factors. These include:
excessively high fishing effort levels; use of destructive fishing gear (e.g. trawl, push nets) and
methods (e.g. large scale trawling in near shore areas, use of push nets near coral reefs); violation of
regulations (e.g. fishing in fish spawning grounds during periods of temporary fishing bans);
destruction of fish habitats, such as mangroves, seagrass meadows, and coral reefs; and
inappropriate or uncoordinated policies (e.g. the protection of the fishmeal industry has a direct impact
on fisheries, since it has encouraged capture of small trash fish, often leading to high catches of
juveniles of other important species).
3.3.2 Potential (project market demand, increased coastal population)
Fish and fish products are particularly important to Thai people as a primary source of animal protein.
With a wide range of species and products available to choose from, and rising purchasing power of
consumers, demand for fish products has grown in recent years.
The domestic demand for fish is predicted to increase at an average of 1 to 2% per annum.
International demand for fish products is expected to increase with a wide range of products available.
However, growth in international demand substantially relies on product quality and safety.
Recently, market demand for live marine resources has increased significantly, especially in coastal
areas frequented by tourists. Consumer preferences are also shifting to smaller sizes of specially
prepared fish, shrimps, crabs, and squids. Accordingly, fishers have begun to supply these smaller
fish to markets as much as possible, with little attention paid to the potential impacts of such actions
on fish populations and their environments.
4.
HABITATS & AREAS OF IMPORTANCE IN THE MAINTENANCE OF EXPLOITED FISH
STOCKS
4.1
The physical, chemical, and biological characteristics of the Gulf of Thailand
The Gulf of Thailand may be characterised as a classical two-layered, shallow water estuary. Low
salinity water, diluted by heavy precipitation and fresh water runoff, flows out of the Gulf at the
surface. There is inflow of high salinity, relatively cool water from the South China Sea into the Gulf.
This high salinity water fills the deep, central depression below a depth of approximately 50 m.
Superimposed on this 2-layered system is a complex circulation system, which is established by wind-
driven currents related to monsoon winds and tidal currents. Neither the northeast nor the southwest
monsoon winds are observed to have a constant direction or velocity over the Gulf as a whole. The
interplay of variable winds, tidal currents, fresh water runoff, and excessive precipitation gives rise to
localised areas of divergence where low temperature, high salinity water, usually of low oxygen
content, is upwelled. These forces also establish areas of convergence where high temperature, low
salinity, and highly oxygenated water sinks. All of these characteristics make the Gulf of Thailand one
of the most productive areas in Southeast Asia.
Takahashi et al. (1985) observed that regions of relatively steep horizontal gradients in surface water
properties, such as salinity, nutrient salts, and phytoplankton, were located in the vicinity of Samui
Island, where oceanic fronts form due to the convergence of water masses from coastal areas and
the central Gulf that originate from the South China Sea. This indicates that water areas adjacent to
Samui Island are potentially good for fishing.
The combined effects of topographical features, tidal regimes, monsoonal water circulation,
freshwater runoff, coastal upwelling, and offshore water intrusions govern the oceanography of the
Gulf of Thailand. The annual surface water temperature varies very little. Gulf waters are well mixed
before the NE monsoon, after which a thermocline becomes more distinct.
From fish egg and larval surveys, it is apparent that pelagic and demersal fish spawn during both the
NE and SW monsoon, with a peak in spawning after the NE monsoon. More species probably spawn
in the area during the SW monsoon season (SEAFDEC 1999).
Reversing Environmental Degradation Trends in the South China Sea and Gulf of Thailand

NATIONAL REPORT ON FISHERIES THAILAND 57
There are 12 species or groups of species with known spawning and fishing grounds. Marine environmental
conditions are also known. These include: bathymetry and coastal geomorphology; water circulation and tide;
meteorological parameters, i.e., wind, monsoon season, air temperature, humidity, and air pressure;
seawater parameters, i.e., salinity, temperature, pH, dissolved oxygen (DO), nutrients, total suspended
solids, and turbidity; phytoplankton and zooplankton; primary production, benthos, and bottom sediment
characteristics.
4.1.1 Known
spawning
grounds
Describing the spawning and fishing grounds of 12 species/species groups is complicated. Here, the
characteristics reviewed are similar to the environmental characteristics of the spawning grounds. The
spawning grounds of some marine fauna in the Gulf of Thailand have been surveyed intensively. The
results of the surveys, conducted since 1963, indicate that the larvae of Rastrelliger spp. concentrate in an
area 10 to 40 nautical miles off the western coast of the Gulf of Thailand (Figure 14) (Boonprakob 1965;
Matsui 1970). Phytoplankton and zoophankton were abundant in this area during the spawning season
(Suvapepun and suwanrampha 1970).
99° 100° 101
102
103
104
105°E
14°N
BANGKOK
Samut Prakan
Samut Sakhon
Chachoengsao
Samut Songkhram
Chon Buri
13°
Phetchaburi
Rayong Chanthaburi
Trat
12°
Prachuap Khiri Khan
11°
Chumphon
10°
9°
Surat Thani
Nakhon Si Thammarat
8°
7°
Songkhla
1-100 / 1000 m3
Pattani
101-500 / 1000 m3
Narathiwat
>500 / 1000 m3
6°
Figure 14 The abundances of Indo-Pacific mackerel larvae (R. neglectus) observed at
various surveys stations in the Gulf of Thailand (Boonprakob 1965).
Reversing Environmental Degradation Trends in the South China Sea and Gulf of Thailand

58 NATIONAL REPORT ON FISHERIES THAILAND
The spawning grounds and season for Decapterus maruadsi and D. macrosoma in the Gulf of
Thailand was determined from observations of seasonal changes in the stage of gonad
development. Spawning was believed to occur from February to August, with peaks from
February to March and from July to August in the deeper area of the Gulf (Figure 15) (Chullasorn
and Yusukswad 1978). Spawning grounds of neritic tuna are located along the Gulf's western
coast, with concentrations in the middle of the Gulf (Figure 16). The spawning grounds for
anchovy are depicted in Figure 17.
99° 100° 101°
104°
102° 103°
105°E
14°N
BANGKOK
Samut Prakan
Samut Sakhon
Chachoengsao
Samut Songkhram
Chon Buri
13°
Phetchaburi
Rayong
Chanthaburi
Trat
12°
Prachuap Khiri Khan
Jan-Mar
Jul-Aug
11°
Chumphon
Jan-Mar
Jul-Aug
10°
9°
Surat Thani
Feb-Mar
Jul-Aug
Feb-Mar
Jul-Aug
Nakhon Si Thammarat
8°
7°
Songkhla
Pattani
Narathiwat
6°
Figure 15 The spawning grounds of round scads (Decapterus spp.) in the Gulf of Thailand
(Chullasorn and Yusuksawad 1978).
Reversing Environmental Degradation Trends in the South China Sea and Gulf of Thailand

NATIONAL REPORT ON FISHERIES THAILAND 59
99° 100° 101°
104°
102° 103°
105°E
14°N
BANGKOK
Samut Prakan
Samut Sakhon
Chachoengsao
Samut Songkhram
Chon Buri
Phetchaburi
13°
Rayong Chanthaburi
Trat
12°
Prachuap Khiri Khan
11°
Chumphon
10°
Stations were found neritic larvae in 1987
Stations were found neritic larvae in 1975, 1983
9°
Surat Thani
Nakhon Si Thammarat
8°
7°
Songkhla
Pattani
Narathiwat
6°
Figure 16
The stations where the eggs and larvae of neritic tunas have been observed to be
abundant during surveys conducted in the Gulf of Thailand (Chamchang and
Chayakul 1990).
Reversing Environmental Degradation Trends in the South China Sea and Gulf of Thailand

60 NATIONAL REPORT ON FISHERIES THAILAND
99° 100° 101°
104°
102° 103°
105°E
14°N
BANGKOK
Samut Prakan
Samut Sakhon
Chachoengsao
Samut Songkhram
Chon Buri
13°
Phetchaburi
Rayong
Chanthaburi
Trat
12°
Prachuap Khiri Khan
11°
Chumphon
10°
9°
Surat Thani
Nakhon Si Thammarat
8°
7°
Songkhla
Pattani
Narathiwat
6°
Figure 17 The spawning grounds for anchovy in the Gulf of Thailand (Vatanachai 1978;
Chansakul 1988; Chayakul 1990 cited in Saikliang 1995b).
4.1.2 Known nursery areas
Many studies have shown that the distribution and abundance of pelagic and demersal fish larval are
related to plankton densities. Plankton production rates are higher in near shore areas and decrease
vertically with depth.
The nursery areas of important marine fauna in the Gulf of Thailand are mostly located in inshore
areas, including mangrove areas, seagrass meadows, and coral reefs. The feeding grounds of most
fished species are generally the same as the areas in which they are fished.
4.1.3 Known
fishing
grounds
The fishing grounds for important marine fish species in the Gulf of Thailand were depicted in Figures
6 to 12 of this report.
Reversing Environmental Degradation Trends in the South China Sea and Gulf of Thailand
NATIONAL REPORT ON FISHERIES THAILAND 61
4.1.4 Seawater quality and pollutants
Seawater Quality
Seawater quality has been studied since 1956. The data vary widely in response to spatial and
seasonal fluctuations. Low DO, high biological oxygen demand (BOD), and elevated nutrient
concentrations characterise coastal water areas adjacent to river mouths and human settlements
(Sitthichokpan 1977; Tharnbubpa 1977; Tharnbubpa and Jusiripongkul 1984; Sanguansin et al.
1999). These characteristics may be influenced by waste disposal from human, agricultural, and
industrial activities into the Chao Phraya, Tha Chin, Mae Klong, and Bang Pakong Rivers. These
rivers also receive organic wastes from human activities and carry them toward the sea, often
resulting in poor estuarine water quality (Table 22). The Pollution Control Department (PCD) (1999)
studied water quality at 218 sampling stations located 100 m and 500 m offshore during dry and rainy
seasons in 1998. The study identified DO lower than 4 mg/l in some inner Gulf stations adjacent to
the estuaries of the Chao Phraya, Tha Chin, and Bang Pakong Rivers, as well as the Taboon canal at
Petchaburi. The nutrient enrichment of coastal waters has also caused low water quality,
eutrophication, and phytoplankton blooms (Suvapepun 1984).
Table 22 Water quality parameters recorded in lower parts of the Chao Phraya, Tha Chin,
Mae Klong, and Bang Pakong Rivers.
DO
BOD
NH
Coliform bacteria
Area
3 N
Reference
(mg/l)
(mg/l)
(mg/l)
(MPN/100 ml)
- Lower Chao Phraya
0.5
3.0
1.3
46,000
PCD (1998)
- Lower Tha Chin
1.0
2.1
0.7
24,000
PCD (1998)
- Lower Mae Klong
6.0
1.3
-
3,200
PCD (1998)
- Lower Bang Pakong
4.3
0.9
-
500
PCD (1998)
- Chao Phraya and
1.1-3.5
-
0.005-0.099
32-54,000
PCD (1999)
Tha Chin River mouth
- Mae Klong and
2.4-8.3
-
0.006-0.25
8-2,300
PCD (1999)
Bang Pakong River mouth
Source: PCD, 1998; 1999.
4.1.5 Biological
parameters
Phytoplankton
Piromnim (1985) studied phytoplankton in the central Gulf of Thailand from Chumphon to Songkhla
Province during the southwest monsoon in 1984. The area surveyed covered a wide range of depths
(13 to 77m), grouped into the depth ranges of 17 to 48, 50 to 61, and 65 to 77m. The results indicated
that the average density of phytoplankton was 96,674, 17,689, and 8,729 cells/m3 at each of the 3
depth ranges, respectively. Of the 36 genera identified, there were 28 genera of diatoms, 7 genera of
dinoflagellates, and 1 genus of green algae. Trichodesmium thiebauti dominated all stations and
depths. The species confined to the deepest waters were Planktonella sol, Gosslerriella tropica, and
Biddulphia sinensis. The density of some species varied significantly by water depth. These include
Thalassiothrix frauenfeldii, Cossinodiscus spp., Rhizosolenia calcaravis, Ceratium dens, C.
trichoceros, and Thalassiosira subtilis. Moreover, Cerataulina compacta, C. bergonii, and Guinardia
flaccida were mostly coastal species. Asterolampra marylandica, Asteromphalus sp., Dactyliosolen
antarcticus, and Planktonella sol were observed offshore.
Boonyapiwat (1999) studied phytoplankton in the Gulf of Thailand from the upper part of the Gulf to
the eastern coast of Malaysian Peninsular. Seawater samples were collected from 81 stations during
the pre-northeast monsoon season (4 Sept. to 4 Oct. 1995) and the post-northeast monsoon season
(23 Apr. to 23 May 1996). The study observed 260 taxa, composed of 2 species of blue green algae,
133 species of diatoms, and 107 species of dinoflagellates. A blue green algal species and 17
species of diatoms were dominant. The species most frequently observed were Ocillatoria erythraea,
Thalassionema flauenfeldii, Chaetoceros lorenzianus, and C. compressus. Cell densities in the study
area ranged from 178 to 113,336 cells/l, and were generally higher in coastal waters than those
offshore.
Reversing Environmental Degradation Trends in the South China Sea and Gulf of Thailand
62 NATIONAL REPORT ON FISHERIES THAILAND
Phytoplankton observations were carried out during joint surveys of fisheries resources and
oceanography by Thai and Vietmanese researchers in the area from latitude 07°40 to 09°30N and
longitude 101°50 to 103°10E in the middle of the Gulf of Thailand. 2 sampling cruises were
conducted from 16 Nov. to 18 Dec. 1997 and 11 Aug. to 2 Sep. 1998. 320 taxa, composed of 2
species of blue green algae, 154 species of diatom, and 144 species of dinoflagellates were
identified. 8 species of phytoplankton were dominant during the southwest monsoon. Chaetoceros
diversus and C. lorenzianus dominated the surface flora, whilst C. messanensis and Proboscia alata
dominated mid depths. Coscinodiscus jonisianus was the dominant species at the bottom. The
species with highest cell densities at all sampling depths were Oscillatoria erythraea, Thalassionema
frauenfeldii, and T. nitzschioides. The relative abundance of these species during the southwest
monsoon was low. During the northeast monsoon, O. erythraea and T. frauenfeldii dominated. The
first species occurred with highest relative abundance from surface to mid-depths, whilst the second
dominated the bottom layer of all stations. The densities observed during this period were relatively
high (Department of Fisheries 1999).
Musikasung et al. (1998) studied primary production in the Gulf of Thailand and the eastern coast of
the Malaysian Peninsular. The rates of primary production observed, ranged from 0.20 to 0.61 and
0.29 to 0.47gC/m2/day for the Gulf of Thailand and the eastern Malaysian Peninsular waters,
respectively. In nearshore areas, highest rates of primary production were observed near the surface,
which declined gradually with depth. However, in offshore areas, the production rate increased in the
layers where subpycnocline chlorophyll was found. Moreover, variability in daily primary production
was observed to be closely related to changes in phytoplankton biomass.
Zooplankton
Jivaluk (1999) studied the distribution, abundance, and composition of zooplankton in the Gulf of
Thailand from the upper Gulf to the eastern coast of the Malaysian Peninsular. Samples were
collected at 81 stations from 4 Sept. to 4 Oct.1995 for the pre-northeast monsoon and from 23 Apr. to
23 May 1996 for the post-northeast monsoon. This study observed 34 groups of zooplankton.
Copepods were most abundant during both periods, followed by Chaetognatha in during the pre-
monsoon period and Ostracod in the post-monsoon period. Biomass and density varied from 0.069 to
20.172ml/m3 and 36 to 3,413no/m3 during the pre-monsoon period, and 0.18 to 2,589ml/m3 and 91 to
1,514no/m3 during the post-monsoon period, respectively. There was significant difference in
abundance between pre and post monsoon periods, although there was no significant difference
between biomass for both periods. Generally, abundance was higher at nearshore stations, especially
near Pattani Bay, Samui Island, and Sattahip, than offshore stations. Moreover, fish larvae and eggs
occurred near Samui Island, Pattani Bay, and nearshore stations adjacent to the lower part of the
Malaysian Peninsular during pre-monsoon periods. During the post-monsoon period, fish larvae were
abundant near Samui Island, whilst fish eggs were observed near Prachuab Khiri Khan Bay.
The Department of Fisheries (1999) studied zooplankton in the central Gulf of Thailand between
latitude 07°40' to 09°30'N and longitude 101°50' to 103°10'E from 16 Nov. to 18 Dec. 1997 and 11
Aug. to 2 Sept. 1998. 8 phyla of zooplankton, composed of Coelenterata, Chaetognatha, Annelida,
Branchiopoda, Arthropoda, Mollusca, Echinodermata, and Chordata, were collected. The most
abundant phylum was Arthropoda. The average biomass and density were 0.79ml/m3 and
4,300.39no/m3 during the first cruise, and 0.45ml/m3 and 751no/m3 during the second cruise,
respectively.
Fish larvae
Termvichakorn (1999) reported that 73 families and 97 species of fish larvae were found from the
upper part of the Gulf to the eastern coast of the Malaysian Peninsular during the pre-northeast (4
Sept. to 4 Oct. 1995) and post-northeast (23 Apr to 23 May 1996) monsoon seasons. The most
abundant fish larvae retained in horizontal surface hauls were Stolephorus spp., Sardinella spp.,
Gobiidae, and Upeneus spp. Those from the oblique hauls included Gobiidae, Stolephorus spp.,
Bregmaceros rasisguamosus, and Nemipterus spp. Moreover, larvae were more abundant in coastal
waters and adjacent to islands, than deeper or offshore waters. The observed abundances of
Sardinella spp. and Stolephorus spp. larvae indicate that spawning peaks in the post monsoon.
Fish larvae in the central Gulf of Thailand were surveyed by the Department of Fisheries (1999) from
16 Nov. to 18 Dec. 1997 and 11 Aug. to 2 Sept. 1998. 50 families of fish larvae were found during this
study. The Gobiidae were most abundant, followed by Monacanthidae, Carangidae, Scombridae,
Bothidae, and Bregmacerotidae, respectively.
Reversing Environmental Degradation Trends in the South China Sea and Gulf of Thailand
NATIONAL REPORT ON FISHERIES THAILAND 63
Surveys conducted in the western Gulf of Thailand from Surat Thani to Narathiwat during February to
August 1984 yielded 47 families of pelagic fish larvae (Chamchang 1986). Family Gobiidae was
observed to dominate in terms of distribution and abundance. Family Engraulidae was the most
dominant group of economically important pelagic fish larvae. Total density of fish larvae was highest
during the inter-monsoon period (April). Densities declined in the month of June and August during
the southwest monsoon period. Lowest densities were recorded in February during the northwest
monsoon period. Most fish larvae were widely distributed throughout the study area, although were
concentrated in the area from Samui Island to Songkhla province. Larvae were most concentrated
along the coast of Pattani province in April. Similarly, the highest and lowest densities of fish eggs
were recorded in February and June, respectively.
Pornpatimakorn and Chayakul (1986) found 24 families of fish larvae in the central Gulf of Thailand.
Englaulidae were dominant and represented by several Stolephorus species, followed by
Hemirhamphidae, Theraponidae, Clupeidae, Eisterlaridae, Mullidae, Bothidae, and Carangidae.
Benthos
Sanguansin (1986) studied the benthic macrofauna of the central Gulf of Thailand from 16 May to 9
June 1984. 102 species were found with an average biomass of 9.67g/m2 and average density of
68no/m2. Callianassa sp. was the dominant crustacean species, whilst the polychaete fauna was
dominated by Terebellides sp. Both were very abundant. Echinoderm biomass was the highest.
Fishes, molluscs, nemerteans, echiurans, sipunculids, oligochaetes, nematodes, and anthozoans
were also recorded. The benthic macrofauna was concentrated in shallow areas, especially near
Samui and Pha-ngan Island.
The ecology of macrobenthic fauna in the Gulf of Thailand, from the upper part of the Gulf to the
eastern coast of the Malaysian Peninsular, was studied during pre-northeast monsoon (4 Sept. to 4
Oct. 1995) and post-northeast monsoon (23 Apr. to 23 May 1996) periods. This study identified 6
groups of macrobenthic fauna in the study area, including polychaetes, crustaceans, molluscs,
echinoderms, fishes, anthozoans, nemerteans, sipunculids, and amphioxus. The polychaetes
dominated the benthic fauna. The average density of the benthic macrofauna was 88no/m2 in the pre-
northeast monsoon period, and 97no/m2 in the post NE monsoon period. Moreover, species
abundance and diversity was higher in inshore rather than offshore areas. Polychaetes, crustaceans,
and echinoderms displayed marked changes in abundance by monsoon period, and the diversity
index varied during the pre and post-northeast monsoon periods (Piamthipmanus 1999).
Benthic macrofauna in the central Gulf of Thailand from latitude 07o40' to 09o30' N and longitude 101o
50' to 103o 10' E was surveyed by the Department of Fisheries (1999). The survey identified 7 groups
of benthic animals from 16 Nov. to 18 Dec. 1997 and 11 Aug. to 2 Sep. 1998. Polychaetes and
crustaceans dominated the first and second cruises, respectively. Echinoderms, oligochaetes,
nemerteans, fishes, and sipunculids were also observed. Average density and biomass was
22.5no/m2 and 3.79g wet weight/m2 for the first cruise, and 37.86no/m2 and 3.47g wet weight/m2 for
the second cruise, respectively.
4.1.6 Bottom
sediment
Reports of bottom sediment studies conducted by Charoenruay (1984) in the Gulf of Thailand indicate
that Gulf sediments are mostly mud or silt. There are only two locations characterised by sand,
namely the Sattahip coast and the Pattani Province coast. The thickness of sediments range from 5 to
75cm, with mud sediments being thicker than sandy sediments. Hard clay is usually found beneath
the soft substrates.
The mud sediments of the central Gulf of Thailand can be subdivided into 3 types, according to mud
content. The finest particle sediments (mud content >90%) are located adjacent to Samui Island.
Medium sized particle sediments (mud content 70 to 90%) characterise the inner central Gulf,
whereas the coarsest sediments (mud content <70%) are distributed on Gulf's outer sides (Takahashi
et al. 1985).
Reversing Environmental Degradation Trends in the South China Sea and Gulf of Thailand
64 NATIONAL REPORT ON FISHERIES THAILAND
4.2
Unknown issues such as stocks with undefined spawning grounds
There are many unknown issues regarding fishery resources in Thai waters. Geographical
distributions and spawning grounds of many economically important species/species groups are not
clearly known. Similarly, it is a known fact that marine resources in tropical areas are multi-species in
nature and may be composed of several different stocks for each species. Information regarding the
migratory routes of pelagic and semi-pelagic resources is also lacking, except for Indo-Pacific
mackerel that has formed part of an extensive tagging program for many years. Therefore, basic
information relating to significant transboundary stocks is usually not available. Strengthened
cooperation amongst scientists and research institutes should be pursued.
The 1985 FAO/SEAFDEC Workshop on Shared Stocks in Southeast Asia (FAO/SEAFDEC 1985)
aimed to provide some guidance for improved regional utilisation and management of stocks. There
are now at least 40 stocks being shared by 2 or more regional countries. A key action in identifying
shared stocks is to determine the location and timing of spawning. Genetic studies are now an
effective method to identify stocks, with the implementation of such activities requiring the close
cooperation of the coastal States concerned.
4.3
Threats, current and potential (coastal development, pollution, oil spills)
4.3.1 Coastal
development
A number of changes have occurred in Thailand's coastal areas during the past 40 years. These
include the establishment of human settlements and urban expansion, infrastructure development,
tourism and industry development, agriculture and tree plantations, and coastal aquaculture. Perhaps
the most widely recognised impacts of these changes in land usage include the large (approximately
50%) loss of mangrove forest cover since the early 1960s, and the dereliction of land following shrimp
pond failures in a number of coastal provinces.
Land rights are one of the most complicated and politically sensitive issues in Thailand. Like their
inland counterparts, coastal communities often do not have adequate land rights. However, land
ownership is frequently transferred through informal and illegal deals. Increased agricultural and
industrial activities, as well as urbanisation further inland, have created a number of externalities in
the form of hydrological changes, and the land-based pollution of coastal waters.
4.3.2 Oil
spills
Numerous oil spills have occurred in both Thai river mouths and the Gulf. Oil can be discharged into
the Gulf not only from routine transportation activities, but also from accidents. Although large oil spill
accidents are infrequent (Table 23), they usually release a large quantity of oil each time they occur.
Consequently, oil spills contribute to 12% of the total volume of oil pollution in Thai waters (Yindepit
1993).
Along the coast of Rayong Province, oil spills have occurred frequently since 1986. In fact, there are 3
to 5 oil spills annually. Most spills involve crude oil, which pollutes beaches and inshore waters.
Typically, the length of beach affected ranges from 5 to 15km, and the spills are thought to have had
negative impacts on capture fisheries and aquaculture in this area.
4.3.3 Pollution
Chareonpanich and Seurungreong (1999) reported that coarse material, including sand and gravel,
usually settles in the nearshore zone of Peninsular Malaysia, whilst fine-grained particles, including
silt and clay, are usually deposited in areas with restricted current in the central Gulf of Thailand and
near Samui Island.
The coastal and marine environment of the Gulf of Thailand has been degraded by a combination of
land and marine-based pollutants. Land-based pollutants are transported via major rivers to the Gulf
of Thailand. They are derived from municipal, agricultural, and industrial activities in river catchments.
Several land-based activities near coastal areas, including deforestation, urban development, tourism,
and the human aggravation of erosion and siltation, have a high potential to pollute the Gulf either
directly or indirectly. Increased marine-based activities in the Gulf of Thailand threaten to exacerbate
pollution problems. These activities include dredging, shipping, and hydrocarbon exploration and
production.
Reversing Environmental Degradation Trends in the South China Sea and Gulf of Thailand
NATIONAL REPORT ON FISHERIES THAILAND 65
Major sources of land-based pollution are domestic sewage, solid waste, agricultural waste, industrial
waste, and toxic and hazardous waste. Land-based sources contribute approximately 70% of marine
pollution, whilst marine-based sources account for the remaining 30%. The pol utants threatening the
marine environment include organic matter, nutrients, sediments, litter and plastics, metals,
radionuclides, and hydrocarbons. They are prioritised differently from country to county. Many of them
are of particular concern, as they may be biomagnified in aquatic food chains (Jala and Aziz 1986).
Table 23
Large oil spill accidents in the Gulf of Thailand during the last 25 years.
Date Oil
type Volume
Location Cause
(tonnes)
1973
J.P. 4
Unknown
Sriracha
Fire tanker
Chonburi
Province
1979
Crude oil
300
Srichung Island
Fire tanker
Chonburi
Province
6 Mar.1994
Diesel
400
Srichang Island
Collision of tanker
And
container
30 Oct.1996
Crude oil
160
Oil loading station,
Leaking during
Rayong
Province Loading
4.3.4 Plankton
blooms
The most conspicuous and widespread effect of pollution on the marine environment of the Gulf is
perhaps eutrophication associated with nutrient enrichment, especially compounds of N and P,
leading to accelerated growth of plankton, algae, and higher forms of plant life (Brodie 1996). Nutrient
enrichment is a key contributor to large phytoplankton blooms, which can harm and even kill other
marine organisms and humans.
Algal blooms have been studied in Thailand since the 1950s (Charoenpol 1957). This early work
included the development of a map illustrating the distribution of phytoplankton blooms and their
causes. Noctiluca sp. and Trichodesmium sp. were identified as species that often bloomed in the
Gulf of Thailand. In the past, such blooms were considered a natural phenomena and harmless to the
marine environment. However, the frequency of blooms has increased significantly. During the last 3
decades, algal blooms have occurred between January and August. During the rainy season, algal
blooms have often occurred at the river mouth areas of the Chao Phraya, Tha Chin, Mae Klong, and
Bang Pakong Rivers (Tamiyavanich 1984). The most common blooming species are the blue green
algae Trichodesmium erythraem and Noctiluca scintillans (Suvapepun 1989). Furthermore,
Coscinodiscus sp., Rhizosolenia sp., Hemidiscus sp., Chaetoceros sp., Bacteriastrum sp., Ceratium
sp., and Nitzschia sp. bloom occasionally. The major cause of algal blooms may be excessive nutrient
and organic pollution from major rivers.
From 1981 to 1987, there were 43 large phytoplankton blooms, mostly involving Trichodesmium
erythraeum (21 blooms), Noctiluca scintillens (17 blooms), and Diatom (5 blooms). A bloom caused
by Trichodesmium erythraeum was observed in eastern and central parts of the Gulf of Thailand from
May to June 1983. It covered an area of 7,000km2, causing anoxic conditions that subsequently led to
massive mortalities of demersal fishes, shellfish, crabs, and benthos, and crippled many aquaculture
activities. The estimated economic losses associated this bloom are in excess of US$1.16 million
(Suvapepun 1984). From 1991 to 1998, the 2 species of phytoplankton highlighted above caused 13
blooms along the eastern coast of the Gulf (Chonburi, Rayong, and Chantaburi provinces). Noctiluca
sp. has bloomed in coastal waters from Ang Sila to Sri Racha, Chonburi province, every year during
July and August, causing mass mortalities of fish and damage to aquaculture operations. Normally,
algal blooms caused by common species, i.e., Trichodesnium sp. and Noctiluca sp., have no direct
effects on fish. Bloom-related fish mortalities are mostly driven by sudden reductions in dissolved
oxygen and high ammonia concentrations. A bloom of Ceratium furca was observed at the Chao
Phraya River mouth during early January 2000. Figure 18 highlights areas in which phytoplankton
blooms occurred in the Gulf of Thailand from 1982 to 2000.
Reversing Environmental Degradation Trends in the South China Sea and Gulf of Thailand

66 NATIONAL REPORT ON FISHERIES THAILAND
99° 100° 101°
104°
102° 103°
105°E
14°N
BANGKOK
Samut Prakan
Samut Sakhon
Chachoengsao
Samut Songkhram
Chon Buri
Phetchaburi
13°
Rayong Chanthaburi
Trat
12°
Prachuap Khiri Khan
11°
Chumphon
10°
9°
Surat Thani
Nakhon Si Thammarat
8°
7°
Songkhla
Pattani
Narathiwat
6°
Figure 18
Areas in which phytoplankton blooms occurred in the Gulf of Thailand from
1982 to 2000 (after Suvapepun 1997).
Studies conducted since 1981 indicate that no phytoplankton bloom has involved a toxic species.
In May 1983, paralytic shellfish poisoning (PSP) was recorded in green mussels at Pranburi
Estuary, Prachaub Kiri Khan. Despite the problem occurring at the same time as a phytoplankton
bloom, its cause was unclear. At the time, phytoplankton was dense and comprised of various
species. In particular, the water was rich in blue green algae, and the diatom community was
dominated by Chaetoceros spp., Skeletonema costatum, Thalassiosira spp., and Cyclotella sp.
Densities of dinoflagellates were also above normal. The most abundant species was
Protoperilinium qinguecorne, and Prorocentrum micans, Peridinium spp., and Dinophysis spp.
were abundant. Alexandrium sp. was present, albeit in very low densities (Suvapepun et al.
1984). Following the bloom, human consumption of toxic green mussels (PSP) led to the loss of 1
human life and another 62 seriously ill patients. This event led to many studies on
phytotoxicology. Subsequently, the toxic phytoplankton, Alexandrium cohoticula, was found in the
Gulf of Thailand. These algae are rare and in very low concentrations, and have most likely never
caused a bloom. In conclusion, the effects of phytoplankton blooms in the Gulf of Thailand have
related to visual amenity, and the health of aquatic organisms and perhaps humans.
Reversing Environmental Degradation Trends in the South China Sea and Gulf of Thailand
NATIONAL REPORT ON FISHERIES THAILAND 67
4.4
Ranking of habitats
Among coastal ecosystems, mangroves, seagrass beds, and coral reefs are the most important
habitats. Physically, they play an important role in land protection by trapping sediments and reducing
erosion from various physical forces. Ecologically, they are characterised by high primary productivity,
which may enhance coastal production and fishery yields. Their environmental characteristics are
suitable for extensive assemblages of a vast variety of aquatic organisms, ranging from autotrophs to
heterotrophs, from tiny invertebrates to mammals, from juveniles to adults, from sedentary inhabitants
to highly migratory ones, or from dependent residents to transitory ones. More specifically, these
habitats have frequently been referred to as important nursery areas. In a socioeconomic sense,
these habitats provide significant economic benefits to local fishers and fish product traders. However,
seagrass beds are damaged directly by intense fishing with destructive fishing gears, i.e., beach
seines, mechanised push nets, and trawlers, and indirectly from sediment loads derived from tin
mining and land development. The marine fauna that are officially listed as being found in any of
these habitats are shown in Appendix 3.
Coral reefs are economically important because they provide sanctuary and feeding grounds for
higher order fish, which form the basis of small-scale fisheries. Similarly, they play a vital role in
supporting ecological balance. Furthermore, they are important in attracting tourists to the country. In
the Gulf of Thailand, Mu Koh Chang in Trat province, Ang Thong Archipelago, and Koh Tao in
Chumphon province have been declared as National Marine Parks.
4.4.1 Association with species of importance to food security
Fish is an important component of the diet of Thai people. Thailand is one of the top fish-producing
nations in the world. Geographical advantage is a factor attributed to the relatively high annual fish
production. Thailand has a total land area of about 540,000km2 and a coastline of 2,614km. Marine
fishing grounds that fall within Thailand's EEZ are located partly in the Gulf of Thailand and the
Andaman Sea, with a total area of about 350,000km2. The area of inland waters is approximately
3,750km2. Furthermore, over 1 million hectares of the Kingdom's coastal areas have coastal
aquaculture potential.
In 2000, the gross domestic production (GDP) of the fisheries sector was 123.2 billion baht, which
accounted for about 2.5% and 27.6% of national GDP and agricultural GDP, respectively. The fishing
industry has contributed to the development of other related industries, including fish processing, cold
storage, ice production, and shipbuilding. The number of people engaged in this sector was estimated
at approximately 826,980, of which 161,670 were engaged in marine capture fisheries, 77,870 in
coastal aquaculture, 404,340 in freshwater fish culture, and 183,100 in other related activities.
The fish produced are consumed domestically and exported for foreign exchange earnings. It is one
of the most important sources of protein. This is reflected in the per capita fish consumption rates of
25 to 32 kg per annum observed during the past decade. The export value of fish and fishery products
has increased significantly.
More than 200 fishing villages are in or near the area of coastal habitats along the Gulf of Thailand.
More than 80% of fishers engage in traditional or small-scale fisheries. The production from their
fishing activities has played an important role as a source of food and income for their families and
communities.
The Thai Government has recently introduced a project named the "Seafood Bank", which aims to
guide the allocation of approximately 284,000 rai (1,817.60km2) of inshore waters to small-scale
fishers and their communities for the development of aquaculture and sea farming. This project will be
of importance to food security and export promotion.
4.4.2 Association with high value species
Thailand's fisheries demonstrated marked growth over the last 3 decades. The total production of
2.77 million tonnes of fisheries products from Thailand's marine capture fisheries in 2000 was
comprised of food fish (52.0%), shrimps (3.2%), crabs (2.1%), squids (6.4), and cuttlefish and
shellfish (3.4%). These high value species/groups of species have mostly been derived from capture
fisheries conducted in coastal waters.
Reversing Environmental Degradation Trends in the South China Sea and Gulf of Thailand
68 NATIONAL REPORT ON FISHERIES THAILAND
Coastal habitats of the Gulf of Thailand play critical roles in the life cycles of many important species,
especially in terms of spawning, nursery, and feeding areas. The most recent figures from 2000 show
a marine catch of 2.77 million tonnes, valued at THB 49,401.7 million. Fishing grounds that fall within
Thailand's EEZ are in the Gulf of Thailand and Andaman Sea. It is estimated that, of the total average
marine catch, 70% is caught in Thai waters (60% from the Gulf and 10% from the Andaman Sea),
whilst the remainder is derived from international waters or foreign EEZs.
4.4.3 Association with endangered, rare, threatened species
Several species of marine resources in the Gulf of Thailand are becoming rare, endangered, and
perhaps threatened with extinction, due to increased human use, the resultant changes in the
environment, and ineffective conservation and/or enforcement measures. Dense and increasing
human populations in coastal areas, use of destructive fishing practices, intensive industrial activities,
and waste disposal are all exacerbating this problem.
It is believed that several species of marine fish and invertebrates are becoming rare, particularly
those inhabiting coral reefs, which are being destroyed by intense fishing or other unwise practices.
Furthermore, many groups of endangered species, including marine turtles, dugong, and dolphins,
spend part of their life cycle in coastal habitats, especially for feeding and nursing areas.
5.
CURRENT MANAGEMENT REGIME(S)
Regarding current management regimes relating to fish stocks and their habitats, the following
subtopics will now be discussed.
5.1 Legal
instruments
Thailand is currently implementing several key legal instruments in order to conserve, preserve,
protect, and manage fish stocks and their habitats. These legal instruments include the:
(a) Constitution of the Kingdom of Thailand relating to natural resources management;
(b) Fisheries Act 1947 (B.E. 2490) and related regulations and notifications, especially concerning
transboundary stocks
- Articles 19 and 20 of the Fisheries Act 1947 relate to environmental aspects of fishing
grounds, including aquatic animal habitats;
(c) National Environmental Quality Act 1992 (B.E. 2535);
(d) Act Determining Plan and Process of Decentralisation of Power to Local Government
Organisation 1999 (B.E. 2542);
(e) Navigation in Thai Waters Act 1913 (B.E. 2456)
- Dumping of ballasts in a river, port area or anchoring location, Section 119: No person is
allowed to dump, discard or ballast articles or any waste except for oil and chemical in a river,
canal, marsh, reservoir or lake used for public traffic or common use or a sea with Thai waters
which will cause shoal, sediment or filth therein unless permitted by the harbour master. Any
person violating this provision must be subject to an imprisonment not exceeding six months
or a fine not exceeding ten thousand bath or both and must also reimburse the costs paid for
disposal thereof. And Section 119 bis: No person shall be allowed to dump, discard or
otherwise act so as to allow oil and chemical or any thing in a river, canal, marsh, reservoir or
lake used for public traffic or common uses or a area within Thai water which may be toxical
to living organisms or environment or harmful to navigation in said river, canal, marsh,
reservoir or lakes. Any person violating these provisions must be subject to an imprisonment
not exceeding three years or a fine not exceeding sixty thousand bath or both and must also
reimburse the costs paid for rehabilitation of such toxic or pay damages therefore;
(f) The Act Governing the Right to Fish in Thai Fisheries Waters B.E.2484 (1939);
(g) Wildlife Reservation and Protection Act 1992
- This Act empowers the Department of Fisheries to protect all animals and their products listed
as for reservation and protection, which include all endangered species such as marine
mammals, turtles, coral, and seashells.
The recent fisheries regulations that have been issued and implemented in Thai waters are
summarised in Table 24.
Reversing Environmental Degradation Trends in the South China Sea and Gulf of Thailand
NATIONAL REPORT ON FISHERIES THAILAND 69
Table 24
Marine fisheries management measures in Thailand.
Period of prohibition
Management measures
Type of gear
Whole year
1. The distance of 3,000 m from shoreline and 400 m
Motorised fishing gears, i.e., trawls,
out off the stationary gear
push net, shortnecked clam dredge
2. Songkhla
lake
3. Phang-nga Bay (Phang-nga to Krabi province)
Whole year
1. The distance of 3,000 m in some area of Prachuab
Trawls, push net, purse seine,
Khiri Khan and Chumphon province influenced by
shortnecked clam dredge, fishing gear
typhoons
used with light
Whole year
Some areas in Trat province (within 15 km from shore)
Purse seine with light luring
Whole year
All areas both in the Gulf of Thailand and Andaman Sea
Purse seine mesh less than 2.5 cm (in
night time operation)
Whole year
1. The distance of 3,000 m from shoreline. The dredge
Shortnecked clam dredge
used should be:
a. The mouth width not less than 3.5 m
b. The sieve size not less than 1.2 cm
c. The boat length not more than 18 m
d. The number of dredge not more than 3 per one
boat
2. The distance of 8,000 m from shoreline in Samut
Sakhon province
Whole year
All areas both in the Gulf of Thailand and Andaman Sea
Squid light luring with mesh not less
than 3.2 cm
Whole year
All areas both in the Gulf of Thailand and Andaman Sea
Set bag net
Whole year
All areas both in the Gulf of Thailand and Andaman Sea
Drive in net
and in the coral and artificial reef areas
Whole year
All areas both in the Gulf of Thailand and Andaman Sea
Mine equipment for shell collection
Whole year
1. Sea turtle and turtle eggs
All gears
2. Sea Dugong
3. Sea Corals
4. Dolphin
5. No fishing in the preservation areas
5.1 A certain area in Phuket province
5.2 A certain area in Chumphon province
5.3 A certain area in Trat province
5.4 A certain area in Phang-nga province
Whole year
The distance of 3,000 m from shoreline in certain areas
Trawl, push net, purse seine, clam
in Prachuab Khiri Khan to Chumphon province for pilot
dredge and light luring nets
CBFM project
6 months
A certain areas in Chonburi province
Motorised fishing gears
(1 Sep 28 Feb)
(Historical Bay)
3 months
Protection of fish spawners and larvae in certain areas
Pair trawl, otter board trawl, purse seine,
(15 Feb-15 May)
in Prachuab Khiri Khan, Chumphon and Surat Thani
mackerel encircling gill net, except the
provinces
otter-boom and beam trawl fishing at
night time during 15 Feb-31 Mar and
fishing at both night and day time 1 Apr-
15 May
3 months
No fishing of female eggs-barriers of mud crab,
All gears
(Oct-Dec)
swimming crab and Charybdis feriatus
3 months
Protection of Horse Shoe crab in Phang-nga Bay
All gears
(1 Dec-28 Feb)
including in the rivers around Phang-nga Bay
2 months
Protection of fish spawners and larvae in the Phang-nga All trawlers, Purse seine, Gill net with
(15 Apr-15 Jun)
Bay, from Krabi to Phuket provinces
mesh size not less than 4.7 cm
5.2
Institutional arrangements (research, monitoring, control & surveillance)
At present, the lead government organisation with direct responsibility for fisheries, marine resource,
and habitat management is the Department of Fisheries, as part of the Ministry of Agriculture and
Cooperatives. Other governmental organisations, including the Department of Marine and Coastal
Resources and the Office of Environment Policy and Planning, as part of the Ministry of Natural
Resources and Environment, also play very important roles in conserving Thailand's marine
resources and environments.
Reversing Environmental Degradation Trends in the South China Sea and Gulf of Thailand
70 NATIONAL REPORT ON FISHERIES THAILAND
The Marine Fisheries Research and Development Bureau conduct research regarding marine
fisheries and resource management. The Bureau's Marine Fisheries Research and Development
Centre has locations in 4 regions of the Gulf of Thailand, namely Rayong, Samut Prakan, Chumphon,
and Songkhla. Marine and coastal research is also conducted by a newer organisation, the
Department of Marine and Coastal Resources, through its regional research centres.
A number of other government organisations contributed to various aspects of marine resource and
environmental management. They can be considered as supporting research agencies for the
Department of Fisheries. They include many organisations under the Department of Pollution Control,
Department of National Park Conservation and Management, Department of Marine Transportation
and Commerce, Burapha University, Kasetsart University, Chulalongkorn University, Songkhla
University, and Walailuk University.
Monitoring, control and surveillance (MCS), is a very important mechanism for fisheries and resource
management in the Gulf of Thailand. The Fisheries Administration and Resource Management
Bureau of the Department of Fisheries is the leading organisation responsible for MCS, and is
supported by various Provincial Fisheries Offices and other organisations empowered by the
Fisheries Act and Ministerial Notifications of the Ministry of Agriculture and Cooperatives.
When the government agencies reform program took place in October 2002, the Department of
Marine and Coastal Resources (DMCR) was established under the Ministry of Natural Resources and
Environment. The DMCR was given the mandate to develop relevant regulations in order to achieve
effective managerial action relevant to vulnerable resources, including resource preservation and
conservation for sustainable use. The MCS activities for the conservation of marine and coastal
resources and habitats are under the mandate of the office of Marine and Coastal Conservation and
Enforcement. The transfer of some authority for enforcement of the Fisheries Act has taken place in
order to empower the DMCR to act in an enforcement capacity.
The organisational structure of the Department of Fisheries (DOF) and the Department of Marine
Coastal Resources (DMCR) is highlighted in Appendices 4 and 5.
5.3
Overview of patterns of resources ownership and traditional utilisation
-
Section 290 of the Constitution of the Kingdom of Thailand states that "For the purpose
of promoting and maintaining the quality of the environment, a local government
organisation has powers and duties as provided by law.
The law under paragraph 1 shall at least contain the following matters as its substances:-
(1) The management, preservation and exploitation of the natural resources and
environment in the area of the locality;
(2) The participation in preservation of natural resources and environment outside the area
of the locality only in the case where the living of the inhabitants in the area may be
affected; and
(3) The participation in considering the initiation of any project or activity outside the area of
the locality which may affect the quality of the environment, health or sanitary conditions
of the inhabitant in the area."
It is very clear that fisheries resources in the coastal areas of the Gulf of Thailand have been
degraded and some groups are depleted. This has led to escalating conflict among resources users
competing for the same scarce resources. Conflicts between small-scale and commercial fishers are
increasing in occurrence on a daily basis. This conflict situation is perhaps not only due to overfishing,
but also due to a lack of clear policies pertaining to the conduct of fisheries and their management.
It is well known that Thailand's marine capture fisheries are open access in nature. Prior to the
introduction of fisheries management, Thai fishers operated when, where, and how they pleased.
However, this situation resulted in unsustainable fisheries. The only areas of non-open access include
permitted areas for coastal aquaculture and the prohibition of active fishing gear use within 400m of
the permitted areas for bamboo stake traps.
In response to the problems of open access, the Thai Department of Fisheries has attempted to
revise the Fisheries Act in order to limit access in Thailand's marine capture fisheries. A proposal has
been submitted to parliament for their consideration and approval. Some Articles of the present
Reversing Environmental Degradation Trends in the South China Sea and Gulf of Thailand
NATIONAL REPORT ON FISHERIES THAILAND 71
Fisheries Act provide a pathway for the limitation of access to fisheries resources. For example,
Article 32 indicates that Provincial Governors, with the permission of the Minister, have the authority
to fix the type, size, and number of fishing gears to be operated at the provincial level. Nevertheless,
this does not provide for the prevention of fishers from other provinces applying for a fishing licence.
Recently, the Department of Fisheries has implemented a pilot project on community based fisheries
management across a range of areas, including Bangsapan District, Prachuab Khiri Khan Province,
Phang-nga Bay, Phang-nga Province, Pathew District, and Chumphon Province. These pilot projects
aim at developing the concept of community level ownership and participation in management of
fisheries resources. The participation of the local community in natural resources and environmental
management is supported by the present constitution, and the future may see fishing communities
being provided with ownership of resources in an attempt to curb the tendency for overexploitation in
Thai fisheries.
5.4
Human & Institutional Capacity
The Marine Fisheries Research and Development Bureau of the Department of Fisheries is
responsible for marine fisheries resource surveys/research, restoration of fisheries resources and the
environment, professional development of fishers, fishing gears/methods research and development,
and other duties as required. There are 4 Marine Fisheries Research and Development Centres
under the Marine Fisheries Research and Technology Development Institute, and 4 MCS centers
under the Marine Fisheries Administration and Conservation Bureau of the Department of Fisheries
along the coast of the Gulf of Thailand. However, there are many institutions, including universities
and colleges that conduct research into fisheries of the Gulf of Thailand. The locations of these
institutions are highlighted in Figure 19.
In order to conduct research and development, and effectively implement management strategies, the
provision of additional education and training for officers of the Department of Fisheries in areas such
as resource assessment, conservation of fishery resources, and fisheries management is very
necessary. This type of education and training has been made available to fishers and other fishing
industry representatives in response to government policy aimed at promoting the participation of all
stakeholders in the planning and implementation of various fisheries management measures. In doing
so, the Fisheries Technology Development and Transfer Bureau of the Department of Fisheries have
collaborated with relevant research institutes and universities involved in fisheries training.
Reversing Environmental Degradation Trends in the South China Sea and Gulf of Thailand

72 NATIONAL REPORT ON FISHERIES THAILAND
99°
100° 101°
104°
102° 103°
105°E
14°N
BANGKOK
Samut Prakan
Samut Sakhon
Chachoengsao
Samut Songkhram
Chon Buri
13°
Phetchaburi
Rayong Chanthaburi
Trat
12°
Prachuap Khiri Khan
11°
Chumphon
10°
9°
Surat Thani
Marine Fisheries Research and
Development Center
Patrol Office Center
Fishery Radio Station
Nakhon Si Thammarat
Marine and Coastal Resources
8°
Research and Development
Center
7°
Songkhla
Pattani
Narathiwat
6°
Figure 19 Marine Research Centres and Monitoring, Control, and Enforcement Sites along
the coast of the Gulf of Thailand.
5.5
Review of stakeholders (e.g. Fishers, National and/or provincial/local management
bodies, NGOs)
The importance of community participation in natural resource and environmental management has
become increasingly recognised, particularly since the Eight National Economics and Social
Development Plan (1997 to 2001). Creating opportunities and an enabling environment to support the
participation of all sectors in the development process is one of the main strategies for the national
plan. In providing more opportunity for local communities and people to participate actively in natural
resource and environmental management, the following guidelines at the national policy level include:
· Providing opportunities for people and communities to participate in decision-making,
monitoring and evaluation of public development projects likely to have an impact on natural
resources and the environment. The government should facilitate continual public discussion
at every stage of those projects such as initiation, preparation and implementation.
Reversing Environmental Degradation Trends in the South China Sea and Gulf of Thailand
NATIONAL REPORT ON FISHERIES THAILAND 73
· Providing legal quarantines of the rights of local communities and small-scale fishers to
participate in coastal resource management, as well as the conservation, rehabilitation and
maintenance of mangrove forests, seagrass and coral reefs, to ensure sustainable use of
coastal resources, especially those related to the fishing industry.
As such, in order to achieve the sustainable utilisation of coastal resources, upgrading the capacities
of rural communities for economic and social development and for conservation of natural resources
and environment has become the key element.
Existing Fisheries and Coastal Community-Based Management Programs
The private sector working for public interests in the area of natural resources and environmental
protection and conservation can be found in the form of foundations, associations, projects, clubs, or
other formal groups. In general, they can be categorised as follows:
· Non-government organisations (NGOs) registered with the Ministry of Science, Technology,
and Environment (MOSTE);
· Non-government organisations not registered with the Ministry of Science, Technology, and
Environment (MOSTE);
· Business firms; and
· People's organisations (PO).
At present, there are more than 60 non-governmental organizations (NGOs) working for natural
resources and environmental protection and conservation registered with the MOSTE (Office of
Environmental Policy and Planning 1996). Under the Enhancement and Conservation of the National
Environmental Quality Act of 1992 (Section 8), registered NGOs can obtain support from government
agencies, including loans from the environmental fund. In this respect, they will have to submit the
proposals, by stating the objectives, plans, project duration, and proposed budget, and then apply for
them from the environmental fund. The committee under the Department of Environmental Promotion,
MOSTE will review the proposals accordingly.
Fisheries and coastal community-based management in Thailand are mainly carried out with the
support of NGOs, particularly in southern Thailand (Table 25). Informal people's organisations may
exist before they work in association with NGOs, but with encouragement of NGOs and university
lecturers working as activists, the organisations become more recognised and they may establish a
formal people's organisation, sometimes registered with MOSTE. The Southern Small-Scale
Fishermen Association is a good example following its establishment in September 1993, which
resulted from a seminar of NGOs, local fishers, and university activists who realised the problems of
coastal resource degradation that adversely affects societal well-being.
Although fishery and coastal management programs in Thailand are carried out by governmental,
non-governmental, and people's organisations, they normally share the following goals or objectives:
1. Create awareness of local communities in the sustainable management of coastal resources;
2. Build up and strengthen local capacities in the conservation and rehabilitation of coastal
resources; and
3. Encourage the coordination among local communities, local government agencies, and
NGOs.
Concerning fishery and coastal resource protection and conservation, the main NGOs working in
these areas are the Volunteer for Society Fund, Lae Tai Project, Southern Small-Scale Fisheries
Association, Yad Fon Association, and Wildlife Fund Thailand. Acting as the supporting and
facilitating organisations in various mechanisms, financially and/or academically, there are various
NGOs and POs working in association with them. The programs can be implemented as sub-projects
in which the above key NGOs are the executing agencies. Examples of this case are illustrated in
Table 25.
Reversing Environmental Degradation Trends in the South China Sea and Gulf of Thailand
74 NATIONAL REPORT ON FISHERIES THAILAND
Table 25 Non-government organisations (NGOs) involved in coastal resource management
in southern Thailand.
Name of the Organisation
Address
Type of Activities
Working Area/Site
Coordinating Committee for Non-
65 Srisuda Road
Acting as coordinating
Provinces in southern
government Organizations,
Amphur Muang
Center for NGOs in the
Thailand
Southern Thailand
Songkhla 90000
south of Thailand
Tel: 074 311821
Small-scale Fisheries
57/216 Kehasathan
Solving problems facing
Songkhla Lake area
Community Development
Khrutai Village Tambol
small-scale fisheries,
(Amphur Hat Yai),
Pawong
pressure group, resource
Amphur Muang,
Amphur Muang
and environmental
Amphur Jana, Amphur
Songkhla 90000
management
Ranode, Songkhla
Tel: 074 333 114
Lae Tai Project to Rehabilitate
68 Mu 4 Tambol Ku
Management of natural
Songkhla Lake
Songkhla Lake
Khud, Amphur
resource and the
(Songkhla and Pattalung
Satingpra, Songkhla
environment
areas)
90190 or 56/9 Soi Pian
Phiboon Apai Boriruk
Road Tambol Kuha
Sawan Amphur Muang
Pattalung 93000
Wildlife Fund Thailand
57/6 Paknam Road,
Management of natural
Pattani Bay and Nongjik
(Under the Royal Patronage of
Tambol Sabarang,
resource and environment
area of Pattani
H.M. the Queen, Wetland and
Amphur Muang,
concerning small-scale
Coastal Conservation
Pattani 94000
fisheries' problems
Project
Tel: 333 227
The Ruk Kukhud Committee
61/1 Mu 3 Tambol
Management of local
Tambol Kukhud
Jatigpra, Amphur
Natural resource and
Amphur Satingpra of
Satingpra, Songkhla
Environment (15 local
Songkhla and area
90190
volunteers fully
Surrounding Songkhla Lake
participating in resource
protection
Small-scale Fishery
n.a.
Nine groups supported by
Villages as they settle
Development Group
the Department of
Fisheries and Provincial
Authority in facilities and
budget for improving
livelihoods
Study Center and Development of
Prince of Songkhla
Providing knowledge on
Pattani Bay
Pattani Bay
University, Pattani
legal aspects and fishery
Campus, Amphur
management
Muang, Pattani 94000
Tel: 334 871
Small-scale Fishery Network
57/6 Paknam Road,
Working on fishery
Pattani
Project under Earth Island
Tambol Sabarang,
resources and
Association
Amphur Muang,
environment problems in
Pattani 94000
cooperation with the
Tel: 333 227
Wildlife Fund Thailand
Strengthening Capacity of Non-
693 Department of
Working on fishery
Amphur Ta Chana of
government Organizations under
Medical Science,
resource and environment
Surat Thani, Amphur
the
Bamrung Muang
problems
Sichol and Pak Phanang of
Local Community Development
Road, Pomparb,
Nakon Sri
Institute
Bangkok 10100
Thammarat
Tel: 2236713, 2257293
Small-scale Fisheries
57/6 Pak Nam Road,
Working as coordinating
Southern provinces
Association of Southern
center for groups of small-
Thailand
scale fishing communities
Tambol Sabarang,
in the southern provinces
Amphur Muang,
Pattani 94000
Tel: 333 227
Source: Department of Fishery and Lae Tai magazine (various issues)
Note: District = Amphur, Sub-district = Tambol
Reversing Environmental Degradation Trends in the South China Sea and Gulf of Thailand
NATIONAL REPORT ON FISHERIES THAILAND 75
There are also various businesses and private organisations working directly with collective activities,
and indirectly through provision of financial support. Private organisations dealing with coral reefs
include the Siam Diving Association, the Thai Diver Company, and other local business groups. Their
activities are conducted along Thailand's coasts, often in collaboration with the Tourism Authority of
Thailand, National Park officers from the Royal Forestry Department, and local academic institutions
(Table 26).
Table 26 Natural resources and environmental protection and conservation programs under
the Wildlife Fund Thailand and corresponding activities.
Name of the Project/Program
Activities
Thailand Coastal Wetland Resources Project, program
Short-necked clam conservation at Tambol Pana Reh, Pattani
for conservation of wetland and coastal zone (Pattani
Community mangrove reforestation at
and Phuket)
Nongjik, Pattani and Thlang, Phuket
Coastal zoning for seagrass conservation at Nonjik, Pattani and
surrounding areas
Program for village conservation of sea turtle
Promotion of sea turtle conservation program
(Mai Khao Beach at Phuket)
Through media, exhibition, and youth camp, in collaboration
with education institutes
Study visit of youth group from Mai Khao, Phuket to observe a
sea turtle conservation program at Thlang, Phuket
Program for conservation of wetland areas (Samut
Survey of base map on land use developing, flora and fauna at
Songkram)
the site where the site where the center is located
Program for rehabilitation of coastal resources and
Community training on seaweed conservation
small-scale fisherman organization (Tamblo Pha Klog,
project, Tambol Pah Klog
Amphur Talang, Phuket)
Community training on mangrove conservation project, Tambol
Pah Klog
Placement of signs for conservation zoning of coastal resources
Meeting of small-scale fishing community leaders (Pattani,
Songkhla, Trang, and Pattalung)
Program for strengthening capacity of local communities
Data gathering on socioeconomic, ecological system, and
in wetland and coastal resource management
natural resources of the community, NGOs in collaboration with
local scholars and lectures at Prince of Songkhla University,
Pattani Campus
Formulation of local groups to further formulate network of
small-scale fishermen in other provinces including Pattani,
Trang, Songkhla, Surat Thani, Phang Nga, Krabi, Phuket,
Pattalung, Nakorn Si Thammarat, Chumphon, and others.
Source: Wildlife Fund Thailand1996 (unpublished documents) and Lae Tai magazine (various issues).
Case Study
The following cases are reviewed from published and unpublished documents, mostly obtained from
NGOs. Additional information is obtained from personal communication with NGO staff. The cases
include Pattani Bay and Amphur Pana Reh of Pattani.
Case study: Pattani Bay and Amphur Pana Reh, Pattani
Pattani Bay covers a total area of 74km2 facing the Gulf of Thailand to the west. With its estuarine
area for the Yaring and Pattani Rivers, the bay is rich with natural resources, abundant mangrove
forests and nursery areas for fishery resources. The community at Pattani Bay is mostly living at
Tambol Lam Pho of the Bay in 4 villages, including Bang Dato, Ban Talo Samilae, Ban Kampong
Budee, and Ban Pata Budee. The community is mainly Moslem and their main livelihood is small-
scale fishing.
The coastal area of 15km2, about 2,000 m from the coastline of Amphur Phanare, Pattani is abundant
with short-necked clams. The Department of Fisheries (DOF) estimated that the available resources
could be valued up to 500 million baht (Lae Tai 12). In March 1992, concessions for short-necked
clam fisheries in Amphur Pana Reh were given by the DOF to 30 fishing boats. However, the
concessionaire boats entered into the 3-km zone reserved for small-scale fisheries. As such, in April
1992 local people, religious leaders, and village leaders protested and requested the governor not to
allow the concession of short-necked clam fisheries in Amphur Pana Reh. As a result, the concession
was successfully stopped.
Reversing Environmental Degradation Trends in the South China Sea and Gulf of Thailand
76 NATIONAL REPORT ON FISHERIES THAILAND
On 28 July 1992, the Pana Reh Coastal Fisheries Association was established as a people's
organisation with the objective of conserving and rehabilitating coastal resources in Amphur Pana
Reh. Its ultimate goal is to improve the living conditions of the small-scale fishers in Pana Reh in a
sustainable manner.
Problem: Declining fishery resources in the Bay caused by large-scale fishing, including trawlers and
push nets operated within the 3-km zone.
Involvement of local organisations: The Association of Small-scale Fishermen was established in
March 1993 through the exchange of information and discussion among villagers in solving problems
regarding the degradation of fishery resources. The sub-district leader of Tambol Lam Pho chairs the
association with members from 4 villages of Lam Pho. The Pattani Bay Rehabilitation Organisation
was later established in September 1993.
Programmes and activities:
· The "Pattani Bay Conservation" Day was established on 11 May 1993. The activities for this
day, in collaboration with government agencies, included the placement of conservation
zones for fishery resources and seaweed, and for the release of shrimp and fish juveniles into
the Bay.
· A study visit of 850 member representatives was organised from 14 to 16 June 1993. The trip
to Pattalung, Trang, Phang Nga, and Phuket was aimed at representatives observing,
discussing, and exchanging information with local people who were actively working on
coastal conservation programmess.
· Survey of coastal resources at Lam Tachi bay was conducted from 21 to 25 June 1993 by
fishers and divers from the Wildlife Fund of Thailand. The data collected were prepared to
support government agencies in planning for future coastal resource development and
management of the bay.
· Mangrove planting was arranged by the association with close collaboration of the regional
forestry office of Pattani in August 1993. The objective was to rehabilitate the existing
mangrove area to become the community forest area for the villagers of Ban Dato and Ban
Talo Samilae.
· A seminar on "Past, Present, and Future of Pattani Bay" was convened from 5 to 6
September 1993 in order for the concerned parties, government, non-government, and local
communities to discuss future plans for sustainable coastal resource management in Pattani
Bay. On 6 September, the Pattani Bay Rehabilitation Organisation was established as the
result of the seminar.
Fisher Associations and Non-Government Organisations
There are 47 registered fisher associations in the Gulf of Thailand region. 44 associations are
members of the National Fisheries Association of Thailand, which acts as a central organisation for
stakeholders concerned with marine fisheries, including fisheries officials, private sector
representatives, fisher organisations, and fishers themselves. The aims of these organisations are to
guide the development of the fishing industry. Fishers associations have been categorised as follow:
- National organisations:
7
- Provincial organisations:
12
- Local organisations:
25
Reversing Environmental Degradation Trends in the South China Sea and Gulf of Thailand
NATIONAL REPORT ON FISHERIES THAILAND 77
At present small-scale fisher groups have been established to monitor coastal resources and promote
responsible fishing. The FAO Code of Conduct for Responsible Fisheries has been introduced to
fishers. Hence, in 2002, the National Fisheries Association of Thailand encouraged fishers to become
members of the association. This association can be used to build the capacity of fishers to become
stewards of their resources.
National Fisheries Association of Thailand
Objective:
1. Promote fishing and standard of living of fishers
2. Promote unity among fisher associations in Thailand
3. Promote fishing extension and technologies
4. Train
fishers
5. Promote public activities
6. Non-political
activities
Activities of the National Fisheries Association of Thailand
1. Fishing
extension
· Conduct joint projects with neighboring countries for fishing group extension
· Conduct co-operative projects with the government sector to provide discounted fuel to
fishers
· Conduct co-operative projects with the government sector to ban destructive fishing
gears, including pushnet, and control the number of some fishing gears such as trawls,
anchovies lift net/falling net
2. Comment
on
fisheries
· Comment to the government sector regarding fishing regulations relating to fishing zones
and fishing seasons
3. Focal point for fisheries association
· Disseminate fisheries information to fisheries associations
· Arrange committee meetings
· Promote knowledge and fishing technology
· On-site meetings for solving fisheries problems
National Organisations
1. Oceanic Fisheries Association of Thailand
2. Fishmeal Producer Association of Thailand
3. Nakorn Si Thammarat Trawler Association
4. Fisheries Export and Aquaculture Extension Association of Thailand
5. Central Gillnet Association
6. Southern Gillnet Association
7. Frozen Food Association of Thailand
Provincial Organisations
1. Cholburi Fisheries Association
2. Nakorn Si Thammarat Fisheries Association
3. Paknam Chumphon Fishermen Association
4. Pattani Fisheries Association
5. Petchaburi Fishermen Association
6. Rayong Fisheries Association
7. Samut Prakan Fisheries Association
8. Samut Sakorn Fisheries Association
9. Samut Songkram Fisheries Association
10. Surat Thani Fishermen Association
11. Songkhla Fishermen Association
12. Trat Fisheries Association
Reversing Environmental Degradation Trends in the South China Sea and Gulf of Thailand
78 NATIONAL REPORT ON FISHERIES THAILAND
Local Organisations
1. Kanom District Fisheries Association
Nakorn Si Thammarat Province
2. Klongyai Fisheries Association
Trat Province
3. Klongwan Fisheries Association
PrachupKiri Khan Province
4. Chaiya District Fishermen Association
Surathani Province
5. Dansawi Fishermen Association
Chumporn Province
6. Thamai District Fishermen Association
Chantaburi Province
7. Banleam District Fishermen Association Petchaburi
Province
8. Banphe Fisheries Association
Rayong Province
9. Paktago Fishermen Association
Chumporn Province
11. Paknam Prasae Fishermen Association
Rayong Province
12. Pakpanang Fishermen Association
Nakorn Si Thammarat Province
13. Pranburi Fisheries Association
PrachupKiri Khan Province
14. Sunthornpu Fisheries Association Rayong
Province
15. Sichon District Fishermen Association
Nakorn Si Thammarat Province
16. Hua Hin Fishermen Association
Prachup Khiri Khan Province
17. Leamsing Fisheries Association
Chantaburi Province
18. Angsila Fisheries Association
Chonburi Province
19. Paknampangrad Fishermen Association
Rayong Province
20. Bangjakreng Fisheries Cooperative
Samutsongkram Province
21. Banleam Fisheries Cooperative
Petchaburi Provin ce
22. Pattani Fisheries Cooperative
Pattani Province
23. Maeklong Fisheries Cooperative
Samut songkram Province
24. Samutsakorn Fisheries Cooperative
Samut sakorn Province
25. Bangsalae Fishing Group
Chonburi Province
6.
PROBLEMS, CONSTRAINTS AND RECOMMENDED ACTIONS
6.1
Problems and Constraints
The rapid development of marine fisheries in Thailand has mainly been a result of intensive
exploitation of marine fisheries resources, without systematic management and rehabilitation of the
resources, often leading to conflicts between resource users. Marine fisheries resources, which had
once served as key contributing factors to national economic prosperity, have now become
constraints for future development that must be carefully taken into consideration. In particular,
demersal and many groups of pelagic resources are rapidly being degraded, resulting in decreases in
their distribution and abundance. Similarly, coastal habitats, particularly mangroves, seagrasses, and
coral reefs have also been damaged by natural phenomena, human activities, and economic factors,
particularly fisheries and tourism.
It is clear from this review that marine fisheries resources have been overexploited for more than 3
decades. Therefore, appropriate management actions at various levels need to be taken. Fisheries
management has been contained as one of the most important strategies since the Fourth (1977 to
1981) to the Ninth (2002 to 2006) National Economic and Social Development Plans. The main policy
is to reduce excessive fishing effort levels to that appropriate toward achieving optimal sustainable
yields from resources, and to protect and rehabilitate important habitats and environments. The
Standing Committee on National Fisheries Policy, chaired by the Deputy Prime Minister, has
approved these strategies. This reflects the Government's policy commitment to overcome these
problems.
Although fisheries management has existed for some time, the government has not yet been able to
ban destructive fishing gears and reduce excessive fishing effort, mostly due to potential economic,
social, and political implications. Moreover, the MCS system has not been effective, mainly due to the
lack of understanding and participation by the fishing community and fishers themselves. Many
fishers have little awareness of resource conservation, concentrating mainly on immediate income
needs associated with their socioeconomic situations. Coordination among the Department of
Fisheries, fishing communities/associations, and the various other governmental agencies concerned
is also considered poor. These problems require solving.
Reversing Environmental Degradation Trends in the South China Sea and Gulf of Thailand
NATIONAL REPORT ON FISHERIES THAILAND 79
6.2
Recommendations
In order to conserve and manage marine fisheries resources and their habitats, it is urgent that the
government express strong political will and commitment through implementing the approved action
plans contained in the National Fisheries Policy. There are a number of other recommended actions
at national and regional levels requiring attention, these include:
1. Development of strategic plans of studies and utilisation of living resources; studies on biology
and dynamics of important fish stocks; conservation and protection of marine environment against
pollution from any sources; fishery resources investigation service; fishing activities research and
development; management and conservation of living resources; development of regulations of
fisheries and alternative use strategies for living resources.
2. Periodical determination of the total allowable fishing effort and catch of fish in the respective
fishing areas, or from respective fish stocks, based on the best scientific evidence, provisions set
forth in international agreements and resolutions of international organisations where Thailand is
a member State.
3. To undertake a review and expedite amendment of laws, rules, and regulations concerned with
the conservation and management of fishery resources and environment and to ensure that they
are compatible with relevant regional and international instruments as well as to ensure promoting
more coordination for active participation of other department in fisheries management.
4. Improvement of fisheries information and catch and effort statistics in the fishing grounds both
inside and outside Thai waters and to strengthen socio-economic information, which will be of
value in supporting improved fisheries management measures.
5. To promote awareness building and the participation of fishers, fisher associations, and fishing
industry stakeholders in the planning process and implementation of fisheries management
measures; education and training for the people concerned must be provided and regular
meetings for evaluation and improvement are needed.
6. In order to reduce the problem of open access in fisheries, demarcation of fishing zones for
various sizes and type of fishing boats/gears, coral reef zones, seagrass meadows, and
conservation zones should be established with agreement among stakeholders concerned. The
introduction of right-based fisheries, community-based fishery management, as well as resource
enhancement programs through installation of artificial reefs should be created and strengthened
for the optimal use of inshore waters as agreed at the ASEAN-SEAFDEC Conference: Fish for
People.
7. Fisheries MCS is a vital mechanism for strengthening fisheries management. It needs to be
modernised and strengthened, and training for the officers concerned is necessary.
8. One of the problems in tropical multi-species fisheries is the by-catch and discards that require
reduction, the development and introduction of appropriate selective fishing gear, as well as
technologies for at sea fish processing should be considered in order to reduce by-catch and
waste.
Considering the geographical distribution and migration of fisheries resources, it is being increasingly
recognised that effective management of the resources has to be conducted at 2 levels, national and
regional. National management should be concerned with the actual implementation of the various
policies created for instituting sustained development, while regional management should seek to
identify common issues and facilitate resolution for the benefit of the coastal States of the region as a
whole.
It is evident that a number of fish stocks, both pelagic and demersal resources in the Gulf of Thailand
and South China Sea, move freely from EEZs of one country to another, or straddle the boundaries of
2 or more countries. The exploitation of those resources may be shared by the neighbouring
countries. Therefore, improved understanding of the biology, dynamics, and the state of stocks is
required to facilitate the establishment of appropriate management plans.
For evolving regional level management measures, the following actions may be necessary: i)
formation of a strong regional body to design regional policies; ii) development of a mechanism to
strengthen national management measures; iii) identification of the regional changes in fisheries,
especially the shared stocks and periodically advising the member countries; iv) provision of strong
scientific support for fisheries development by imparting training on technological changes; v)
Reversing Environmental Degradation Trends in the South China Sea and Gulf of Thailand
80 NATIONAL REPORT ON FISHERIES THAILAND
development of a system for communication, exchange of data and interaction on management
experiences among the member countries; vi) promotion of compatibility and consensus among the
countries in sharing the stock assessment studies; and vii) generation of adequate funds for
implementing the management program.
7.
REFERENCES
Aksornkoae, S. 1989. Mangrove: Ecology and Management. Compute advertising. 251pp. (In Thai)
Aksornkoae, S. 1998. Mangroves: Ecology and Management. Kasetsart University Press: Bangkok.
Anugul, T. 2002. Marine Resources Caught by Research Vessels (otter board trawl) in the Upper Gulf of
Thailand in 1999. Technical Paper no.18, Upper Gulf Fisheries Development Center, Department of
Fisheries. 37pp. (In Thai)
Bakhayokho, M. 1983. Biology of the cuttlefish Sepia afficinalis Hierredda off the Senegalese coast. Advances
in assessment of world cephalopod resources. Food and Agriculture Organisation of the United Nations,
Rome. 412pp.
Boonprakob, U. 1965. The identification of pelagic eggs and larvae of Chub mackerel, Rastrelliger spp., in the
Gulf of Thailand with additional study on their distribution. Contrib. Mar. Fish. Lab., Bangkok, (4) : 115-151.
(In Thai)
Boonwanich, T. 1993. Demersal resources and trash fish. A paper presented on the Seminar on the Thai
Fisheries Improvement, Ao Kunggaben Study and Development, Chantaburi Province, 20-22 August 1993.
13pp. (In Thai)
Boonyapiwat, S. 1999. Distribution, Abundance and Species Composition of Phytoplankton in the South China
Sea, Area I: Gulf of Thailand and East Coast of Peninsular Malaysia. In Proceedings of the First Technical
Seminar on Marine Fishery Resources Survey in the South China Sea, Area I, Gulf of Thailand and East
Coast of Peninsular Malaysia. 24-26 November 1997, Bangkok, Thailand. Southeast Asian Fisheries
Development Center, March 1999. pp.111-134.
Boonyubol, M. and S. Pramokchutima. 1982. Trawl fisheries in the Gulf of Thailand. A paper submitted to the
Second National Seminar on Marine Science, Bangsan 8-10 September 1982, 7pp.
Briggs, M.R.P. 1994. `Status, problems and solutions for a sustainable shrimp culture industry.' In M.R.P.
Briggs (ed). Development of strategies for sustainable shrimp farming. Final report to the Overseas
Development Administration. Research Project R4751. Institute of Aquaculture, University of Stirling, UK.
Brodie, J. 1996. Nutrient and Sediment Pollution and its Effects. In Trevor J. Ward (ed.), Proceedings of the
Workshop on Eutrophication in Tropical Marine Systems the Impacts and Management of Nutrient
Pollution. RCU/EAS Technical Reports Series No.8. Bangkok, Thailand : UNEP. pp.15-20.
Chaitiamvong, S. and M. Supongpan. 1993. A guide to Penaeoid shrimps found in Thai waters. Australian
Institute of Marine Science Townsville, Australia. 77pp.
Chamchang, C. 1986. Distribution of Economically Important Pelagic Fish Larvae from Surat Thani to
Narathiwat Province, Western Portion of the Gulf of Thailand. Technical Paper of Marine Resource Survey
Team No.2/1986, Marine Fisheries Division, Department of Fisheries. 45pp.
Chamchang, C. and R. Chayakul. 1990. Distribution of longtail tuna (Thunnus tonggol, Bleeker), Kawakawa
(Euthynuus affinis, Canter) and Frigate tuna (Auxis thazard, Lacepede) in the Eastern Coast of the Gulf of
Thailand. Technical paper no.2/1990, Marine Resources Survey, Marine Fisheries Division, Department of
Fisheries. 17pp.
Chansakul W. 1988. Identification and Distribution of Fish Larvae in Rayong Bay, Rayong Province. 194pp.
Chareonpanich C. and S. Seurungreong. 1999. Some physical and Chemical Characteristics of Bottom
Sediments in the South China Sea, Area I : Gulf of Thailand and East Coast of Peninsular Malaysia. In
Proceedings of the First Technical Seminar on Marine Fishery Resources Survey in the South China Sea,
Area I, Gulf of Thailand and East Coast of Peninsular Malaysia. 24-26 November 1997, Bangkok, Thailand.
Southeast Asian Fisheries Development Center, March 1999. pp. 12-33.
Charoenphol, S. 1957. Preliminary study of discoloration of sea water in the Gulf of Thailand. Paper presented
in the IXth Pacific Science Congress, Bangkok, 18-30 November.
Chotiyaputta, C. 1977. Relationship between Length and body weight and sex ratio of the cuttlefish, Sepia spp.
in the Gulf of Thailand. Technical Paper no.9/1977. Invertebrate section, Marine Fisheries Division,
Department of Fisheries. 30pp. (In Thai)
Chotiyaputta, C. 1978. Biology of the cuttlefish, Sepia recurvirostra Steenstrup in the Gulf of Thailand. Technical
Paper no.1/1978. Invertebrate section, Marine Fisheries Division, Department of Fisheries. 26pp. (In Thai)
Chotiyaputta, C. 1980. Biology of the cuttlefish, Sepia aculeata Ferussac and d'Orbigny in the Gulf of Thailand.
Technical Paper no.17/1980. Invertebrate section, Marine Fisheries Division, Department of Fisheries.
28pp. (In Thai)
Chotiyaputta, C. 1982. Biology of the cuttlefish, Sepia pharaonis Ehrenberg. Technical Paper no.4/1982.
Invertebrate section, Marine Fisheries Division, Department of Fisheries. 6pp. (In Thai)
Reversing Environmental Degradation Trends in the South China Sea and Gulf of Thailand
NATIONAL REPORT ON FISHERIES THAILAND 81
Chotiyaputta, C. 1995a. Juvenile and adult taxonomy and fishery biological of neritic squid in Thai waters. A
Ph.D.dissertation submitted to the Tokyo University of Fisheries, Tokyo, Japan. 121pp. 15 Appendix Table
and 10 Plates.
Chotiyaputta, C. 1995b. Distribution, abundance, reproduction biology age and growth of Loligo chinensis in the
western Gulf of Thailand. Technical Paper no.2/1995, Marine Resources Survey Unit, The Upper Gulf
Marine Fisheries Development Center, Marine Fisheries Division, department of Fisheries. 67pp.
Chotiyaputta, C., T. Okutani and S. Chaitiamvong. 1992. Systematic study of cephalopods in Thailand. Report
Presented to National Research Council of Thailand, JSPS-NRCT October 1992: 96pp. (In Thai)
Chuenpun, A. 1996. Coastal tuna resources in the Gulf of Thialnd. Stock Assessment Section, Bangkok Marine
Fisheries Development Center, Marine Fisheries Division. (In Thai)
Chullasorn, S. and P. Martosubroto. 1986. Distribution and Important Biological Feature of Coastal Fish
Research in Southeast Asia. FAO Fisheries Technical Paper No.278.
Chullasorn, S. and S. Yusukswad. 1978. Preliminary report on the fisheries biology of the roundscads
(Decapterus spp.) in the Gulf of Thailand. Technical Paper no.2/1978, Pelagic Fish Unit, Marine Fisheries
Division, Department of Fisheries. 33pp.
Day, M.M. 2000. Analysis of demand for fish in Bangladesh. Aquaculture Economics & Management. 4(1&2),
63-79.
Department of Fisheries, 1982-2002. Thai Fishing Vessels Statistics 1980-2000. Small-Scale Fisheries
Statistics Analysis Sub-Division, Fisheries Economics Division, Department of Fisheries, Ministry of
Agriculture and Cooperatives. (In Thai)
Department of Fisheries, 1988-2002. Fisheries Statistics of Thailand 1985-1999. Fisheries Statistics and
Information Technology Sub-Division, Fisheries Economics Division, Department of Fisheries, Ministry of
Agriculture and Cooperatives. (In Thai)
Department of Fisheries, 1995-2002. Thai Fishing Vessels Statistics 1993-2000. Small-Scale Fisheries
Statistics Analysis Sub-Division, Fisheries Economics Division, Department of Fisheries, Ministry of
Agriculture and Cooperatives. (In Thai)
Department of Fisheries, 1996. Fisheries Statistics of Thailand 1994. No.13/1996. Fisheries Statistics and
Information Technology Sub-Division, Fisheries Economics Division, Department of Fisheries, Ministry of
Agriculture and Cooperatives. (In Thai)
Department of Fisheries. 1998. Fisheries Statistics of Thailand 1995. No.5/1998. Fisheries Statistics and
Information Technology Sub-Division, Fisheries Economics Division, Department of Fisheries, Ministry of
Agriculture and Cooperatives. 86pp. (In Thai)
Department of Fisheries. 1999. Fisheries Statistics of Thailand 1996. No.5/1999. Fisheries Statistics and
Information Technology Sub-Division, Fisheries Economics Division, Department of Fisheries, Ministry of
Agriculture and Cooperatives. 86pp. (In Thai)
Department of Fisheries. 2002. The Landing Place Survey 1998. No.14/2002. Small-Scale Fisheries Statistics
Analysis Sub-Division, Department of Fisheries, Ministry of Agriculture and Cooperatives. 38pp. (In Thai)
Department of Fisheries. 2002. Fisheries Statistics of Thailand 1999. No.10/2002. Fisheries Economics
Division, Department of Fisheries, Ministry of Agriculture and Cooperatives. 87pp. (In Thai)
Department of Fisheries. 2003a. Fisheries Statistics of Thailand 2000. No.4/2003. Fishery Statistics Analysis
and Research Group, Fishery Information Technology Center, Department of Fisheries, Ministry of
Agriculture and Cooperatives. 91pp. (In Thai)
Department of Fisheries. 2003b. The Landing Place Survey 2000. No.9/2003. Fisheries Statistic Analysis and
Research Group, Fishery Information Technology Center, Department of Fisheries, Ministry of Agriculture
and Cooperatives. 38pp. (In Thai)
Department of Fisheries. 1995. Statistics of Marine Fisheries Production, Year 1993. Department of Fisheries.
Bangkok. Thailand. (In Thai)
Department of Health. 1997. http://www.anami.moph.go.th
FAO. 1993. Report on the First and Second THAILAND/FAO/DANIDA Workshops on Fishery Research
Planning Held at Phuket, 28 October to 8 November 1991 and Songkhla, 15 to 26 February 1993 for the
Project "Training in Fish Stock Assessment and Fishery Research Planning" GCP/INT/392/Den Report on
Activities Nos. 35 and 41. 109pp.
FAO. 1996. Chub mackerel fishery in the Gulf of Thailand. Third Thailand/FAO/DANIDA Workshop on Fishery
Research Planning, Chiangrai, Thailand, 23 Jan 3 Feb. 1995. FAO Report on Activity No.12, Supplement 1,
33pp.
Gulland, J.A. 1972. Some notes on the demersal resources of South China Sea. Proc. Indo-Pacific Fish. Coun.
13(3) : 51-60.
Isara, P. 1993. Assessment of Big-eye scad (Selar crumenophthalmus) from Purse Seine in the Gulf of
Thailand. Technical paper no. 5/1993. Stock Assessment Section, Bangkok Marine Fisheries Development
Center, Marine Fisheries Division. (In Thai)
Reversing Environmental Degradation Trends in the South China Sea and Gulf of Thailand
82 NATIONAL REPORT ON FISHERIES THAILAND
Isvilanondas, S. and R. Tokrisna. 1994. National Resources and Environment Economics. Faculty of
Economics, Kasetsart University, Bangkok. (In Thai)
Jala, K.F. and M.A. Aziz. 1986. Pollution control from agro-based and small-scale industries of the ESCAP
region. In Proceeding of the International Conference on Water and Wastewater Management in Asia. pp.
65-81. Singapore.
Jindalikit, J and K. Sereerux. (2004). Distribution and spawning grounds of cuttlefish in the Upper Gulf of
Thailand. Technical Paper no. X, Upper Gulf Marine Fisheries Research and Development Center, Marine
Fisheries Research and Development Bureau, Department of Fisheries. 14pp.
Jiraphanpiphat, K. 1987. Growth and mortality of bigeye (Priancanthus tayenus) in the Gulf of Thailand,
Prachuap Khiri Khan Surat Thani provinces. Technical Paper no. 5/1987. Population Analysis section,
Marine Fisheries Division. 11pp. (In Thai)
Jivaluk, J. 1999. Distribution, abundance and composition of zooplankton in the South China Sea, area I: Gulf of
Thailand and East Coast of Peninsular Malaysia. In: Proceeding of the First Technical Seminar on Marine
Fishery Resources Survey in the South China Sea area I. Gulf of Thailand and east coast of Peninsular
Malaysia, 24-26 November 1997, Bangkok, Thailand, Southeast Asian Fisheries Development Center.
pp. 256-284.
Johnson, C. 1997. Conflict and Change in an Open-Access Resource: An Analysis of Thailand's Coastal
Fisheries, Background Paper for the Thai Marine Rehabilitation Plan Project. Bangkok: Natural resources
and Environment Program, Thailand Development Research Institute. December.
Klinmuang, H. 1981. Length distribution and relationship between length and weight of tuna species in the Gulf
of Thailand. Technical paper No.24, Pelagic Fish Unit, Marine Fisheries Division, Department of Fisheries.
39pp. (In Thai)
Kongprom, A., P. Khaemakorn., M. Eiamsa-ard and M. Supongpan. (in press). The status of demersal fishery
resources in the Gulf of Thailand. A paper presented to ICLARM/ADB Project, ADB-RETA 5766:
Sustainable Management of Coastal Fish Stocks in Asia.
Marine Fisheries Laboratory and Fisheries Research Institute. 1967. Result of the Joint Thai-Malaysian-German
Trawling Survey off the East Coast of the Malay Peninsula, 1967. The Marine Fishery Laboratory,
Department of Fisheries, Ministry of Agriculture, Bangkok, Thailand and The Fishery Research Institute,
Fisheries Division, Ministry of Agriculture & Cooperatives, Malaysia, December, 1967.
Matsui, T. 1970. The larvae of Rastrelliger. Ecology of the Gulf of Thailand. NAGA REPORT. S10 (Scripps
Inst. Oceanogr.) Ref. (63-6) : 59-69.
Musikasung, W., S. Rattanaruangsi and N. Yama. 1998. Life History and Environmental Effects on Anchovies in
the Southern Gulf of Thailand. Southern Marine Fisheries Development Center.
Nabhitabhata, J. 1999. Checklist of Diversity and Distribution of Recent Cephalopods from Thai Waters. Thai
Marine Fisheries Research Bulletin, 7: 89-96.
Nabthitabhata, J. 1997. Life cycle of three cultured generations of spineless cuttlefish, Sepiella inermis
(FERUSSAC&D'ORBIGNY, 1848). Phuket Marine Biological Center Special Publication 17(1): 289-298.
National Seminar. 1999. The proceeding of the 3rd National Seminar on the Thai Marine Direction in Future,
Department of Fisheries of Thailand.
NESDB. http://www.nesdb.go.th
OEPP (Office of Environmental Policy and Planing). 1995. Status Report on Environment Quality, 1994.
Bangkok : OEPP, Ministry of Science, Technology and Environment. December. (In Thai)
Okawara, M., A. Munprasit, Y. Theparaoonrat, P. Masthawee and B. Chokesanguan. 1986. Fishing Gear and
Methods in Southeast Asia I, Thailand. Training Department, Southeast Asia Fisheries Development Center.
TD/Res./9.
Phasuk, B. 1987. The Marine Fisheries in Thai Waters. In Seminar on Fisheries in the Future. Southeast Asian
Fishery Development Center. pp 324-404. (In Thai)
Piamthipmanus, M. 1999. Temporal Change in the Abundance of Macrobenthos in the South China Sea, Area
II: Sarawak, Brunei and Sabah. In Proceedings of the Second Technical Seminar on Marine Fishery
Resources Survey in the South China Sea AREA II West Coast of Sabah, Sarawak and Brunei Darussalam,
14-15 December 1998, Kuala Lumpur, Malaysia. Southeast Asian Fisheries Development Center, March
1999. pp.323-337.
Piromnim, M. 1985. Phytoplankton in the Inner Gulf of Thailand. Report No.5, Marine Fisheries Laboratory,
Marine Fisheries Division, Department of Fisheries. 35pp.
Piumsombun, S. 2003. Analysis of demand for fish consumed at home in Thailand. In Thai Fisheries Gazette
56(2) : 113-121.
Pollution Control Department. 1998. Development of an action plan to improve water quality in the Eastern River
Basin, Thailand: Main Report, vol 3/10. Ministry of Science, Technology and Environment, Thailand.
Reversing Environmental Degradation Trends in the South China Sea and Gulf of Thailand
NATIONAL REPORT ON FISHERIES THAILAND 83
Pollution Control Department. 1999. A survey of coastal water quality along the Andaman Sea and the Western
Gulf of Thailand. PCD 02/027, Pollution Control Department, Ministry of Science, Technology and
Environment.
Robinson, M.K. 1974. The physical oceanography of the Gulf of Thailand. The University of California, Scripps
Institution of Oceanography, La Jolla, California, NAGA REPORT, Volume 3, Part I : 5-109.
Saikliang, P. 1995a. Implication of the International law of the Sea to Fisheries of Thailand. Paper presented to
The15th Training Programme on the Entry into Force of the United Nations Convention on the Law of the
Sea, Its Implementation and Agenda 21, June 5- August 11, 1995. 14pp.
Saikliang, P. 1995b. Economics of Anchovy Fishery Management in The Gulf of Thailand. A Paper Presented
Kasetsart University Research Project Resources Management Committee. 138pp. (In Thai)
Sanguansin, J. 1986. Benthic Macrofaura in the Central Gulf of Thailand. Report of the Thai-SEAFDEC Joint
Fishery Oceanographic Survey in the Central Gulf of Thailand, Vol. II, Training Department Southeast Asian
Fisheries Development Center. 24pp.
Sanguansin, J., D. Tanvilae, S. Suwannagosoom and S. Jaipium. 1999. Seawater quality along the Eastern
Coast of the Gulf of Thailand in 1994-1995. Technical Paper No.71/1999, Eastern Marine Fisheries
Development Center, Department of Fisheries. (In Thai)
SEAFDEC. 1981a. Preliminary Results from Acoustic Survey in the Gulf of Thailand, 1979. In Report of
Seminar on Stock Assessment of Pelagic Resources with Emphasis on Shared Stocks. Bangkok, Thailand
10-14 August 1981. pp.177-186.
SEAFDEC. 1981b. Country Report of Thailand. In Report of Seminar on Stock Assessment of Pelagic
Resources with Emphasis on Shared Stocks. Bangkok, Thailand 10-14 August 1981. pp.123-143.
SEAFDEC. 1999. Proceedings of the First Technical Seminar on Marine Fishery Resources Survey in the South
China Sea Area I : Gulf of Thailand and East Coast of Peninsular Malaysia, 24-26 November 1997,
Bangkok, Thailand. Southeast Asian Fisheries Development Center, March 1999. 366.
Siripong, A. 1985. The hydrography of the South China Sea and the Gulf of Thailand. Vol. III, Hydrology and
Climatology. 260pp.
Sitthichokpan, S. 1977. Water quality in estuary and coastal area in the Inner Gulf of Thailand 1977. Marine
Fisheries Laboratory Report No.5/78, Marine Fisheries Division, Department of Fisheries.
Smith, P., G. Griffiths and N. Ruello, 1998. Price formation on the Sydney fish market. ABARE Research
Report no.98.8. Australian Bureau of Agricultural and Resource Economics, Canberra.
Somjaiwong, D. and S. Chullasorn 1974. Tagging experiment on the Indo-Pacific mackerel, Rastrelliger
neglectus (van Kampen) in the Gulf of Thailand (1060-1965) Proc.Indo-Pac. Fish.Counc., 15(3) : 287-296.
Sukhavisidth, P. 1996. Checklist of Marine Fishes of Thailand. Technical Paper no.2/1996. Marine Resources
Surveys Section, Bangkok Marine Fishes Development Center, Marine Fishes Division, Department of
Fisheries. (In Thai)
Supongpan, M. 1988. The cephalopod fisheries and resource in the Gulf of Thailand. Technical paper
no.2/1988. Stock Assessment Section, Marine Fisheries Division. 34pp.
Supongpan, M. 1993. Cephalopod resources in the Gulf of Thailand. A paper presented on the Seminar on the
Thai Fisheries Improvement, Ao Kungaben Study and Development, Chantaburi province, 20-22 August
1993. 45pp.
Supongpan, M. 1995. Cephalopod Resource in the Gulf of Thailand. Contribution no.17. Upper Gulf Marine
Fisheries Development Center, Marine Fisheries Division, department of Fisheries. 30pp. (In Thai)
Supongpan, M. 1996. The fisheries biology of Indian squid (Loligo duvauceli) in west coast of the Gulf of
Thailand. A dissertation submitted in partial fulfillment of the requirements for the degree of Doctor of
Philosophy in Marine Science, Graduate School of Marine Science and Engineering, Nagasaki University,
Japan. 132pp.
Supongpan, M. 1998. The fisheries biology of Indian squid (Loligo duvauceli) in west coast the Gulf of Thailand.
Thai Fisheries Gazette Vol.51(2): 157-158
Supongpan, M., C. Chamchang., S. Boongerd and A. Laowapong. 2000. Anchovy fisheries in the Gulf of
Thailand. A Paper Submitted to Fishcode Management, FAO/NORWAY Programme of Assistance to
Developing Countries for the Implementation of the Code of Conduct for Responsible Fisheries Sub-
Programme F: Provision of Scientific Advice to Fisheries Management. January 2000. 139pp.
Supongpan, M., M. Shinodo and S. Boongerd. 1992. Catch analysis of Indian squid Loligo duvauceli by light
luring fishing in the Gulf of Thailand. Nippon Suisan Gakkaishi, 58, 439-444.
Suvapepun, S. 1984. Red Tide and Fisheries in the Gulf of Thailand. Technical Paper No.27/7, Marine
Fisheries Laboratory, Marine Fisheries Division, Department of Fisheries. 19pp.
Suvapepun, S. 1989. Occurrences of Red Tide in the Gulf of Thailand. In T. Okichi, D.M. Anderson and T.
Nemoto (eds.), Proceedings of the First International Symposium on Red tide : Biology, environment science
and toxicology (10-14 November, 1987). New York : Elsevier Science Publishing Co., Inc., pp.41-44.
Reversing Environmental Degradation Trends in the South China Sea and Gulf of Thailand
84 NATIONAL REPORT ON FISHERIES THAILAND
Suvapepun, S. 1997. An effective investment in coastal fishery management: Thailand's experience.
Proceeding of the regional workshop on coastal fishery management based on Southeast Asian
Experiences, Chaingmai, Thailand, 19-22 November 1996. TD/RP/40: February 1997, Training Department,
Southeast Asian Fisheries Development Center, Samut Prakan, Thailand.
Suvapepun, S. and W. Suwanrumpha. 1970. Distribution and seasonal variation in the abundance of plankton
off the western coast of the Gulf of Thailand. First Symp.mar.Fish.,Mar.Fish.Lab., Bangkok, Jan. 26-27,
1970. 23pp.
Suvapepun, S., S. Chernbamrung, W. Wangcharoenporn. 1984. Effect of water discolouration on coastal
fisheries. In Report of the Marine Fisheries Division, Fisheries Department, Bangkok.
Takahashi, Z., N, Ruangsivakul and S. Silpipat. 1985. Distribution and Seasonal Fluctuation of Heterotrophic
and Coliform Bacteria in the Chao Phraya River and the Bangkok Bight. Southeast Asian Fisheries
Development Center, Samut Prakarn.
Tamiyavanich, S. 1984. The causes and impacts of the Red tide phenomena occurring in the Upper Gulf of
Thailand. In Proceedings of the Third Seminar on the Water Quality and Quantity of Living Resource in in
Thai Waters, 26-28 March 1984, pp.841-486. National Research Council of Thailand, Bangkok.
Tantisawetrat, C. 1994. Status of Indo-Pacific mackerel (Rastrelliger neglectus, van Kampen) Resource in the
Gulf of Thailand. Stock Assessment Section, Bangkok Marine Fisheries Development Center, Marine
Fisheries Division. (In Thai)
Tantisawetrat, C. 1996. Status of Indian mackerel Resources and Fishery in the Gulf of Thailand. Technical
paper no. 4, Stock Assessment Section, Bangkok Marine Fisheries Development Center, Marine Fisheries
Division. (In Thai)
Tantisawetrat, C., A. Cheunpan and P. Suvatthee. 1994. Status of Chub Mackerel in the Upper Part of the Gulf
of Thailand. Technical paper no.5/1994, Stock Assessment Section, Bangkok Marine Fisheries
Development Center, Marine Fisheries Division, Department of Fisheries. 25pp.
Termvidchakorn, A. 1999. Kinds, Abundance and Distribution of the Fish Larvae in the South China Sea, Area I:
Gulf of Thailand and East Coast of Peninsular Malaysia. In Proceedings of the First Technical Seminar on
Marine Fishery Resources Survey in the South China Sea, Area I, Gulf of Thailand and East Coast of
Peninsular Malaysia. 24-26 November 1997, Bangkok, Thailand. Southeast Asian Fisheries Development
Center, March 1999. pp.241-255.
Tharnbubpa, C. 1977. Seawater quality in the Inner Gulf and Western Coast of the Gulf of Thailand 1977.
Marine Fisheries Laboratory Report No.5/77, marine Fisheries Laboratory, Department of Fisheries.
Tharnbubpa, C. and A. Jusiripongkul. 1984. Seawater quality in the Eastern Coast of the Gulf of Thailand 1982.
Marine Fisheries Laboratory Report No. 6/83, Marine Fisheries Division, Department of Fisheries.
Thubthimsang, W. 1981. Observation on the spawning ground and spawning season of shrimps in the territorial
water of Ko Samui and Ko Phangna, Surat Thani. Deptment of Fisheries, bangkok. 27pp. (In Thai)
Uraiwan, S. and T. Boonvanich. 1993. Collaborative Demersal Fish stock Survey between Thailand and Malasia
in the Joint Development Area (JDA). Technical paper no. 4/1993. Southern Marine Fisheries Development
Center. Marine Fisheries Division, department of Fisheries. 34pp. (In Thai)
Vatanachai, S. 1978. Distribution and abundance of fish eggs and larvae in the inner Gulf of Thailand. Marine
Fisheries Laboratory, Marine Fisheries division, Department of Fiseries. Technical Report No. S.J./20/15 :
1-22.
Vetchakaran, K. 1987. Far sea fisheries of Thailand. In Seminar on Fisheries in the Future. Southeast Asian
Fishery Development Center. pp. 405-445.
Vibhasiri, A. 1984. The status of shrimp resources and fisheries in the Gulf of Thailand. A report submitted to
the seminar on Marine Fisheries of Thailand, Bangkok. 19pp. (In Thai)
Vibhasiri, A. 1988. An assessment of Jinga shrimp, Metapenaeus affinis (Penaeiddae), in Ban Don Bay, Gulf
of Thailand. In Venema, S.C., J.M. Christensen and D. Pauly, (eds.), Contributions to Tropical Fisheries
Biology. FAO Fish.Rep., (389): 101-116.
Vibhasiri, A. 1993. Penaeid Shrimp Resources in the Upper Coast, Gulf of Thailand. Technical paper
No.4/1993, Stock Assessment Section, Bangkok Marine Fisheries Development Center, Sathon Distric,
Bangkok. 24pp.
Westlund, L. 1995. Apparent historical consumption and future demand for fish fishery products exploratory
calculation. Paper presented for the International Conference on Sustainable Contribution of Fisheries to
Food Security, Kyoto, Japan, 1995. Rome: FAO/KC/FI/95/TECH/8.
Whitehead, P.J.P., G.J. Nelson and T. Wongratana. 1988. FAO species catalogue. Vol. 7. Clupeoid fishes of the
world (Suborder Clupeoidei). An annotated and illustrated catalogue of the herrings, sardines, pilchards,
sprats, shads, anchovies and wolf-herrings, Part 2. Engraulididae. FAO Fish. Synop., (125) Vol.7,
Pt.1:303pp.
Wongratana, T. 1968. A check list of fishes caught during the trawl surveys in the Gulf of Thailand and off the
east coast of the Malay Peninsula. Contribution no.13, Marine Fisheries Laboratory, Marine Fisheries
division, Department of Fisheries, Ministry of Agriculture, Bangkok, Thailand. 96pp.
Yindepit, S. 1993. Kwuamrouu kue prateep. ESSO No. 2/34.
Reversing Environmental Degradation Trends in the South China Sea and Gulf of Thailand
NATIONAL REPORT ON FISHERIES THAILAND
APPENDIX 1 PAGE 1
APPENDIX 1
Rates of Exchange of Commercial Bank in Bangkok Metropolis
(Baht per currency unit)
Year
Baht per one U.S. dollar
Baht per one U.S. dollar
Reference rate 1/
Buying
Selling
1982 22.9000
23.0500
23.0000
1983 22.9000
23.0500
23.0000
1984 23.5392
23.6892
23.6393
1985 27.0593
27.2093
27.1594
1986 26.1991
26.3491
26.2992
1987 25.6359
25.7859
25.7353
1988 25.1941
25.3441
25.2940
1989 25.6020
25.7520
25.7020
1990 25.4960
25.6360
25.5854
1991 25.4157
25.5657
25.5166
1992 25.3203
25.4553
25.3999
1993 25.2197
25.3697
25.3196
1994 25.0498
25.1998
25.1498
1995 24.8151
24.9651
24.9151
1996 25.2439
25.3939
25.3439
1997 31.1542
31.4817
31.3723
1998 41.0276
41.5850
41.3709
1999 37.6172
37.9618
37.8405
2000 39.9535
40.2694
40.1621
1/ Prior to July 1997, the figures were the rate of the Exchange Equalization Fund (EEF)
Source : Bank of Thailand
Table 1a
Indo-Pacific mackerel caught by commercial fishing gears in specific areas of the
Gulf of Thailand from 1990 to 2000.
Year
Total (mt)
Area 1
Area 2
Area 3
Area 4
Area 5
Area A
Area B
1990
69,866
5,141
12,259
29,238
11,752
3,780
3,837
3,859
1991
55,169
1,494
1,091
17,722
23,929
0
9,865
1,068
1992
88,308
4,126
24,924
38,254
4,972
214
7,510
8,308
1993
68,025
2,553
824
44,944
5,048
360
3,613
10,683
1994
73,944
3,679
19,595
33,230
6,989
14
7,441
2,996
1995
105,323
1,269
34,261
36,530
9,624
74
9,126
14,439
1996
86,617
4,825
32,677
26,525
2,760
0
15,267
4,563
1997
84,620
4,273
31,442
24,105
6,637
0
13,600
4,563
1998
91,943
2,130
25,569
38,459
13,719
0
6,699
5,367
1999
111,366
1,450
27,253
37,336
2,196
0
15,006
27,125
2000
107,667
1,524
21,509
38,699
1,445
0
11,716
32,774
Avg.
85,713
2,951
21,037
33,186
8,097
404
9,425
10,522
Reversing Environmental Degradation Trends in the South China Sea and Gulf of Thailand
NATIONAL REPORT ON FISHERIES THAILAND
APPENDIX 1 PAGE 2
Table 1b
Indian mackerel caught by commercial fishing gears in specific areas of the Gulf of
Thailand from 1990 to 2000.
Year
Total (mt)
Area 1
Area 2
Area 3
Area 4
Area 5
Area A
Area B
1990
20,922
5,577
1,550
8,120
1,549
3,658
419
49
1991
16,269
8,011
969
6,523
757
0
1
8
1992
29,353
9,639
132
8,156
436
10,506
337
147
1993
33,882
7,633
1,303
4,887
1,094
16,018
979
1,968
1994
49,235
31,645
316
5,188
2,073
9,913
100
0
1995
43,697
7,017
42
4,287
1,643
28,511
1,055
1,142
1996
19,934
3,080
505
4,802
2,607
6,635
2,228
77
1997
18,352
2,748
482
4,519
2,525
5,972
1,994
112
1998
18,475
2,519
2,176
7,437
4,539
0
1,474
330
1999
25,984
1,856
5,446
10,707
3,805
1,011
1,775
1,384
2000
20,561
1,737
1,484
9,953
2,532
657
2,516
1,682
Avg.
26,969
7,406
1,310
6,780
2,142
7,535
1,171
627
Table 1c
Spanish mackerel caught by commercial fishing gears in specific areas of the Gulf
of Thailand from 1990 to 2000.
Year
Total (mt)
Area 1
Area 2
Area 3
Area 4
Area 5
Area A
Area B
1990
9,223
1,507
393
2,780
2,212
1,379
692
260
1991
6,118
670
205
1,886
1,675
0
1,235
447
1992
6,711
1,017
229
1,271
1,545
104
1,172
1,373
1993
9,568
1,275
212
1,572
1,733
150
1,642
2,984
1994
8,537
2,288
109
947
727
604
1,482
2,380
1995
9,258
1,603
231
1,121
1,174
376
2,513
2,240
1996
8,205
885
370
2,170
1,834
29
2,243
674
1997
7,654
794
358
1,962
1,661
26
1,942
911
1998
7,516
440
767
1,384
3,193
0
807
925
1999
7,922
303
702
1,024
2,430
339
1,180
1,520
2000
6,516
135
607
1,232
1,418
248
1,590
1,539
Avg.
7,930
992
380
1,577
1,782
296
1,500
1,387
Table 1d
Longtail tuna caught by commercial fishing gears in specific areas of the Gulf of
Thailand from 1990 to 2000.
Year
Total (mt)
Area 1
Area 2
Area 3
Area 4
Area 5
Area A
Area B
1990
101,293
2,642
1,869
5,413
15,416
67,284
4,658
4,011
1991
79,186
4,754
6,521
2,327
2,053
0
63,531
0
1992
72,276
617
2,145
569
3,466
398
3,467
61,614
1993
39,395
1,261
1,300
2,095
3,140
2,131
8,561
20,907
1994
31,767
10,457
14,428
1,900
1,655
865
1,495
967
1995
38,746
7
1,537
850
2,256
351
18,359
15,386
1996
32,235
111
1,732
764
2,795
285
17,672
8,876
1997
29,016
100
1,560
688
2,516
256
15,906
7,990
1998
34,715
1,463
1,102
2,077
4,215
0
12,135
13,723
1999
45,736
339
1,497
1,232
3,290
329
11,710
27,339
2000
52,978
44
1,490
1,280
1,442
219
6,342
42,161
Avg.
50,668
1,981
3,198
1,745
3,840
6,556
14,894
18,452
Reversing Environmental Degradation Trends in the South China Sea and Gulf of Thailand
NATIONAL REPORT ON FISHERIES THAILAND
APPENDIX 1 PAGE 3
Table 1e
Little tuna caught by commercial fishing gears in specific areas of the Gulf of
Thailand from 1990 to 2000.
Year
Total (mt) Area 1
Area 2
Area 3
Area 4
Area 5
Area A
Area B
1990
54,915
5,150
1,089
2,777
20,628
14,599
9,799
873
1991
58,763
6,134
270
2,087
3,876
0
46,396
0
1992
84,887
6,707
25
3,827
2,125
7,425
15,074
49,704
1993
67,402
5,691
0
2,895
2,086
9,286
13,784
33,660
1994
67,817
38,960
0
4,224
1,588
15,561
7,272
212
1995
48,117
3,568
0
382
2,781
17,819
9,458
14,109
1996
47,125
926
341
2,643
2,118
8,324
27,569
5,204
1997
42,557
833
307
2,380
2,049
7,491
24,814
4,683
1998
43,930
548
303
592
4,655
0
20,211
17,621
1999
56,681
137
35
712
3,171
1,209
12,947
38,470
2000
43,988
109
80
1,110
1,897
830
11,538
30,424
Avg.
56,017
6,251
223
2,148
4,270
7,504
18,078
17,724
Table 1f
Round scad caught by commercial fishing gears in specific areas of the Gulf of
Thailand from 1990 to 2000.
Year
Total (mt)
Area 1
Area 2
Area 3
Area 4
Area 5
Area A
Area B
1990
10,676
232
218
997
1,418
72
7,739
0
1991
22,747
53
4
448
898
0
21,344
0
1992
42,525
3,266
795
577
1,297
3,722
32,868
0
1993
46,186
1,380
0
2
892
5,947
37,884
81
1994
38,394
4,753
0
204
0
1,696
31,741
0
1995
54,633
502
0
948
0
7,744
35,755
9,684
1996
52,640
239
0
0
34
2,541
37,370
12,456
1997
47,379
215
0
0
31
2,287
33,634
11,212
1998
57,893
0
0
279
0
0
37,051
20,563
1999
56,461
0
102
2,207
0
2,643
51,071
438
2000
67,902
470
8,321
5,608
0
1,605
51,733
165
Avg.
45,221
1,010
858
1,025
415
2,569
34,381
4,964
Table 1g
Hardtail scad caught by commercial fishing gears in specific areas of the Gulf of
Thailand from 1990 to 2000.
Year
Total (mt)
Area 1
Area 2
Area 3
Area 4
Area 5
Area A
Area B
1990
13,663
1,447
707
3,451
4,074
806
3,168
10
1991
11,941
5,537
1
383
2,171
0
3,424
425
1992
17,775
530
449
917
1,299
1,915
12,665
0
1993
18,345
1,282
15
241
1,214
3,665
7,053
4,875
1994
20,532
4,707
5
61
1,737
1,843
8,716
3,463
1995
9,474
1,002
3
243
1,096
3,710
2,309
1,111
1996
4,412
858
81
0
929
817
1,421
306
1997
3,947
750
69
0
837
736
1,279
276
1998
7,499
260
471
2,906
391
0
3,172
299
1999
6,232
37
259
1,168
409
340
4,019
0
2000
6,185
35
194
932
0
139
4,885
0
Avg.
10,910
1,495
205
937
1,287
1,270
4,737
979
Reversing Environmental Degradation Trends in the South China Sea and Gulf of Thailand
NATIONAL REPORT ON FISHERIES THAILAND
APPENDIX 1 PAGE 4
Table 1h
Bigeye scad caught by commercial fishing gears in specific areas of the Gulf of
Thailand from 1990 to 2000.
Year
Total (mt)
Area 1
Area 2
Area 3
Area 4
Area 5
Area A
Area B
1990
21,548
2,823
311
6,715
3,415
512
7,670
102
1991
15,462
692
166
1,315
2,394
0
10,895
0
1992
21,851
876
45
1,920
974
1,340
16,660
36
1993
19,581
1,295
51
540
1,190
2,960
13,544
1
1994
37,080
4,532
87
963
2,347
708
28,427
16
1995
36,449
2,376
77
1,395
2,144
4,388
20,158
5,911
1996
24,533
152
98
6,439
2,156
1,276
10,676
3,736
1997
22,188
136
96
5,799
1,946
1,149
9,495
3,567
1998
24,931
487
406
2,074
1,640
0
18,302
2,022
1999
26,029
103
4,093
9,093
2,274
548
8,206
1,712
2000
29,075
342
6,971
6,518
1,259
535
11,273
2,177
Avg.
25,339
1,256
1,127
3,888
1,976
1,220
14,119
1,753
Table 1i
Trevallies caught by commercial fishing gears in specific areas of the Gulf of
Thailand from 1990 to 2000.
Year
Total (mt)
Area 1
Area 2
Area 3
Area 4
Area 5
Area A
Area B
1990
36,186
3,007
15,582
9,911
5,154
1,136
887
509
1991
34,574
2,847
21,478
5,254
4,470
0
501
24
1992
41,281
3,416
26,566
2,521
3,590
2,232
2,670
286
1993
40,913
1,498
14,782
13,750
4,963
329
2,347
3,244
1994
54,546
5,711
27,375
8,564
6,734
33
4,798
1,331
1995
46,485
2,657
18,993
1,646
6,942
5,917
7,386
2,944
1996
43,643
3,586
15,729
9,093
6,221
1,142
5,577
2,295
1997
40,731
3,167
14,239
8,193
6,718
1,028
4,805
2,581
1998
33,346
3,818
7,159
6,831
5,851
0
7,495
2,192
1999
35,217
1,743
9,715
8,824
4,705
83
7,224
2,923
2000
30,744
573
12,064
6,007
2,968
62
6,245
2,825
Avg.
39,788
2,911
16,698
7,327
5,301
1,087
4,540
1,923
Table 1j
Sardines caught by commercial fishing gears in specific areas of the Gulf of
Thailand from 1990 to 2000.
Year
Total (mt)
Area 1
Area 2
Area 3
Area 4
Area 5
Area A
Area B
1990
90,789
14,555
9,276
26,428
20,356
11,746
8,428
0
1991
114,472
7,941
3,120
49,214
7,911
0
46,286
0
1992
141,422
8,689
12,966
66,568
5,699
1,944
45,556
0
1993
112,620
4,558
1,456
67,309
5,503
7,114
19,974
6,706
1994
123,700
5,375
4,785
98,939
7,533
2,195
4,873
0
1995
137,965
1,534
7,239
116,703
6,687
5,517
0
285
1996
159,071
928
5,686
131,712
11,769
862
6,087
2,027
1997
149,177
836
5,742
118,541
15,978
776
5,479
1,825
1998
124,907
1,997
2,447
98,376
12,248
0
8,925
914
1999
126,040
349
17,898
89,088
9,921
220
8,564
0
2000
120,571
412
38,233
78,232
2,528
276
890
0
Avg.
127,339
4,289
9,895
85,555
9,648
2,786
14,097
1,069
Reversing Environmental Degradation Trends in the South China Sea and Gulf of Thailand
NATIONAL REPORT ON FISHERIES THAILAND
APPENDIX 1 PAGE 5
Table 1k
Anchovies caught by commercial fishing gears in specific areas of the Gulf of
Thailand from 1990 to 2000.
Year
Total (mt)
Area 1
Area 2
Area 3
Area 4
Area 5
Area A
Area B
1990
118,707
107,072
2,493
9,063
39
40
0
0
1991
110,013
52,675
2,579
54,719
1
0
0
39
1992
120,211
72,600
1,978
43,634
86
1,551
156
206
1993
116,648
61,282
5,575
49,119
56
1
80
535
1994
97,343
33,156
1,666
58,812
138
0
1,145
2,426
1995
116,180
62,137
1,214
48,654
39
2
881
3,253
1996
115,217
45,396
3,030
59,858
3,819
0
1,529
1,585
1997
111,482
42,880
2,767
59,149
3,607
0
1,430
1,649
1998
115,747
44,391
3,956
60,541
4,631
0
843
1,385
1999
96,877
37,831
1,017
50,964
5,780
0
466
839
2000
113,665
51,503
2,216
51,967
5,694
0
1,195
1,090
Avg.
112,008
55,538
2,590
49,680
2,172
145
702
1,182
Table 2a
Threadfin breams caught by commercial fishing gears in specific areas of the Gulf
of Thailand from 1990 to 2000.
Year
Total (mt)
Area 1
Area 2
Area 3
Area 4
Area 5
Area A
Area B
1990
23,583
5,765
829
5,237
4,583
658
4,373
2,138
1991
33,044
12,125
1,030
5,360
8,621
0
220
5,688
1992
51,259
13,187
1,481
5,089
4,451
25
9,661
17,365
1993
57,452
13,007
1,656
3,683
9,192
825
8,334
20,755
1994
55,551
17,610
2,056
3,963
12,167
303
4,785
14,667
1995 71,064
8,671 1,865 5,104 15,306 1,352 22,280 16,486
1996
64,077
7,663
1,055
1,205
5,737
0
27,515
20,902
1997
62,441
6,896
1,006
1,086
5,226
0
24,125
24,102
1998
59,225
5,928
2,833
2,423
7,947
0
17,827
22,267
1999
69,866
5,740
2,011
3,087
6,181
0
22,207
30,640
2000
73,892
6,838
1,552
4,487
6,661
0
19,392
34,962
Avg. 56,496
9,403 1,579 3,702 7,825
288
14,611
19,088
Table 2b
Lizard fishes caught by commercial fishing gears in specific areas of the Gulf of
Thailand from 1990 to 2000.
Year
Total (mt)
Area 1
Area 2
Area 3
Area 4
Area 5
Area A
Area B
1990
12,985
1,985
492
3,846
2,056
528
3,068
1,010
1991
19,994
3,992
504
4,101
4,842
0
217
6,338
1992
30,789
3,617
458
5,037
2,564
8
8,774
10,331
1993 42,485 4,430 1,206 4,828 4,351
463
12,063
15,144
1994
34,973
5,828
861
3,751
4,715
121
8,741
10,956
1995 58,482 2,643 1,096 5,012 5,094 1,574
9,607
33,456
1996
51,004
2,870
1,471
626
7,673
0
18,704
19,660
1997
62,397
2,610
1,404
572
6,934
0
12,295
38,582
1998
35,289
1,832
945
1,323
9,083
0
8,536
13,570
1999
60,534
2,224
541
2,374
6,998
0
8,966
39,431
2000
52,601
1,826
561
1,131
4,079
0
7,327
37,677
Avg.
41,958
3,078
867
2,964
5,308
245
8,936
20,560
Reversing Environmental Degradation Trends in the South China Sea and Gulf of Thailand
NATIONAL REPORT ON FISHERIES THAILAND
APPENDIX 1 PAGE 6
Table 2c
Snappers caught by commercial fishing gears in specific areas of the Gulf of
Thailand from 1990 to 2000.
Year
Total (mt)
Area 1
Area 2
Area 3
Area 4
Area 5
Area A
Area B
1990
3,154
196
210
113
1,105
138
609
783
1991
2,633
397
256
195
1,014
0
0
771
1992
4,977
517
162
205
67
0
704
3,322
1993
10,676
448
194
248
573
41
619
8,553
1994
7,977
606
8
296
1,420
69
513
5,065
1995
8,658
391
165
244
2,035
54
991
4,778
1996
8,962
221
235
181
3,284
2
2,360
2,679
1997
8,383
206
226
165
2,970
2
1,720
3,094
1998
11,360
725
193
373
1,974
0
5,586
2,509
1999
8,470
155
121
600
2,409
0
1,451
3,734
2000
5,207
151
227
331
1,228
0
887
2,383
Avg.
7,314
365
182
268
1,644
28
1,404
3,425
Table 2d
Big-eyes caught by commercial fishing gears in specific areas of the Gulf of
Thailand from 1990 to 2000.
Year
Total (mt)
Area 1
Area 2
Area 3
Area 4
Area 5
Area A
Area B
1990
19,438
4,618
954
4,350
6,509
622
1,876
509
1991
24,899
8,213
882
4,335
6,380
0
327
4,762
1992
36,221
9,062
323
4,165
2,504
153
10,745
9,269
1993
49,710
10,994
759
2,918
11,560
971
8,600
13,908
1994
44,674
13,607
843
2,797
12,696
281
4,686
9,764
1995
57,723
7,807
672
3,895
12,048
1,396
15,809
16,096
1996
67,411
7,445
810
1,558
21,173
0
26,418
10,007
1997
62,673
6,695
770
1,426
19,249
0
23,521
11,012
1998
64,871
4,095
2,052
1,847
20,995
0
16,417
19,465
1999
71,065
4,610
1,774
3,080
16,111
0
19,223
26,267
2000
65,166
5,629
1,102
3,238
12,586
0
15,800
26,811
Avg.
51,259
7,525
995
3,055
12,892
311
13,038
13,443
Table 2e
Groupers caught by commercial fishing gears in specific areas of the Gulf of
Thailand from 1990 to 2000.
Year
Total (mt)
Area 1
Area 2
Area 3
Area 4
Area 5
Area A
Area B
1990
1,156
163
84
247
156
100
341
65
1991
1,537
348
107
339
452
0
11
280
1992
2,666
510
129
277
162
0
1,171
417
1993
2,742
448
152
209
613
63
479
778
1994
5,598
721
34
193
2,015
35
572
2,028
1995
5,257
352
136
310
1,677
51
798
1,933
1996
5,662
277
201
153
2,721
0
1,463
847
1997 5,515 253 194 140 2,475
0 1,130 1,323
1998 4,904 196 166 304 1,501
0 1,148 1,589
1999 5,420 228 140 586 1,028
0 1,260 2,178
2000
4,843
233
225
258
708
0
1,169
2,250
Avg.
4,118
339
143
274
1,228
23
867
1,244
Reversing Environmental Degradation Trends in the South China Sea and Gulf of Thailand
NATIONAL REPORT ON FISHERIES THAILAND
APPENDIX 1 PAGE 7
Table 3a
Banana prawn caught by commercial fishing gears in specific areas of the Gulf of
Thailand from 1990 to 2000.
Year
Total (mt)
Area 1000
Area 2
Area 3
Area 4
Area 5
Area A
Area B
1990
1,652
271
465
162
248
0
494
12
1991
1,494
542
307
290
328
0
20
7
1992
2,089
154
441
338
372
0
181
603
1993
1,734
341
632
365
354
15
27
0
1994
2,431
1,247
328
449
365
0
36
6
1995
2,445
88
623
384
307
0
1,022
21
1996
1,429
48
558
297
302
0
204
20
1997
1,354
48
532
267
300
0
187
20
1998
2,342
47
418
154
644
0
1,023
56
1999
2,339
135
769
219
401
0
89
726
2000
3,651
91
983
936
728
0
130
783
Avg.
2,087
274
551
351
395
1
310
205
Table 3b
Jumbo tiger prawns caught by commercial fishing gears in specific areas of the
Gulf of Thailand from 1990 to 2000.
Year
Total (mt)
Area 1000
Area 2
Area 3
Area 4
Area 5
Area A
Area B
1990
59
10
23
25
0
0
0
1
1991
135
29
49
41
15
0
1
0
1992
154
0
37
73
44
0
0
0
1993
167
4
35
59
45
19
5
0
1994
363
61
34
140
124
0
3
1
1995
317
3
12
189
101
0
12
0
1996
527
13
50
201
153
0
92
18
1997
495
13
50
180
149
0
85
18
1998
253
7
73
73
31
0
22
47
1999
829
60
37
64
104
0
15
549
2000
1,096
32
59
371
63
0
43
528
Avg.
400
21
42
129
75
2
25
106
Table 3c
Tiger prawns caught by commercial fishing gears in specific areas of the Gulf of
Thailand from 1990 to 2000.
Year
Total (mt) Area 1000
Area 2
Area 3
Area 4
Area 5
Area A
Area B
1990
245
83
7
118
6
0
31
0
1991
319
159
2
121
18
0
19
0
1992
283
168
0
79
0
0
36
0
1993
308
185
0
70
13
0
40
0
1994
543
230
0
81
85
0
78
69
1995
670
139
0
45
61
0
215
210
1996
1,041
159
3
75
68
0
579
157
1997
1,023
144
3
73
68
0
406
329
1998
839
81
2
118
60
0
176
402
1999
587
156
0
20
136
0
146
129
2000
713
124
18
35
187
0
188
161
Avg.
597
148
3
76
64
0
174
132
Reversing Environmental Degradation Trends in the South China Sea and Gulf of Thailand
NATIONAL REPORT ON FISHERIES THAILAND
APPENDIX 1 PAGE 8
Table 3d
King prawns caught by commercial fishing gears in specific areas of the Gulf of
Thailand from 1990 to 2000.
Year
Total (mt)
Area 1000
Area 2
Area 3
Area 4
Area 5
Area A
Area B
1990
644
187
71
192
166
0
28
0
1991
1,029
212
84
371
350
0
12
0
1992
592
114
16
425
24
0
13
0
1993
400
109
15
267
6
0
3
0
1994
308
9
109
170
7
0
10
3
1995
368
61
0
167
94
0
3
43
1996
498
10
47
232
95
0
71
43
1997
500
10
47
216
89
0
59
79
1998
440
5
133
49
153
0
18
82
1999
287
20
74
134
46
0
4
9
2000
948
11
93
717
53
0
27
47
Avg.
547
68
63
267
98
0
23
28
Table 3e
Other shrimps caught by commercial fishing gears in specific areas of the Gulf of
Thailand from 1990 to 2000.
Year
Total (mt)
Area 1000
Area 2
Area 3
Area 4
Area 5
Area A
Area B
1990
58,110
1,772
7,589
11,115
36,418
39
1,069
108
1991
69,486
950
11,067
24,305
32,084
0
723
357
1992
61,195
647
13,032
17,536
27,782
82
1,382
734
1993 63,815 1,619
13,509
21,919 23,758 305 1,165
1,450
1994
64,314
547
12,570
19,089
29,423
0
1,195
1,490
1995
65,774
240
17,437
10,449
34,077
0
1,787
1,784
1996
68,639
371
12,528
11,496
35,844
0
7,984
416
1997
65,140
353
11,753
10,210
34,765
0
7,167
892
1998
43,078
659
9,794
7,537
21,356
0
1,601
2,131
1999
32,908
971
9,054
5,463
14,846
0
250
2,324
2000
36,891
1,022
9,399
5,969
15,548
0
2,462
2,491
Avg.
57,214
832
11,612
13,190 27,809
39 2,435 1,289
Table 3f
Flathead lobsters caught by commercial fishing gears in specific areas of the Gulf
of Thailand from 1990 to 2000.
Year
Total (mt)
Area 1000
Area 2
Area 3
Area 4
Area 5
Area A
Area B
1990
853
103
94
179
260
17
166
34
1991
923
20
170
56
436
0
11
230
1992
766
11
27
48
82
0
369
229
1993
1,053
119
55
262
167
5
163
282
1994
858
47
33
52
201
0
162
363
1995
1,669
10
117
20
311
0
113
1,098
1996
2,629
57
328
167
1,156
0
357
564
1997
2,687
57
311
152
1,050
0
285
832
1998
2,957
29
368
109
1,038
0
491
922
1999
1,746
3
12
66
646
0
83
936
2000
2,254
2
61
157
575
0
289
1,170
Avg.
1,672
42
143
115
538
2
226
605
Reversing Environmental Degradation Trends in the South China Sea and Gulf of Thailand
NATIONAL REPORT ON FISHERIES THAILAND
APPENDIX 1 PAGE 9
Table 3g
Mantis shrimps caught by commercial fishing gears in specific areas of the Gulf of
Thailand from 1990 to 2000.
Year
Total (mt)
Area 1000
Area 2
Area 3
Area 4
Area 5
Area A
Area B
1990
314
66
72
107
45
0
15
9
1991
382
17
9
305
37
0
0
14
1992
165
10
2
117
6
0
16
14
1993
166
25
8
109
9
0
2
13
1994
296
77
20
180
8
0
3
8
1995
184
63
37
64
11
0
6
3
1996
181
26
65
46
37
0
7
0
1997
176
25
65
45
34
0
7
0
1998
427
2
163
1
60
0
57
144
1999
750
4
387
269
76
0
12
3
2000
866
17
223
609
4
0
13
0
Avg. 355 30
96 168 30 0 13
19
Table 3h
Swimming crabs caught by commercial fishing gears in specific areas of the Gulf
of Thailand from 1990 to 2000.
Year
Total (mt)
Area 1
Area 2
Area 3
Area 4
Area 5
Area A
Area B
1990
9,993
595
4,213
1,609
3,035
169
302
70
1991
6,532
683
731
2,576
2,052
0
132
358
1992
5,942
497
1,155
1,841
1,176
168
803
302
1993
6,733
559
756
2,043
2,522
61
524
268
1994
8,709
539
834
2,094
4,243
0
552
447
1995
9,321
425
889
997
4,852
4
726
1,428
1996
12,285
569
1,229
1,998
6,360
0
1,517
612
1997
11,408
515
1,166
1,804
5,875
0
1,330
718
1998
9,183
213
707
1,243
5,273
0
1,250
497
1999
7,008
163
588
998
4,311
0
605
340
2000
8,577
187
669
1,236
5,368
0
710
407
Avg.
8,699
450
1,176
1,676
4,097
37
768
495
Table 3i
Common squids caught by commercial fishing gears in specific areas of the Gulf of
Thailand from 1990 to 2000.
Year
Total (mt)
Area 1000
Area 2
Area 3
Area 4
Area 5
Area A
Area B
1990
35,048
6,775
2,064
8,367
12,877
1,759
2,463
743
1991
33,915
5,826
1,910
9,752
14,413
0
338
1,676
1992
29,243
4,707
2,056
6,258
7,893
706
3,207
4,416
1993 35,257 6,084 1,782 5,157
13,078 1,272 2,910
4,974
1994
33,166
5,842
1,771
4,780
12,957
241
2,520
5,055
1995 38,431 4,427 1,759 4,314
12,393 2,165 5,607
7,766
1996
37,802
4,556
2,002
3,473
10,551
0
8,883
8,337
1997
35,773
4,092
1,879
3,168
9,677
0
7,799
9,158
1998
34,442
2,839
2,205
4,207
10,342
0
5,681
9,168
1999
40,246
3,592
3,012
3,875
9,422
0
7,276
13,069
2000
48,911
3,722
5,339
9,235
8,190
0
9,532
12,893
Avg. 36,567 4,769
2,344 5,690
11,072
558
5,111
7,023
Reversing Environmental Degradation Trends in the South China Sea and Gulf of Thailand
NATIONAL REPORT ON FISHERIES THAILAND
APPENDIX 1 PAGE 10
Table 3j
Cuttlefish caught by commercial fishing gears in specific areas of the Gulf of
Thailand from 1990 to 2000.
Year
Total (mt)
Area 1000
Area 2
Area 3
Area 4
Area 5
Area A
Area B
1990
37,352
3,924
2,036
10,039
16,085
725
3,620
923
1991
41,645
5,680
4,449
11,125
15,334
0
464
4,593
1992
39,321
7,767
2,866
7,831
7,853
282
6,780
5,942
1993
36,574
5,673
1,766
7,505
10,938
645
5,141
4,906
1994 34,342 4,963 1,433 6,317 12,229 81
4,146
5,173
1995 37,190 3,296 2,006 5,344 11,874 778
4,385
9,507
1996
37,640
2,787
2,271
2,905
9,643
0
9,232
10,802
1997
37,439
2,494
2,138
2,643
8,840
0
7,655
13,669
1998
36,928
2,310
2,039
2,992
10,699
0
5,762
13,126
1999
37,945
2,594
2,417
2,366
8,716
0
6,498
15,354
2000
35,841
2,345
2,201
2,470
7,154
0
6,413
15,258
Avg. 37,474 3,985 2,329 5,594 10,851 228 5,463
9,023
Table 3k
Octopus caught by commercial fishing gears in specific areas of the Gulf of
Thailand from 1990 to 2000.
Year
Total (mt)
Area 1000
Area 2
Area 3
Area 4
Area 5
Area A
Area B
1990
15,729
883
2,050
3,704
7,857
294
866
75
1991
13,960
1,192
1,952
6,045
3,949
0
249
573
1992 14,646 1,034 1,673 6,264 1,942 211 1,992 1,530
1993 13,681 1,089 1,883 4,489 2,478 120 1,870 1,752
1994
11,145
1,012
947
3,856
2,572
32
1,295
1,431
1995
10,795
690
1,600
1,933
1,841
372
1,266
3,093
1996
12,718
578
1,790
2,242
3,291
0
3,090
1,727
1997
12,112
520
1,695
2,049
3,043
0
2,621
2,184
1998
12,949
843
1,626
2,104
3,296
0
1,845
3,235
1999
11,961
1,048
1,697
1,209
3,370
0
1,646
2,991
2000
10,866
449
1,900
1,081
4,015
0
1,877
1,544
Avg.
12,778
849
1,710
3,180 3,423
94 1,692 1,830
Reversing Environmental Degradation Trends in the South China Sea and Gulf of Thailand
NATIONAL REPORT ON FISHERIES THAILAND
APPENDIX 2 PAGE 1
APPENDIX 2
Extinct, Extinct in the Wild, Critically Endangered, Vulnerable, and Threatened Marine Species
in Thailand
No.
Type
Scienticific name
Common name
Local name
Status
(Thai name)
1 Mammal Orcaella brevirostris
Irrawady dolphin
Loma erawadee
CR
2 Mammal Dugong dugon
Sea cow, Dugong
Payoon
CR
3 Mammal Mesoplodon ginkgodens
Ginkgotoothed beaked whale
Wal fun khaew
CR
4 Mammal Peponocephala electra
Melonheaded whale
Wal hua tang mo
EN
5 Mammal Steno bredanensis
Roughtoothed dolphin
Loma fun hang
EN
6 Mammal Delphinus capensis
Longbeaked common dolphin
Lonma pak yoa
EN
7 Mammal Balaenoptera physalus
Fin whale
Wal fin
EN
8 Mammal Balaenoptera edeni
Bryde's whale
Wal sit tang
EN
9 Mammal Physeter macrocephalus
Sperm whale
Wal hua tui
EN
10 Mammal Kogia breviceps
Pigmy sperm whale
Wal hua tui lex
EN
11 Mammal Kogia simus
Dwarf sperm whale
Wal hua tui kak
EN
12 Mammal Orcinus orca
Killer whale
Wal pet cha kart
EN
13 Mammal Globicephalus macrorhynchus
Pigmy killer whale
Wal num rong krep sun
EN
14 Mammal Stenella coeruleoalba
Striped dolphin
Loma tab
EN
15 Mammal Stenella attenuata
Spotted dolphin
Loma jud
EN
16 Mammal Feresa attenuata
Pygmy killer whale
Wal petchakart lex
EN
17 Mammal Neophocaena phcaenoides
Finless porpoise
Loma hua baht lan leab
EN
18 Mammal Sousa chinensis
Indo-Pacific humpbacked dolphin
Loma perk
EN
19 Mammal Stenella longirostris
Spinner dolphin
Loma kadod
EN
20 Mammal Tursiops aduncus/truncatus
Bottlenose dolphin
Loma pakkhod
EN
21 Mammal Pseudorca crassidens
False killer whale
Wal petchabart dum
EN
22 Fishes
Macrochirichthys macrochirus
Dab
loas
EN
23 Fishes
Tetraodon baileyi
Pukpult
khon
EN
24 Fishes
Sphyrna blochii
Wing hammerhead shark
Chalam hua korn yao
EN
25 Fishes
Chiloscyllium plagiosum
Whitespot bambooshark
Chalammalayoo chalamhin
VU
26 Fishes
Carcharhinus brachyurus
Copper shark
Chalamkeepdang
VU
27 Fishes
Carcharhinus obscurus
Dusky shark
Chalamtow
VU
28 Fishes
Rhizoprionodon acutus
Milk shark
Chalamhualeam
VU
29 Fishes
Rhina ancylostoma
Bighead quitarfish
Ronin krabentongnum
VU
30 Fishes
Rhinobatos granulatus
Rough-backed guitarfish
Ronun emud
VU
31 Fishes
Rhinobatos thouini
Bottlenosed guitarfish
Emod emud
VU
32 Fishes
Narcine brunnea
Brown electric ray
Krabenfirefahseenumtan
VU
33 Fishes
Narcine maculata
Blotched electric ray
Krabenfirefajudkem
VU
34 Fishes
Narke dipterygia
Electric ray
Krabenfirefa
VU
35 Fishes
Dasyatis brevicaudatus
Smooth stingray
Krabenhangsun
VU
Reversing Environmental Degradation Trends in the South China Sea and Gulf of Thailand
NATIONAL REPORT ON FISHERIES THAILAND
APPENDIX 2 PAGE 2
APPENDIX 2 cont. Extinct, Extinct in the Wild, Critically Endangered, Vulnerable, and
Threatened Marine Species in Thailand.
No.
Type
Scienticific name
Common name
Local name
Status
(Thai name)
36 Fishes
Himantura gerrardi
White spotted whipray
Krabenjudkao krabenma
VU
37 Fishes
Aetomylaeus maculatus
Mottled eagle ray
Krabennokjudkao
VU
38 Fishes
Aetomylaeus nichofii
Nieuhof's eagle ray
Krabennokbung
VU
39 Fishes
Chiloscyllium griseum
Grey bambooshark
Chalamtookkae chalamkob
VU
40 Fishes
Stegostoma fasciatum
Nurseshark, zebrashark
Chalamsuar suartalay
VU
41 Fishes
Carcharhinus albimarginatus
Silvertip shark
Chalamplaykeebkao
VU
42 Fishes
Carcharhinus amboinensis
Greyreef shark
Chalamtalek
VU
43 Fishes
Carcharhinus plumbeus
Sandbar shark
Chalamkradonqsung
VU
44 Fishes
Rhizoprionodon oligolinx
Sharpnose shark
Chalamhualeam
VU
45 Fishes
Rhychobatus australiae
White-spotted shovelnose ray
Ronunjudkao
VU
46 Fishes
Rhinobatos schlegelii
Brown quitarfish
Ronumhuasai
VU
47 Fishes
Rhinobatos typus
Giant shovelnose ray
Ronumyak
VU
48 Fishes
Narcine indica
Large spotted numbfish
Krabenfirefa indea
VU
49 Fishes
Narcine prodorsalis
Tonkin numbfish
Krabenfirefa judlek
VU
50 Fishes
Temera hardwickii
Smooth electric ray
Krabenfirefa, plaseal
VU
51 Fishes
Himantura uarnak
Reticulate whip ray
Krabenpakleam
VU
52 Fishes
Aetomylaeus milvus
Ocellate eage ray
Krabennok
VU
53 Fishes
Rhinoptera adspersa
Rough cownose ray
Krabenjamookwua
VU
54 Fishes
Chirocentrus nudus
Smooth wolf herring
Dablaosun
VU
55 Fishes
Setipinna melanochir
Duskyhairfin anchovy
Meawhudum
VU
56 Fishes
Narcine brunnea
Brown electric ray
Krabenfirefaseenumtan
VU
57 Fishes
Epinephelus coioides
Orange spotted grouper
Karangjudnumtan
VU
58 Fishes
Lobotes surinamensis
Brown tripletail
Kapongkeesao
VU
59 Fishes
Gymuura poecilura
Longtail butterfly ray
Krabenpesuar
VU
60 Fishes
Tetraodon suvatti
Puffers fish
Pukpao
VU
61 Fishes
Aetobatus narinari
Spot eagle ray
Krabenkangkao
TH
62 Fishes
Carcharhinus leucas
Bull shark
Chalamhuamart
TH
63 Fishes
Cromileptes altivelis
Humpback grouper
Karangnangon
TH
64 Fishes
Epinephelus lanceolatus
Queensland grouper, Brindle bass
Mortalay
TH
65 Fishes
Triaenodon obesus
Whitetip reef shark
Chalam keepkao
TH
66 Reptile Dermochelys coriacea
Leathery turtle
Taomaphaung
CR
67 Reptile Caretta caretta
Loggerhead turtle
Tao huakon
CR
68 Reptile Chelonia mydas
Green turtle
Tao tanu
EN
69 Reptile Eretmochelys imbricata
Howksbill turtle
Taokra
EN
70 Reptile Crocodylys porosus
Estuarine crocodlie, Salt water
Jarakaenumkem EN
crocodile
Remarks : EX = Extinct
CR = Critically endangered species
EN = Endangered species
VU = Vulnerable species
TH = Threatened species
Reversing Environmental Degradation Trends in the South China Sea and Gulf of Thailand
NATIONAL REPORT ON FISHERIES THAILAND
APPENDIX 3 PAGE 1
APPENDIX 3
Fishes Found in Habitats of the Gulf of Thailand
No.
Family
Scientific name
Common name
WL CR MG SG
1 Acanthuridae
Acanthurus mata (Cuvier, 1829)
Elongate surgeonfish
x
2 Acanthuridae
Naso lituratus
x
3 Acropomatidae
Malakichthys wakiyae
Temperate Ocean-bass
x
4 Akysidae
Akysis macronemus
Stream Catfish
x
5 Ambassidae
Ambassis buruensis Bleeker, 1857
Buru Glass Perchlet
x
x
6 Ambassidae
Ambassis commersoni
Commerson's Perchlet
x
7 Ambassidae
Ambassis dayi
Perchlet x
8 Ambassidae
Ambassis gymnocephalus (Lacepede, 1802)
Bald Glassfish
x
9 Ambassidae
Ambassis interruptus Cuvier & Valenciennes, 1828 Longspined perchlet
x
x
x
10 Ambassidae
Ambassis kopsii Bleeker, 1858
Freckled Hawkfish
x
x
x
11 Ambassidae
Ambassis macracanthus Bleeker, 1849
Bleeker's wasp fish
x
x
12 Ambassidae
Ambassis ranga
Indian Glassy Fish
x
13 Ambassidae
Ambassis siamensis
Glassfish x
14 Ambassidae
Ambassis sp. 1
x
x
15 Ambassidae
Ambassis urotaenis Bleeker, 1852
Bunded-tail Glassy
x
Perchlet
16 Ambassidae
Ambassis vachellii Richardson, 1846
x
x
17 Ambassidae
Ambassis wolffii
Perchlet x
18 Amblycipitidae
Amblyceps sp.
x
19 Anabantidae
Anabas testudineus
Common Climbing Perch
x
20 Anabatidae
Osphronemus goramy
Giant Gourami
x
21 Anguillidae
Anguilla bicolor bicolor McClelland, 1844
Freshwater Eel
x
x
22 Apochelidae
Apocheilus panchaxDay, 1875
Blue Panchax
x
x
23 Apogonidae
Apogon aureus (Lacepede, 1802)
Ring-tailed cardinalfish
x
24 Apogonidae
Apogon cf. hyalosoma
x
25 Apogonidae
Apogon cookii
x
26 Apogonidae
Apogon cyanosoma
x
27 Apogonidae
Apogon exostigma
x
28 Apogonidae
Apogon fasciatus Shaw, 1790
x
x
29 Apogonidae
Apogon hyalosoma Bleeker, 1853
x
x
30 Apogonidae
Apogon kallopterus
x
31 Apogonidae
Apogon kalosoma
x
32 Apogonidae
Apogon Leptacanthus
x
33 Apogonidae
Apogon nigrofasciatus
x
34 Apogonidae
Apogon novemfasciatus
x
35 Apogonidae
Apogon sangiensis
Sangi Caardinalfish
x
36 Apogonidae
Apogon semilineatus Temmink & Schelgel, 1843
Black-tipped cardinalfish
x
37 Apogonidae
Apogon septemstriatus
x
38 Apogonidae
Apogon sp.1
x
x
39 Apogonidae
Apogon spp. Cardinalfish
x
x
40 Apogonidae
Apogon taeniophorus
x
41 Apogonidae
Apogon thermalis Valenciennes, 1829
Thermal Cardinalfish
x
42 Apogonidae
Apogon trimaculatus
x
43 Apogonidae
Cheilodipterus artus
x
44 Apogonidae
Cheilodipterus macrodon
Eightlined Cardinal
x
x
45 Apogonidae
Cheilodipterus quinquelineatus
Toothed Cardinal
x
x
46 Apogonidae
Cheiloprion labiatus
x
47 Apogonidae
Fowleria variegata (Valenciennes,
1832)
x
48 Ariidae
Apogon ventrifasciatus Allen, Kuiter & Randall,
x
1828
49 Ariidae
Archamia fucata
x
50 Ariidae
Archamia goni
x
51 Ariidae
Arius caelatus (Cuvier & Valenciennes, 1840)
Engraved catfish
x
x
52 Ariidae
Arius gagora
Seacatfish x
53 Ariidae
Arius maculatus(Thunberg, 1792)
Spotted catfish
x
54 Ariidae
Arius sagor(Buchanan, 1822)
Sagor catfish
x
55 Ariidae
Arius sp.
Seacatfish
x
56 Ariidae
Arius spp.
Seacatfish
x
57 Ariidae
Arius thalassinus(Ruppell, 1837)
Salmon catfish
x
58 Ariidae
Batrachocephalus mino
Frog Seacatfish
x
59 Ariidae
Hemiarius stormi
Seacatfish x
60 Ariidae
Hemipimelodus borneensis
Sea Catfish
x
61 Ariidae
Hemipimelodus sp. Sea
Catfish
x
62 Ariidae
Ketengus typus
Typus Catfish
x
63 Ariidae
Osteogeneiosus nilitaris
Seacatfish x
64 Atherinidae
Hypoatherina temminckki
x
65 Atheriniidae
Atherinomorus duodecimalis (Cuvier, 1835)
x
x
x
66 Bagridae
Bagroides siamensis
Bagrid Catfish
x
67 Bagridae
Batasio tengana
Bagrid Catfish
x
Reversing Environmental Degradation Trends in the South China Sea and Gulf of Thailand
NATIONAL REPORT ON FISHERIES THAILAND
APPENDIX 3 PAGE 2
Appendix 3 cont.
Fishes found in habitats of the Gulf of Thailand.
No.
Family
Scientific name
Common name
WL CR MG SG
68 Bagridae
Hemibagrus bocourti
Bagrid Catfish
x
69 Bagridae
Hemibagrus nemurus
Yellow Mystus
x
70 Bagridae
Hemibagrus wyckii
Bagrid Catfish
x
71 Bagridae
Heterobagrus bocourti
Bocourt's River Catfish
x
72 Bagridae
Leiocassis poecilopterus
Bagrid Catfish
x
73 Bagridae
Leiocassis siamensis
Siamese Rock Catfish
x
74 Bagridae
Mystus cavasius
Long-fatty Finned Mystus
x
75 Bagridae
Mystus gulio (Hamliton, 1822)
Long Whiskers Catfish
x
x
76 Bagridae
Mystus micracanthus
Twospot Catfish
x
77 Bagridae
Mystus mysticetus
Catfish x
78 Bagridae
Mystus planiceps
Catfish x
79 Bagridae
Mystus sp. Catfish
x
80 Bagridae
Mystus vittatus
Iridescent Mystus
x
81 Bagridae
Mystus wolffi
Catfish x
82 Bagridae
Mystus wyckii
Bagrid Catfish
x
83 Balistidae
Balistoides viridescens
x
84 Balitoridae
Homaloptera orthogoniata
River Loach
x
85 Balitoridae
Homaloptera septemfasciata
River Loach
x
86 Balitoridae
Homaloptera smithi
River Loach
x
87 Balitoridae
Homaloptera sp.
River Loach
x
88 Balitoridae
Homaloptera zollingeri
River Loach
x
89 Batrachoididae
Allenbatrachus grunniens (Linnaeus, 1758)
Grunting toadfish
x
90 Batrachoididae
Batrachus grunniens
Toad Fish
x
91 Batrachoididae
Batrichthys grunniens (Linnaeus, 1758)
x
92 Belonidae
Strongylura strongylura (Van Hassch, 1823)
Spottail needlefish
x
x
93 Belonidae
Strongyrura incisa
x
94 Belonidae
Tylosurus acus melanotus
x
95 Belonidae
Tylosurus crocodilus crocodilus (Peron et Le
Hound needlefish
x
x
x
Sueur, 1821)
96 Belonidae
Tylosurus sp.
x
97 Belonidae
Xenenthodon cancilla
Round-tailed Garfish
x
98 Belonidae
Xenenthodon sp. Freshwater
Garfish
x
99 Beloniformes
Ablennes hians(Valenciennes, 1846)
Flat needlefish
x
100 Blenniella
Istiblennius dussumieri
x
101 Blenniella
Istiblennius edentulus
x
102 Blenniidae
Blenniella bilitonensis
x
103 Blenniidae
Cirripectes filamentosus
x
104 Blenniidae
Enchelyurus kraussi
x
105 Blenniidae
Laiphognathus multimaculatus
x
106 Blenniidae
Omobranchus fasciolatus Erhenberg, 1839
x
107 Blenniidae
Omobranchus ferox (Herre, 1927)
x
108 Blenniidae
Omobranchus punctatus (Valenciennes, 1836)
x
109 Blenniidae
Omox biporos
x
110 Blenniidae
Parenchelyurus hepburni
x
111 Blenniidae
Petrocirtes variabilis Cantor,
1850
x
112 Blenniidae
Salarias fasciatus
x
113 Bothidae
Arnoglosus sp.
x
114 Bothidae
Pseudorhombus arsius (Hamilton, 1822)
Largetooth flounder
x
x
x
115 Bothidae
Pseudorhombus elevatus Ogilby, 1912
Deepbody flounder
x
116 Bothidae
Pseudorhombus malayanus Bleeker, 1866
Roughscale flounder
x
117 Caesionidae
Caesio caerulaurea
x
118 Caesionidae
Caesio coerulaureus Lacepede, 1801
Blue and gold fusilier
x
119 Caesionidae
Caesio cuning
Redbelly yellowtail fusilier
x
x
120 Caesionidae
Caesio lunaris
x
121 Caesionidae
Caesio xanthonotus
Fusilier x
122 Caesionidae
Pterocaesio chrysozona
x
123 Caesionidae
Pterocaesio tile
x
124 Callionymidae
Callionymus enneactis
x
125 Callionymidae
Callionymus filamentosus
x
126 Callionymidae
Callionymus hindsi Richardson, 1844
x
127 Callionymidae
Callionymus sagitta
Arrowhead Dragonet
x
128 Callionymidae
Callionymus schaapii Bleeker, 1852
Dragonet
x
x
129 Callionymidae
Callionymus spp.
x
130 Carangidae
Alectis indicus (Ruppell, 1828)
Indian threadfin
x
x
131 Carangidae
Alepes djedaba (Forsskal, 1775)
Djedaba crevalle/Solar
x x
sacd
132 Carangidae
Alepes kleinii (Bloch, 1793)
Bonded scad
x
x
133 Carangidae
Alepes vari (Cuvier, 1833)
Herring scad
x
x
134 Carangidae
Atule mate (Cuvier, 1833)
Yellowtail scad
x
x
x
135 Carangidae
Carangoides armatus (Ruppell, 1830)
Longfin trevally
x
x
Reversing Environmental Degradation Trends in the South China Sea and Gulf of Thailand
NATIONAL REPORT ON FISHERIES THAILAND
APPENDIX 3 PAGE 3
Appendix 3 cont.
Fishes found in habitats of the Gulf of Thailand.
No.
Family
Scientific name
Common name
WL CR MG SG
136 Carangidae
Carangoides bajad
x
137 Carangidae
Carangoides ferdau (Forsskal, 1775)
Blue trevally
x
138 Carangidae
Carangoides praeustus Bennett, 1830
Brownback trevally
x
x
139 Carangidae
Caranx djedaba
Shrimp scad
x
140 Carangidae
Caranx kalla
Shrimp scad
x
141 Carangidae
Caranx sexfasciatus Quoy & Gaimard, 1824
Bigeye trevally
x
x
x
142 Carangidae
Caranx sp.
Shrimp scad
x
143 Carangidae
Chorinemus lysan
Doublespotted Queenfish
x
144 Carangidae
Chorinemus tol
Needlescaled Queenfish
x
145 Carangidae
Gnathanodon speciosus
x
146 Carangidae
Scomberoides commersonianus Laccpede, 1801
Talang queenfish
x
x
147 Carangidae
Scomberoides lysan
Double-spotted queenfish
x
x
148 Carangidae
Scomberoides tol (Cuvier, 1832)
Needlescales queenfish
x
x
149 Carangidae
Selaroides leptolepis (Cuvier, 1833)
Yellow-stripe scad
x
x
150 Carangidae
Selaroides sp.
Yellowstripe Scad
x
151 Carcharhinidae
Carcharhinus melanopterus
x
152 Carcharhinidae
Carcharhinus sp.
Requien sharks
x
153 Centriscidae
Aeoliscus strigatus(Gunther, 1860)
Blacklined razorfish
x
154 Centropomidae
Chanda baculis
x
155 Centropomidae
Chanda siamensis
Siamese Glassfish
x
156 Centropomidae
Chanda sp. Asiatic
Glassfishes
x
157 Centropomidae
Lates calcarifer (Bloch, 1790)
Giant seaperch
x
x
x
158 Centropomidae
Parambassis ranga
Indian Glassy Fish
x
159 Centropomidae
Parambassis siamensis
Indian Glassy Fish
x
160 Centropomidae
Psamoperca waigiensis
x
161 Chaetodontidae
Chaetodon octofasciatus
Eight-banded Butterflyfish
x
x
162 Chaetodontidae
Chaetodon sp.
x
163 Chaetodontidae
Chaetodon wiebeli
x
164 Chaetodontidae
Chelmon rostratus
Long-nosed Butterflyfish
x
x
165 Chaetodontidae
Coradion chrysozonus(Cuvier, 1831)
Orange-banded coralfish
x
x
166 Chaetodontidae
Heniochus acuminatus (Linnaeus, 1758)
Featherfin Butterflyfish
x
x
x
x
167 Chaetodontidae
Parachaetodon ocellatus (Cuvier, 1831)
Ocellated Butterflyfish
x
x
x
x
168 Chaetodontidae
Pomacanthus annularis
Six-ined Anglefish
x
x
169 Chaetodontidae
Pomacanthus sexstriatus
Six-banded Anglefish
x
x
170 Channidae
Chanda wolffii
x
171 Channidae
Channa limbata
Red-tailed Shakehead
x
172 Channidae
Channa lucius
Blotched Snake-head Fish
x
173 Channidae
Channa micropeltes
Giant Snake-head Fish
x
174 Channidae
Channa siamensis
x
175 Channidae
Channa sp.
x
176 Channidae
Channa striatus
Striped Snake-head Fish
x
177 Channidae
Chanos chanos (Forsskal, 1775)
Milk fish
x
x
178 Chirocentridae
Chirocentrus dorab (Forsskal, 1775)
Dorab wolf herring
x
x
179 Cichlidae
Oreochromis mossambica
Java Tilapia
x
180 Cichlidae
Oreochromis nilotica
Nile Tilapia
x
181 Clariidae
Clarias batrachus
Batrachian Walking
x
Catfish
182 Clariidae
Clarias macrocephalus
Gunther's Walking Catfish
x
183 Clariidae
Genus prophagorus
Nieuhof's Walking Catfish
x
184 Clupeidae
Amblygaster sirm (Walbaum, 1792)
Spotted sardinella
x
185 Clupeidae
Anodontostoma chacunda (Hamilton, 1822)
Chacunda gizzaard shad
x
x
x
186 Clupeidae
Clarias meladerma
Catfish x
187 Clupeidae
Clupea atricauda
Bleeker's Blacktip
x
Sardinella
188 Clupeidae
Clupeichthys aesarnensis
Thai River Sprat
x
189 Clupeidae
Clupeichthys goniognathus
Sumatran River Sprat
x
190 Clupeidae
Clupeoides lile
x
191 Clupeidae
Clupeoides sp.
x
192 Clupeidae
Dussumieria elopsoides Bleeker, 1849
x
193 Clupeidae
Escualosa thoracata (Valenciennes, 1847)
White sardine
x
x
194 Clupeidae
Herklotsichthys dispilonotus
Two Spot Herring
x
195 Clupeidae
Herklotsichthys qradrimaculatus
x
196 Clupeidae
Hilsa kelee (Cuvier, 1829)
x
x
197 Clupeidae
Sardinella albella (Valenciennes, 1847)
White sardinella
x
x
198 Clupeidae
Spratelloides gracilis (Temminch & Schlegel, 1846) Striped Roundherring
x
x
x
x
199 Cobitidae
Acanthopsis choirorhynchos
Horseface Loach
x
200 Cobitidae
Botia beauforti
Botia x
201 Cobitidae
Botia eos
Red-tail Botia
x
202 Cobitidae
Botia helodes
Botia x
203 Cobitidae
Botia modesta
Yellow-tail Botia
x
Reversing Environmental Degradation Trends in the South China Sea and Gulf of Thailand
NATIONAL REPORT ON FISHERIES THAILAND
APPENDIX 3 PAGE 4
Appendix 3 cont.
Fishes found in habitats of the Gulf of Thailand.
No.
Family
Scientific name
Common name
WL CR MG SG
204 Cobitidae
Botia sidthimunki
Aree Botia
x
205 Cobitidae
Botia sp.
Botia
x
206 Cobitidae
Cobitophis anguillaris
Loach x
207 Cobitidae
Lepidocephalichthys sp. Loach
x
208 Cobitidae
Lepidocephalus octocirrhis
Loach x
209 Cobitidae
Pangio anguillaris
Loach x
210 Cobitidae
Pangio kuhlii
Khuli Loach
x
211 Cobitidae
Pangio myersi
Loach x
212 Cobitidae
Pangio pangia
Java Loach
x
213 Coiidae
Coius microlepis
Siamese Tiger Fish
x
214 Coiidae
Coius quadrifasciatus
Striped Bass, Rock Bass
x
215 Cynoglossidae
Cynoglossus arel (Schneider, 1801)
Largescale tonguesole
x
216 Cynoglossidae
Cynoglossus bilineatus (Lacepede, 1802)
Fourlined tongue sole
x
217 Cynoglossidae
Cynoglossus lida (Bleeker, 1851)
Twonostrils tongue sole
x
x
218 Cynoglossidae
Cynoglossus lingua Hamilton & Buchanan, 1822
Long tongue sole
x
x
219 Cynoglossidae
Cynoglossus macrolepidotus
Largescale tongue sole
x
220 Cynoglossidae
Cynoglossus microlepis
Freshwater Tonguefish
x
221 Cynoglossidae
Cynoglossus oligolepis
Tonguesole x
222 Cynoglossidae
Cynoglossus puncticeps (Richardson, 1846)
Speckled tonguesole
x
x
x
223 Cynoglossidae
Cynoglossus semifasciatus Day, 1878 - 1888
x
x
224 Cynoglossidae
Cynoglossus sp.
Tonguesole
x
225 Cynoglossidae
Paraplagusia blochi
Two Lined Tongue Sole
x
226 Cyprinidae
Albulichthys albuloides
Minnow x
227 Cyprinidae
Amblyrhynchichthys truncatus
Minnow x
228 Cyprinidae
Balantiocheilos melanopterus
Black-tipped Silver Shark
x
229 Cyprinidae
Bangana behri
x
230 Cyprinidae
Barbichthys laevis
Golden Carp
x
231 Cyprinidae
Barbodes altus
Red-tail Tinfoil Barb
x
232 Cyprinidae
Barbodes goninotus
Common Silver barb
x
233 Cyprinidae
Barbodes schwanenfeldi
Schwanenfeld's Barb
x
234 Cyprinidae
Barillius guttatus
Barillius x
235 Cyprinidae
Barillius nanensis
Barillius x
236 Cyprinidae
Barillius ornatus
Barillius x
237 Cyprinidae
Boraras micros
x
238 Cyprinidae
Catlocarpio siamensis
Siamese gisnt carp
x
239 Cyprinidae
Chela caeruleostigmata
Leaping Barb
x
240 Cyprinidae
Chela laubuca
Indian Glass Barb
x
241 Cyprinidae
Cirrhinus chinensis
Mud Carp
x
242 Cyprinidae
Cirrhinus cryptopogon
Mud Carp
x
243 Cyprinidae
Cirrhinus jullien
Jullien's Mud Carp
x
244 Cyprinidae
Cirrhinus macrosemion
Mud Carp
x
245 Cyprinidae
Cirrhinus microlepis
Smallscale Mud Carp
x
246 Cyprinidae
Cirrhinus prosemion
Smallscale Mud Carp
x
247 Cyprinidae
Cirrhinus spiropleura
Jullien's Mud Carp
x
248 Cyprinidae
Crossocheilus oblongus
Siamese Flying Fox
x
249 Cyprinidae
Crossocheilus reticulatus
Loach x
250 Cyprinidae
Crossocheilus siamensis
Hying Fox
x
251 Cyprinidae
Cyclocheilichthys apogon
Indian River Barb
x
252 Cyprinidae
Cyclocheilichthys armatus
River Barb
x
253 Cyprinidae
Cyclocheilichthys enoplos
Soldier River Barb
x
254 Cyprinidae
Cyclocheilichthys heteronema
River Barb
x
255 Cyprinidae
Cyclocheilichthys repasson
River Barb
x
256 Cyprinidae
Cyprinus carpio
Common carp
x
257 Cyprinidae
Danio albolineatus
Danio x
258 Cyprinidae
Danio regina
Blue Danio
x
259 Cyprinidae
Discherodontus schroederi
x
260 Cyprinidae
Epalzeorhynchos bicolor
Red-tailed Black Shark
x
261 Cyprinidae
Epalzeorhynchos frenatus
Red-finned Black Shark
x
262 Cyprinidae
Epalzeorhynchos kallopterus
Flying Fox
x
263 Cyprinidae
Epalzeorhynchos sp. Black
Shark
x
264 Cyprinidae
Esomus metallicus
Flying Rasbora
x
265 Cyprinidae
Garra cambodgiensis
Stonelapping Ninow
x
266 Cyprinidae
Garra fuliginosa
Loach x
267 Cyprinidae
Garra sp.
Loach
x
268 Cyprinidae
Garra taeniata
Stonelapping Ninow
x
269 Cyprinidae
Hampala diapar
Eye-spot Barb
x
270 Cyprinidae
Hampala macrolepidota
Transverse-bar-barb x
271 Cyprinidae
Henicorhynchus caudimaculatus
x
272 Cyprinidae
Henicorhynchus cryptopogon
x
273 Cyprinidae
Henicorhynchus siamensis
Mud Carp
x
Reversing Environmental Degradation Trends in the South China Sea and Gulf of Thailand
NATIONAL REPORT ON FISHERIES THAILAND
APPENDIX 3 PAGE 5
Appendix 3 cont.
Fishes found in habitats of the Gulf of Thailand.
No.
Family
Scientific name
Common name
WL CR MG SG
274 Cyprinidae
Hypophthalmichthys molitrix
Silver Carp
x
275 Cyprinidae
Hypophthalmichthys nobilis
Bighead Carp
x
276 Cyprinidae
Hypsibarbus wetmorei
x
277 Cyprinidae
Labeo behri
Carp x
278 Cyprinidae
Labeo bicolor
Redtail Sharkminow
x
279 Cyprinidae
Labeo dyocheilus
x
280 Cyprinidae
Labeo erythrurus
x
281 Cyprinidae
Labeo rohita
Rohu x
282 Cyprinidae
Labeo sp.
x
283 Cyprinidae
Labiobarbus burmanicus
Barb x
284 Cyprinidae
Labiobarbus lineatus
Carp x
285 Cyprinidae
Labiobarbus sp.
x
286 Cyprinidae
Labiobarbus spilopleura
Barp x
287 Cyprinidae
Leptobarbus hoeveni
Hoeven's Slender Carp
x
288 Cyprinidae
Lobocheilus gracilis
x
289 Cyprinidae
Lobocheilus quadrilineatus
Barb x
290 Cyprinidae
Lobocheilus rhabdoura
Barb x
291 Cyprinidae
Lobocheilus sp.
x
292 Cyprinidae
Luciosoma bleekeri
Appllo Shark
x
293 Cyprinidae
Luciosoma setigerum
x
294 Cyprinidae
Macrochirichthys macrochirus
Carp x
295 Cyprinidae
Morulius chrysophekadian
Black Shark
x
296 Cyprinidae
Morulius sp. Barb
x
297 Cyprinidae
Mystacoleucus argenteus
Barb x
298 Cyprinidae
Mystacoleucus atridorsaliss
x
299 Cyprinidae
Mystacoleucus marginatus
x
300 Cyprinidae
Mystacoleucus sp.
x
301 Cyprinidae
Neolissochilus stracheyi
x
302 Cyprinidae
Osteochilus hasselti
Barb x
303 Cyprinidae
Osteochilus lini
Barb x
304 Cyprinidae
Osteochilus melanopleura
Greater Bony Lipped Barb
x
305 Cyprinidae
Osteochilus microcephalus
x
306 Cyprinidae
Osteochilus prosenion
Mud Carp
x
307 Cyprinidae
Osteochilus schlegeli
x
308 Cyprinidae
Osteochilus sp. Barb
x
309 Cyprinidae
Osteochilus spilopleurus
Mud Carp
x
310 Cyprinidae
Osteochilus vittatus
Bony Lipped Barb
x
311 Cyprinidae
Osteochilus waandersii
Waander's Bony Lipped
x
Barb
312 Cyprinidae
Oxygaster maculicauda
x
313 Cyprinidae
Oxygaster oxygastroides
Glass Fish
x
314 Cyprinidae
Oxygaster pointoni
x
315 Cyprinidae
Oxygaster siamensis
Glassfish x
316 Cyprinidae
Oxygaster sp.
x
317 Cyprinidae
Parachela sp.
x
318 Cyprinidae
Paralaubuca barroni
Carp x
319 Cyprinidae
Paralaubuca harmandi
x
320 Cyprinidae
Paralaubuca riveroi
Siamese River Abramine
x
321 Cyprinidae
Paralaubuca sp.
x
322 Cyprinidae
Paralaubuca typus
x
323 Cyprinidae
Probarbus jullieni
Jullien's Golden Price
x
Carp
324 Cyprinidae
Puntioplites proctozysron
Barb x
325 Cyprinidae
Raiamas guttatus
Minnow x
326 Cyprinidae
Rasbora argyrotaenis
Silver Rasbora
x
327 Cyprinidae
Rasbora borapetensis
Blackline Rasbora
x
328 Cyprinidae
Rasbora caudimaculata
Graeter Scissortail
x
329 Cyprinidae
Rasbora dusonensis
Yellowtail Rasbora
x
330 Cyprinidae
Rasbora lateristriata
Yellow Rasbora
x
331 Cyprinidae
Rasbora myersi
Myer's Silver Rasbora
x
332 Cyprinidae
Rasbora retrodorsalis
Pale Rasbora
x
333 Cyprinidae
Rasbora sumatrana
Giant Scissor-tail
x
334 Cyprinidae
Rasbora trilineata
Three-lined Rasbora
x
335 Cyprinidae
Sikukia stejnegeri
Carp x
336 Cyprinidae
Systomus beasleyi
x
337 Cyprinidae
Systomus binotatus
Spotted Barb
x
338 Cyprinidae
Systomus leiacantus
Golden Little Barb
x
339 Cyprinidae
Systomus orphoides
Red-cheeked Barb
x
340 Cyprinidae
Systomus partipentozona
x
341 Cyprinidae
Systomus somphongsi
x
Reversing Environmental Degradation Trends in the South China Sea and Gulf of Thailand
NATIONAL REPORT ON FISHERIES THAILAND
APPENDIX 3 PAGE 6
Appendix 3 cont.
Fishes found in habitats of the Gulf of Thailand.
No.
Family
Scientific name
Common name
WL CR MG SG
342 Cyprinidae
Systomus sp.
x
343 Cyprinidae
Systomus stolitczkae
x
344 Cyprinidae
Systomus vernayi
x
345 Cyprinidae
Tor soro
Soro Brook Carp
x
346 Cyprinidae
Tor tambroides
Greater Brook Carp
x
347 Dasyatidae
Dasyatis bleekeri
Freshwater Stingray
x
348 Dasyatidae
Himantura chaophraya
Ray x
349 Dasyatidae
Himantura gerrardi (Gray,
1851)
x
350 Dasyatidae
Himantura imbricata (Bloch & Schneider, 1801)
x
x
351 Dasyatidae
Taeniura lymma(FORSSKAL, 1775)
Blue-spotted Fantail Ray
x
x
352 Diodontidae
Chilomycterus orbicularis (Bloch, 1785)
Birdbeak burrfish
x
353 Diodontidae
Diodon holocanthus(Linnaeus, 1758)
Freckled porcupine fish
x
354 Diodontidae
Diodon hystrixLinnaeus, 1758
Porcupine fish
x
355 Diodontidae
Diodon liturosus
Shortspine Ballonfish
x
x
356 Drepanidae
Drepane longimana (Bloch & Schneider, 1801)
Band sicklefish
x
357 Drepanidae
Drepane punctata (Linnaeus, 1758)
x
358 Echeneidae
Echenius naucratesLinnaeus, 1758
Slender suckerfish
x
359 Eleotridae
Ophiocara porocephala (Valenciennes, 1837)
Spangled gukgeon
x
x
360 Eleotridae
Prinobutis koilomatodon
x
361 Eleotridedae
Bostrychus sinensis (Lacepede, 1801)
x
362 Eleotridedae
Butis butis (Hamilton, 1822)
Crimsontip flathead
x
x
gudgeon
363 Eleotridedae
Butis koilomatoton (Bleeker, 1849)
x
364 Eleotrididae
Eleotris melanosoma Bleeker, 1852
x
365 Eleotrididae
Odonteleotris macrodon (Bleeker, 1583)
x
366 Elopidae
Elops machnata (orsskal, 1775)
x
367 Engraulidae
Coilia borneensis
x
368 Engraulidae
Coilia dussumieri
Goldspotted Grenadier
x
369 Engraulidae
Coilia macrognathus
Moustached Taper-tail
x
370 Engraulidae
Coilia sp.
x
371 Engraulidae
Engraulis grayi
Hamilton's thryssa
x
372 Engraulidae
Engraulis mystax
Moustached Thryssa
x
373 Engraulidae
Engraulis sp.
x
374 Engraulidae
Stolephorus baganensis Hardenberg, 1933
x
375 Engraulidae
Stolephorus commersonii
Anchovy x
376 Engraulidae
Stolephorus indicus (Van Hasselt, 1823)
Indian anchovy
x
x
x
377 Engraulidae
Stolephorus insularis Hardenberg, 1933
x
378 Engraulididae
Setipinna taty (Valenciennes, 1848)
Hairfin anchovy
x
379 Engraulididae
Thryssa hamiltonii (Gray, 1835)
Hanilton's thryssa
x
x
380 Engraulididae
Thryssa kammalensis (Bleeker, 1849)
Madura thryssa
x
381 Engraulididae
Thryssa setirostris (Broussonet, 1782)
Longjaw thryssa
x
382 Ephippidae
Ephippus orbis (Bloch, 1787)
Round spadefish
x
x
383 Ephippidae
Platax orbicularis
Round Batfish
x
384 Ephippidae
Platax teira (Forsskal, 1775)
Longfin batfiah
x
x
x
385 Fistulariidae
Fistularia commersonii Ruppell, 1838
Serrated flutemouth
x
386 Gerreidae
Gerres abbreviatus Bleeker, 1850
Deepbody silverbiddy
x
x
x
387 Gerreidae
Gerres acinaces (Bleeker, 1854)
Longtail silverbiddy
x
388 Gerreidae
Gerres filamemtosus Cuvier, 1829
Whipfin silverbiddy
x
x
389 Gerreidae
Gerres lucidus
x
390 Gerreidae
Gerres oblongus (Cuvier, 1830)
Elongated silverbiddy
x
x
x
391 Gerreidae
Gerres oyena (Forsskal, 1775)
Slender silverbiddy
x
x
x
392 Gerreidae
Gerres poieti (Cuvier, 1829)
Strongspine silverbiddy
x
x
393 Gerreidae
Gerres sp.
x
394 Gobiesocidae
Diademichthys lineatus
x
395 Gobiesocidae
Lepadichthys sp.
x
396 Gobiidae
Acentrogobius audax Smith, 1959
x
397 Gobiidae
Acentrogobius caninus (Cuvier & Valenciennes,
Dogtooth goby
x
x
1837)
398 Gobiidae
Acentrogobius janthinopterus (Bleeeker, 1852)
x
399 Gobiidae
Acentrogobius viridipunctatus (Valenciennes,
Triangle Goby
x
x
1837)
400 Gobiidae
Amblyeleotris fontanesii (Bleeker, 1852)
x
401 Gobiidae
Amblyeleotris gymnocephalus (Bleeker, 1853)
x
402 Gobiidae
Amblygobius nocturnus (Herre, 1945)
x
403 Gobiidae
Amblygobius phalaena (Valenciennes, 1837)
x
404 Gobiidae
Amoya moloanus (Herre, 1927)
x
405 Gobiidae
Apocryptodon madurensis (Bleeker, 1849)
x
x
406 Gobiidae
Aulopareia cyanomos (Bleeker, 1849)
x
407 Gobiidae
Bathygobius fuscus (Ruppell, 1830)
Brown goby
x
x
x
408 Gobiidae
Boleophthalmus boddarti (Pallas, 1770)
x
Reversing Environmental Degradation Trends in the South China Sea and Gulf of Thailand
NATIONAL REPORT ON FISHERIES THAILAND
APPENDIX 3 PAGE 7
Appendix 3 cont.
Fishes found in habitats of the Gulf of Thailand.
No.
Family
Scientific name
Common name
WL CR MG SG
409 Gobiidae
Boleophthalmus pectinirostris
Jumping Goby
x
410 Gobiidae
Brachygobius sp.
Goby
x
411 Gobiidae
Brachygobius sp.1
x
412 Gobiidae
Brachygobius sp.2
x
413 Gobiidae
Callogobius sp.1
x
414 Gobiidae
Callogobius sp.2
x
415 Gobiidae
Cristatogobius lophius Herre, 1927
x
416 Gobiidae
Cristatogobius sp.1
x
417 Gobiidae
Cryptocentrus caeruleomaculatus
x
418 Gobiidae
Cryptocentrus cinctus
x
419 Gobiidae
Cryptocentrus fasciatus
x
420 Gobiidae
Cryptocentrus leptocephalus Bleeker, 1876
Eightband goby
x
x
421 Gobiidae
Cryptocentrus pavaninoides
x
422 Gobiidae
Cryptocentrus sp.
x
x
423 Gobiidae
Cryptocentrus
sp.1
x
424 Gobiidae
Cryptocentrus strigilliceps (Jordan & Seale, 1906)
x
x
425 Gobiidae
Ctenogobiops pomastictus
x
426 Gobiidae
Ctenogobius cephalopadus
Goby x
427 Gobiidae
Ctenogobius driengmainensis
Goby x
428 Gobiidae
Dasson variabilis
Scabre Toothed Blenny
x
429 Gobiidae
Drombus key (Smith, 1947)
x
x
430 Gobiidae
Drombus sp.1
x
431 Gobiidae
Drombus triangularis (Weber, 1909)
x
432 Gobiidae
Eviota prasina
x
433 Gobiidae
Eviota qreenslandica
x
434 Gobiidae
Glossogobius bicirrbosus (Weber, 1894)
x
435 Gobiidae
Glossogobius biocellatus (Valenciennes, 1837)
x
x
436 Gobiidae
Glossogobius circumspectus (Macleay, 1883)
x
437 Gobiidae
Glossogobius giuris (Hamilton, 1822)
Flathead goby
x
x
438 Gobiidae
Glossogobius sp. Goby
x
439 Gobiidae
Gobiodon citrinus
Acroporal x
x
440 Gobiidae
Gobiodon micropus
x
441 Gobiidae
Gobiodon quinquestrigatus
x
442 Gobiidae
Gobiopsis aporia
x
443 Gobiidae
Gobiopsis macrostoma Steindachner, 1861
x
444 Gobiidae
Gobiopsis quinquecincta
x
445 Gobiidae
Gobiopsis woodsi
x
446 Gobiidae
Gobiopterus brachypterus (Bleeker, 1855)
x
447 Gobiidae
Gobiopterus panayensis (Herre, 1944)
x
448 Gobiidae
Gobiopterus sp.1
x
449 Gobiidae
Istigobius ornatus(Ruppell, 1830)
Ornate goby
x
450 Gobiidae
Mahidolia mystacina
x
451 Gobiidae
Mangarinus sp.1
x
452 Gobiidae
Mangarinus waterousi Herre, 1943
x
453 Gobiidae
Mugilogobius rambaiae
x
454 Gobiidae
Mugilogobius sp.1
x
455 Gobiidae
Oxyurichthys microlepis (Bleeker, 1849)
Smallscale goby
x
x
456 Gobiidae
Oxyurichthys tentacularis (Valenciennes, 1837)
Eyebrow goby
x
457 Gobiidae
Pandaka lidwilli (McCulloch, 1917)
x
458 Gobiidae
Papillogobius cf punctatus Gill & Miller,1990
x
459 Gobiidae
Papillogobius reichei (Bleeker, 1853)
x
460 Gobiidae
Parachaeturichthys polynema (Bleeker,1853) Eyetail
goby
x
461 Gobiidae
Periophthalmus argentilineatus Valenciennes,
x
1837
462 Gobiidae
Periophthalmus barbarus
Atlantic Mudskipper
x
463 Gobiidae
Periophthalmus cantonensis
Mud Skipper
x
464 Gobiidae
Periophthalmus chrysospilos Bleeker, 1852
x
465 Gobiidae
Periophthalmus minutus Eggert, 1935
x
466 Gobiidae
Periophthalmus sp. Mud
Skipper
x
467 Gobiidae
Priolepis nuchifasciatus
x
468 Gobiidae
Priolepis semidoliatus
x
469 Gobiidae
Redigobius bikolanus Herre, 1927
x
470 Gobiidae
Redigobius chrysosoma (Bleeker, 1875)
x
471 Gobiidae
Rhinogobius baliuroides
x
472 Gobiidae
Rhinogobius sp. Goby
x
473 Gobiidae
Scartelaos cantoris (Day, 1871)
x
x
474 Gobiidae
Scartelaos histophorus (Valenciennes, 1837)
x
475 Gobiidae
Stigmatogobius javanicus
Goby x
476 Gobiidae
Stigmatogobius oligactis
Goby x
477 Gobiidae
Stigmatogobius sadanundio (Hamiton, 1822)
Spot goby
x
Reversing Environmental Degradation Trends in the South China Sea and Gulf of Thailand
NATIONAL REPORT ON FISHERIES THAILAND
APPENDIX 3 PAGE 8
Appendix 3 cont.
Fishes found in habitats of the Gulf of Thailand.
No.
Family
Scientific name
Common name
WL CR MG SG
478 Gobiidae
Taenioides cirratus (Blyth, 1860)
Yellow tapering goby
x
479 Gobiidae
Trypauchen microcephalus Bleeker, 1860
x
480 Gobiidae
Trypauchen vagina
Pink Burrowing Goby
x
481 Gobiidae
Valenciennea linicola
x
482 Gobiidae
Valenciennea muralis (Valenciennes,1837)
x
x
483 Gobiidae
Valenciennea puellaris
x
484 Gobiidae
Valenciennea sexguttata
x
485 Gobiidae
Valenciennea wardii
x
486 Gobiidae
Yongeichthys nebulosus(Forsskal, 1775)
x
x
487 Grammistidae
Diploprion bifasciatum(kuhl & van Hasselt, 1928)
Yellow emperor
x
x
488 Gyrinocheilidae
Gyrinocheilus aymonieri
Siamese Gyrinochellid
x
489 Haemulidae
Diagramma pictum (Thunberg, 1792)
Painted sweetlip
x
x
490 Haemulidae
Plectorhinchus albovittatus Ruppell, 1838
Giant sweetlips
x
491 Haemulidae
Plectorhinchus chaetodonoides Lacepede, 1801
Harlequin Sweetlip
x
x
492 Haemulidae
Plectorhinchus unicolor
x
493 Haemulidae
Plectorhynchus gibbosus (Lacepede, 1802)
Harry hotlips
x
x
x
494 Haemulidae
Plectorhynchus orientalis
Oriental Sweetlip
x
495 Haemulidae
Plectorhynchus picus (Tortonese, 1936)
Spotted Sweetlip
x
496 Haemulidae
Pomadasys kaakan (Cuvier, 1830)
Javelin grunter
x
x
497 Hemiramphidae Hemiramphus dispar
Wrestling Halfbeak
x
498 Hemiramphidae Hemiramphus far (Forsskal, 1775)
Spotted halfbeak
x
x
499 Hemiramphidae Hemiramphus gaimardi
Gaimardi's Halfbeak
x
500 Hemiramphidae Hemiramphus melanurus
Black-tailed Halfbeak
x
501 Hemiramphidae Hyporamphus limbatus (Valenciennes, 1846)
x
x
502 Hemiramphidae Hyporhamphus dussumieri (Valenciennes, 1846)
x
x
503 Hemiramphidae Zenarchopterus disper (Valenciennes, 1847)
x
x
504 Hemiramphidae Zenarchopterus kampei
Sepile River Halfbeak
x
505 Hemiramphidae Dermogenys pusillus
Wrestling Half-beak
x
506 Hemiscylliidae
Chiloscyllium griseum Muller & Henle, 1839
Grey bambooshark
x
507 Hemiscylliidae
Chiloscyllium indicum (Gmelin, 1789)
Slender Bambooshark
x
508 Hemiscylliidae
Chiloscyllium plagiosum (Bennett, 1830)
Whitespot Bambooshark
x
509 Hemiscylliidae
Chiloscyllium punctatumMuller & Henle, 1818
Brown-band catshark
x
510 Heteropneustidae Heteropneustes fossilis
Scrobranch Catfish
x
511 Holocentridae
Myripristis botche
x
512 Holocentridae
Myripristis hexagona
x
513 Holocentridae
Myripristis murdjan
x
514 Holocentridae
Myripristis violaceus
Lattice Soldierfish
x
x
515 Holocentridae
Sagocentrom rubrum
Redcoat x
516 Holocentridae
Sargocentron rubrum
x
517 Kyphosidae
Kyphosus cinerascens
x
518 Kyphosidae
Kyphosus vaigiensis
x
519 Labridae
Anampses caeruleopunctatus
x
520 Labridae
Cheilinus chlorourus
x
521 Labridae
Cheilinus fasciatus
Scarlet-breasted Wrasse
x
x
522 Labridae
Cheilinus trilobatus
Triple-tailed Wrasse
x
x
523 Labridae
Choeredon sp. Tuskfish
x
524 Labridae
Choerodon anchorago(Bloch, 1791)
Orange-dotted tuskfish
x
525 Labridae
Choerodon schoenleinii
x
526 Labridae
Diproctacanthus xanthurus
x
527 Labridae
Epibulus insidiator
Slingjaw Wrasse
x
x
528 Labridae
Halichoeres argus
x
529 Labridae
Halichoeres bicolor (Bloch & Schneider, 1801)
x
x
530 Labridae
Halichoeres chlropterus
Green Spot Wrasse
x
x
531 Labridae
Halichoeres dussumieri (Valenciennes,
1839)
x
532 Labridae
Halichoeres hoeveni
Three Eye Wrasse
x
533 Labridae
Halichoeres hortulanus
x
534 Labridae
Halichoeres margaritaceus
x
535 Labridae
Halichoeres marginatus
Speckle Rainbow Wrasse
x
x
536 Labridae
Halichoeres melanurus
x
537 Labridae
Halichoeres nebulosus
x
538 Labridae
Halichoeres nigrescens
Dusky Rainbow Wrasse
x
x
539 Labridae
Halichoeres poecilopterus
Blackline Wrasse
x
540 Labridae
Halichoeres purpurascens
x
541 Labridae
Hemigymnus fasciatus
Barred Thicklip Wrasse
x
x
542 Labridae
Hemigymnus melapterus
Blackeye Thicklip Wrasse
x
x
543 Labridae
Labroides dimidiatus(Valenciennes, 1839)
Bluestreak Wrasse
x
x
544 Labridae
Oxychelinus digrammus
x
545 Labridae
Stethojulis bandanensis
x
546 Labridae
Stethojulis interrupta
x
547 Labridae
Stethojulis sp.
x
Reversing Environmental Degradation Trends in the South China Sea and Gulf of Thailand
NATIONAL REPORT ON FISHERIES THAILAND
APPENDIX 3 PAGE 9
Appendix 3 cont.
Fishes found in habitats of the Gulf of Thailand.
No.
Family
Scientific name
Common name
WL CR MG SG
548 Labridae
Stethojulis strigiventer (Bennett, 1832)
Silver ribbon rainbow
x
549 Labridae
Stethojulis trilineata
x
550 Labridae
Thalassoma lunare
Crescent Grunter
x
x
551 Leiognathidae
Gazza minuta (Bloch, 1797)
Toothed ponyfish
x
x
x
552 Leiognathidae
Leiognathus bindus (Valenciennes, 1835)
Orangefin slipmouth
x
553 Leiognathidae
Leiognathus brevirostis
Shortnose Slipmouth
x
554 Leiognathidae
Leiognathus daura (Cuvier, 1829)
Goldstripe slipmouth
x
555 Leiognathidae
Leiognathus decorus (De Vis, 1844)
x
x
556 Leiognathidae
Leiognathus equula (Forsskal, 1775)
Common slipmouth
x
x
x
557 Leiognathidae
Leiognathus fasciatus
Striped Slipmouth
x
558 Leiognathidae
Leiognathus insidiator
Pugnose Pongfish
x
559 Leiognathidae
Leiognathus leuciscus (Gunther, 1860)
Whipfin slipmouth
x
560 Leiognathidae
Leiognathus lineolatus
Line Slipmouth
x
561 Leiognathidae
Leiognathus oblongus (Valenciennes, 1835)
x
562 Leiognathidae
Leiognathus pan (Wongratana, 1988)
x
563 Leiognathidae
Leiognathus smithursti (Ramsay & Ogilby, 1886)
Smithurst's slipmouth
x
564 Leiognathidae
Leiognathus splendens (Cuvier, 1829)
Splendid slipmouth
x
x
565 Leiognathidae
Leiognathus stercorarius (Everman & Seale, 1907)
x
x
566 Leiognathidae
Secutor insidiator (Bloch, 1787)
Slender slipmouth
x
x
567 Leiognathidae
Secutor ruconius (Hamilton, 1822)
Deeppug nose slipmouth
x
x
568 Lethrinidae
Gymnocraniius grandoculis
x
569 Lethrinidae
Lethrinus erythropterus
x
570 Lethrinidae
Lethrinus lentjan (Lacepede, 1802)
Redspot emperor
x
x
x
571 Lethrinidae
Lethrinus mebulosus
Spangled Emperor
x
572 Lethrinidae
Lethrinus ornatus (Balenciennes, 1830)
Ornate emperor
x
x
573 Lethrinidae
Lethrinus sp.
x
574 Lobotidae
Lobotes surinamensis (Bloch, 1790)
Browm tripletail
x
x
575 Lutjanidae
Lutjanas argentimaculatus
Mangrove Redsnapper
x
576 Lutjanidae
Lutjanas carponotatus
x
577 Lutjanidae
Lutjanas decussatus
Crossband Snapper
x
578 Lutjanidae
Lutjanas vaigiensis
x
579 Lutjanidae
Lutjanus argentimaculatus (Forsskal, 1775)
Mangrove red snapper
x
x
580 Lutjanidae
Lutjanus biguttatus (Valenciennes, 1775)
Twospot banded snapper
x
581 Lutjanidae
Lutjanus bohar
x
582 Lutjanidae
Lutjanus carponotatus
x
583 Lutjanidae
Lutjanus decussatus
x
584 Lutjanidae
Lutjanus erythropterus
x
585 Lutjanidae
Lutjanus fulviflamma (Forsskal, 1775)
Blackspot snapper
x
x
x
586 Lutjanidae
Lutjanus johnii (Bloch, 1792)
John's snapper
x
x
x
x
587 Lutjanidae
Lutjanus kasmira
x
588 Lutjanidae
Lutjanus lemniscatus
x
589 Lutjanidae
Lutjanus lunulatus
Lunartail Snapper
x
590 Lutjanidae
Lutjanus lutjanus
Bigeye snapper
x
x
x
591 Lutjanidae
Lutjanus madras (Valenciennes, 1831)
x
592 Lutjanidae
Lutjanus monostigmus
One spot Snapper
x
x
593 Lutjanidae
Lutjanus quinquelineatus
x
594 Lutjanidae
Lutjanus russelli (Bleeker, 1849)
Russell's snapper
x
x
x
x
595 Lutjanidae
Lutjanus sebae
Emperor Redsnapper
x
x
596 Lutjanidae
Lutjanus timorensis
x
597 Lutjanidae
Lutjanus vitta
x
598 Lutjanidae
Lutjanus vittus
Brownstripe Snapper
x
599 Lutjanidae
Symphorus nematophorus (Bleeker,1860)
Chinamanfish
x
600 Mastacembelidae Macrognathus aculeatus
Siamensis Lesser Spiny
x
Eel
601 Mastacembelidae Macrognathus circumcinctus
Lesser Spiny Eel
x
602 Mastacembelidae Macrognathus siamensis
Spotted Spiny Eel
x
603 Mastacembelidae Mastacembelus armatus
Armed Spiny Eel
x
604 Mastacembelidae Mastacembelus favus
Spiny Eel
x
605 Mastacembelidae Mastacembelus sp.
x
606 Megalopidae
Megalops cyprinoides (Broussonet, 1782)
Indo-Pacific tarpon
x
x
607 Microdesmidae
Parioglossus formosus
x
608 Microdesmidae
Parioglossus philippinus
x
609 Microdesmidae
Parioglossus sp.
x
610 Microdesnidae
Ptereleotris microlepis
x
611 Microdesnidae
Ptereleotris monoptera
x
612 Microdesnidae
Ptereleotris sp.
x
613 Monacanthidae
Aluterus monoceros(Linnaeus, 1758)
Unicorn leatherjacket
x
614 Monacanthidae
Monacanthus chinensis (Osbeck, 1765)
Chinese leatherjacket
x
x
x
x
615 Monacanthidae
Paramonacanthus choirocephalus (Bleeker, 1852)
x
x
x
616 Monacanthidae
Pseudomonacanthus macrurus (Bleeker, 1857)
x
Reversing Environmental Degradation Trends in the South China Sea and Gulf of Thailand
NATIONAL REPORT ON FISHERIES THAILAND
APPENDIX 3 PAGE 10
Appendix 3 cont.
Fishes found in habitats of the Gulf of Thailand.
No.
Family
Scientific name
Common name
WL CR MG SG
617 Monodactylidae
Monodactylus argenteus (Linnaeus, 1758)
Butter fish
x
x
x
618 Mugilidae
Atherina valenciennesi
Sumatran Silverside
x
619 Mugilidae
Moolgarda cunnesius (Valenciennes, 1836)
x
x
620 Mugilidae
Moolgarda engeli (Bleeker, 1858)
x
621 Mugilidae
Moolgarda pedaraki (Valenciennes, 1836)
x
x
x
622 Mugilidae
Moolgarda seheli
x
623 Mugilidae
Mugil borneenis
Largescale Mullet
x
624 Mugilidae
Mugil dussumieri
Greenback Mullet
x
625 Mugilidae
Mugil kelaartii
Longarm Mullet
x
626 Mugilidae
Mugil seheli
Bluespot Mullet
x
627 Mugilidae
Mugil sp. Mullet
x
628 Mugilidae
Mugil subviridis
Greenback Mullet
x
629 Mugilidae
Mugil tado
Tade Mullet
x
630 Mugilidae
Mugil vaigiensis
Squaretail Mullet
x
631 Mugilidae
Oedalechilus labiosus
x
632 Mugillidae
Chelon macrolepis (Smith, 1849)
x
633 Mugillidae
Chelon parmata (Cantor, 1849)
x
634 Mugillidae
Chelon parsia (Hamilton, 1822)
x
635 Mugillidae
Chelon spp.
x
636 Mugillidae
Chelon subviridis (Valenciennes, 1836)
x
x
637 Mugillidae
Ellochelon vaigiensis (Quoy & Gaimard)
x x x
638 Mullidae
Mulloidichthys flavolineatus (Lacepede, 1802)
Slender goatfish
x
639 Mullidae
Mulloidichthys sp. Goatfish
x
640 Mullidae
Parupeneus heptacanthus (Lacepede,1801)
x
641 Mullidae
Parupeneus indicus (Shaw,1803) Indian
goatfiah
x
x
642 Mullidae
Upeneus sp. Goatfish
x
643 Mullidae
Upeneus sulphureus Cuvier, 1829
Yellow goatfish
x
x
x
644 Mullidae
Upeneus sundaicus (Bleeker, 1855)
Ochreband goatfish
x
645 Mullidae
Upeneus tragula (Richarson, 1846)
Freckled goatfish
x
646 Mullidae
Upeneus tragula Richardson, 1846
Freckle goatfish
x
x
x
647 Muraenidae
Congresox talabon(Cuvier, 1829)
Yellow Pike-conger
x
648 Muraenidae
Gymnothorax boschii (Bleeker, 1853)
x
649 Muraenidae
Gymnothorax sp.
x
650 Muraenidae
Gymnothorax undulatus
x
651 Muraenidae
Siderea delicatula
x
652 Muraenidae
Siderea thyrsoidea
x
653 Myliobatidae
Aetobatus narinari(Euphrasen, 1790)
Spooted eagle ray
x
654 Nandidae
Badis badis
Badis x
655 Nandidae
Nandus nandus
Gangetic Leaffish
x
656 Nandidae
Nandus nebulosus
Bornean Leaffish
x
657 Nandidae
Pristolepis fasciatus
Striped Tiger Nandid
x
658 Nemipteridae
Nemipterus hexodon
x
659 Nemipteridae
Nemipterus peronii (Valenciennes, 1830)
Rosy threadfin bream
x
660 Nemipteridae
Pentapodus setosus
Blue Banded Whip Tail
x
x
661 Nemipteridae
Scolopsis bilineatus (Bloch, 1793)
Twolined monoclebream
x
x
x
662 Nemipteridae
Scolopsis ciliatus (Lacepede, 1802)
Sawjawed monoclebream
x
x
x
x
663 Nemipteridae
Scolopsis dubiosus
Yellowstreak
x
Monoclebream
664 Nemipteridae
Scolopsis lineatus
x
665 Nemipteridae
Scolopsis margaritifer
x
666 Nemipteridae
Scolopsis monogramma (Kuhl & van Hasselt,
Monogrammed
x x
1830)
monoclebream
667 Nemipteridae
Scolopsis sp. Threadfin
Bream
x
668 Nemipteridae
Scolopsis taeniopterus (Valenciennes, 1830)
Lattice monoclebream
x
x
669 Nemipteridae
Scolopsis vasmeri
x
670 Notopteridae
Chitala blanci
Blanc'a Atriped Feather
x
671 Notopteridae
Chitala lopis
Indonesian Featherback
x
672 Notopteridae
Chitala ornata
Spotted Featherback
x
673 Notopteridae
Notopterus notopterus
Grey Featherback
x
674 Ophichthidae
Pisodonophis sp. Snake
Eel
x
675 Ophichthidae
Pisoodonophis cancrivorus (Richardson, 1844)
x
676 Ophidiidae
Dinematichthys ilucoeteoides
Yellow Brotula
x
x
677 Oryziidae
Oryzias javanicus(Bleeker, 1854)
x
678 Oryziidae
Oryzias minutillus
Dwarf Medaka
x
679 Oryziidae
Oryzias sp.
Ricefish
x
680 Osteoglossidae
Scleropages formosus
Asian Bonytongue
x
681 Ostraciidae
Ostracion cubicusLinnaeus, 1758
x
x
682 Ostraciidae
Ostracion nasus
x
683 Ostracoiidae
Lactoria cornuta (Linnaeus, 1758)
Longhorned cowfish
x
x
x
x
684 Ostracoiidae
Lactoria diaphana (Bloch, 1785)
x
Reversing Environmental Degradation Trends in the South China Sea and Gulf of Thailand
NATIONAL REPORT ON FISHERIES THAILAND
APPENDIX 3 PAGE 11
Appendix 3 cont.
Fishes found in habitats of the Gulf of Thailand.
No.
Family
Scientific name
Common name
WL CR MG SG
685 Ostracoiidae
Rhynchostracion nasus
Small-nosed Boxfish
x
686 Pangasiidae
Pangasius larnaudii
Black Ear Catfish
x
687 Pangasiidae
Pangasius nasutus
x
688 Pangasiidae
Pangasius pangasius
Pangas Catfish
x
689 Pangasiidae
Pangasius polyuranodon
x
690 Pangasiidae
Pangasius sanitwongsei
Chao Phraya Gian Catfish
x
691 Pangasiidae
Pangasius sutchi
Striped Catfish
x
692 Pangasiidae
Pterois miles (Bennett,
1828)
x
693 Pangasiidae
Pteropangasius cultratus
x
694 Pangasiidae
Pteropangasius micronema
x
695 Pangasiidae
Pteropangasius pleurotaenis
Shark Catfish
x
696 Pempheridae
Pempheris adusta
x
697 Pempheridae
Pempheris moluca
x
698 Pempheridae
Pempheris oualensis
Catalufa Sweeper
x
x
699 Pempheridae
Pempheris sp. Sweeper
x
700 Pinguipededae
Parapercis alboguttata (Gunther, 1872)
Grubfish
x
701 Pinguipededae
Parapercis cf. kamoharai
x
702 Pinguipededae
Parapercis sp.
x
703 Pinguipededae
Parapercis xanthozona
x
704 Platycephalidae Cociella crocodila (Tilesius, 1812)
Crocodile flathead
x
705 Platycephalidae
Grammoplites scaber (Linnaeus, 1758)
Thorntyscales
x
706 Platycephalidae
Hoplichthys sp.
Ghost Flathead
x
707 Platycephalidae
Inegocia japonica (Tilesius, 1812)
x
x
708 Platycephalidae
Inegocia sp.
Flathead
x
709 Platycephalidae
Platycephalus indicus (Linnaeus, 1758)
Bartail flathead
x
x
x
710 Platycephalidae
Platycephalus scabar
Round Flathead
x
711 Platycephalidae
Platycephalus spp. Flathead
x
712 Platycephalidae
Thysanophrys carbunculus (Valenciennes, 1833)
Carbuncle flathead
x
x
713 Plectorhynchidae Gaterin diagrammus
Silver-banded Sweetlip
x
714 Plesiopidae
Plesiops coeruleolineatus
x
715 Plotosidae
Plotosus canius Hamilton, 1822
Lagoon eel catfish
x
x
716 Plotosidae
Plotosus lineatus (Thunberg, 1791)
Striped Eel Catfish
x
x
x
717 Polynemidae
Eleutheronema tetradactylum (Shaw, 1804)
Fourfinger threadfin
x
x
718 Polynemidae
Polydactylus microstoma (Bleeker, 1851)
x
719 Polynemidae
Polydactylus plebeius (Broussonet, 1782)
x
720 Polynemidae
Polynemus longipectoralis
Threadfin Bream
x
721 Polynemidae
Polynemus paradiseus
Paradise Threadfin
x
722 Polynemidae
Polynemus tetradactylus
Threadfin, Tessel Fish
x
723 Pomacanthidae
Pygoplites diacanthus
Roysl Anglefish
x
x
724 Pomacentridae
Abudefduf bengalensis (Bloch, 1787)
Sergeant Major
x
x
725 Pomacentridae
Abudefduf coelestinus
Black-banded
x
Demerselfish
726 Pomacentridae
Abudefduf notatus (Day, 1869)
x
727 Pomacentridae
Abudefduf septemfasciatus (Cuvier 1830)
x
728 Pomacentridae
Abudefduf sexfasciatus Lacepede, 1802
x
729 Pomacentridae
Abudefduf sordidus Forsskal, 1775
Blackspot sergeant major
x
730 Pomacentridae
Abudefduf vaigensis (Quoy & Gaimard, 1825)
Fivebar Sergeant
x
x
731 Pomacentridae
Amblyglyphidodon curacao (Bloch, 1787)
Blacknout Chromis
x
x
732 Pomacentridae
Amblyglyphidodon leucogaster (Bleeker, 1847)
x
733 Pomacentridae
Amphiprion clarkii (Bennett, 1830)
Whitetip anemone
x
734 Pomacentridae
Amphiprion perideraion Bleeker, 1855
Whiteline Anemone
x
x
735 Pomacentridae
Amphiprion polymnus (Linnaeus, 1758)
Saddleband Anemone
x
x
736 Pomacentridae
Amphiprion sebae Bleeker,
1853
x
737 Pomacentridae
Chromis atripectoralis Welander and Schultz, 1951
x
738 Pomacentridae
Chromis cinerascens (Cuvier, 1830)
x
739 Pomacentridae
Chromis fumea (Tanaka, 1917)
x
740 Pomacentridae
Chromis sp. Damselfish
x
x
741 Pomacentridae
Chromis viridis (Cuvier, 1830)
x
742 Pomacentridae
Chrysiptera biocellata
x
743 Pomacentridae
Chrysiptera hemicyanea
x
744 Pomacentridae
Chrysiptera leucopoma
x
745 Pomacentridae
Chrysiptera unimaculata
x
746 Pomacentridae
Dascyllus aruamus
Band Puller
x
747 Pomacentridae
Dascyllus reticulatus
x
748 Pomacentridae
Dascyllus trimaculatus
Whitespot Puller
x
x
749 Pomacentridae
Dischistodus melanotus
x
750 Pomacentridae
Hemiplyphidodon plagiometopon
x
751 Pomacentridae
Neoglyphidodon melas
x
752 Pomacentridae
Neoglyphidodon nigroris
x
753 Pomacentridae
Neopomacentrus anabatoides
x
Reversing Environmental Degradation Trends in the South China Sea and Gulf of Thailand
NATIONAL REPORT ON FISHERIES THAILAND
APPENDIX 3 PAGE 12
Appendix 3 cont.
Fishes found in habitats of the Gulf of Thailand.
No.
Family
Scientific name
Common name
WL CR MG SG
754 Pomacentridae
Neopomacentrus azysron
x
755 Pomacentridae
Neopomacentrus bankieri
x
756 Pomacentridae
Neopomacentrus cyanomua
Violet Damsel
x
x
757 Pomacentridae
Neopomacentrus filamentosus
x
758 Pomacentridae
Neopomacentrus nemurus
x
759 Pomacentridae
Neopomacentrus taeniurus
x
760 Pomacentridae
Paraglyphidodon melas
Zulu Damselfish
x
761 Pomacentridae
Paraglyphidodon nigroris
Black damsel
x
762 Pomacentridae
Plectroglyphidodon lacrymatus
Whitespotted Devil
x
x
763 Pomacentridae
Plectroglyphidodon leucozonus
x
764 Pomacentridae
Pomacentrus albimaculus
x
765 Pomacentridae
Pomacentrus alexanderea
x
766 Pomacentridae
Pomacentrus amboinensis
x
767 Pomacentridae
Pomacentrus chrysurus
x
768 Pomacentridae
Pomacentrus coelestis
Yellow-tailed Damselfish
x
x
769 Pomacentridae
Pomacentrus cuneatus
x
770 Pomacentridae
Pomacentrus hardi
Damselfish x
771 Pomacentridae
Pomacentrus littoralis
x
772 Pomacentridae
Pomacentrus moluccensis
Yellow Damselfish
x
x
773 Pomacentridae
Pomacentrus philippinus
x
774 Pomacentridae
Pomacentrus rhodonotus
Whitetail Damsel
x
775 Pomacentridae
Pomacentrus sp.
x
776 Pomacentridae
Pomacentrus tripunctatus
x
777 Pomacentridae
Stegaster apicalis
Australian Gregory
x
778 Pomacentridae
Stegastes fasciolatus
x
779 Pomacentridae
Stegastes nigricans
x
780 Pomacentridae
Stegastes obreptus
x
781 Pomadasyidae
Pomadasys argyreus (Valenciennes, 1833)
Silver grunt
x
x
782 Pomadasyidae
Pomadasys hasta
Silver Spotted Grunt
x
783 Pomadasyidae
Pomadasys maculatus (Bloch, 1797)
Saddle grunt
x
x
x
784 Pomadasyidae
Pomadasys sp.
x
785 Pristigasteridae
Ilisha kampeni (Weber & Beaufort, 1913)
x
x
786 Pristigasteridae
Ilisha megaloptera (Swainson, 1839)
Bigeye ilisha
x
787 Pristigasteridae
Ilisha melastoma (Schneider, 1801)
Indian ilisha
x
788 Pristigasteridae
Opisthopterus tardoore (Cuvier, 1829)
Tardoors
x
789 Pristigasteridae
Pellona ditchela (Valenciennes, 1847)
Indian pellona
x
790 Pristigasteridae
Pellona sp. Herring
x
791 Pseodochromidae Congrogadus subducens
x
792 Psettodidae
Psettodes erumei (Schnerder, 1801)
Indian halibut
x
793 Psettodidae
Pseudochromis xanthochir
x
794 Rachycentridae
Rachycentron canadum (Linnaeus, 1766)
Kingfish, Cobia
x
x
795 Scaridae
Chlorurus sordidus
x
796 Scaridae
Scarus frenatus
x
797 Scaridae
Scarus ghobban Forsskal, 1775
Yellow-scale parrot
x
x
x
798 Scaridae
Scarus niger
x
799 Scaridae
Scarus prasiognathos
x
800 Scaridae
Scarus rivulatus
Rivulated Parrot Fish
x
x
801 Scaridae
Scarus rubroviolaceus
x
802 Scaridae
Scarus sp. Parrotfish
x
x
803 Scatophagidae
Scatophagus argus (Linnaeus, 1758)
Spade fish, Spotted butter
x
x
804 Schibeidae
Eutropiichthys vacha
Schilbid Catfish
x
805 Schibeidae
Laides hexanema
Catfish x
806 Schibeidae
Platytropius siamensis
x
807 Sciaenidae
Boesemanis microlepis
Boeseman Coaker
x
808 Sciaenidae
Dendrophysa russelli (Cuvier, 1830)
Goatee croaker
x
x
809 Sciaenidae
Johnius belangerii (Cuvier, 1830)
Belanger's croaker
x
x
810 Sciaenidae
Johnius spp. Croaker
x
811 Sciaenidae
Johnius trachycephalus
Leaftail Croaker
x
812 Sciaenidae
Nibea soldado (Lacepede, 1802)
Soldier Croaker
x
x
813 Sciaenidae
Otolithes aeneocorpus
Slender Croker
x
814 Sciaenidae
Otolithes cuvieri (Trewavas, 1974)
Lessertigertooth croaker
x
815 Sciaenidae
Otolithes ruber
Tigertooth Croaker
x
816 Sciaenidae
Pennahia anea (Bloch, 1773)
x
817 Sciaenidae
Pseudosciana soldado
White Soldier Croaker
x
818 Sciaenidae
Pseudoscians sp. Croaker
x
819 Sciaenidae
Sciaena russelli
Russell's Jew Fish
x
820 Sciaenidae
Sciaena sp.
x
821 Scombridae
Rastrelliger feaughni
Faughn's Mackerel
x
822 Scombridae
Rastrelliger kanagurta (Cuvier, 1816)
Indian mackerel
x
x
823 Scombridae
Rastrelliger neglectus /brachysoma
Indo-Pacific Mackerel
x
Reversing Environmental Degradation Trends in the South China Sea and Gulf of Thailand
NATIONAL REPORT ON FISHERIES THAILAND
APPENDIX 3 PAGE 13
Appendix 3 cont.
Fishes found in habitats of the Gulf of Thailand.
No.
Family
Scientific name
Common name
WL CR MG SG
824 Scombridae
Scomberomorus commerson (Lacepede, 1800)
Narrow-barred Spanish
x x x
mackerel
825 Scorpaenidae
Parascorpaena picta
x
826 Scorpaenidae
Pterogobius sp.
x
827 Scorpaenidae
Scorpaenopsis cirrhosa
x
828 Scorpaenidae
Scorpaenopsis diabolus
x
829 Scorpaenidae
Scorpaenopsis venosa
x
830 Scorpaenidae
Trachicephalus uranoscopus (Bloch & Schneider,
x
1801)
831 Scorpaenidae
Vespicula trachinoides (Cuvier & Valenciennes,
Globinfish
x
x
1829)
832 Serranidae
Aethaloperca rogaa (Forsskal, 1775)
Redmouth grouper
x
833 Serranidae
Anyperodon leucogrammicus(Valenciennes, 1828) Slender grouper
x
834 Serranidae
Cephalopholis argusBloch&Schneider, 1801
Peacock grouper
x
x
835 Serranidae
Cephalopholis boenackBloch, 1790
Chocolate hind
x
x
836 Serranidae
Cephalopholis cyanostigma
x
837 Serranidae
Cephalopholis microprion
x
838 Serranidae
Cephalopholis miniata(Forsskal, 1775)
Coral grouper
x
839 Serranidae
Cephalopholis pachycentron
Brown hind-banded
x
seabass
840 Serranidae
Cephalopholis sammana
Seabass x
841 Serranidae
Cephalophotis formosa(Shaw $ Nodder, 1812)
Bluelined hind
x
842 Serranidae
Cromileptes altivelis(Valencienes, 1828)
Polkadot grouper
x
843 Serranidae
Epinephelus areolatus
Areolated Grouper
x
x
844 Serranidae
Epinephelus bleekeri (Vaillant & Bocourt, 1877)
Duskytail grouper
x
x
x
x
845 Serranidae
Epinephelus brunneus(Bloch, 1793)
Mud grouper
x
846 Serranidae
Epinephelus caeruleopunctatus
White-spooted grouper
x
847 Serranidae
Epinephelus coioides (Hamilton, 1822)
Duskytail grouper
x
x
x
x
848 Serranidae
Epinephelus corallicola
x
849 Serranidae
Epinephelus epistictus(Temminch & Schlegel,
Broken-line grouper
x
1842)
850 Serranidae
Epinephelus erythrurus
x
851 Serranidae
Epinephelus erythrurus (Valenciennes, 1828)
x
852 Serranidae
Epinephelus fasciatus(Forsskal, 1775)
Black-tipped grouper
x
853 Serranidae
Epinephelus fuscoguttatus(Forsskal, 1775)
Brown-marbled grouper
x
854 Serranidae
Epinephelus heniochus
x
855 Serranidae
Epinephelus lanceolatus
x
856 Serranidae
Epinephelus latifasciatus
x
857 Serranidae
Epinephelus malabaricus(Bloch & Schneider,
Malabar grouper
x
1801)
858 Serranidae
Epinephelus merraBloch, 1793
Dwaft-spotted grouper
x
859 Serranidae
Epinephelus ongus(Bloch, 1790)
White-streaked grouper
x
860 Serranidae
Epinephelus quoyanus (Valenciennes, 1830)
Barred-chest grouper
x
x
861 Serranidae
Epinephelus sexfasciatus (Valenciennes, 1828)
Six-banded rockcod
x
x
x
862 Serranidae
Epinephelus sp.
x
x
863 Serranidae
Epinephelus tauvina(Forssakal, 1775)
Greasy grouper/Reef cod
x
864 Serranidae
Plectropomus leopardus
x
865 Serranidae
Plectropomus maculatus
Spot Coral Trout
x
x
866 Siganidae
Siganus canaliculatus (Park, 1797)
White-spotted Spinefoot
x
x
x
x
867 Siganidae
Siganus corallinus
x
868 Siganidae
Siganus fuscescens (Houttuyn,
1782)
x
869 Siganidae
Siganus guttatus (Bloch, 1787)
Golednlined spinefoot
x
x
x
870 Siganidae
Siganus javus (Linnaeus, 1766)
Streaked spinefoot
x
x
x
x
871 Siganidae
Siganus lineatus
x
872 Siganidae
Siganus punctatissimus
Peppered Spinefoot
x
873 Siganidae
Siganus punctatus
x
874 Siganidae
Siganus vermiculatus
x
875 Siganidae
Siganus virgatus
Doublebarred Spinefoot
x
x
876 Sillaginidae
Sillago aeolus (Jordan & Evermann, 1902)
x
x
x
877 Sillaginidae
Sillago lutea (McKay, 1985)
x
878 Sillaginidae
Sillago sihama (Forsskal, 1775)
Common whiting
x
x
x
879 Sillaginidae
Sillago sp.
x
880 Siluridae
Ceratoglanis scleronema
Sheatfish x
881 Siluridae
Kryptopterus apogon
Common Sheatfish
x
882 Siluridae
kryptopterus bleekeri
Whisker Sheatfish
x
883 Siluridae
Kryptopterus cryptopterus
Sheatfish x
884 Siluridae
Kryptopterus limpok
Whisker Sheatfish
x
885 Siluridae
kryptopterus sp.
x
886 Siluridae
Ompok bimaculatus
Butter Catfish
x
887 Siluridae
Ompok eugeneiatus
Sheatfish x
Reversing Environmental Degradation Trends in the South China Sea and Gulf of Thailand
NATIONAL REPORT ON FISHERIES THAILAND
APPENDIX 3 PAGE 14
Appendix 3 cont.
Fishes found in habitats of the Gulf of Thailand.
No.
Family
Scientific name
Common name
WL CR MG SG
888 Siluridae
Ompok hypophthalmus
Sheatfish x
889 Siluridae
Silurus cochinchinensis
x
890 Siluridae
Wallago dinema
x
891 Siluridae
Wallago leerii
x
892 Siluridae
Wallagonia attu
Great White Sheatfish
x
893 Sisoridae
Bagarius bagarius
Sisorid Catfish
x
894 Sisoridae
Bagarius yarrelli
Giant Bagarius
x
895 Sisoridae
Bagroides macropterus
Catfish x
896 Sisoridae
Glyptothorax fuscus
Catfish x
897 Sisoridae
Glyptothorax lampris
Catfish x
898 Sisoridae
Glyptothorax sp.
Catfish
x
899 Sisoridae
Glyptothorax trilineatus
Catfish x
900 Sisoridae
Oreoglanis siamensis
Freshwater Batfish
x
901 Soleidae
Pardachirus pavoninus (Lacepede, 1802)
Broad sole
x
x
902 Soleidae
Solea ovata Richardson, 1849
Ovate sole
x
903 Soleidae
Zebrias quagga Kaup, 1858
Fringefin zebra sole
x
904 Sparidae
Acanthopagrus berda (Forsskal,1775) Picnic
seabream
x
905 Sphyraenidae
Sphyraena baracuda (Walbaum, 1792)
Great barracuda
x
x
906 Sphyraenidae
Sphyraena forsteri
x
907 Sphyraenidae
Sphyraena jello (cuvier, 1829)
Pickhandle barracuda
x
x
x
908 Sphyraenidae
Sphyraena obtusata (cuvier, 1829)
Striped barracuda
x
x
x
909 Sphyraenidae
Sphyraena qenie (Klunzinger, 1870)
x
x
910 Sphyraenidae
Sphyraena sp.
x
x
911 Sphyraenidae
Sphyrna blochii
Winghead Shark
x
912 Stromateidae
Pampus argenteus
Silver Pomfret
x
913 Stromateidae
Pampus chinensis
Chinese Pomfret
x
914 Stromateidae
Pampus sp.
x
915 Synbranchidae
Macrotrema caligans
x
916 Synbranchidae
Monopterus albus
Swamp Eel
x
917 Synbranchidae
Ophisternon bengalense
Onegilled Eel
x
918 Syngnathidae
Choeroichthys brachysoma
x
919 Syngnathidae
Corythoichthys amplexus
x
920 Syngnathidae
Cosmocampus investigatoris
x
921 Syngnathidae
Doryrhamphus excisus excisus
x
922 Syngnathidae
Doryrhamphus janssi
x
923 Syngnathidae
Halicampus grayi
x
924 Syngnathidae
Hippichthys cyanospilus (Bleeker, 1854)
x
925 Syngnathidae
Hippichthys heptagonus (Bleeker, 1853)
x
926 Syngnathidae
Hippichthys penicillus (Cantor, 1849)
x
927 Syngnathidae
Hippichthys spicifer (Ruppell, 1840)
x
928 Syngnathidae
Phoxocampus belcheri
x
929 Syngnathidae
Syngnathoides biaculeatus (Bloch, 1875)
x
930 Syngnathidae
Trachyrhamphus bicoarctatus (Bleeker, 1857)
x
931 Synodontidae
Saurida micropectoralis Shindo & Yamada, 1972
Shortpectoral fin
x
932 Synodontidae
Saurida nebulosa Valenciennes, 1849
x
x
933 Synodontidae
Synodus variegatus
x
934 Tachysuridae
Tachysurus sp.
x
935 Teraponidae
Pelates quadrilineatus (Bloch, 1797) or 1790 check Fourlined terapon
x
x
936 Teraponidae
Terapon farbua
x
937 Teraponidae
Terapon jarbua (Forsskal, 1775)
Crescent grunter
x
x
938 Teraponidae
Terapon puta Cuvier & Valenciennes, 1829
Smallscale terapon
x
x
939 Teraponidae
Terapon theraps Cuvier, 1829
Threelined terapon
x
x
x
940 Tetraodontidae
Arothron hispidus (Linnaeus, 1758)
Bristly puffer
x
941 Tetraodontidae
Arothron immaculatus (Bloch & Schneider, 1801)
Innaculate blowfish
x
x
x
942 Tetraodontidae
Arothron reticularis (Bloch & schneider, 1801)
Reticulated blowfish
x
943 Tetraodontidae
Arothron sp.
x
944 Tetraodontidae
Arothron stellatus(Bloch&Schneider, 1801)
Star puffer
x
x
945 Tetraodontidae
Lagocephalus lunaris (Bloch & Schneider, 1801)
Spotrugh back blowfish
x
946 Tetrodontidae
Chelonodon patoca (Hamilton, 1822)
Gangetic Blowfish
x
x
x
947 Tetrodontidae
Chelonodon sp. Puffer
x
948 Tetrodontidae
Sphoeroides lunaris
x
949 Tetrodontidae
Tetraodon fluviatilis
Green Pufferfish
x
950 Tetrodontidae
Tetraodon leiurus
Green Blowfish
x
951 Tetrodontidae
Tetraodon nigroviridis Proce, 1822
x
x
952 Tetrodontidae
Tetraodon sp.
x
953 Tetrodontidae
Tetraodon suvatti
Puffer x
954 Theraponidae
Therapon jarbua
Jabua Terapon
x
955 Toxotidae
Toxotes chatareus
Common Archer Fish
x
956 Toxotidae
Toxotes jaculatrix (Pallas, 1766)
Fourspined archer
x
x
957 Toxotidae
Toxotes microlepis
Fiveblotched Archer
x
Reversing Environmental Degradation Trends in the South China Sea and Gulf of Thailand
NATIONAL REPORT ON FISHERIES THAILAND
APPENDIX 3 PAGE 15
Appendix 3 cont.
Fishes found in habitats of the Gulf of Thailand.
No.
Family
Scientific name
Common name
WL CR MG SG
958 Triacanthidae
Triacanthus biaculeatus (Bloch, 1786)
Shortnosed tripodfish
x
x
x
959 Triacanthidae
Triacanthus bicoarctatus (Bleeker, 1757)
x
960 Trichiuridae
Trichiurus lepturus Linnaeus, 1758
Largehead hairtail
x
x
961 Tripterygiidae
Helcogramma obtusirostris
x
962 Tripterygiidae
Tripterygion bapturum
x
963 Tripterygiidae
Tripterygion fasciatum
x
964 Tripterygiidae
Tripterygion sp.
x
WL = Wetland
CR = Coral
MG = Mangrove
SG = Seagrass
Reversing Environmental Degradation Trends in the South China Sea and Gulf of Thailand
NATIONAL REPORT ON FISHERIES THAILAND
APPENDIX 4 PAGE 1
APPENDIX 4
The Organisational Structure of the Department of Fisheries (DOF)
Department of Fisheries
Director
of General
Deputy Director-General
(3)
Office of Fisheries
Technical Advisor (12)
Administration
Internal Auditing
Office of Inspector
Development Group
Group
General (7)
Office of Department
Fishery Technological
Inland Fisheries Research
Coastal Fisheries
Marine Fisheries Research
Fisheries Development
Fisheries Administration
Secretary
Development Division
and Development Bureau
Research and
and Development Bureau
and Technology Transfer
and Management
Dev
elopment Bureau
Bureau
Bureau
Personnel Division
Fishery Inspection and
Administrative
Administrative
Administrative
Administrative
Administrative
Quality Control Division
Research group
Research group
Research group
Research Group
Finance Division
Fisheries Research and
National Institut e of
Far Sea Marine Fisheries
Permission and
Inland Aquaculture
Development Technology
Coastal Aquaculture
and Technology
Fisheries Administrative
Research Institute
Transfer Group
Planning Division
Aquatic Animal Genetic
Development Institute
Section
Research and
Coastal Aqua
tic
Fisheries
Development Institute
Animal Health
Dissemination Section
Foreign Fisheries
Inland Aquatic Animal
Marine Fisheries Research
Fish Trade Inspection
Research Institute
Affairs Division
Health Research Institute
and Technology
Section
Development Institute
Coastal Aqua
tic
Bangkok Fisheries
Inland Fisheries
Fishery Information
Animal Feed
Section
Administrative Section
Technology Center
Inland Aquatic Animal
Research Institute
Marine Fisheries Research
Feed Research Institute
and Development Center
(5)
Royal Project Section
Inland Fisheries Control
Marine Shrimp Culture
Inland Fisheries
and Surveillance Center
Research Institute
Resources Research
(7)
and Development
Fishery Technology
Institute
Kung Krabaen Bay
Transfer Section
Marine Fisheries
Royal Deve
lopment
Administration and
Ornamental Aquatic
Study
Center
Management Division
Fishery Engineering
Animal and Aquatic Plant
Section
Research Institute
Pak Panang Basin
Marine Fisheries Control
Roy
al Fisheries
and Surveillance Center
Inland Fisheries
Dev
elopment Center
Fishery economics
(5)
Research and
Section
Development Center (31)
Coastal Fisheries
Research a
nd
Development Center
Fisheries Provincial
(13)
Office (75)
Reversing Environmental Degradation Trends in the South China Sea and Gulf of Thailand
NATIONAL REPORT ON FISHERIES THAILAND
APPENDIX 5 PAGE 1
APPENDIX 5
The Organisational Structure of the Department of Marine and Coastal Resources (DMCR)
Structure and Function
Department of Marine and Coastal
Resource
Office of Public Sector
Office of Law
Department Commission
Office of Secretarial
Division of Policy and Planning
Institute for Research and
Office of Mangrove
Office of Marine and Coastal
Development of Marine and
Conservation
Conservation and
Coastal Resources (Phuket
Enforcement
Marine Biological Center
(PMBC)
Regional Offices
Reversing Environmental Degradation Trends in the South China Sea and Gulf of Thailand


United Nations
UNEP/GEF South China Sea
Global Environment
Environment Programme
Project
Facility
NATIONAL REPORT
on
The Fish Stocks and Habitats of Regional, Global, and
Transboundary Significance
in the South China Sea
VIET NAM
Dr. Dao Manh Son
Focal Point for Fisheries
Research Institute for Marine Fisheries, Ministry of Fisheries
170 Le Lai Street, Haiphong City, Viet Nam
NATIONAL REPORT ON FISHERIES VIET NAM
Table of Contents
1. BACKGROUND ............................................................................................................................1
1.1 OVERVIEW OF THE FISHERIES SECTOR ....................................................................................1
1.1.1 Total catch of the coastal provinces ..........................................................................2
1.1.2 Fishing effort by gear .................................................................................................4
1.1.2.1 Trawl .............................................................................................................4
1.1.2.2 Purse seine...................................................................................................5
1.1.2.3 Line fisheries.................................................................................................6
1.1.2.4 Gill net...........................................................................................................7
1.1.2.5 Other fishing gears .......................................................................................7
1.1.3 Economic value of catch............................................................................................8
1.1.4 Importance of the fisheries sector in terms of employment and dependence...........9
1.1.4.1 Fishery labors ...............................................................................................9
1.1.4.2 Fisheries infrastructure ...............................................................................10
1.1.4.3 Marketing ....................................................................................................10
1.1.4.4 Processing and exporting of marine products ............................................11
1.1.4.5 Socio-economy of marine capture fisheries ...............................................11
2.
SPECIES OF REGIONAL, GLOBAL AND TRANSBOUNDARY SIGNIFICANCE ...................11
2.1 RANKING OF IMPORTANCE OF SPECIES ..................................................................................11
2.1.1 In terms of landings .................................................................................................12
2.1.2 In terms of local market value..................................................................................12
2.1.3 In terms of status (endangered, threatened, rare etc. IUCN criteria) ......................12
2.1.4 Food security ...........................................................................................................13
2.2 BIOLOGY AND ECOLOGY OF THE PRIORITY SPECIES ................................................................14
2.2.1 Large pelagic fishes.................................................................................................14
2.2.2 Small pelagic fishes .................................................................................................15
2.2.3 Demersal fish species..............................................................................................16
2.2.4 Commercially exploited invertebrates......................................................................17
3.
THREATS & CURRENT STATUS..............................................................................................17
3.1 STATUS OF THE FISHERY IN TERMS OF CPUE........................................................................17
3.2 STATUS OF THE FISH STOCKS BASED ON HISTORICAL REVIEW OF LANDINGS AND CPUE...........21
3.2.1 Fish Resources........................................................................................................21
3.2.1.1 Species Composition ..................................................................................21
3.2.1.2 Fish distribution...........................................................................................22
3.2.1.3 Standing stock and potential yield. .............................................................23
3.2.2 Shrimp resources.....................................................................................................23
3.2.2.1 Species composition...................................................................................23
3.2.2.2 Distribution and harvesting season ............................................................24
3.2.2.3 Shrimp stock and potential yield.................................................................25
3.2.3 Cephalopod..............................................................................................................26
3.2.3.1 Species composition...................................................................................26
3.2.3.2. Distribution and harvesting season ............................................................26
3.2.3.3 Standing stock and potential yield ..............................................................27
3.3 THREATS.............................................................................................................................27
3.3.1 Current threats.........................................................................................................27
3.3.1.1 Environmental problems caused by fishing activities .................................27
3.3.1.2 Environmental problems caused by aquaculture .......................................27
3.3.1.3 Environmental problems caused by fisheries logistics supplies and
processing plants........................................................................................28
3.3.1.4 Destructive fishing ......................................................................................28
3.3.1.5 Over-fishing ................................................................................................28
3.3.2 Potential threats.......................................................................................................28
3.3.2.1 Projected market demand ..........................................................................28
3.3.2.2 Increased coastal population......................................................................29
ii
NATIONAL REPORT ON FISHERIES VIET NAM
4.
HABITATS AND AREAS OF IMPORTANCE IN THE MAINTENANCE OF EXPLOITED
FISH STOCKS ............................................................................................................................29
4.1 PHYSICAL, CHEMICAL, AND BIOLOGICAL CHARACTERISTICS OF THE SPAWNING, NURSERY,
FEEDING, AND FISHING GROUNDS ..........................................................................................29
4.1.1 Spawning and nursery grounds of fish, shrimp .......................................................31
4.1.2 Fishing grounds .......................................................................................................32
4.2 UNKNOWN ISSUES SUCH AS STOCKS WITH UNDEFINED SPAWNING GROUNDS ...........................35
4.3 THREATS, CURRENT AND POTENTIAL .....................................................................................35
4.3.1 Coastal development ...............................................................................................35
4.3.2 Pollution ...................................................................................................................35
4.3.3 Oil spills....................................................................................................................35
4.3.4 Destructive exploitation............................................................................................36
4.4 RANKING OF HABITATS .........................................................................................................36
4.4.1 Association with species of importance to food security .........................................36
4.4.2 Association with high value species ........................................................................36
4.4.3 Association with endangered, rare and threatened species....................................36
5.
CURRENT MANAGEMENT REGIMES......................................................................................37
5.1 LEGAL INSTRUMENTS ...........................................................................................................37
5.2 INSTITUTIONAL ARRANGEMENTS (RESEARCH, MONITORING, CONTROL & ENFORCEMENT) .........37
5.3 OVERVIEW OF PATTERNS OF RESOURCES OWNERSHIP AND TRADITIONAL UTILIZATION .............38
5.4 CAPACITY, HUMAN & INSTITUTIONAL (INCLUDE LOCATION OF RESEARCH AND MCS
INSTITUTIONS)......................................................................................................................39
5.5 REVIEW OF STAKEHOLDERS..................................................................................................39
6.
RECOMMENDATIONS...............................................................................................................40
REFERENCE ........................................................................................................................................41
iii
NATIONAL REPORT ON FISHERIES VIET NAM
LIST OF TABLES
Table 1 Total production and export value of fisheries in Viet Nam from 1990 to 2002......................1
Table 2 The catch of marine fish by coastal provinces of Viet Nam from 1991 to 2001 (tonnes).......3
Table 3 Number of fishing boats by fishing grounds in Viet Namese waters. .....................................4
Table 4 Average catch per unit of effort of key fishing gears employed in coastal and offshore
waters of Viet Nam. ................................................................................................................4
Table 5 Annual mean catch per one single trawler in Vietnamese waters (tonnes). ..........................5
Table 6 Annual mean catch per one pair trawler in Vietnamese waters (tonnes)...............................5
Table 7 Annual mean catch per one purse seiner in Vietnamese waters (tonnes).............................6
Table 8 Annual mean catch per one line boat in Vietnamese waters (tonnes) ...................................7
Table 9 Total catches in 14 coastal provinces by fishing gear type in 1997 (tonnes) .........................8
Table 10 Changes in the number of fishing cooperatives in Viet Nam from 1985 to 2000. ................11
Table 11 Changes in the number of fishing groups in Viet Nam from 1985 to 1997...........................11
Table 12 The catch of ten most fishery important provinces in 2001 ..................................................12
Table 13 Market price of some important marine fish species in Viet Nam (1000 VND). ...................12
Table 14 Endangered, vulnerable, threatened, and rare species in Viet Nam's marine waters. ........12
Table 15 Some major socioeconomic development targets for Viet Nam's fisheries sector to 2010. 14
Table 16 The number of fishing boats, total horsepower, landings, and catch rate in Viet Nam
from 1981 to 2002.................................................................................................................18
Table 17 Mean CPUE (kg/day) of purse seine and drift gillnet fleets from 2000 to 2002. ..................18
Table 18 Mean catch rate (kg/km of net) of large pelagic fish in gill net surveys conducted
from 2000 to 2002..............................................................................................20
Table 19 Mean CPUE observed during the surveys from 2000 to 2003......................................21
Table 10 Proportion (%) of the five dominant species in the total catch of gill net surveys
conducted in Vietnamese waters from 2000 to 2003..................................................23
Table 21 Mean CPUE (kg/h) and proportion (%) of the total catch of top ten species by season
and area in Viet Nam..........................................................................................23
Table 22 Proportion (%) of the dominant shrimp families in the total catch of shrimp.....................25
Table 23 Biomass and potential yields of selected shrimp and lobsters in Vietnamese waters.........27
Table 24 The biomass and potential yield of squid and cuttlefish in Vietnamese waters.................28
Table 25 The area of mangroves converted for the aquaculture of ark-shell, clam and crab
in the Mekong Delta of Viet Nam from 1995 to 2000 (ha)............................................28
Table 26 The area of mangrove forests used for shrimp culture in selected provinces
of southern Viet Nam..........................................................................................29
Table 27 Oil concentrations recorded in Viet Nam's southeastern coastal waters
from 1992 to 1995..............................................................................................36
Table 28 The average coefficient of oil pollution in the coastal estuaries of northern Viet Nam........37
Table 29 The distribution of five endangered, rare, and threatened sea turtles in Viet Nam's water..38
iv
NATIONAL REPORT ON FISHERIES VIET NAM
LISTS OF FIGURES
Figure 1 Mean length of skipjack tuna caught in gill net surveys from 2000 to 2003. ........................14
Figure 2 The length frequency distribution of Atule mate caught during trawl surveys conducted in
southeastern and southwestern areas of Viet Nam during December 2000........................15
Figure 3 The Length frequency distribution of Loligo chinensis caught during trawl surveys
conducted in southeastern and southwestern areas of Vietnamese water in December
2000. .....................................................................................................................................17
Figure 4 CPUE of the single trawl fleet (20 to 45 hp) in northern (Gulf of Tonkin), central,
southeastern, and southwestern (Gulf of Thailand) waters of Viet Nam..............................19
Figure 5 Mean CPUE of pink and white prawns in Vietnamese waters located within the Gulfs of
Tonkin and Thailand from 1996 to 2003...............................................................................21
Figure 6 CPUE distribution of trawls (kg/h) and gill nets (kg/km) during the southwest (right) and
northeast (left) seasons from the surveys conducted by ALMRV and the Offshore Fisheries
Project in 2000 and 2001......................................................................................................23
Figure 7 The key ground of Penaeidae shrimp in Vietnamese waters. ..............................................25
Figure 8 The main fishing grounds (as highlighted in green) in Vietnamese waters..........................33
v
NATIONAL REPORT ON FISHERIES VIET NAM 1
Fish Stocks & Habitats of Regional, Global and Transboundary Significance
in the South China Sea
1. BACKGROUND
1.1
Overview of the fisheries sector
Viet Nam is situated in the tropical monsoon area of South East Asia. It has a coastline of 3260km
and an exclusive economic zone (EEZ) of more than 1 million km2. At present, the fisheries sector
plays an important role in the social and economic development of Viet Nam.
Total fisheries production was estimated at 2,410,900 tonnes in 2002, of which 1,434,800 tonnes was
from capture fisheries. Export value in 2002 reached US$2,014 million (MOFI 2003) (Table 1).
Table 1
Total production and export value of fisheries in Viet Nam from 1990 to 2002.
Total catch
Marine capture
Aquaculture
Total export value
Year
(tonnes)
(tonnes)
(tonnes)
(Million USD)
1990
1,019,000 709,000 310,000 205.000
1991
1,062,163 714,253 347,910 262.234
1992
1,097,830 746,570 351,260 305.630
1993
1,116,169 793,324 368,604 368.435
1994
1,211,496 878,474 333,022 458.200
1995
1,344,140 928,860 415,280 550.100
1996
1,373,500 962,500 411,000 670.000
1997 1,570,000
1,062,000
481,000
776.000
1998 1,688,530
1,130,660
537,870
858.600
1999 1,827,310
1,212,800
614,510
971.120
2000 2,003,700
1,280,590
723,110
1,402.170
2001 2,226,900
1,347,800
879,100
1,760.600
2002 2,410,900
1,434,800
976,100
2,014.000
Source: The Implementation of Work plan 2002 and Fishery Socio-Economic Development Plan 2003, Ministry of Fisheries
(2003).
Vietnamese waters have many bays, lagoons, and estuaries, including Ha Long Bay, Bai Tu Long
Bay, and Tam Giang lagoon, and over 400,000ha of mangroves. There is huge potential for the
development of capture fisheries, marine aquaculture, and other economic sectors, including
transportation and tourism.
There are over 2,030 fish species in Vietnamese waters, of which approximately 130 species have
economic value, 1,600 crustacean species, 2,500 species of mollusc, and many other kinds of seaweed
and seabirds. The standing stock of fisheries resources is estimated to be 3.1 to 3.3 million tonnes, with
a potential yield of approximately 1.4 to 1.5 million tonnes (Study on Marine Fishery Resources and
Selection of Appropriate Fishing Patten for Development of Offshore Fisheries Dao Manh Son, 2003).
The fisheries sector is currently Viet Nam's third biggest exporting sector, after crude oil and garments.
This sector provides about 40% of the animal protein in the diet of Vietnamese people, creates jobs for
over 4 million labourers, and provides part time income for millions of people.
However, the fisheries sector is facing many difficulties, largely due to capture fisheries in Viet Nam
being mostly small-scale. For instance, 84% of fishing boats have a capacity of less than 90hp, and
fishing activities mainly take place in near shore areas causing higher fishing pressure, resulting in the
overexploitation and severe decline of living resources. In this setting, the income of fishing boats
decreases, and competition among them increases, resulting in resources becoming increasingly
exhausted.
Therefore, it is necessary to orient the development of fisheries in the right direction by strengthening
coastal fisheries management, and developing offshore fisheries in a sustainable manner.
Reversing Environmental Degradation Trends in the South China Sea and Gulf of Thailand
2 NATIONAL REPORT ON FISHERIES VIET NAM
1.1.1 Total catch of the coastal provinces
Historical total catch by province
As shown in Table 2, the coastal provinces of Kien Giang, Ba Ria-Vung Tau, Binh Thuan, and Ca
Mau had the highest marine catches, with total catches in 2001 of 256,200 tonnes, 140,180 tonnes,
131,000 tonnes and 125,000 tonnes, respectively.
Main species caught in the fishing grounds:
Among the 2030 marine fish species in Viet Nam's waters, approximately 70% of these are demersal
and semi-demersal fish, with the remaining 30% being pelagic species. The distribution of dominant
species varies by area. The main species by areas are as follows:
Tonkin Gulf: Ponyfishes (Leiognathus spp.), glow-belly (Acropoma japonicum), threadfin porgy
(Evynnis cardinalis), roundscad (Decapterus maruadsi), and splendid squid (Loligo
chinensis).
Central and middle area of the South China Sea: Skipjack tuna (Katsuwonus pelamis), yellowfin
tuna (Thunnus albacares), common dolphinfish (Coryphaena hyppurus), bigeye tuna
(Thunnus obessus), swordfish (Xiphias gladius), and silky shark (Carcharhinus menisorrah).
Southeast area: Japanese leatherjacket (Monacanthus nipponensis), red bigeye (Priacanthus
macracanthus), bensasi goatfish (Upeneus bensasi), cuttlefish (Sepia spp.), squid (Loligo
spp.), and octopus.
Southwest area: Frigate tuna (Auxis thazard), short mackerel (Rastrelliger brachysoma), goatfish
(Upenus bensasi), squid, cuttlefish, pike conger and trevallies (Carangidae spp.).
Reversing Environmental Degradation Trends in the South China Sea and Gulf of Thailand
NATIONAL REPORT ON FISHERIES VIET NAM 3
Table 2
The catch of marine fish by coastal provinces of Viet Nam from 1991 to 2001. (tonnes)
Provinces 1991 1992 1993 1994 1995 1996 1997 1998 1999 2000 2001
State
Enterprises
9,850
10,471 8,300 7,873 3,750 4,000 3,875 3,800 3,000 3,130 1,540
Local
provinces
702,527 700,710 789,757 882,125 950,890 958,500 1,074,755 1,147,600 1,209,800 1,277,460 1,394,243
Quang
Ninh
12,000 10,225 10,850 11,665 12,000 13,300 14,456 15,332 16,300 19,000 20,000
Hai
Phong
11,500 11,500 11,150 11,763 13,000 16,500 15,500 17,200 19,000 22,500 27,200
Thai
Binh
9,000 7,000 5,000 5,000 7,100 6,500 6,000 11,300 12,200 5,400 5,832
Nam
Ha
5,480
5,700
6,935
7,976
9,350
Nam
§inh
7,950 9,050 12,550 14,800 23,500 25,380
Ninh
Binh
440 471 570 600 750 600 900 900
1,000
1,100
1,200
Thanh
Hoa
18,000 18,178 21,450 21,900 22,050 18,000 25,200 28,500 33,000 34,000 33,405
NgheAn
16,500 17,360 19,120 20,000 22,000 12,000 24,000 25,000 26,500 29,000 30,000
Ha
Tinh
11,200 13,700 13,745 14,300 15,000 13,600 14,590 14,600 16,500 21,380 21,000
Quang
Binh
9,000 8,900 10,601 11,704 12,000 13,000 13,524 13,572 15,550 17,100 18,212
Quang
Tri
5,500 5,000 5,280 7,200 6,600 5,000 7,000 9,541 10,000 10,500 10,300
Thua
Thien
Hue
9,000 7,750 8,013 11,500 9,100 9,700 11,110 12,800 14,000 12,000 11,414
QNam-§a
Nang 30,844
28,100
36,500
37,435
42,300
§a
Nang
42,000 21,000 22,000 24,735 26,200 22,000
Quang
Nam
29,500 31,570 32,000 37,000 39,500
Quang
Ngai
22,700 25,300 26,400 30,000 38,000 38,000 44,600 47,000 52,000 29,000 28,700
Binh
§inh
23,300 23,000 24,926 25,000 28,450 25,500 32,530 35,000 35,800 36,300 46,400
Phu
Yen
14,060 13,150 18,400 15,524 21,000 20,800 22,650 24,442 24,500 27,500 28,100
Khanh
Hoa
36,910 38,500 38,100 40,429 44,520 44,000 49,500 50,000 52,000 65,000 66,130
Ninh
Thuan
12,840 12,970 14,320 19,000 19,500 22,000 27,000 25,200 26,400 27,500 29,500
Binh
Thuan
77,160 78,000 92,000 94,000 95,000 97,000 110,000 100,620 103,200 112,550 131,000
Ba Ria -Vung Tau
61,200
70,000
76,468
84,793
91,860
100,000
95,000
102,400
103,800
115,000
140,180
HCM
City
10,800 5,340 8,120 14,600 18,500 19,000 20,485 26,000 24,015 23,830 17,100
Tien
Giang
24,590 25,125 23,550 36,000 39,650 38,000 40,000 57,960 57,900 56,000 62,980
Ben
Tre
35,000 30,000 35,000 36,000 50,000 50,000 48,000 54,462 57,000 58,000 61,570
Tra
Vinh
23,000 24,150 36,820 48,800 33,000 33,800 31,000 32,000 35,500 37,500 44,000
Vinh
Long
14,200
14,200
3,000
2,500
Can
Tho
18,000
2,785
739
913
1,400
1,250
380
Soc
Trang
13,806 14,500 14,523 16,500 18,000 15,900 18,500 20,500 24,000 24,850
Minh
Hai
75,000
76,000
94,200
101,500
104,000
Bac
Lieu
112,000 46,745 46,851 48,500 50,500 57,360
Ca
Mau
93,000
92,700
111,000
123,000
125,000
Kien
Giang
110,303 112,000 134,000 155,000 170,800 173,000 196,535 210,100 212,300 223,000 256,200
An
Giang
2,000
1,500
1,500
Long
An
3,000 1,000
2,500 7,460 6,500 9,600 9,500 9,800 10,100 9,730
Total
712,377 711,181 798,057 889,998 954,640 962,500 1,078,630 1,151,400 1,212,800 1,280,590 1,395,783
Source: Fishery Statistics 2002, Fisheries Information Center. (FICen)
Reversing Environmental Degradation Trends in the South China Sea and Gulf of Thailand
4 NATIONAL REPORT ON FISHERIES VIET NAM
Trends in marine catches
Total marine catch increased from 419,470 tonnes in 1981 to 1,434,800 tonnes in 2002. During the
same period, total engine power increased from 453,871 to 4,038,365hp, respectively. Similarly, total
engine power increased 8.9 times, however, total marine catch only increased 3.4 times. This indicates
that profits are perhaps diminishing.
1.1.2 Fishing effort by gear
In recent years, the number of fishing boats increased considerably from 29,117 in 1983 to 81,800 in
2002. The size of engines used by fishing boats has increased. Average engine power per boat
increased from 16.3hp/boat in 1983 to 49.4 hp/boat in 2002.
Table 3 presents the number of boats operating in coastal and offshore fishing areas.
Table 3
Number of fishing boats by fishing grounds in Vietnamese waters.
Region Total
number
Total horse
Fishing area
(boats)
power (hp)
Coastal Off
shore
Tonkin Gulf
20,268
409,578
18,977
94%
1,291
6%
Central 35,155
838,233
29,198
83%
5,957
17%
South East
11,508
810,440
9,619
84%
1,889
16%
South West
9,660
786,520
7,657
79%
2,003
21%
Total 76,591
2,844,771
65,451
86%
11,140
14%
Source: The Implementation of Work plan 1999 and Fishery Socio-Economic Development Plan 2000, Ministry of Fisheries
(2000).
Around 86% of fishing boats in Viet Nam operate in coastal fishing grounds, with a major part of the
marine catch derived from coastal fishing areas.
Catch per Unit of Effort by key gears and area
The Research Institute for Marine Fisheries has observed many fishing gears operated by different
fishing boats. Based on these observations, an estimate of average catch per unit of effort of some
fishing gears employed in coastal and offshore waters is presented in Table 4.
Table 4
Average catch per unit of effort of key fishing gears employed in coastal and
offshore waters of Viet Nam.
Pair trawl
Single trawl
Purse seine
Region
(kg/hp/h)
(kg/hp/h)
(kg/gear operation)
Coastal Off
shore Coastal Off
shore Coastal Off
shore
Tonkin
Gulf
0.23-0.63 0.19-0.49 0.04-0.39 0.06-0.86 125.2
303-582
Central
0.24-0.34 0.41-0.58 0.3-0.41 0.19-0.45 170-500 428-2008
South East and
0.15-0.94 0.25-0.49 0.11-0.43 0.19-0.49 616-910 470-887
South West
1.1.2.1 Trawl
Trawls are one of the most important fishing gears used in Viet Nam, as well as in many other
countries. The catch produced by trawl fisheries constitutes 20 to 30% of the total world marine catch,
40% of the total Asian marine catch, and 43% of the total Viet Nam marine catch.
Key types of trawls used in Viet Nam:
Shrimp trawl
As high towing speed is not required while fishing, most fishing boats (<45hp) use a single trawl.
Shrimp trawlers represent approximately 95% of the total trawlers operating in the Tonkin Gulf and 91%
in the central waters of Viet Nam. Particularly, in the southeast and southwest, fishers use large single
shrimp trawlers up to 350hp. With very fine stretched mesh at cod-end from 18 to 25mm, shrimp trawls
capture not only shrimp, but also many juvenile fishes.
Reversing Environmental Degradation Trends in the South China Sea and Gulf of Thailand
NATIONAL REPORT ON FISHERIES VIET NAM 5
The proportion of trash fish in catches made by shrimp trawl boats of less than 90hp has been
observed to be as high as 80.7%, whilst that for boats greater than 90hp is approximately 60% of the
total catch. In this respect, fishing depth is an important factor. Small shrimp trawlers (<90hp) normally
operate at depths of 10 to 20 m, whilst only 4% of the total large shrimp trawlers (90 to 350hp) operate
in waters 15 to 20m deep.
Resources in Viet Nam's coastal waters are declining, and fishing pressure is increasing. Shrimp trawl
fishing is often pinpointed as the main reason for resource decline. For this reason, adequate studies
into the effects of fishing on the dynamics of fish populations are required to provide a scientific basis
for the adjustment of the number of shrimp trawls operating in coastal waters.
Fish trawl
High towing speed is required to operate this gear type effectively, so medium to large size vessels
typically use this gear. Single trawlers are often not able to maintain a constantly high towing speed,
causing low catches, so many fishers have changed to a pair trawling pattern.
Fish trawls commonly have a head rope length of 30 to 36m, an overall length of 40 to 70m, and a
stretched mesh at codend from 18 to 30mm. Several types of Chinese trawls have recently been
introduced in Viet Nam. These trawls are too big for Vietnamese fishing boats. The nets are 120 to
160m long, with a head rope length of 90 to 95m, and wing mesh sizes from 1000 to 4000mm. This
type of net does not align with the towing speed of the local boats. Due to low towing speed, catches
are low.
The results of investigations into towing speed indicate that Vietnamese fishing boats do not gain
optimum velocities. Hence, there is a need for a fish trawl net that is suitable for Vietnamese boats. The
identification of such a net would assist the development of Viet Nam's offshore fisheries.
Catches in main fishing grounds by trawl fisheries:
Single trawlers
Almost all single trawlers in Viet Nam are shrimp trawlers. In Tonkin Gulf, shrimp trawlers mostly have
engine capacities less than 60hp, however, in the southeast and southwest, shrimp trawlers are quite
big, some having engine capacities greater than 450hp. The annual catch of trawlers by horsepower
group is presented in Table 5.
Table 5
Annual mean catch per one single trawler in Vietnamese waters. (tonnes)
Horsepower group (hp)
Region
36-60
61-90
91-135
136 -300
301 -450
>450
Tonkin
Gulf
10-20
- - -
330
-466
-
Southeast-west
-
324
106 -129
135 -272
118 -617
550 - 685
Pair trawlers
All pair trawlers target fish resources. Several large trawlers (>300hp) operating in the Tonkin Gulf are
employing large meshed nets with stretched mesh at wing ranging from 1,000 to 4,000mm. This type of
gear is effective in making large catches of small, low value fish. The annual catch of the pair trawl fleet
is presented in Table 6.
Table 6
Annual mean catch per one pair trawler in Vietnamese waters. (tonnes)
Horse power group (hp)
Region
36-60 61-90 91-135
136-300
301-450 >450
Tonkin
Gulf
-
144 145-210 154 416-580
440-736
Southeast-west
-
196-231 194-298 179-400 367-661 396
1.1.2.2 Purse seine
Purse seine is another important fishing gear for Viet Nam, and is mostly used for offshore fishing.
Catch derived from the purse seine fishery represents 20.6% of Viet Nam's total marine catch, whilst
the number of purse seine boats (5,174 units) is only 7.6% of the total fishing fleet.
Reversing Environmental Degradation Trends in the South China Sea and Gulf of Thailand
6 NATIONAL REPORT ON FISHERIES VIET NAM
Common Purse seines
Use of purse seines with artificial light or aggregative devices for fish attraction
Purse seine fishers use artificial light to attract and gather fish. This is the most common purse seine
fishing technique in Viet Nam today, with approximately 70 to 90% of Viet Nam's purse seine fleet using
light or aggregative devices for fish attraction when fishing.
Purse seines used to catch small pelagic fish in Viet Nam are often 350 to 500m in length, with a
stretched height from 70 to 120m. The bunt stretched mesh size used in these purse seines is usually
20 - 25mm. For Anchovy purse seines, these dimensions may be smaller, with net lengths from 300 to
500m, net heights from 45 to 55m, and bunt stretched mesh sizes at codend from 4 to 6mm, being
common.
Ordinary purse seine
Due to the need to encircle schools of fish moving in front of the gear, ordinary purse seine nets used
without light or aggregating devices need to be larger. These nets are usually 600 to 800m long, 100 to
160m deep, and have a bunt stretched mesh size at codend of 20 - 40mm. For faster swimming fish,
purse seine length and depth is increased.
Almost all purse seine operations in Viet Nam involve the use of a single fishing boat.
Fishing effort of purse seine fleet
The main target species in the purse seine fishery are small pelagic fish, including tuna, mackerel,
Indian mackerel, herrings, scads, and anchovies. One fishing trip of a purse seine boat often involves 7
to 20 days at sea. Catches depend largely on the abundance of resources in the fishing area.
Average catches of a purse seine boat using light for fish attraction range from 306.6 to 902.7kg/gear
operation, whilst those of an ordinary purse seiner range from 351.5 to 465kg/gear operation. The
average revenue of one purse seiner in Kien Giang and Vung Tau province ranges from 816,900 to
2,494,800 VND/operation.
In some central provinces, the catch composition of purse seine boats includes mainly anchovies. The
annual mean catch of one purse seine boats is presented in Table 7.
Table 7
Annual mean catch per one purse seiner in Vietnamese waters. (tonnes)
Horse power group (hp)
Region
36-60 61-90 91-135
136-300
301-450 >
450
Tonkin
Gulf
44 30-45 31-45 45-50 -
-
Central
52-168
104
- - - -
Southeast-west
195 150-171 160-213 159-261 155-400
-
1.1.2.3 Line fisheries
Yellowfin tuna longline
This fishery has been developed recently in Phu Yen and Khanh Hoa provinces. Fishing boats involved
in this fishery have engine capacities from 45 to 60hp. The length of the mainline used is approximately
18 to 25km. The total number of hooks ranges from 330 to 580. The length of branch lines are from 50
to 60m. Average catches from a 15 to 30 day fishing trip range from 1,200 to 4,300kg, and are mostly
composed of bigeye and yellowfin tuna. The tuna for exporting, after removing internal organs and
blood is commonly preserved in cool seawater at 0oC using ground ice and freesing equipment.
Pike conger longline
The most developed areas of this fishery are Ca Mau and Kien Giang provinces. Fishing boats involved
in this fishery have engine capacities from 20 hp to 350hp, and commonly operate in waters from 25 to
35m deep. The main target species is pike conger, which often represents 90% of the total catch. The
length of the mainline used is between 20 and 30km with 900 to 2,000 hooks. One 8-day fishing trip,
using a mainline of 30km, will often result in catches between 2,000 and 5,000kg.
Reversing Environmental Degradation Trends in the South China Sea and Gulf of Thailand
NATIONAL REPORT ON FISHERIES VIET NAM 7
Shark longline
This fishery has developed strongly in the central provinces, including Binh Dinh, Binh Thuan, and
Khanh Hoa. The fishing grounds are typically offshore. Fishing boats involved in this fishery have
engine capacities from 60 to 90hp. The length of mainline used ranges from 24 to 32km, with 620 to
1,322 hooks. A fishing trip of 20 to 30 days often results in 3,900 to 4,200kg of catch.
Squid hand line
This is a simple and low-investment fishery with only one line and 2 to 3 hooks used. The target species
is squid. This gear is often used by fishing boats with an engine capacity less than 23hp, and is
sometimes used in combination with other gears.
Fish hand line
This gear is used to catch groupers and other fish. This fishery is minor, making a very small
contribution to total production.
Fishing effort of line fisheries
The catch per unit effort (CPUE) of longline fishing is calculated as the average catch per 100 hooks
per one operation, as well as the average revenue per 100 hooks per one operation.
Observations indicate that the average catch per 100 hooks of a tuna longline is 14.8 times higher than
that of pike conger longline, 10.2 times higher than shark longline, and 5.6 times higher than mackerel
longline.
The average catch of a squid hand line ranges from 4 to 6kg/person/day.
Table 8
Annual mean catch per one line boat in Vietnamese waters. (tonnes)
Horse power group (hp)
Region
36-60 61-90 91-135
136-300
301-450 >450
Tonkin Gulf
9-15
-
-
-
40
40
Center 3-23
19-34
29-40
-
-
-
Southeast-west
20-42
19-45 - 25-50 -
-
1.1.2.4 Gill net
Gill net fishing is a traditional fishing activity in Viet Nam, however, it is only conducted by small fishing
boats. The common types of gill net used include:
Shrimp trammel net
This gear is normally used by boats with an engine capacity less than 25hp. Length of nets range from
500 to 2,000m, with heights from 1.5 to 3.0m, the stretched mesh of the inner layer ranges from 48
50mm. This gear is used in inshore waters and estuaries that are less than 20m deep.
Cuttlefish trammel net
This gear is normally used by boats with an engine capacity less than 25hp. The length and height of
the net is the same as that of the shrimp trammel net. The stretched mesh of inner net is approximately
80mm. This gear is used in inshore waters with high salinity (not in estuaries).
Demersal fish trammel net
This gear is normally used by boats with an engine capacity from 15 to 45hp. The length of nets range
from 2 to 5km, with heights from 4 to 6m. This gear is used in inshore waters from 15 to 35m deep.
1.1.2.5 Other fishing gears
Besides the main fishing gears described above, a number of other fishing gears are operated
effectively in Vietnamese waters. These include lift nets, stow nets, push nets, and traps. The catches
made by different gear types in certain areas of Viet Nam's EEZ are introduced in Table 9.
Reversing Environmental Degradation Trends in the South China Sea and Gulf of Thailand
8 NATIONAL REPORT ON FISHERIES VIET NAM
Table 9
Total catches in 14 coastal provinces by fishing gear type in 1997. (tonnes)
Seawaters Total
Trawl Purse Gill net
Line
Lift net
Stationary
Other
catch
seine
net
gears
Gulf of Tonkin
73,703
27,182
4,880
18,728
4,773
14,110
1,240
2,391
100%
36.9%
6.6%
25.4%
6.5%
19.1%
1.7%
3.2%
Central area
173,218
31,078
41,614
34,674
23,793
36,534
841
4,504
100%
17.9%
24.0%
20.0%
13.7%
21.7%
0.5%
2.6%
Southern area
283,415
169,958
62,593
18,729
16,452
-
13,371
2,322
100%
60.0%
22.0%
6.6%
5.8%
-
4.7%
0.8%
Total
530,336
228,218
109,087
72,131
45,028
50,644
15,452
9,217
(14 provinces)
100%
43.0%
20.6%
13.6%
8.5%
9.5%
2.9%
1.7%
1.1.3 Economic value of catch
Trend in catch per unit of effort (CPUE)
There are a large and increasing number of small fishing boats operating in Viet Nam's coastal waters.
The corresponding increases in fishing effort and total catch have led to the overexploitation of fisheries
resources in these areas. Consequently, for each unit increase in fishing effort in Viet Nam's coastal
waters, the income of fishers per unit of effort diminishes. In order to maintain financial returns on their
investments in time and effort, fishers typically intensify their operations by increasing fishing duration,
increasing number of gear operations, and reducing mesh size. This often further contributes to the
problem of overexploitation, driving further increases in fishing effort. For example, the average catch
per 1 horsepower declined significantly from 1985 to 2002 (Table 16). Specifically, the average catch
per 1 horsepower was 1.11 tonnes/hp in 1985, although by 2002 this had fallen to 0.35 tonnes/hp, or
31.5% of the 1985 catch rate.
Trend in price and value of catch
As discussed above, approximately 82% of Viet Nam's total marine catch is derived from waters less
than 50 m deep. The overexploitation of coastal fisheries resources has the following consequences:
-
The proportion of high value fish species in catches is gradually reduced.
-
The sizes of individual high value fish in catches become smaller over time.
-
The proportion of trash fish (very low value fish) in catches tends to increase.
This drives fluctuations in the price per kg and value of catch.
Fish price per kg
The prices obtained for species of high commercial value, especially coral-associated species such as
grouper, eel, and lobster, have recently increased significantly. The price of other commercial species,
including yellowfin tuna, snapper, and mackerel, have also increased. However, price for these latter
species is not stable due to fluctuations in market supply and demand.
Value per fishing trip
Due to ongoing reductions in catch rates, the quantity of high quality fish, size of fish, and income per
fishing trip has declined.
Estimated value of the total catch
At present, Viet Nam's fisheries statistics only provide general information regarding total catch, total
number of fishing boats, and total engine power. Information at the fishing gear or species level has not
been collected due to an underdeveloped fisheries statistics system in Viet Nam.
In fact, the total annual catch of marine fish from Vietnamese waters was estimated very roughly.
Although the total catch (Table 1) may not be precise, it provides an indication of the level of resource
exploitation.
Estimates of the cost of fishing, based on data collected from different fleets (trawl, purse seine, gill net,
and line fishing boats) and horsepower groups across a variety of regions (Tonkin Gulf, Centre, South
East and West) indicate that the:
-
Mean price per one tonne of catch is 4.214 million VND; and the
-
Mean cost per one hp is 1.843 million VND per year (1 US$ = 15,340 VND in 2002).
Reversing Environmental Degradation Trends in the South China Sea and Gulf of Thailand
NATIONAL REPORT ON FISHERIES VIET NAM 9
It is possible to estimate the total annual value and cost of fishing by multiplying these figures with
those relating to total catch and total engine capacity. The data from 1981 to 2002 indicate that the
catch rate and income per horse power decreases with increases in engine capacity.
The total costs of fishing increased 8.89 times from 836,484.3 VND in 1981 to 7,442,706.7 million VND
in 2002. However, during this period, the total value only increased 3.42 times from 1,767,646.6 to
6,046,247.2 million VND. Profit per fishing boat or operator in Viet Nam's marine fisheries tends to
decline as horsepower or the number of boats increases.
Highest profits were obtained during the period from 1986 to 1991, with total profits ranging from 1,462
to 1,558 billion VND. Since 1991, total profits have declined. This indicates that traditional waters, less
than 50m deep, have been overexploited and that fishing in these areas results in poor economic
returns. It is considered that the development of sustainable fisheries in Viet Nam requires a reduction
in the size of the coastal fishing fleet, supported by an expansion of fishing effort in offshore areas.
1.1.4 Importance of the fisheries sector in terms of employment and dependence
1.1.4.1 Fishery labors
Viet Nam's fisheries are small-scale, multi-species, and multi-gear. The majority of investment in these
fisheries is private. These small-scale fisheries contribute more than 87% of the total catch. Some
640,000 Vietnamese people are engaged in fishing, including approximately 60,000 people
participating in offshore fishing activities.
Development of state-owned fishing enterprises has not been effective due to insufficient management
and lack of investment. They gradually lose their leading role in application of new technologies as well
as in catch contribution. In 2001, according to the Ministry of Fisheries, there were 452 fishing co-
operatives (Table 10) comprising 15,650 labourers and 4,300 fishing groups comprising 21,000
fisheries labourers.
The educational level in every Vietnamese fishing community is low. It is estimated that: 68% of people
in these communities only finish primary school; slightly more than 20% complete lower secondary
school; about 10% finish secondary schools; and only 0.65% have graduated from vocational schools
or universities.
The following socio economic conditions influence the quantity and quality of fishery labourers in Viet
Nam:
-
Coastal fisheries in all areas of Viet Nam face the threat of overexploitation. There is a need to
introduce strict measures aimed at reducing fishing effort in coastal waters. However, many
fishers cannot afford to purchase fishing boats suitable for offshore use due to lack of sufficient
capital. Therefore, a continuously growing number of coastal and inshore fishers exacerbate
existing conditions.
- Marine fishing is a customary and hereditary profession in Viet Nam. Fishers normally do not
have any other sources of income. Compared to agriculture, incomes associated with fishing
are typically higher. This situation attracts many labourers to this sector.
- Due to low levels of education, it is difficult for fishers to learn about advanced technology,
especially offshore fishing techniques. Similarly, finding employment in other areas is often a
major challenge for small-scale fishers.
-
The decline in fisher incomes, associated with the degradation of coastal resources, has driven
fishers to increase the efficacy of fishing effort. This has involved fishers:
+ reducing mesh size to catch fish of all shapes and sizes, including juvenile fish;
+ increasing the number of gear operations per trip, or extending the duration of fishing; and
+ using destructive fishing gears or methods, including explosives, chemicals, and other
poisonous substances.
- In the reduction of overall fishing effort exerted in coastal waters, there is a need to create
alternative employment opportunities for fishers.
There is a requirement for these socio economic considerations to be incorporated into Viet Nam's
strategic policy and planning for fisheries in the future.
Reversing Environmental Degradation Trends in the South China Sea and Gulf of Thailand
10 NATIONAL REPORT ON FISHERIES VIET NAM
1.1.4.2 Fisheries infrastructure
At present, there are about 700 shipyards in Viet Nam with a capacity to build 4,000 new boats and
repair 10,000 units in a year. Normally, hulls of fishing boats are made of wood. Some fishing
enterprises and transportation units use steel. Those boats may be equipped with an engine capacity of
200 to 400hp.
At the end of 2002, the fisheries sector had 63 fishing ports, including 47 in coastal provinces and 16 on
islands. The construction of these facilities relied on a range of different capital sources. Among them,
48 ports are in operation, providing a total jetty length of 6,700m. 15 ports are still under construction.
Although the Ministry of Fisheries has attempted to improve infrastructure, the logistical system for
fisheries remains underdeveloped and does not have all the necessary services. Some services are not
operated effectively. For instance, several access routes have not been dredged, hampering the
navigation of fishing and transportation boats into and out of port facilities. Similarly, the number of
shelters and landing places is not sufficient for Viet Nam's large fishing fleet, resulting in efficient
offloading of catch. This often leads to the deterioration of catch quality.
There are 8 manufacturing enterprises producing net thread, packing bags and other fish related
packaging. These facilities have an annual capacity to produce 200 tonnes of thread and 7,500 tonnes
of packing materials. Among them, 2 are State-owned, 2 are joint-ventured with foreign countries, 3
have 100% foreign capital investment, and 1 is a private Vietnamese-owned factory.
In 2000, new fish market complexes were constructed in BacLieu, Kien Giang and Quang Ninh (CoTo
Island).
There are 266 industrial processing enterprises in Viet Nam having more than 300 processing plants.
Most of them use freezing technology (Do Van Nam, 2003).
In general, marine fisheries in Viet Nam are still small-scale. The management of the sector is difficult
due to the complexity of the multi-species tropical fish fauna, too many small fishing boats and gears,
too many small landing sites and beaches scattered along Viet Nam's coastline, open access to
fisheries resources, and underdeveloped production techniques.
1.1.4.3 Marketing
At present, there are no fish auctions or large markets in Viet Nam. Intermediaries play key roles in the
trading of fisheries products.
Intermediaries often buy fish on a wholesale basis from fishing boats, and then sell items to the skipper
of the fishing boat that are required for the next fishing trip. These items include ice, fresh water, fishing
gear, and food. Powerful intermediaries often enter into contracts with fishers that involve the
intermediary lending the fishers money, usually 20 to 70 million VND/boat, to cover the costs of fishing,
in return for monopoly rights to purchase the entire landings from a boat.
The landings are usually sorted into species and size classes prior to sale in the following key markets:
-
Export market: High value products are selected and stored properly and carefully.
Intermediaries sell them to export processing plants or export them directly to China and other
countries.
-
Domestic market: Products selected for domestic consumption are usually transported in
frozen form to big cities for sale as fresh fish, or to processing plants for the production of dried
products for domestic markets.
-
Fish sauce processing: About 40 to 50% of the total landings, or trash fish, from trawl fishing,
and low value products derived from other fisheries, including sardinella and anchovies, are
used in the production of fish sauce. In 1998, approximately 160 million litres of fish sauce was
produced in Viet Nam.
Apart from the powerful intermediaries associated with the larger landing sites, small-scale traders
operate in most small landing places. These traders are typically female workers in fishing
communities, or the wives of fishing boat owners and operators. They buy small quantities of landings
for resale in local fresh food markets.
Reversing Environmental Degradation Trends in the South China Sea and Gulf of Thailand
NATIONAL REPORT ON FISHERIES VIET NAM 11
1.1.4.4 Processing and exporting of marine products
In 2000, the majority of exports of marine products were frozen (shrimp, fish, squid), representing 65%
of the total export quantity. Frozen shrimp represented approximately 66% of these exports in terms of
both value and quantity. Other important fish exports include dried cuttlefish, dried squid, and frozen
fish fillets. Canned food for export is still limited in quantity. Other value added products make up 35%
of the total export value.
Fisheries exports have grown in terms of quantity and value. The export quantity increased from 3,441
tonnes in 1980 to 64,366 tonnes in 1990. The export value increased from US$11.2 million in 1988 to
US$550 million in 1995, and then to US$2,014 million USD in 2002. This 2002 export value is
approximately 180 times higher than that observed in 1988. In 1990 to 2000, the national export
turnover increased 584%, with an average yearly growth of 21.2%.
1.1.4.5 Socio-economy of marine capture fisheries
The fisheries of Viet Nam have recently experienced a rapid and continuous growth phase, becoming
one of the key sectors of the national economy. In 2003, fisheries contributed to more than 4% of the
national GDP. The yearly average increase in the contribution of fisheries to GDP has been estimated
at 40%. In 1990, the GDP of fisheries was 1,281 billion VND, growing to 6,664 billion VND in 1995, and
by 2003, it was approximately 25,675 billion VND. The average GDP/fisher is approximately
US$160/year. However, compared with average national living standards, the welfare conditions of
fishers are still low.
Fishing communities contain 2.5 to 3% of the total population of Viet Nam, of which 49% are male and
51% are female. The average number of persons per one fishing household is 6 to 7 persons.
Most fishers can only afford to buy small fishing boats and gear, resulting in most fishing effort being
directed towards coastal fisheries resources.
In the fisheries sector, there exist different economic components: (1) state-owned fishing enterprises;
(2) fishing cooperatives; (3) fishing groups; and (4) private fishers.
The number of fishing cooperatives reduced dramatically from 1985 to 1996. However, they did
increase slightly during the late 1990s (Table 10).
Table 10
Changes in the number of fishing cooperatives in Viet Nam from 1985 to 2000.
Year
1985 1990 1995 1996 1997 2000
Number of fishing cooperatives
673
398
95
94
184
452
Source: A preliminary Analysis on Socio-economic Situation of Coastal Fishing Communities in Viet Nam, Nguyen Long, 2000.
Fishing groups consisting of several fishers, who are willingly to cooperate with each other in fishing
and investment, have grown in popularity (Table 11).
Table 11
Changes in the number of fishing groups in Viet Nam from 1985 to 1997.
Year
1985 1990 1995 1996 1997
Number
of
fishing
groups
2,205 2,884 3,773 3,886 5,542
Source: The Implementation of Work plan 1999 and Fishery Socio-Economic Development Plan 2000, Ministry of Fisheries
(2000).
2.
SPECIES OF REGIONAL, GLOBAL AND TRANSBOUNDARY SIGNIFICANCE
2.1
Ranking of importance of species
In Viet Nam, the data on total catch by species is not available. Generally, catches are sorted into
separate commercial groups. The number of commercial groups depends on the type of the fishery.
The most complicated catch compositions are associated with trawl fisheries. The commercial groups
are defined by the species, size, quality, and market price. Some commercial groups consist of only
one or two species, whereas other groups contain many species, for instance the trash fish group.
Trawl fisheries may also contain both demersal and pelagic fishes.
Reversing Environmental Degradation Trends in the South China Sea and Gulf of Thailand
12 NATIONAL REPORT ON FISHERIES VIET NAM
2.1.1 In terms of landings
Table 12 presents Viet Nam's provinces with the highest total catches in 2001.
Table 12
The catch of ten most fishery important provinces in 2001.
Unit: 1000 tons
Province Kien B/Ria-
Binh
Ca Mau
Khanh
Tien
Ben Tre
Binh
Tra
Quang
Giang
V/Tau
Thuan
Hoa
Giang
Dinh
Vinh
Nam
Catch
256.2 140.18 131.0 125.0 66.13 62.98 61.57 46.4 44.0 39.5
2.1.2 In terms of local market value
According to an observation of the Research Institute for marine Fisheries (RIMF), the market price of
some important species in terms of quantity and high value are presented in Table 13.
Table 13
Market price of some important marine fish species in Viet Nam (1000 VND).
Important species in terms of quantity
Important species in terms of high value
Species
Market price
Species
Market price
Round scad
6.0 9.0
Spiny lobster
500.0 550.0
Sardinella
5.0 8.0
Marine eel
180.0 210.0
Indo - Pacific mackerel
5.0 7.0
Tiger shrimp
120.0 150.0
Frigate tuna
4.0 7.0
Mud crab
100.0 140.0
Yellowstripe scad
3.0 4.0
Silver pomfret
100.0 120.0
Ponyfish
1.0 2.0
Grouper
90.0 120.0
Trash fish
0.3 2.0
Abalone
90.0 110.0
Spanish mackerel
30.0 40.0
Cuttlefish
50.0 80.0
Seabream
30.0 50.0
Snapper
40.0 60.0
Yellowfin tuna
40.0 60.0
Seabass
40.0 50.0
(Exchange rate: 1 US$ = 15,340 VND in 2002)
2.1.3 In terms of status (endangered, threatened, rare etc. IUCN criteria)
Recently, declines in the abundance of some fish species have been observed in the waters of Viet Nam
and the broader South East Asian region. A number of these species are classified as endangered or
threatened. There are 37 marine fish species, 5 spiny lobster species, 27 mollusc species and 3
cephalopod species in Viet Nam waters that are considered as endangered, threatened, or rare in Viet
Nam red book.
Table 14
Endangered, vulnerable, threatened, and rare species in Viet Nam's marine waters.
No Type
Scientific
name
Status
1 Fishes
Amphioxus belcheri
Vu
2 Fishes
Stegostoma fasciatum
Ra
3 Fishes
Rhincodon typus
Ra
4 Fishes
Alopias pelagicus
Dd
5 Fishes
Cephaloscyllium umbratile
Ra
6 Fishes
Etmopterus lucifer
Ra
7 Fishes
Pristis cuspidatus
Ra
8 Fishes
Pristis microdon
Ra
9 Fishes
Rhina ancylostoma
Th
10 Fishes
Narcine tonkinensis
Ra
11 Fishes
Chimaera phantasma
Dd
12 Fishes
Elops saurus
Ra
13 Fishes
Megalops cyprinoides
Ra
14 Fishes
Albula vulpes
Ra
15 Fishes
Nematolosa nasus
En
16 Fishes
Anodontostoma chacunda
En
17 Fishes
Ateleopus japonicus
Ra
18 Fishes
Solenostomus paradoxus
Ra
19 Fishes
Trachyrhamphus serratus
Ra
20 Fishes
Syngnathus acus
Ra
21 Fishes
Solenognathus hardwickii
Ra
22 Fishes
Hippocampus histrix
Vu
23 Fishes
Hippocampus kuda
Vu
Reversing Environmental Degradation Trends in the South China Sea and Gulf of Thailand
NATIONAL REPORT ON FISHERIES VIET NAM 13
Table 14 cont. Endangered, vulnerable, threatened, and rare species in Viet Nam's marine
waters.
No Type
Scientific
name
Status
24 Fishes
Hippocampus japonicus
Dd
25 Fishes
Hippocampus trimaculatus
Vu
26 Fishes
Hippocampus kellogi
Vu
27 Fishes
Velifer hypselopterus
Ra
28 Fishes
Zeus japonicus
Ra
29 Fishes
Zeus cypho
Ra
30 Fishes
Schindlerria praematura
Ra
31 Fishes
Bostrichthys sinensis
Vu
32 Fishes
Satyrichthys rieffeli
Ra
33 Fishes
Psilocephalus barbatus
Ra
34 Fishes
Oxymonocanthus longirostris
Ra
35 Fishes
Masturus lanceolatus
Th
36 Fishes
Mola mola
Ra
37 Fishes
Antennarius melas
Ra
38 Spiny
lobster
Panulirus homatus
Vu
39 Spiny
lobster
Panulirus longipes
Vu
40 Spiny
lobster
Panulirus ornatus
Vu
41 Spiny
lobster
Panulirus versicolor
Vu
42 Spiny
lobster
Tachypreus tridentatus
Th
43 Mol usc
Haliotis asinina
Vu
44 Mol usc
Haliotis ovina
Vu
45 Mol usc
Trochus niloticus
En
46 Mol usc
Trochus pyramis
En
47 Mol usc
Turbo marmoratus
En
48 Mol usc
Chelycypraea testudinaria
Th
49 Mol usc
Cypraea argus
Ra
50 Mol usc
Cypraea histrio
Ra
51 Mol usc
Cypraea mappa
Ra
52 Mol usc
Cypraea spadicea
Ra
53 Mol usc
Cypraea turdus
Ra
54 Mol usc
Mauritia scurra
Ra
55 Mol usc
Blasicrura chinensis
Ra
56 Mol usc
Ovula costellata
Ra
57 Mol usc
Calpurnus lacteus
Ra
58 Mol usc
Calpurnus verrucosus
Ra
59 Mol usc
Lambis crocata
Ra
60 Mol usc
Strombus luhuanus
Vu
61 Mol usc
Cymatium lotorium
Ra
62 Mol usc
Charonia tritonis
Vu
63 Mol usc
Epitonium scalare
Ra
64 Mol usc
Mytilus viridis
Vu
65 Mol usc
Pinctada margarritifera
Vu
66 Mol usc
Tridacna gigas
Ra
67 Mol usc
Anomalocardia squamosa
En
68 Mol usc
Gafrarium tumidum
En
69 Mol usc
Nautilus pompilius
En
70 Cephalopoda
Loligo chinensis
En
71 Cephalopoda
Sepioteuthis lessoniana
Vu
72 Cephalopoda
Sepia pharaonis
En
Remarks: En = endangered; Vu = vulnerable; Th = threatened; Ra = rare and Dd = data deficient.
Source: Country Report of Viet Nam for Transboundary Diagnostic Assessment, National Environment Agency, 1998.
In a report on the status of sea turtles in Viet Nam, Pham Thuoc et al. listed 5 endangered species in
Viet Nam. They are Green turtle, Loggerhead turtle, Leatherback turtle, Hawksbill turtle and Olive
Ridley turtle. The 2000 IUCN Red List of Threatened Animals classifies 4 of these species as
endangered and 1, the Hawksbill turtle, as critically endangered at the global level. All five species is
listed in Appendices I and II of the Convention on Migratory Species.
2.1.4 Food security
Since 1996, Viet Nam has transformed its general policy and strategy from a central planned economy
to a market economy with socialism style. In line with this new direction, the Ministry of Fisheries, in its
Master Plan (2000 to 2010), has set the following objectives for the socio economic development of this
sector:
Reversing Environmental Degradation Trends in the South China Sea and Gulf of Thailand
14 NATIONAL REPORT ON FISHERIES VIET NAM
-
Increase domestic consumption of fish and fishery products.
-
Increase export earnings.
-
Create substantial additional employment.
-
Improve the sector's infrastructure, equipment, and technology base.
-
Increase the sector's contribution to national income.
Table 15 Some major socioeconomic development targets for Viet Nam's fisheries sector to
2010.
Year
Item Unit
2001 2005 2010
1. Total fisheries production
1,000 t
2,256.941
2,450
3,400
Consists of:
- Marine capture fisheries
1,000 t
1,367.393
1,300
1,400
- Aquaculture fisheries
1,000 t
879.548
1,150
2,000
2. Export value
USD billion
1.76
3.0
4.5
Source: Master plan for fishery Socio-Economic Development to 2010, Research Institute for Fishery Economics and Planning,
2002.
The main species contributing to total fisheries production and food security in Viet Nam are tuna,
round scads, sardine, anchovy, mackerel, threadfin bream, lizardfish, trevally, grouper, snapper, squid,
cuttlefish, black tiger prawn, catfish, tilapia, clam, blood cockle, and mud crab.
2.2
Biology and ecology of the priority species
Since 2000, the project of Assessment of the Living Marine Resources in Viet Nam has conducted a
series of scientific surveys by trawlers in the gulf of Tonkin, Southeast - Southwest waters and by gill-
netters and long liners in the Central waters of Viet Nam. The below analyses in this report used the
data from these surveys.
2.2.1 Large pelagic fishes
Generally, the most important component of the large pelagic fish resource in Vietnamese waters is
tuna, belonging to the Scombridae family. Other families including Xiphiidae, Istiophoridae, and
Coryphaenidae are also found in these waters.
The most important species found in scientific surveys conducted 2000 2003 with gill nets in central
and southeastern waters of Viet nam were skipjack tuna (Katsuwonus pelamis), Devil ray (Mobula
diabolus), and yellowfin tuna (Thunnus albacares).
Skipjack tuna are mainly caught with gillnets of 100mm stretched mesh size. The length of this
species observed in Viet Nam's waters from 2000 to 2003, ranged from 13 to 84 cm, with fish of lengths
between 40 and 50 cm dominating catches. Figure 1 shows the mean length of skipjack tuna caught in
8 surveys (based on 31327 individuals) with very small fluctuation over the time.
Figure 1
Mean length of skipjack tuna caught in gill net surveys from 2000 to 2003.
Reversing Environmental Degradation Trends in the South China Sea and Gulf of Thailand
NATIONAL REPORT ON FISHERIES VIET NAM 15
Yellowfin tuna (Thunnus albacares) is also a target species for gillnet and longline fisheries conducted
in Vietnamese waters. Yellowfin tuna caught by longline were much bigger than that caught by gillnet in
identical areas, ranging from 85 to 112cm.
2.2.2 Small pelagic fishes
The important small pelagic fishes caught in Vietnamese waters include scads (Decapterus), herrings
(Sardinella), anchovy (Stolephorus), and Indian mackerel (Rastrelliger brachysoma). Other species
belonging to genus and families of Trichiurus, Sphyraena, Priacanthus, Selaroides, Selar, Polynemus,
Formioniger and Leiognathidae also contribute significantly to total catch volumes of this group.
In the coastal waters of the Gulf of Tonkin, small pelagic fishes are present at all times. Generally, they
start to come closer to shore in the southern part of the gulf for spawning during March, and from May
to June, they are abundant in all inshore waters.
The continental slope in the central region of Viet Nam is very narrow. Therefore, fishes tend to
concentrate close to the shore or in small bays like Quy Nhon, Nha Trang, and Phan Rang.
There are four southeastern areas characterised by high abundances of small pelagic fish. The include:
(1) coastal waters from Phan Thiet to Vung Tau; (2) the Mekong estuaries; (3) waters adjacent to Con
Dao Island: and (4) Phu Quy Island waters. Fishes with deep-water characteristics have been found in
the fourth area. In the Gulf of Thailand, small pelagic fishes are ubiquitous. The most important pelagic
species in the catch of a series of trawl surveys from 2000 to 2003 were Atule mate, Decapterus
maruadsi, and Selaroides leptolepis. The description of biology of fishes in the below part is originated
from a bottom trawl survey in the Southeast and Southwest waters of Viet Nam in December 2000.
Atule mate
The lengths of Atule mate caught during trawl surveys conducted in the southeast and southwest areas
in December 2000 ranged from 7 to 20cm. The mean length was 14.9cm. Total biomass of this species
was estimated to be 2,747 tonnes (Q=1) with a CV of 58%. The gonads of 208 fishes (72.6%) were in
the resting phase for both sexes (December 2000).
Atule mate
%
n=958
30
M ean=14.9
25
20
15
10
5
0
7 8
9 10 11 12 13 14 15 16 17 18 19 20
Fl (cm)
Figure 2
The length frequency distribution of Atule mate caught during trawl surveys
conducted in southeastern and southwestern areas of Viet Nam during December
2000.
Selaroides leptolepis
The catch of this species contributed 3% of the total catch during the 2000 trawl survey. The total
biomass was estimated to be 8,168 tonnes with a CV of 59%. The catch was mainly taken in depths
from 20 to 100m. The highest biomass was observed in the 30 to 50m depth range (6,257 tonnes). The
length frequency of 1,788 measured fishes ranged from 6 to 16cm, with a mean length of 11.9cm.
Reversing Environmental Degradation Trends in the South China Sea and Gulf of Thailand
16 NATIONAL REPORT ON FISHERIES VIET NAM
There were no juvenile fish observed in the exploited stock during this period, with 49.7% of studied
gonads in the resting stage (II). Approximately 38% of fish gonads were at gonad stage (III) and 11.4%
of the surveyed population were ripe stage, indicating that a part of the stock was going to spawn soon.
Decapterus maruadsi
This species contributed 1.25% to the total catch volume during the survey period. Total biomass was
estimated to be 2,288 tonnes with a CV of 63%, with the main catches being taken in waters deeper
than 30m. Lengths ranged from 13 to 22cm, with a mean length of 15.4cm. The 15cm length class
dominated catches of this species. According to the analysis of gonads from 265 individuals,
approximately 13.6% of the catch were juveniles. The main part of the stock was in resting stage
(75.8%) for both sexes. A few female were ripe and at the spawning stage (2.3%). The gonads of the
remaining fish were developing.
2.2.3 Demersal fish species
The demersal resources of Vietnamese waters can be divided into two groups: (1) coastal resources;
and (2) deep sea resources. The first group, including Lutianidae, Mullidae, Nemipteridae,
Pomadasssyidae, Synodidae, and Priacanthidae, are mainly targeted with bottom trawls. Most fishes in
the second group are of low economic value, including Myctophidae, Scorpaenidae, Chimaeridae and
Lophiidae.
In the surveys conducted in December 2002, in southeastern waters and the Gulf of Thailand, the
dominant species were Upeneus bensasi, Trachinochephalus myops, Saurida undosquamis, Saurida
tumbil, and Priacanthus macracanthus. The key biological information collected for these species
during the survey is presented below.
Upeneus bensasi
This species contributed 7.21% to total catch. The biomass of this species was estimated to be 14,240
tonnes with a CV of 51%. The main catch was derived from waters deeper than 30m in southeastern
waters and 50m in southwestern waters. Lengths ranged from 6 to 18cm, with a mean length of
10.4cm.
Analysis of gonads revealed that approximately 22% of the catch was juvenile. More females were
developing or ripe (30.8%) as compared to males (2.4%).
Trachinocephalus myops
This species contributed 5.83% to total catch. The biomass of the species was estimated to be 10,761
tonnes with a CV of 40%. The main catch was derived from waters deeper than 30m. The lengths of
2,115 individual fishes ranged from 7 to 39cm, with a mean length of 16.2cm. The length frequency
distribution peaked firstly at 12cm and secondly at 24cm.
Analysis of gonads revealed that approximately 9.9% of the catch was juvenile. Generally, a higher
percentage of males were developing or ripe (37.0%) as compared to females (28.5%).
Saurida undosquamis
This species contributed 5.56% to total catch. The biomass of the species was estimated to be 10,575
tonnes with a CV of 40%. The main catch was derived from waters deeper than 30m. Lengths ranged
from 6 to 49cm, with mean length of 16.8cm. Analysis of length frequency enabled to identification of at
least two cohorts in the catch. The smaller sized cohort dominated the catch.
Analysis of gonads revealed that approximately 12.5% of the catch was juvenile. There were a higher
proportion of males than females with gonads in the resting (II) and developing stages (III). Generally,
16% of both sexes were ripe. There was no fish in the spawning stage during the time of the survey.
Saurida tumbil
This species contributed 2.02% to total catch. Lengths ranged from 7 to 48cm, with a mean length of
17.9cm.
Analysis of gonads revealed that both sexes were mainly in the gonad resting stage (54.7%).There
were about 26.7% in developing stage, and 9.3% in the ripe stage. Approximately 9.3% were juvenile.
There were no fish in spawning condition, indicating that the survey period did not align with the
spawning season for this species.
Reversing Environmental Degradation Trends in the South China Sea and Gulf of Thailand
NATIONAL REPORT ON FISHERIES VIET NAM 17
Priacanthus macracanthus
This species contributed 5.16% to the total catches during the survey. Lengths ranged from 5 to 30cm,
with a mean length of 17.7cm. The length group from 17 to 19 cm dominated the catch.
The results of gonad analysis indicate that 3.3% were juvenile. Most of the catch was in the gonad
resting stage (57.9%). Females appeared to reach active stage sooner than the male (11.2% for female
and 4.6% for male). There were no fish in spawning stage (V) observed during the survey.
2.2.4 Commercially exploited invertebrates
Loligo chinensis
According to the trawl surveys conducted during 2000, this species contributed 2.84 % to total catches.
The biomass was estimated at 5,642 tonnes with a CV of 31%. The length frequency distribution of 726
individuals is provided in Figure 3. Mantle lengths ranged from 6 to 33cm, with mean length of 13.2cm.
N
Loligo chinensis
100
N=726
90
Mean = 13.2
80
70
60
50
40
30
20
10
0
6
8
10
12
14
16
18
20
22
24
26
28
30
32
ML(cm)
Figure 3
The Length frequency distribution of Loligo chinensis caught during trawl surveys
conducted in southeastern and southwestern areas of Vietnamese water in
December 2000.
Metapenaeus affinis
Length frequency data were collected monthly from the commercial trawl fishery (fleet <45 hp) in 1997.
The length of female of Metapenaeus affinis ranged from 6 to 33cm, with a mean length of 13.2cm.
3.
THREATS & CURRENT STATUS
3.1
Status of the fishery in terms of CPUE
As shown in Table 16, annual mean catch rate per horsepower has declined rapidly year by year. The
reason for that could be overexploitation in the near shore waters, where most of fishing boats
harvesting in.
Reversing Environmental Degradation Trends in the South China Sea and Gulf of Thailand
18 NATIONAL REPORT ON FISHERIES VIET NAM
Table 16 The number of fishing boats, total horsepower, landings, and catch rate in Viet Nam
from 1981 to 2002.
Year
No of motorised
Total Horsepower
Landings
Catch rate
fishing boats (units)
(hp)
(tonnes)
(Tonnes/hp/Year)
1981 29,584
453,871
419,470
0.92
1982 29,429
469,976
475,597
1.01
1983 29,117
475,832
519,384
1.09
1984 29,549
484,114
530,650
1.10
1985 29,323
494,507
550,000
1.11
1986 31,680
537,503
582,077
1.08
1987 35,406
597,022
624,445
1.05
1988 35,774
609,317
622,364
1.02
1989 37,035
660,021
651,525
0.99
1990 41,266
727,585
672,130
0.92
1991 43,940
824,438
730,420
0.89
1992 54,612
986,420
737,150
0.75
1993 61,805
1,291,550 793,324
0.61
1994 67,254
1,443,950 878,474
0.61
1995 69,000
1,500,000 928,860
0.62
1996 69,953
1,543,163 962,500
0.62
1997 71,500
1,850,000 1,078,000
0.58
1998 71,779
2,427,856 1,130,660
0.47
1999 73,397
2,518,493 1,212,800
0.48
2000 75,928
3,185,558 1,280,591
0.40
2001 78,978
3,722,577 1,347,800
0.36
2002 81,800
4,038,365 1,434,800
0.35
Source: The Implementation of Work plan 2002 and Fishery Socio-Economic Development Plan 2003, Ministry of Fisheries
(2003).
Pelagic resources
There was no comprehensive acoustic survey carried out in Vietnamese waters during the decade prior
to late 2003. Recently, the Government of Viet Nam has provided support to the Research Institute for
Marine Fisheries for a three-year acoustic project, which is still in its initial stage. The major gears used
to exploit small pelagic resources are purse seine, drift gill net, and high opening bottom trawl. So far,
the status of these resources has not been updated by scientific surveys. However, the project
Assessment of the Living Marine Resources in Viet Nam (ALMRV) established an enumerator-sampling
programme in 1996 aimed at collecting data from commercial fisheries along Viet Nam's coastline.
Table 17 shows the mean catch rate of the purse seine and drift net fleets by area from 2000 to 2002.
According to these figures, the mean catch rate (kg/day) of many fleets seems to have significantly
decreased over time. Catch rate has decreased more than half in some horsepower classes and fleets
of drift gillnet boats. The catch rate of nearly all purse seine fleets has declined significantly. The most
serious problem has occurred in the fleet of 90 to 140hp class purse seine boats in the north (from
1324.2kg in 2000 to 447.9kg in 2002) and in the central region (from 1128.6kg in 2000 to 362.1kg in
2002).
Table 17
Mean CPUE (kg/day) of purse seine and drift gillnet fleets from 2000 to 2002.
Region Landing
Drift gillnet
Purse seine
year
20 20-45
46-89
90-140
>140
20-45
46-89
90-140
>140
North
2000 26.2 176.5
299.3
752.2
494.8
1324.2
1687.7
2001 24.3 43.4
200.0
323.6
133.3
867.3
2002 28.7 61.7
116.5
302.0
295.2
447.9
Center
2000 42.1
144.7 205.9 413.5
644.7
1128.6
2001 56.9
206.3 144.0 471.3
712.7
423.8
2002 41.8
207.3 95.7 205.4
344.4
362.1
Southeast
2000 56.7 272.8
193.2
317.6
117.1 951.4
958.5
1134.8
2001 45.4 108.6
264.9
313.4 667.5
738.1
867.3
2002 52.1 141.3
332.6
343.7 507.3
737.9
Southwest
2000 18.3 95.5
232.8 249.3
868.1
815.9 1191.9
2001 15.8 26.8
257.0 1358.2
2002 25.0 50.9
191.0 224.8
Source: Extraction from Vietfishbase, Enumerator Programme, Assessment of the Living Marine Resources in Viet Nam, 2003.
Reversing Environmental Degradation Trends in the South China Sea and Gulf of Thailand
NATIONAL REPORT ON FISHERIES VIET NAM 19
To update information regarding the relative abundance of large pelagic fishes, there have been two
gillnet surveys conducted each year since 2000 in central and south-eastern waters of Viet Nam during
the southwest and northeast monsoon seasons. In general, the mean catch per unit effort observed
during the two seasons was quite stable at a low value of more than 31kg/km of net (Table 18).
Table 18
Mean catch rate (kg/km of net) of large pelagic fish in gill net surveys conducted
from 2000 to 2002.
Year
Southwest monsoon season Northeast monsoon season (NE)
Total
(SW)
CPUE
CV (%)
CPUE
CV (%)
CPUE
CV (%)
2000
29.0 90 33.7
68
31.4
78
2001
41.8 93 30.9 134
36.7
109
2002
31.5 115 31.8
109
31.6
110
Source: Extraction from Vietfish Survey Database, Assessment of the Living Marine Resources in Viet Nam, 2003.
Demersal resources
According to Pham Thuoc (1993), during the decade after 1988, the density of demersal fish resources
in south-eastern waters declined by 93.7% in waters shallower than 30m, and by 60.57% in waters
deeper than 30m.
Figure 4 shows fluctuations in CPUE of the single trawl fleet (20 to 45hp) by area from 1996 to 2002. It
is noted this figure generated from Vietfish database, Enumerator Programme, Assessment of the
Living Marine Resources in Viet Nam includes only active boats.
CPUE (kg/h) of single trawl 20-45HP
30
25
20
/
h
15
kg
10
5
0
1996
1997
1998
1999
2000
2001
2002
North
Center
SouthWest
SouthEast
Figure 4
CPUE of the single trawl fleet (20 to 45hp) in northern (Gulf of Tonkin), central,
southeastern, and southwestern (Gulf of Thailand) waters of Viet Nam.
In the period from 2000 to 2003, a number of scientific trawl surveys (using the same boat and same
gear) were conducted in the Gulf of Tonkin, south-eastern and south-western (Gulf of Thailand) waters.
Table 19 shows the mean catch rate by area and depth stratum observed during these surveys. The
lowest catch rate (22.3kg/h) was derived from the Gulf of Tonkin in November 2001, with the highest
from south-eastern waters in November 2003 (1670.9kg/h).
Reversing Environmental Degradation Trends in the South China Sea and Gulf of Thailand
20 NATIONAL REPORT ON FISHERIES VIET NAM
Table 19
Mean CPUE observed during the surveys from 2000 to 2003.
CPUE (kg/h)
Depth stratum (m)
Gulf of Tonkin
May-01 Nov-01
20-30 57.6
22.3
30-50 73.2
101.2
50-100 113.3
95.6
100-200 77.7
97.1
CPUE (kg/h) in southeastern waters
May-00 Nov-00 May-02 Nov-02 Nov-03
20-30 62
25.4
39.4
47.5
81.1
30-50 77.9
60.7
52
49.1
144.1
50-100 65.9
87.4
53.4
72.6
211.2
100-200 187.5
107.5
65.2
141.8
221.7
> 200 m
1670.9
CPUE (kg/h) in the Gulf of Thailand
May-00 Nov-00 May-02 Nov-02 Nov-03
20-30 37.8
54.3
43.4
71.1
73.3
30-50 79.9
91.3
70.5
65.6
108.4
50-100 68.4
77.9
62.5
71
148.3
Source: Bottom survey technical reports, Assessment of the Living Marine Resources in Viet Nam, 2000 2003.
Shrimps
Shrimp trawling is an important fishing activity in the Gulf of Tonkin and the Gulf of Thailand. The most
important fleet targeting shrimp resources in northern waters are single trawlers of the 20 to 89hp class,
whilst in southeastern and southwestern waters the 20 to 45 and > 140hp classes are important. In the
Gulf of Thailand, shrimp mostly occur in waters less than 30m deep. The recent use of large boats
(> 90hp) to catch shrimp is believed to have caused severe degradation of the resource. In general, not
only the catch rate of shrimp has declined, the compositions of catches have changed. The catch rates
of high value shrimp, including white prawn and pink prawn, are low. The trend line indicates a clear
decrease in the catch rate of pink prawn in both the Gulfs of Tonkin and Thailand (Figure 5). The catch
rate of white prawn in these areas is not significant at all.
Reversing Environmental Degradation Trends in the South China Sea and Gulf of Thailand
NATIONAL REPORT ON FISHERIES VIET NAM 21
Figure 5
Mean CPUE of pink and white prawns in Vietnamese waters located within the Gulfs
of Tonkin and Thailand from 1996 to 2003.
3.2
Status of the fish stocks based on historical review of landings and CPUE
With the rapid development of fisheries during recent decades, it is believed that marine resources in
near shore waters are overexploited. The Government of Viet Nam has recently devoted much effort to
the redirection of fishing effort from coastal waters towards offshore waters. A number of studies and
surveys aimed at assessing the status of fisheries resources have been initiated in Viet Nam. Different
international donors have supported these efforts, and the results will be used to guide the development
of sustainable fisheries in Viet Nam.
3.2.1 Fish Resources
3.2.1.1 Species Composition
In the continental shelf areas of the northern and central regions, 301 and 260 species have been
identified, respectively. In the continental shelf areas of the southeast and southwest, 845 and 581
species have been identified, respectively.
There were 70 species belonging to 31 genus caught in gill nets during a survey conducted from
October to November 2002, with the dominant families being Carrangidae, Scombridae, and
Gemplydae. Table 20 highlights the five dominate species in the total catch in gill nets used during
surveys from 2000 to 2002. Katsuwonus pelamis always ranked first in terms of contribution to total
catch volume.
Table 20
Proportion (%) of the five dominant species in the total catch of gill net surveys
conducted in Vietnamese waters from 2000 to 2003.
Name
2000 2001 2002
NE SW NE SW SW NE
Katsuwonus pelamis
68.0 50.0 63.0 62.0 65.3 63.81
Mobula diabolus
5.5 6.9 8.5 15 4.6 4.8
Mobula japanica
1.,2 9 3.9 10.2 0.59
Thunnus albacares
3.2 6.4 4.6 1.7 3.04
Auxis thazard
6.7 2.7
3.3 1.68
Source: Bottom survey technical reports, Assessment of the Living Marine Resources in Viet Nam, 2000 2003.
Reversing Environmental Degradation Trends in the South China Sea and Gulf of Thailand
22 NATIONAL REPORT ON FISHERIES VIET NAM
Demersal fishes live near the seafloor and in communities comprised of a large number of other
species. Normally, trawl catches also consist of some small pelagic fish. No fish species has been
observed to dominate trawl catches across all areas and seasons. Table 21 shows the mean CPUE
and proportion of the top ten species caught in the trawl surveys conducted during both fishing seasons
of 2000 and 2001.
In the Gulf of Tonkin, Evynnis cardinalis was the most abundant in both seasons. In the southeast,
Paramonacanthus nipponensis was dominant during the southwest monsoon and Upeneus bensasi
dominated during the northeast monsoon. In the Gulf of Thailand, Loligo chinensis and Leiognathus
spp. were ranked first in the southwest and northeast seasons, respectively.
Table 21
Mean CPUE (kg/h) and proportion (%) of the total catch of top ten species by
season and area in Viet Nam.
Gulf of Tonkin
Southeast waters
Species name
% to total catch
Species name
% to total catch
SW 2001
NE 2001
SW 2000
NE 2000
Evynnis cardinalis
34.54
9.46
Paramonacanthus nipponensis
42.73
4.26
Loligo chinensis
8.16
3.70
Trachinocephalus myops
5.56
7.22
Acropoma japonicum
6.77
5.46
Upeneus bensasi
3.41
8.64
Trachurus japonicus
4.04
3.16
Loligo chinensis
3.24
2.71
Saurida tumbil
3.31
3.84
Pristotis jerdoni
2.88
1.66
Leiognathus spp.
2.63
5.04
Charybdis cruciata
2.52
1.44
Trichiurus lepturus
2.55
7.56
Priacanthus macracanthus
2.4
6.32
Charybdis cruciata
2.14
0.53
Saurida undosquamis
2.22
6.21
Decapterus maruadsi
1.70
2.22
Selaroides leptolepis
2.18
3.45
Lophiomus setigerus
1.38
0.99
Nemipterus bathybius
2.17
1.68
Gulf of Thailand
Species name
% to total catch
Species name
% to total catch
SW 2000
NE 2000
SW 2000
NE 2000
Loligo chinensis
7.8
3.32
Sepia esculenta
3.25
3.53
Leiognathus spp.
6.61
17.25
Lagocephalus inermis
3.11
2.35
Trichiurus lepturus
3.92
4.5
Paramonacanthus nipponensis
2.62
0.89
Selar crumenophthalmus
3.64
0.32
Nemipterus tambuloides
2.59
0.34
Loligo duvauceli
3.36
3.1
Apogon spp.
2.32
1.2
SW: Southwest monsoon season; NE: Northeast monsoon season
Source: Bottom survey technical reports, Assessment of the Living Marine Resources in Viet Nam, 2000 2003.
3.2.1.2 Fish distribution
The fisheries of Viet Nam clearly divide into two seasons: (1) the southwest monsoon (May to October);
and (2) the northeast monsoon (November to April). In the southwest monsoon, fishes tend to move
into shallow waters for spawning, and during the northeast monsoon, they move into deeper areas.
Normally, catch rates during the southwest monsoon season are higher than during the northeast
monsoon season. However, the quality of fish is usually better during the northeast winter season.
Figure 6 presents the CPUE distribution by fishing season as indicated from the trawl and gillnet
surveys conducted in 2000 and 2001.
Reversing Environmental Degradation Trends in the South China Sea and Gulf of Thailand
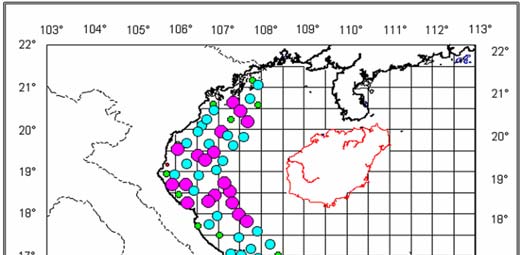
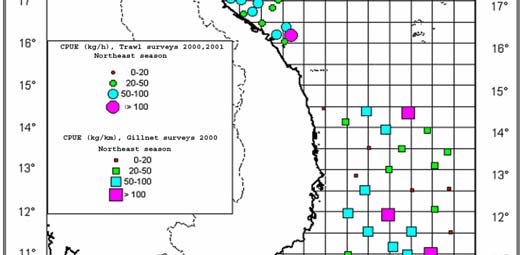
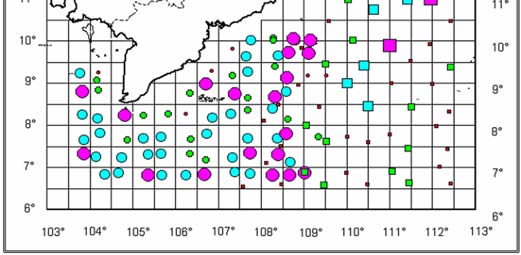
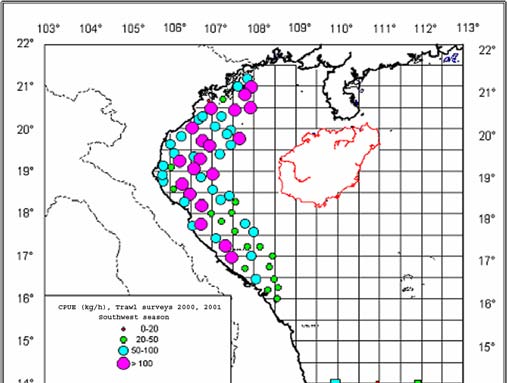
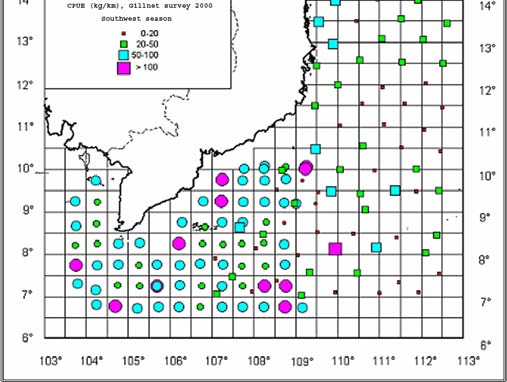
NATIONAL REPORT ON FISHERIES VIET NAM 23
Figure 6
CPUE distribution of trawls (kg/h) and gill nets (kg/km) during the southwest (right)
and northeast (left) seasons from the surveys conducted by ALMRV and the
Offshore Fisheries Project in 2000 and 2001.
3.2.1.3 Standing stock and potential yield.
It is necessary to note that Viet Nam was unable to undertake any comprehensive studies into small
pelagic resources for quite some time. Furthermore, there was no appropriate methodology for
estimating the biomass of the large pelagic fish stock. To obtain some knowledge regarding the relative
abundance of large pelagic fishes, gill nets and longlines have been used in scientific surveys.
According to Pham Thuoc (2000), the total standing stock of Viet Nam's marine fish was estimated at
3.3 to 3.5 million tonnes, resulting in 1.5 to 1.6 million tonnes of sustainable yield.
3.2.2 Shrimp resources
3.2.2.1 Species composition
There have been 225 shrimp species from 69 genera and 24 families found in Vietnamese waters. Out
of those, the 6 most important families are Penaeidae (59 species); Solenoceridae (12 species);
Nephropidae (3 species); Aristeidae (3 species); Palinuridae (9 species); and Scyllaridae (9 species).
From 2001, several surveys regarding shrimp resources were conducted in the Gulf of Tonkin, and the
southeast and southwest (Gulf of Thailand) waters in Southwest monsoon (SW) and Notheast monsoon
(NE) season. Table 22 shows the proportion of the most dominant families in the total catch of shrimp
during these surveys.
Reversing Environmental Degradation Trends in the South China Sea and Gulf of Thailand
24 NATIONAL REPORT ON FISHERIES VIET NAM
Table 22
Proportion (%) of the dominant shrimp families in the total catch of shrimp.
2001
2002
2003
Area Family
Name
SW
NE
SW
NE
SW
NE
Gulf of Tonkin
Penaeidae
-
-
17.87
9.60
9.32
13.46
Solenoceridae
-
-
0.82
1.54 0.39
-
Squillidae -
- 3.96 4.24 - 2.46
Total
-
-
22.64
15.38
9.70
15.92
Southeast waters
Penaeidae
-
-
14.02
13.12
-
-
Solenoceridae
-
-
0.41
-
-
Squillidae -
- 3.32 3.76 -
-
Total
-
-
17.74
16.88
-
-
Gulf of Thailand
Penaeidae
10.39
22.76
25.31
20.54
-
-
Solenoceridae 3.33
4.62
1.91
-
-
Squillidae
4.12 3.66 5.28 3.71 -
-
Total
17.84
31.04
32.50
24.26
-
-
The family of Penaeidae was found in all surveyed areas in both seasons. However, a major part of the
catch of this family was comprised of low value species. The contribution of high value shrimp of the
Penaeidae family to total catch was not significant.
3.2.2.2 Distribution and harvesting season
The family of Penaeidae is ubiquitous in Gulf of Tonkin waters less than 30 m deep. However, they are
typically more abundant in the Diem Dien-Tra Ly and Lach Bang-Lach Quen estuaries, and waters of
Cat Ba-Do Son, Bai Tu Long Bay, and those adjacent to the Mi andMieu Islands. The species of
Thenus orientalis of the family of Scyllaridae is mostly found at depths less than 50 m during both
monsoon seasons, while the species of Ibacus ciliatus maily distributes at depth beyond 25 m.
Species of the Penaeidae family are present throughout the year in coastal waters of the central region
at depths less than 50 m. However, they are typically less abundant than the species of the Scyllaridae
family. Ibacus ciliatus are abundant in this area at depths greater than 50 m during the dry season. The
harvesting of shrimp in waters of the central region mostly occurs during the dry season.
The Penaeidae family and Thenus orientalis are relatively abundant in southeastern and southwestern
waters throughout the year. Significant areas for shrimp in southern Viet Nam include the area from
Cung Hau to An Dinh estuaries, Anh Dong-Nam Du waters (Kien Giang province), the northwest area
of Hon Chuoi Island (Ca Mau province), and waters adjacant to Phu Quy Island.
In 1986, Pham Thuoc, in his PhD thesis mapped the key grounds of Penaeidae shrimp in Vietnamese
waters (Figure 7).
Reversing Environmental Degradation Trends in the South China Sea and Gulf of Thailand
NATIONAL REPORT ON FISHERIES VIET NAM 25
Figure 7
The key ground of Penaeidae shrimp in Vietnamese waters.
3.2.2.3 Shrimp stock and potential yield
Table 23 presents the biomass and potential yields of commercially important shrimp and lobsters in
Vietnamese waters.
Reversing Environmental Degradation Trends in the South China Sea and Gulf of Thailand
26 NATIONAL REPORT ON FISHERIES VIET NAM
Table 23 Biomass and potential yields of selected shrimp and lobsters in Vietnamese waters.
Area Depth
Name Biomass
Potential yield
(m)
(tonnes)
(tonnes)
Gulf of Tonkin
< 30
Penaeidae 1,408 704
Scyllaridae 152 48
> 30
Thenus orientalis
278
Scyllaridae 321
101-117
Central
<50
Penaeidae 1,200 600
waters
Scyllaridae 1,506 550
> 50
Penaeidae 1,100 402
Scyllaridae
14,793-16,175
5,399 5,904
Nephropidae 319 116
Southeastern
< 30
Penaeidae 3,983 1,946
waters
Scyllaridae 4,344 1,586
> 30
Penaeidae 1,012 369
Scyllaridae
13,220-15,373
4,825 5,611
Nephropidae 614 224
Southwestern
< 30
Penaeidae 3,383 1,691
waters (Gulf of
Scyllaridae 5,461 1,993
Thailand)
> 30
Scyllaridae
1,858 3,799
678 1,378
Source: The resources of shrimp, lobsters and cephalopod resources in Vietnamese waters: status and conservation
methods, Pham Ngoc Dang, Nguyen Cong Con, 1995.
The families of Penaeidae and Scyllaridae are the most important in terms of distribution and bundance
in Vietnamese waters.
3.2.3 Cephalopod
3.2.3.1 Species composition
In Vietnamese waters, 53 cephalopod species have been identified. Among them, one species belong
to the class Nautiloidea, whilst the remaining 52 species belong to 12 genera from 6 families (Pham
Ngoc Dang and Nguyen Cong Con, 1995). There are 12 species with high economic value:
Sepioteuthis lessoniana; Loligo chinensis; L. duvauceli; L. edulis; L. singhalensis; Sepia pharaonis; S.
aculeate; S. lycidas; S. esculenta; Sthenoteuthis oualaniensis; and Octopus vulgaris.
3.2.3.2. Distribution and harvesting season
Cephalopod resources are mainly distributed in the waters of the Gulf of Tonkin and southern Viet Nam.
The oceanic flying squid is found in offshore waters of the central region.
Spawning season of squid
Squid (Loliginidae) usually spawn during summer from April to September, with peak spawning
occurring during July and August. Cuttlefish (Sepiidae) usually spawn during winter from December to
March.
Harvesting season
Squid is mainly caught in waters of the Gulf of Tonkin and southern Viet Nam during the southwest
monsoon season (May to October). The gears used include squid hand line, stick-held falling net, purse
seine, lifting net with light, and trawls. Squid hand lines are mostly used in waters adjacent to small
islands and coral reefs. Cuttlefish are targeted from October to March, mainly with trammel nets. The
key grounds are:
- Co To-Cat Ba, Long Chau-Bach Long Vi waters
- Hon Me, Hon Mat waters
- Qui Nhon coastal waters
- Phu Yen: from Dai Lanh to Cha La Island (Van Phong Bay).
- Khanh Hoa: from Nha Trang to Ca Na
- Phan Thiet: from off Mui Ne to Phu Quy Island
- Vung Tau: off Vung Tau, southeastern waters of Con Son Island
- Ca Mau: northwest and southeast of Hon Khoai Island
- Kien Giang: north and nouthwest of Phu Quoc
Reversing Environmental Degradation Trends in the South China Sea and Gulf of Thailand
NATIONAL REPORT ON FISHERIES VIET NAM 27
Flying Squid is harvested from May to November using squid hand lines.
3.2.3.3 Standing stock and potential yield
The standing stock of cephalopods in Vietnamese waters was estimated at 100,000 to 104,000 tonnes
with a potential yield of 45,000 tonnes (Vu Huy Thu and Pham Thuoc, 2003). This figure does not
include the flying squid resource.
Table 24
The biomass and potential yield of squid and cuttlefish in Vietnamese waters.
Water areas
Biomass (ton)
Potential yield (ton)
Tonkin Gulf
13,500-14,000
Central waters
33,000-35,000
Southeast and Southwest waters
54,400-55,000
Total 100,900
-
104,000
45,000
Source: Guidelines on exploitation and protection of the marine resources of Viet Nam, Vu Huy Thu and Pham Thuoc, 2003.
3.3
Threats
3.3.1 Current threats
3.3.1.1 Environmental problems caused by fishing activities
The practice of releasing waste like garbage, human waste, and petrol sludge directly from fishing
boats into the sea is quite common. In addition to this, oil leaking from boats also contributes to
pollution at fishing ports and landing places.
A survey conducted at the fishing harbours of Cat Ba, Bach Long Vi, Do Son, and Diem Dien in
northern Viet Nam indicated that oil pollution is a common problem. The lowest level of oil pollution was
observed at Bach Long Vi fishing harbour (0.10mg/l), whilst the highest was at Cat Ba (0.28mg/l).
However, oil concentrations in both places exceed Viet Nam's standard for coastal water quality
(Quality standards of sea water of Viet Nam 5943, 1995). This situation has the potential to hinder the
development of fisheries resources.
3.3.1.2 Environmental problems caused by aquaculture
Aquaculture has the potential to contribute to the degradation of wild fisheries resources and the
environments upon which they depend.
Discharges of untreated wastewater and the remains of trash feed fish from aquaculture facilities into
Viet Nam's coastal waters can potentially cause disease in populations of wild marine fish species.
Mangroves play very important roles in fisheries. At the most basic level, the primary production of
mangroves supports numerous forms of wildlife and avifauna, including estuarine and coastal fisheries.
Around 90% of marine species depends on mangroves for at least one part of their lifecycle. However,
mangrove and other littoral areas continue to be destroyed in Viet Nam for the development of facilities
associated with the aquaculture of shrimps, clams, ark-shells, and crabs (Table 25).
Table 25
The area of mangroves converted for the aquaculture of ark-shell, clam and crab in
the Mekong Delta of Viet Nam from 1995 to 2000 (ha).
Cultured
species
1995 1996 1997 1998 1999 2000
Blood
ark-shell
1,494 1,319 1,626 2,250 3,718 4,919
Clam
3,425 1,905 3,155 5,105 6,053 7,734
Crab
1,270 239
1,243 513 420 307
Total
6,189 3,513 6,124 7,868 10,191 12,960
Table 26 highlights the area of mangroves in some southern provinces that have been cleared for the
development of shrimp aquaculture facilities.
Reversing Environmental Degradation Trends in the South China Sea and Gulf of Thailand
28 NATIONAL REPORT ON FISHERIES VIET NAM
Table 26 The area of mangrove forests used for shrimp culture in selected provinces of
southern Viet Nam.
No. Province
Area (ha)
1998 1999
2000
1 Ca
Mau
37,143
41,000
45,000
2 Ben
Tre
3,250
3,650
4,213
3 Soc
Trang
1,560
1,980
2,072
4 Kien
Giang
598
650
850
The continuing degradation of mangroves will not only reduce terrestrial and aquatic production and
wildlife habitats, but will also seriously affect the environmental stability of coastal forests. These
forests have been effective buffers between the sea and inland agricultural areas and villages.
Presently, the restoration of mangrove forest ecosystems is a primary concern of the Government of
Viet Nam. A mangrove rehabilitation programme has been launched in many coastal provinces.
Recently, Bac Lieu province has planted 1,100 to 1,200ha of new mangrove forests each year. Its
neighbouring province of Ca Mau has carried out 7 mangrove restoration projects. Ben Tre province
plans to increase mangrove forest area in that province to 10,416ha after the year 2000, including
2,273ha combined with aquaculture. In northern Viet Nam, thousands of hectares of mangroves have
recently been planted in Hai Phong, Thai Binh, and Nam Dinh provinces.
3.3.1.3 Environmental problems caused by fisheries logistics supplies and processing plants
The majority of logistical suppliers and fish processing facilities are located along the coast or adjacent
to estuaries. Among them, only a few facilities treat wastewater prior to its release into coastal waters.
Small-scale processing facilities, which do not usually treat waste, are one of the main causes of
pollution in the water bodies into which they release wastes.
The amount of solid wastes is equivalent to 35 to 40% of raw materials. Liquid wastes are
estimated at 1.5 to 2 billion m3/year, including the water used for washing raw materials, and
wastewaters pressed from fishmeal.
3.3.1.4 Destructive fishing
According to incomplete statistics from 1998 to 2000, Viet Nam's inter-sectoral surveillance force
uncovered 149 cases involving the illegal transportation and trading of explosives; 843 cases of
explosives use; 19,658 cases involving the use of electric pulses; and 106 cases involving the use of
poisons in fishing. Exploitation of corals for sale to tourists or cement factories is a large problem in
central Viet Nam.
To overcome this problem, the Government of Viet Nam has introduced strong management measures,
including: the issuing of legal regulations stipulating desired fishing behaviours; establishing inspection
committees for the control of destructive fishing in important provinces; and surveillance and monitoring
activities. The Government also devotes a lot of effort to an awareness and education programme,
which involves training, TV messages, newsletters, posters, and magazines.
3.3.1.5 Over-fishing
It is generally believed that there are indications of over-fishing in the coastal waters of Viet Nam, as
approximately 80% of Viet Nam's total catch is derived from these waters. The catch rates and size of
fishes have declined over recent years. The composition of catches have also changed, with large
declines in the representation of high value species such as silver pomfret, grouper, snapper, and
prawn in landings.
3.3.2 Potential threats
3.3.2.1 Projected market demand
The export value from fishery products of Viet Nam has rapidly increased. Especially, when Viet Nam
becomes an official member of the World Trade Organisation, there will be more markets opening to
Reversing Environmental Degradation Trends in the South China Sea and Gulf of Thailand
NATIONAL REPORT ON FISHERIES VIET NAM 29
Viet Nam. It is also expected that domestic demand for fish products will increase in line with general
increases in per capita income in Viet Nam. Similarly, the government has recently established
favourable policies to assist fishers and fish-farmers, including soft loans and low taxes, fisheries
infrastructure improvement projects, and technology development. This setting may lead to the
unsustainable development of fisheries in the case of ineffective fisheries management. Some species,
including anchovy, lobster, and prawn, are fully or overexploited. High demand situations will give such
species little chance to recover.
3.3.2.2 Increased coastal population
Coastal Viet Nam is 1.3 times more populated than the average for the whole country. Similarly, annual
population growth in coastal provinces is higher than other areas, creating a need for finding more
employment opportunities, such as those associated with fisheries.
4.
HABITATS AND AREAS OF IMPORTANCE IN THE MAINTENANCE OF EXPLOITED FISH
STOCKS
4.1
Physical, chemical, and biological characteristics of the spawning, nursery, feeding, and
fishing grounds
Based on geography, bathymetry, hydrodynamics, and climatic conditions, Vietnamese waters can be
divided into 4 areas:
Gulf of Tonkin
Water circulation
In summer (the southwest monsoon season), currents flow up along the coastline to the north of the
Gulf, exiting through the west coast of Hai Nan Island, creating a closed clockwise circulation. This
system forms an up-welling area of 60 nautical miles long along the west of the gulf from Ha Tinh to
Quang Binh. The current speed is low at approximately 10 to 15 cm/s. In winter (the northeast monsoon
season), this current reverses its direction. The currents in the whole area reach an average speed of
10 to 15cm/s.
Temperature
The water temperature in the Gulf of Tonkin fluctuates widely throughout the year from 16 to 23oC in
winter and 28 to 31oC in summer.
Salinity
The salinity ranges from 27.0%o to 32.0%o and from 32.0%o to 33.5%o in summer and winter,
respectively.
Plankton
In general, the average zooplankton biomass in the Gulf of Tonkin is higher than that in central and
southeastern waters with an average biomass ranging from 80 to 120mg/m3.
Central waters
Water circulation
The hydrological regime in this area is controlled by a distinct offshore hydrological regime. In summer,
from the latitude of 160N to 180N, inflow water partly goes into the Gulf of Tonkin, partly flows parallel to
the shore to the south. Upon reaching 100N to 110N, the direction of the current changes to and
northwest to southeast direction. Further from the shore, the current flows parallel to the line if latitude
until reaching the longitude of 1110E, where the current flows in a south to north direction, or in an
opposite direction to the coastal current.
The mean speed of currents in summer in this region is usually between 30 and 40cm/s, occasionally
peaking at 75cm/s.
The formation of currents in winter is similar to that in summer, however, its average speed increases to
70cm/s, with a maximum of 150cm/s.
Reversing Environmental Degradation Trends in the South China Sea and Gulf of Thailand
30 NATIONAL REPORT ON FISHERIES VIET NAM
Temperature
During summer, water temperature ranges from 27 to 30oC, and during winter, it ranges from 25oC to
28oC.
Salinity
Marine water salinity in the central region is very stable, with little difference between summer and
winter. Salinity tends to fluctuate from 31.5%o to 34.5%o throughout the year.
Plankton
Zooplankton biomass in waters of the central region is relatively low, with an average concentration
ranging from 20 to 40mg/m3.
Southeast seawaters
Water circulation
The coastal waters of the southeastern region are shallow and the seafloor is flat. In summer, the
coastal hydrological regime is dominated by water from coastal rivers and streams. Coastal currents,
which are largely influence by river water, flow in a northwest to southeast direction. The speed of the
current is quite low, ranging from 10 to 15cm/s.
During winter the current in eastern waters of this region appears to be a continuation of the current
dominating the central region, flowing in a north to south direction, with a mean speed ranging from 20
to 30cm/s. In the western area, currents flow in a northeast to southwest direction. Around Con Son
Island, there is a small orthodromic whirlpool, and a large antidromic whirlpool appears in the area of
Cu Lao Thu Island. The current speed in the coastal area ranges from 15 to 20cm/s.
Temperature
Water temperature fluctuates from 29oC to 30oC in summer, and 25 oC to 27oC in winter.
Salinity
In this region, salinity is stable, except in estuarine areas, where salinity decreases by 2 to 3% during
the rainy season.
Salinity ranges from 29.0% to 33.0%o and 33.75%o to 34.0% in the rainy season and dry season,
respectively.
Plankton
According to an extensive time series survey, average biomass of zooplankton in this area is similar to
the central region. The average zooplankton biomass in the coastal estuary of fishing grounds 9 and 13
ranges from 40 to 80mg/m3, whilst that in the estuary of fishing grounds 11 and 12 ranges from 20 to
40mg/m3.
Gulf of Thailand
Water circulation
In summer, the northwest to southeast current flows partly into the southeast area and partly into the
Gulf of Thailand near the Ca Mau Cape.
Temperature
Water temperature is stable throughout the year. It ranges from 29 to 30oC in the rainy season and from
26 to 28oC in dry season.
Salinity
In the rainy season, mean salinity values at surface and bottom layers are observed at 27.0% to 27.4%
respectively. During the dry season, mean salinity are 32.0 and 33.5% for the said layers.
Plankton
The highest zooplankton biomass has been observed in fishing ground 15 in the Gulf of Thailand. Here,
zooplankton biomass ranges from 120 to 160mg/m3. Fishing ground 14 (Figure 8) has an average
zooplankton biomass ranging from 80 to 120mg/m3.
Reversing Environmental Degradation Trends in the South China Sea and Gulf of Thailand
NATIONAL REPORT ON FISHERIES VIET NAM 31
4.1.1 Spawning and nursery grounds of fish, shrimp
Studies of fish eggs and larvae are used to identify fish spawning and nursery grounds. Before 1985,
this was a key area of investigation in many surveys conducted in Viet Nam's northern and
southeastern waters. From the mid 1980s through to the 1990s, this area received little attention until
the Southeast Asian Fisheries Development Center (SEAFDEC) conducted some analyses on eggs
and larvae in 1999. The Vietnamese Research Institute for Marine Fisheries also completed a number
of surveys in 2002 and 2003. However, these efforts have mainly focused on the Gulf of Tonkin, and
waters of the central and southeastern regions. A paucity of information exists for the Gulf of Thailand.
Typical of tropical fish fauna, marine fishes in Viet Nam spawn throughout the year round and in all
waters. We will now consider fish spawning and nursery grounds based on studies on eggs and larvae
in specific areas of Viet Nam.
Gulf of Tonkin
Although eggs and larvae scatter over the Gulf of Tonkin, there are five areas where spawning is
concentrated: (1) from Co To to Ha Mai Island; (2) around Bach Long Vi Island; (3) coastal waters from
Cat Ba Island to the Ba Lat estuary; (4) from Ninh Co to Lach Ghep estuaries; and (5) coastal waters
from Dien Chau Gulf to the Cua Viet estuary.
More fishes tend to spawn from March to September. However, peak spawning occurs from April to
June.
In a survey conducted from August to September 2003 (Do Van Nguyen 2004), the highest density of
fish eggs and larvae was found in the area from Cat Ba to Long Chau Islands, with 6,000 to 9,000
eggs/1,000m3. In the southern part of the Gulf, densities ranged from 9,000 to 22,900eggs/m3. The
highest larval densities, observed in the southern Gulf area, ranged from 3,000 to 12,000 larvae/
1000m3. The analysis of eggs indicated that the dominant families were Engraulidae (17.08%),
Synodontidae (5.48%), and Clupeidae (2.01%). The dominant families in term of larvae were
Scombridae (16.56%), Clupeidae (14.29%), and Leiognathidae (12.15%). In the survey conducted from
October to November 2003 (Do Van Nguyen 2004), the areas with highest concentrations of eggs and
larvae were Cat Ba and Bach Long Vi Islands, as well as the southern part of the Gulf (more than 1000
eggs or larvae/1,000m3). A counting of egg and larvae by Do Van Nguyen indicated that the family of
Engraulidae ranked first (50.14 and 59.04%, respectively). Other dominant families were Synodontidae,
Synoglossidae, Gobiidae and Leiognathidae.
Central waters
In waters of the central region, there is no typical spawning ground. Eggs tend to be scattered along the
coastline or adjacent to river estuaries, whilst the distribution of fish larvae extends a little further
offshore. In this area, it seems more fishes spawn from April to September, with peak spawning activity
occurring from May to July.
According to a survey conducted from April to May 2003, the dominant families were Excoetidae
(19.11% of total eggs and 35.70% of total larvae), Scombridae (13.75% and 24.40% eggs and larvae,
respectively) (Do Van Nguyen 2003). The eggs and larvae were scattered throughout the area.
However, densities were highest (more than 500 eggs or larvae/1000m3) in waters adjacent to Danang,
the Paracels archipelagos, as well as more southern waters. The composition of eggs and larvae
observed in the survey from October to November 2003 differed slightly (Do Van Nguyen 2003).
According to the number of total eggs, the family of Clupeidae ranked first (41.62%) and Scombridae
(8.67%) second. The larvae of Myctophidae (35.08%) and Scombridae (7.52%) were dominant.
Southeastern waters
According to historical data (Do Van Nguyen 1981 and 1999), there are three main spawning grounds:
(1) around Cu Lao Thu Island; (2) around Con Son Island; and (3) coastal waters from Phan Thiet
province to Ca Mau Cape. In general, the spawning season in this area is longer than that observed for
the Gulf of Tonkin, and can be divided into two groups:
-
Migratory fishes, such as tuna and flying fish, tend to spawn more from April to September in
the coastal waters between Quang Ngai to Khanh Hoa provinces.
-
Commercially important inshore fish species spawn from February to March until October to
November. They may spawn 3 to 4 times during this season.
Reversing Environmental Degradation Trends in the South China Sea and Gulf of Thailand
32 NATIONAL REPORT ON FISHERIES VIET NAM
The data available from recent SEAFDEC surveys (Do Van Nguyen, 1999), conducted from 30 April to
29 May 1999, indicate that the area with the highest concentration of fish eggs (>1,000 eggs/1,000m 3)
is that from Phu Quy Island to the Mekong revers estuaries. The concentration of larvae was highest in
waters extending from the Mekong estuaries to Con Son Island. According to egg counts, the dominant
families were Engraulidae, Synodontidae, Cynoglossidae, and Clupeidae. Families of Engraulidae,
Leiognathidae, Gobiidae, Carangidae, Mullidae, Scombridae, and Nemipteridae dominated according to
larvae quantities.
4.1.2 Fishing grounds
According to the study, "Characteristics of Viet Nam Fisheries Resources, Biomass, and Potential
Yield" (Pham Thuoc, 1981 to 1985), there are 15 main fishing grounds in Vietnamese waters. Most of
these are located in coastal waters, close to islands, and in waters less than 200m deep. There are only
3 offshore fishing grounds. These are located in central and southeastern waters. Based on location,
the fishing grounds can be grouped into four areas:
Gulf of Tonkin: Fishing ground numbers 1 to 3.
Fishing Ground Number 1:
This fishing ground includes the area adjacent to Bach Long Vi Island, with a maximum depth of 50m.
The main fishing season is from June to August. The dominant species caught in this area include
round scad (Decapterus maruadsi), lizardfish (Saurida tumbil), threadfin bream (Nemipterus spp.),
bensasi goatfish (Upeneus bensasi), and spined red bream (Argyrops swainson).
Fishing Ground Number 2:
This fishing ground is located in the centre of the Gulf of Tonkin, with a depth of 50m. The main species
caught in this area include spined red bream (Argyrops swainson), round scad (Decapterus maruadsi),
bensasi goatfish (Upeneus bensasi), yellow goatfish (Upeneus sulphureus), and threadfin bream
(Nemipterus spp.).
Fishing Ground Number 3:
This fishing ground is located in the southern part of the Gulf of Tonkin near Hon Me-Hon Mat Islands,
where water is approximately 20m deep. The major species caught include goatfish (Upeneus spp.),
lizardfish (Saurida tumbil), threadfin bream (Nemipterus spp.), and malabar jack (Caranx malabaricus).
Central waters: 5 fishing grounds, including 3 coastal and 2 offshore areas.
Fishing Ground Number 4:
The depth of Hon Gio (Thuan An) fishing ground ranges from 45 to 70m. The main fishing season is
from April to July. The main species caught in this area include threadfin bream (Nemipterus spp.),
goatfish (Upeneus spp.), lizardfish (Saurida tumbil), coastal trevally (Carangoides caeruleopinnatus),
and gray emperor (Gymnocranius griseus).
Fishing Ground Number 5:
This fishing ground is located in waters to the northeast of Cu Lao Cham Island, with depths ranging
from 100 to 300m. The bottom substrate is sandy mud. The area of this fishing ground is approximately
1,306 square nautical miles (4,476km2). The main species caught include lizardfish (Saurida tumbil),
yellow tail scad (Atule mate), and goatfish (Upeneus spp.).
Fishing Ground Number 6:
This fishing ground is located northwest of Da Nang province. It runs in a southeast to northwest
direction, with water depths ranging from 50 to 200m. The main species caught in this area include
spined red bream (Argyrops swainson), croaker (Argyrosomus argentatus), yellow tail scad (Atule
mate), lizardfish (Saurida tumbil), and threadfin bream (Nemipterus spp.).
Reversing Environmental Degradation Trends in the South China Sea and Gulf of Thailand
NATIONAL REPORT ON FISHERIES VIET NAM 33
Figure 8 The main fishing grounds (as highlighted in green) in Vietnamese waters.
Source: Fish resources of Viet Nam seas: biological charateristics, biomass assessment and exploitation potentials, Pham
Thuoc, Schechin 1986 (PhD thesis).
Fishing Ground Number 7:
This underwater knoll "125" fishing ground is located in offshore waters adjacent to Da Nang province.
The knoll surface is only more than 5km2. It occurs at a depth of 215m, and the bottom consists of
organic sediments. The main species caught in this area include redlipped fish (Dipterygonotus
leucogrammicus) and small head hairtail (Trichiurus muticus).
Reversing Environmental Degradation Trends in the South China Sea and Gulf of Thailand
34 NATIONAL REPORT ON FISHERIES VIET NAM
Fishing Ground Number 8:
The "Margest-seamount" underwater knoll stretches in a southeast to northwest direction in offshore
waters adjacent to Qui Nhon province. It is 5.7km long and 1.1kms wide (total area is 6.37km2). The
water depth at the top of the mountain is 290 to 350m, with a slope of 2 to 3. This is a very good fishing
ground for trawl fishing.
Southeastern waters: Fishing grounds numbers 9 to 13.
Fishing Ground Number 9:
This underwater knoll fishing ground is located in offshore waters adjacent to Phan Rang-Phan Thiet.
Its geographical location is 11o15'N and 111o32'E. The knoll is 16 km long and 2.4km wide, with a total
surface area of a little more than 40km2. The water depth at the top of the mountain is 280m. The main
species caught is redlipped fish (Dipterygonotus leucogrammicus), which accounts for 62% of the total
catch in this area.
Fishing Ground Number 10:
This fishing ground is located east of Phan Thiet province. Its bottom is muddy-sand. The peak-fishing
season is from December to February. True lizardfish (Saurida undosquamis) is the main species and
can be caught throughout the year. Similarly, red bigeye (Priacanthus tayenus), round scad
(Decapterus maruadsi), and lizardfish (Saurida tumbil) are abundant in this area.
Fishing Ground Number.11:
This fishing is located south of Cu Lao Thu Island, with water depths ranging from 50 to 200m. This is
area is fishable throughout the year. However, winter is considered the peak-fishing season. Catch
rates decline during the rainy season (April to July). The main species caught include lizardfish (Saurida
undosquamis), red bigeye (Priacanthus macracanthus), greater lizardfish (Saurida tumbil), snapper
(Lutjanus sanguineus), and red goatfish (Upeneus bensasi).
Fishing Ground Number 12:
This fishing ground is located in the waters surrounding Con Son Island, with a fine sand and clamshell
bottom that occurs at depths from 25 to 40m. The peak-fishing season is from autumn to winter. The
main species caught in the area include round scad (Decapterus maruadsi), snapper (Lutjanus
sanguineus), lizardfish (Saurida tumbil), yellowtripe trevally (Selaroides leptolepis), goatfish (Upeneus
spp.), and threadfin bream (Nemipterus spp.).
Fishing Ground Number 13:
The fishing ground is located in the estuary of the Hau Giang River, with depths ranging from 10 to
22m. Fishing takes place in this area throughout the year. Fish are most abundant at the mouth of the
Hau Giang River. The main species caught include silver-spotted grunt (Pomadasys hasta), common
threadfin (Polynemus plebejus), sardine (Sardinella), coastal trevally (Carangoides caeruleopinnatus),
blotched croaker (Nibea maculata), and snapper (Lutjanus erythropterus).
Gulf of Thailand : Fishing grounds numbers 14 and 15.
Fishing Ground Number 14:
This fishing ground is located in the southwestern coastal waters of Viet Nam. Waters in this area are
only 10 to 15m deep. High catch rates are observed in this area throughout the year. The main species
caught is ponyfish (Leiognathus), which accounts for 70% of total catch. Other species include
yellowtripe trevally (Selaroides leptolepis), snapper (Lutjanus sanguineus), grunter (Theraponidae), and
threadfin bream (Nemipterus).
Fishing Ground Number 15:
This fishing ground is located in waters southwest of Phu Quoc Island. Waters in this area are only 10
to 15m deep. High catch rates are observed in this area throughout the year. The main species caught
include pony fish (Leiognathus) (25 to 30%), yellowtripe trevally (Selaroides leptolepis), snapper
(Lutjanus sanguineus), grunter (Theraponidae), and anchovy (Stolephorus spp).
Reversing Environmental Degradation Trends in the South China Sea and Gulf of Thailand
NATIONAL REPORT ON FISHERIES VIET NAM 35
4.2
Unknown issues such as stocks with undefined spawning grounds
Very few studies regarding spawning, nursery, and feeding grounds have been conducted in
Vietnamese waters, especially those located in the Gulf of Thailand. Therefore, spatial and temporal
variations in fish distribution and abundance, particularly in offshore areas and regarding pelagic fishes,
cannot be compared against any baseline information. In order to strengthen knowledge regarding the
status of resources, there is a need for the initiation of a comprehensive fisheries research programme.
4.3
Threats, current and potential
At present, there are a number of threats to spawning, nursery, feeding, and fishing grounds. These are
mainly associated with the rapid development of Viet Nam's coasts, including the establishment of a
number of new industrial zones, over population, deforestation, oil spills, and use of destructive fishing
gears.
4.3.1 Coastal development
The Government of Viet Nam's renovation policy, applied during the last 20 years, has resulted in a
large number of new factories, industrial zones, ports, aquaculture facilities, and tourism zones along
Viet Nam's coast. In general, waste treatment in most facilities is poor, leading to reductions in the
health of the ecosystems into which the wastes are released. Furthermore, the uncontrolled utilisation
of mangrove for the establishment of aquaculture facilities for has reduced the overall availability of this
valuable spawning and nursery habitat.
4.3.2 Pollution
The release of untreated water and waste into the sea is a growing problem, with negative impacts on
coastal ecosystems. The pollutants may come from industrial activities, agriculture, ports, and tourism
areas. They may include ammonia, oxygen-demanding contaminants, heavy metals, bacteria, viruses,
and toxic chemicals.
4.3.3 Oil spills
Oil spills in Vietnamese waters may occur because of activities associated with oil exploitation,
transportation, or leaking from ships and fishing vessels. The concentration of oil in waters adjacent to
large ports usually exceeds Viet Nam's standard (0.05-1mg/litre).
The combined discharges or leaks of oil from a large number of fishing boats can seriously pollute
fishing harbours or landing places. It is believed that this source contributes around 61.5 to 86.5% of
the total oil discharged into Viet Nam's coastal waters. A study carried out in a number of estuaries
located in the Gulf of Tonkin shows oil concentrations fluctuating from 0.18 to 2.01mg/l. In large ports,
including Hai Phong and Hon Gai, oil concentrations exceeded 1.0 mg/l. Generally, in highly polluted
areas, oil concentrations can exceed Viet Nam's allowable limit (Quality standards of sea water of Viet
Nam 5943-1995) by 333 to 670%. In the middle of Tonkin Gulf in August 1998, the concentration of oil
was 0.108 mg/l (about 36% of the limit).
Table 27 highlights the concentrations of oil recorded for southeastern waters from 1992 to 1995.
Table 27
Oil concentrations recorded in Viet Nam's southeastern coastal waters from 1992 to
1995.
Observation time
Concentration (mg/l)
% of the national
National limit
Minimum Maximum Average
limit
12/1992 0.025
0.320
0.178
59.3
12/1993 to 1/1994
0.397
0.660
0.175
158.3
5/1994 0.060
0.120
0.087
29.0
0.30
12/1994 0.030
0.218
0.105
35.0
3-4/1995 0.007
0.064
0.029
9.6
Reversing Environmental Degradation Trends in the South China Sea and Gulf of Thailand
36 NATIONAL REPORT ON FISHERIES VIET NAM
The coefficient of oil pollution represents the relationship between recorded oil concentrations and the
national limit (0.3mg/l). The coefficient of oil pollution in the coastal estuaries of northern Viet Nam is
provided in Table 28.
Table 28 The average coefficient of oil pollution in the coastal estuaries of northern Viet Nam.
Coefficient of oil pollution
Areas
1995 1996 1997 1998 1999 2000 2001
Cua
Luc
0.9 211 1.6 2.0 2.5 2.7 2.7
Bach
Dang
1.1 1.8 1.2 1.0 1.6 1.7 2.2
Ba
Lat
0.9 2.4 1.3 1.7 2.5 1.7 2.0
Sam
Son
0.5 2.0 1.3 2.6 1.7 2.0 2.0
The
whole
area 0.8 2.1 1.4 1.8 2.1 2.0 2.2
The figures presented in Table 28 indicate that oil pollution in these areas has increased over time. In
1995, oil pollution in the whole area was low. However, from 1996 to 2001, the coefficient of oil pollution
generally increased, fluctuating between 1.2 and 2.7.
4.3.4 Destructive exploitation
It appears that the further fisheries resources are degraded in Viet Nam, there are more fishers
employing illegal fishing methods. The most destructive fishing method in Viet Nam is dynamite fishing,
which leads to severe degradation of critical fisheries habitats, including coral reefs. The use of
intensive light and excessively small mesh sizes in fishing nets are also thought to be unsustainable
fishing practices in Viet Nam.
The extraction of coral from reefs for selling to tourists, or for cement production, has seriously
damaged fish habitats, especially in Khanh Hoa and Ninh Thuan provinces.
4.4
Ranking of habitats
4.4.1 Association with species of importance to food security
Fish is an important component in the diet of Vietnamese people. As a result, the consumption rate of
fish in Viet Nam is high and increasing. The goal of the Vietnamese fisheries sector is to increase its
annual total production to 3.4 million metric tonnes by 2010, including 1.4 million tonnes of marine fish
and 2.0 million tonnes of fish from aquaculture (Master Plan for Fishery Socio-Economic Development
to 2010, Research Institute of Fishery Economic and Planning, 2002). Catches from southern
Vietnamese waters make the greatest contribution to fisheries production in Viet Nam.
4.4.2 Association with high value species
The most important habitats for small pelagic fishes, including scads, herrings, and Indian mackerel,
are those of southern Vietnamese waters. Waters of the central region are most important for large
pelagic fish, including tuna, swordfish, sailfish, and dolphin fish. The coral reefs in the Gulf of Tonkin
(adjacent to Bach Long Vi Island), the central region (adjacent to Con Co, Paracels, and Spartly
Islands), and the southeast (adjacent to Cu Lao Thu Island), are critical habitats for demersal fishes,
including grouper and snappers. Lobsters mainly occur in waters of the central region from Quy Nhon to
Khanh Hoa provinces.
4.4.3 Association with endangered, rare and threatened species
The most important habitats associated with endangered, rare, and threatened species are river
mouths, coral reefs, sea grass, and seaweed habitats. In the Gulf of Tonkin, these habitats are located
in the Cat Ba, Ha Long, Bach Long Vi and Co To areas, and are inhabited by many endangered
species, including Clupanodon thrissa, Haliotis diversicolor, and other reef fishes. In the central region,
there are areas of seagrass important for turtles, dugong, sharks, and dolphins in waters extending
from Hue to Binh Thuan provinces.
Reversing Environmental Degradation Trends in the South China Sea and Gulf of Thailand
NATIONAL REPORT ON FISHERIES VIET NAM 37
Lobsters mainly live in reefs present in the waters adjacent to Phu Yen, Khanh Hoa, and Binh Thuan
areas. In the southern regions, the waters of the Mekong estuaries and the Phu Quoc Islands are
considered the most important for endangered, rare, and threatened species, including dugong, milk
fish, and sea horse.
Table 29 presents the distribution of endangered turtles in Viet Nam's marine waters. The critical area
in the Gulf of Tonkin is Cat Ba Island, whereas in the Gulf of Thailand, Phu Quoc and Tho Chu Islands
are important.
Table 29 The distribution of five endangered, rare, and threatened sea turtles in Viet Nam's
water.
Area
No of species
Scientific name
English name
Gulf of Tonkin
4
Chelonia mydas
Green turtle
Caretta caretta
Loggerhead turtle
Dermochelys coriacea
Leatherbackturtle
Eretmochelys imbricata
Hawksbill turtle
Central area
4
Caretta caretta
Loggerhead turtle
(including Paracels islands
Chelonia mydas
Green turtle
and Spratly islands)
Eretmochelys imbricata
Hawksbill turtle
Lepidochelys olivacea
Olive Ridley turtle
Southeast area
4
Caretta caretta
Loggerhead turtle
Chelonia mydas
Green turtle
Eretmochelys imbricata
Hawksbill turtles
Lepidochelys olivacea
Olive Ridley turtle
Southwest area
3
Caretta caretta
Loggerhead
Chelonia mydas
Green turtle
Eretmochelys imbricata
Hawksbill turtle
Source: Status and Protection of Sea Turtles Resources of Viet Nam, Pham Thuoc et al., 2001.
The 2000 IUCN Red List of Threatened Animals classifies 4 of these species as endangered and 1, the
Hawksbill turtle, as critically endangered at the global level.
5.
CURRENT MANAGEMENT REGIMES
5.1
Legal instruments
There are many legal instruments for the management of Viet Nam's fisheries. They include a large
number of regulations (stipulating the objectives, functions, and organisation of the fisheries sector),
norms and standards (standards used in the fisheries sector; safety control of fishing boats; quality
control of fishery products; and aquaculture management), duties of fisheries stakeholders (taxation
regulations), behaviours on resource users.
The most important document for the protection of fisheries resources and their habitats is "The
Ordinance on Fisheries Resources Protection and Development", issued by the National Assembly on
25 April 1989. In this ordinance, all activities leading to destruction of resources and their habitats are
prohibited. The government is responsible for the identification of closures or temporary-closures in
areas such as spawning and nursery grounds. The registration of all mechanised fishing boats is
required. The trading of endangered, rare, and threatened species is prohibited.
In support of this range of fisheries rules and regulations, the Department of Fishery Resources
Conservation was established in 1991 within the Ministry of Fisheries. Provincial divisions were
established in all coastal provinces. The main tasks of the Provincial Division of Fishery Resources
Conservation are the licensing of vessels and the monitoring of fishing activities in provincial waters.
To provide a more formal basis for the development of responsible fisheries and their management, the
National Assembly of Viet Nam introduced new fisheries legislation on 26 November 2003. This
legislation will be enacted on 1 July 2004.
5.2
Institutional arrangements (research, monitoring, control & enforcement)
The highest government agency responsible for the administration, development, and management of
Viet Nam's fisheries is the Ministry of Fisheries (MOFI). MOFI consists of the following departments:
Reversing Environmental Degradation Trends in the South China Sea and Gulf of Thailand
38 NATIONAL REPORT ON FISHERIES VIET NAM
-
Department of Fisheries Management
-
Department of Fisheries Resources Conservation
-
Department of Planning & Investment
-
Department of Personnel & Labour
-
Department of Science & Technology
-
Department of Legislation
-
Department of Finance & Accounting
-
Department of International Cooperation
- Administrative
Office
- Inspection
Concerning capture fisheries at the central level, the Department of Fisheries Management is
responsible for establishing policies for fisheries development and the renovation of non-state-owned
fisheries enterprises. The Department of Fisheries Resources Conservation, through its nationwide
network of Provincial Fishery Resources Conservation Divisions, takes care of resource protection and
enhancement, quarantine, as well as vessel registration and licensing.
In all coastal provinces, there is a Provincial Fisheries Department. In the inland provinces, the
Department for Agriculture and Rural Development is responsible for fisheries. This department assists
the local authority (People's Committee) in the administration and development of fisheries. Normally,
the department has subordinate networks at the district and community level in important areas for
fisheries.
The Research Institute for Marine Fisheries, established in 1961, is responsible for assessing fisheries
resources and fleet performance. The Institute collects and analyses information and data derived from
surveys and studies conducted in Vietnamese waters. The Institute's research outputs provide MOFI
with a scientific base for the institution of management and development policies. The Research
Institute of Fisheries Economics and Planning mainly deals with development of master plans.
Fisheries rules and regulations are enforced through monitoring and surveillance activities conducted
by the fisheries inspection staff of the Fishery Resources Conservation Divisions, and coast guards, the
navy and marine police.
5.3
Overview of patterns of resources ownership and traditional utilization
Living marine resources in Viet Nam are common property and managed by government. Access to
resources is open to all individuals and organisations that qualify for a fishing licence. According to
government regulations, all boats larger than 0.5 tonnes require a licence prior to fishing. The licences
for coastal waters (6 miles from the shore for the Gulf of Tonkin and southern waters; and 3 miles from
the shore for waters of the central region) are valid for 12 months. Licences for near shore waters are
valid for 24 months. Near shore waters are defined from the outer boundary of the coastal water area
boundary to the depth strata of 30m in the Gulf of Tonkin and southern waters, and to the depth strata
of 50m for waters of the central region. Licences for fishing in offshore area are valid for 36 months.
Fishing boats with an engine capacity greater than 90hp are not permitted to fish in coastal and near
shore waters. Some gears like trawl push net, beach seine, and gears using artificial light to attract fish
(except squid hand line) are banned in the coastal waters.
Fisheries in Viet Nam are mainly small scale. Most boats operate in water less than 50m deep. A large
numbers of boats from the central region fish in the Gulf of Tonkin or southern waters for extensive
periods. Being aware of high fishing pressure in coastal areas the government has recently encouraged
fishers to redirect fishing effort towards offshore waters and resources, with soft loans and tax reduction
incentives. As a result, there have been many new large fishing entering Viet Nam's offshore fisheries.
However, a number of these larger boats have been observed fishing in coastal and nearshore areas.
In fact, with few patrol boats and staff, the enforcement forces ineffectively control fishing activities in
Viet Nam's EEZ. The open access nature of Viet Nam's fisheries severely hinders resource and habitat
conservation efforts.
In order to improve the management of fishery resources, there are some proposals to divide
Vietnamese waters into different management zones. These proposals suggest that the management
of coastal and nearshore waters should be transferred to the local authorities. Co management may be
another alternative for these areas.
Reversing Environmental Degradation Trends in the South China Sea and Gulf of Thailand
NATIONAL REPORT ON FISHERIES VIET NAM 39
5.4
Capacity, human & institutional (include location of research and MCS institutions)
To ensure proper management and development of fisheries, there is an administrative network from
the national to grass-root levels in Viet Nam. This network is made up of representatives of MOFI, the
provincial departments, the district office, and the community in important fisheries areas. The
enforcement units of all Provincial Fishery Resources Conservation Divisions are equipped with patrol
boats for surveillance. At important fishing harbours and river mouths, there are fisheries inspection
stations. To supply scientific information to MOFI, there is the Research Institute for Marine Fisheries
(RIMF) and Institute of Fisheries Economics and Planning.
The Research Institute for Marine Fisheries (RIMF)
RIMF is part of the Ministry of Fisheries. At present, the RIMF headquarters are in Haiphong province,
with a Marine Biodiversity Research Station on Cat Ba Island in the Gulf of Tonkin. The Government of
Viet Nam has recently given approval for RIMF to establish a research centre in the southeastern
province of Vung Tau. A centre for resource conservation and fisheries development is also planned for
the province of Kien Giang (Gulf of Thailand).
RIMF has the main following tasks: 1) to survey and research living marine resources (distribution,
migration, biology, stock assessment, potential yield estimates and resource conservation methods,
etc.); 2) to study the marine environment and relationships between environment and fisheries
development, including methods for monitoring the marine environment; 3) to study biodiversity and the
establishment of marine protected areas (MPA); 4) to study, trial, develop and apply new technologies
for exploiting fish; 5) to develop post - harvest technologies; 6) to transfer technologies in the fields of
fishing, post - harvest technologies to all economic counterparts; 7) to provide postgraduate training on
specific subjects and other training on marine fisheries science and technology; and 8) to provide
consultation services.
Institute of Fisheries Economics and Planning in Hanoi
This institute conducts research on the economics and management of fisheries. Planning the
restructuring of production and the establishment of regional and master plans are some of its key
activities.
Centre for Fisheries Science -Technology and Economics Information (FICen) in MOFI
This centre is responsible for gathering and supplying information to the fishery management process.
Other research institutions and agencies
Some other institutions and agencies involved in fisheries research are:
- The Centre for Natural Resources and Environment Study (CRES) under the National
University of Viet Nam (NU).
-
The Sub-institute for Forestry Sciences in South Viet Nam.
-
The Research Institute of Oceanography, Nha Trang.
-
The Branch Institute of Oceanography, Hai Phong.
-
The Branch Institute of Ecology of Biological Resources, Ho Chi Minh City.
Extension Services
The top organisation of fisheries extension services is the National Extension Center, located in the
Ministry of Fisheries. Extension centres have been established in 24 of the 28 coastal provinces, and in
26 inland provinces, with the purpose of transferring knowledge to fishers and fish farmers to enhance
their activities. However, these organisations are currently focused mainly on aquaculture.
5.5
Review of stakeholders
Fishers
The most important stakeholders in capture fisheries are the fishers. The fishery sector is considered
an important source of employment due to the large amount of primary and secondary jobs created in
fisheries. According to the national strategy for the fisheries sector, fisheries should create around 4
million jobs in 2010.
Reversing Environmental Degradation Trends in the South China Sea and Gulf of Thailand
40 NATIONAL REPORT ON FISHERIES VIET NAM
State-owned fishing enterprises
Generally, the state-owned enterprises own large fishing boats. Traditionally, these enterprises have
played a leading role in fisheries. However, since the introduction of the market economy, these
enterprises have lost their competitiveness. Many of them have now discontinued their activities.
Fishing cooperatives
After 1985, most of fishing cooperatives were disbanded due to poor effectiveness. In 1997, some new
cooperatives were re-established for obtaining loans from financial institutions. Fishing cooperatives
play a useful role in fisheries management, as the government can efficiently introduce its policies or
management measures to fishers through this system.
Fishing groups
Due to the large amounts of capital required to purchase fishing boats and gear, fishers tend to create
fishing groups. People in fishing groups can receive support from others in a very flexible way. Since
1985, the number of groups has rapidly increased.
Private business
The private business approach to capture fisheries is the most popular in Viet Nam. Many fishers own
private fishing boats, requiring less than 5 crew. Others may own more than one boat or larger boats
requiring more than 5 employees. Some people make capital investments in large boats, with a
capacity to operate at sea for extended periods. These people may have several large boats operating
as part of a larger fleet.
6.
RECOMMENDATIONS
Due to the important contribution of fisheries to the national economy and social stability, the
Government of Viet Nam has committed to develop fisheries in a sustainable way. Therefore, many
measures have been adopted to maintain the resources and their habitats. As key players in Viet
Nam's fisheries systems, fishers cannot be excluded from any fishery management system. This sector
can only be successful by managing fisheries in light of fisheries resource and ecosystem
interdependencies, as well as the socio economic welfare of fishers and their communities.
The management of fisheries resources is heavily dependent on information. Fisheries management
measures should be based on information that is sound, robust and provided in a timely fashion.
In light of the status of fisheries resources and their habitats, as well as the performance of fisheries,
the following recommendations aimed at improving Viet Nam's fisheries situation are provided:
1. Strengthen the assessment of fisheries resources status via the establishment of a regular
resource-monitoring programme. This programme should collect necessary biological data and
provide regular assessments. A fixed station survey programme may be appropriate.
2. Strengthen the national fishery statistics system to facilitate the use of indicators in monitoring
trends in commercial fisheries. This approach was agreed by the ASEAN countries in a series
of technical consultations for the implementation of the Code of Conducts for Responsible
Fisheries. The use of indicators can enable the rapid identification of the effects of fishing on
fisheries resources and their ecosystems. For example, a decrease in catch rate, or change in
catch composition, may provide an indication of broader unsustainable trends in the fishery.
3. Replant mangroves in coastal areas for the creation of spawning and nursery grounds for
aquatic resources.
4. Establish Marine Protected Areas (MPAs). MPAs can be an effective tool in resource
enhancement. At present, there are two pilot projects of Hon Mun in Khanh Hoa and Cu Lao
Cham in Quang Nam provinces. The Ministry of Fisheries, with support from various
international donors, is working on the establishment of 15 MPAs in Vietnamese waters. It is
intended that these areas will assist in the recovery of overexploited resources.
5. Improve the use of responsible fishing gears and practices. Although, the government has
issued regulations, clearly prohibiting destructive fishing gears and methods, this problem has
become more serious in recent years. Therefore, the enforcement force should be provided
with sufficient means to conduct effective surveillance and monitoring activities.
6. Reduce fishing pressure in nearshore waters. Alternative income sources should be created for
those fishers required to leave fisheries.
Reversing Environmental Degradation Trends in the South China Sea and Gulf of Thailand
NATIONAL REPORT ON FISHERIES VIET NAM 41
7. Help fishers increase the value of their catches through the adoption of effective post-harvest
handling and processing.
8. Raise awareness of fishers regarding fisheries laws and regulations.
REFERENCE
Assessment of the Living Marine Resources in Viet Nam. 2000 2003. Bottom survey technical
reports.
Assessment of the Living Marine Resources in Viet Nam. 2001. Bottom survey technical report,
Southeast Southwest Waters,2000.
Assessment of the Living Marine Resources in Viet Nam, 2003. Vietfishbase, Enumerator Programme.
Assessment of the Living Marine Resources in Viet Nam. 2003. Vietfish Survey Database.
Dao Manh Son et all. 2003. Survey study on marine fishery resources and selection of the appropriate
fishing pattern for development of offshore fishery in Viet Nam". Hai Phong, May 2003.
Do Van Nam.2003.Preliminary Assessment of waste and environment pollution of fishery processing
plants and recommendation on management regime.
Do Van Nguyen. 2002. Primary study on density distribution of fish eggs and larvae in coastal waters of
the central region, Viet Nam in October - November 2002. RIMF scientific report.
Do Van Nguyen. 2003. Primary study on density distribution of fish eggs and larvae in coastal waters of
the central region, Viet Nam in March April 2003. RIMF scientific report.
Do Van Nguyen. 2004. Primary study on density distribution of fish eggs and larvae in the Gulf of
Tonkin and Northern Part of the Central waters, Viet Nam in August September and October
November 2003. RIMF scientific report.
Fisheries Information Centre. 2002. Fishery Statistics, 2002.
K.Hotta and I.M.Dutton. 1995. Costal Management in the Asia Pacific Region: Issues and Aproaches
(Page 209-224).
Ministry of Fisheries. 2000. The Implementation of Work plan 1999 and Fishery Socio-Economic
Development Plan 2000.
Ministry of Fisheries.2003. The Implementation of Work plan 2002 and Fishery Socio-Economic
Development Plan 2003.
Ministry of Fisheries. 1996. The Aquatic Resources of Viet Nam. The Agriculture Publish House.
National Environment Agency. 1995. Quality standards of sea water of Viet Nam.
National Environment Agency, 1998. Country Report of Viet Nam for Transboundary Diagnostic
Assessment.
Nguyen Long, 2000. A preliminary Analysis on Socioeconomic Situation of Coastal Fishing
Communities in Viet Nam.
Pham Ngoc Dang, Nguyen Cong Con, 1995. The resources of shrimp, lobsters and cephalopod
resources in Vietnamese waters: status and conservation methods.
Pham Thuoc et al.. 2000. Status of the Demersal Fishery Resources of the Viet Nam Seawaters.
Pham Thuoc et al.. 2001. Status and Protection of Sea Turtles Resources of Viet Nam.
Pham Thuoc, 1981 to 1985. Characteristics of Viet Nam Fisheries Resources, Biomass, and Potential
Yield".
Pham Thuoc. 1993. Resources status and fishery exploitation in Vietnamese waters.
Pham Thuoc. 1986. Fish resources of Viet Nam seawaters: biological characteristics, biomass
assessment and exploitation potentials, (PhD thesis).
Research Institute of Fishery Economic and Planning. 2002. Master Plan for Fishery Socio-Economic
Development to 2010.
Ta Dang Minh. 1995. Study on status assessment of oil pollution in Vietnamese seawaters and
development of the technical solutions for preventing oil pollution and oil products.
Vinh Chu Tien. 1999. Report on exploring marine resources to support for off shore fisheries
development (Document of RIMP).
Vu Huy Thu and Pham Thuoc.2003. Guidelines on exploitation and protection of the marine resources
of Viet Nam.
Reversing Environmental Degradation Trends in the South China Sea and Gulf of Thailand


UNEP/GEF Project Co-ordinating Unit
United Nations Environment Programme
United Nations Building
2nd Floor, Block B
Rajdamnern Nok Avenue
Bangkok 10200, Thailand
Department of Fisheries
Ministry of Agriculture, Forestry and Fisheries
186 Narodom Blvd.
P.O. Box 582, Phnom Penh
Cambodia
.
Ministry of Marine Affairs and Fisheries
Jl.Medan Merdeka Timur no. 16
Jakarta Pusat 10110
Indonesia
National Fisheries Research and Development Institute
Department of Agriculture
940 Kayumanggi Press Building I
Quezon Avenue, Quezon City 1103
Philippines
Chumporn Marine Fisheries research & Development Center
408 Moo 8, Paknum Sub-district
Muang District
Chumporn 86120
Thailand
Research Institute for Marine Fisheries
Ministry of Fisheries
170 Le Lai Street
Hai Phong City
Viet Nam
Document Outline
- þÿ
- þÿ
- þÿ
- þÿ
- þÿ
- þÿ
- þÿ
- þÿ
- þÿ
- þÿ
- þÿ
- þÿ
- þÿ
- þÿ
- þÿ
- þÿ
- þÿ
- þÿ
- þÿ
- þÿ
- þÿ
- þÿ
- þÿ
- þÿ
- þÿ
- þÿ
- þÿ
- þÿ
- þÿ
- þÿ
- þÿ
- þÿ
- þÿ
- þÿ
- þÿ
- þÿ
- þÿ
- þÿ
- þÿ
- þÿ
- þÿ
- þÿ
- þÿ
- þÿ
- þÿ
- þÿ
- þÿ
- þÿ
- þÿ
- þÿ
- þÿ
- þÿ
- þÿ
- þÿ
- þÿ
- þÿ
- þÿ
- þÿ
- þÿ
- þÿ
- þÿ
- þÿ
- þÿ
- þÿ
- þÿ
- þÿ
- þÿ
- þÿ
- þÿ
- þÿ
- þÿ
- þÿ
- þÿ
- þÿ
- þÿ
- þÿ
- þÿ
- þÿ
- þÿ
- þÿ
- þÿ
- þÿ
- þÿ
- þÿ
- þÿ
- þÿ
- þÿ
- þÿ
- þÿ
- þÿ
- þÿ
- þÿ
- þÿ
- þÿ
- þÿ
- þÿ
- þÿ
- þÿ
- þÿ
- þÿ
- þÿ
- þÿ
- þÿ
- þÿ
- þÿ
- þÿ
- þÿ
- þÿ
- þÿ
- þÿ
- þÿ
- þÿ
- þÿ
- þÿ
- þÿ
- þÿ
- þÿ
- þÿ
- þÿ
- þÿ
- þÿ
- þÿ
- þÿ
- þÿ
- þÿ
- þÿ
- þÿ
- þÿ
- þÿ
- þÿ
- þÿ
- þÿ
- þÿ
- þÿ
- þÿ
- þÿ
- þÿ
- þÿ
- þÿ
- þÿ
- þÿ
- þÿ
- þÿ
- þÿ
- þÿ
- þÿ
- þÿ
- þÿ
- þÿ
- þÿ
- þÿ
- þÿ
- þÿ
- þÿ
- þÿ
- þÿ
- þÿ
- þÿ
- þÿ
- þÿ
- þÿ
- þÿ
- þÿ
- þÿ
- þÿ
- þÿ
- þÿ
- þÿ
- þÿ
- þÿ
- þÿ
- þÿ
- þÿ
- þÿ
- þÿ
- þÿ
- þÿ
- þÿ
- þÿ
- þÿ
- þÿ
- þÿ
- þÿ
- þÿ
- þÿ
- þÿ
- þÿ
- þÿ
- þÿ
- þÿ
- þÿ
- þÿ
- þÿ
- þÿ