Physical path
POLFOTO
t
hways of contaminant transpor
IDSTRAND
W
STAFFAN
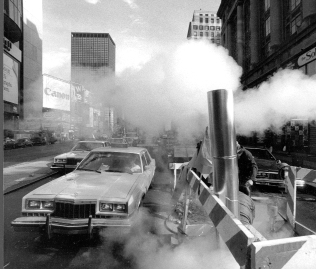
In the mid-1950 s, airplane pilots flying in the North American Arctic saw a strange, discolored haze
on the horizon. It was thick enough to obscure visibility and different than any flying conditions
they had come across before. In the 1980s, the haze was identified as aerosols of sulfate and soot,
along with some soil particles, which were carried by winds from heavily industrialized areas in
Europe.
This Arctic haze was the first sign that the northern polar environment is closely connected to
activities in other parts of the world. Other observations have added to this insight. Around Sval-
bard, Norway, and in Canada, measurements of toxic organic compounds in polar bears have
shown unexpectedly high levels. Svalbard had been chosen as a background station for environmen-
tal monitoring and was thought to be an example of a clean, undisturbed environment. Where did
the pollution come from? Local sources could not explain the high levels.
A third example made the issue of long-range transport of contaminants into the Arctic even
more acute. A study of traditional foods from the sea showed that some people in native communi-
ties in Canada ingested high levels of the environmental contaminant PCB in their diet. Could the
nourishing food, so essential for health and culture, also be a threat? Again, local sources of PCB
could not explain the high levels. It must have been transported from regions outside the Arctic.
High levels of contaminants in Arctic environments that had been thought pristine led to intensi-
fied research into the pathways by which pollutants reach the Arctic the air and water that enter
the region from industrialized areas of the world. As it turns out, its geographical characteristics
and cold climate make the Arctic a sink for many contaminants that are spread around the globe.
This chapter describes the pathways involved in transferring contaminants from one place to
another and the physical processes that determine their fate in the Arctic.
22
The atmosphere
help break down some contaminants, explains
why sulfates and soot from Eurasia can con-
Physical pathways
The atmosphere contains relatively small
tribute to haze throughout the lower layer of
amounts of contaminants compared with the
the Arctic atmosphere in winter and spring. It
total load in polar soil, sediments, and water.
takes 13 to 16 days for contaminants in the
However, the rapid movement of air makes it
lower atmosphere to travel from Europe to
an important pathway for delivering contami-
Alaska during the winter.
nants to the Arctic. Any chemically stable,
North America and East Asia only rarely
wind-borne material will follow winds and
contribute to Arctic haze since air masses from
weather patterns into and within the Arctic
these areas move over huge ocean distances
region. The atmosphere is the fastest and most
before reaching the Arctic, where low pressure
direct route from the source of pollution:
systems give rain and snow a chance to clean
transport from the sources to the Arctic occurs
the air. They may, however, be important
in a matter of days or weeks.
source areas for occasional bursts of high lev-
els of contaminants that are not efficiently
removed by rain and snow.
Winter and spring winds carry dirty air
In summer, the continental high-pressure
Air-transport patterns are highly dependent on
systems break up, and the low-pressure sys-
season and on the position of major weather
tems over the oceans become weaker. There-
systems. In winter and spring, an intense high-
fore, the transport of air and contaminants
pressure system over Siberia pushes the Arctic
from mid-latitudes becomes much less impor-
front far to the south, so that important pol-
tant in summer than in winter. Summer is also
luted areas of Eurasia are actually within the
warmer, allowing for cloud formation and for
Arctic air mass, the lower one-to-two kilome-
drizzling rain that can remove contaminants
ters of which can move contaminants across
from the air before they are carried far. More-
the pole. Winds that can carry contaminants to
over, sunlight during the summer months al-
the Arctic are therefore more frequent in win-
lows for photochemical degradation of some
ter and spring than in summer and autumn.
contaminants.
The transport of contaminants during the
The position of the
Arctic winter is made even more effective by
Particles take one hop from source to site
Arctic front influences
the lack of clouds and precipitation over the
contaminant transport
areas dominated by high-pressure systems.
Contaminants that are in the form of minute
in the atmosphere. The
Low wind speeds and temperature inversions,
particles, or aerosols, are relatively easy to
figure shows the mean
position of Arctic air
caused by the cold winter weather, allow con-
track. This is also true for gases that transform
mass in January and
taminants to accumulate in the atmosphere.
into particles, such as sulfur dioxide. These
July and the winter and
Rather than falling to the ground in the vicin-
contaminants start their journey with a ride on
summer frequencies of
ity of the source, they follow the large-scale
northflowing winds from the source. Once
winds driving the major
patterns of atmospheric circulation. This,
they land, they usually stay on the ground.
south-to-north transport
routes.
together with the lack of light, which would
They are often labeled one-hop contaminants.
Acids carried as sulfates, non-volatile metals,
and radionuclides are some examples. Non-
Wind frequencies
volatile organic compounds behave the same
Winter: 25%
Summer: 5%
way. One-hop contaminants follow the same
route as Arctic haze, from mid-latitude
sources, mainly in Eurasia, to the Arctic.
The distances over which one-hop contami-
nants travel is determined by the location of
their sources in relation to the Arctic airmass,
er
m
precipitation patterns, and how far the airmass
Arctic front, winter
moves during the atmospheric lifetime of the
front, sum
particles. In the Arctic winter, particles can
tic
rc
stay in the air as long as 20 to 30 days, creat-
A
ing conditions for long-range transport and
accumulation of contaminants in the polar
Wind frequencies
region. In summer, the contaminants usually
Winter: 15%
stay in the air for only 2 to 5 days.
Summer: 5%
Volatile substances
gain global distribution
Some contaminants are transported as gases.
Wind frequencies
Winter: 40%
This is true for volatile and semi-volatile
Summer: 10%
organic compounds. Their behavior is differ-
ent from particle-bound contaminants and
aerosols in that their journey consists of sev-
Modeling the fate of contaminants
A t m o s p h e r e
Where do contaminants come from? How do they get
from one point to the other? Much of what is known
about contaminant transport comes from computer
models that mathematically simulate pathways. The
input to the models are data on emissions, information
Snowpack, river ice,
River ice,
about meteorological conditions such as winds and pre-
Sea ice
lake ice, glacial
shore ice
cipitation, and equations describing processes that
change the chemical and physical characteristics of the
compounds or that remove them from the air.
Single-hop compounds, such as radionuclides and sul-
fate aerosols, can be modeled in the same way as weather
Terrestrial, freshwater
Delta, estuary, fjord
Surface ocean
parameters in computer-based weather forecasts. Winds,
precipitation, temperature, humidity, clouds, and deposi-
Shelf
Central
tion to Earth's surface are the major factors that deter-
mine the pathway from source to deposition site. Such
models have been used to describe the fallout from
Chernobyl, the fate of pollution from the Kuwaiti oil
Sediments
Sediments
Sediments
fires, and the impact of acid rain in Europe, eastern
North America, and southeast Asia.
Models for multi-hop compounds are much more
complex. In addition to the meteorology, a model has to
describe how the contaminant moves between different
environmental compartments, such as the atmosphere,
Deep
the land, and the ocean. To get a more accurate picture,
ocean
the compartments are often subdivided: Will the contam-
inant enter the surface of the ocean and remain there or
will it also reach the deep layers? Will it adhere to parti-
cles and end up in soil or sediments, or will it dissolve in
water and follow land runoff to a river? Often, the same
contaminant will be present in several compartments, and
there is an exchange between them that depends on the
A multi-compartment representation of the major pathways
Bottom
temperature and on the total mass of the compound pre-
water
of contaminants to and within the Arctic environment.
sent in each compartment. The model should, for exam-
ple, be able to describe how a decrease in the load of
contaminants in the atmosphere can turn a sink, such as
the oceans, into a source. Similar models exist for marine
Sediments
environments. An illustrative example of this phenome-
non is how the pesticide hexachlorocyclohexane spreads
around the globe by moving in and out of the ocean.
eral hops. The compounds are first picked up
air, which eventually land on the ground. They
by the winds as gases. They can then land on
can also condense directly onto the Earth's sur-
the ground, on ice, or in the oceans by adher-
face. At the low temperatures typical of the
ing to particles or organic films, as well as by
Arctic, they are not as likely to revolatilize as
dissolving in water. But this is not necessarily
in warmer climates. Another explanation is
the end of their journey. When summer brings
that gases dissolve in water more readily at
higher temperatures, the compounds can vol-
low Arctic temperatures than in warmer envi-
atilize again, re-enter the atmosphere, and con-
ronments.
tinue their journey as gases. If the contami-
nants do not break down, as is the case for
The breathing oceans
persistent organic pollutants and mercury, and
if the temperature conditions are right, the
For multi-hop contaminants, it is difficult to
process can repeat itself a number of times.
pinpoint the sources of the high levels that
Eventually, the compounds might break down
have been detected in the Arctic. Some of these
to less harmful chemicals or be deposited in
contaminants have been used for decades, dur-
bottom sediment in oceans and lakes.
ing which time a portion of the chemicals has
Multi-hop compounds can travel great dis-
ended up in the world's oceans or in soils. For
tances and become truly global in distribution.
some compounds, the concentration in the
At some point in their journey, the winds are
oceans can be thousands of times higher than
likely to carry them into the Arctic, which
in the air. This capacity to hold on to contami-
explains why chemicals that have never been
nants is especially pronounced when the water
used in the Arctic can still be found in the tis-
is cold, as it is in the Arctic Ocean. When the
sues of people and wildlife in the region.
temperature increases, the capacity of the
For some compounds, the levels are higher
water to retain the contaminants decreases,
in the Arctic than one would expect, even tak-
and the oceans `breathe out'. Because the mass
ing transport into account. Why? One expla-
of contaminants is higher in the water than in
nation lies in the cold climate. As the tempera-
the air, the ocean can be expected to have `bad
ture drops, the compounds condense out of the
breath' for a long time, at least ten years for
gas phase onto particles or snowflakes in the
the Arctic Ocean. For contaminants that
adhere to particles, soil can serve as a similar
condense on the cold ground where they
24
reservoir.
adhere to soil particles or plants. For many
Physical pathways
To understand the levels of multi-hop conta-
contaminants in the Arctic, wet and dry depo-
minants in the air, one has to know the condi-
sition from the atmosphere is the major pollu-
tions under which the oceans and the land
tion source.
breathe out. First, there is a seasonal pattern.
For example, an increase in water temperature
may lead to a release of contaminants. The
The land and rivers
breakup of ice in spring and the fall break-
down of water stratification can also turn the
The Arctic landmass receives contaminants
ocean into an important seasonal source to the
from the atmosphere. Contaminants are also
air. Contaminants captured in snow or soil
transported to the Arctic by large rivers that
behave in a similar manner and can also be
can move material from polluted areas farther
released to the atmosphere when temperatures
south along the river. Mines, metal processing
rise in summer.
facilities, factories, oil and gas drilling, waste
Over the long term, the concentration of
dumps, and settlements can add to the local
contaminants in the air will determine the role
load. The diagram opposite gives a conceptual
of oceans and soils as sources. If air concentra-
picture of some different pathways.
tions drop, as they would if we were to place
The fate of contaminants in the terrestrial
restrictions on use, the oceans and the land
environment depends on the landscape as well
may release more of their loads.
as on the physical and chemical characteristics
of each compound. Water-soluble compounds
will be carried by snow-melt, surface water,
Rain, snow, fog, and rime clean the air
groundwater, and rivers. Unless they degrade,
Contaminants are cleaned out from the air by
they tend eventually to end up in the ocean.
several processes. They can be caught when
Contaminants with low water solubility nor-
raindrops or snow crystals form in a cloud or
mally adsorb onto particles in the soil or sedi-
when the rain or snow is actually falling. Fog
ment. Their fates depend on whether erosion
can scavenge contaminants and deposit them
will wash the soil into waterways and, if so, on
when it condenses onto surfaces. Rime ice,
what happens to the particles during a river's
journey to the ocean.
137
Radioactive rain
Cesium deposition, kBq
Precipitation, mm,
May-June 1986
28-30 April,
Precipitation was important
1986
in washing wind-borne ra-
Snowmelt creates a chemical surge
dionuclides from the Cher-
Melting snow plays an important role in trans-
nobyl accident out of the air
2
and onto the ground.
porting contaminants in the terrestrial envi-
In Scandinavia, the de-
ronment. By spring, the snow has had a whole
position of radionuclides
2
winter to accumulate contaminants from the
15
was very similar to the pat-
0
30
air. A deep snow pack can even retain volatile
tern of local rain showers.
9
5
5
2
9
5
contaminants, which shallow snow packs
The areas that had rain the
15
10
20
days after the accident were
20
would release back to the air.
30
those with the highest levels
50
When the temperature rises, water-soluble
0
of cesium-137 in the ground.
30
chemicals concentrate in the melt-water, and
25
For example, the city of
30
25
85
the initial 20 to 30 percent of the meltwater
Gävle
20
Gävle, where it rained the
2
15
can remove 40 to 80 percent of the total mass
day after the accident, re-
95
0
ceived substantial deposi-
of pre-melt contaminants. Most of the meltwa-
5
tion, as did the reindeer
ter flows over frozen ground directly into
herding grounds in the mid-
streams and lakes. The chapter on acidification
9
dle parts of northern
9
provides an example of the effect this chemical
Sweden. The Saami reindeer
9
surge can have on the water quality of small
herders farther north were
0
much less affected by the
5
streams.
fall-out.
5
Meltwater can also be a powerful erosive
5
force. In areas where the ground cover has
been disturbed, the rushing water easily forms
which forms when supercooled cloud droplets
erosion gullies and washes away soil. Over-
freeze on contact with snow crystals or sur-
grazing, seen in Scandinavia, Russia, and
faces, is also an important scavenger of conta-
North America, can thus affect water quality.
minants from the air. In Greenland, rime ice
Construction work is another potentially dam-
has been estimated to contribute about 5 per-
aging activity, especially if the permafrost is
cent of the annual snow load, while account-
disturbed.
ing for approximately 30 percent of the annual
Erosion also introduces suspended particles,
deposition of contaminants.
which provide surfaces to which contaminants
An additional route from the air is dry
can attach. Therefore, erosion can increase
deposition. Particles can land by themselves
contaminant transport in a river.
and semi-volatile, gaseous contaminants can
Revolatilization
25
W e t a n d d r y a t m o s p h e r i c d e p o s i t i o n
Revolatilization
Physical pathways
Revolatilization
Wetland
(bog /swamp)
Coastal
runoff
Transformation
Lake
Watershed
Ocean
Transformation
Resuspension
Groundwater
drainage Runoff
Wetland outflow
Sedimentation
Water +
particulate matter
Sedimentation +
transformation in
transport
Resuspension
delta/estuarine zone
Industrial
Municipal
Sedimentation
Riverine transport
Mining
Transformation
Different pathways of
contaminant transport
in the terrestrial and
Agriculture
freshwater environ-
ments.
water from the ground, most of it in late sum-
mer. Only during this short period can the
chemical and biological composition of the
active layer affect the contaminant load
Permafrost makes surface water
brought by precipitation. In spring and early
vulnerable
summer, the lake gets its water directly from
Even when the ground is not completely
surface runoff, and the active layer plays no
frozen, the shallow active layer of Arctic soils
role. Farther south, groundwater becomes pro-
makes patterns of water transport over and
gressively more important as the active layer
through the ground very different than in
becomes thicker.
warmer areas. Specifically, there is a greater
risk of surface water contamination, whereas
Rivers are key pathways
the groundwater is relatively more protected.
For example, a small lake in a permafrost area
Rivers are central to many Arctic settlements,
might only receive slightly more than half its
providing drinking water and fish for food.
Tundra with River.
Drawing: Ruth Qual-
luaryuk.
They are also important pathways for conta-
of the Kola Peninsula was treated according to
26
minants.
specified purification standards. In general,
Physical pathways
Rivers are also key pathways for long-range
however, the main watersheds in both Russia
transport. They can gather water and particu-
and North America are relatively clean, and
late matter from huge catchment areas and
they have many lakes and reservoirs that act as
transport them over long distances. The major
traps for contaminated sediment.
inflow of freshwater to the Arctic Ocean comes
from rivers that originate outside the Arctic.
Early summer brings peak input
The catchment areas of large rivers often
and floods
include many diffuse sources of contaminants,
such as agricultural runoff loaded with pesti-
The flow in Arctic rivers is highly seasonal,
cides. Discharges of municipal and industrial
especially in those unregulated by dams and
sewage from heavily populated and industrial-
reservoirs; see the graphs opposite. In winter,
ized areas south of the Arctic also contribute
water flow is very low, and some rivers even
to the contaminant load. Other polluting activ-
freeze to the bottom. Peak flow usually comes
ities are mining and oil and gas exploitation.
in June and July, and this is when one would
In Russia, some rivers are used as roads and
expect the largest input of contaminants to
for dumping dirty snow in winter. Contami-
the Arctic Ocean.
nants from vehicles and from materials gath-
The peak flow in the rivers coincides with
ered in the snow will also be carried by the
the greatest transport of river ice, and in some
water or by the ice during spring melt.
rivers the combination of high flow and ice
Some of the Arctic rivers have polluting
jams leads to flooding. If the landscape is flat,
activities in their catchment areas. The major
as is the case in many parts of the Russian tun-
Russian rivers, in particular the Yenisey and
dra, the water can cover vast areas. Floods can
the Ob, have their upstream basins in heavily
leave contaminant-laden sediments on the
developed areas with industries, urban centers,
flood plain, temporarily removing them from
and intensive agriculture. However, very little
the riverine pathway. However, in years where
is known about what these rivers actually
flooding is extreme, the water may pick up
transport. In North America, the Nelson River
previously deposited material, and the load of
system, which empties into Hudson Bay, flows
contaminants will then reflect inputs from sev-
through areas with intensive agriculture in
eral years.
mid-west Canada. The same is true, though to
Slower-flowing rivers with well-developed
a lesser extent, for the Mackenzie River.
flood plains usually do not rise until the rivers
The large rivers in the Arctic and in the sub-
are clear of ice and might thus be more effici-
arctic receive most of their water during spring
ent in moving contaminants to the coast.
snowmelt, and in most areas the melted snow
In summer, heavy rains or periods of dry
is also the most important source of contami-
weather control river flow. In small waterways,
nation. In highly urbanized regions, such as
the water level can change dramatically depend-
the large industrial cities of the Russian Arctic,
ing on the weather. Nonetheless, most sedi-
direct discharges of wastewater are equally
ment transport occurs during the spring flood.
important.
In Russia, large volumes of industrial and
River ice gathers contaminants
municipal waste water are not treated. For
example, in 1994 less than 5 percent of the
River ice has a special role in the transport of
Dirty river ice,
Lena delta.
waste water produced in the Murmansk region
contaminants. The ice gathers material from
the atmosphere and from the river itself as the
water freezes. The incorporation of particle-
borne contaminants from the water can con-
tinue throughout the winter as the ice grows.
When the water freezes all the way to the
bottom of a river, material from the river bot-
tom gets caught in the ice. Also, if the entire
water column in the river is supercooled, i.e.
has a water temperature below freezing, a sud-
den change in temperature or turbulence can
lead to ice formation around rocks and sedi-
ment on the bottom of the river. Known as
anchor ice, these formations can lift rocks as
heavy as 30 kilograms. Supercooled water is
also involved in formation of frazil ice, which
collects small particles in the water and incor-
porates them into the ice cover. As a result, river
ice can contain large amounts of sediments.
The sediments and any contaminants in the
HEIDI KASSENS
ice itself are released to the river water during
the spring melt, when the biological producti-
Water discharge, m3/second
27
vity of the water is at its peak. The seasonal
40 000
Mackenzie River, 1973-1990
freeze-thaw cycle thus creates conditions in
Daily mean discharge
35 000
Average of daily means
which the contaminant load built up in winter
can be effectively incorporated into animals.
30 000
25 000
Lakes and dams trap sediment
20 000
The landscape through which a river flows
15 000
plays an active role in the fate of contami-
10 000
nants. Many contaminants are bound to par-
5000
ticles, and sedimentation and resuspension
processes will determine whether the contami-
0
Jan
Feb
Mar
Apr
May
June
July
Aug
Sep
Oct
Nov
Dec
nants reach the Arctic Ocean or are deposited
along the way. When a river flows slowly, par-
Concentration of sediment in water, mg /liter
4000
ticles usually settle, and bottom sediments can
Mackenzie River, 1972-1991
Daily mean concentration
become enriched in metals, persistent organic
3500
Average of daily means
pollutants, and hydrocarbons. However, the
river bottom is usually only a temporary trap
3000
since turbulent flow can lead to the resuspen-
sion of particles. Large lakes, on the other
2500
hand, can serve as permanent traps for conta-
minants. Great Slave Lake on the Mackenzie
2000
River system, for example, blocks much pole-
ward transport of contaminants, particularly
1500
those bound to particles.
1000
Man-made lakes are no less important.
Dams constructed along the Yenisey River in
500
the 1960s and 1970s illustrate the role of man-
made lakes as particle traps. Eight reservoirs,
0
controlling about one-fourth of the river flow,
Jan
Feb
Mar
Apr
May
June
July
Aug
Sep
Oct
Nov
Dec
caused a three-fold reduction in the amount of
tances even when contaminants are adsorbed
Top: Variation in dis-
sediment that reached the mouth of the river.
to particles. Through resuspension of bottom
charge of water in the
These sediments were deposited in the reser-
sediments, these fine clay particles also gather
Mackenzie River over
the year.
voirs. Dams can also change the seasonal pat-
metals and hydrocarbons originating from
Bottom: Variation in
tern of the flow, distributing it more evenly
natural weathering processes.
concentration of sedi-
throughout the year.
Living organisms help the sedimentation
ment in the water of the
The fate of specific contaminants is deter-
process in lakes, just as they do in deltas and
Mackenzie River over
mined by how well they adhere to particles
estuaries. Phytoplankton extract material that
the year.
and by the type of particles in the water. The
is dissolved in the water, and many zooplank-
smallest particles often have the highest con-
ton and larger filter feeders gather suspended
centrations of contaminants due to their
matter, effectively packaging small particles
larger relative surface area, and these settle
into larger ones. The material is deposited on
less quickly than coarser material. There is
the bottom, which becomes a mixture of inor-
thus a potential for transport over long dis-
ganic sediment, shells, and excrement.
Flooding of Yenisey
River shown in yellow
NOAA/TSS/AKVAPLAN-NIVA
©
on satellite image.
Rivers carry fresh water and
time in the flat landscape. During spring melt,
sediment to the Arctic seas
they will follow the runoff and end up in rivers.
In total, Arctic rivers carry
Wetlands are thus important secondary sources
about 4200 cubic kilometers
Yukon
60 million tonnes
of pollution to surface rivers in this region and
of water per year into Arctic
Kolyma
are likely to remain so for a long time.
seas, along with about 221
Mackenzie
16.1 million tonnes
million tonnes of sediment
Another example where wetlands act as sec-
42 million tonnes
per year. The landscape de-
Lena
ondary sources is in areas with intensive metal
termines the role of each
17.6 million tonnes
industries, such as the Kola Peninsula, where
particular river. Those cros-
Nelson
Yenisey
metals are likely to leach into waterways even
sing flat, frozen tundra gen-
5.9 million tonnes
0.7 million tonnes
after emissions decrease.
erally carry relatively small
16.5 million tonnes
Ob
amounts of sediment. The
Mackenzie River, on the
13.5 million tonnes
other hand, flows through
Pechora
3.8 million tonnes
a much steeper landscape,
Where the river
Northern Dvina
with less permafrost and
meets the sea
with abundant surficial
Yearly discharge of
material that can be eroded.
suspended sediment
Rivers enter the ocean through estuaries and
by major rivers.
Consequently, it carries
deltas along the coastal zone. The physical and
larger amounts of sediment.
biological processes in these environments
have a major impact on the fate of contami-
Lakes do not control the transport of water-
nants carried by river water and river ice.
borne contaminants as much as they do for
particle-bound substances. Often, snowmelt
Deltas and estuaries serve as particle traps
flows through small Arctic lakes without mix-
ing. Therefore, at least for headwater lakes,
In the context of contaminant transport, the
most of what comes in also flows out. The
major physical role of deltas and estuaries is as
load of contaminants in lakewater is therefore
particle traps for particulate matter in river
more likely to reflect input from rain and
water. Rivers flow more slowly and with less
ground runoff during summer.
turbulence when they reach the coast, allowing
particles to settle. The containment of particles
is enhanced when sediments that settle farther
Wetlands can be contaminant sources
out are transported back toward the river
Through snow, rain, and dry deposition, the
mouth by inflowing seawater. The sediment is
vast wetland areas in the Arctic, with numer-
thus advected back upstream before it finally
ous shallow lakes, swamps, marshes, and bogs,
deposits. The settling process is enhanced by
gather contaminants from the air. Water in
the mixing of fresh water and sea water, which
wetlands naturally contains much organic
makes fine colloidal particles stick together
matter, such as humic substances from peat.
and become large enough to settle.
Hydrophobic contaminants tend to bind to
Some water-soluble substances can also be
organic matter, in both soil and water. Some
caught in deltas and estuaries. The main mech-
of these bound contaminants remain in the
anism for this is flocculation, in which dissolv-
ground but some will enter waterways.
ed organic and mineral substances are gath-
Local sources add to the load. For example,
ered into suspended particles. The process is
oil and gas exploitation in northwest Siberia
driven by changes in acidity and salt concen-
releases untreated waste water as well as oil to
tration. Living organisms also help the sedi-
depressions in the landscape. The cold weather
mentation process.
does not allow for much decay of the organic
The efficiency of coastal sediment traps
Mackenzie River delta.
pollutants, which are likely to stay for a long
depends to a large extent on whether a delta is
formed, i.e. a depositional plain where the
sediments build up new land into the sea; or if
tides and waves eventually carry most sedi-
ments away from the river mouth. The largest
deltas are created by major rivers draining
large areas and carrying abundant sediment. If
the continental shelf is shallow, the delta plain
can continue far out to sea, beneath the ocean
surface. Two examples of huge deltas are those
of the Lena River in Russia and the Mackenzie
River in Canada. The Mackenzie Delta accu-
mulates several centimeters of overbank sedi-
ment every year. This can be compared with
accumulation rates of 10-100 centimeters in
1000 years in estuaries, or 1-3 millimeters per
WIDSTRAND
1000 years for ocean sedimentation.
Large amounts of the suspended matter in
STAFFAN
rivers can thus be deposited and excluded from
further transport to the open ocean. Along the
during part of the year, which allows for the
29
Russian Arctic coast, only 10 to 20 percent of
exchange of contaminants between water and
Physical pathways
the particulate matter in the Ob and Yenisey
air; and they have high biological productivity,
Rivers travels farther than the borders of the
which provides a route for contaminants into
deltas and the Kara Sea shelf.
the food web. The diagrams below summarize
the major processes for redistribution of conta-
minants in the coastal zone.
Landfast ice
keeps sediments close to shore
Sea ice may gather
Many Arctic rivers discharge into areas with
and transport contaminants
extensive ice cover. Maximum river flow
occurs at the time that the landfast ice in the
In recent years, sea ice has become a focus of
shelf seas is about to break up. If the early,
research concerning contaminant pathways in
sediment-laden river water flows on top of the
the Arctic. The picture is just emerging, but
ice, the heavy load of dark particles will speed
some hypotheses are interesting to consider.
up the melt, and the sediments will settle to the
There are two major ways in which sea ice
bottom along the coast. If the near-shore ice
gathers contaminants: from the atmosphere,
cover is anchored to shallow off-shore banks,
where its large surface area makes it an effi-
it can form a barrier to offshore transport of
cient trap for air-transported contaminants,
any floating material such as dirty river ice. In
and from the water during ice formation. Sea
both cases, the sedimentary material will most
ice can incorporate sediments in much the
likely be deposited near the shore.
same way as river ice: frazil and anchor ice
formation capture material from the sea bot-
tom. This incorporation of particles in ice is
The continental shelves
especially effective for silt-size or smaller parti-
cles. Because many contaminants are preferen-
The shallow continental shelves surrounding
tially associated with these fine-grained parti-
the Arctic Ocean are important for the trans-
cles, the ice can become more contaminated
port of contaminants within the Arctic for
with these substances than the water.
three reasons: they are the primary areas of ice
When ice formed in the shelf seas becomes
formation and ice melt; they have open water
part of the pack ice, associated contaminants
Atmospheric transport
Gas exchange
Sediment deposition
Turbid plume
River inflow
Pack ice
Ice melt
Summer stratified layer
Flocculation
Bottom
resuspension
Biogenic
Particles from
by waves
particles
melting ice
Salt wedge
Upwelling
Spring/summer
Gas exchange
Sediment incorporated in ice
River inflow
Landfast ice
Shear
zone
Strong stratification
Anchor ice
Brine drainage
Suspension
freezing
Polar mixed layer
Ice scouring
Summary of different
processes determining
the fate of contaminants
along the coast and in
Winter
the shelf seas in spring/
summer and in winter.


contaminant-laden particles often form pools
of dirt on the surface, so called cryoconites.
Once at the surface, any semi-volatile material
can interact with the atmosphere. Other mate-
rials will be released when the ice melts.
Sediment traps along the Fram Strait show
that most of the ice-carried debris will be
released in the marginal ice zone. The timing
and location of the ice melt coincide with the
bloom of biological activity, and thus provides
an opportunity for contaminants to enter the
food chain. Many small plants and animals
live at the ice-water interface (the epontic
zone), and can be exposed to much higher lev-
els of contaminants than would be expected
from the contaminant load of the water.
Similar processes also occur under the ice in
the central Arctic Ocean, but are less well
understood.
If the sediments have aggregated into pel-
lets, they will sink to the ocean floor much
faster than fine particles. If the ocean is deep
enough, contaminants in these pellets are less
likely to be taken up in the food chain.
Water-soluble contaminants
follow the brine
NOAA/TSS/AKVAPLAN-NIVA
©
Water-soluble substances behave differently
Satellite image of sea ice
are carried away by the drifting ice. Much of
than those that adhere to sediments, but sea-
in the Barents and Kara
the ice in the Arctic Ocean circulates for one to
ice formation can still provide a route for long
Seas. The large white
seven years before it leaves the basin and
range-transport. The mechanism is quite dif-
area is snow-cover on
melts. The map on page 32 shows the major
ferent. When sea water freezes, brine (a con-
Novaya Zemlya, Russia.
circulation patterns.
centrated salt solution) is expelled into the
Ice is not a passive vessel for contaminants.
water, and water-soluble compounds follow
Melting at the surface, drainage, and refreez-
along. If the water is not stratified, the brine
ing from the bottom will redistribute the mate-
mixes with the surrounding water and can
rial carried by the ice. Most of it will appear at
penetrate into the deep parts of the ocean. In
the surface after a few years. The dispersed,
the absence of particles, even contaminants
Ice can scour the sea floor
Icebergs are a spectacular feature of Arctic ice. They are pieces of glaciers that have broken off and floated away in the sea. Calving glaciers
cover much of Greenland, Svalbard, Franz Josef Land, Severnaya Zemlya, and the northern island of Novaya Zemlya. The photos show ice-
bergs near the Jakobshavn Icebrae, Ilulissat.
Beneath the surface, icebergs can reach depths of more than 100 meters, and can scour the bottom in shallow areas. Such scouring marks
can be several meters deep and tens of meters wide. Icebergs are not important for transporting contaminants but might disrupt waste contain-
ers that have been dumped on the sea floor.
Sea ice can also disturb the bottom, especially along shallow shores and when it is compressed into thick pressure ridges. The ridges can
scour the bottom and stir up contaminant-laden sediment, making it available to biota and to further transport by water currents.
Iceberg sources
Arctic Ocean
Major
Minor
Canada
NILSSON
Ilulissat
Common iceberg tracks
Greenland
PETERSEN; right: ANNIKA
Atlantic Ocean
Common iceberg tracks
Left: HENNING SLOTH
that normally adhere to particles, such as
radiocesium, follow the brine.
31
Open water allows
for atmospheric exchange
Pacific water
In summer, the shelf seas are relatively free of
ice, while in winter, ice covers the areas closest
to the coast. Farther out, between the landfast
Beaufort Gyre
0.8
Transpolar Drift
ice and the permanent pack ice, offshore winds
often form areas of open water. These flaw
leads, also called coastal polynyas, can extend
Precipitation
0.05
over thousands of square kilometers.
Flaw leads along the coast are important
areas for the interchange of semi-volatile cont-
1.9
aminants between water and air. For example,
0.04
1.7
2.0
soluble, gaseous pollutants that make their
way to the Arctic can dissolve in the cold Arc-
tic waters.
1.2
0.16
Moreover, the leads typically form the locus
3.1
4.9
of ice break-up from late April to mid May
Atlantic water
and thus are a gathering place for many marine
animals. As is the case along the marginal ice
8.0
zone, the high primary productivity and rich
Atlantic water + Intermediate layer, 200-1700 m
wildlife of these areas provide a route for cont-
Pacific water, 50-200 m
aminants to enter biological pathways, as is
Surface water circulation
further discussed in the chapter Arctic Ecology.
River inflow
Figures are estimated in- or outflows in Sverdrups
The transport of water
(million m3 per second)
with the main ocean cur-
The Arctic Ocean
other oceans only through restricted passages.
rent systems in the Arctic.
The major inflow of ocean water passes from
The Atlantic-layer water
mass originates from the
The Arctic Ocean and the surrounding seas
the North Atlantic through Fram Strait and
surface of the North At-
receive contaminants from air, other oceans,
the Barents Sea. There is also some inflow
lantic Ocean and descends
rivers, and from direct discharges. The fate of
from the North Pacific through the Bering
below less-dense Arctic
these substances is determined both by Arctic
Strait. The ocean transport of pollutants is
Ocean surface water,
which is affected by fresh-
Ocean circulation patterns and by the stratifi-
slow, taking years to decades to transport
water from rivers. The
cation of the ocean waters.
water from industrialized, temperate coastal
Pacific water mass is pro-
Geographically, the Arctic Ocean is often
regions to the Arctic Ocean.
duced by modification of
described as a `mediterranean' sea because it is
The movement of water and pollutants in
water entering the Bering
surrounded by land, communicating with
the Arctic Basin is best understood by viewing
Strait on the broad Chuk-
chi Shelf and occurs in the
Canada Basin.
Ice
Polar mixed layer
Pacific halocline
Atlantic halocline
Bering Strait
Fram Strait
Depth, m
0
ca. 10 years
200
Pacific water
ca. 10 years
400
Atlantic water
ca. 25 years
600
ca. 30 years
Atlantic layer
800
1000
Arctic deep water
Norwegian Sea
Bering
Strait
and Greenland Sea
ca. 75 years
deep water
2000
Canada
Makorov
Basin
Basin
Fram
Alpha
Strait
Ridge
3000
ca. 300 years
Amundsen
Nansen
Basin
Basin
Vertical section of the
Arctic Ocean and the
ca. 290 years
Nansen
Lomo-
different water masses
Gakkel
nosov
with their approximate
Ridge
Ridge
4000
residence times. The ver-
tical scale is exaggerated
Bold figures denote residence times
compared to the hori-
zontal scale.
32
breaks up and allows surface waters to sink
and deep water to rise to the surface. This hap-
pens every fall and winter when the water cools
and when ice starts to build, expelling brine.
This vertical mixing allows both nutrients and
contaminants from deeper layers to reach the
surface in the shelf seas and Nordic Seas.
5
4
Two main features characterize the circula-
tion of the surface water: the Beaufort Gyre
3
6
Beaufort
and the Transpolar Drift; see map left. The
Gyre
2
Beaufort Gyre is a large clockwise gyre extend-
ing over the entire Canadian Basin. It circu-
lates slowly between the pole and the Cana-
1
dian Archipelago. In this way, water is ex-
Transpolar
Drift
ported both to Baffin Bay through the Cana-
dian Archipelago and to the Transpolar Drift.
Fram
The Transpolar Drift runs east to west
Strait
across the Eurasian Basin from the Siberian
coast out through the western Fram Strait.
Tracer studies show that about 10 percent of
the water in this current comes from rivers,
making it a conveyer belt for any contami-
nants that reach the open ocean through estu-
aries and deltas. The rest of the water comes
from the Bering Strait and from the shelf seas.
The transport takes only five years from the
Ice cover
continental shelves to Fram Strait.
September
the ocean as a layered system; see the diagram
March
Surface water
below.
circulation
Atlantic layer circulation
Number of years
has been traced with radionuclides
x
for sea ice
to exit Fram Strait
Arctic surface water
has a mixed layer and a halocline
Immediately below the Arctic surface layer is
Sea-ice extent in Septem-
the Atlantic layer. This water enters the Arctic
ber and March and the
The Arctic surface water extends to a depth
Ocean at the surface through Fram Strait and
major surface currents
of approximately 200 meters. This water can
the Barents Sea, submerges, circulates around
governing the transport
of sea ice. The numbered
be further subdivided into the polar mixed
the Arctic Basin, and exits back through the
lines show the expected
layer (0 to 50 meters depth) and the halocline
Fram Strait, still submerged.
time in years for the ice
(50 to 200 meters depth). The water comes
Radionuclides from Sellafield, a nuclear
at that location to exit
from rivers, the shelves, and from the Atlantic
reprocessing plant on the northwestern coast
the Arctic Ocean through
Ocean through the Fram Strait. One of the
the Fram Strait.
of England, give a tell-tale sign of water cur-
most important routes is via the North Atlan-
rents. The North Atlantic Current (an exten-
tic Current.
The polar mixed layer is formed in winter
Arctic Ocean
when the ice freezes and excludes brine, and in
summer by melting sea ice and river runoff
10
along the coast. It is the only water within the
4-6 years
4000 km
1-2
Arctic that has direct contact with the atmos-
6-8 years
5000 km
phere and consequently the only water that
can exchange semi-volatile contaminants with
3000 km
the air.
Greenland
50
The halocline is a structurally complex
3-4 years
6000 km
region with water of increasing density. It is
Norway
Time taken for radio-
crucial to the transport of contaminants. Over
2000 km
50
cesium released from
the shelves, it transports water laterally, away
7000 km
4 years
100
3 years
Sellafield to be trans-
from the coast, as heavy, saline water sinks
1000 km
ported to the Arctic
along the bottom.
1000
1 year
Sellafield
Ocean. Bold figures rep-
Atlantic Ocean
resent relative concen-
Away from the shallow coast, the role of the
UK
trations at different
halocline depends on the season. In spring and
points.
summer, it provides a barrier between the sur-
face water and any deeper waters, effectively
sion of the Gulf Stream) transports large quan-
blocking vertical mixing of contaminants. It
tities of warm water from the Gulf of Mexico
also limits the exchange of volatile contami-
via the European coast to the Arctic. Any con-
nants between deeper layers of the ocean and
taminants entering the current from rivers,
the atmosphere. One important transport
ocean dumping, or the atmosphere will be car-
process thus takes place when the halocline
ried along. Radiocesium from the Sellafield
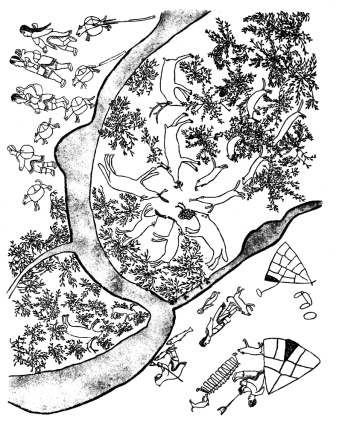
Fridtjof Nansen counted on the Transpolar Drift
and the Barents Sea as the Bering Strait is too
33
`Everywhere, the ice has stopped people in their quest
shallow. The water moves counter-clockwise.
Physical pathways
to reach the North. Only in two cases have the ships
Contaminants enter Arctic deep water
drifted northward once they were stuck in the ice . . . By
mainly by flow of dense water off the shelves.
reading the history of Arctic research, it became clear to
Once there, they can be transported long dis-
me that it would be difficult to capture the secrets of the
tances. One example is the anomalously high
unknown widths of ice by the routes that have been tried.
But where did the road go?'
ratio of cesium-137 to strontium-90, which in
The transpolar drift was documented in the 19th
1979 was observed at the Eurasian Basin flank
century by the Norwegian polar explorer Fridtjof Nansen
of the Lomonosov Ridge. It represents a signal
with his ship Fram. Three observations gave him the idea
from the Sellafield nuclear reprocessing plant
that water and ice moved according to a particular pat-
on the Irish Sea. The signal was carried either
tern. He had found trees from Siberian forests as drift-
wood on the eastern coast of Greenland. He had also
from Spitsbergen or from the continental slope
found a throwing tool for bird hunting that was typical
off the Barents Sea to the North Pole and then
around the perimeter of the Eurasian Basin in
about 3 years.
The Arctic deep water has an extremely
long residence time, and any contaminants
The Inuit throwing tool
entering this layer might stay in the Arctic for
up to 300 years.
Summary
of Alaskan Inuit on the Greenland shore. But most im-
portant, pieces from the American ship Jeanette had been
Air, water, and ice can carry contaminants over
found on the drift ice south of Greenland. Jeanette had
great distances.
been lost in the ice near the New Siberian Islands on her
In winter, industrial areas of Eurasia are
way north from the Bering Strait. Nothing but drifting
within the Arctic air mass, which provides for
ice could have carried this material over such long dis-
tances. There had to be a current from east to west, and
efficient air transport of particle-bound conta-
Fridtjof Nansen was determined to take advantage of this
minants across the pole. Semi-volatile com-
in his quest to cross the unexplored polar sea. He built a
pounds are carried to the Arctic by cycles of
ship that would survive the crushing forces of the ice and
evaporation, transport, and condensation in a
set out on his journey in the summer of 1893. By mid
fall, the ship was securely lodged in the pack ice north of
multi-hop process. The cold climate traps them
the New Siberian Islands, just as predicted, and it was
more effectively here than anywhere else on
only a matter of time and patience to let the currents do
the globe.
their job. The journey was slow and trusting his theory
Snow, rime ice, rain, and dry deposition
was not always easy. Every sign of progress was noted in
cleanse the air and contaminate the surfaces on
his diary:
`Friday February 16. Hurrah! Our meridian observa-
which they land. The contaminants often end
tion this morning gave 80°1'N. We have come a few min-
up in meltwater that feeds both rivers and the
utes northward since last Friday, even though the wind
ocean surface layer.
has been blowing constantly from the north since Mon-
Rivers process contaminants along their
day. It is very strange. Could it be, as I have thought
routes by sedimentation and resuspension of
myself, observing the skies and the misty air, that it has
been a southerly wind further south, which stops the drift
particles. Lakes, estuaries, and deltas serve as
of the ice in that direction? Or have we finally come
sediment traps and sinks for contaminants.
within an area where a current acts?'
Ice forming in the shelf seas can pick up
Time proved that Fridtjof Nansen was right, that
contaminants from the coastal shelves, and can
there is an east-to-west current. After three years, in
travel far in the Beaufort Gyre and Transpolar
August 1896, Fram was released from the ice as the
Transpolar Drift reached Spitsbergen.
Drift. The ice may release its load of contami-
nants in the biologically productive shelf seas
nuclear reprocessing plant can, for example, be
and in the North Atlantic, where they can be
detected all along the Norwegian coast as well
taken up into the food chain.
as in the Arctic Ocean. Some of the north-
Another important pathway is via ocean
flowing water is returned to the North Atlantic
currents. They act slowly compared with the
in a subsurface flow along the eastern coast of
atmosphere, but take water with water-soluble
Greenland, but a substantial part of this his-
and particle-adsorbed contaminants from dis-
torical discharge now resides in the Arctic
tant industrialized coasts into the Arctic within
Ocean.
a few years, and out again through the East
Greenland Current and the Canadian
Arctic deep water
Archipelago. The sea is the final resting place
has extremely long residence time
for most contaminants.
Modeling is a useful tool for understanding
Arctic deep water extends from 800 meters
contaminant transport. Its importance will
downward and is divided into the Canadian
grow as the basic processes become better
Basin deep water and the Eurasian Basin deep
understood and the models improve.
water. The only inflow is through Fram Strait