
41
Chapter 5
Effects on Terrestrial Ecosystems
John Derome, Sirkku Manninen, Julian Aherne, Paavo Hellstedt, Jean-Paul Hettelingh, Kevin Hicks, Satu Huttunen,
Juha Kðmðri, Galina Kashulina, Mikhail Kozlov, Annamari Markkola, Maximilian Posch, Anna-Liisa Ruotsalainen,
Reijo Salminen, and Elena Zvereva
The first AMAP assessment of acidification (AMAP, 1998)
addressed the processes involved in the acidification of
arctic soils, and the direct effects of sulfur dioxide (SO2)
and nitrogen oxides (NOX), as well as acidifying deposi-
tion, on the biotic components of terrestrial ecosystems.
At that time, however, there was little empirical evidence
to suggest that soil acidification was anything more than
a local problem in very limited parts of, for example, the
Kola Peninsula. The serious damage to flora and fauna
reported in the area was mainly attributed to the direct
toxic effects of SO2, combined with the accumulation of
toxic heavy metals in the arctic environment. It is extremely
difficult to distinguish between the direct effects of SO2, the
indirect effects of the deposition of acidifying compounds
(SO2 and sulfate (SO4)), and the direct toxic effects of heavy
metals on terrestrial ecosystems in the areas around the
smelters. In the Arctic, the cumulative effects of acidifying
emissions and the deposition of toxic heavy metals can
AMAP boundary
be disastrous for ecosystems which are already subject to
extreme climatic conditions. In this, the latest acidification
assessment, a large amount of new empirical data are pre-
sented and discussed.
Most
Least
No
sensitive
sensitive
data
5.1. Effects on soils
Figure 5.1. Sensitivity of arctic ecosystems to acid deposition (Kuylen-
stierna et al., 2001).
Kuylenstierna et al. (2001) have mapped the relative sen-
sitivity of terrestrial ecosystems to acidic deposition at the
global scale. An overview of the sensitivity of arctic ecosys-
tems is provided in a circumpolar map extracted from the
via long-range transport from industrial sources in China,
global sensitivity map. The sensitivity classes are based on
India, and other parts of the Far-East, reliable deposition
base saturation and cation exchange capacity data applied
data and information about the soil acidification status of
to FAO (Food and Agriculture Organization) soil types.
the region are extremely difficult to obtain. Other parts of
The soils most sensitive to acidic deposition have a low
the Arctic receive acidifying compounds via long-range
base saturation (<40%) and a low cation exchange capacity
transport from North America, Europe and the Far-East
(<10 meq/100 g); the implication is that these soils have
but, according to deposition measurements made in the
low rates of long-term mineral weathering and a limited
Arctic, the levels are not likely to cause widespread soil
base cation content and may therefore be subject to rapid
acidification in background areas in the near future.
changes in base saturation and pH. The most sensitive ar-
eas occur in Fennoscandia, in parts of Russia, and in parts
of Canada and Alaska. Much of the Canadian Arctic seems
5.1.1. Acidity status of soils
not to be sensitive to acidic deposition (Figure 5.1).
on the Kola Peninsula
AMAP has identified three regions in the Arctic that
may be susceptible to acidification caused by the deposi-
The results of two regional studies Ù the Kola Ecogeo-
tion of acidifying compounds (sulfur and nitrogen): the
chemistry Project (www.ngu.no/Kola) and the Barents
Kola Peninsula in northwestern Russia, the Taymir Penin-
Ecogeochemistry Project (www.gsf.fi/Barents) Ù have
sula in northern Russia, and the Chukotka region in east-
recently become available. These cover the distribution
ern Siberia. The Kola Peninsula and the Taymir Peninsula
area of SO2 emissions from the Cu-Ni smelters in Nikel,
both receive acidifying compounds from major local point
Zapolyarnyy and Monchegorsk on the Kola Peninsula,
sources; deposition in these areas has been, and is still,
and almost pristine areas of northern Finland (Reimann et
high. There is a large amount of information about the ef-
al., 1998a; Salminen et al., 2004). The survey carried out as
fects of acidic deposition on soils on the Kola Peninsula but
part of the Kola Ecogeochemistry Project had a sampling
much less about effects on soils in the Norilsk area. Owing
density of approximately 1 site per 300 km2 and gener-
to the very high SO2 emissions from the Norilsk smelter
ated information about soil acidity status and the most
complex, the acidifying effects are potentially many times
important natural and anthropogenic factors contributing
higher than on the Kola Peninsula. Although the Chukotka
to soil acidity in this region (Reimann et al., 1998a, 2000a;
region may receive large amounts of acidifying pollutants
Kashulina et al., 1998a,b, 2003; Kashulina and Reimann,
42
AMAP Assessment 2006: Acidifying Pollutants, Arctic Haze, and Acidification in the Arctic
2001; Kashulina, 2002). Figure 5.2 shows the area discussed
ing north through the 100 km wide coastal zone. There is
here. The results of the Barents Ecogeochemistry Project,
a 10-fold increase in sodium (Na) and a 2-fold increase in
undertaken five years later and with a lower sampling den-
magnesium (Mg) in ground mosses and the O-horizon
sity, confirmed the overall conclusions of the Kola Ecogeo-
over the same coastal zone (Figure 5.3). This indicates that
chemistry Project, and in addition, provided information
marine aerosols are probably the main factor explaining
about temporal trends in soil acidity in the region.
the pH increase near the coast. The figure also indicates
According to the Kola Ecogeochemistry Project, the
that natural precipitation chemistry can have a significant
pH(H2O) of the organic (O) horizon of podzolic soils in
effect on acidity parameters in the O-horizon.
1995 ranged from 3.2 to 5.6. Although the region has re-
ceived high levels of acidifying deposition for about 60
Bioclimatic factors
years, this wide range in pH cannot be related to the effects
The distribution of Na concentrations (Na is a major ele-
of two of the world's largest SO2 emission sources, which
ment in marine aerosols, but not an important plant nu-
are located on the Kola Peninsula, since an even greater pH
trient) in mosses and the O-horizon (Figure 5.3) suggests,
range (3 to 6) has been reported as typical for the O-horizon
however, that the influence of marine aerosols is only re-
of podzols in background areas (Targulian, 1971).
sponsible for the southÙnorth pH gradient in the O-horizon
within a distance of 200 km from the coast. The minor
increase in pH between 200 and 500 km from the coast
5.1.1.1. Natural factors affecting soil acidity
coincides with a slight increase in Mg and calcium (Ca)
concentrations (Mg and Ca are both important plant nu-
Marine input of base cations
trients) (Figure 5.3). The southward decrease in exchange-
There is a relatively strong decreasing trend (0.6 pH units)
able Ca and especially Mg concentrations in the O-horizon
in the acidity of the O-horizon along a southÙnorth gradi-
is probably due to increasing uptake and utilization by
ent running through the background area (from the Arctic
plants. Thus, the change in bioclimatic factors (climate +
Circle to the coast of the Barents Sea) of northern Finland
vegetation) on moving from south to north may also affect
(Figure 5.3) (Reimann et al., 2000b; Kashulina et al., 2003).
the distribution of acidity in the O-horizon in the region
The sharpest increase in pH (0.4 pH units) occurs on mov-
(Kashulina et al., 2003).
D
0 km
50
100
HonningsvÍg
Vard½
N O R W A Y
Vads½
Lakselv
Kirkenes
Barents Sea
Petschenga
Nikel
Zapolyarnyy
F
E
Severomorsk
Murmansk
Kola
Allarechka-Vostok
Gremyakha-Vyrmes
Ivalo
Lovnozero
F I N L A N D
R U S S I A
Olenegorsk
B
A
Monchegorsk
Revda
Saattopora
Suurikuusikko
Kirovsk
Kovdor
Kittilð
Keivitsa
Apatity
Pahtavaara
Mine, in production
Mine, closed down
Kandalaksha
Important mineral
Alakurtti
occurrence, not developed
Umba
35¯30'E
Smelter, production
of mineral concentrate
24¯E
Arctic Circle
White Sea
City, town, settlement
C
Rovaniemi
Project boundary
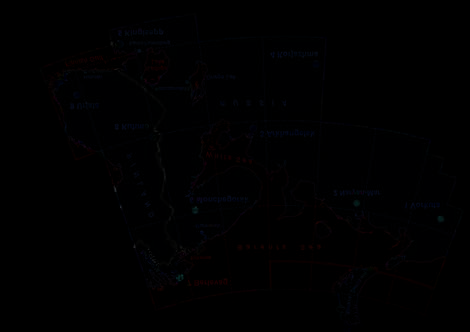
Figure 5.2. The Kola Ecoregion survey area and major industrial centers. The lines AÙB, CÙD, and EÙF mark the transects shown in Figures 5.3,
5.4, 5.5, 5.7, and 5.9.


43
Chapter 5 ñ Effects on Terrestrial Ecosystems
Site-specific and temporal variation
from other industrial sources) supply enough base cations
All the soil acidity parameters showed very high site-spe-
to maintain precipitation at a less acidic level than that re-
cific variation (Figure 5.3). For instance, pH at two adjacent
corded in northern Finland. Current emissions of nitrogen
sites in background areas differed by more than one pH
dioxide on the Kola Peninsula are low and have little or
unit. Acidity in the O-horizon can vary within the same
no effect on precipitation acidity; nitrate concentrations in
site by more than one pH unit over the year (Levina, 1969).
precipitation are low and relatively uniform throughout
Thus, spatial and temporal variation in pH in the O-horizon
the area (Tikkanen and Niemelð, 1995; Kashulina et al.,
may be greater than any natural trends at the regional level.
1998a). Thus, the area where the soil can be affected by
Site-specific characteristics and/or processes can have a
acidified rain on the Kola Peninsula is limited to restricted
stronger deterministic effect on soil acidity status at an
zones around the smelters. The contribution played by the
individual site than any other regional factors (Kashulina
direct adsorption of SO2 on the soil surface on the Kola
et al., 2003).
Peninsula needs to be investigated, however.
Monchegorsk area
5.1.1.2. Sulfur dioxide emissions and soil acidity
The westÙeast transect of pH in the O-horizon, running
The O-horizon of podzols is directly influenced by the
through the area occupied by the Monchegorsk smelter
input of ions and cations in precipitation. In the study
(Figure 5.4), indicates that emissions from industrial ac-
area the organic material in the O-horizon has a lifetime
tivities at Apatity (mining and processing of alkaline rocks
of around 20 to 50 years. As a result, it `integrates' the ef-
mined at Kirovsk near Apatity), located 40 km south-east
fects of pollutant deposition over a relatively long period,
of Monchegorsk, have increased the pH by 0.3 units. These
and the cumulative effect of acidifying pollutants can be
emissions also affect the pH of the surface soil close to the
considerable. According to Kashulina et al. (2003), precipi-
Monchegorsk smelter, and are still detectable at the Rus-
tation acidity is affected by SO2 emissions only within a
sian/Finnish border to the west. The atmospheric origin
radius of 30 km around the smelters. In other parts of the
of this increase in pH is supported by the distribution of
Kola Peninsula, the emissions of base cations (derived from
base cations in moss (Figure 5.4).
the smelters, marine aerosols, and basal and alkaline dust
pH in O-horizon
pH in O-horizon
6
a
6
Monchegorsk
Apatity
a
5
5
4
4
C
3
D
A
3
B
Exchangeable base cations in O-horizon, mg/kg
Exchangeable base cations in O-horizon, mg/kg
10000
10000
b
b
C
Ca
Ca
1000
1000
K
K
Mg
Mg
100
100
Na
Na
C 10
D
A 10
B
Total base cations in moss, mg/kg
Total base cations in moss, mg/kg
10000
c
10000
c
K
K
Ca
Ca
1000
Mg
1000
Mg
100
100
Na
Na
C 10
D
A 10
B
7350
7450
7550
7650
7750
7850
350
450
550
650
750
850
Northing, km
Easting, km
Figure 5.3. Transect southÙnorth across the survey area near the west-
Figure 5.4. Transect westÙeast across the survey area and through the
ern boundary in 1995 (CÙD on Figure 5.2), showing: (a) pH in a water
industrial zone centered on Monchegorsk and Apatity in 1995 (AÙB
extract of the O-horizon; (b) ammonium acetate extractable (pH 4.5)
on Figure 5.2), showing: (a) pH in a water extract of the O-horizon of
base cation concentrations in the O-horizon; and (c) total base cation
podzol soils; (b) exchangeable base cation concentrations in the O-ho-
concentrations in mosses (Kola Ecogeochemistry Project, Kashulina
rizon of podzol soils; and (c) total base cation concentrations in mosses
et al., 2003).
(Kola Ecogeochemistry Project, Kashulina et al., 2003).


44
AMAP Assessment 2006: Acidifying Pollutants, Arctic Haze, and Acidification in the Arctic
The distribution of exchangeable Ca (the dominant
Nikel/Zapolyarnyy area
base cation) in the O-horizon along the transect follows the
Further north, the variation in pH in the O-horizon along
same pattern as for pH (Figure 5.4). However, there is no
an eastÙwest transect through Nikel and Zapolyarnyy is
corresponding trend for potassium (K) or Mg. This could
less than 0.2 pH units (Figure 5.5). There is a very slight
be partly due to the increased leaching into stream water,
(<0.1 pH units) decreasing trend near Nikel, due to a small
observed within 30 km of Monchegorsk (Kashulina et al.,
number of low pH values near Nikel. Correspondingly,
2003). However, the increase in total Mg in mosses (Fig-
the slightly increasing trend near Zapolyarnyy is due to a
ure 5.4) and the O-horizon near Monchegorsk (Reimann
number of relatively high pH values. The eastern end of
et al., 1998a) is in agreement with the increased deposition
the transect has slightly higher pH values than the western
of Mg in the area. The decrease in the exchangeable Mg
end. The distribution of marine-derived cations (Na and
concentration may be associated with low solubility of
Mg) in mosses and the O-horizon indicates an increasing
Mg in anthropogenic particulate material deposited on
maritime influence towards the east, starting near Nikel
the O-horizon.
(Figure 5.5). The western section of the transect is more
A low pH (although within the natural range of pH
inland, while the eastern section ends at the Barents Sea
variation) and extremely low base cation concentrations
coast. In addition to marine-derived deposition, the Zapol-
(Figure 5.4) are characteristic of soils at a number of sam-
yarnyy area receives alkaline dust from opencast mining
pling sites in the immediate vicinity of the Monchegorsk
(Reimann et al., 1997).
smelter where the vegetation cover has been completely
Generally, it appears that the sources of base cations are
destroyed. Low pH values were also reported in case or
sufficient to prevent acidification of the O-horizon, and to
gradient studies within a distance of 5 km from the smelt-
maintain relatively constant pH and base cation concentra-
ers on the Kola Peninsula (Chertov et al., 1993; Koptsik
tions in the vicinity of Nikel and Zapolyarnyy. As is the
and Muchina, 1995; Kashulina et al., 2003). No changes
case for Monchegorsk, only a small number of low values
in soil acidity were found in a gradient study within a
were observed in the immediate vicinity of Nikel/Zapol-
distance of 10 to 80 km from Monchegorsk (Tikkanen and
yarnyy, especially at sites where the vegetation cover has
Niemelð, 1995).
been severely damaged.
5.1.1.3. The role of overburden and
bedrock chemistry
pH in O-horizon
6
Nikel Zapolyarnyy
The simultaneous emission of fly ash by the smelters and
a
associated power plants, and the alkaline nature of the
overburden and bedrock in some areas near the emission
5
sources, are frequently used to explain the lack of wide-
spread soil acidification on the Kola Peninsula, despite
the very high SO2 emissions (Koptsik and Muchina, 1995;
4
Moiseenko, 1997; Tikkanen and Niemelð, 1995). This raises
the question of whether the relatively high base cation con-
tent of the parent material in some areas near both emission
E
3
F
sources (Monchegorsk and Nikel/Zapolyarnyy) can influ-
ence the chemistry of the O-horizon and counteract the
Exchangeable base cations in O-horizon, mg/kg
acidifying effect of the emissions. Relatively poor correla-
10000
tion has been found between the element concentrations in
b
the parent material (C-horizon) and the O-horizon imme-
diately around the Nikel/Zapolyarnyy smelters (Reimann
Ca
1000
et al., 1998b). Base cation concentrations in the O-horizon
K
at all the sampling points show a much closer relation-
Mg
ship with the corresponding concentrations in mosses (the
100
chemistry of which is primarily determined by atmospheric
inputs) (Figures 5.3 to 5.6), than with those in the C-horizon
Na
(Kashulina et al., 2003). Thus, the distribution of acidity in
E 10
F
the O-horizon in the region is mainly determined by the
atmospheric input, and the geological influence is hardly
detectable in the relatively high atmospheric base cation
Total base cations in moss, mg/kg
10000
deposition gradient on the Kola Peninsula. Fly ash from the
c
K
smelter complexes is not the most important source of base
Ca
1000
Mg
100
Figure 5.5. Transect westÙeast across the survey area and through the
Na
industrial zone centered on Nikel and Zapolyarnyy in 1995 (EÙF on
Figure 5.2), showing (a) pH in a water extract of the O-horizon of pod-
E 10
F
zol soils; (b) exchangeable base cation concentrations in the O-horizon
350
450
550
650
750
850
of podzol soils; and (c) total base cation concentrations in moss (Kola
Easting, km
Ecogeochemistry project, Kashulina et al., 2003).
45
Chapter 5 ñ Effects on Terrestrial Ecosystems
Total Ca (C-horizon), mg/kg
Total Ca in moss, mg/kg
10000
10000
1000
1000
100
100
0
1000
2000
3000
4000
5000
0
1000
2000
3000
4000
5000
Exchangeable Ca (O-horizon), mg/kg
Exchangeable Ca (O-horizon), mg/kg
Total Mg (C-horizon), mg/kg
Total Mg in moss, mg/kg
100000
100000
10000
10000
1000
1000
100
100
0
500
1000
1500
2000
2500
0
500
1000
1500
2000
2500
Exchangeable Mg (O-horizon), mg/kg
Exchangeable Mg (O-horizon), mg/kg
Figure 5.6. Ammonium acetate extractable Ca and Mg in the O-horizon of soils (x-axis) vs. their total concentrations (aqua regia extractable) in
the C-horizon of soils and in moss in 1995 (Kola Ecogeochemistry project, Kashulina et al., 2003).
cations in deposition on the Kola Peninsula (Kashulina et
do, however, suggest that there is elevated deposition of
al., 2003). Alkaline dust from the apatite fertilizer plant,
Al into the O-horizon near Nikel/Zapolyarnyy (alkaline
marine aerosols, and alkaline dust from open-cast mining
rock dust from the opencast mine) and near Apatity (apat-
appear to be the major sources of base cation deposition
ity-nepheline dust). The Al concentrations in precipitation
on forest soil in the western part of the Kola Peninsula.
increase to such an extent immediately around the smelt-
The current rate of base cation emissions is sufficient to
ers (Reimann et al., 1997; de Caritat et al., 1998), that Al
maintain soil acidity parameters at levels that are even
is a major cation (in equivalent terms) in rain and snow
less acidic than, for example, in northern Finland. The only
(Kashulina et al., 2003). Thus, the relatively high exchange-
areas with increased soil acidity and exchangeable base
able Al concentrations in the soil and percolation water
cation depletion are in the severely damaged ecosystems
reported near Monchegorsk (Motova and Nikonov, 1993;
immediately around the smelters.
Lukina and Nikonov, 1996) are more likely to be associated
with basal lithology and increased deposition than to the
Exchangeable aluminum
impacts of SO2 emissions.
The major factor governing the distribution of exchange-
The aluminum:base cation (Al:BC) ratio in the O-ho-
able aluminum (Al) in the O-horizon on the Kola Peninsula
rizon (Figure 5.7) shows extremely high spatial variation.
appears to be the bedrock geology (Kashulina et al., 2003).
The highest values occur around Apatity (apatite-nephe-
Aluminum concentrations in the C-horizon along the
line, syenite) and in soils overlying the meta-sedimentary
transect running through the major SO2 emission source
rocks of northern Norway. The Al:BC ratio in the O-horizon
areas (Figure 5.7) are more similar to the concentrations
shows a good correlation with the total Al concentration in
in the O-horizon than to the moss concentrations (Figure
the C-horizon (r = 0.73), and so the geology is therefore the
5.4). The Al concentrations in mosses along the transect
main factor determining the Al:BC ratio in the O-horizon


46
AMAP Assessment 2006: Acidifying Pollutants, Arctic Haze, and Acidification in the Arctic
Al in O-horizon, mg/kg
Al in O-horizon, mg/kg
100000
100000
Monchegorsk
Apatity
Nikel Zapolyarnyy
a
10000
Total Al
10000
Total Al
1000
1000
Exchangeable Al
100
100
Exchangeable Al
A
10
B
E
10
F
Al in C-horizon and moss, mg/kg
Al in C-horizon and moss, mg/kg
100000
100000
b
C-horizon
C-horizon
10000
10000
1000
1000
Moss
Moss
100
100
A
10
B
E 10
F
Exchangeable Al:(Ca+Mg+K+Na) ratio in O-horizon
Exchangeable Al:(Ca+Mg+K+Na) ratio in O-horizon
10
10
c
1
1
0.1
0.1
A
0.01
B
E 0.01
F
350
450
550
650
750
850
350
450
550
650
750
850
Easting, km
Easting, km
Figure 5.7. A comparison of the two westÙeast transects across the survey area in 1995 (AÙB and EÙF on Figure 5.2), showing changes from east
to west in (a) total Al (nitric acid) and exchangeable Al concentrations in the O-horizon; (b) total Al concentrations in moss and Al (aqua regia
extracts) concentrations in the C-horizon; and (c) the exchangeable Al:(Ca+Mg+K+Na) ratio in the O-horizon (Kola Ecogeochemistry Project,
Kashulina et al., 2003).
(Kashulina et al., 2003). Emissions affect the Al:BC ratio in
5.1.1.4. Connections between soil condition
the soil only within the immediate vicinity of the smelt-
and ecosystem quality
ers. Furthermore, this appears to be an indirect effect of
pollution via damage to the ecosystem. Elevated Al:BC
Soil acidity
ratios also occur in the completely destroyed ecosystems
The distribution of the major acidity parameters in the vari-
(Figure 5.8).
ous classes of ecosystem damage (Kashulina et al., 2003)
47
Chapter 5 ñ Effects on Terrestrial Ecosystems
CDF, %
CDF, %
100
100
80
80
60
60
40
40
Damage
FIN No damage
RUS No damage
20
20
RUS Depressed
RUS Strong
RUS Complete
0
0
3.0
4.0
5.0
6.0
100
1000
10000
pH
Ca, mg/kg
100
100
80
80
60
60
40
40
20
20
0
0
10
100
1000
10000
100
1000
10000
Mg, mg/kg
K, mg/kg
100
100
80
80
60
60
Figure 5.8. Cumulative distribution
functions (CDF, %) of pH (water ex-
traction), exchangeable Ca, Mg, K, and
40
40
Al concentrations and the exchangeable
Al:(Ca+Mg+K+Na) ratio in the O-hori-
zon in the `no visual damage' zone in
20
20
Finnish Lapland and for various classes
of ecosystem damage in the western
part of the Kola Peninsula in 1995 (Kola
0
0
1
10
100
1000
0.01
0.1
1
10
Ecogeochemistry Project, Kashulina et
al., 2003).
Al, meq/kg
Al:(Ca+Mg+K+Na)
shows that the onset of ecosystem damage (and even of
Niemelð, 1995). A deterioration in the nutrient status of
serious ecosystem damage) on the Kola Peninsula occurs
the soil on the Kola Peninsula has occurred only in the
where there is a more favorable (higher pH and base cation
completely destroyed ecosystems around the smelters.
concentrations) acidity status in the O-horizon compared
There is also a decrease in phosphorus concentrations in
with background areas in northern Finland (Figure 5.8).
the seriously damaged ecosystems within a radius of 30
In contrast, severe ecosystem damage appears to be a
km around the smelters. Manganese concentrations below
prerequisite for soil acidification to appear on the Kola
the deficiency level only occurred at sites with serious or
Peninsula.
complete destruction of the ecosystems (Kashulina, 2002).
Furthermore, the depletion of major nutrients is not a spe-
Plant nutrients
cific reaction of the ecosystem to acidifying deposition.
In addition to base cations (Ca, Mg, K) and other impor-
Thus, the indirect effect of acidifying pollutants on the
tant nutrients (e.g., nitrogen and phosphorus), depletion of
condition of ecosystems via soil acidification and nutrient
some other nutrients (e.g., manganese (Mn) and zinc (Zn))
depletion does not appear to be the main factor affecting
is regarded as one of the detrimental consequences of acidi-
forest ecosystem condition on the Kola Peninsula. The di-
fying deposition on ecosystems (Galloway, 1995). A sharp
rect effects of SO2 on the vegetation (Aamlid et al., 1995;
decrease in some nutrients (Mn, Zn, Mg) has been reported
Tikkanen and Niemelð, 1995; Kashulina et al., 2003) is a
in severely damaged ecosystems around the smelters on
much more likely explanation for the widespread dam-
the Kola Peninsula (Lobersli and Venn, 1995; Tikkanen and
age to ecosystems on the Kola Peninsula. The significant
48
AMAP Assessment 2006: Acidifying Pollutants, Arctic Haze, and Acidification in the Arctic
increases in the concentrations of some other pollutants
Devonian calcareous and dolomitic marls, and sulfate-
(e.g., nickel, cobalt, cadmium, silver, arsenic, lead, copper
rich evaporates and lower Carboniferous shallow water
and others) of up to a few orders of magnitude in the soil
limestones. Westward from Norilsk the bedrock changes
near the major emission sources (Rðisðnen et al., 1997; Rei-
and mainly includes intermediate and more acidic types
mann et al., 1998a; áyrðs and Kashulina, 2000) is obviously
of rock.
contributing to the widespread ecosystem damage.
In 2001, water and soil samples were collected from
ten sites in the Norilsk industrial area and in the uncon-
taminated area to the east of the industrial zone. Stream
5.1.1.5. Temporal trends in soil acidity
water samples were collected from each site and complete
A comparison of soil acidity parameters near the Monche-
soil profiles were collected from two sites Ù one in the in-
gorsk smelter in 1995 (Reimann et al., 1997; Kashulina et
dustrial area and the other in the clean background area.
al., 2003) and 2000-2001 (Salminen et al., 2004) showed no
Organic layer samples were also taken from two sites. The
clear changes in the exchangeable Ca concentration in the
sampling and analytical procedures are as reported by Gre-
O-horizon (Figure 5.9). The values obtained in the sparser
gorauskiene et al. (2000) and Salminen and Gregorauskiene
sampling network in 2000 are within the range of spatial
(2002).
variability reported for 1995.
The minerogenic soils that have developed on the
weathering crust of basalt (Lake Lama) have pH values
ranging from 5.1 to 6.2, and the soils that have developed
5.1.2. Acidification and the acidity status
on calcareous sedimentary rocks (Norilsk) from 7.1 to 8.6.
of soils in the Norilsk area
These values are considerably higher than the respective
values reported for Monchegorsk (Table 5.1). The buffer-
The Norilsk mining area is one of the largest point sources
ing capacity, as indicated by Ca and Mg concentrations, is
of sulfur and certain heavy metals in the northern Arc-
much higher in Norilsk than in Monchegorsk. The soils in
tic (AMAP, 1998). Annual sulfur emissions were around
the Norilsk area cannot be considered sensitive to acidifica-
1 million tonnes between 1985 and 2000 (Ekimov et al.,
tion; the pH of the organic layer in the Norilsk industrial
2001), while annual nickel and copper emissions were up
area was as high as 6.4. However, the Cu and Ni values of
to 1300 and 2800 tonnes, respectively. These emissions are
the organic layer are at the same level as in Monchegorsk
more than ten times higher than emissions reported for the
(1370-2820 mg/kg), due to the smelter emissions. The cor-
Monchegorsk smelter on the Kola Peninsula (MRCENR,
responding concentrations in the Lake Lama area are much
1995; Ekimov et al., 2001). Since 2000, there have been no
lower (72-82 mg/kg). However, even the concentrations in
reported changes in the volume of metal production or
the Lake Lama area are higher than the median values (5.9-
any investments to decrease emissions. SO2 emissions for
7.9 mg/kg) reported for large areas of the Kola Peninsula
Norilsk were 2118 kt for 1992 and 1847 kt for 2003.
(Salminen et al., 2004).
The effects of emissions on the soil are partly deter-
mined by climate. Owing to the presence of permafrost in
the region, chemical processes can only occur in the upper-
5.1.3. Effects on soil micro-organisms
most part of the soil, and because of the long winter (9 to 10
months) the period favorable for chemical changes is short.
Soil acidification and the deposition of sulfur and heavy
However, the uppermost part of the soil profile is strongly
metals can influence soil micro-organisms via several routes.
affected by the emissions of sulfur and heavy metals.
First, a decline in pH and the accumulation of pollutants in
Basalts with a basic chemical composition character-
the soil may directly reduce microbial growth and activity
ize the bedrock in the Norilsk area and in the neighboring
(BÍÍth, 1989). Second, pollutants may indirectly harm the
Putorana Mountains. According to Naldrett et al. (1992),
symbiotic and rhizosphere micro-organisms by decreasing
the sulfide ore deposits in the Norilsk area are hosted by
the amount of photosynthesizing foliage of their hosts.
a large flood basalt formation that erupted in the Devo-
This, in turn, reduces carbon flow to the roots and myc-
nian and Carboniferous sedimentary rocks. The age of the
orrhizal fungi (which are dependent on carbon received
basalt is 251 million years. It consists of picritic, basaltic,
from the host) and to rhizosphere microbes (which are
and tholeitic lavas. Today the basalts form the mountains
negatively affected both by a reduction in the availability of
(the Putorana Mountains) and sedimentary rocks (which
suitable environment due to reduced root biomass and by a
are not metamorphosed but eroded deeper) fill the valleys
decline in the amount of carbohydrate exudates produced
(e.g., in the Norilsk area). These sedimentary rocks include
by the roots). Direct and indirect impacts of acidification
Ca in O-horizon, mg/kg
1995
2000 - 2001
10000
1000
100
pH=4.4
Figure 5.9. Transect westÙeast across the
survey area (AÙB on Figure 5.2) show-
ing exchangeable Ca in the O-horizon of
A 10
B
podzol soils in 1995 (Kola Ecogeochem-
400
350
300
250
200
150
100
50
0
-50
-100
-150
istry Project) and from 2000 to 2001 (Bar-
Distance from Monchegorsk, km
ents Ecogeochemistry Project).
49
Chapter 5 ñ Effects on Terrestrial Ecosystems
Table 5.1. Element concentrations in soil horizons in the Monchegorsk (Kashulina and Gregorauskiene, 2000), Norilsk, and Lake Lama areas.
Sites/
Lowest
Ca
Mg
Cu
Ni
S
horizon
depth
pH
LOI
C
(mg/kg)
(mg/kg)
(mg/kg)
(mg/kg)
(mg/kg)
(cm)
(%)
(%)
Total
AR
Total
AR
AR
AR
Total
Monchegorsk
Oer
0
3.90
20.50
11.60
792
532
1370
2030
446
OEer
3
4.39
5.79
3.11
39800
614
37300
443
366
541
122
Bs
20
42400
BC1
40
4.78
3.72
0.92
49900
3310
48200
4850
52.0
72.9
175
2BC2
82
5.42
2.10
0.47
54900
3110
43100
4540
62.2
60.3
95.4
Norilsk
O
5-6
6.40
42.90
22.90
23600
7340
2180
2820
3580
B1
13
7.10
7.96
1.61
43100
12800
24200
8390
64.5
45.0
274
B2
25
7.60
9.36
2.32
44200
13100
27400
8290
50.3
37.0
173
BC
49
8.60
5.35
0.81
62900
25600
29200
9410
50.6
31.0
122
BCk2
70
8.60
5.96
1.07
73900
32900
30900
11100
53.5
32.5
<100
Lake Lama
O
4
4.00
65.20
32.30
3900
2980
81.9
72.4
1080
E
3
4.30
25.10
12.80
4140
3560
30.9
18.4
B
7
5.10
20.30
5.31
31600
7980
22800
8650
47.9
41.6
198
BC
19
5.40
13.70
2.91
37500
9750
23000
10100
58.1
42.3
198
BC2
41
6.00
7.68
1.10
43800
13400
25800
10900
66.5
39.7
124
C
70
6.20
6.00
0.70
50700
15800
29000
10800
56.1
36.6
157
LOI: loss in weight on ignition; AR: aqua regia extractable concentration.
and heavy metals include species-specific effects, leading
communities have also been found in taiga forests around
to shifts in fungal species composition. Third, pollutants
the Kostamuksha iron pellet plant (Zaguralskaya and
often reduce the amount of litter produced by vegetation,
Ziabchenko, 1994) and in subtundra forests of the Taymir
and also change its composition. In addition, the direct
Peninsula affected by the Norilsk nickel-copper smelter
effects of acidifying pollutants on soil invertebrates, re-
(Kirtsideli et al., 1995). Intriguingly, rhizosphere of severely
sulting for example in the disappearance of earthworms
damaged larches near Norilsk contained 10 to 100 times
in polluted areas (section 5.3.2), can affect the mechanical
more micro-organisms than healthy larches in unpolluted
degradation of litter. Both the amount and composition of
regions; this phenomenon presumably resulted from the
the litter, as well as changes in the degradation processes
development of saprotrophic microbiota that benefit from
of soil organic matter, may have several impacts on soil
root decline (Raguotis, 1989).
decomposer activity and diversity.
Fluoride deposition originating from the Kandalaksha
In the Arctic, relatively few studies have been carried
aluminum smelter caused slight alkalinization of the soil
out on the impacts of acidifying pollutants on soil micro-
and altered the community composition of soil fungi, al-
organisms. The adverse effects on soil microbial biomass
though no effects on the biomass of soil bacteria and fungi
and activity seem to be concentrated in relatively restricted
were found (Evdokimova, 2001). However, a more detailed
areas around the nickel-copper smelters where there are
investigation revealed a significant (by a factor of eight)
high levels of heavy metal deposition. For instance, Ohto-
decline in fungal biomass near Kandalaksha (Evdokimova
nen and Vðre (1996) reported no detectable changes in soil
et al., 2004).
microbial activity and biomass parameters at distances of
Acidification may not necessarily affect the basidio-
no more than 14 km from the smelter complex at Nikel. On
mycete and ascomycete ectomycorrhizal fungal symbionts
the other hand, soil microbial activity and biomass were
of forest trees, as they are well adapted to naturally acidic
reported to be extremely reduced near Monchegorsk. For
conditions in forest soil (Smith and Read, 1997). However,
example, basal respiration of micro-organisms at sites 8
a decrease in ectomycorrhizal colonization in the roots of
and 10 km from the Monchegorsk smelter was 5 and 8 g
forest trees has been found in response to soil acidifica-
carbon dioxide (CO2) per gramme of organic matter (OM)
tion (Danielson and Visser, 1989; Holopainen et al., 1996;
per hour, respectively, while at sites 36 km or more the
Brunner, 2001). Emissions from the Monchegorsk smelter
basal respiration was 16 to 40 g CO2/g OM/hr. Micro-
have been reported to negatively affect the diversity of
bial biomass was 2.2 and 2.4 C/g OM at nearby sites, and
ectomycorrhizal fungi (Isaeva, 2004).
2.4-5.6 C/g OM at more distant sites (Ohtonen and Vðre,
Studies on the effects of acidifying pollution on arbus-
1996). Also, the diversity of microfungi (Lebedeva, 1993;
cular mycorrhizal (AM) colonization in herbs and grasses
Evdokimova, 2000), algae, and prokaryotes (non-spore
in the Arctic are even fewer than those dealing with ec-
forming gram negative bacteria, cyanobacteria and strep-
tomycorrhizal symbionts of trees. There appears to have
tomycetes) (Evdokimova, 2000) in forest soils decreased
been only one survey (Ruotsalainen et al., 2006) on root
moving towards the pollution source. In another study
colonisation in Deschampsia flexuosa, a common perennial
(Nikonov et al., 2001), populations of prokaryotes in the
grass that is tolerant of both acidification and heavy metals.
soils of Norway spruce stands were found to increase, and
There was a decrease in hyphal colonization of both AM
populations of eukaryotes to decrease, moving towards
and DSE (dark septate) fungi with increasing pollution
Monchegorsk. Deterioration of the forest soil, leading to
levels. In contrast, DSE microsclerotia were more abundant
losses in soil organic matter and nutrients, was assumed to
in highly polluted sites, possibly indicating the strategy of
be connected to the adverse effects of heavy metals on soil
these fungi to survive and disperse from unfavorable envi-
fungal populations in drier Scots pine forests (Polyanskaya
ronments. Severe damage to field layer vegetation creates a
et al., 2001). Changes in the composition of soil microbial
patchy environment, such as the industrial barrens around
50
AMAP Assessment 2006: Acidifying Pollutants, Arctic Haze, and Acidification in the Arctic
Monchegorsk, and under these conditions AM fungi may
annual average modeled SO2 concentrations of 15 to 40
have difficulties dispersing from one plant host to another.
g/m3. External damage on the needles of Scots pine (e.g.,
This may have further impacts on fungal communities in
tip necrosis) and changes in species composition of the
the soil.
lichen communities occurred in areas with annual aver-
The cover of Cladina lichens, which is assumed to be
age modeled SO2 concentrations of 8 to 15 g/m3, and
especially effective at filtering out heavy metals, has de-
the damage area extended to the eastern part of Inari in
teriorated and even disappeared in industrial barrens and
Finland. The total area covered by visible damage zones
declining forests (T½mmervik et al., 1995), and this may
surrounding Monchegorsk, Nikel, and Zapolyarnyy was
accelerate the adverse impacts of acidifying pollutants on
estimated to be around 39 000 km2. Around Monchegorsk,
the activity of soil micro-organisms. The structure of the
chlorosis of pine needle stomata occurred in areas with an-
organic layer has been damaged severely in these areas
nual average modeled SO2 concentrations of 4 to 8 g/m3,
(Rigina and Kozlov, 1999). This is partly due to the loss of
and there were changes in the microscopic structure of pine
living fungal hyphae which, together with the fine roots,
needles and epiphytic lichens where the annual average
normally play an important role in maintaining the struc-
modeled SO2 concentrations were 2 to 4 g/m3 (Tikkanen
ture of this layer.
and Niemelð, 1995).
Thus, changes in ground and field layer vegetation due
In the mid-1990s, the proportion of damaged ecosys-
to acidifying pollution in the Arctic are linked to soil de-
tems in the European Arctic increased steadily from the
terioration and changes in soil microbiology. On the basis
northern boreal forest zone to the tundra. Furthermore,
of sparse information on soil micro-organisms in the Arc-
the same stages of ecosystem disturbance (severe, dam-
tic, the adverse effects of acidifying pollutants seem to be
aged, depressed, no damage) coincided with lower con-
concentrated in restricted areas around the nickel-copper
centrations of the major pollutants in humus in tundra
smelters and to be more strongly linked to the excessive
and in subarctic birch forest ecosystems than in forested
deposition of heavy metals rather than to acidification.
areas (Kashulina et al., 1997). On the other hand, a veg-
The diversity of soil micro-organisms may be affected to
etation study from South-Varanger in eastern Finnmark,
a greater extent or at lower levels of pollution, than the
Norway (Aarrestad and Aamlid, 1999) showed that the
biomass and activity of the soil microbial communities.
`pollution variables' Cu and Ni in humus, Ni in Cladina,
and the modeled atmospheric SO2 concentration, together
only explained around 9% of the species variation after
taking into account variation due to natural environmental
5.2. Effects on vegetation in
variables. The comparisons between sulfur concentrations
the European Arctic
in moss and Ni concentrations in humus at various levels
of ecosystem damage demonstrate that the state of the
ecosystems in the mid-1990s in Norway and Finland had,
The damage zones around Nikel and Monchegorsk on the
with few exceptions, no correlation with the deposition
Kola Peninsula reported in the previous AMAP assessment
of pollutants from the Russian smelters. In Russia, how-
(AMAP, 1998) ranged from forest death to a zone with
ever, pollution strongly influenced ecosystem degradation.
changes in the microscopic structure of epiphytic lichens on-
There, even the `no damage' class had a higher median
ly. The corresponding range in annual average atmospheric
value for Ni and sulfur than for all damage classes in Fin-
SO2 concentrations was from >40 to 2-4 g/m3 (Tikkanen
land or Norway (Kashulina et al., 1997).
and Niemelð, 1995; T½mmervik et al., 1995). Nikel, although
As there have been very few studies on acidification
having a much smaller smelter than Monchegorsk, has had
effects on vegetation in the Arctic since the last AMAP
(for technical reasons) considerably higher SO2 emissions
assessment, this section reviews the few new studies to-
(but lower metal emissions) than Monchegorsk. It is also
gether with the results of studies based on data collected
further north and so, having a harsher climate, the vegeta-
in the early 1990s, but mainly published in the late 1990s or
tion is dominated by subarctic birch forest rather than the
early 2000s. The studies include data on direct and indirect
boreal forests around Monchegorsk (Kashulina et al., 1997).
effects of air pollutants, especially SO2, and both critical
Satellite data showed that the total area affected by air
levels and critical loads are addressed.
pollution (average SO2 concentrations >10 g/m3) around
Nikel increased from 400 km2 in 1973 to more than 3900 km2
in 1988, and remained at this level during the early 1990s
5.2.1. Lichen-dominated and mountain
(H½gda et al., 1995; T½mmervik et al., 1995; see also Aamlid
birch (tundra) ecosystems
et al., 1995; Gytarsky et al., 1997). Furthermore, episodes of
high SO2 emissions had caused changes in the lichen and
The main vegetation types in the northernmost and high
dwarf shrub communities over an additional 1100 km2 in
altitude areas of northern Norway and the Kola Peninsula
1988, the area affected by severe air pollution near Nikel
consist of lichen and dwarf shrub communities. Changes
thus increasing to more than 5000 km2.
in the area with reindeer lichen (Cladina spp.)-dominated
The size of the forest-death area was over 400 km2 in
vegetation (heaths and forests with dwarf birch and moun-
the Nikel-Zapolyarnyy and Varanger regions; the area near
tain birch, Betula nana and B. pubescens ssp. czerepanovii)
the border between Russia and Norway studied in 1988
around the Cu-Ni smelters in Nikel and Zapolyarnyy cor-
(T½mmervik et al., 1995). At Monchegorsk, the forest-death
related with changes in emissions of SO2 between the 1970s
area covered between 400 and 500 km2 and extended more
and late 1990s (H½gda et al., 1995; T½mmervik et al., 1995,
than 10 km to the south and more than 15 km to the north
1998, 2003). Thus, there was a reduction in the areas of li-
of the smelter complex (Mikkola, 1996). The average mod-
chen-dominated mountain heaths and forests from 37% in
eled SO2 concentrations exceeded 40 g/m3 in this area
1973 to 10% in 1992, followed by a slight increase to 12% in
(Tuovinen et al., 1993). Marked defoliation of conifers and
1999 in the border areas of Norway and Russia (T½mmer-
an absence of epiphytic lichens occurred in the area with
vik et al., 2003). Reindeer lichens had completely disap-
51
Chapter 5 ñ Effects on Terrestrial Ecosystems
peared from around two Ni-Cu smelter complexes on the
emissions decreased (but not reaching 1973 levels before
Kola Peninsula by the 1990s (Kalabin, 1991; T½mmervik
the mid-1990s) (T½mmervik et al., 2003).
et al., 1995), their growth rates reaching normal levels at a
Average SO2 concentrations for the lichen-dominated
distance of 50 to 60 km from the smelters (Helle and Ko-
vegetation (Betula nana-lichen heath and Empetrum-lichen
jola, 1992). In addition to Cladina stellaris, the arctic lichen
types) were 3.5 and 9.2 g/m3, respectively, and were 13.6
Cladonia rangiferina is also sensitive to SO2 and/or metals
g/m3 for heather woodland/partly damaged heather
(Koptsik et al., 2003). Kapitsa and Golubeva (1997) ranked
(Empetrum-Vaccinium type) with a sparse/reduced lichen
the lichens Cladina mitis and Cladonia cornuta among the
cover (T½mmervik et al. 1995, 1998). There were associa-
most sensitive species to anthropogenic pressure, while
tions between the damaged land cover, the industrial
the lichen Cetraria nivalis was ranked as less sensitive, and
barren land, and the SO2 concentration in air at ground
the low bushes Phyllodoce caerulea and Salix glauca were
level and Ni and sulfur concentrations in reindeer lichens.
among the most tolerant species. Gaseous uptake meas-
Average sulfur concentrations in reindeer lichens (C. stel-
urements on lichens are limited, but according to Winner
laris and C. mitis) from Empetrum-lichen type forests and
et al. (1988, cited in Nash and Gries, 1995), SO2 uptake by
Empetrum-Vaccinium type heather woodland/partly dam-
C. rangiferina is at least an order of magnitude greater than
aged heather were 489 and 765 mg/kg, respectively, in
in a typical vascular plant. The lichen-dominated vegeta-
the border areas between Norway (Southern-Varanger)
tion types were, however, not just changed into barrens or
and Russia (NikelÙZapolyarnyy) in the late 1980s to early
partly damaged vegetation entities, but were also changed
1990s. In the bilberry forests/heaths (V. myrtillus-D. flexu-
into heath (and woodland) vegetation with sparse lichen
osa and Cornus suecica types), the average SO2 concentration
cover and were dominated by dwarf shrubs such as bil-
was 14.9 g/m3 and the lichen sulfur concentration was 644
berry (Vaccinium myrtillus) in the NikelÙZapolyarnyy and
mg/kg (T½mmervik et al., 1998). The vegetation damage
South-Varanger areas in the early 1990s (T½mmervik et
observed and the slightly elevated sulfur concentrations in
al., 1995, 1998).
lichen thalli may be attributed to both high short-term SO2
The gradual change of lichen-dominated vegetation
concentrations as well as long-term exposure to elevated
between 1973 and 1999 into barrens or sparsely vegetated
sulfur deposition based on the proposed critical level of 10
areas or into other vegetation formations: partly damaged
g SO2 /m3 (annual mean) to be adopted for cyanobacterial
heather-dominated vegetation, bilberry forests/heaths,
lichens (UNECE, 1993, 2004a).
and meadow forests (on better soils in lowland areas) oc-
One of the nine catchments where Reimann et al.
curred mainly between 5 and 30Ù40 km from the smelt-
(2001b,c,d, 2003) studied total sulfur concentrations in the
ers at Nikel and Zapolyarnyy, depending on prevailing
leaves of various species was an arctic tundra catchment
wind directions during the growing season. For example,
in BerlevÍg on the Barents Sea coast of northern Norway.
the previous sparsely vegetated coastal mountains have
They did not report air quality and/or deposition data
become more barren due to large emissions of SO2 and
and so could not calculate correlations between air quality
their location within the path of the prevailing winds. On
and/or deposition and plant and soil sulfur concentra-
the other hand, the slight increase from around 10 to 12%
tions. At any rate, their results did not show any effects of
in the lichen-dominated communities (Betula nana-lichen
changes in SO2 emissions from the Kola Peninsula, and/or
heath and Empetrum-lichen types) during the 1990s indi-
SO4 in marine aerosols, on the sulfur concentrations of
cates an improvement in air quality and environmental
plant samples collected in summer 1999. For example, the
conditions for these vegetation formations (T½mmervik
total sulfur concentrations of Hylocomium splendens and
et al., 2003); for example, a decrease from 20 to 10 g/m3
Pleurozium schreberi ranged from 716 to 863 mg/kg and for
in the summer SO2 concentrations at Svanvik in the Nor-
V. myrtillus from 1720 to 2230 mg/kg. They concluded that
wegianÙRussian border area (SFT, 2002). The significant
total sulfur in moss is largely governed by the input of par-
positive relationship between lichen (Cladina sp.)-domi-
ticulate material (dust), such as metal sulfides (Gregurek
nated forests (Empetrum-lichen type with birches; r=0.84,
et al., 1999), and not by atmospheric SO2 concentrations.
p=0.018) and the significant negative relationship between
The total sulfur concentrations of plant and soil samples in
changes in the area of industrial barrens (r=-0.95, p=0.001),
BerlevÍg were similar to those in the Russian catchments
and the changes in SO2 emissions between 1973 and 1999
of Vorkuta and Naryan-Mar, with all three areas showing
may be explained by the response times of the different
large variations in the total sulfur concentrations in leaves
land cover classes to SO2 emissions. There is always a lag
both between species within each area as well as between
in the vegetation response to changes in SO2 emissions and
areas (Figure 5.10, Table 5.2).
in this case the area of lichen-dominated vegetation types
Particulate emissions that contain heavy metals are
decreased and the barrens increased at the same time as
deposited closer to the emission sources than SO2 and
Table 5.2. Median sulfur concentrations (mg/kg dry weight) in plant leaves collected from four northern European catchments in summer 1999
(Reimann et al., 2001c, 2003).
Catchment
BerlevÍg
Monchegorsk
Naryan-Mar
Vorkuta
(southern tundra
(moss-lichen shrub tundra
(arctic tundra)
(northern taiga)
with birch and shrub)
with birch and willow)
Moss (Hylocomium splendens)
754
1090
889
824
Blueberry (Vaccinium myrtillus)
2025
1710
Cowberry (Vaccinium vitis-idaea)
1350
2095
1300
1480
Crowberry (Empetrum nigrum)
1220
1260
1130
1360
Birch (Betula pubescens)
1775
1890
Willow (Salix spp.)
3765
2335
2350
3180
Pine (Pinus sylvestris)
1190
Spruce (Picea abies)
1985
547

52
AMAP Assessment 2006: Acidifying Pollutants, Arctic Haze, and Acidification in the Arctic
1 Vorkuta
Catchments discussed
in this report
Project area boundary
100 0 100 km
Figure 5.10. Location of the catchments included in the Barents Project (Reimann et al., 2003; reprinted from Reimann et al., 2001d).
SO4 (e.g., Gytarsky et al., 1995) and therefore the relative
deposition than H. physodes. The zero zone of lichen cover
importance of the direct and indirect harmful effects of
coincided approximately with the areas where the mod-
sulfur compounds increases with increasing distance
eled annual mean SO2 concentrations reached 25 g/m3.
from the emissions sources. The occurrence of visible SO2
However, sulfur compounds are not the only acidifying
injuries in the leaves (B. pubescens, B. nana, V. myrtillus,
compounds; Hilmo and Larsen (1994) found morphologi-
V. uliginosum) and Scots pine needles (Pinus sylvestris) in
cal changes (discoloration, growth form) in Parmelia sulcata
northeastern Norway close to the Russian border (Aamlid,
at an industrial site in Glomfjord that may be related to
1993; Aarrestad and Aamlid, 1999) (Figure 5.11) has mainly
elevated nitrogen deposition.
been attributed to episodes with high SO2 concentrations
The results of T½mmervik et al. (1998, 2003) on vegeta-
that occur under specific meteorological conditions (Jerre,
tion changes in the area of Pasvik and Zapolyarnyy/Nikel
1994). Hilmo and Larsen (1994), in turn, reported mor-
at the NorwegianÙRussian border show an increase from
phological differences (growth form, fertility, apothecial
about 7% in 1973 to about 20% in 1979, with a stabilization
morphology, discoloration) in the epiphytic lichens Hypo-
at approximately 30% by 1999 in bilberry and low herb
gymnia physodes and Melaniella olivacea at sites exposed to
vegetation formation and meadow vegetation (bilberry
high concentrations of SO2 in S½r-Varanger compared to
forests/heaths and meadow forests with mountain birch).
lichens at an unpolluted control site. As M. olivacea had a
This change coincided with the decrease in the areas of
larger mean cover on birch stems than H. physodes in the
lichen-dominated vegetation and was mainly due to the
border area between Norway and Russia, and was more
transformation of dwarf shrub (Empetrum hermaphroditum)
frequently found at the plots in the 1991 and 1993 studies
and lichen-dominated vegetation cover types into bilberry
(Aamlid and Skogheim, 2001), it may even be considered
and Deschampsia flexuosa-dominated formations which
more tolerant to the direct and indirect effects of sulfur
appear up to 5 to 40 km from the smelters (Deyeva and
a)
b)
Figure 5.11. Visible (acute) SO2
injuries on (a) birch (Betula pu-
bescens) leaves and (b) Scots
pine (Pinus sylvestris) needles
at Svanvik, Norway, approxi-
mately 10 km northwest of
Nikel (Photos: Dan Aamlid).

53
Chapter 5 ñ Effects on Terrestrial Ecosystems
Varangerfjorden
1973
Norway
Kirkenes
Finland
N O R W A Y
F I N L A N D
PC
PA PB
RUS-1
RUS-3
PD RUS-2
Nikel Zapolyarnyy
R U S S I A
RUS-0
Monitoring site
NorwayRussia
Figure 5.13. Location of joint Norwegian/Russian sites for intensive
a)
terrestrial monitoring (SFT, 2002).
Maznaja, 1993; T½mmervik et al., 1995, 1998, 2003). With
regard to pollution resistance of mountain birch, studies in
1994
the vicinity of the smelters at Monchegorsk may suggest
phenotypic acclimatization of mature trees to a gradual
Norway
increase in pollution as well as selection for pollution-
Finland
resistant genotypes that may have occurred due to the
exceptionally high emissions pressure over the past few
decades (Valkama and Kozlov, 2001; Kozlov and Zvereva,
2004; Kozlov, 2005).
5.2.2. Coniferous forest ecosystems
According to T½mmervik et al. (2003), the vegetation cover
that had the highest association (r=-0.94, p=0.001) with
changes in SO2 emissions in the Pasvik and NikelÙZapol-
yarnyy areas was the mixed birch-pine forests with lichen
content (Figure 5.12). The increase in the area of mixed
pine-birch forests, especially from 1988 to 1999, meant
Norway
b)
Russia
that the area affected by air pollution was reduced. The
most important differences in species composition in the
NikelÙPasvik area along the NorwegianÙRussian border
(see Figure 5.13 for the location of the RussianÙNorwe-
1999
gian vegetation monitoring sites) were related to the loss
of species richness, i.e., a lower abundance of bryophytes
Norway
(e.g., H. splendens, P. schreberi, Dicranum species) and li-
Finland
chens (several Cladonia species) (Aamlid et al., 2000), and
a concomitant increase in the dominance of air pollution
resistant species such as D. flexuosa and E. hermaphroditum
(SFT, 2002; T½mmervik et al., 2003; see also Vassilieva et al.,
1995) (Table 5.3). These differences are explained on the
basis of both the direct impacts of pollution and the indi-
rect soil-mediated processes leading to, for example, soil
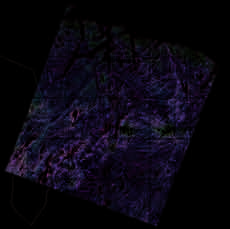
0 Unclassified/edge
1 lakes/rivers/sea
2 Exp. heaths/barrens/boulders
3 Mixed pine-birch forests
4 Heather wodland and mires
5 Heather wodlandpartly dam.
6 Lichen dominated forests
7 Lichen dominated heaths
Norway
8 Bilberry forests
c)
Russia
9 Meadow forests
10 Wet bogs/mires
11 Ind. barrens/bare rocks
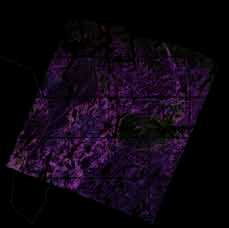
Figure 5.12. Land cover maps for the PasvikÙNikel area for (a) 1973,
12 Ind. barrens/damaged veg.
(b) 1994, and (c) 1999 (T½mmervik et al., 2003).
13 Clouds/smoke
54
AMAP Assessment 2006: Acidifying Pollutants, Arctic Haze, and Acidification in the Arctic
Table 5.3. Average number of species within 1 m2 plots in pine forest along a western gradient from Nikel (SFT, 2002). The highest values for each
species group (bold font) indicate the change from lichen- and moss-dominated vegetation to small shrub- and grass-dominated vegetation near
the emissions sources.
Species group
Sample plots and their distance from Nikel
45 km
25 km
16 km
12 km
9 km
6 km
6 km
south
west
west
west
northwest
north
west
Small shrubs
3.5
2.9
3.1
3.1
3.4
4.2
4.0
Herbs
1.9
1.9
1.7
0.8
1.9
2.0
1.1
Mosses
5.1
4.6
4.7
4.7
4.6
1.2
2.1
Liverworts
1.3
1.5
2.0
1.5
1.6
0.7
1.2
Lichens
3.7
4.1
7.5
8.2
3.9
2.3
3.1
All species a
15.4 (24)
14.9 (30)
19.2 (32)
18.7 (31)
15.6 (26)
10.9 (23)
11.5 (17)
a maximum number of species in brackets
acidification and nutrient imbalances (T½mmervik et al.,
However, the cell injuries studied did not show any distinct
1995; Aarrestad and Aamlid, 1999; Koptsik et al., 1999a,b,
relationships with element concentrations in either foliage
2003; SFT, 2002). Furthermore, for example, Pohlia nutans is
or deposited particles (Rautio et al., 1998c).
a moss species that has increased its cover in the most pol-
High variation in the total sulfur concentrations in
luted area. This species, characterized by wide ecological
plant samples collected during the growing season may
amplitude, colonized the emptying litter in industrial bar-
be explained (in addition to species-specific characteristics
ren land in the absence of competition from other (moss)
and differences in gaseous and particulate sulfur deposi-
species more sensitive to pollution (Koptsik et al., 2003).
tion) by nutrient status, pH, and other soil characteristics,
According to Kashulina et al. (1997, 2003), direct ex-
as well as by climate, composition of the vegetation layer
posure to SO2 is the most likely, although not the only
and altitude (Reimann et al., 2001b, 2003). For example,
mechanism of vegetation damage in the eight catchments
despite higher SO2 emissions from the Nikel smelter com-
located on the Kola Peninsula and in northeastern Finland
pared to the Monchegorsk smelter, plants accumulate more
and Norway. The highest sulfur concentrations in plant
sulfur near the latter because of the specific combination
samples in the most polluted sites were usually 2- to 4-fold
of geomorphological and meteorological conditions (Ko-
higher than at control sites (Gytarsky et al., 1995; áyrðs et
ptsik et al., 1999a). It is also well known that plant nutrient
al., 1997; Aamlid et al., 2000; Steinnes et al., 2000; Reimann et
concentrations (including sulfur) vary considerably during
al., 2001a,c). Steinnes et al. (2000) reported a decrease from
and between growing seasons. For example, the average
4270 to 2000 mg/kg and from 2820 to 1420 mg/kg in the
sulfur concentrations of current-year Scots pine needles
mean total sulfur concentration of B. pubescens and E. her-
collected in August-October between 1996 and 1999 were
maphroditum leaves, respectively, on moving from the most
755 to 901 mg/kg at Vðrri— in the eastern part of Finnish La-
polluted study sites around Nikel to the southernmost sites
pland and 806 to 988 mg/kg at Sammaltunturi (i.e., Pallas)
more close to background conditions in 1991. A decrease
in the western part of Finnish Lapland (Sirkku Manninen,
from around 3500 to 1000 mg/kg, and from around 3400 to
University of Helsinki, unpubl. data). This is why needle
1500 mg/kg in the foliar sulfur concentration of Betula sp.
samples for bioindicator studies mapping the dispersal of
and V. myrtillus, respectively, between the areas closest to
sulfur emissions, as well as the area possibly affected by
the Nikel smelters (<5 km) and background areas (about 30
sulfur deposition, are usually collected in winter, i.e., when
km) was, in turn, reported by Gytarsky et al. (1995). Sulfur
emissions are at their highest and the trees are physiologi-
was also the major element in moss (H. splendens and P.
cally relatively inactive (see e.g., Manninen et al., 1997a,
schreberi 2090-543 mg/kg) and the O and B soil horizons in
1998; Rautio et al., 1998a,b).
the 1995 survey in northern Finland, Norway, and Russia
The latitude-related decrease in the total sulfur concen-
(áyrðs et al., 1997; Kashulina et al., 1997, 2003; Kashulina
tration on moving northward (Reimann et al., 2003) may
and Reimann, 2001, 2002; Reimann et al., 2001a).
be related to the length of the periods during which the
Reimann et al. (2001b,c,d, 2003) measured total sulfur
plants have stomatal uptake of SO2 versus the time when
concentrations in the leaves of several plant species col-
they are exposed to non-stomatal deposition only, as the
lected from nine catchments in northern Europe (Finland,
proportion of (winter) non-stomatal deposition increases
Norway and Russia) in summer 1999. Only Norway spruce
towards the north. The dry deposition of sulfur dominates
(Picea abies) needles showed significantly higher sulfur
in northern areas due to the low precipitation, and dry
concentrations in all samples collected near Monchegorsk.
deposition accounts for about 80% of the total deposition
Correlation between `available' sulfur in surface soil and
(Tuovinen et al., 1993). On the other hand, as most of the
observed foliar sulfur concentrations for all plants growing
plants have a snow-cover for six to seven months of the
in the soils was in general very low. Furthermore, Reimann
year, more than 50% of the total annual deposition will
et al. (2003) concluded that macroscopic and microscopic
deposit onto snow (Kashulina and Reimann, 2002). This
evidence of leaf damage are more reliable indicators of pol-
means that the sulfur concentrations of mosses and lichens
lution impact than foliar sulfur concentration. In a study
which are thallophytes (i.e., they have no roots but ob-
carried out in the early 1990s on Scots pine, Rautio and
tain all their nutrients through their above-ground parts
Huttunen (2003) also found a weak relationship between
as ions dissolved in water Ù rain and melting snow), may
element concentrations in the soil and internal foliar con-
give a different picture about the rate and distribution of
centrations. A factor representing high foliar levels of Ni,
sulfur emissions compared to that given by foliar sulfur
Cu, and sulfur, and low levels of Zn and Mn, was found to
analyses of evergreen conifers. Steinnes (1995) pointed out
explain most of the variation in the number of needle age
that it may, however, be feasible to achieve representative
classes and tip necrosis. The macroscopic injury variables
results (at least for heavy metals) by carefully selecting the
(including stomatal chlorosis and other discolorations) cor-
sampling site for moss in order to avoid interference from
related clearly with the modeled SO2 concentration in air.
wind erosion or surface water flow. On the other hand,
55
Chapter 5 ñ Effects on Terrestrial Ecosystems
the lower growth rate of mosses in arctic regions may be
reductions at the smelters on the Kola Peninsula. There has
expected to lead to greater uptake of airborne trace ele-
also been extensive forestry in the southern part of the Pas-
ments per unit weight than in mosses at more southerly
vik area and this has led to reductions in lichen cover (suc-
latitudes. Furthermore, the different growth structure of
cession) and pine forests. Severe desiccation of the forest
the plant may make it more difficult to accurately define
vegetation close to the smelters at Nikel and Zapolyarnyy
the exposure period.
has led to increasing amounts of dead needles and woody
In addition to the total sulfur concentration of Scots
debris, which in turn has led to more frequent wild for-
pine needles, statistically significant correlations (p<0.001)
est fires (T½mmervik et al., 2003). Moreover, outbreaks by
were found between the annual mean SO2 concentration
caterpillars such as Epirrita autumnata have been followed
and needle sulfate concentration and S:N ratio at the sites
by successions from lichen-dominated vegetation to more
close to Monchegorsk in the early 1990s (Manninen et al.,
dwarf shrub- and grass-dominated vegetation (Lehtonen,
1998) (Table 5.4). Koptsik et al. (1999a, 2001) also found a
1987; Tenow and Bylund, 2000).
marked gradient in the needle total sulfur concentration
Over most of northernmost Europe, the trend towards
and S:N ratio of Scots pine with increasing distance from
a shift in lichen-dwarf shrub dominated forests to more
the Nikel smelters in the early 1990s. The increase in the
grass- and herb-dominated forests, may reflect a situation
S:N ratios towards the Nikel smelters is not just explained
where slow-growing species such as lichens, crowberry
by the increasing needle total sulfur concentrations, but by
(E. hermaphroditum), and cowberry (V. vitis-idaea) are de-
lower nitrogen supply from the soil observed as decreasing
clining due to intensive reindeer grazing (Olofsson et al.,
concentrations of nitrogen in soil organic horizons toward
2001). T½mmervik et al. (2004) also gave climate change (in-
the smelter. In addition to nitrogen concentrations, those
creased precipitation) and long-range transported nitrogen
of ammonium acetate-extractable Mg and K in organic
pollution (increasing nitrogen deposition is also linked to
horizons tended to be lower within several kilometers of
increasing precipitation) as possible accentuators for the
the Nikel smelters compared to remote sites (Koptsik et al.,
increase of birch forests and vegetation types dominated by
1999b, 2001, 2003) as they also were around the Monche-
bilberry, wavy hair-grass (D. flexuosa), the dwarf cornel (C.
gorsk smelters (Lukina and Nikonov, 1999, cited in Zvereva
suecica), and mosses (P. schreberi, H. splendens) in northern
and Kozlov, 2005). With regard to temporal trends related
Norway over the last 40 years.
to the decrease in SO2 emissions and, consequently, in the
Increased nitrogen deposition through precipitation
ambient SO2 concentrations in the border areas of Nor-
and/or deposition of manure (feces) from the reindeer may
way and Russia (Hagen et al., 2005), the results of Koptsik
create unfavorable living conditions for slow-growing spe-
et al. (G. Koptsik, Moscow State University, pers. comm.)
cies. Bobbink et al. (2002) considered an empirical critical
suggested a decrease in the total sulfur concentration of
load of 5 to 10 kg N/ha/yr, based on field manipulations
current-year Scots pine needles from August 1991-1994 to
in which exceedance was indicated by changes in biomass
August 2002. At any rate, as there are differences in foliar
and in the moss layer, reliable for tundra ecosystems. They
responses to elevated sulfur and nitrogen deposition be-
gave the same critical load for arctic, alpine, and sub-alpine
tween coniferous tree species (Manninen and Huttunen,
shrub habitats (with exceedance indicated by a decline
2000; Luyssaert et al., 2005), more research is needed on
in lichens, mosses, and evergreen dwarf-shrub), but its
foliar sulfur and nitrogen fractions and ratios, as well as
reliability was referred to as `expert judgment' (see also
on Mg:N and Ca:Al ratios, in the northernmost areas for
UNECE, 2004a). Recent results from field experiments in
use as indicators of acidification.
an area of northern Sweden with low background nitrogen
deposition and from a large-scale monitoring study, show
that important vegetational changes start to occur when
5.2.3. Reindeer grazing, climate change,
adding low nitrogen doses and that recovery of the vegeta-
nitrogen deposition, and other factors
tion after nitrogen inputs stop is a very slow process. Based
on data from the Swedish research program Abatement
Reindeer grazing is one factor that modifies or interacts
Strategies for Transboundary Air Pollution, Nordin et al.
with the effects of sulfur deposition on vegetation, especial-
(2005) suggested that the critical load should be lowered
ly in northern Norway. According to Gaare and T½mmer-
from the current 10 to 15 kg N/ha/yr to a level of 6 kg
vik (2000), reindeer have grazed down the new `reindeer'
N/ha/yr to protect the biodiversity of the boreal forest
lichens in the period 1992 to 1999, i.e., after the emissions
understorey vegetation. The impact of elevated nitrogen
Table 5.4. Concentrations (mg/kg) and ratios of sulfur and nitrogen in current-year Scots pine needles collected at different distances from the
smelters on the Kola Peninsula showing change along the pollution gradients and seasonal variation in needle chemistry.
Sampling
Total Sa
Organic S
SO4-S
SO4-S/organic Sa
Total N
Total S/Total Na
Reference
Finnish Laplandb
Sep-Oct 1990,
720-1153
479-862
141-361
0.20-0.53
9200-13000
0.032-0.045
Manninen et al.,
Sep 1992
1997b
Monchegorsk-
Apr 1991
856-2548
672-1599
105-1297
0.14-1.04
8100-13800
0.032-0.089
Manninen et al.,
Jenac
Jul 1992
794-1474
619-971
168-656
0.21-0.80
8400-14200
0.034-0.055
1998
Norwegian-Russian
Aug 1991-1994
499-1917
13400-21300
0.031-0.046
Koptsik et al.,
borderb
Aug 2002
896-1248
1999a; 2001;
pers. comm.
Monchegorsk-
Sep 1990
1112Ý471
Rautio et al.,
Finnish borderd
Apr 1991
1321Ý499
1998b
a The background total sulfur concentration is around 600 mg/kg, SO4-S concentration 100 to 200 mg/kg, and total sulfur:total nitrogen ratio 0.028
(on a gramme-atom basis) (Manninen, 1995 and references therein); b minÙmax site means , c minÙmax values for individual tree, d meanÝSD for
all sites.
56
AMAP Assessment 2006: Acidifying Pollutants, Arctic Haze, and Acidification in the Arctic
deposition was seen as decreased abundance of V. myrtillus
Norilsk area was that by Tutubalina and Rees (2001) who
and V. vitis-idaea and increased abundance of D. flexuosa in
reported a loss of vegetation from the city of Norilsk be-
particular, as well as decreased abundance of P. schreberi
tween 1961 and 1995 and the growth of landscape damage
and H. splendens.
over a larger area between 1972 and 1995. Several studies
Care must be taken when drawing conclusions about
on the spatial and temporal dynamics of forest decline in
nitrogen deposition on the basis of plant nitrogen analyses.
this area were published in Russian.
For example, Walker et al. (2003a) found marked regional
gradients in terricolous lichen nitrogen concentrations in
the Usa river basin, northeast European Russia, suggesting
5.2.4. Needs and recommendations for
that there were concomitant gradients in nitrogen deposi-
future research and monitoring
tion. On the 240 km south-to-north transects through the
town Inta, values of [N]apex (the apical 5 mm part) in Clado-
In the multi-medium ecogeochemical mapping carried out
nia stellaris decreased from 0.57Ý0.01 mmol/g to 0.43Ý0.01
in the European Arctic (Russia, Finland and Norway) in
mmol/g. Moreover, elevated [N]apex in C. arbuscula, and
the mid-1990s, the only sample material in which the high-
to a lesser extent in Flavocetraria cucullata, in the Vorkuta
est bulk sulfur deposition figures were directly reflected
area suggested elevated nitrogen deposition due to local
in a subarctic birch forest catchment close to Zapolyarnyy
industrial pollution. Variation in [N]apex in C. arbuscula cor-
was vegetation (áyrðs et al., 1997; Kashulina et al., 1997,
related well with other pollutant signals in snow ([SO 2-
4
2003; Kashulina and Reimann, 2001, 2002; Reimann et al.,
]snow, [Ca2+]snow, [K+]snow, pH) (Walker et al., 2003b) as well as
2001a). However, the almost 10-fold increase in the bulk
thalli, but as on the other transects, it was not correlated
sulfur deposition on moving from a coniferous forest
with [NO -3]snow. Molar concentrations of organic nitrogen
catchment (0.17 g S/m2/yr) at Pallas in the western part
were broadly similar to those of nitrate, except at sites close
of Finnish Lapland to the subarctic birch forest catchment
to Vorkuta where [organic N]snow values were greater than
near Zapolyarnyy (1.5 g S/m2/yr) resulted in only a 2-fold
[NO -3]snow by a factor of 2 or 3, varying spatially in a man-
increase in the sulfur concentration of moss samples (from
ner similar to that of [SO 2-
4 ]snow. Thus Walker et al. (2003a)
a median of 800 to 1500 mg/kg).
concluded that a higher deposition rate of organic nitrogen
Gytarsky et al. (1997) calculated that the annual dry
at the sites close to Vorkuta might have contributed to el-
deposition of sulfur is about 2-fold higher in deciduous
evated [N]apex in this area. In addition, they did not exclude
forests compared to coniferous forests on the Kola Penin-
that impaired lichen growth at sites close to Vorkuta, per-
sula. Taking into account the high proportion of dry-de-
haps due to phytotoxic air pollutants, might have resulted
posited sulfur, they expected that the values of total sulfur
in higher tissue nitrogen concentrations. They emphasized
deposition over the slightly damaged area (based on the
that data for snow pack chemistry were for a single winter
classification by Boltneva et al., 1982; Karaban et al., 1988),
period, whereas [N]apex values probably gave an indica-
where the modeled growing season mean SO2 concentra-
tion of nitrogen deposition integrated over a period of at
tion was 21 g/m3, would increase to 0.6 to 1.0 g/m2/yr
least one to two years. Furthermore, that these interpreta-
in coniferous forests and 1.2 g/m2/yr in deciduous forests
tions were made in the absence of commensurate data on
(Gytarsky et al., 1995, 1997). In general, dry deposition to
[NH +
4 ]snow.
coniferous forest is considered to be higher than that in
According to Walker et al. (2003a), mat-forming lichen
deciduous forest. The dry deposition velocity of 1.1 cm/s
cover was generally poor in the Vorkuta region due to
for SO2 on deciduous forests during the vegetation period
heavy grazing and trampling by reindeer; for example,
(McMahon and Denison, 1979) versus that of 0.3 cm/s on
C. stellaris was largely absent at most sites. Virtanen et al.
coniferous forests (Garland, 1977) used by Gytarsky et al.
(2002), in turn, identified two impact zones around Vorkuta
(1997) in their calculations may explain the high sulfur
on the basis of remote sensing data: (1) a pollution zone
deposition in deciduous forest. At any rate, the values
(150Ù200 km2), where most of the lichen species are absent
given by Gytarsky et al. (1995, 1997) are 4-fold higher than
and changes in vegetation communities' species compo-
the proposed SO2 critical level of 5 g/m3 as a growing
sition in all main plant groups are obvious (willows es-
season mean (Manninen, 1995; Manninen and Huttunen,
pecially being more dominant than in unpolluted sites),
2000; see also Tsvetkov, 1993), as well as the critical load
and (2) a slight pollution/disturbance zone (600Ù900 km2),
of 0.32 g/m2/yr derived for the highly sensitive forest
where vegetation changes are mainly similar but less so
ecosystems of northern Europe (Downing et al., 1993). The
than the changes in the first zone Ù in particular the amount
summertime (AprilÙSeptember) mean SO2 concentrations
of herbs and grasses is increased relative to unpolluted
have been around 5 to 10 g/m3 at Svanvik (about 10 km
areas. The upper soil layers (15Ù30 cm) in Vorkuta, where
west of Nikel) and reached 150 g/m3 at Nikel in the late
atmospheric pollution is mainly caused by dust from open
1990s (Hagen et al., 2001, cited in SFT 2002). Thus acute
coalmines, emissions from coal combusting power plants
and chronic impacts of SO2 and sulfur deposition still oc-
and a cement factory, and burning of waste rock near the
cur in the area. There is a need for measurements of dry
coalmines, have become chemically modified with pH
deposition velocities on different vegetation types.
ranging from 6.7 to 8.9 indicating strong alkalinization,
According to Alexeyev (1995), the least studied but
and concentrations of exchangeable Ca and total nitrogen
most important stage of air pollution impacts on arctic and
are 10 to 20 and 2 to 4 times higher, respectively, than at
subarctic terrestrial ecosystems is the initial damage, when
comparable non-polluted sites. Heavy metal levels in soils
the negative irreversible processes of ecosystem destruc-
are also increased in the area (Getsen et al., 1994, cited in
tion are still preventable. Simultaneous determination of
Virtanen et al., 2002). Emissions data for the 1990s sug-
several signals can provide an early warning of damage
gested that SO2 emissions averaged around 40 000 tonnes
to terrestrial vegetation by low-level airborne pollutants.
per year from the Vorkuta industrial complex in the Komi
It is recommended that studies be carried out at perma-
Republic (Virtanen et al., 2002). The only information found
nent plots (in cooperation with air quality, deposition, soil
on the effects of emissions on terrestrial vegetation in the
and faunal monitoring) in order to assess the state and
57
Chapter 5 ñ Effects on Terrestrial Ecosystems
5.3.1.1. Mammals
functioning of the tundra, mountain birch and conifer-
ous forest ecosystems. These studies should focus on the
Mitotic activity of spleen and cornea cells in root voles of
biomass (growth) and species composition and coverage
different age and sex was higher 4 km from the Monche-
of field and ground layer vegetation, the condition and
gorsk smelter than 28 km from the smelter. Mature root
frequency of epiphytic lichens, visible foliar injuries, foliar
vole males had a lower hemoglobin content at 4 km than at
sulfur and nitrogen concentrations, and ratios of S:N, Mg:
28 km. The mean frequency of chromosome aberrations in
N and Ca:Al using standardized methods (including dif-
spleen, cornea, and marrow cells of root voles ranged from
ferent sampling dates for the coniferous, deciduous and
34 to 50%. In spleen and cornea cells there were no differ-
thallophytic key species). In particular, more attention
ences in aberration frequency between 4 and 28 km, but in
should be paid to nitrogen-related issues and interactions.
marrow cells the frequency of aberrations was significantly
Lichens (e.g., Lobaria, Peltigera and Stereocaulon species and
higher at 4 km than at 28 km (Kataev and Popova, 1993).
Nephroma arcticum) containing cyanobacteria are abundant
Males of the field vole (Microtus agrestis) collected 4 km
in arctic ecosystems and may account for a major part of
south of the Monchegorsk smelter had lighter livers and
the nitrogen fixed in these systems. Their nitrogen fixation
heavier spleens than males collected 28 km away (Kataev
may be even more sensitive to acidity than photosynthesis
and Popova, 1993). However, correlation analysis based on
and may thus be decreased by decreasing pH (Nash and
data from eight sites located 3 to 52 km south of Monche-
Gries, 1995). Climate change and elevated nitrogen depo-
gorsk did not show any relationship between body mass of
sition are expected to affect negatively the slow-grow-
adult grey-sided voles and distance from the smelter (Ka-
ing lichen vegetation in particular (e.g., Cornelissen et al.,
taev et al., 1994). The proportion of pregnant females was
2001; Gordon et al., 2001; Fremstad et al., 2005) and higher
higher in unpolluted sites, but the number of fetuses per
CO2 concentrations and UV-B radiation may reduce nu-
female was the same along the pollution gradient (Kataev
trient cycling and so may potentially reduce ecosystem
et al., 1994). However, resorption of embryos was much
productivity (Callaghan, 2005 and references therein).
higher at the most polluted site (36.8%) than at the control
On the other hand, if the most sensitive tundra vegeta-
site (3.8%) (Kataev and Makarova, 1984).
tion is at least partly replaced by more tolerant forest veg-
The sex ratio of grey-sided voles near the Monchegorsk
etation over the next 100 years (Kaplan et al., 2003) and SO2
smelter was around 1:1, while males made up 65% of the
emissions do not increase, the state of the vegetation may
population at an unpolluted forest site. The age structure
(continue to) improve Ù also taking into account that plant
of the populations was also different: no overwintered in-
compensatory responses as well as allocation to reproduc-
dividuals were found in the polluted sites compared to
tion are species specific (e.g., Zvereva and Kozlov, 2001,
5.9 to 7.7% of the population overwintering in unpolluted
2005). Alekseev and Soroka (2002) reported that a higher
forests (Kataev and Makarova, 1984). The proportion of
growth rate occurred in Scots pine on the northwestern
adult voles in catches from the moderately polluted sites
Kola Peninsula despite significant air pollution. Generally,
around the Monchegorsk smelter was higher than that
the younger the trees, the greater the growth increase. The
at unpolluted sites (Kataev et al., 1994), suggesting that
most probable reasons for the marked increase in radial
juvenile mortality is higher at moderately polluted sites
increment growth of Scots pine in the region are climate
than unpolluted sites.
warming (including an increase in growth season length)
The density of grey-sided voles, the most abundant
and higher levels of CO2 as well as changes in forest fire
vole species, was lowest close to the Monchegorsk smelter
frequencies (increased frequency and, consequently, a
and increased with distance to the farthest, less-polluted
shift towards younger forests). The lack of significant
trapping sites. The bank vole, red vole (Clethrionomys ru-
differences in diameter growth between trees in differ-
tilus) and Norway lemming (Lemmus lemmus) were absent
ent damage classes is explained by Alekseev and Soroka
from the most severely damaged area, and were also scarce
(2002) by the low number of samples on severely damaged
at the moderately polluted area 28 km south of the smelter
trees, which are most susceptible to growth suppression
(Kataev et al., 1994). Snap trapping in the surroundings of
by pollution.
Monchegorsk revealed six species of small mammals; the
common shrew and grey-sided vole were the most com-
mon in unpolluted forests. Only the grey-sided vole and
root vole were captured in industrial barrens (Kozlov et
5.3. Effects on fauna
al., 2005a).
5.3.1. Effects on birds and mammals
A long-term study by Kataev (1995) revealed a mo-
notonous decline in the population of small mammals on
Acidification and acidic deposition typically affect terres-
approaching the Monchegorsk smelter: the biomass de-
trial vertebrates indirectly. There are only a few studies
creased from 87 kg/km2 at the unpolluted forest site to 69
concerning the direct effects of acidification on mammals
kg/km2 at the moderately polluted site to 15 kg/km2 at the
and birds, but indirect effects mediated through exposure
most polluted site. However, the pattern in 2001 (Kozlov
to metals in food or water have been reported (Dudley
et al., 2005a) differed from earlier data (Kataev, 1995): the
and Stolton, 1996). On the Kola Peninsula, all the verte-
density decline in the most polluted sites was much smaller
brate species studied, for example, root vole (Microtus
(51.8% of the background value) and, most importantly, the
oeconomus), grey-sided vole (Clethrionomys rufocanus), com-
highest densities were associated with slightly to moder-
mon shrew (Sorex araneus), willow grouse (Lagopus lagopus)
ately polluted forest. This result may be partially explained
and common frog (Rana temporaria), had elevated heavy
by the presumably higher plant quality in moderately pol-
metal concentrations in liver, bone, muscle, and skin. The
luted sites: grey-sided voles preferred bilberry shoots at
accumulation of heavy metals seems to depend on trophic
distances of 20 to 40 km from Monchegorsk compared to
level (AMAP, 2005).
shoots from sites both closer and further away (Suomela
and Palokangas, 1993).
58
AMAP Assessment 2006: Acidifying Pollutants, Arctic Haze, and Acidification in the Arctic
Although pollution may have suppressed the cyclic
the Monchegorsk smelter: redstart (Phoenicurus phoenicu-
density fluctuations of the bank vole (Figure 5.14), this and
rus), pied flycatcher (Ficedula hypoleuca), and Siberian tit
many other results obtained near Monchegorsk should be
(Parus cinctus). Up to 80% of breeding attempts by these
viewed as tentative due to the non-replicated experimental
species failed in the most polluted habitats; as a whole,
design (one polluted vs. one or two unpolluted sites).
reproductive success in industrial barrens was five times
lower than in background areas. In severely polluted sites,
46% of nests were abandoned in the nest building phase
Density, individuals per 100 trap x nights
(9% in an unpolluted site), with 36% of nests abandoned
70
Site 1
before completing the clutch (3% in an unpolluted site)
60
(Gilyazov, 1993).
In the 1980s, the densities of breeding birds in mod-
50
erately and severely polluted habitats along the Monche-
Site 2
40
gorsk pollution gradient were estimated to be 60 and 13%,
Start of
pollution impact
respectively, of the density in the unpolluted forests (Gilya-
30
zov and Kataev, 1990; Gilyazov, 1993). The results of recent
20
counts are in good agreement with these earlier data: bird
10
biomass declined monotonously on approaching the pollu-
tion source and was reduced to 12.7% in the industrial bar-
0
rens relative to unpolluted forests (Kozlov et al., 2005a).
1935
1945
1955
1965
1975
1985
1995
In the zone of declining forests (about 15 km south of
Figure 5.14. Effects of pollution on density of bank vole (Clethrionomys
Monchegorsk), bird abundance was reduced to around
glareolus) in Lapland Biosphere reserve (the break in observations is
two-thirds of that in unpolluted forests. In particular, the
due to the Second World War). Site 1 is located 30 km south of Monche-
gorsk; it was considered unpolluted until 1958Ù1960, when the first
densities of typical northern taiga species like tree pipit
signs of forest damage by emissions were detected. Site 2 is located
(Anthus trivialis), redstart, redwing (Turdus iliacus), song
30 km west of the smelter and represents an unpolluted control site
thrush (T. philomelos), willow warble, pied flycatcher, and
(protected from emissions by the Monche-tundra mountain range)
(after Kozlov and Barcan, 2000).
Siberian tit were lower than in control sites. In this zone, the
abundances of capercaillie (Tetrao urogallus), hazel grouse
(Bonasia bonasia), willow grouse, and black grouse (Tetrao
H—rnfeldt (2004) listed several hypotheses to explain
tetrix) had been reduced by 1988 to approximately half
the long-term decline in vole numbers and changes in vole
the numbers observed in 1963 (2.5 versus 4.9 ind/km2,
dynamics. One hypothesis attributed the decline to the
respectively), while no reduction was recorded in unpol-
decrease in quantity or quality of food, or to the decrease
luted forests (7.4 versus 7.3 ind/km2) (Gilyazov, 1993).
in availability of natural shelter for voles. Lichens are an
Since the 1970s, hazel grouse, Strix owls, eagle owl (Bubo
important winter food for bank voles (Clethrionomys glare-
bubo), Tengmalm's owl (Aegolius funereus), and treecreeper
olus), and another hypothesis explained the changes in
(Certhia familiaris) have not been recorded closer than 40 km
regular 3- to 5-year, synchronous, high amplitude northern
from Monchegorsk and birds of prey did not nest in this
Fennoscandian vole dynamics by the decline in pendulous
area (Gilyazov, 1993).
lichens (Hansson, 1999). Thus, acidification might indirect-
Counts of 16 bird species around the Monchegorsk
ly affect vole dynamics. Voles, especially Microtus voles,
smelter demonstrated that, in spring, birds migrate to
the grey-sided vole, and the bank vole, are key species
heavily polluted areas, possibly because of the earlier
in northern vertebrate communities, and changes in their
disappearance of the continuous snow cover, which is re-
dynamics may affect many of the avian and mammalian
duced to a third of the background depth (Kozlov, 2001).
predators dependent on voles as prey (e.g., Hanski et al.,
Later in the season, however, they return to the surround-
2001). The supply of bilberry (Vaccinium myrtillus) may also
ing (moderately contaminated) forest habitats. As a result,
affect vole dynamics (H—rnfeldt, 2004). Bilberry is sensitive
during the spring migration the density of birds in heavily
to the direct effects of SO2 (SFT, 2002) and, together with
polluted habitats was, on an average, 1.3 times higher than
birch, is regarded as one of the most suitable bio-indicators
in moderately polluted sites. In contrast, during the nesting
for monitoring pollutants (Steinnes et al., 2000). Bilberry
period bird density in heavily polluted sites was 2.5 times
is an important food item for the grey-sided vole (Kalela,
lower, and during the post-nesting period 15 to 20 times
1957) and bilberry stands provide shelter for grey-sided
lower than in moderately polluted sites (Gilyazov, 1993).
voles against predators (L—fgren, 1995).
Species richness of birds in an industrial barren south of
The densities of large mammals also declined on ap-
Monchegorsk, estimated by observations repeated during
proaching the Monchegorsk smelter. Although this pattern
1977 to 1990, was reduced by two-thirds relative to two
seems trivial, no data on the effects of pollution on the
unpolluted sites (Gilyazov, 1993). Similarly, the number of
abundance of large mammals had ever been published pri-
bird species recorded in 2001 by standard surveys (three 1
or to the study by Kozlov et al. (2005a). During the winter
km-long transects per site) decreased from 11 to 15 in un-
the tracks of eight species of large mammal were recorded.
polluted forests to 3 to 4 in industrial barrens near Monche-
Mountain hare (Lepus timidus) and red fox (Vulpes vulpes)
gorsk (Kozlov et al., 2005a).
were the most common, and only these two species were
Species characteristic of tundra and forest-tundra, such
recorded in industrial barrens near Monchegorsk (Kozlov
as yellow wagtail (Motacilla flava), meadow pipit (Anthus
et al., 2005a).
pratensis), bluethroat (Luscinia svecica), wheatear (Oenan-
the oenanthe), little bunting (Emberiza pusilla), and redpoll
(Carduelis flammea), all of which are migratory species,
5.3.1.2. Birds
constituted about 40% of the records at a barren site. Wil-
Changes in reproduction have been documented for three
low warble represented 50 to 80% of the northern taiga
abundant hole-nesting bird species in the impact zone of
species complex (redstart, redwing, willow warble, pied
59
Chapter 5 ñ Effects on Terrestrial Ecosystems
flycatcher, Siberian tit and brambling (Fringilla montifring-
mainly in the vicinity of the Monchegorsk nickel-copper
illa)) in undisturbed conditions, but at a barren site its share
smelter on the central part of the Kola Peninsula provide
did not rise above 15%. Both willow warble and meadow
some information on the responses of several groups of
pipit were relatively abundant, possibly because of habi-
invertebrates, primarily insect herbivores, to pollution.
tat changes (replacement of coniferous forests by birch
Empirical data collected in the vicinity of the point
and willow bushes, along with replacement of ericaceous
sources, which emit an extremely wide range of metals
dwarf shrubs by grasses) that favor these species. Also, the
and other compounds, can not be used to unequivocally
abundance of crows (Corvus corone) increased in polluted
attribute observed effects to a specific pollutant. Never-
habitats relative to unpolluted forests (Gilyazov, 1993).
theless, many pollutants are considered to have a minor
impact on biota around point sources. In particular, there
has been no correlation found between larval weight for
5.3.1.3. Concluding comments on
the moth Eriocrania and nickel concentrations in the larval
birds and mammals
body (Kozlov et al., 2000), which agrees with the reported
The most likely explanation for the observed changes in
resistance of many insects to heavy metals (Heli—vaara and
vertebrate populations near Monchegorsk is habitat dete-
Vðisðnen, 1993; Boyd and Martens, 1994). In contrast, both
rioration. Forest decline results in a decrease in the number
direct and indirect effects of SO2 on Lapland leaf beetle
of nesting sites for birds; however, the increase in second-
(Chrysomela lapponica) and autumnal moth (Epirrita autum-
ary open habitats favors certain bird species. Changes in
nata) have been confirmed experimentally (Kozlov et al.,
the abundance of invertebrates (see section 5.3.2) may in-
1996c; Kozlov and Selikhovkin, 1997). Therefore in this
fluence food availability for insectivorous birds Ù birds
assessment changes observed in invertebrate communities
in the polluted area were reported to be suffering from
are linked to both the direct and indirect effects of acidify-
nutritional stress (Framstad, 2002; Eeva et al., 2003). The
ing pollutants, primarily to changes in habitat structure
low number of microtine rodents in the damaged and mod-
following forest decline (Rigina and Kozlov, 1999). This
erately polluted areas is due to a decrease in the quantity of
supports the conclusion in the previous AMAP assessment
important food plants: epiphytic lichens for bank vole and
(AMAP, 1998), that the deterioration of ecosystems around
possibly also for red vole, mosses for Norway lemming,
the smelter complexes on the Kola Peninsula is mainly
and vascular plants, especially bilberry, for grey-sided vole
due to pollution by high concentrations of SO2, leading to
(Kalela, 1957; Kataev et al., 1994; L—fgren, 1995; Hansson,
extreme cases of acidification.
1999; H—rnfeldt, 2004).
Although there is almost no direct evidence of pollu-
5.3.2.1. Size, individual performance,
tion-induced mortality of vertebrates in the Arctic, data on
and population structure
the population densities of a carrion-feeding beetle, Nicro-
phorus vespilloides, indicate an increase in the mortality rates
Insect size frequently declines with an increase in pollu-
of vertebrates in moderately polluted forest habitats around
tion levels (Heli—vaara and Vðisðnen, 1993). However, this
Monchegorsk (Kozlov et al., 2005a). Even if pollutants do
trend has not been found in the Monchegorsk area: weight
not kill the birds and mammals, mortality may increase
of the Lapland leaf beetle, Chrysomela lapponica (Zvereva et
due to a reduced ability to sustain environmental stresses
al., 1995a), femur length in the autumnal moth (Ruohomðki
such as disease, low winter temperatures, and shortage of
et al., 1996), and the length of the hind tibia in black fly
food (Heinz, 1989; H—rnfeldt, 2004). Winter mortality (e.g.,
(Simulium pusillum) (Kozlov et al., 2005b), were independ-
Novikov, 1981) may be especially high in the contaminated
ent of pollution load. The absence of a pollution effect in
habitats.
S. pusillum, together with an extremely low abundance of
The increase in mortality, in the absence of a compensa-
black fly near the Monchegorsk smelter, implies that at
tory increase in reproduction (as reported in earlier stud-
least some of the specimens from the most heavily polluted
ies), suggests that populations in the polluted (low quality)
sites may represent occasional migrants rather than locally
habitats are supported by migration from the surrounding
breeding populations. However, this explanation is not
unpolluted territories, and that migrants are not able to as-
valid for C. lapponica or the autumnal moth as their larvae
sess habitat quality in terms of toxic contamination before
were collected in heavily polluted sites.
breeding. Moderately polluted habitats may be attractive
Despite some biochemical adaptations to pollution
for dispersing birds and mammals not only because of the
(Zvereva et al., 2003), the individual performance of C.
permanent vacation of territories due to high mortality, but
lapponica beetles collected in heavily polluted, industrial
also because some resources are more abundant there than
barrens was lower than in unpolluted forests; females
in the surrounding unpolluted forests. The contaminated
laid less eggs and egg hatchability was significantly lower
area of about 1000 km2 around the Monchegorsk smelter
(Zvereva et al., 1995a).
complex acts like a death trap for dispersing birds and
Although an increase in the rate of melanic specimens
mammals, and the moderately contaminated forested part
with an increase in pollution is well documented (Brake-
of this area can possibly be classified as an attractive sink
field, 1987), this has not been reported for the Arctic. There
habitat (Kozlov et al., 2005a).
were no melanic specimens among geometrid and noc-
tuid moths collected around the Monchegorsk smelter by
bait-traps during 1991 to 1994 (Kozlov, 1997). Similarly,
5.3.2. Effects on invertebrates
frequencies of melanic morphs of the Lapland leaf beetle
C. lapponica were independent of pollution load, despite
The effects of acidifying pollutants on invertebrates have
pronounced variation in morph frequencies among study
been explored to a much lesser extent than many of the oth-
sites and differences between dark and light morphs in
er components of terrestrial ecosystems, and the previous
both size and performance (Zvereva et al., 2002).
AMAP assessment (AMAP, 1998) contained no informa-
Changes in spatial structure of insect populations are
tion on invertebrates. However, recent studies conducted
limited to observations on their distribution among and
60
AMAP Assessment 2006: Acidifying Pollutants, Arctic Haze, and Acidification in the Arctic
within host-plant individuals. Distribution of mines of two
a decrease in feeding niche breadth with increasing pollu-
moths, Eriocrania spp. on birch and Phyllonorycter strigul-
tion levels: near the smelter, beetles concentrated on S. bo-
atella on elder, is more aggregated near the pollution source
realis, while in unpolluted habitats they used other willow
(Kozlov, 1987, 2003). For Eriocrania, an increase in aggrega-
species as well (Zvereva et al., 1995b). Second, the death of
tion can be explained by higher wind speed (Kozlov, 2002)
large trees in polluted habitats makes the forest more open,
in industrial barrens, which forces females of tiny moths to
well illuminated, and with higher summer temperatures
walk rather than to fly between the oviposition sites. How-
(Kozlov and Haukioja, 1997); these microclimate changes
ever, this explanation is not valid for P. strigulatella, due to
may be beneficial for many insects in northern areas. In
much lower habitat disturbance near the power plant in
particular, larval survival of C. lapponica increased with an
Apatity than in the industrial barrens around the Monche-
increase in mean June temperature (Zvereva, 1999). Third,
gorsk smelter. Instead, the latter may simply concentrate
the impact of moderate concentrations of SO2 improves
on longer, presumably more vigorous, shoots, because the
host willow quality for C. lapponica (Kozlov et al., 1996c),
preference for longer shoots increased towards the emis-
an effect that seems to be general for herbivores (Hughes,
sion source (Figure 5.15).
1988; Riemer and Whittaker, 1989). Fourth, the overall im-
Frequency
Beetles per 10 min count
Polluted
0.4
30
All shoots
Clean sites
P< 0.0001
Mined shoots
25
0.3
20
0.2
15
10
0.1
5
0
1
2
3
4
5
6
7
8
9
0
Number of leaves in a shoot
Beetles per 10 min count
Frequency
200
Background
Polluted sites
0.4
All shoots
P< 0.0001
Mined shoots
150
0.3
100
0.2
50
0.1
0
0
1
2
3
4
5
6
7
8
9
1990
1991
1992
1993
1994
1995
1996
1997
1998
1999
Number of leaves in a shoot
Figure 5.15. Distribution of Phyllonorycter strigulatella mines among
Figure 5.16. Population dynamics of Lapland leaf beetle (Chrysomela
shoots of its host, Alnus incana, with different number of leaves rela-
lapponica) at two relatively clean and two heavily polluted sites near
tive to distribution of shoots in a random sample in polluted and
the copper-nickel smelter in Monchegorsk. Density was assessed by
background sites around the power plant at Apatity. Sample sizes:
the number of beetles found during 10 minute counts (conducted
polluted sites, all shoots: N=500, mine number: N=1250; background
in three replicates at each site); bars indicate standard errors (after
sites, all shoots: N=300, mine number: N=1000. Statistics ( 2) reflect the
Zvereva et al., 2002).
difference between the distributions of all shoots and mined shoots
(after Kozlov, 2003).
pact of pollution creates enemy-free space for C. lapponica
5.3.2.2. Changes in population densities
(Zvereva and Kozlov, 2000) by decreasing the abundance
Some species clearly benefit from the impact of pollu-
of some predators, especially syrphid flies, birds, and ants;
tion. In particular, the willow feeding Lapland leaf beetle
in contrast, fly parasitoids are not sensitive to pollution
(Chrysomela lapponica) is generally infrequent in subarc-
(Figure 5.17). Thus, it seems that the release from preda-
tic forests; however, outbreaks of this species, sometimes
tion pressure allows leaf beetles to increase their abun-
resulting in complete defoliation of willow bushes, have
dance, despite a decrease in individual performance and
been detected in the vicinity of Monchegorsk and Nikel
to utilize high-quality host plants up until the point where
(nickel-copper smelters), and Vorkuta (a cement factory
overgrazing causes a deterioration in host quality (termed
and a power plant) (Figure 5.16) (Zvereva et al., 1997b,
Delayed Inducible Resistance), with a subsequent crash in
2002; Virtanen et al., 2002). Long-term studies on the Lap-
the outbreak (Zvereva et al., 1997a).
land leaf beetle suggest that pollution favors this species
Pollution may interact with the natural density fluctua-
in a number of ways. First, the abundance of Salix borealis,
tions of some insects and, in these situations, the effects of
which is the most favorable host plant of the leaf beetle, is
pollution become visible only in high-density years. This
much higher in the willow- and birch-dominated second-
is the case with a tiny moth, Phyllonorycter strigulatella, the
ary communities around the Monchegorsk smelter than in
larvae of which develop in the leaves of Alnus incana. This
virgin coniferous forests located at considerable distances
was monitored around a coal-fired power plant (emitting
from Monchegorsk (Zvereva et al., 1995a,b). This may be
11 000 to 29 000 tonnes of SO2 each year) near Apatity dur-
especially important in relation to the findings concerning
ing 1991 to 2001. The periodicity in density fluctuation was
61
Chapter 5 ñ Effects on Terrestrial Ecosystems
not affected by pollution; peak densities of the leafminer
of the background density Ù was reported for soil mites
were observed at both polluted and unpolluted sites in
near Monchegorsk (Zenkova, 1999). Ants also decline near
1993 and 1999 (Figure 5.18). Densities of P. strigulatella
Monchegorsk, as revealed by direct censuses (Gilyazova,
showed no correlation with pollution levels between out-
1993) and estimates of their predatory activity against leaf
breaks, but increased strongly near the power plant during
beetle larvae (Zvereva and Kozlov, 2000). Among herbiv-
outbreaks. At polluted sites the density increased by a fac-
ores, this pattern was evident in the birch-feeding leafroller
tor of 15 to 20, whereas at unpolluted sites it increased by
(Eulia ministrana) (Kozlov, 1997) and several noctuid moths
a factor of 3 to 4, relative to the density between outbreaks
(Xestia rhaetica, X. speciosa, Eurois occultus) (Kozlov et al.,
(Kozlov, 2003).
1996a). A decrease in the abundance of the autumnal moth
Increase in density with increasing proximity to the
was reported near Monchegorsk (Ruohomðki et al., 1996);
Monchegorsk smelter complex has also been reported in
this, however, contradicts the density increase of the au-
leafmining moths (Eriocrania spp.) feeding on birches, in
tumnal moth reported near Nikel (Ruohomðki et al., 1996).
the moth Argyresthia pygmaeella the larvae of which live
Catches of human-biting mosquitoes (Culicidae) and black
in willow buds (Kozlov, 1997), and in saprophagous flies
flies (Simuliidae) decreased near the Monchegorsk smelter
(families Calliphoridae, Scatophagidae, Calobatidae, Otiti-
by a factor of 10 to 100, presumably due to the combined
dae, Sepsidae) (Zvereva, 1993a,b). Around Nikel, a density
action of pollutant toxicity, pollution-induced forest deg-
increase was found for the autumnal moth (Ruohomðki et
radation, and a decline in vertebrate density (Kozlov et al.,
al., 1996).
2005b). Among other fly species, the density decline was
The opposite Ù a decline in density near the pollution
most pronounced in predatory groups such as Empididae
source Ù has been reported more frequently than a density
(Zvereva, 1993a,b).
increase; however, this may have resulted from the strong
Although detection of a non-linear (e.g., dome-shaped)
publication bias against the reporting of `positive' results.
response to pollution is more difficult than a linear re-
This trend seems most common for soil mesofauna around
sponse, this kind of density pattern has been found in sev-
all Kola Peninsula polluters (Koneva, 1993; Zenkova, 1999;
eral species, such as noctuid moths (Acronicta auricoma,
Zenkova and Zainagutdinova, 2002). In particular, the den-
Hyppa rectilinea, Diarsia mendica, Xestia alpicola, Sympistis
sity of spiders in the most polluted sites was around 10%
heliophila), geometrid moths (Rheumaptera subhastata, Ema-
of that observed in unpolluted forests around Monche-
turga atomaria), and butterflies (Clossiana euphrosyne, Vacci-
gorsk (Gilyazova, 1993) and Nikel (Koneva and Koponen,
niina optilete) (Kozlov et al., 1996a,b). The density of frit flies
1993). Abundance of larvae of two families of soil-inhabit-
(Chloropidae) peaked at 7 to 17 km from Monchegorsk,
ing beetles Ù click beetles (Elateridae) and soldier beetles
being equally low in industrial barrens and in unpolluted
(Cantharidae) Ù near the Kandalaksha aluminum smelter
forests (Zvereva, 1993b). Population density of the burying
decreased by a factor of 10 to 20 (Zenkova and Zainagut-
beetle (Nicrophorus vespilloides) determined by bait-trap-
dinova, 2002). The most pronounced decline Ù to 0.43%
ping, peaked at 15 to 30 km from Monchegorsk. Since the
abundance of vertebrates decreases towards the pollution
Mortality, %
source, this pattern indicates an increase in the beetle's
70
Clean sites
food supply (carcasses of vertebrates), i.e. an increase in the
60
Polluted sites
mortality rates of vertebrates even in moderately polluted
50
forest habitats (Kozlov et al., 2005a).
40
Finally, densities of some groups of invertebrates do
not seem to change along pollution gradients. This pattern
30
was detected for the willow-feeding leaf beetle (Phratora
20
vitellinae) (Kozlov, 1997), springtails (Collembola), and soil-
10
dwelling beetle larvae (Zenkova, 1999).
0
Eggs
Larvae
Pupae
Larvae
Pupae
Predation
Parasitism
5.3.2.3. Changes in species richness, diversity,
and community structure
Figure 5.17. Mean mortality of different stages of Lapland leaf beetle
(Chrysomela lapponica) due to predators and parasitoids in two rela-
Species richness of different taxa or ecological groups, in-
tively clean and two heavily polluted sites near the copper-nickel
smelter at Monchegorsk. Bars indicate standard errors (after Zvereva
cluding moths and butterflies, ants, flies (including human-
and Kozlov, 2000).
biting flies), birch-feeding insects and some other insects,
does not decline with decreasing distance to the smelter
Mine/leaf
at Monchegorsk (Kozlov, 1996, 1997; Kozlov et al. 1996a,b,
2.0
2005b; Kozlov and Whitworth, 2002). Moreover, some rare
Polluted
Background
or endangered species of moths and butterflies, such as
1.5
Sympistis zetterstedti and Clossiana freja, have been recorded
in severely polluted habitats (Kozlov, 1996). The occur-
1.0
rence on the Kola Peninsula of the lunar hornet clearwing
(Sesia bembeciformis) which had been considered extinct
0.5
in Finland for decades, is only associated with industrial
barrens adjacent to the Monchegorsk smelter (Kozlov and
0
Jalava, 1994). Interestingly, both species of parasitic fly that
1991 1992 1993 1994 1995 1996 1997 1998 1999 2000 2001
develop in larvae of the Lapland leaf beetle, C. lapponica,
Figure 5.18. Density fluctuations for the leafmining moth Phyllonorycter
were considered extremely rare prior to the mass occur-
strigulatella in polluted and background areas around the power plant
rence reported in the impact zone around the Monchegorsk
at Apatity on the Kola Peninsula. Means are based on five (polluted
smelter (Richter and Zvereva, 1996; Disney et al., 2001).
sites) or four (background sites) site-specific values; bars indicate
standard errors (after Kozlov, 2003).
62
AMAP Assessment 2006: Acidifying Pollutants, Arctic Haze, and Acidification in the Arctic
In contrast, the diversity (measured by the Shannon-
and makes the data available for integrated assessments,
Weaver index) of several groups of insect, for example
for example in support of emission reduction negotiations
moths and butterflies, or all birch-feeding insects, was
(Hettelingh et al., 2001).
reported to decrease with increasing levels of pollution,
Parties to the LRTAP Convention mostly compute criti-
while the diversity of other groups, such as flies, did not
cal loads for terrestrial ecosystems (forests and semi-natural
change (Kozlov, 1997; Kozlov and Whitworth, 2002; Kozlov
vegetation) following agreed procedures laid down in the
et al., 2005b). These data suggest that acidification modifies
Mapping Manual (UBA, 2004). Although the LRTAP Con-
insect communities primarily via changes in abundance,
vention covers the region of the UN Economic Commission
rather than through selective removal of some species.
for Europe (UNECE) Ù i.e. Europe, the area of the former
The few studies that have been undertaken on soil
Soviet Union, the United States, and Canada Ù critical loads
mesofauna suggest that several taxa, such as earthworms
data for North America have not been available to date.
(Lumbricidae) and millipedes (Myriapoda), may have
Only recently a level-0 approach has been used to compute
completely vanished in severely polluted habitats (Koneva,
critical loads for terrestrial ecosystems in Canada.
1993; Gilyazova, 1993; Zenkova, 1999). Only two species of
The resulting critical load map for Canada represents
spider, Steatoda phalerata and Agyneta gulosa, were caught
the long-term buffering capacity (or weathering rate) in
in the industrial barren 2.5 km from Monchegorsk, com-
the top 60 cm (at most) of soil (Aherne and Watmough,
pared to 18 species collected in forests 20 and 30 km from
2005). The principal data set underlying the current map is
Monchegorsk (Koponen, 2005). However, the conclusion
the Soil Landscapes of Canada (SLC; scale of 1:1,000,0000)
concerning an overall decline in the taxonomic diversity
database. The SLC map (and associated databases) was
of soil mesofauna (Zenkova, 1999) near the Monchegorsk
produced by generalizing detailed soil survey data. The
smelter must be viewed as tentative, due to deficient sam-
level of mapping was designed to be used for broad, re-
pling design and because the diversity data were not cor-
gional-scale assessments. Using semi-quantitative meth-
rected for sample size.
ods, soil buffering capacities (derived from percent clay
and substrate type) have been allocated to soil types. Buff-
ering capacities were vertically and spatially weighted for
5.3.2.4. Concluding comments on invertebrates
each soil type to derive a single average value for each
Much circumstantial evidence suggests that acidic pre-
mapping unit. This level-0 approach does not yet consider
cipitation is responsible for a decline in populations of
vegetation uptake, atmospheric inputs, or soil leaching,
some insects in Europe and North America (Heli—vaara
and represents an initial attempt at mapping critical loads
and Vðisðnen, 1993). However, densities of many insects
for Canada. Figure 5.19 shows the acidity critical loads for
significantly increased near point polluters, thus pollution
terrestrial ecosystems above 60¤ N, both for Canada and
impacts on invertebrates can not be seen as purely adverse.
northern Europe (note: terrestrial critical loads for Alaska
Although the causal reasons behind the reported changes
and Greenland have not been mapped).
in insect populations are far from clear, the effect is more
likely to be linked to changes in host plant abundance and
physiology, or with changes in habitat structure, rather
-150
Critical Loads of acidity in terrestrial ecosystems
60
60
65
than to toxicity (Kozlov, 1997). Data collected in heavily
70
75
contaminated industrial barrens show that these habitats
80
85
are relatively rich in insect fauna and can even serve as
refugia for some rare and endangered species.
-120
30
5.4. Critical loads of acidity
and their exceedance
eq/ha/yr
-90
0
< 200
200 - 500
Several protocols under the Convention on Long-range
500 - 800
800 - 1000
Transboundary Air Pollution (LRTAP) require signatories
-60
1000 - 1500
-30
> 1500
to reduce sulfur and nitrogen emissions, the latest being
the Protocol to Abate Acidification, Eutrophication and
Figure 5.19. Critical loads of acidity for terrestrial ecosystems in north-
Ground-level Ozone which was signed in Gothenburg in
ern Europe and Canada north of 60¤ N.
1999 and entered into force in May 2005. This is an effects-
based protocol, meaning that ecosystem vulnerabilities
Exceedances of critical loads were calculated by com-
were used in negotiations of emission reduction targets.
bining the critical load maps with modeled deposition data,
The vulnerability of ecosystems to the deposition of sulfur
using the hemispheric Eulerian model DEHM. Three emis-
and nitrogen is quantified by critical loads, `the quanti-
sion/deposition scenarios were used for the exceedance
tative estimate of an exposure to one or more pollutants
calculations (see section 2.3 for details): (i) 1990 emissions,
below which significant harmful effects on specified sensi-
(ii) the Current Legislation (CLE) scenario for 2010 (the
tive elements of the environment do not occur according
CLE scenario reflects the current perspectives of individual
to present knowledge' (Nilsson and Grennfelt, 1988). Un-
countries on future economic development and takes into
der the auspices of the LRTAP Convention, critical loads
account the effects of presently agreed emission control leg-
are calculated at national focal centers of many European
islation in the individual countries), and (iii) the Maximum
countries following agreed methodologies (UBA, 2004).
technically Feasible Reduction (MFR) scenario for 2020 (the
The data are collected, vetted, and collated by the Coordi-
MFR scenario projects the scope for emission reductions
nation Centre for Effects, which produces European maps
offered by full implementation of presently available emis-
63
Chapter 5 ñ Effects on Terrestrial Ecosystems
sion control technologies, while maintaining the projected
levels of anthropogenic activities).
Estimated exceedances of the critical loads for the three
scenarios are shown in Figure 5.20. The results indicate that
for Canada there is no exceedance (north of 60¤ N) under the
three deposition scenarios (i.e., not even in 1990). Although
critical loads are comparable in Canada and northern Eu-
rope, deposition of sulfur and nitrogen is much smaller in
Canada. The minimum critical load is about 84 eq/ha/yr
and the maximum rates of sulfur and nitrogen deposition
are about 30 to 40 eq/ha/yr each (not in the same place).
Thus not even the combined sulfur and nitrogen deposition
exceeds any critical load in this region.
In northern Europe large regions show critical load
exceedances for 1990 (Figure 5.20). However, this area is
much reduced assuming implementation of currently ag-
reed emission reduction measures (CLE 2010), and would
almost completely disappear assuming the MFR 2020
scenario.
Estimated exceedance of critical loads of acidity in soils
-150
60
60
65
1990
70
75
80
85
-120
30
-90
0
-60
-30
-150
60
60
65
CLE 2010
70
(Current Legislation)
75
80
85
-120
30
-90
0
-60
-30
-150
MFR 2020
60
60
65
(Maximum technically
70
Feasible Reduction)
75
80
85
-120
30
eq/ha/yr -90
0
> 500
200 - 500
100 - 200
50 - 100
< 50
-60
-30
no exeedance
Figure 5.20. Estimated exceedance of critical loads of acidity for soils for
three emission/deposition scenarios: 1990 emissions, the CLE scenario
for 2010 (CLE, 2010), and the MFR scenario for 2020 (MFR, 2020).
64
AMAP Assessment 2006: Acidifying Pollutants, Arctic Haze, and Acidification in the Arctic
Chapter 6
Effects on Freshwater Ecosystems
Brit Lisa SkjelkvÍle, Julian Aherne, Tarja Bergman, Kevin Bishop, Martin Forsius, Laura Forsstr—m, Natalia A.
Gashkina, Jean-Paul Hettelingh, Dean Jeffries, Äyvind Kaste, Atte Korhola, Antti Lappalainen, Hjalmar Laudon,
Jaakko Mannio, Tatyana Moiseenko, Marjut Nyman, Maximilian Posch, Ann Kristin Schartau, John Stoddard,
Jouni Tammi, Jussi Vuorenmaa, Anders Wilander, and Valery Yakovlev
6.1. Evidence from water
Definitions, terms, and calculations
quality monitoring
Water chemistry
The previous AMAP assessment of acidification of surface
The chemical composition of surface waters in an undisturbed
water in the Arctic focused on northern Fennoscandia and
ecosystem is mainly determined by the contribution of ions
the Kola Peninsula (AMAP, 1998). There were no reports
from weathering and ion exchange in the catchment and from
of acidified lakes and rivers in Arctic Canada and Alaska.
atmospheric deposition. Atmospheric deposition is influenced
Although lakes in some areas of North America were re-
by sea salts, soil dust, and long-range transported air pollut-
ported to be acid sensitive there were no indications of
ants. The chemical composition of precipitation depends on
acidification.
distance from the sea and anthropogenic pollution sources. It
The geographical extent of surface water acidification
is modified by a number of processes when passing through
was based on national lake surveys in Finland, Norway,
a catchment. Such processes are biological (microbial activ-
and Sweden between 1986 and 1990 (Henriksen et al.,
ity, uptake by plants, release of ions through decomposition,
1992). These surveys showed that the impacts from high
etc.) and chemical (weathering, ion exchange, adsorption
levels of sulfur deposition were mostly limited to a dis-
and desorption, redox processes, precipitation etc.). In gen-
tance of about 50 km from the large pollution sources.
eral, bedrock composed of gneisses and granitic gneisses has
Nitrate concentrations were very low over the whole area,
low weathering rates, yielding waters with a low content of
due to very low nitrogen deposition.
base cations and bicarbonate that consequently have a low
The border areas between Norway, Finland, and Rus-
buffering capacity toward acidification. Bedrock with a more
sia were reported to be heavily polluted. Studies of lakes
basic character such as gabbro, greenstone, and schist has
in the eastern parts of Finnmark in 1986 (Traaen, 1987)
higher weathering rates and releases more base cations and
showed that the sulfate concentration had more than dou-
bicarbonate, yielding surface waters with a higher buffering
bled since 1966 and was at the same stage of acidification
capacity. Biological processes usually result in modification
as the most acidified lakes in southern Norway. Numer-
of ion composition or removal of ions, while weathering gives
ous small mountain lakes in the area were chronically
a net contribution. The total sum of ions from deposition and
acidic (pH<5). Even large lakes had little of their original
weathering together with all the various processes occurring
buffering capacity left. Some small lakes, in particular
within a catchment determine the chemistry of the runoff
at Jarfjordfjellet, were too acidic to support fish. Studies
water. Additional, but often similar, in-lake processes can
in 1987 to 1989 (Traaen, 1991) indicated that large areas
further modify the ion composition.
in S½r-Varanger would become increasingly damaged,
with a loss of fish stocks, if the acid deposition increased
Acidification and naturally acidified lakes
further.
On the Kola Peninsula acidified lakes were reported
The pH of most natural, mineral-bearing waters falls within
around the industrial centers, and along the northern and
the range 6 to 9. pH 6 is a threshold value below which lake
eastern parts of the peninsula. However, at Kola, pollution
biology is detrimentally affected by acidification (Baker et al.,
from nickel and copper was a bigger problem in lakes than
1990; Doka et al., 2003; Holt and Yan, 2003). pH in a lake
acidification (Moiseenko et al., 1995).
is affected by several natural processes within the catchment,
An extensive inventory of small lakes in northern
such as the rate of weathering and production of bicarbonate,
Finland between 1987 and 1991 showed that acidic and
mobilization and leaching of organic acids derived from humic
poorly buffered lakes were widely found in northeast-
substances (organic anions, typically indicated by dissolved
ern Lapland near the Norwegian and Russian borders.
organic carbon/ total organic carbon levels), and input of sul-
Sulfate concentrations here were generally higher than
fate from natural sulfide-bearing minerals. Low weathering
in other parts of Lapland (Kðhk—nen, 1996). A survey of
rates, high input of organic anions, and high input of natural
small mountain lakes and brooks in northeastern Lapland
sulfate help to depress pH in the lake or river. Large inputs of
in 1991 to 1993 found that the alkalinity of surface waters
anthropogenically derived sulfur and nitrogen that exceed the
was lowest (mostly <50 eq/L) in the Vðtsðri area 40 to 50
critical loads for the lake can also depress the pH to biologi-
km west of the Nikel smelter (Lappalainen et al., 1995).
cally harmful levels. It is not obvious, by measuring pH only,
Areas sensitive to acidification and areas possibly acid-
if a low pH value in a water body is due to anthropogenic or
ified by acid deposition were quantified by calculating the
natural processes.
critical loads for acidification of surface waters (see Box).
Sulfur was regarded as the only acidifying agent as nitrate
Alkalinity
concentrations in lakes and streams in this area were very
low. Critical loads for northern Fennoscandia, the Kola
Alkalinity is a measure of the buffering capacity of water, or the
Peninsula, and the Spitsbergen Archipelago (Henriksen
capacity of bases to neutralize acids. Alkalinity is a measure
et al., 1994; Lien et al., 1995) were very variable, ranging
of the water's ability to resist change in pH and to neutralize
from <300 to >1300 mg S/m2/yr. Most areas of Finland
65
Chapter 6 ñ Effects on Freshwater Ecosystems
acid inputs. Alkalinity is a more integrative indicator of lake
the seasalt contributions have been subtracted from the total
acidification than pH. The most important buffering materi-
levels measured. For sulfate, what is left represents the natural
als in natural waters in the Arctic are primarily bicarbonate
background input from weathering (which is normally very
(HCO -3) and organic acids. Waters with low alkalinity (<20
low) and the anthropogenic contribution from deposition. For
eq/L) are very susceptible to changes in pH. Waters with
base cations the remaining fraction is derived from weather-
high alkalinity (>200 eq/L) are able to resist major shifts in
ing. Non-marine fractions (denoted by an asterisk) of sulfate*
pH. As increasing amounts of acid are added to a water body,
and base cations* in lake and river water are calculated (see
the buffering capacity of the water is consumed, and the pH
below) under the assumptions that all chloride (Cl) is of ma-
of the water decreases (acidification). At pH 5.5, only very
rine origin (cyclic sea salts) and is accompanied by other ions
weak buffering ability remains, and at pH levels below 4.5
in the same proportions as in seawater. Base cations* are in
there is no alkalinity left. Alkalinity is measured by titration.
this assessment taken as the sum of non-marine Ca + Mg. All
An acid of known strength (the titrant) is added to a volume
units are in eq/L.
of a treated sample of water. The volume of acid required to
bring the sample to a specific pH level reflects the alkalinity
[Ca*]
=
[Ca]
-
0.037
ñ
[Cl]
of the sample. Alkalinity can be measured in the laboratory
[Mg*] =
[Mg]
-
0.198
ñ
[Cl]
in many different ways, making it difficult to compare results
[SO
from different investigations.
4*]
=
[SO4] -
0.103
ñ
[Cl]
Acid neutralizing capacity
Acid sensitive lakes and critical loads
Calculated Acid Neutralizing Capacity (ANC) is an equiva-
Lake water chemistry gives information on sensitivity to acidi-
lent to measured alkalinity. ANC is an even more integrative
fication. An extremely sensitive lake typically has an alkalinity
and robust parameter than alkalinity in establishing good
of <20 eq/L, and a less sensitive lake from 20 to 50 eq/L. A
dose/response relationships between water chemistry and
lake with an alkalinity of >200 eq/L is considered to be insen-
damage to the biological community. ANC is the parameter
sitive to acidification. The concentration of base cations can
used as the critical chemical criterion for sensitive indicator
also give an indication of the acid sensitivity of the water, as
organisms in surface waters within the international critical
the base cation concentrations directly reflect the weathering
loads work. ANC is defined as (Reuss and Johnson, 1986):
rate and bicarbonate production rate within the catchment.
equivalent sum of base cations minus the equivalent sum of
Surface water with low concentrations of base cations (BC*
strong acid anions ANC = ([Ca2+] + [Mg2+] + [Na+] + [K+] +
<100 eq/L) indicates sensitivity to acidic atmospheric inputs.
[NH +
2-
-
4 ]) - ([Cl-] + [SO4 ] + [NO3 ]). Waters with low ANC
Concentrations of base cations from 100 to 400 eq/L indicate
(<50 eq/L) indicate possible damage to biota.
moderate sensitivity and values >400 eq/L indicate general
insensitivity.
Biologically relevant chemistry
To evaluate anthropogenic acidification of lakes, the water
chemistry must be evaluated together with deposition input.
The ultimate goal of emissions control programs is biologi-
This is done by calculating the critical load of acidity (CLAc)
cal recovery, or the return of sensitive species that have been
and the exceedance of the critical load based on atmospheric
eliminated during the course of acidification. An assessment
inputs of sulfur and nitrogen. The critical load concept is a
of biologically-relevant chemical trends can only suggest that
method of estimating ecosystem sensitivity to acidic inputs
biological recovery is possible (or expected), not that it has
(i.e., sulfur and nitrogen), and was used to prepare the two
occurred. When surface water trends are shown to be mov-
protocols to the LRTAP Convention for reducing emissions
ing in the correct direction (e.g., decreases in sulfate, or in-
of sulfur and nitrogen in Europe: the Oslo Protocol in 1994
creases in pH), they indicate improvement in the acidÙbase
(UNECE, 1994) and the Gothenburg Protocol in 1999 (UN-
chemistry of lakes and streams. It is important to note that
ECE, 1999). Similarly, critical loads were used to guide the
these improvements do not necessarily equate to recovery.
distribution of sulfur dioxide emissions reductions in south-
The term `recovery' implies that the chemistry has returned
eastern Canada during the 1980s and 1990s (Jeffries, 1997).
to some pre-acidified status, such as pre-industrial levels of
The CLAc is a property of the lake and its catchment and is
sulfate or alkalinity; trends indicate only that surface waters
primarily based on weathering rates in the catchment. Since
are moving toward this recovered status, not that they have
weathering is a function of bedrock geology, the sensitivity
reached it. In the absence of good data on biological recovery,
to acidification of surface waters can also be determined from
it is common to assume that biological recovery will eventu-
geological maps. Exceedance of critical loads compares the
ally occur, after a sufficient time lag, when key chemical vari-
critical load with deposition Ù actual or expected. When the
ables have recovered their pre-acidification levels. These key
deposition is greater than the critical load the aquatic ecosys-
chemical variables are those that have direct toxic effects on
tem is expected to become damaged.
biota (primarily hydrogen ion and aluminum) and those that
The geographical extent of surface water sensitivity to
ameliorate some of the toxic effects (primarily base cations like
acidification in the AMAP region can also be determined from
calcium). For these reasons, evaluations of chemical recovery
a map prepared by the Stockholm Environmental Institute
are often focused on acidity (pH and alkalinity), aluminum,
based on soil type, land cover, and soil moisture. This is mainly
and base cations (calcium).
assumed to hold for assessment of soil sensitivity, but will in
general also hold for surface water sensitivity.
Non-marine concentrations
All calculations and presentations of sulfate and base cations
(sum of Ca + Mg) in this work are non-marine fractions, i.e.
66
AMAP Assessment 2006: Acidifying Pollutants, Arctic Haze, and Acidification in the Arctic
a
Non-marine sulfate
(SO *), eq/L
4
< 50
50 - 100
> 100
Figure 6.1. Distribution of (a) sulfate levels and (b) acid neutralizing capacity in
arctic lakes. For densely sampled areas (Scandinavia and Spitsbergen), data were
summarized into grid cells by averaging the data points (lakes).
and Norway near the smelters were quite sensitive, and
eas of Arctic Canada, northern Russia, Alaska, Iceland,
critical loads for the Kola Peninsula were low. Exceedance
and the Spitsbergen Archipelago were also covered. Since
of critical loads (based on 1990 sulfur deposition), which
the previous AMAP assessment on acidification (AMAP,
indicates possible surface water acidification, occurred
1998) there has been one large lake survey in the arctic
in 70% of the county of S½r-Varanger in Norway. Critical
part of the Fennoscandian region. This was undertaken in
loads were exceeded in 48% of lakes on the Kola Peninsula
1995 and included the Kola Peninsula, the northern part
(Moiseenko, 1994). Small exceedances (based on 1990 sul-
of Fennoscandia, and Iceland (Henriksen et al., 1997a,b;
fur deposition) were recorded in 5% of the ice-free area of
SkjelkvÍle et al., 2001c).
Svalbard and Bear Island, but only in the northern parts
This assessment compiles data from several arctic re-
(Lien et al., 1995).
gions. Sources of data and median values for key chemi-
Long-term trends in surface water chemistry in Fin-
cal variables for different arctic regions are summarized
land, Norway, Sweden, and on the Kola Peninsula, showed
in Table 6.1. The geographical distribution of sulfate and
that between the mid-1980s and early 1990s, acidification
acid neutralizing capacity (ANC) in arctic lakes is shown
had stabilized and may even have reduced slightly in
in Figure 6.1. It should be remembered that compiling
some lakes. This was assumed to have resulted from de-
data in this way means that the sample population is not
creased sulfur emissions in Europe. Some of the lakes and
a statistical subset of the overall lake population. Chemical
rivers had enough buffering capacity that they were not
data from 605 lakes within the Canadian Arctic were com-
affected by high acid inputs.
piled for this assessment. Most of the data were collected
in the 1990s (Table 6.1). The variables include: pH, calcium
(Ca2+), magnesium (Mg2+), sodium (Na+), potassium (K+),
6.1.1. Current status
alkalinity, sulfate (SO 2-
-
4 ), chloride (Cl-), nitrate (NO3 ), plus
dissolved organic carbon (DOC) and specific conductance.
The current status of acidification of surface waters in the
Some datasets contained dissolved inorganic carbon (DIC)
Arctic has been determined from a compilation of regional
values rather than alkalinity, and in such cases, the latter
and sub-regional lake surveys. Most were undertaken in
was estimated by assuming that the DIC exists entirely as
northern Fennoscandia and the Kola Peninsula, but ar-
bicarbonate (HCO -3).
67
Chapter 6 ñ Effects on Freshwater Ecosystems
b
ANC
< 20
20 - 50
50 - 200
> 200
Table 6.1. Median values for a selection of key chemical variables including the calculated critical load of acidity CLAc and exceedance.
n % of total
pH
BC*, Alkalinity, ANC,
SO4*,
DOC,
NO3,
CLAc,
% of area
lake
eq/L
eq/L
eq/L
eq/L mg C/L
eq/L
meq/m2/yr exceeded
popu-
by sulfur
lation
deposition
Northern Russia a Taymir area
23
7.97
490
445
80
4.0
Northern Russia a Pechora River basin
29
6.75
196
195
53
7.7
Northern Russia a Lena River basin
31
7.40
393
312
37
4.0
Northern Russia b Kola Peninsula
460
2.3
6.45
172
79
144
36
7.6
0.1
66
14
Finland b
Lapland
184
2.1
6.81
196
116
175
35
5.3
0.2
64
8
Norway b
Nordland, Troms
205
1.4
6.80
145
88
106
27
1.4
0.2
101
12
and Finnmark
Sweden b
Norbotten
641
3.5
6.84
188
114
165
30
4.0
0.4
64
3
Iceland c
39
2.1
7.30
369
441
477
10
1.0
>0.1
546
0
Svalbard and
167
30
7.54
541
492
429
82
0.5
1.9
193
5
Bear Island c, d
US, Alaska e
Kenai
59
6.88
101
96
144
3
6.4
0
US, Alaska f
CABAL
22
7.79
457
459
448
89
4.7
0
Canada g
Yukon (YK)
96
8.09
972
692
756
55
5.6
0.6
Canada g
Northwest
167
7.89 1866
1525
1519
83
3.0
0.7
Territories (NT)
Canada g
Nunavut (NU)
3
7.90 1577
1200
1098
275
10.6
0.8
CLAc is calculated by using the catchment dependent ANClimit (Henriksen and Posch, 2001) and the Norwegian background sulfate concentration
for all countries, except Sweden (Wilander, 1994). Exceedance CL is calculated with S-deposition from different sources, for each country year of
deposition and name of the institute providing the deposition numbers are given: Norway (1990, NILU Norwegian Institute for Air Research),
Sweden (1994, SMHI Swedish Meteorological and Hydrological Institute), Finland (1990, SYKE), Kola and Iceland (1992, EMEP European
Monitoring and Evaluation Programme).
Data sources: a Duff et al. (1998); b Henriksen et al. (1997b); c SkjelkvÍle et al. (2001c); d Lien et al. (1995), e Newell and Mitch (1992), Eilers et al. (1993);
f Allen-Gil et al. (1997) g Nahanni (NT), Tuktoyaktuk (NT), Yellowknife (NT) and Wager Bay (NU) from Environment Canada, unpub. data; region
between Coronation Gulf and Great Slave Lake (both NT and NU) from R■hland and Smol (1998), R■hland et al. (2003); region between southern
YK and Tuktoyaktuk (NT) from Pienitz et al. (1997a,b); Wood Buffalo National Park (NT) from Moser et al. (1998); Melville Island (both NT and
NU) from Bronwyn Keatley (Queen's University, unpub. thesis data); Prince Patrick Island (NT), Ellef Ringnes Island (NU) and Ellesmere Island
(NU) from Antoniades et al. (2003a,b); Victoria Island and Axel Heiberg Island (NU) from Michelutti et al. (2002a,b); Baffin Island (NU) from Joynt
and Wolfe (2001); Southhampton Island (NU) from Mallory et al. (2006).
68
AMAP Assessment 2006: Acidifying Pollutants, Arctic Haze, and Acidification in the Arctic
6.1.1.1. Northern Fennoscandia and the Kola Peninsula
also had the highest frequency of lakes with pH levels of
The Euro-Arctic Barents region consists of two major geo-
<6.0 (28% of lakes), followed by northern Norway (14%),
logical provinces: the northern part of the Precambrian
Norrbotten (7%), and Lapland (7%). In general, the lakes
shield and the Caledonian fold belt toward the north and
of the Euro-Arctic Barents region are less acid than lakes
west. Within the framework of European geology, the Nor-
further south in these countries.
wegian, Swedish, Finnish, and Kola Precambrian is a part
There was a pronounced west to east gradient in total
of the Fennoscandian or Baltic Shield. The Caledonian fold
organic carbon (TOC) concentrations. The coastal areas
belt includes Precambrian and Paleozoic sediments. The
of Norway usually had <2 mg C/L, while lakes with >8
Precambrian rocks are dominated by gneisses and granitic
mg C/L were abundant in Norrbotten, Lapland, and the
gneisses with low weathering rates, while the Caledonian
eastern parts of the Kola Peninsula. The topographically
and the Archean Karelian province also include rocks of
flat areas with peatland accumulation on the eastern Kola
more basic character with higher weathering rates (Lid-
Peninsula and around Bothnian Bay are reflected in high
mar-Bergstr—m and Nðslund, 2005).
TOC levels. However, despite the high proportion of peat-
The results from the 1995 Nordic Lake Survey were re-
land areas in the north, TOC concentrations in lakes in
ported by Henriksen et al. (1997a,b), Henriksen (1998), and
northern regions were found to be lower than in the coun-
SkjelkvÍle et al. (2001c) and form the basis of this section.
tries as a whole, due to the colder climate, longer soil frost
Lakes with relatively high concentrations of base cati-
period, and lower peat decomposition rate (Kortelainen,
ons are found in areas with basic/mafic rocks and metased-
1993). Low TOC values in mountain lakes in the border
iments; south-central Kola, central Finnmark, and central
area between Norway and Sweden are due to less organic
Lapland as well as scattered areas in the Swedish moun-
soils in the catchments and high precipitation leading to
tains. Low base cation concentrations, giving the greatest
dilution.
sensitivity to acidification, are found scattered all over the
The estimated critical loads of acidity were exceeded
area and are most abundant in areas with bedrock com-
in all countries. The highest percentage of exceeded lakes
posed of granite and granitic gneisses, i.e., the northern
occurred in the Russian Kola and Norway, while Sweden
part of Kola, Norwegian coastal areas, the northeastern
had the lowest percentage of exceeded lakes. The calcula-
and southern parts of Lapland, and the western part of
tions were based on sulfur deposition for 1990 (Finland and
Norrbotten county. Northern Norway had the highest per-
Norway), 1992 (Kola), and 1994 (Sweden) (see Henriksen et
centage of lakes with low concentrations of base cations; in
al., 1997a for full references of source data). In Norrbotten,
Norway 40% of lakes had <100 eq/L, while Finnish La-
the mean exceedance for 47 NILU-grids (95 percentile) us-
pland had only 10%. In Norrbotten and Kola respectively,
ing the FAB model with respect to deposition in 1990, 1997,
21 and 26% of lakes were acid sensitive. On the other hand,
and 2010 (in accordance with the Gothenburg Protocol)
Norway also had the highest number of lakes with very
was 117, 38, and 31 eq/ha/yr, respectively.
high concentrations of base cations (11% of lakes had >500
eq/L compared to 4 to 6% in the other countries).
6.1.1.2. Iceland
Low alkalinity lakes (<20 eq/L) were most abundant
in the northern parts of the Russian Kola. Here, the higher
Iceland was created by volcanic activity along the Mid-
content of organic matter in lakes in the eastern parts and
Atlantic Ridge during the last 20 million years. The vol-
the higher anthropogenic sulfate content in the western
canic rocks in Iceland are predominantly mafic. Owing
parts lowers the alkalinity. In the northern parts of the
to the vesicular nature of the lava with glassy crusts, they
Nordic countries both the geological conditions and the
weather readily. The lake water chemistry clearly reflects
precipitation amounts determine the alkalinity; depending
this geology. Results from the 1995 lake survey (SkjelkvÍle
on the weathering rate of the minerals in the soil and dilu-
et al., 2001c) showed that Icelandic lakes generally had high
tion by precipitation, respectively. In some regions with a
concentrations of base cations and high values of ANC
high proportion of peatland, low alkalinity values in lakes
and pH. Sulfate and nitrate concentrations were in general
are largely attributable to organic acidity. In general, low
very low, due to low anthropogenic deposition of sulfur
alkalinity lakes are rare in the northern Nordic countries
and nitrogen. High sulfate lakes were found in the active
and are scattered throughout the region as a whole.
geological zones. Owing to the basic conditions of Icelandic
Sulfate is considered to be the major acidifier of surface
lakes, they are not sensitive to acidification.
waters. High sulfate concentrations were most common in
Owing to the high critical loads and the low sulfur
the western part of the Kola Peninsula, particularly around
deposition in Iceland, critical loads were not exceeded in
the smelters in Nikel and Monchegorsk. More than 10% of
any of the lakes studied. Hence, acidification of lakes is not
the lakes on the Kola Peninsula had >100 eq/L non-ma-
a problem in Iceland.
rine sulfate (SO4*). High concentrations were also found
scattered around the whole Euro-Arctic Barents region.
6.1.1.3. Svalbard and Bear Island
Most of these lakes probably had a significant input of
sulfate from geological sources, reflecting the diverse ge-
The sedimentary rocks at Svalbard and Bear Island have a
ology of the area. The eastern Kola Peninsula represented
diverse mineralogy that includes limestone, dolomite, gyp-
the largest area with consistently low (<20 eq/L) sulfate
sum/anhydrite and shales containing phosphatic nodules,
levels, reflecting the low sulfur deposition in this area.
and yields waters with highly variable ionic composition.
Nitrate concentrations in the lakes of the Euro-Arctic
The lakes were sampled in 1990 to 1992 (Lien et al., 1995;
Barents region were generally very low. More than 75%
SkjelkvÍle et al., 2001c). High sulfate lakes were related to
of lakes had <1 eq/L NO3. It was therefore concluded
gypsum/ anhydrite in the soils and bedrock. In the north-
that nitrogen deposition was an insignificant acidifier of
ern parts of Svalbard some lakes were very acid sensitive,
these lakes.
and in this area the critical loads were exceeded given the
pH values of <5.5 were most abundant in the north-
1990 sulfur deposition (Lien et al., 1995).
ern part of the Russian Kola (19% of lakes). Russian Kola
69
Chapter 6 ñ Effects on Freshwater Ecosystems
6.1.1.4. New critical loads and exceedance calculations
Estimated exceedance of CL for surface waters
Ac
for the Euro-Arctic Barents region
85
Critical load calculations are used for assessment and
1990
eq / ha / yr
policy work under the Convention on Long-range Trans-
< 20
80
20 - 50
boundary Air Pollution (LRTAP) and the European Union
50 - 100
and so are regularly updated (see section 5.4). This assess-
100 - 200
200 - 500
ment focuses on data for northern Europe submitted to the
> 500
Coordination Centre for Effects in 2004 (Hettelingh et al.,
75
2004) and new data for 104 lakes in the Kola region. The
data on individual lake catchments are aggregated to the
`EMEP 50x50 km grid', which is used under the LRTAP
70
Convention for deposition and exceedance calculations.
Figure 6.2 shows the 5 percentile of the critical load of
acidity on this grid system. Also shown are the critical
loads for surface waters in Svalbard, which were computed
65
and documented by Lien et al. (1995).
Exceedance of critical loads was calculated by combin-
ing the critical load maps with modeled deposition data,
60
-5
using the hemispheric Eulerian model DEHM (see section
45
3.7.4). Three emission/deposition scenarios were used in
5
35
15
25
the calculations (see section 2.3): (i) 1990 emissions, (ii) the
`Current Legislation' scenario for 2010 (CLE 2010), and (iii)
85
the `Maximum technically Feasible Reduction' scenario for
2020 (MFR 2020). The same scenarios were used for calcu-
CLE 2010
(Current Legislation)
lating critical load exceedance for soils (see section 5.4).
80
Estimated exceedance of critical loads for the surface
waters in northern Europe are shown in Figure 6.3 for the
three emissions scenarios. The results indicate that imple-
mentation of presently agreed emissions reductions will
75
reduce both the area and magnitude of exceedance sub-
stantially. However, the results also show that there is still
clear exceedance of critical loads for surface waters in parts
70
of the Kola region even after implementation of maximum
technically feasible emissions reductions.
65
60
-5
45
5
35
15
25
CL for surface waters
Ac
85
85
eq / ha / yr
< 200
MFR 2020
(Maximum technically
200 - 500
500 - 800
80
Feasible Reduction)
80
800 - 1000
1000 - 1500
> 1500
75
75
70
70
65
65
60
60
-5
-5
45
45
5
5
35
35
15
25
15
25
Figure 6.3. Estimated exceedance of critical loads of acidity for surface
waters in northern Europe for three scenarios: 1990 emissions, Current
Figure 6.2. Critical loads of acidity for surface waters in northern
Legislation for 2010 (CLE 2010), Maximum technically Feasible Reduc-
Europe.
tions for 2020 (MFR 2020).
70
AMAP Assessment 2006: Acidifying Pollutants, Arctic Haze, and Acidification in the Arctic
6.1.1.5. Current status in Arctic Canada
of <6. Furthermore, only three of 605 lakes were strongly
acidic, having a pH of <5. Two of the three strongly acid-
The area north of 60¤ N in Canada (the southern bound-
ic lakes are on Axel Heiberg Island (pH 3.6 and 3.8) and
ary of the AMAP domain) contains three politically de-
both had extremely high SO4 concentrations (Michelutti et
fined territories: Nunavut, the Northwest Territories and
al., 2002a). Schiff et al. (1991) used isotopic techniques to
the Yukon, plus the northernmost part of the province of
identify the source of the acid in the most acidic of these
Quebec. The area (more than 4 million km2) comprises
lakes (Colour Lake). They showed that oxidation of py-
eight terrestrial ecozones spanning the boreal, taiga, arctic,
rite in the surrounding basin and oxidation of ferrous iron
and cordillera types that encompass the full spectrum of
from an anoxic zone of the lake following spring ice-off
geological sensitivity to acidification. The largest expanses
and water column overturn caused the observed low pH
of acid-sensitive terrain (defined by a combination of bed-
and high SO4 concentrations. It is not clear whether the
rock and surficial geology) occur on Baffin Island and the
arctic setting of these lakes is an important determinant
continental mainland west of Hudson Bay. Most of the
in this acidification process. Certainly, lakes and rivers in
islands of the Arctic Archipelago have carbonate geology
temperate climates that are affected by acid mine drain-
and so are not acid-insensitive.
age become acidic through similar processes. In natural
Owing to the low solubility of the soils and bedrock
temperate settings, however, acid generation by sulfide
characteristic of acid-sensitive terrain, associated surface
mineral oxidation tends to be self-limiting because the iron
waters are typically low in dissolved minerals and so the
oxide weathering product coats the mineral surface render-
concentration of base cations indicates aquatic sensitivity.
ing it less reactive. The occurrence of a naturally extremely
Fifteen percent of lakes investigated had base cation levels
acidic lake such as Colour Lake (and probably the other
of <100 eq/L, 20% of 100 to 400 eq/L, and 65% of >400
Axel Heiberg lake) is quite rare. Given the widespread
eq/L. The only extremely acid-sensitive lakes occur on
occurrence of sulfide and to a lesser extent sulfate miner-
Baffin Island and the central mainland straddling the bor-
als, it seems reasonable to assume that some and perhaps
der of Nunavut and the Northwest Territories. It should
even many lakes have been affected by acid-generating
be noted, however, that the sample population excluded a
oxidation processes. The best evidence of this is probably
large proportion of the acid-sensitive terrain.
the SO4 data rather than the pH data. The third extremely
Sulfur dioxide has long been acknowledged as the main
acidic lake in the Canadian sample population was on Baf-
air pollutant acidifying Canadian lakes (Jeffries, 1995, 1997)
fin Island (pH 4.66), but there are no SO4 data to confirm
and is ultimately deposited on aquatic and terrestrial land-
oxidation of local sulfide minerals as the acid source.
scapes as SO4. Sulfate deposition in the Canadian Arctic is
A unique ecosystem acidification occurs at the Smoking
very low (~3 meq/m2/yr) so if atmospheric deposition is
Hills along the sea shore of Cape Bathurst in the Northwest
the main source of SO4 in lakes, then lake concentrations
Territories (70¤14' N, 127¤10' W; Havas and Hutchinson,
should also be uniformly low. Figure 6.1 shows that lake
1983). Bituminous shales appear to have been burning for
SO4 concentrations in Canadian arctic lakes are in fact spa-
thousands of years thereby producing ground-level acidic
tially variable indicating the presence of geological sources
fumigations that strongly influence the local tundra. Ponds
in some areas, particularly Axel Heiberg Island.
in the area (not included in the data compilation described
Dissolved organic carbon levels in artic lakes exhibit a
above) typically have pH levels of >8, but those within the
broad range in concentration (Table 6.1). Approximately
fumigation zone have been acidified, sometimes to a pH
25% of lakes in Arctic Canada had substantial levels of
of <2. The ponds exhibit elevated metal concentrations
DOC (>10 mg/L), which may contribute to some acidifica-
(aluminum, iron, zinc, nickel, manganese, and cadmium)
tion by naturally occurring organic acids.
and biota that are characteristic of acidic environments
Lakes having alkalinity concentrations of <200 eq/L
elsewhere. Biota in adjacent non-acidified ponds are typical
have traditionally been considered sensitive to acidic depo-
of other arctic environments.
sition and 26% of the samples fell into this category. The
spatial distribution of low alkalinity lakes tends to confirm
6.1.1.7. Alaska
the sensitivity interpretation using base cations. Unfortu-
nately, there are no alkalinity data for Baffin Island lakes.
There are very few lake or stream chemistry data available
Of the lakes sampled, 251 had sufficient data to per-
from acid-sensitive parts of the Alaskan arctic. The Kenai
mit a calculation of critical loads for acidity (CLAc) using
Lakes Investigation Project (Newell and Mitch, 1992; Eil-
the Steady-State Water Chemistry Model (Henriksen and
ers et al., 1993) characterized the major ion chemistry of
Posch, 2001) with an acid neutralizing capacity threshold
over 800 lakes on the Kenai Peninsula from a statistical
value (ANClimit) of 40 eq/L. The median CLAc was 127
survey of 59 lakes in 1988. The results showed two groups
meq/m2/yr and 8% of lakes had values of 10 meq/m2/yr.
of lakes: those with an alkalinity of <300 eq/L (78% of
The spatial distribution of three CLAc classes confirmed
lakes) and those with an alkalinity of >700 eq/L. Low-
that the sample lakes mostly likely to acidify occur on Baf-
alkalinity lakes had significantly lower concentrations of
fin Island and the central mainland. Whether or not the
base cations and silica and significantly higher average
Steady-State Water Chemistry Model should be applied in
concentrations of DOC than high-alkalinity lakes. Despite
a desert environment (annual surface runoff for almost all
widespread acidic soils and bog vegetation, and resulting
lakes was estimated to be 150 mm or less) merits further
high DOC levels, none of the lakes sampled were acidic
consideration.
(minimum alkalinity 20 eq/L).
The Chemistry and Biology of Arctic Lakes (CABAL;
Allen-Gil et al., 1997) project sampled 22 lakes on the North
6.1.1.6. Naturally acidic lakes in Arctic Canada
Slope of Alaska in 1992 (D. Landers, U.S. Environmental
Most of the Canadian lakes fell within the pH range 6 to
Protection Agency, unpubl. data). The results showed only
9, which is assumed as the normal range for most natural,
two lakes with an alkalinity of <200 eq/L (minimum 156
mineral-bearing waters. Only 3% of sample lakes had a pH
eq/L); none were considered to be acidified.
71
Chapter 6 ñ Effects on Freshwater Ecosystems
6.1.1.8. Northern Russia, Siberia
(SO4*), non-marine base cations (Ca+Mg)*, alkalinity, ANC,
Lakes were sampled in three regions of Siberia, northern
and pH. The lakes were sub-divided into three groups
Russia, in 1993 to 1995 (Duff et al., 1998). The lakes were sit-
based on geographical location: (1) Lapland, Finland, (2)
uated in the Pechora River basin, in the Yenisey River basin
eastern Finnmark, Norway, (3) northern Norway and Swe-
on the Taymir Peninsula, and in the Lena River basin. Only
den (Figure 6.4). Trends for each lake and each variable
the lakes in the Taymir region were located in the same area
were analyzed using the non-parametric tests given by
as the large emissions source at Norilsk, but these were still
Hirsch et al. (1982). These are equivalent to a non-seasonal
around 200 km away. All the lakes (with the exception of
Mann-Kendall trend test and the Sen slope estimator (cf.
a few in the Pechora River basin) were small, dilute, and
Helsel and Hirsch 1995). Trend slopes for each region were
oligotrophic with a neutral to slightly alkaline pH. Forested
calculated using the same test, but in this case each lake
lakes near the mining center of Norilsk had higher concen-
was treated as a `season'. The results give the direction of
trations of the major ions and metals; sediments in these
the trend from the trend slope. The detected trends are
lakes also had elevated metal concentrations (Blais et al.,
monotonic, i.e., proceed in only one direction.
1999). However, all the sample lakes in this area had ANC
levels of >200 eq/L and so were well buffered towards
Non-marine sulfate
acidification. Some acidic lakes in the Pechora River basin
Most sites showed a significant decrease in sulfate be-
had very high levels of organic carbon or high sulfate con-
tween 1990 and 2004 (Figures 6.4 and 6.5, Tables 6.2 and
centrations, probably due to geological sources.
6.3). The exception was a single site in northern Sweden
(Abiskojaure) in which concentrations increased due to sul-
fur-containing minerals within the drainage basin. Lakes
6.1.2. Temporal trends
in eastern Finnmark near the emissions sources showed
the most pronounced decrease with a trend slope of -1.4
Temporal trends in water chemistry can be identified using
eq/L/yr (Table 6.3) based on concentration levels of 78
data from regular monitoring over many years or from a
eq/L in 1990 to 55 eq/L in 2004 (representing a 30% de-
series of repeated lake surveys. This assessment is based on
crease). Lakes in Finnish Lapland showed a trend slope of
both types of data but is limited to the Euro-Arctic Barents
about -1.0 eq/L/yr based on concentrations of 32 eq/L
region (i.e., the northern part of Finland, Norway, Sweden
to 18 eq/L (a 43% decrease). Lakes in southern and cen-
and the Kola Peninsula of Russia). Data for other areas are
tral Lapland are more affected by long-range transported
not available.
air pollutants from the south and so have benefited from
The Euro-Arctic Barents region is affected by long-
the decrease in total European sulfur emissions. Lakes in
range transboundary air pollution and by emissions from
northern parts of Norway and Sweden showed very slight
industrial centers on the Kola Peninsula. Although the
decreases with an overall trend slope of -0.4 eq/L/yr
pollution exhibits relatively large year-to-year variations,
(Table 6.3) based on concentrations of about 20 eq/L to
it has still been possible to identify a general decrease in
13 eq/L (a 30% decrease).
sulfur deposition and consistently low nitrogen deposition
(see section 3.3).
Non-marine base cations
Base cations showed very small changes in concentration
and the trends were both positive and negative (Figures
6.1.2.1. Lakes in Finland, Norway, and Sweden
6.4 and 6.5, Table 6.3). Of the 60 lakes in this assessment,
Acidification has been monitored in Finnish lakes since
25% had slightly significant increasing trends while 12%
1990. In northern Finland, there are estimated to be around
had significant decreasing trends. Trends for two of the
2100 small (4-100 hectare) headwater or seepage lakes sus-
three regions showed significant increases with average
ceptible to acidification (Forsius et al., 2003). A subset of
trend slopes of +0.5 eq/L/yr for northern Norway and
35 small forest or mountain lakes has been monitored an-
Sweden and +0.8 eq/L/yr for Lapland. The increase in
nually in Finnish Lapland. In Norway, 24 lakes have been
the first group was strongly dependant on the increase in
monitored on an annual basis since the 1986 lake survey
a single lake (Lake Abiskojaure). Small changes and even
(Henriksen et al., 1988). The monitoring is focused on areas
increases in BC* concentrations compared to SO4* con-
of eastern Finnmark near the Russian border. The monitor-
ing network includes six lakes in the Jarfjord area and 11
lakes in the county of S½r-Varanger. In addition there are
Table 6.2. Decrease in sulfate concentrations (eq/L) between 1990
six lakes in the counties of Nordland and Troms (SFT, 2005).
and 2004 for the three sub-regions. Values are calculated from linear
In Sweden, eight `reference' lakes have been sampled three
regressions of average values.
to four times each year (Wilander, 1998).
SO4*, eq/L
Change
The data from these 60 lakes for 1990 to 2004 were com-
1990
2004
(%)
piled to assess surface water trends in non-marine sulfate
Lapland, Finland
32
18
-43
Eastern Finnmark, Norway
78
55
-30
Northern Norway and Sweden
20
13
-30
Table 6.3. Regional trends for 1990 to 2004. Values are median slopes with significant results (p<0.05) in bold. Units are eq/L/yr.
Alkalinity
ANC
BC*
H+
SO4*
Theil
Theil
Theil
Theil
Theil
n
p
slope
p
slope
p
slope
p
slope
p
slope
Lapland, Finland
35
0.002
1.0
0.04
-0.3
0.006
0.8
0.2
0.00
0.0003
-1.0
Eastern Finnmark, Norway
17
0.004
0.3
0.0003
1.9
0.05
-0.4
0.0004
-0.04
0.0001
-1.4
Northern Norway and Sweden
8
0.007
0.9
0.001
1.6
0.007
0.5
0.002
-0.01
0.001
-0.4
72
AMAP Assessment 2006: Acidifying Pollutants, Arctic Haze, and Acidification in the Arctic
Non-marine sulfate (SO *)
4
no trend
significant decrease
significant increase
2
3
1
1 Lapland, Finland
2 Eastern Finnmark, Norway
3 Northern Norway and Sweden
Non-marine base cations (BC*)
ANC
no trend
no trend
significant decrease
significant decrease
significant increase
significant increase
pH
Alkalinity
no trend
no trend
significant decrease
significant decrease
significant increase
significant increase
Figure 6.4. Trends in non-marine sulfate, non-marine base cations (Ca+Mg), alkalinity, acid neutralizing capacity, and pH across the Euro-Arctic
Barents region for 1990 to 2004. Large circles denote the three sub-regions.
73
Chapter 6 ñ Effects on Freshwater Ecosystems
çeq/L
Non-marine sulfate (SO *)
pH
4
100
6.5
80
6.0
60
40
5.5
20
0
5.0
çeq/L
ANC
çeq/L
Alkalinity
80
50
60
40
40
30
20
20
0
10
Lapland, Finland
-20
0
Eastern Finnmark,
Norway
Northern Norway
çeq/L
Non-marine base cations (BC*)
çg/L
Labile Al
and Sweden
80
40
60
30
40
20
Figure 6.5. Trends in non-ma-
20
10
rine sulfate, non-marine base
cations, alkalinity, acid neu-
tralizing capacity, pH, and
0
0
labile aluminum for lakes in
1990
1995
2000
2005
1990
1995
2000
2005
the three sub-regions.
centrations enabled alkalinity to increase (see Figures 6.4
Aluminum
and 6.5). The median annual change in alkalinity ranged
There are few data on aluminum. In Finland, when sample
from +0.3 to +1.0 eq/L/yr for the three regions (Table
pH was >6.2, the laboratories did not analyze aluminum.
6.3). The signs of chemical recovery are not reflected in
Moreover, at many sites inorganic bound aluminum was
the same way in calculated ANC (Figures 6.4 and 6.5).
below the detection limit (<10 g/L). The 1995 lake survey
For Lapland, the median annual change in ANC was a
showed that a median value for lakes in northern Finland
decrease of -0.3 eq/L/yr (Table 6.3). The small lakes in
was <10 g/L (with a 90 percentile of 10 g/L), and the
northern Finland are low ionic, dilute lakes (with BC*
median in northern Norway was also <10 g/L (90 percen-
typically <100 eq/L) that have had only modest impacts
tile of 13 g/L). Lakes in eastern Finnmark show a clear
from air pollutants. Therefore, a high interannual varia-
decrease from around 20 to 30 g/L in the early 1990s to
tion in ion concentrations in these lakes reflects hydro-
10 g/L in 2004 (Figure 6.5).
logical variations.
Alkalinity and pH
6.1.2.2. Lakes on the Kola Peninsula
Increases in alkalinity are at an early stage and not really
A lake survey has been conducted every five years on the
reflected in the pH values. In 37% of lakes, pH showed a
Kola Peninsula (1990, 1995, 1998, 2000, 2005). Six lakes with
significant increase (Figures 6.4 and 6.5, Table 6.3 (calcu-
different atmospheric loads were chosen to illustrate long-
lated as decrease in concentration of H+)). This increase
term changes. Two are near (10 km) the large point sources
was most pronounced in eastern Finnmark. There is a large
at Nikel and Monchegorsk while the other four are over 80
interannual variation in pH in lakes in eastern Lapland,
km away (Figure 6.6).
due to variations in hydrology and natural organic acids.
Water quality in the two lakes near the point sources
So a consistent and corresponding increase in pH cannot
had improved, with decreased concentrations of sulfate
be expected. There is also pronounced seasonal variation,
(Figure 6.6), nickel, and copper. Base cation levels have also
with the highest values in late summer and the lowest at
decreased at these sites. As the concentrations of sulfate,
the end of winter or at snowmelt.
nickel and copper also decreased in the four lakes located
74
AMAP Assessment 2006: Acidifying Pollutants, Arctic Haze, and Acidification in the Arctic
eq/L
eral times each year also had decreasing trends for alka-
250
Non-marine sulfate (SO *)
linity, but in all seven the ANC increased (median 0.0015
4
meq/L/yr). A comparison of these two studies shows that
200
Close sites (< 10 km, n=2)
changes observed on just a few occasions may be more in-
Distant sites (> 80 km, n=4)
dicative of variation between years than a trend. Trends, as
150
evident from more intense monitoring, are very small and
so surveys with few observations over time may be insuf-
100
ficient to identify the trends found using more intensive
studies (Wilander, 1998).
50
0
6.1.2.4. Concluding comments on trends
7.0
Long-term monitoring indicates that lakes in the Euro-Arc-
pH
tic Barents region are recovering from acidification and that
this is due to reduced sulfur deposition. However, even
6.5
if the lakes have received acidic inputs and have conse-
quently experienced a decrease in ANC, alkalinity, and pH,
6.0
the lake water has not necessarily been acidified to a level
at which visible damage to the biota can be expected. Lakes
5.5
in eastern Finnmark near the non-ferrous metal smelters on
the Kola Peninsula show the clearest signs of recovery due
5.0
to reduced sulfur deposition. Other studies from the Finn-
ish-Norwegian-Russian border area also show signs that
eq/L
lakes there are recovering from acidification. Surveys of
250
Non-marine base cations (BC*)
small mountain lakes and brooks in northeastern Lapland
200
in 1993 and 2000 found a significant increase in alkalinity
and a decrease in sulfate concentrations. The increase in
150
alkalinity was pronounced in the most acidic lakes (i.e.,
those with an alkalinity of <20 eq/L) in 1993 (Lappalainen
100
et al., 1995; Tammi et al., 2003b). The recovery of lakes fur-
ther from these major pollution sources (that experienced
50
only modest impacts from air pollutants) are affected by
a high interannual variation in ion concentrations and so
0
trends are not easily detected. Although the changes seen
eq/L
in Swedish surface waters are thus less pronounced than
150
in northern Norway, they are still significant evidence of
Alkalinity
improvement in the Barents region.
100
6.2. Effects of acidification on arctic biota
50
The first AMAP assessment (AMAP, 1998) reviewed data
on the effects of acidification on the freshwater biota of arc-
0
tic surface waters. One of the key conclusions of the assess-
1990
1995
2000
2005
ment was that arctic biota live in an extreme environment
Ù the limited temperature range, ice-free season, and pro-
Figure 6.6. Trends in non-marine sulfate, alkalinity, non-marine base
cations, and pH for lakes on the Kola Peninsula.
ductivity of the Arctic produce biotic assemblages that may
require very little additional stress before they are affected.
The assessment also described those characteristics of arctic
some distance from Nikel and Monchegorsk it appears
biota that make them especially sensitive to acidification.
likely that these decreases represent a decrease in regional
The assessment concluded that, while the taxa found in
sulfate and metal loads in the Kola North. There was no
arctic waters are also likely to occur in sub-artic (and even
tendency for pH or alkalinity to increase despite the large
temperate) waters, the number of different taxa in any one
decrease in sulfate.
arctic lake or stream is relatively low Ù low taxa richness
and low productivity create the potential for small changes
in biotic assemblages to have relatively large ecosystem
6.1.2.3. Swedish repeated lake survey
effects (Hobbie, 1984). Within the Arctic, the likelihood of
In each of the Swedish lake surveys (1990, 1995 and 2000)
low productivity and paucity of species increases with lati-
315 lakes were sampled in Norrbotten county. An evalu-
tude. The assessment found that crustacean zooplankton
ation using Theil's slope showed that SO4 concentrations
may be absent from ultra-oligotrophic arctic lakes due to
fell in 96% of lakes, which supports the results of other
lack of food and that benthic invertebrate assemblages are
studies presented here. Alkalinity and ANC decreased in
generally dominated by chironomid larvae in lakes, and
91 and 69% of lakes, respectively. So this study shows no
in flowing waters by the same sensitive insect taxa (e.g.,
anticipated response of the lakes to the decreased sulfur
mayflies) that dominate in northern temperate areas. The
deposition. Seven Norrbotten reference lakes studied sev-
assessment also found that there are a small number of fish
75
Chapter 6 ñ Effects on Freshwater Ecosystems
species in most arctic waters Ù fish life spans may be very
Lakes in northeastern and northwestern Finnish La-
long (e.g., 25 to 40 years for Arctic char) due to slow growth
pland have been studied for their contemporary phyto-
and the slow accumulation of sufficient energy reserves for
plankton fauna as a part of the European-wide project
reproduction. Thus, arctic fauna is considered sensitive or
EMERGE (European mountain lake ecosystems: regio-
vulnerable to anthropogenic alterations, including acidifi-
nalization, diagnostics & socio-economic evaluation). One
cation (Hammar, 1989), principally because arctic assem-
purpose of the project was to set the baseline of the ecologi-
blages occupy simple and labile ecosystems that undergo
cal conditions of pristine mountain/arctic lakes in Europe
extreme climatic conditions and fluctuations.
for future monitoring. Even though the lakes do not appear
Although there are relatively few (compared to temper-
to be anthropogenically acidified, variations in the species
ate zones) published studies on arctic biota and acidifica-
composition of phytoplankton indicate different responses
tion, research and monitoring prior to 1996 supports the
and sensitivities to pH.
characterization of arctic biota as susceptible to acidifica-
Phytoplankton were studied from 33 lakes in north-
tion (AMAP, 1998). The few documented effects include
ern Finland as part of EMERGE. All the lakes had low
sensitive zooplankton (e.g., some species of Daphnia) being
biomass and low species numbers and are classified as
rare or absent from acidified lakes in the Jarfjord area of
oligotrophic or ultraoligotrophic from their chlorophyll
Norway (N½st et al., 1992); there are no other reports of
a concentrations and phytoplankton biomass (Vollenwei-
acidification effects on plankton in the Arctic. Also in the
der and Kerekes, 1982). Most lakes were dominated by
Jarfjord area, N½st et al. (1992) reported low abundance of
chrysophytes, which are characteristic of oligotrophic lakes
acid-sensitive mayflies (Ephemeroptera) in acidified lakes;
with cool summer water temperatures, low alkalinity and
in the Dalelva catchment (Norway) the loss of sensitive
conductivity, and neutral or slightly acid pH (Sandgren,
benthic invertebrate taxa was attributed to low pH and
1988). Several lakes showed a pronounced dominance pat-
elevated aluminum concentrations (BÌkken and Aanes,
tern, where only a few phytoplankton taxa contributed
1990). In the Murmansk region of Russia, the abundance
up to 80% of total phytoplankton biomass. This pattern
of zoobenthos in small acidified lakes was as low as that
is considered to be a consequence of stress, such as harsh
in lakes contaminated by heavy metals (Yakovlev, 1992). In
climate (WillÕn, 2003). In the EMERGE study this pattern
northeastern Finland, no acidification effects were reported
seemed to be more common in lakes with some additional
for the benthos, with sensitive taxa (e.g., Baetis rhodani, B.
stress (other than climate), such as high altitude or low pH.
lapponicus) found throughout the area. Many researchers
Although the studied lakes are widely distributed across
concluded that fish populations in the Arctic were rela-
Finnish Lapland, representing different environmental, al-
tively unaffected by acidification (e.g., Erkinaro et al., 1992;
titudinal, and geomorphological settings, site-specific lake
Lappalainen et al., 1995; N½st et al., 1992); deleterious effects
chemical properties (e.g., pH, conductivity, calcium, mag-
of acidification on fish may only be found in the Jarfjord
nesium, sodium, alkalinity) seem to be the best predictors
area of Norway (Hesthagen et al., 1992).
of species composition.
6.2.1.2. Macroinvertebrates
6.2.1. Current status
Data on benthic invertebrates from lakes and streams sug-
More recent data support the conclusions of the first AMAP
gest that, while demonstrable acidification effects are rare,
assessment (AMAP, 1998), namely that acidification effects
sensitive taxa are common in the Arctic, and the potential
are rare. These data are all for the areas immediately ad-
for subtle (or future) effects is high.
jacent to the Kola Peninsula Ù there continues to be no
Nearly 400 small lakes and their inlet/outlet streams
biological data for any acid-sensitive areas of the North
have been studied in northeastern Fennoscandia (Finnish
American Arctic.
Lapland, northern Norway, and the Murmansk region).
Data collected between 1990 and 1997 suggest that both
anthropogenic (mineral) and natural (organic) acidification
6.2.1.1. Phytoplankton and periphyton
have effects on the structure of benthic assemblages (Yako-
Planktonic and epilithic diatoms are considered some of
vlev, 1999). These effects (e.g., declines in species diversity,
the best biotic indicators of acidification; the disappear-
relative abundance and biomass in acid-sensitive inverte-
ance of acid-sensitive diatom species, and the dominance
brates such as Gammarus, as well as snails, mayflies, and
of acid-tolerant species, has long been used to quantify
stoneflies) also vary strongly with natural abiotic factors of
the long-term progression of acidification (see section 6.4).
the landscape, including lake size, hydrological type, and
The current species composition of diatoms and chryso-
morphology. Impoverished benthic fauna, typical of acidi-
phytes can also be used to assess whether acidification
fied lakes, was found in roughly 25% of the acid and/or hu-
has altered the current status of lakes and streams. There
mic lakes in central and northern Lapland, and attributed
is currently no evidence of altered diatom assemblages
to decreased pH and the toxic effects of elevated aluminum
due to acidification in the Arctic. Sorvari et al. (2002), for
(Yakovlev, 1999). Yakovlev (2000) also reported increased
example, examined sediment cores from five lakes in Finn-
dominance of the benthos by predators, and a decrease in
ish Lapland and concluded that, although diatom assem-
primary consumers, with decreasing pH in Fennoscandia.
blages have changed over the past two centuries, there
Both Yakovlev (1999) and Erkinaro et al. (2001) reported
was no evidence of changing diatom-inferred lake water
no observable acidification effects on macroinvertebrate
pH. Similarly, Korhola et al. (1999) reported stable diatom
assemblages in northernmost Finland.
assemblages from three lakes in northeastern Finnish Lap-
Benthic assemblages may also be strongly affected by
land, and concluded from their pH reconstructions that `no
acidic episodes in the Arctic. Hðmðlðinen and Huttunen
substantial changes in the acidification status of lakes have
(1998) used a set of 17 test streams in northeastern Finland
occurred within the last century despite the very high local
to construct a weighted averaging (WA) model predicting
acidic deposition' (see also section 6.4).
minimum pH from invertebrate assemblage data, and then
76
AMAP Assessment 2006: Acidifying Pollutants, Arctic Haze, and Acidification in the Arctic
applied the WA model to an additional 37 streams in the
number of small headwater lakes and brooks, which are
region. They found that the predicted pH values correlated
sensitive to acidification due to the geochemistry of the
most closely with the minimum pH values observed dur-
local soil (Kðhk—nen, 1996). Owing to the relatively large
ing spring snowmelt. They also found a strong correlation
differences in altitude over a short distance, natural ob-
with longitude, suggesting stronger effects (and lower
stacles to migration are common and fish populations in
minimum pH values) near the Kola region.
many lakes and brooks are isolated from each other. In
Midge larvae (chironomids; Diptera: Chironomidae)
some of the small lakes in the Vðtsðri area, the alkalinity
have been sampled extensively in the EMERGE lakes in
values were critically low in 1993, and studies revealed
Finnish Lapland. The composition of benthic littoral chi-
the first signs of acid-induced fish population damage
ronomid assemblages in this region appears to be strongly
in Finnish Lapland in local minnow (Phoxinus phoxinus)
influenced by pH, but the assemblages do not exhibit signs
populations. In continuing this research and monitoring,
of acidification. Nyman et al. (2005) found that the varia-
special attention has been focused on the minnow and its
tion in chironomid communities of 50 shallow lakes across
reproduction because of the sensitivity of the species to
western Finnish Lapland was explained by the factors that
acidification and its frequent occurrence in the study area
are likely to respond to future climate change (e.g., sedi-
(see section 6.2.2.2).
ment organic content, total organic carbon, pH, and mean
July air temperature). These subarctic lakes are not anthro-
pogenically acidified, but are highly vulnerable to multiple
6.2.2. Temporal trends
stresses caused by climate change and ultraviolet radiation
6.2.2.1. Invertebrates
(ACIA, 2004; Rautio and Korhola, 2002) (see section 6.5).
Temporal trend data are available for 12 arctic lakes in Nor-
way (included in the Norwegian national monitoring pro-
6.2.1.3. Fish
gram on long-range transported air pollution (SFT, 2005)).
Recent data from acid-sensitive regions of the Arctic sug-
The microcrustacean assemblages of six lakes situated in
gest little evidence of widespread effects on fish assem-
Nordland and Troms counties were surveyed in 1999, and
blages, but significant effects in some highly affected areas.
the data indicate no or only minor impacts of acidification.
Hesthagen et al. (1998) analyzed questionnaire data from
One of these lakes has been followed with annual sampling
401 lakes (236 with Arctic char, 293 with brown trout) in
and shows no signs of changing acidification status. Six
northern Norway near the Russian border. They concluded
lakes in the eastern part of Finnmark (Varanger Penin-
that only three populations of Arctic char had been lost due
sula) were surveyed in 2000 and 2004 (additional data are
to acidification, while three populations of char and eight
available for 1990 to 1997 for most of the lakes); these data
of brown trout were reduced at least to some degree. This
indicate minor to moderate impacts of acidification in the
is consistent with the larger context of acidification (and
microcrustacean communities.
recovery) in the Nordic countries; results from the project
Lake Dalvatn is an acid-sensitive lake in Finnmark that
`Fish status of Nordic Lakes' indicate that `fish population
has been monitored for zooplankton since 1990. Signs of
losses were most frequent in the most highly acidified
improvement in the acidification status of Lake Dalvatn
region of southern Norway and least common in eastern
are given by the increased abundance of the acid-sensitive
Fennoscandia' (Rask et al., 2000; Tammi et al., 2003a). Simi-
cladoceran Daphnia longiremis (Figure 6.7). This species,
larly, a study of 13 rivers in northernmost Finland found
which is absent in acidified lakes (Keller et al., 2002), was
no signs of acid-induced failure in salmonid reproduction
first recorded in Lake Dalvatn in 1996, and has been found
and/or recruitment (Erkinaro et al., 2001). Importantly,
each year since 1999 with increasing dominance. The pres-
many studies of fish in acid-sensitive regions of the Arctic
ence of other acid-sensitive species of microcrustaceans has
have focused on salmonids (e.g., Arctic char, brown trout)
also increased in the last six years.
which may be relatively tolerant of low pH and elevated
aluminum (PolÕo and Bjerkely, 2000).
6.2.2.2. Fish
In a fish and water chemistry survey carried out in
northeastern Finnish Lapland in 1991-1993, Lappalainen
Tammi et al. (2003b) reported on fish data collected as part
et al. (1995) found that the buffering capacities of small
of a re-sampling of 20 lake and stream sites in the Vðtsðri
lakes and brooks were lowest in the Vðtsðri area. The sur-
area of northeastern Finland in 2000; these were the same
face waters of the area consist of an exceptionally high
sites as were sampled in 1993 by Lappalainen et al. (1995),
% of zooplankton
Daphnia longiremis in the lake Dalvatn
30
25
20
15
10
5
Figure 6.7. Presence of the acid-
sensitive cladoceran Daphnia lon-
0
giremis in Lake Dalvatn (Varanger
1990
1992
1994
1996
1998
2000
2002
2004
Peninsula, Norway) (SFT, 2005).
77
Chapter 6 ñ Effects on Freshwater Ecosystems
who found evidence of acidification in the age-structure of
quality, sparse minnow populations at some of the study
minnow populations. Comparisons of the 1993 and 2000
sites appear to have disappeared completely during the
data are shown for four sites in Figure 6.8. In all brooks
1990s. At these sites, the catch for 1993 consisted of only a
and lakes, the alkalinity values were significantly higher,
few, rather large (60Ù80 mm) individuals and no minnows
and the sulfate concentrations and conductivity values
were found at all by electrofishing in 2000.
significantly lower, in 2000 than in 1993. The increased
Lake Otervatn in eastern Finnmark has been moni-
densities of minnow, and changes in the length distribu-
tored for water chemistry and brown trout populations
tion of the sampled fish, indicate reproductive success and
(using benthic gill nets) since 1986 (Figure 6.9). The lake has
recruitment of young fish at most sampling sites in the late
shown a dramatic recovery in both acid/base status and
1990s. Although fish samples were taken in single years,
brown trout populations over the last 20 years. Brown trout
the catches of electrofishing included several age-classes
catch per unit effort shows a significant increase over time,
Ù the combined data on abundance and length distribution
and is significantly correlated with the observed increase in
provided convincing evidence of the reproductive success
alkalinity. These data are strongly suggestive of recovery
of fish in the late 1990s. Despite the improvement in water
from acidification.
% Joulujðrvi 6
Alkalinity, eq/L
100
70
1993, n=9
a
2000, n=115
80
60
60
50
40
20
40
0
30
Joulujðrvi 7
100
1993, n=0
20
2000, n=19
80
10
60
40
0
Brown trout (catch per unit effort)
20
35
b
0
30
áðlisjðrvi 16
100
1993, n=6
25
2000, n=14
80
20
60
15
40
10
20
0
5
áðlisjðrvi 20
0
100
1993, n=9
2000, n=22
80
1986
1988
1990
1992
1994
1996
1998
2000
2002
2004
2006
60
Brown trout (catch per unit effort)
40
40
c
20
35
0
1
2
3
4
5
6
7
8
9
10
30
Length of minnows (cm)
Barents
25
Sea
20
Kirkenes
15
N O R W A Y
10
F I N L A N D
áðlisjðrvi
5
Joulujðrvi
0
R U S S I A
10
20
30
40
50
60
70
Alkalinity, eq/L
Figure 6.8. Length distributions of minnows caught by electrofishing
Figure 6.9. Data for Lake Otervatn in eastern Finnmark, showing (a)
in the Joulujðrvi area (sites 6 and 7), and in the áðlisjðrvi area (sites 16
alkalinity (eq/L) and (b) brown trout catch per unit effort (CPUE, ex-
and 20) in 1993 and 2000 (re-drawn from Tammi et al., 2003b).
pressed in number of fish caught per 100 m2 of gill net area) since 1986,
and (c) brown trout populations in relation to changes in alkalinity.
78
AMAP Assessment 2006: Acidifying Pollutants, Arctic Haze, and Acidification in the Arctic
6.3. Episodic acidification
fries, 1997). In arctic regions, an abrupt drop in water pH
in a short flood period is accompanied by a pulse of metals,
Episodic acidification of surface streams during spring
especially in their ionic forms, and it is this that generates
floods is a ubiquitous phenomenon all over the world,
the greatest hazard for aquatic organisms. The leaching of
including arctic regions. Acid episodes are especially dan-
metals during flood (2Ù3 weeks) can account for up to 75%
gerous in the Arctic; contaminants deposited from the at-
of their total annual load (Moiseenko, 1999; Moiseenko et
mosphere accumulate in the snowpack during the long
al., 2001). Data on streams of the Kola North showed that in
polar winter and are released rapidly into drainage basins
the periods of pH depression during floods, the total metal
during the short spring flood in acidified polluted snow-
concentration increases in all types of creek, notwithstand-
melt waters that cause a sharp decrease in pH and alkalin-
ing dilution by snowmelt water. The total concentration of
ity. Simultaneous pulses of protons and metals may lead to
aluminum in water increased by 50Ù88%. In the most acidi-
episodes with extremely strong toxic effects in streams and
fied tundra stream studied, an increase in the concentration
rivers. pH in rivers often drops during spring or rain floods
of its labile form was accompanied by a drop in the form
under natural conditions because of base-flow dilution
bound with organic complexes.
by atmospheric precipitation, although in some cases this
phenomenon can be due to the leaching of natural organic
acids from soils in forested or wetland catchments (Laudon
6.3.2. Acidic episodes in the Dalelva catchment
and Bishop, 1999). However, this natural pH decline can
in eastern Finnmark, Norway
also be dramatic and may affect biota. The accumulation
of anthropogenic acids (SO4, NO3) in catchments abruptly
Dalelva is a small (3.2 km2) undisturbed catchment domi-
intensifies the episodic acidification in flood periods. Arctic
nated by heathland and mountains, in Jarfjord in eastern
ecosystems are especially vulnerable to acid pulses during
Finnmark, Norway (69¤45' N, 30¤23' E). Vegetation com-
spring floods. After polar night, the vulnerability of arctic
prises birch forest to an elevation of about 150 m with heath
biota to acid and toxic impacts is much higher. Situations in
and moorland above. Small lakes cover about 15% of the
which two or more stressors occur simultaneously, thereby
catchment. The catchment is usually covered with snow
multiplying the risk for aquatic life, are dealt with in more
for six to seven months of the year, approximately from
detail in section 6.5. Episodic pH decline has been observed
mid-October to late May, and receives relatively little pre-
in several arctic regions, for example, Sweden, Finland,
cipitation (500Ù600 mm/yr). At the adjacent meteorological
and Russia (Kinnunen, 1992; Moiseenko, 1999; Laudon et
station (Lanabukt) about 45% of the annual precipitation
al., 2000; Moiseenko et al., 2001).
was accumulated as snow during 1990 to 2000 (Kaste and
How pH episodes form depends on the conditions of
SkjelkvÍle, 2002). The extensive snow accumulation has a
water formation. Catchments in the Arctic are mostly of
large impact on the seasonal runoff pattern, which is char-
the tundra or forest type, although hilly and mountainous
acterized by very low flow during winter and a distinct
catchments also occur. The mechanism of pH depression
snowmelt flood in May to June.
in surface waters is determined, as a rule, by the inter-
The large seasonal variations in streamwater flow also
action of several factors capable of causing acidification.
have big impacts on water chemistry (Kaste and SkjelkvÍle,
Published reports emphasize five factors that contribute
2002; SFT, 2005). During the long cold winters, when pre-
to depressed ANC during flood time: (1) dilution from
cipitation is accumulated as snow, the stream is dominat-
increased discharge; (2) H2SO4 and (3) HNO3 derived from
ed by baseflow with relatively high solute concentrations
precipitation or natural sources; (4) organic acids derived
from watershed soils or wetlands; and (5) HCl derived
from `salt-effect', i.e., reactions within catchment soils (e.g.,
Jeffrey et al., 1992).
3.5
R2 = 0.89
3.0
6.3.1. Acidic episodes in the Kola region
Acidic episodes have been studied in the Kola North, where
2.5
a high level of anthropogenic sulfur deposition has been re-
corded. The decrease in pH during spring flood relative to
2.0
the pre-episode period (i.e., the winter low-water period)
was examined in 21 streams (Moiseenko, 1999; Moiseenko
1.5
et al., 2001). The decrease was most noticeable in streams
where the pre-episode pH was high, while in streams that
1.0
were chronically acidified (with pH values during the low-
water period of <6) the pH drop was insignificant owing to
the similarity between the chemistry of water in acidified
0.5
R2 = 0.44
streams and atmospheric precipitation (Figure 6.10). This
is in general agreement with data collected in Europe and
0
North America (Wigington et al., 1992). The period of pH
5.5
6.0
6.5
7.0
7.5
depression during spring flood in this part of the Arctic is
short and rarely exceeds five to seven days.
Acidic episodes facilitate the discharge of metals into
Figure 6.10. Water pH depression during spring flood versus pH
streams and rivers. It is well known that water acidifica-
during the low-flow period in streams of the Kola North. The upper
line shows the relationship in streams where the minimum pH during
tion causes an increase in the concentrations of labile metal
high flow was <5, and the lower line where the minimum pH during
forms (Dillon et al., 1988; Nelson and Campbell, 1991; Jef-
high flow was >5.
79
Chapter 6 ñ Effects on Freshwater Ecosystems
(Figure 6.11). Concentrations of major ions and nitrogen
owing to industrial SO2 emission sources on the Russian
compounds (not shown) tend to build up during winter
side of the border. During 1990 to 2000, however, stream-
and then decrease rapidly to initial levels at the start of the
water concentrations of non-marine sulfate declined by
snowmelt flood. This dilution of base cations during snow-
35% as a result of reduced SO2 emissions (SFT, 2005). Da-
melt also causes a rapid decrease in streamwater pH, from
lelva is moderately affected by humic substances; average
the normal level of around 6.0 to 6.5, to values of around
concentrations of total organic carbon between 2001 and
5.5 (Figure 6.11). Sea-salts accumulated in the snowpack
2003 were in the range 3.7 to 4.4 mg C/L. The greatest in-
during winter are eluted from the snow in the early melting
fluence of total organic carbon is often associated with the
phase, resulting in an annual peak in chloride concentra-
onset of snowmelt. Streamwater concentrations of nitrate
tions immediately before the onset of the main snowmelt
are relatively low, with annual peaks up to 70 to 100 g N/
flood (Figure 6.11).
L prior to snowmelt, and growing season values typically
After snowmelt, streamwater flow and solute con-
below 5 g N/L.
centrations return rapidly to normal summer levels. The
Dalelva catchment usually experiences a short and intense
growing season that lasts approximately four months. Dur-
6.3.3. Acidic episodes in northern Sweden
ing summer, air temperatures can be relatively high and
owing to the relatively low precipitation amounts, stream-
A large, multi-investigator project in northern Sweden de-
water flow is usually very low at this time.
veloped the Boreal Dilution Model (BDM) to quantitatively
The overall water chemistry at Dalelva is characterized
distinguish the natural and anthropogenic mechanisms
by relatively high concentrations of non-marine sulfate
that drive episodic decline of ANC and pH during hy-
drological events (Bishop et al., 2000; Laudon et al., 2000).
The BDM identifies the anthropogenic component of epi-
sodic ANC decline (ANCpoll) from relative differences in
pH
Stream flow, m3/s
the runoff dynamics of base cations and anthropogenic
7.0
1.2
a
acid anions during episodes. Snow chemistry data are not
1.0
pH
used in the BDM. However, comparison of snow chemistry
6.5
with the results from over 50 applications of the BDM in
0.8
catchments from the alpine zone to the coast of northern
6.0
0.6
Sweden sampled between 1991 and 1999 revealed a strong
relationship between SO
0.4
4 in snow and the anthropogenic
5.5
impact on the subsequent spring flood. This suggests an
Stream flow
0.2
immediate and proportional response in spring flood acidi-
5.0
0
fication to changes in winter SO4 deposition. Nitrogen is
not a factor in the spring flood of this nitrogen-poor region
eq/L
(Laudon et al., 2000).
250
Trends in anthropogenically driven episodic acidifi-
Non-marine sulfate (SO *)
b
4
Non-marine base cations (BC*)
cation were analyzed in five streams from northernmost
200
Sweden between 1990 and 1999 using the BDM (Laudon
BC*
150
and Hemond, 2002). Although there was no significant
change in annual average stream water chemistry, the an-
100
thropogenically driven episodic acidification associated
with spring flood runoff decreased by 40 to 80%. A strong
SO *
50
4
correlation between winter SO4 deposition and the anthro-
pogenic component of episodic acidification in these five
0
streams suggests that future reductions of acid deposi-
tion will further improve the spring flood acidification
Cl, eq/L
Non-marine sodium (Na*), eq/L
situation in northern Sweden. These results also indicate
800
60
c
Na*
that reduced emissions of acid precursors have generated
40
significant improvements in the surface water chemistry
600
20
during episodes associated with spring runoff in northern
0
Sweden.
400
-20
While the data requirements of the BDM are too big for
-40
regional assessments, the correlation between snow SO4
Cl
200
-60
and ANCpoll, together with a relatively consistent amount
-80
of snowmelt in the peak of spring flood creates the basis
0
-100
for the more empirical `one point BDM' (pBDM, Laudon et
2001
2002
2003
2004
al., 2004). This model uses widely available lake chemistry
measurements, and can thus provide a more synoptic view
of how human impact on spring melt ANC in northern
Sweden has responded to changed SO4 deposition. This is
a region where many surface waters experience low ANC
Figure 6.11. Surface water run-
off from the Dalelva catchment,
and pH in conjunction with hydrological episodes despite
northeastern Norway, 2001Ù2003.
a relatively low annual acid deposition load. The largest
(a) streamwater flow and pH, (b)
episodic ANC declines and greatest biological effects in
non-marine concentrations of sul-
fate and base cations, and (c) chlo-
the region are associated with spring flood (Laudon et al.,
ride and non-marine sodium.
2000).
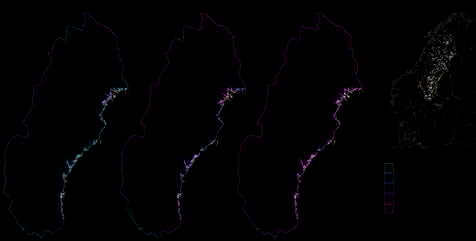
80
AMAP Assessment 2006: Acidifying Pollutants, Arctic Haze, and Acidification in the Arctic
1970
1990
2010
(projected)
Impact
extreme
very large
large
moderate
0
100
200 km
Figure 6.12. Intensity of anthropogenic episodic acidification in northern Sweden during the 1970 spring flood and the 1990 spring flood, and
projected for the 2010 spring flood. Assessed using the acidification index of the Swedish Environmental Protection Agency and the pBDM model
(Laudon and Bishop, 2002).
Sulfur deposition in northern Sweden peaked in 1970
Table 6.4. Extent of anthropogenic acidification in northern Sweden
(Mylona, 1996) and had declined by 65% by 1990 (S. My-
(Laudon and Bishop, 2002).
lona, Norwegian Pollution Control Authority, unpubl.
Percentage cover
data). A further 55% reduction relative to the 1990 level is
Acidification ANCp /
Acidification
expected by 2010 in accordance with the 1999 Gothenburg
class
ANCpi
index
1970 1990
2010
Protocol to the LRTAP Convention. Winter chemistry data
1
1.0 - 0.75
not significant impact
20
63
91
suitable for use in the pBDM was available for 1240 lakes
2
0.75 - 0.50
moderate impact
26
23
6
3
0.50 - 0.25
large impact
18
6
1
sampled in conjunction with national monitoring (Figure
4
0.25 - 0.10
very large impact
7
1
1
6.12). Application of the pBDM to these lakes using the
5
<0.10
extreme impact
29
7
1
1990 and 2010 data projects a clear recovery (Figure 6.12,
1-2
46
86
97
Table 6.4). In 1970, 54% of lakes in Sweden were subject to
3-5
54
14
3
significant human impact (classes 3Ù5, Table 6.4). By 1990,
ANCp: peak in ANC; ANCpi: pre-industrial peak in ANC
only 14% of the lake population was more than moderately
impacted by acid deposition during spring. By 2010 that
number is projected to be 3%. Reductions in acid deposi-
acidified, delays in deposition reduction translate directly
tion have led to rapid and substantial chemical recovery
into recovery delays. Important as these results are for
from spring flood acidification in arctic waters, including
northern Sweden where large investments are made each
70 000 lakes and 1 000 000 km of watercourses in northern
year to remediate acidification in spring flood by liming, it
Sweden (Laudon and Bishop, 2002). These results are based
is very likely that extensive regions in the boreal zones of
on the strong correlation between SO4 concentration in
North America, Europe and Asia may be similarly sensitive
snow and the anthropogenic component of spring flood
to changes in winter SO4 deposition.
ANC decline (Laudon et al., 2004). Laudon et al. (2004) esti-
mated that the 65% reduction in sulfur deposition between
1970 and 1990 reduced the area of acidified spring floods
6.3.4. Concluding comments on
across 250 000 km2 of northern Sweden by 75%.
episodic acidification
A large and rapid reduction in the anthropogenic in-
fluence on spring flood acidity does not mean that spring
In arctic regions, episodic acidification is a ubiquitous
ANC/pH decline disappears. A large spring flood ANC
natural phenomenon during spring flood that has been
decline (equivalent to ca. 50%) is a natural feature of aquat-
intensified by acidic deposition. It develops swiftly due to
ic ecosystems in northern Sweden. The relative increase
the pollutants accumulated in the snowpack over winter
in organic acids during spring flood also contributes to a
being released rapidly into drainage basins during snow
natural pH decline (Ivarsson and Jansson, 1995; Laudon
melt. The dominant factor in the acidification mechanism
et al., 1999).
is the type of stream catchment. Replacement of hydrocar-
The difficulties in assessing episodic acidification have
bonates by stronger acids and dilution are the most appar-
contributed to the focus of previous acidification recovery
ent and well-known factors and these affect acid episodes
assessments on changes in average lake conditions. The
in all streams. In forest and wetland streams, organic acids
failure to account for an episodic response may greatly
also contribute strongly to pH decline. In remote coastal
underestimate the immediate benefits of reducing acid
tundra areas, HCl is the dominating factor because of ion-
deposition. Furthermore, since spring flood responds di-
exchange processes in catchments (adsorption of marine
rectly to snow acidity in this region that is not chronically
aerosol Na+).
81
Chapter 6 ñ Effects on Freshwater Ecosystems
A general pattern in the behavior of metals induced
is possible to obtain a temporal perspective on the lake
by acidification is an increase in their concentration, re-
ecosystems with regard to acidification (Smol, 1992).
distribution toward the most toxic ionic form, and pulses
In the previous AMAP assessment (AMAP, 1998), pale-
of metals during the period of episodic acidification. An
olimnological assessments of acidification in arctic Canada
abrupt increase in the ionic form, which is the most toxic
and Alaska showed that the lakes had been unproductive
form for biological systems, together with low pH causes
throughout their entire existence and that long-term natu-
a toxic stress for water inhabitants. In polar regions, the
ral acidification was still occurring. However, anthropo-
maximum stress for biota occurs during spring flood pe-
genically-induced acidity was reported to have affected the
riods, when pH is at a minimum and the concentration of
present-day acid-sensitive plankton species, invertebrates,
ionic forms of metals is at a maximum.
and fish on the Kola Peninsula and in the neighboring areas
A model based assessment on data from five streams
of Finland and Norway (AMAP, 1998). Critical loads were
in northern Sweden indicated that reduced emissions of
reported to have been exceeded in large areas of northern
acid precursors have generated significant improvements
Finland and Norway due to the low critical load values in
in surface water chemistry during episodes associated with
these systems (the lakes in the region are characterized by a
spring runoff. Although there was no significant change in
low buffering capacity and are sensitive to acidification, see
the annual average stream water chemistry at these sites,
section 6.1) and the influence of emissions from industrial
the anthropogenically driven episodic acidification asso-
areas on the Kola Peninsula. At present, the diatom-based
ciated with spring flood runoff decreased by 40 to 80%
pH-reconstructions cover extensive areas of arctic Fenno-
between 1990 and 1999. A regional scale model applica-
scandia, the Kola Peninsula, Siberia (Norilsk), Svalbard,
tion indicated that the 65% reduction in sulfur deposition
and arctic Canada.
between 1970 and 1990 has reduced the area of acidified
spring floods across 250 000 km2 of northern Sweden by
75%. It is also likely that future reductions in acid depo-
6.4.1. Millennial trends in lake acidification
sition will further improve the spring flood acidification
6.4.1.1. Fennoscandia and the Kola Peninsula
situation in this region.
The difficulties of assessing episodic acidification have
Natural long-term acidification is a common feature of
contributed to many previous acidification recovery as-
lakes in cold environments with thin soils and acid bed-
sessments having focused on changes in average lake con-
rock in the catchment. Most of the available pH reconstruc-
ditions. The failure to account for an episodic response
tions are based on changes in the subfossil diatom flora,
may greatly underestimate the immediate benefits of re-
since diatoms are very responsive to changes in acidity
ducing acid deposition. Also, since spring flood responds
(e.g., Weckstr—m et al., 1997; Bigler and Hall, 2002). Seppð
directly to snow acidity in those northern regions that are
and Weckstr—m (1999) studied the acidification history of
not chronically acidified, delays in deposition reductions
Lake Tsuolbmajavri, located just above the present pine
translate directly into recovery delays.
treeline in northwestern Finnish Lapland. The current pH
of the lake is around 7.4. Diatom-inferred pH (hereafter
referred to as DI-pH) was observed to have decreased
slowly and gradually throughout the Holocene (i.e., the
6.4. Evidence from
last 10 000 years) (Figure 6.13). The periods of slightly more
paleolimnological studies
evident drops in DI-pH values were related to climate-
driven changes in soil-forming processes and catchment
vegetation patterns, for example the immigration of pine
Monitoring of northern lakes often started after indus-
and the initiation of paludification. However, the influence
trial pollution had been ongoing for tens of years. In the
of peatlands on the acidification status of lakes is probably
absence of long-term data on water quality, as is often the
less clear in northern Fennoscandia than in more southerly
case in the Arctic and subarctic, paleolimnological recon-
boreal environments owing to the less acidic nature of the
structions using microfossils preserved in lake sediments
mire vegetation and water in the northern rich fens (Kor-
provide a powerful chronology of acidification history
hola et al., 2002; Sj—rs and Gunnarsson, 2002). A similar
and recovery and a tool for separating anthropogenic im-
slow and gradually decreasing pH trend was reconstructed
pact from the natural pH succession. Microfossils are sur-
from another lake (Lake Toskaljavri) in the barren tundra
prisingly accurate proxy sources for reconstructing past
region of Finnish Lapland (Figure 6.13), with a pH decrease
environmental conditions. Modern distributions of organ-
of ca. 0.3 to 0.4 pH units during the Holocene (Seppð et
isms that preserve well in lake sediments can be related to
al., 2002).
the hydrochemistry of the water body using a large set of
An even weaker trend in natural acidification was evi-
lakes (`training set') and environmental optima and toler-
dent in data from Solovieva and Jones (2002), who studied
ance ranges for the individual species. These ecological
the Holocene history of a small upland lake (Lake Chuna)
optima and tolerance ranges can then be applied to fossil
on the Kola Peninsula (Figure 6.13). The lake water is cur-
communities by means of mathematical calibration (trans-
rently dilute, clear and slightly acidic with a pH of around
fer) functions, which enable changes in the hydrochemis-
6.4. The lake experienced slow natural acidification in the
try of a lake to be quantitatively determined from the fossil
early Holocene, with the acid-base balance achieved about
assemblages deposited in the sediment over a certain time
4000 years ago after which there appeared to have been
period. In particular, the strong linkage between diatoms
no further acidification. By applying the diatom mod-
and lake-water pH has long been recognised (for a his-
els developed by Weckstr—m et al. (1997) and Solovieva
torical review, see Battarbee et al., 2001), which is why
(2000), Gr—nlund and Kauppila (2002) recorded a similar
diatoms have been widely used as indicators in bio-moni-
slight trend of progressively declining DI-pH towards the
toring present and past changes in the acidification status
present in Lake Soldatskoje, a small tundra site located in
of surface waters. Using paleolimnological techniques, it
the northern coastal area of the Kola Peninsula. Similarly,
82
AMAP Assessment 2006: Acidifying Pollutants, Arctic Haze, and Acidification in the Arctic
(a) Toskaljavri
(b) Tsuolbmajavri
(c) Lake Chuna
(d) Njargajavri
Age (cal. BP)
0
0
0
Modern
1000
1000
1350
2000
2000
1000
2850
3000
3000
4850
2000
4000
4000
HIATUS
5000
5000
3000
6000
6000
4000
7000
7000
9350
5000
8000
8000
6000
10220
7000
9000
9000
8000
10000
10000
9000
6.8
7.0
7.2
7.4
7.6
7.4
7.6
7.8
8.0
8.2
5.5
6.5
7.5
5.0
6.0
7.0
8.0
DI - pH
N O R W AY
Njargajavri
Toskaljavri
R U S S I A
Tsuolbmajavri
Lake Chuna
S W E D E N
Figure 6.13. Diatom-inferred Holocene pH histories of lakes in arctic Fennoscandia and the Kola Peninsula.
Toskaljavri (a) is redrawn from Seppð et al. (2002), Tsuolbmajavri (b) from Seppð and Weckstr—m (1999), Lake
F I N L A N D
Chuna (c) from Solovieva and Jones (2002), and Njargajavri (d) from Sarmaja-Korjonen et al. (2006). Note the
different scales for pH and time (cal. BP means calibrated years before present).
Bigler et al. (2002a, 2003) found that two small subarctic
years, which is considerably less than the corresponding
lakes near Abisko in northern Sweden had gone through
0.01 to 0.02 pH units per 100 years in boreal lakes. Some arc-
a slow long-term acidification during the Holocene from
tic lakes may, however, be especially vulnerable to changes
about pH 7.2 to 6.8 and 7.2 to 6.5, respectively. No evidence
in climate, which can modulate pH.
was found that changes in land-use or reindeer herding
would have affected the acidity status of these lakes during
the last 1000 years.
6.4.2. Recent acidification
Korsman (1999) reconstructed the late Holocene pH
6.4.2.1. Fennoscandia and the Kola Peninsula
history from five currently acidic lakes in northern Swe-
den using diatoms and reported a slight natural acidifica-
In 1990, critical loads for surface waters in northern Eu-
tion trend beginning thousands of years ago as a result of
rope were exceeded almost everywhere. Henriksen et al.
soil-forming processes and natural changes in vegetation.
(1997a,b) reported that critical loads of acid deposition
One of these lakes is within the AMAP region. In a recent
were exceeded in 50 to 70% of lakes on the Kola Penin-
study, Sarmaja-Korjonen et al. (2006) reported relatively
sula and in the NorwegianÙRussian border areas. Regional
strong mid-Holocene acidification of around two pH units
geochemical mapping from 1992 to 1998 demonstrated
from 7.5 to 5.5 in Lake Njargajavri, a small shallow lake in
that although the local influence of industry on the Kola
Finnish Lapland (Figure 6.13). The reasons for the rapid
Peninsula can be seen, distance from the coast dominates
decline in pH may be due to specific characteristics of this
the distribution of pH and sulfur trends in lake water at
poorly buffered, acid (pH 5.3) and oligotrophic lake and its
the regional scale (Reimann et al., 2000a).
catchment that made the system particularly susceptible
A quick and efficient paleolimnological means to estab-
to climatically-induced changes in pH. Climate is known
lish the extent of lake acidification at the regional level is the
to modulate lake acidity through links between lake ice
so called `topÙbottom approach'. From a number of lakes
cover, primary productivity, and DIC dynamics (Wolfe,
a single sediment sample is analysed (e.g., for diatoms)
2002, see section 6.5.1).
from the top of the sediment layer, to represent present-day
conditions, with another taken from deeper down the core
to represent pre-industrial conditions. By comparing these
6.4.1.2. Concluding comments on
samples it is possible to estimate the extent of the change in
millennial-scale acidification
species assemblages and thus the DI-pH values since pre-
Millennial-scale changes in lake water acidity in arctic
industrial times. This method was applied to 118 northern
Fennoscandia and the Kola Peninsula are mainly slow or
Swedish lakes (Korsman, 1999) and to 32 lakes around the
non-existent during the Holocene. Excluding the initial
smelters on the Kola Peninsula (Weckstr—m et al., 2003).
transient alkaline period following deglaciation evident at
The results indicate that in the majority of the Swedish
some sites, Korhola and Weckstr—m (2004) estimated that
lakes DI-pH was unchanged, while on the Kola Peninsula
the long-term natural rate of pH decline in arctic lakes in
the decrease in DI-pH occured only within the immediate
this region has been around 0.005 to 0.01 pH units per 100
vicinity of the smelters. These diatom data do not sup-
83
Chapter 6 ñ Effects on Freshwater Ecosystems
port the hypothesis of large-scale modern acidification in
6.14, M-N), in fact one even showed a slight increase in
northern Sweden, nor the widespread acidification of arctic
DI-pH since 1800 AD.
lakes due to sulfur pollution from the Kola smelting and
Sediments representing the industrial time of Lake
mining industries. However, in four lakes out of 15 stud-
Chuna, a small upland lake on the Kola Peninsula about
ied by Dauvalter (1997) in Finnish Lapland, acidification
30 km from the Monchegorsk smelter, were studied by
was postulated to have altered the geochemical cycling of
Moiseenko et al. (2000) and Ilyashuk and Ilyashuk (2001).
potentially harmful metals by dissolution from sediments
Moiseenko et al. (2000) found that toward present times
back to water or by reducing the adsorption of metals onto
the acidobiontic diatom taxa (as well as abnormal forms
sedimenting particles.
of some diatom species) increased as species diversity de-
In addition to these broad-scale top-bottom studies,
creased, these changes running in parallel with the start of
several downcore pH reconstructions covering the past 200
heavy metal accumulation due to industrial development
to 300 years have been made for a number of individual
of the region. Ilyashuk and Ilyashuk (2001) studied changes
lakes (see Figure 6.14). Collectively, these studies indicate
in the subfossil benthic invertebrate (Diptera: Chironomi-
that no substantial changes in DI-pH have taken place. The
dae) communities in the sediments of Lake Chuna. They
next paragraph summarises some of these studies.
concluded that compositional changes in the assemblages
Data from three small, potentially acid-sensitive (au-
were due to inputs of airborne contaminants and climate
tumn alkalinity values of 20, 20, and 60 eq/L) lakes, two in
change. According to their interpretation, the first changes
eastern Finnish Lapland 40 km west and 150 km southwest
that took place in chironomid communities around 1950
from the Nikel smelter and a reference lake in western La-
were caused by the decrease in pH and the accumulation of
pland, suggested no substantial changes in DI-pH despite
heavy metals in bottom sediments. In the uppermost sedi-
the relatively high acid deposition in the east (Korhola et al.,
ment layers climate change may have lead to the decrease
1999) (Figure 6.14, lakes A-C). The other lakes (Figure 6.14,
in the predominant species, to increased taxon evenness,
lakes D-N), dilute clearwater lakes with varying geology,
and thus to an increase in species diversity over the last two
were not chosen to evaluate their acidification history and
decades. Solovieva and Jones (2002) studied the same lake
so their sensitivity to acidification was not a major crite-
using modern quantitative approaches but did not find any
rion for selection. Sorvari et al. (2002) did not find change
significant decline in DI-pH over recent decades/centuries.
in DI-pH over the last 200 years in five tundra lakes in
This discrepancy between the pH reconstructions for Lake
northwestern Finnish Lapland (Figure 6.14, lakes H-L) in-
Chuna from the two different diatom studies is still to be
vestigated using high-resolution sediment sampling. Simi-
resolved. It may in part result from methodological differ-
larly, Weckstr—m (Environmental Change Research Unit,
ences in reconstructing pH. Nevertheless, over the last 100
University of Helsinki, unpubl. data) found no decrease
years the sediments have accumulated some toxic elements
in DI-pH in two lakes in western Finnish Lapland (Figure
(lead, nickel, copper, cobalt, and cadmium) despite their
A
B
C
D
E
F
G
Lake Sarvijðrvi
Lake 222
Lake Pieni Kokkoselkð
Pond I
Pond II
Lake Njulla
Lake 850
2000
2000
1940
1940
1980
1980
1900
1900
1970
1960
1960
~1900
~1900
1800
1800
1940
1940
Year (AD)
1940
1920
1920
1900
1900
6.0 6.5 7.0 7.5
6.5
7.0
7.5
5.5 6.0 6.5 7.0
7.0 7
7
.2 .4 7.6
6.6 6.8 7.0
6.4 6.6 6.8
6.5 6.7 6.9
DI - pH
20¯
29¯
70¯
D E H
I
J
K L
Norway
B
F
Kola Peninsula
M N
Figure 6.14. Diatom-inferred recent pH-histories of 14 lakes and
G
C
ponds in northern Fennoscandia. Note the different scales for
A
age and pH. Figures A-C are from Korhola et al. (1999), D-E from
66.5¯
Erola (1999), F-G from Bigler and Hall (2003), H-L from Sorvari et
Arctic Circle
al. (2002), and M-N from J. Weckstr—m (Environmental Change
Research Unit, University of Helsinki, unpubl. data).
Sweden
Finland
Russia
H
I
J
K
L
M
N
Saanajðrvi
Tsahkaljavri
Masehjavri
Toskaljðrvi
Stuoramohkki
Tsuolbmajavri
Vallijavri
1990
1990
1990
1950
1990
1970
1930
1910
1950
~1900
1930
1890
1910
~1800
1950
1800
1890
1900
1900
1900
1900
Year (AD)
~1600
1870
1800
1700
1600
7.0 7.2 7.4 7.6
7.0 7.2 7.4 7.6
7.0 7.2 7.4 7.6
7.1 7.3 7.5 7.7
6.3 6.5 6.7 6.9
7.0 7.2 7.4 7.6
6.7 6.9
6.8
7.0 7.1 7.2
DI - pH
84
AMAP Assessment 2006: Acidifying Pollutants, Arctic Haze, and Acidification in the Arctic
low concentrations in water. The increasing appearance
pH values towards the present. Similarly, Solovieva et al.
of deformations in diatom and chironomid specimens to-
(2005) did not find any detectable signs of acidification in
wards recent times may indicate that the accumulation of
two lakes within this region studying both diatoms and
heavy metals has had an adverse effect on the lake biota.
chironomids from the high-resolution sediment record ex-
In their study of two bays of Lake Imandra on the
tending back to about 1800.
Kola Peninsula (Monche Bay in the near vicinity of the
Monchegorsk copper-nickel smelter and Kunchast Bay,
6.4.2.3. Svalbard
an internal reference site located about 90 km southwest
from the smelter), Ilyashuk et al. (2003) found an increase
Elevated levels of atmospheric contaminants such as sphe-
in the metal contamination of the sediments in Monche Bay
roidal carbonaceous particles (from fossil fuel combustion),
that was accompanied by marked changes in chironomid
polyaromatic hydrocarbons, polychlorinated biphenyls,
communities towards more toxic-tolerant species and a
and possibly lead from both long-range and local sources
decline in diversity and total abundance. Also, the pres-
are recorded in Svalbard lake sediments for the past 30 to
ence of increasingly frequent morphological deformities
40 years (Rose et al., 2004). Lakes in Svalbard are poten-
among the detritus-eating Chironomus and the decreased
tially particularly sensitive to acid deposition as they are
Benthic Quality Index (BQI) both served to indicate in-
located on deep permafrost and there is little groundwater
creasingly toxic conditions for the biota. At the reference
interaction (Betts-Piper et al., 2004). Exceedance of critical
site (Kunchast Bay) no obvious changes in chironomid
loads for acidity (Lien et al., 1995) also suggests that acidi-
communities were noted that could be connected to metal
fication effects are possible, but no ecological impacts on
contamination and acidification. The mouthpart deformi-
diatom (Jones and Birks, 2004) or chironomid (Brooks and
ties of Chironomus may reflect a switch from non-genetic
Birks, 2004) assemblages from the lake sediments have
stress in midge larvae to an increasing amount of stress at
been observed. Trends in DI-pH values in five Svalbard
genetic level under prolonged stress conditions (Ilyashuk
lakes have been stable over the past few centuries. How-
et al., 2003).
ever, topÙbottom analysis of chrysophycean stomatocysts
Dauvalter and Rognerud (2001) studied the impact
showed marked shifts in assemblages in most of the lakes
of heavy metals on the watershed of the Pasvik River,
studied. Lakes on granitic bedrock, which are presently
the largest river system in northern Fennoscandia. They
acidic, may have become more acidic over time. On the
found increased concentrations of heavy metals in recent
other hand, lakes on carbonate bedrock that are presently
sediment layers in the lower reaches of the river. This was
alkaline appear to have increased their pH in recent times.
presumably due to the atmospheric emissions of nickel,
These changes may be related to atmospheric contamina-
copper, cobalt, zinc, cadmium and mercury from the smelt-
tion from local and remote sources, but climate change may
ers and to wastewaters from tailing dams and mines. In
also play a role (Betts-Piper et al., 2004).
the upper river reaches no significant changes in vertical
distribution of heavy metals were apparent.
6.4.2.4. Concluding comments on recent acidification
The geochemical and biological data from the Kola
Peninsula suggest localized effects of pollution from the
Broad-scale recent acidification of arctic lakes is not ap-
smelter industries within a few tens of kilometers from the
parent through DI-pH reconstructions. This may be partly
actual emission sources. However, no precise dates were
because most of the lakes studied are not particularly sensi-
available for the sediment cores studied by Dauvalter and
tive to acidification or are not located in areas of high depo-
Rognerud (2001) and Ilyashuk et al. (2003) and the time
sition. Also, there are no accurately dated high-resolution
resolution of the samples (1 cm sediment slices) was not
DI-pH reconstructions from the near vicinity of the local
high enough to allow estimates of any recovery.
emission sources to allow a paleolimnological evaluation
of acidification status in these lakes. However, within a few
tens of kilometers from the local emission sources there
6.4.2.2. Siberia
is clear evidence of the effects of metal accumulation on
the lake biota as a function of time, as indicated by the in-
Using the topÙbottom approach, Michelutti et al. (2001)
creased proportion of deformed diatoms and chironomids
found that diatom assemblages in the sediments of 17 lakes
towards the core top. As documented in a recent Arctic-
had experienced relatively little change since pre-industrial
wide study (Smol et al., 2005), climate change is already
times in the Norilsk area, in Russian Siberia. Lakes seemed
affecting lakes and ponds and their biota in arctic areas.
well buffered against acidification due to the surround-
This is evident from the marked recent change in algal and
ing alkaline bedrock and overlying glacial deposits. Ac-
zoological paleolimnological indicators that is inconsistent
cording to their investigations, the effects of the massive
with atmospheric acidification or nutrient input but in-
mining activities on the water quality of these lakes have
stead indicates the widespread impacts of climatic change
been minimal, and the alkaline nature of the lake water
(e.g., Douglas et al., 1994; Sorvari et al., 2002; Michelutti et
has resulted in the incorporation of the insoluble metallic
al., 2003).
complexes into the lake sediments. However, the mining
activities may have caused increased erosion, which had
altered the species assemblages to some extent (Michelutti
et al., 2001).
6.5. Interaction between acidification
There is no evidence of widespread lake acidification
and other environmental issues
during the industrial period in the Usa Basin of the East-
European Russian Arctic according to the subfossil diatom
assemblages studied by Solovieva et al. (2002). However,
Both the causes and effects of air pollutants are closely
they did find evidence of alkalinization of the lakes due
linked to other environmental problems and human ac-
to atmospheric deposition, as shown by the increased DI-
tivities. Many of the traditional air pollutants and green-
85
Chapter 6 ñ Effects on Freshwater Ecosystems
house gases have common sources. They interact chemi-
6.5.1. Interactions concerning climate change
cally and physically in the atmosphere and cause a variety
and UV radiation
of interrelated environmental effects at different spatial
6.5.1.1. Anticipated changes in climate
scales (Swart et al., 2004; Table 6.5). Politically these differ-
ent air pollutants and greenhouse gases have been treated
The overarching stress on ecosystems in the future will be
separately; they also have different spatial and temporal
global climate change, which is projected to be greatest in
scales. Others have a more local deposition pattern (e.g.,
the Arctic due to various feedback mechanisms (Chapman
many heavy metals) while others are spread over hun-
and Walsh, 1993; Overpeck et al., 1997). The Arctic is highly
dreds of kilometers or even globally (sulfur, greenhouse
likely to be warmer and moister in future. According to the
gases). The different spatial scale of each pollutant and its
Arctic Climate Impact Assessment (McBean, 2005), the av-
effects makes georeferenced modeling necessary, as this
erage surface temperature in the Arctic is currently increas-
can handle different scales and resolutions simultaneously
ing by approximately 0.09 ¤C per decade and it is probable
(van Rompaey, 1995 and references therein). There is also
that there was an increase in arctic precipitation of 1% per
a need to seek synergies in emissions controls for air pol-
decade during the past century. The Arctic Climate Impact
lution and climate change to gain economic and political
Assessment projected (Kattsov and KðllÕn, 2005) that the
benefits (Swart et al., 2004). Furthermore, the projected
annual precipitation will increase by 7.5 to 18.1% by 2071-
climate change-related alterations in temperature, wind
2090, depending on the model used. The projected increase
patterns, and precipitation can change the routes of con-
is generally greatest in autumn and winter and smallest
taminant entry and the locations and amounts of deposi-
in summer. Temperature is projected to increase by 2.8 to
tion in the Arctic (AMAP, 2002; Macdonald et al., 2003;
4.6 ¤C in the Arctic (north of 60¤ N) by 2071-2090. Climate
ACIA, 2004).
change will influence water quality by altering the balance
between the atmospheric, terrestrial, and aquatic processes
in watersheds, and the effects of human resource use on
Table 6.5. Impacts of various substances emitted to the air (redrawn
these processes. Among the most important physical and
from Seip and Aunan, 2002).
chemical changes projected for freshwater ecosystems
Regional impacts
Local impacts
are: increasing water temperatures, thawing permafrost,
changes in ice cover on rivers and lakes, and increasing
levels of contaminants (ACIA, 2004).
6.5.1.2. Anticipated changes in hydrology
ound level ozone
and water quality
egetation
Climate change
Acidification
Gr
Health
V
Materials
Effects of increasing temperature and
CO2
x
moisture on water quality
CH4
x
x
SO2
x
x
x
x
x
Murdoch et al. (2000) summarized some of the potential
NOx
x
x
x
x
x
x
water quality effects of increasing temperature and chang-
NH3
x
x
x
x
x
ing moisture conditions. If air temperatures increase,
NMVOCa
x
x
x
x
?
fewer arctic lakes and streams will freeze to the bottom
PMb
x
x
x
x
x
and lakes will have an increased number of ice-free days.
a non-methane volatile organic compounds; b particulate matter
In both cases these changes will increase nutrient cycling
and productivity. A shallower depth of freezing in arctic
lakes during warm years has been shown to cause in-
creased productivity through a lengthening of the grow-
Climate warming, acid deposition, the effects of toxic
ing season. If sufficient nutrient sources are available,
chemicals, and increasing exposure to ultraviolet (UV) ra-
lakes in arctic and alpine regions will also experience in-
diation are all regarded as widespread problems in north-
creasing productivity as a result of more frequent mixing
ern ecosystems. In the past, climate warming, acidifica-
and deeper thermoclines with increases in temperature.
tion, and UV radiation were treated as if they had distinct
Longer thaw seasons will enhance decomposition and
and separate effects on ecosystems. It is now clear that
greenhouse gas releases from northern wetlands and
these major stresses caused by man's alteration of the at-
peatlands. Increased moisture is predicted to decrease
mosphere cannot be studied in isolation (Schindler et al.,
permafrost thawing compared to warm-dry conditions,
1996; Schindler and Curtis, 1997). The recent Arctic Climate
but increased erosion from high runoff may yield greater
Impact Assessment (ACIA, 2004) concluded that the total
nutrient, DOC, and sediment loads from thawing per-
impact of contaminants, excess UV radiation, and climate
mafrost terrain.
warming is greater than the sum of its parts. Thresholds
Dissolved organic carbon is derived from terrestrial
of tolerance of biodiversity or of the structural and func-
vegetation, especially wetland vegetation. Concentrations
tional attributes of ecosystems to changes in atmospheric
in high latitude lakes are low. In small boreal lakes DOC
stressors are largely unknown (Freedman and Beauchamp,
is the most important determinant of thermocline depth
1998). Multiple stresses, for example, concomitant changes
(Perez-Fuentetaja et al., 1999). Changes in the levels of
in the atmosphere and land use, make these thresholds
DOC are likely to be one of the most important changes
even more difficult to define.
of climate warming in surface waters (Schindler, 2001).
This section summarizes the possible interactions
The effects of climate change on treeline lakes are likely to
between acidification and other environmental issues in
be strong since shifts in vegetation cover near the treeline
high-latitude aquatic ecosystems in two key sectors: cli-
will affect DOC in lake waters as well as hydrology (Rouse
mate change and UV radiation, and heavy metals/con-
et al., 1997). The projected increase in supply of organic
taminants.
material and nutrients will enhance primary production
86
AMAP Assessment 2006: Acidifying Pollutants, Arctic Haze, and Acidification in the Arctic
in arctic freshwaters dramatically (Schindler, 1997; Hob-
At present, water below the winter ice in subarctic lakes
bie et al., 1999; Flanagan et al., 2003).
is warmer than in lakes further south due to the rapid ice
Thawing permafrost increases the flow into ground-
over. This sustains efficient decomposition on the sedi-
water, which can lead to the disappearance of water bod-
ment surface and causes anoxia in lakes (especially meso-
ies in some areas but an increase the area of wetlands
polyhumic lakes) at the end of winter. Climate warming
and small ponds in others. Longer ice-free periods and
may remove this problem by shortening the ice-on period
the northward advance of vascular plants will increase
and increasing wind mixing in shallow lakes. On the other
evapo(transpi)ration, leading to lower water levels. On
hand, increased production and DOC concentrations in
the other hand, increased precipitation and cloudiness
shallow lakes may strengthen thermal stratification and
may counteract this. However, lakes, ponds, and wetlands
sedimentation of organic matter to the bottom, thus in-
are more likely to dry out during summer (Wrona et al.,
creasing oxygen demand. Deep lakes are projected to be
2005). Earlier ice break-up affects supplies of nutrients,
more strongly stratified. Changing the redox situation near
sediments, and water quality, but increases the amount
the bottom will affect the alkalinity of the lakes.
of harmful UV-radiation during spring. These multiple
stressors will impact on the aquatic biota at a time when
Multiple stressors and effects on biota
they are having to compete with new species moving north
The combined effects of multiple stressors may be antago-
from lower latitudes.
nistic or synergistic, i.e., smaller than expected or larger
than expected, respectively (Folt et al., 1999). The cumula-
pH changes in high-latitude and high-altitude lakes
tive impacts of anthropogenic stressors on ecosystems are
Thawing permafrost and a deepening of the active layer
especially worrying in relation to a loss of biodiversity
are very likely to increase geochemical weathering and
and to changes in ecosystem functioning (Sala et al., 2000;
nutrient release (Wrona et al., 2005). Warmer wetter condi-
Schindler, 2001; Vinebrooke et al., 2004). When the critical
tions will also favor erosion and greater runoff of weather-
load for multiple environmental stresses is exceeded, the
ing products. This could increase the buffering capacity of
ecosystem may change abruptly. Sala et al. (2000) projected
lakes against strong acids.
very little change in biodiversity in arctic areas if the in-
As previously described, climate change probably
teractions between driving factors (land use, climate, ni-
alters the chemical properties of high-latitude lakes, po-
trogen deposition, biotic exchange and atmospheric CO2)
tentially influencing their susceptibility to anthropogenic
are synergistic, and much change if the interactions are
atmospheric deposition. A small change in temperature
antagonistic.
can have a profound impact on aquatic environments, es-
For example, acidification typically shifts phyto-
pecially in areas where the duration of snow and ice cover
plankton communities towards larger dinoflagellates and
has a dominant role in determining ecosystem functioning.
filamentous algae, while suppressing cyanobacteria and
It has been suggested that climate (e.g., temperature and
smaller chrysophytes and larger eukaryotic algae that are
precipitation) indirectly controls the pH of oligotrophic
less well adapted to higher temperatures, suggesting that
alpine lakes (Psenner and Schmidt, 1992) as well as poorly
acidification and environmental warming have synergistic
buffered arctic lakes (Wolfe, 2002). In the Arctic, this is
negative impacts on phytoplankton. It has been hypoth-
explained by dissolved inorganic carbon (DIC) dynamics,
esized that since acidification favors smaller zooplankton
which are affected by lake ice cover and primary produc-
species, such as rotifers and certain copepods, the effects of
tivity (Wolfe, 2002). Thus DIC regulates the pH of dilute
several other stressors on zooplankton will be reduced in
lakes. Globally, lakes are supersaturated by carbon dioxide
acidified lakes. For example, smaller zooplankton species
(CO2) and under prolonged ice conditions this situation is
experience lower metabolic costs per capita than larger
exaggerated, which leads to a decline in pH. With a warmer
species during warming, and are less vulnerable to UV
climate and longer ice-free season CO2 supersaturation is
radiation, visually feeding vertebrate predators, and pes-
eliminated and enhanced algal production further reduces
ticides. On the other hand, some planktonic crustaceans,
limnetic CO2, shifting the balance in inorganic forms of dis-
which are UV-tolerant due to their ability to produce
solved carbon away from CO2 and toward HCO3, resulting
photo-protective pigmentation, are likely to face an in-
in an increase in pH (Wolfe, 2002). If the catchment to lake
creased risk of predation by visually feeding planktivorous
area ratio is small (e.g., < 10) in-lake processes become
fish, especially if large populations of alien sportfish are
especially important in determining the lake pH status.
introduced into clear lakes (Vinebrooke et al., 2004). In their
Otherwise changes in the catchment, such as vegetation,
experiments on multiple stress effects on daphnids, Folt
land use, erosion, and weathering, would mainly drive
et al. (1999) concluded that effects of toxins and low food
changes in lake water quality.
supply would probably be enhanced by thermal stress.
Climate change may also affect the seasonality of the
Hypothesized antagonistic and synergistic effects of an-
stress. A rise in algal productivity under warmer condi-
thropogenic acidification and other major abiotic and biotic
tions may lead to larger seasonal fluctuations in pH as
stressors on phytoplankton and zooplankton are shown
organic matter production influences the redox potential
in Table 6.6.
and consequently the acid-base equilibrium (Psenner and
Schmidt, 1992), thus acting as an additional stress on the
biota with pulses of strong acids into lakes in spring (see
6.5.1.3. Recovery from acidification in surface waters
section 6.3). The relationship between climate and pH is,
however, dependent on the unbuffered character of re-
There is good documentation of a large-scale chemical re-
mote high-latitude lakes, which allows the direct control
covery process from surface water acidification in Europe
of pH by DIC dynamics. In general, it seems that a warmer
and North America (Stoddard et al., 1999; Forsius et al.,
and moister future climate would increase the alkalinity
2001; Evans et al., 2001; SkjelkvÍle et al., 2001a). Recovery
of arctic lakes.
is also documented in the northern regions (section 6.1.2).
Modeling studies based on current emission reduction
87
Chapter 6 ñ Effects on Freshwater Ecosystems
Table 6.6. Hypothesized antagonistic (+) and synergistic (-) effects of major abiotic and biotic stressors (first column) and anthropogenic acidifi-
cation on phytoplankton and zooplankton (redrawn from Vinebrooke et al., 2004).
Phytoplankton
Zooplankton
Rationale
Elevated temperature
-
+
Acid-sensitive cyanobacteria are thermophilic; small acid-tolerant
zooplankton (e.g., rotifers) experience lower metabolic costs than large
acid-sensitive cladocerans.
Ultraviolet radiation
+
+
Acid-tolerant species must also be UV-tolerant as they experience elevated
UV exposure during lake acidification and loss of UV-attenuating
DOC. Small acid-tolerant rotifers show higher UV-tolerance than other
zooplankton.
Eutrophication
-
?
Acid-sensitive cyanobacteria are better competitors for nutrients than
other groups of phytoplankton.
Toxins
+
+
Acid-tolerant, small zooplankton species are more resistant to
contaminants than large species.
Predation
+
-
Large, acid-tolerant phytoplankton (e.g., cyanobacteria, dinoflagellates)
are less edible; smaller zooplankton are more susceptible to predatory
invertebrates like Chaoborus, while pigmented UV- and acid-tolerant
zooplankton are easily detected by introduced fish.
plans project further chemical recovery (Jenkins et al., 2003;
tant in European soils. Both stores of sulfur are sensitive to
Wright et al., 2005). Uncertainties in these scenarios are
drought. Relationships between sulfate pulses and drought
mainly related to the effects of climate change and future
associated with El Niþo events have been shown to occur
behavior of nitrogen in the ecosystem. Other uncertainties
in lakes in Ontario, Canada (Dillon et al., 1997). In the UK,
are related to the biological response.
large flushes of sulfate were widely observed in streams
Present-day climatic conditions are commonly assumed
following a drought in 1995 (e.g., Harriman et al., 2001).
in model projections of future scenarios. However, as previ-
Climate-regulated sulfur retention and release represent
ously discussed large changes in climate are anticipated for
`noise' within an overall recovery trend. Release of stored
the Arctic and the direction and degree of change may signifi-
sulfur will delay recovery where pools are large. Also, sul-
cantly affect the dynamics of terrestrial and aquatic ecosys-
fate flushes following drought (particularly if droughts
tems. SkjelkvÍle et al. (2003) identified four key climate-re-
become more severe with climate change) may continue to
lated factors that may influence recovery from acidification:
generate acidic episodes, despite improvements in baseline
(a) increased frequency and severity of sea-salt episodes, (b)
water quality. These drought-driven episodes may be more
increased frequency and severity of drought, (c) increased
extreme or frequent in future climate scenarios and may,
turnover of organic carbon, and (d) increased mineraliza-
like sea-salt episodes, contribute to a delay in chemical and
tion of nitrogen. Although most empirical evidence is from
biological recovery in surface waters.
boreal or temperate regions, it is likely that these processes
are also relevant for most arctic environments.
Increased turnover of organic carbon
Regional trends of increasing DOC concentrations over the
Increased frequency and severity of sea-salt episodes
last two decades have been documented across substantial
The `sea-salt effect' in surface waters is important in areas
parts of northern and central Europe (Evans and Monteith,
receiving substantial inputs of sea-salts, in particular coast-
2001; SkjelkvÍle et al., 2001a,b, 2005; Evans et al., 2005; Vuo-
al areas of Norway, the United Kingdom and the United
renmaa et al., 2006) and eastern North America (Stoddard
States. The sea-salt effect may temporarily increase the
et al., 2003). For Canada the picture is less straightforward
acidity of runoff. However, a prerequisite for the lake and
(Jeffries et al., 2003). The widespread occurrence of these
stream acidification effect to occur from sea-salt episodes
trends indicates a regional cause and various hypotheses
is that the catchment soil is acidic. Recent climate forecasts
have been put forward to explain them. It has been pro-
project a dramatic increase in the North Atlantic Oscilla-
posed that these increases may be coupled to change in
tion index (see section 3.7.3) over the next 80 years, imply-
potential drivers, such as increasing temperature (Freeman
ing that warm, westerly conditions in winter may become
et al., 2001; Hejzlar et al., 2003), changes in hydrological
more prevalent. A greater frequency and intensity of sea-
regimes (Tranvik and Jansson, 2002; Hejzlar et al., 2003),
salt episodes may therefore be expected in coastal surface
increasing atmospheric CO2 concentration (Freeman et
waters. Sea-salt episodes may have important regional bio-
al., 2004), airborne nitrogen enrichment in soils (Findlay,
logical effects. Massive regional fish kills were reported for
2005), or decreasing sulfur deposition (Stoddard et al., 2003;
the first time after the episode in southwestern Norway
Evans et al., 2005; Vuorenmaa et al., 2006). More research is
during winter 1993 (Barlaup and étland, 1996). The fish
needed to establish the relative significance of the various
deaths occurred in moderately acidified systems that sud-
drivers in the different regions.
denly became extremely acid.
Elevated DOC concentrations in surface waters have
raised concerns that terrestrial carbon stores may be beco-
Increased frequency and severity of drought
ming unstable, with unpredictable consequences for the
In parts of North America, the reduction and storage of
global carbon cycle and with complex consequences for
sulfate in wetlands, and its subsequent re-oxidation and
surface waters. Recovery from acidification along with dec-
release, have been shown to have a major impact on run-
reasing acid deposition is being partially offset by increa-
off water quality and hence recovery (Dillon and LaZerte,
sing organic acidity. Increasing DOC concentrations may
1992; Jeffries et al., 2003). Immobilization and re-minerali-
also cause increased buffering of changes in pH, increased
zation of sulfur within soil organic matter are both impor-
water coloration, and decreased visible light and UV-B
88
AMAP Assessment 2006: Acidifying Pollutants, Arctic Haze, and Acidification in the Arctic
penetration within the water column (see sections 6.5.1.2
change and UV radiation potentially modify the underwa-
and 6.5.1.4). While increased organic acidity may delay
ter UV radiation regime via: (a) changes in stratospheric
chemical recovery from acidification in surface waters, the
ozone levels, (b) changes in snow- and ice-cover duration,
other factors may influence biological recovery.
and (c) changes in DOC levels in natural waters (Wrona et
al., 2005). A reduction in snow and ice cover on the surface
Increased mineralization of nitrogen
of rivers, lakes, or oceans is likely to increase the exposure
Additional uncertainties with regard to nitrogen processes
of many organisms to UV radiation (Weatherhead et al.,
relate to the influence of climate (short and long term) on
2005). On the other hand, UV penetration in dilute lakes
nitrate leaching, which may alter the long-term trend, or
that are presently within catchments dominated by tundra
simply add `noise' to the anthropogenic signal. Because in-
and forest-tundra may be significantly reduced if climate
ternal ecosystem cycling of nitrogen greatly exceeds system
warming induces a northward shift in the treeline or in-
inputs and outputs, any disturbance of this cycle has the
creases in the density of forest cover, leading to increased
potential to completely obscure the relationship between
DOC inputs (Pienitz and Vincent, 2000; Figure 6.15). Lakes
nitrogen deposition and runoff. Both in the UK and the US,
with very high catchment to lake area ratios are likely to
large pulses of nitrate have been observed in surface waters
be most affected by vegetation changes in treeline areas
following severe winters possibly as a result of soil freezing
(Pienitz and Vincent, 2000). Export of humic substances is
(Mitchell et al., 1996; Monteith et al., 2000). The frequency
related to climate and to the balance between production
of such pulses may change in future in response to altered
and decomposition. However, climatic as well as deposi-
climate. Results from the CLIMEX project, where ambient
tion impacts on DOC export are under debate (Evans et al.,
air and soil temperature was increased over three years,
2002; section 6.5.1.3).
show increased leaching of inorganic nitrogen, probably
Thus, both acid precipitation and climate warming may
due to increased mineralization and nitrification rates in
enhance the exposure of aquatic organisms to increased UV
soils (Wright and Jenkins, 2001). Continued high deposi-
radiation, which is usually attributed only to depletion of
tion of nitrogen is likely to increase nitrogen saturation
stratospheric ozone (Schindler et al., 1996; Gorham, 1998;
and generate increased nitrate concentrations in runoff,
Schindler, 1999). Levels of DOC decrease rapidly when
thereby delaying recovery due to reductions in sulfur emis-
lakes become acidified. Lower pH values lead to increased
sions. Increased temperature due to climate change may
protonation of functional groups and cause the dissolved
increase nitrate in runoff and thereby contribute to delay in
materials to become hydrophobic and to settle out of the
recovery. The role of nitrogen in acidification and recovery
water column onto bottom sediments. Increased photo-
remains uncertain.
degradation also seems to occur. Acidification, climate
warming, and stratospheric ozone depletion may thus act
together in a `three-pronged attack' of UV radiation on
6.5.1.4. Impacts of DOC changes on
aquatic systems, particularly in dry conditions (Schindler
UV radiation in lakes
et al., 1996; Schindler, 1999; Figure 6.15).
Climate effects on exposure to UV radiation were dis-
cussed extensively by Wrona et al. (2005). Humic substanc-
es strongly absorb UV radiation and act as a screen, thus
6.5.2. Interactions concerning heavy
protecting organisms from its detrimental effects. Under
metals/contaminants
normal conditions all wavelengths of solar radiation in
freshwater ecosystems, including UV radiation, are attenu-
In principle, the atmospheric transport routes for acidic
ated to some degree by DOC (Schindler, 1999) and long
compounds should be similar to the pathways of other
term variation in underwater UV irradiance is primarily
contaminants, such as heavy metals. Trace metals can
controlled by the amount of dissolved organic material.
catalyze the oxidation of SO2 to sulfate by sunlight (Kel-
Long lasting ice cover has a similar protective role, protect-
logg, 1995). Acid precipitation contains a variety of trace
ing organisms from UV radiation during the most intensive
metals. However, the deposition pattern of heavy metals
radiation period in spring. Interactions between climate
is different from SO2 in that they (usually) deposit within
Figure 6.15. Climate warming will
Ozone Depleting
Greenhouse Gas
Ozone Depleting
Acid Rain
Greenhouse Gas
induce environmental changes in
Chemicals
Emissions
Chemicals
Emissions
the Arctic that alter the exposure of
aquatic organisms to the increasing
levels of UV radiation caused by
Increased
Climate
Increased
Acid Lakes
Climate
stratospheric ozone depletion: (a)
UV Radiation
Change
UV Radiation
Change
a warmer wetter climate is likely
to result in higher DOC levels in
arctic lakes which, because humic
Higher DOC
More Rain,
Increased
Less Rain,
substances strongly absorb UV
Warmer
Aluminum
Warmer
radiation, will offset the effects of
increased UV radiation from stra-
tospheric ozone depletion (modified
from Schindler, 1999), whereas (b)
Decreased
Lower DOC
Underwater UV
in arctic areas with a warmer drier
Warmer Water, Longer Water Renewal Times
climate the effects of stratospheric
Warmer Water,
Increased
Underwater UV
Longer Summers
ozone depletion, acid rain, and
Increased Oxygen Depletion
Increased Oxygen Depletion
climate warming can combine to
increase the exposure of aquatic
biota to UV radiation by causing a
Disequilibrium, Higher Production,
Damage to Aquatic Biota
decrease in the DOC levels in lakes
Changes in Aquatic Biota
Disruption of Biogeochemical Cycles
a
(redrawn from Schindler, 1999).
b
89
Chapter 6 ñ Effects on Freshwater Ecosystems
the immediate vicinity of the sources (mercury being a
reason for ecosystem deterioration (Kashulina et al., 2003).
clear exception). Therefore, the interactive effects of metals
The pine ecosystems there act as a biogeochemical bar-
and acid precipitation are especially visible locally near
rier against metals by accumulating them in plant tissue
the emitters. The co-emissions of the smelters (base cati-
and humus horizons (Goryainova and Nikonov, 1997). The
ons) may be adequate to prevent environmental acidifica-
function of forest ecosystems as a regulator of the cycles
tion at the regional scale (e.g., Kashulina et al., 2003). The
of these heavy metals (copper and nickel) is disrupted if
AMAP heavy metals assessment (AMAP, 2005) included
the vegetation is lost (e.g., by acidification) and more toxic
little information on the potential interactions of heavy
substances can then drain into watercourses.
metals with other pollutants, for example sulfate, or the
Significant interactions between acidic rain and metal
cumulative impacts of multiple pollutants. This section
exposure were also observed in the lichen Bryoria fuscesens
addresses potential interactions of heavy metal/contami-
by Tarhanen et al. (1999). They established that although
nant pollution with other air pollution issues, including
the metal load had a very important role in the decline of
climate change. The complementary AMAP assessment on
epiphytic lichen cover, acidic precipitation further disturbs
contaminant pathways (Macdonald et al., 2003) addressed
the symbiosis between the photobiont and mycobiont of
recent global changes and their effects on the distribution
a lichen. Kashulina et al. (2003) concluded that the whole
of various contaminants.
spectrum of emitted elements needs to be studied in the
Kola region, in order to understand the effect of anthropo-
genic activities, including acidification.
6.5.2.1. Processes in air
Warming, increased precipitation, and thawing permafrost
6.5.2.3. Processes in surface waters
will increase the transport and deposition of contaminants
to the Arctic. This was discussed in detail by Wrona et al.
Changes in the timing of spring freshet, ice melt, and
(2005) in relation to mercury and persistent organic pollut-
productivity are very likely to alter the efficiency of arc-
ants. The timing of weather events also affects the transfer
tic lakes in capturing contaminants, for example mercury.
of contaminants to the Arctic. For example, snowfall occur-
Episodes of high contaminant levels are likely to occur in
ring at the time of arctic haze would increase the transfer of
freshwaters when stored contaminants are released due to
contaminants to the ground at that time of year.
warming climate (Wrona et al., 2005). A wetter climate will
The northward movement of toxic metals and organic
expand the spatial extent of direct runoff to surface waters
pollutants by cold condensation was confirmed by evi-
thus significantly increasing pollutant loads from point
dence from tree bark (Simonich and Hites, 1995) and lake
and non-point sources that are hydrologically isolated or
sediments (Muir et al., 1995). Differential distillation, which
filtered through groundwater aquifers under current flow
pollutants undergo, allows them to be released in vapor
conditions (Murdoch et al., 2000). Inundation of wetlands,
form from warm areas and to re-condense in colder re-
riparian zones, and low-lying soils results in increased mo-
gions. However, Givelet et al. (2004) concluded that there is
bilization of trace metals and organic compounds from
no evidence for the `cold condensation hypothesis' and that
soils, increased mobilization and methylation of mercury,
the Arctic was not an important natural sink for mercury
and greater anaerobic activity in saturated soils (sulfate
during pre-industrial times. Moreover, while the anthropo-
reduction, denitrification) (Murdoch et al., 2000).
genic emissions of mercury are thought to have decreased
A change in flow patterns can alter the capability of a
by 30% in the past 20 years (Pacyna and Pacyna, 2002),
lake to receive and restore contaminants. At present, most
there is evidence that mercury fluxes may have doubled
of the contaminant load is carried through the lake sur-
over the past 100 years in the Arctic (Lockhart et al., 1995,
face layers under the ice before lake turnover and peak
1998; Jackson, 1997) and that the average concentration of
primary production and little is retained in the lake itself
heavy metals has more than doubled on the Kola Peninsula
(Macdonald et al., 2000). In a warming climate the main
over the last 20 years (Dauvalter, 2003). According to Give-
runoff pulse may couple with lake mixing and primary
let et al. (2004), springtime mercury depletion events are the
production and hence cause more contaminants to be cap-
chief mechanism for transferring atmospheric mercury to
tured within the lake. In the case of acidifying compounds,
the arctic environment. Climate warming enhances mer-
lakes in catchments with thin soils, especially on slowly
cury depletion events, which in turn increases the transfer
weathering bedrock, may thus face strong effects as the
of mercury into the food webs.
substances remain in the lake, rather than being carried
Synergistic interactions seem to occur between acidi-
rapidly through the lake.
fication, climate warming, and stratospheric ozone deple-
Acidification and heavy metal contamination often
tion that enhance the global mercury cycle (reviewed by
work synergistically because the solubility of heavy met-
Schindler, 2001). Global change and air pollutant levels in-
als in water increases as pH falls. As a result, heavy metals
fluence the scale of mercury depletion (mercury transport
leach more quickly from contaminated soils in contact with
and deposition from the air) (AMAP, 2002). The release of
acidic water. Dauvalter (1995) studied 15 lakes in Finnish
mercury to the atmosphere might be expected to increase
Lapland. In four acidic lakes, the low pH had changed
as lakes become clearer (due to changes in DOC concentra-
the geochemical cycling of potentially harmful metals by
tions), particularly if increased methyl mercury is available
increasing desorption of metals from sediments back to
due to warming lakes, and as reservoirs are constructed
water and/or decreasing the adsorption of metals onto
(Schindler, 1999).
settling sediment particles. Cadmium and nickel mobiliza-
tion from sediments during acidification was observed by
Nuorteva et al. (1987) and Fjeld et al. (1994).
6.5.2.2. Processes in terrestrial areas
Heavy metals are absorbed by plankton at the base of
Terrestrial processes have a key role in determining the
the food web and biomagnified to significant amounts at
impacts of heavy metals on surface waters. On the Kola
higher trophic levels. The influence of acidification and
Peninsula, direct exposure to SO2 seems to be the main
eutrophication on metal behavior must therefore be consid-
90
AMAP Assessment 2006: Acidifying Pollutants, Arctic Haze, and Acidification in the Arctic
ered. It is well known that inorganic monomeric aluminum
freshwater food chains. This is one of the main hypotheses
acts synergistically with pH to cause embryo mortality
tested in an ongoing EU project EURO-LIMPACS (http://
(e.g., Clark and Hall, 1985; Clark and LaZerte, 1985; Freda
www.eurolimpacs.ucl.ac.uk/index.php).
and McDonald, 1990; Blaustein et al., 2003). UV radiation
also may affect the toxicity of contaminants (Wrona et al.,
2005).
Acidification of the oceans
Water chemistry, especially acidity, and food web struc-
Owing to increasing atmospheric CO2 levels, CO2 levels in the
ture also affect mercury availability and uptake. Acidifica-
oceans have increased since pre-industrial times. Added CO2 de-
tion can greatly enhance methylation, producing a higher
creases the CO 2-
3 (carbonate) ion concentration and makes the ocean
proportion of bioavailable methylmercury (Miskimmin et
more acidic. Ocean pH has decreased by 0.1 units, equivalent to
al., 1992; Gilmour and Henry, 1991). Lake acidification is
a 30% increase in hydrogen ion concentration over the last two
known to favor higher methylation to demethylation ra-
centuries (Caldeira and Wickett, 2003; The Royal Society, 2005).
tios, both directly and via effects on DOC (see references in
If global emissions of CO2 continue to rise on current trends, then
Schindler et al., 1995). Climate warming alters the thermal
the average pH of the oceans could fall by 0.5 pH units by 2100 (a
conditions of lakes in a way that increases the methylation
0.5 unit decrease in ocean acidity means a three-fold increase in
of mercury (Ramlal et al., 1993; Schindler et al., 1995). On
hydrogen ions). This could have substantial effects on the biologi-
the other hand, increased penetration of shortwave solar
cal processes in surface oceans. Recent studies indicate that future
radiation due to decreases in DOC may cause increased
undersaturation of aragonite and calcite, especially in polar oceans,
conversion of methylmercury to elemental mercury, which
may have potential biological impacts on calcifying organisms, es-
is then released back to the atmosphere (Sellers et al., 1996).
pecially shelled pteropods, the densities of which are high in cold
Once back in the atmosphere, mercury is susceptible to
water regions (Orr et al., 2005). Shell dissolution rates of pteropods
long-range transport and biomagnification in distant food
increase in waters that have become undersaturated with aragonite
chains (Schindler, 1999).
(e.g., Byrne et al., 1984). Also, benthic calcareous organisms such
Future climate change, in interaction with other en-
as cold-water corals are in danger of becoming surrounded by water
vironmental problems, is thus thought to influence the
masses that are undersaturated with aragonite. Orr et al. (2005) sug-
distribution patterns and mobility of organic pollutants
gested that some high latitude surface waters will probably become
and toxic metals in freshwater systems and to lead to chan-
undersaturated within the next 50 years, leading to detrimental
ges in the uptake and accumulation of these substances in
conditions for many organisms.
91
Chapter 7
Air Pollution and Health Impacts in the Arctic
Jon Äyvind Odland
In addition to the detrimental ecosystem effects of acidify-
Researchers are currently investigating the importance
ing compounds and haze precursors described in previous
of the size and chemical composition of particles as a causal
chapters, elevated concentrations of air pollutants may also
factor for cardiorespiratory effects (Brunekreef and Holgate,
cause serious human health impacts. Concern over health
2002). The focus is now on the very small particles; PM2.5
effects is currently one of the most important factors driv-
and PM1 (i.e., particles smaller than 2.5 m or 1 m, respec-
ing international air pollutant emission reduction policies
tively). As very small particles penetrate further into lungs
(Sliggers and Kakebeeke, 2004; UNECE, 2004b).
than larger particles, they are believed to be more strongly
associated with adverse health effects. Diesel engine emis-
sions contribute disproportionately to the very-small-par-
ticle fraction of urban air pollution (WHO, 1996).
7.1. Major air pollutants of health concern
The recent documentation of lung cancer as an ef-
fect of long-term exposure to urban air pollution (Pope et
The sources, health effects, and vulnerable groups for ma-
al., 2002) highlights carcinogenic chemicals in the small-
jor air pollutants are summarized in Table 7.1. It is very dif-
est air particles and in carcinogenic gases (e.g., benzene;
ficult to isolate the health effects of individual pollutants.
benz[a]pyrene) as possible causal agents.
It is more useful to consider each of the major pollutants
Carbon dioxide (CO2), another air pollutant created by
as `indicators' of the mixture of air pollution created by
fuel combustion, has no direct health effects at the concen-
motor vehicles, home heating, and industry. Continuous
trations occurring in the ambient environment. However, it
monitoring of particulate matter, nitrogen oxides, ozone,
is the main `greenhouse gas' causing global climate change
and carbon monoxide is now established in the big cities
(McMichael et al., 1996) and, as such, indirectly contributes
(Simpson et al., 2001), but these data provide only general
to the global health impact of such change. Efforts to reduce
estimates of actual exposures in individuals. Carbon mon-
urban air pollution by reducing the use of cars would have
oxide is the only major air pollutant for which a biomar-
the added benefit of reducing CO2 emissions.
ker of exposure (carboxyhaemoglobin in erythrocytes) is
Health effects of the major air pollutants are listed in
available.
Tables 7.1 and 7.2. In any particular study, establishing
Table 7.1. Selected outdoor air pollutants and their effects on health (adapted from WHO, 2001).
Contributing or
Source
Known health effects
potentiating factors
Vulnerable populations
Particulate matter
Biomass and fossil fuel
Upper respiratory tract irritation and
Sulfur dioxide,
Elderly people with respiratory
combustion in home heating,
infection; exacerbation of and increased
sulfuric acid; cold,
and cardiovascular diseases;
industry and motor vehicle
mortality from cardiorespiratory diseases
heat, humidity
children with asthma
engines; cigarette smoke
Sulfur dioxide and acid aerosols
Fossil fuel combustion; metal
Throat irritation; exacerbation of
Exercise,
People with respiratory diseases
smelting and petrochemical
cardiorespiratory diseases, including asthma particulates, asthma (e.g., children with asthma);
industries; home heating/cooking
elderly people with respiratory
with coal
and cardiovascular diseases
Oxides of nitrogen
Fuel combustion at high
Eye irritation; upper respiratory tract
Exercise, respiratory People with respiratory diseases
temperature (e.g., from vehicle
infection (especially in children);
tract infection,
(e.g., children with asthma)
engines, gas cooking and heating exacerbation of asthma; irritation of bronchi
asthma
Ozone
Reaction product of sunlight and Eye and throat irritation; reduced exercise
Exercise, respiratory People with respiratory diseases
vehicle pollutants; hydrocarbons capacity; exacerbation of respiratory disease
tract infection,
(e.g., children with asthma)
and oxides of nitrogen
asthma
Carbon monoxide
Biomass and fossil fuel
Headache, nausea, dizziness, breathlessness,
Coronary artery
People with ischemic heart
combustion; cigarette smoke and fatigue, visual disturbance, confusion;
disease
disease
vehicle exhaust
angina, coma, death; low birth weight
(after maternal exposure during pregnancy)
Lead
Smelting; leaded petrol
In children: neuropsychological and
Other sources of
Children, pregnant women
cognitive effects.
lead; iron deficiency
In adults: hypertension, classic lead poisoning
Other pollutants; `air toxics'
(hydrocarbons, aldehydes, other
Eye irritation; lung cancer; asthma
Smoking,
Smokers, asbestos workers,
organic compounds, asbestos)
occupational
people with asthma, children
exposures
92
AMAP Assessment 2006: Acidifying Pollutants, Arctic Haze, and Acidification in the Arctic
Table 7.2. Adverse respiratory health effects of air pollution
et al., 1995, 2002). These studies reported significant asso-
(American Thoracic Society, 2000).
ciations between annual average particle pollution levels
ñ Increased mortality
(PM10 or PM2.5) and annual all-cause mortality rates: an
ñ Increased incidence of lung cancer
average increase of 10 g/m3 of PM10 or PM2.5 was associ-
ñ Increased frequency of symptomatic asthma attacks
ated with a 3Ù4% increase in mortality. The ACS study also
ñ Increased incidence of lower respiratory tract infections
found a significant association between levels of PM2.5
ñ Increased exacerbation of chronic cardiopulmonary or other
diseases, reflected in various ways, including reduced ability to
and deaths due to cardiorespiratory diseases and lung can-
cope with daily activities, increased hospitalization, increased
cer (Pope et al., 2002). A `natural intervention' study using
physician visits and medication, and decreased pulmonary
long-term exposure and effect data analyzed mortality in
function
Dublin before and after coal-burning was banned in 1990
ñ Reduction of FEV1 (forced expiratory volume in one second) or
(Clancy et al., 2002). The annual average particle pollution
FVC (forced vital capacity) associated with clinical symptoms
ñ Increased prevalence of wheezing unrelated to colds, or
level declined by 36% after the ban, while adjusted mortal-
wheezing on most days or nights
ity rates decreased by 15.5% and 10.3% for respiratory and
ñ Increased prevalence or incidence of chest tightness
cardiovascular deaths, respectively.
ñ Increased prevalence or incidence of cough/phlegm production
A review of epidemiological studies concluded that
requiring medical attention
ñ Increased incidence of acute upper respiratory tract infections
there may be a relationship between acute ozone expo-
that interfere with normal activity
sure and increased mortality, especially in elderly people
ñ Acute upper respiratory tract infections that do not interfere with
(Thurston and Ito, 2001). However, the concurrence of high
normal activity
ozone levels with hot weather makes it difficult to separate
ñ Eye, nose, and throat irritation that may interfere with normal
the effect of heat from the effect of ozone on mortality.
activities (e.g., driving a car), if severe
Acute time-series studies have shown associations be-
tween particle pollution and daily hospital admissions,
mainly for respiratory diseases (especially asthma and
whether there is an association between air pollution and
chronic obstructive pulmonary disease) but also for car-
one or more of the effects listed depends on exposure level,
diovascular diseases (Morgan et al., 1998; McGowan et al.,
the background health status of the population exposed,
2000; Petroeschevsky et al., 2001; Denison et al., 2001; De-
and their age.
partment of Environment, 2003).
7.2. Key epidemiological findings
7.3. The arctic perspective
Most recent epidemiological studies of air pollution and
The arctic perspective is, in general, the same as the global
mortality have used time-series analysis to relate daily
perspective but with the addition of point sources related
mortality rates to daily air pollution levels (on the same
to heavy industrial complexes, especially in the area of
day or previous days). However, this approach cannot be
the former Soviet Union (Smith-Sivertsen et al., 1998). The
used to ascertain whether increased mortality reflects a
associations between air pollution and human health in dif-
significant reduction in life expectancy (Brunekreef and
ferent arctic areas are briefly described in the recent AMAP
Holgate, 2002). A few studies have documented associa-
assessment on human health (AMAP, 2003), and in more
tions between mortality and air pollution exposure over
detail in many publications related to the RussianÙNorwe-
longer periods. The Harvard `six cities' study involved a
gian Health Group's reports (Smith-Sivertsen et al., 1998,
14Ù16-year prospective cohort of more than 8000 adults in
2001, 2003; Dotterud et al., 2001). The results reported were
the United States, and the American Cancer Society (ACS)
mostly very optimistic. Studies to date have been unable
study collected data on over 500 000 people living in 51 dif-
to show any significant health effects that are directly as-
ferent US metropolitan areas between 1982 and 2000 (Pope
sociated with emissions from the nickel refineries. No
Table 7.3. Reflections and predictions (after Kjellstr—m et al., 2002).
Circa 1900
Cities being rapidly industrialized. Large amounts of sulfur dioxide and particulates being emitted in heavily populated areas from inefficient
combustion of coal in power stations and industrial and domestic furnaces.
Air pollution and resultant lack of sunshine in industrialized areas causing widespread lung damage, high mortality, and an upsurge in
diseases such as rickets in children. Indoor air pollution, from cooking with coal and wood, even worse for health than outdoor pollution.
Circa 2100 (a pessimistic view)
Increasing air pollution in developing countries.
Limited progress on motor vehicle emissions in developed countries.
Circa 2100 (an optimistic view)
Intelligent global stewardship of our natural resources has led to a major shift towards alternative energy sources such as wind power, solar
energy, and fuel-cell engines for vehicles.
More wood burning to heat houses, as this creates less greenhouse gas emissions than fossil fuel.
Coal burning in super efficient and clean-burning electric power stations is still continuing in countries with large coal reserves (e.g., China,
India, United States of America).
Many governments have put pressure on motor vehicle manufacturers to produce less-polluting cars.
High-quality public transport systems and advanced telecommunications systems have made daily commuting in private cars largely obsolete.
Private vehicles are mainly used for leisure activities.
93
Chapter 7 ñ Air Pollution and Health Impacts in the Arctic
reduction in lung function between exposed and non-ex-
7.4. The shifting panorama
posed groups could be demonstrated (Smith-Sivertsen et
al., 2001). Sensitization described by serum IgE-levels was
From a global and arctic perspective, many countries are
more common in Russia than Norway, but the Russians
at the same stage of industrial and urban development
did not report any more atopic diseases (Smith-Sivertsen et
as Western European countries 50 to 80 years ago, when
al., 2003). Atopic diseases seem to be even less prevalent in
high levels of ambient air pollution from coal-burning were
the Russian study groups than in studies of other northern
common. At the household level, promoting energy-effi-
European countries (Dotterud et al., 2001). Urinary nickel
cient and less-polluting cooking stoves constructed from
excretion was considerably higher in the Russian popula-
local materials would be an important step in reducing
tions, but only partly associated with vicinity to the nickel
air pollution (Table 7.3). Switching the energy source for
smelters or to occupational exposure (Smith-Sivertsen et al.,
cooking to less-polluting kerosene, gas, and electricity is
1998). Differences in health status of the Norwegian and
another solution, often out of reach for poor communi-
Russian border populations seem to be more associated
ties in the short term (Kjellstr—m et al., 2002). Worldwide,
with socio-economic conditions than to environmental pol-
a major change in priorities is needed to steer economic
lution (Odland et al., 2004).
development towards low-pollution policies.
94
AMAP Assessment 2006: Acidifying Pollutants, Arctic Haze, and Acidification in the Arctic
Chapter 8
Conclusions and Recommendations
Martin Forsius, John Derome, Lars R. Hole, Sirkku Manninen, Marjut Nyman, Patricia Quinn, Brit Lisa SkjelkvÍle,
and John L. Stoddard
8.1. Sources of acidifying pollutants
The impacts of acidification from arctic shipping should be ad-
and arctic haze precursors
dressed, and future scenarios for emissions associated with this
source should be included in this work.
AMAP assessments have clearly documented that air
pollutants, including persistent organic pollutants, heavy
The Arctic is thought to contain at least a quarter of the
metals such as mercury, and acidifying substances can
world's undiscovered petroleum resources: most of these
reach the Arctic as a result of long-range transport from
in Russia, Alaska, Canada, Greenland, and Norway (off-
source regions in Europe, North America, and Asia. In
shore). A significant increase in arctic oil and gas activity
relation to acidifying substances, the industrial areas of
can be expected, including activity in offshore areas.
northern Europe and parts of Russia and the northeastern
United States are responsible for most of the pollution
The impacts associated with oil and gas related activities on
exported to the Arctic. There are also significant sources
acidification and arctic haze in the Arctic should be assessed
of acidifying substances within the Arctic, including in-
together with the assessment of the impacts of oil and gas de-
dustrial sources (the metallurgical industry, power plants,
velopment.
oil and gas related activities) and diffuse sources associ-
ated with, for example, shipping. Emissions from natural
sources within the Arctic (volcanoes, marine algae, and
8.2. Trends in air concentrations
forest fires) are very difficult to quantify and almost im-
and deposition
possible to project. However, the frequency, severity, and
duration of boreal forest fires do appear to be increasing,
Ice core drillings on Svalbard show that significant chang-
possibly related to the influence of changing climate.
es in atmospheric pollution within the Arctic have only
occurred since the beginning of the industrial era, indi-
Nonferrous metal production remains the dominant
cated by increased levels of non-sea-salt sulfate, nitrate,
source of emissions of acidifying gases to the atmosphere
acidity, fly ash, and organic contaminants. Acidifying pol-
within the Arctic. Non-ferrous metal smelters located at
lutants in rain, snow, dust, and gases have been monitored
Norilsk, and at Nikel, Zapolyarnyy, and Monchegorsk on
regularly at purpose-built stations in some parts of the
the Kola Peninsula (all operated by MMC Norilsk Nickel)
Arctic, mostly since the 1980s. Fennoscandia has several
together account for 68% of the total `harmful emissions'
background monitoring stations, while the vast Siberian
(including sulfur dioxide, dust, and nitrogen oxides) from
region and the Canadian Arctic and Alaska have relatively
non-ferrous metal production in Russia. These smelters
few. Some of the stations have now generated time series
are all located within or close to the Arctic. Sulfur dioxide
datasets that are long enough to show whether concen-
emissions from these smelters have reduced substantially
trations are increasing, decreasing, or staying the same
due to changes in production and better technology for
over time.
controlling emissions. The main reductions have occurred
since 1995 and have been considerably greater on the Kola
Peninsula than at Norilsk.
8.2.1. Air and precipitation
It is recommended that improved information be obtained on
Sulfate concentrations measured at those air monitoring
emissions from arctic point sources, in particular for the non-fer-
stations with the best air quality time series in the High
rous metal smelters on the Kola Peninsula and at Norilsk.
Arctic (Alert, Canada; and Ny-élesund, Svalbard) and at
several monitoring stations in subarctic areas of Europe
Recent modeling results suggest that southeast Asia is not
(Oulanka, Finland; Tustervann, Svanvik, Karasjok/Jer-
likely to be a major source of acidification-related atmos-
gul, Norway; Bredkðlen, Sweden) show decreasing trends
pheric pollution at ground level in the Arctic. Efforts are,
since the 1990s. Although there are relatively few back-
however, needed to confirm this finding. Future changes
ground stations within the Arctic measuring sulfate con-
in atmospheric transport patterns due to climate change
centrations, most record a decrease in concentrations since
could also alter this conclusion. Europe (Northern Russia
the 1990s. These observations are supported by modeling
in particular) and to a lesser degree North America con-
results. There are few signs of significant trends in precipi-
tinue to be the main source regions for acidifying pollut-
tation for the period studied. However, expected future
ants carried into the Arctic by long-range transport.
occurrence of rain events in both summer and winter will
result in increasing wet deposition in the Arctic.
Shipping activities in arctic waters may increase substan-
tially in the future. Projected reductions in sea-ice thick-
For nitrate and ammonia the pattern is unclear, with
ness and extent due to climate change have raised the
increases at some stations and decreases at others. The
possibility that shipping activities in arctic waters may
increasing trends in nitrate are particularly apparent in
increase substantially over the coming decades (as the
recent years indicating a decoupling between the trends
navigation season lengthens and new sea routes open).
in sulfur and nitrogen. Time series of sulfur and nitrogen
Emissions associated with this increased activity are dif-
concentrations in precipitation at Norilsk since 1990 do not
ficult to project.
show any significant trends.
95
Chapter 8 ñ Conclusions and Recommendations
In general, sulfur deposited originates from local point
appears to be increasing in Alert (Canada), with an unclear
sources and long-range transport. In the AMAP region,
trend at Barrow (Alaska). However, trend analysis on light
high levels of deposition only occur close to large point
scattering data collected since the late 1990s indicates an
sources in the vicinity of the Nikel and Monchegorsk
increase in the amount of haze reaching the Alaskan Arc-
smelters on the Kola Peninsula and in Norilsk in north-
tic (Barrow). There is also evidence of increasing light ab-
western Siberia. With the exception of areas affected by
sorption, due to black carbon aerosols at Barrow (Alaska)
emissions from the industrial centers, average atmos-
and Alert (Canada). Forest fires are a possible source of
pheric deposition loads are much lower in arctic Russia
this black carbon. The frequency, severity and duration of
than in more southerly parts of the country. Background
boreal forest fires seem to be increasing and the pollution
sulfate levels in precipitation decrease from west to east
plumes from these summer fires can extend over vast ar-
across the Russian Arctic. There is a similar pattern for
eas. Boreal forest fires may even dominate the black carbon
background levels of nitrate in precipitation across the
budget in the Arctic in years of strong burning.
Russian Arctic. A trans-Arctic snow study found no over-
all relationship between pH and levels of sulfate from
human activities.
8.4. Effects
Short-term episodes of winds carrying very high concen-
8.4.1. Human health
trations of air pollutants can result in pulses of pollution
entering the arctic environment. Studies at Finnish back-
Epidemiological studies indicate that differences in health
ground stations showed that the five worst days of the
status of the Norwegian and Russian border populations
year can bring 20 to 30% of the annual sulfate load of bulk
are more associated with socio-economic conditions than
deposition.
environmental pollution. Studies to date have been unable
to show any significant health effects that are directly as-
sociated with emissions from the nickel refineries.
8.2.2. Model projections
The decreasing trends in levels of acidifying pollutants
8.4.2. Terrestrial ecosystems
observed at many sites throughout the Arctic are sup-
ported by model results. Models indicate that mean con-
The present deposition of acidifying compounds from
centrations of sulfur oxides and total sulfur deposition
long-range, transboundary transport of anthropogenic
within the Arctic almost halved between 1990 and 2000.
emissions at lower latitudes does not appear to be a threat
These decreasing trends are supported by empirical data
to terrestrial ecosystems in most of the Arctic.
from the several monitoring stations around the Arctic
(see above). The modeled results for airborne oxidized
The non-ferrous metal smelters are responsible for the vast
nitrogen are similar to those for sulfur. The models also
majority of acidification-related effects in plants and soils
confirm earlier findings that emissions in Eurasia continue
within the European Arctic. Information on the effects
to make the greatest contribution to acid deposition within
of emissions from the smelters on the Kola Peninsula on
the Arctic.
terrestrial ecosystems is accumulating rapidly and is more
accessible to the international scientific community than
Model projections based on future emissions scenarios
information on the situation in the Norilsk region, which
indicate that the decreasing trends observed between 1990
is less detailed and published mostly in Russian.
and 2000 are likely to level off and that only small reduc-
tions in concentrations and deposition can be expected af-
Acidified soils on the Kola Peninsula mostly occur im-
ter 2020, even if maximum feasible reductions in emissions
mediately around the smelters and coincide with the ar-
are achieved. Although further recovery and continuing
eas where the vegetation has been completely destroyed.
improvement in the acidification status of the Arctic can
Strongly acidic precipitation only falls within about 30 km
be expected during the period until 2020, this is depend-
of the smelters; outside this zone lower sulfur dioxide lev-
ent on the implementation of existing international agree-
els and the presence of alkaline particles in the atmosphere
ments to reduce emissions of acidifying substances. The
prevent the precipitation becoming acidic. Sparse data on
Gothenburg Protocol is the most important agreement in
soil microorganisms show that adverse effects are also
this connection.
concentrated in restricted areas around the smelters but
are more associated with excessive heavy metal deposition
All arctic countries should be encouraged to ratify the UN ECE
than soil acidification.
LRTAP protocol to Abate Acidification, Eutrophication, and
Ground-level Ozone (the `Gothenburg Protocol') and to support
Outside the area immediately around the smelters, there is
its implementation.
no clear evidence of soil acidification due to sulfur dioxide
emissions (and subsequent deposition of acidifying com-
pounds) on the Kola Peninsula. The lack of widespread
8.3. Arctic haze
soil acidification despite high sulfur dioxide emissions
appears to result from the simultaneous emission of alka-
Based on measurements of sulfate aerosol and light scat-
line fly ash from the power plants and the apatite fertilizer
tering by aerosols, the amount of arctic haze reaching the
complex, the low interception of acidifying compounds by
Arctic was either relatively constant or decreasing be-
the sparse cover of coniferous trees, and the low rate of
tween the 1980s and early 1990s. Levels of sulfate aerosol
conversion of sulfur dioxide to sulfuric acid in the Arctic.
have decreased since the late 1990s and the indications are
Soils in the Norilsk area are not considered acid sensi-
that levels are still decreasing. In contrast, nitrate aerosol
tive.
96
AMAP Assessment 2006: Acidifying Pollutants, Arctic Haze, and Acidification in the Arctic
In the European Arctic there are direct effects of sulfur di-
transported sulfur. Lakes close to the pollution sources
oxide on trees, dwarf shrubs, and epiphytic lichens. Effects
on the Kola Peninsula are showing the clearest signs of
on vegetation, some of which are evident at a regional lev-
recovery. There are insufficient data to make similar con-
el, are due to changes in air quality and in most cases are
clusions about regional-scale biological recovery.
not related to changes in soil acidification. Direct effects
of sulfur dioxide include visible leaf damage, decrease in
Assessments of biological effects of acidification in arctic
needle life span in conifers, and elevated sulfur concen-
surface waters are largely based on sparse and isolated
trations in plant tissues. The observed changes in plant
data. There are far more chemical data available than bio-
community structure (species composition and coverage)
logical data. The best biological effects data are from the
also indicate the indirect effects of sulfur and nitrogen
impacted areas in northeastern Norway and Finland Ù out-
deposition. In terms of their effects on plants, it is dif-
side this area it is impossible to draw robust conclusions
ficult to differentiate between the effects of acidifying air
about biological effects in surface waters. It is important
pollutants and elevated heavy metal levels in soils. Large
to note that lakes subjected to acidic inputs, even those
quantities of heavy metals are emitted by the non-ferrous
with measured decreases in acid neutralizing capacity,
metal smelters.
alkalinity, and pH, have not necessarily been acidified to
the point where measurable damage to the biota can be
The most likely explanation for the changes observed in
observed.
vertebrate populations near Monchegorsk is habitat de-
terioration. Winter mortality may be especially high in
Biological recovery is occurring in at least two isolated ar-
the contaminated habitats. Changes in insect populations
eas. Both sites are directly downwind of point sources on
are mostly due to changes in host plant abundance and
the Kola Peninsula. A comparison of minnow populations
physiology, accompanied by a decline in some natural
in lakes and streams in the Vðtsðri area of northeastern
predators, and to changes in habitat structure.
Finland between 1993 and 2000 and increasing abundance
of the acid-sensitive cladoceran Daphnia longiremis since
The critical loads of acidity for terrestrial ecosystems
1999 in Lake Dalvatn, an acid-sensitive lake in Finnmark,
have not been exceeded in Canada north of 60¤ N. In the
both indicate improvement in the acidification status of
European Arctic the widespread exceedance of critical
these waters. A clear recovery of the brown trout popula-
loads of acidity in 1990 should have almost disappeared
tion of lake Otervatn in Eastern Finnmark has occured.
by 2010 if the agreed emissions reduction policies are fully
implemented. However, the critical levels of sulfur diox-
Changes in the microscopic fossil record in lake sediments
ide and critical loads for acidity in highly sensitive forest
indicate that most arctic lakes have experienced very slow
ecosystems are expected to be exceeded locally and re-
natural acidification over the last 10 000 years. These pale-
gionally near the non-ferrous metal smelters. (In this con-
olimnological studies do not support the hypothesis of
text, `critical level' refers to the atmospheric concentration
recent and widespread acidification of arctic lakes due to
above which direct adverse effects will occur on plants,
sulfur pollution from the smelting and mining industries.
while `critical load' refers to the maximum amount that
Many of the lakes studied are outside areas of high acid
can be deposited on an ecosystem without causing that
deposition or are not particularly sensitive to acidifica-
ecosystem to become damaged). It must be remembered
tion. Within a few tens of kilometers from the local emis-
however, that non-exceedance of critical loads/levels does
sion sources there is however clear evidence of the effects
not necessarily mean that there will be no environmental
of metal accumulation on the lake biota as a function of
change.
time, as indicated by the increased proportion of deformed
specimens of diatoms and chironomids towards the top
section of the sediment. The algal and zoological paleolim-
8.4.3. Freshwater ecosystems
nological indicators also show that the global warming is
affecting the lakes and ponds in the Arctic.
Anthropogenic acidification of lakes is only of concern in
areas with both sensitive geology and elevated levels of
Sulfur deposition has important effects on the severity
acid deposition. Because the areas with the highest levels
of acidic episodes in spring. Data on streams of the Kola
of acid deposition, for example Norilsk, are less geologi-
North showed that in the periods of pH depression dur-
cally sensitive the biggest impacts on lake chemistry and
ing floods (acidic episodes) the total concentration of toxic
biology have mostly been observed in small sensitive eco-
aluminum in water increased by 50 to 88%. A model based
systems in local areas.
assessment on data from streams in northern Sweden in-
dicated that reduced emissions of acid precursors have
Available lake chemistry data provide irregular and in-
generated significant improvements in the surface water
complete coverage of the Arctic. Only a few of the lakes
chemistry during episodes associated with spring runoff,
monitored in the Canadian Arctic are acid sensitive;
and that episodic acidification decreased by between 40
these are mostly on Baffin Island or the central mainland.
and 80% between 1990 and 1999. It is also likely that ex-
There are no lake chemistry data for large areas of the
pected future reductions in acid deposition will further
North American Arctic. Acid sensitive lakes are scattered
improve the spring flood acidification situation in the
throughout the European Arctic but are most abundant in
northern regions.
northern Fennoscandia and the Kola region. Acidification
by natural organic acids is important in some lakes.
In 1990, critical loads of acidity for surface waters in the
European Arctic were exceeded almost everywhere. Im-
Chemical monitoring data show that lakes in the Euro-
plementation of agreed emission reduction policies will
Arctic Barents region are showing clear signs of a regional-
reduce the area in which critical loads are exceeded and,
scale recovery from acidification caused by long-range
to a greater extent, the amount by which the critical loads
97
Chapter 8 ñ Conclusions and Recommendations
are exceeded. But even with the implementation of the
ing stations. The vast regions of Siberia east of the Urals,
maximum feasible emissions reductions (the `MFR 2020'
Alaska, and the Canadian Arctic are covered by relatively
scenario) there are still very likely to be areas where the
few stations, and some of these are being closed. A better
critical loads for surface waters are exceeded. The required
distribution of background monitoring/research stations
deposition reduction is up to 3.2 kilograms of sulfur per
will enable a more complete and accurate circumpolar
hectare per year in the most exposed area of the Kola Pe-
assessment to be made of acidification and arctic haze, as
ninsula.
well as of other air pollution issues.
Additional background monitoring stations for air and precipi-
8.5. Links between acidification, arctic
tation chemistry should be established in northern Canada and
haze, and other environmental issues
Alaska. More regional and background air monitoring and pre-
cipitation chemistry stations should be established in the Rus-
sian Arctic. These background air monitoring stations should
The effects of haze aerosols on the arctic climate are com-
be extended to form `multi-purpose' monitoring stations that
plicated by feedbacks between aerosols, clouds, radiation,
monitor acidification parameters together with, for example,
sea ice, and vertical and horizontal transport processes.
persistent organic pollutants and heavy metals, ozone and UV,
Whether the pollutant aerosols cause an overall warming
and precipitation chemistry and relevant meteorological and
or an overall cooling is not yet known. Changes in the light
ecosystem effects parameters. This will help to ensure cost-ef-
scattering and absorbing properties of the haze directly
fective monitoring at remote sites that are expensive to operate
affect the amount of solar radiation passing through the
and maintain, and will allow data to be assessed in a more multi-
haze.
disciplinary context.
The causes and the effects of air pollutants are closely
linked to other environmental problems. For example,
8.6.2. Data availability
climate change, changes in exposure to ultraviolet radia-
tion, the effects of toxic chemicals, and land-use. Complex
Both AMAP and EMEP have benefited from a close coop-
interactions between these factors can strongly affect eco-
eration with respect to monitoring levels of acidifying pol-
system responses to air pollutants.
lutants in air and precipitation within the European Arctic.
The new EANET (Acid Deposition Monitoring Network in
Recent studies indicate that if global emissions of carbon
East Asia) initiative represents an opportunity to develop
dioxide continue to rise at current rates, then the average
similar cooperation in relation to monitoring in the Far
pH of the surface oceans could fall by 0.5 pH units by
East of Asia, including assessment of the acidification po-
2100. This could cause detrimental conditions for calcify-
tential and arctic haze impacts of long-range transported
ing organisms, especially in high latitude surface oceans,
air pollutants from southeast Asia. Programs addressing
within the next 50 years.
acidification issues also exist in North America, although
their coverage of arctic areas is limited.
Future AMAP assessments should view acidification and arctic
haze in a wider context. Particularly in relation to toxic pollut-
AMAP should continue to develop a better linkage with pro-
ants, particulate matter, and climate change and climate feedback
grams such as EMEP and EANET and with appropriate na-
effects (i.e., reduced snow albedo as a result of increasing black
tional experts (particularly in Russia and North America) to
carbon deposition).
extend the geographical areas and time series datasets available
for use in AMAP assessments.
Chemical and biological variables should be monitored and stud-
ies conducted to assess the risk of acidification of high latitude
Improved efforts should be made to ensure that relevant data,
surface oceans due to increased carbon dioxide emissions.
both existing and future, from North American monitoring sta-
tions are reported to the AMAP database at NILU according
to agreed procedures. Including more North American data in
8.6. Gaps in knowledge and
the AMAP database would enable a better understanding of
recommendations concerning
hemispheric pollutant transport to the Arctic and would be a
monitoring and research needs
useful source of data for groups engaged in hemispheric trans-
port modeling.
8.6.1. Geographical gaps
New information from the areas around Norilsk has pro-
Monthly data from Russian precipitation chemistry monitor-
vided valuable insight into the sensitivity, and potential
ing sites should be reported to the AMAP database at NILU
vulnerability of this region. The few samples taken, how-
according to agreed procedures. This will enable a better un-
ever, are not sufficient to enable an overall assessment of
derstanding of acid deposition at the regional level within the
the geographic extent or trends in environmental effects
European Arctic.
in the Norilsk region.
Continued effort should be made to collect data and information
8.6.3. Trends in air and precipitation
for the Norilsk region. This should involve both MMC Norilsk
Nickel and the relevant local and regional authorities.
Long-term monitoring is extremely important, even when
trends are decreasing. For example, background monitor-
While Fennoscandia has several background air moni-
ing stations that measure sulfate have mostly recorded a
toring stations for acidification parameters, most areas
decrease in concentrations since the 1990s. In contrast,
of the Arctic have few, if any, background air monitor-
many stations have recorded an increasing trend in nitrate
98
AMAP Assessment 2006: Acidifying Pollutants, Arctic Haze, and Acidification in the Arctic
over recent years. This indicates a decoupling between the
ity followed by recovery of aquatic biota. The latter is the
trends in sulfur and nitrogen. There is also evidence of
ultimate proof for successful action.
increasing light absorption due to black carbon aerosols
at Barrow (Alaska) and Alert (Canada). Natural climate
More biological data from sites close to the main emission point
fluctuations (such as the North Atlantic Oscillation) affect
sources and less affected sites as reference are needed to assess
the concentrations of acidifying air pollutants and levels
effects and verify recovery. Systematic studies (monitoring pro-
of arctic haze. Time series datasets need to be long enough
grams) should be conducted on key species and variables that
to resolve the effects of natural climate fluctuations and to
indicate changes in the structure and function of terrestrial
identify the underlying trends. Measurements linked to
ecosystems (including possible recovery) in very polluted areas
chemical transport models are particularly important for
as well as in `control' areas. Similarly, more biological data on
helping to establish the causes of trends.
effects and trends in surface waters should be collected in the
most impacted areas of the Arctic. The effects of acidic episodes
Monitoring of trends in acidic species in the Arctic and other
on biota should be studied with high temporal resolution. In
high latitude stations should continue and sulfur dioxide should
these contexts, AMAP should co-operate and co-ordinate with
be added to the list of chemicals monitored at Barrow (Alaska).
other relevant programs and projects, such as CAFF and CBMP
in obtaining biological data. Systematic lake surveys should be
Monitoring of aerosol composition, light scattering, and light ab-
conducted in acid-sensitive regions of the Arctic.
sorption should continue at Barrow (Alaska) and Alert (Canada),
as well as at other locations to better define changes in arctic
Sites for effects monitoring studies should be located close to air
haze over time.
quality, deposition, and climate monitoring stations (`multi-pur-
pose stations', see above). The study sites should be representative
of the different terrestrial ecosystem types (tundra, mountain
8.6.4. Pathways
birch, and coniferous forest ecosystems) because these differ in
their sensitivity to air pollution impacts.
Recent modeling studies yield conflicting results as to
whether southern Asia is a source of pollutants to the Arc-
Limnological and accurately-dated high-resolution paleolimno-
tic. Rapid industrialization in this region has caused an
logical studies are needed in lakes near emission sources in the
increase in the emissions of many air pollutants and these
environmentally sensitive areas of the Kola Peninsula and No-
increases are likely to continue. The transport pathways to
rilsk to assess recovery.
the Arctic are likely to be affected by the projected changes
in the climate system.
8.6.6. Models
Co-operation with relevant international organizations, such
as EMEP, the LRTAP Convention Task Force on Hemispheric
Modeling is one of the most important tools available for
Transport of Air Pollutants, and EANET should be enhanced to
gaining insight into the possible pollution status of the
obtain more precise data on emissions from southeast Asia and to
extensive areas of the Arctic where the observational net-
investigate the possible impact of these emissions on the Arctic.
works are absent or poorly developed. Models also allow
investigation of scenarios for future trends, and for link-
Further research is needed into pollution transport pathways to
ages between contaminant pathways and, for example,
the Arctic. In particular, the potential effects of future changes in
climate change.
transport pathways due to climate change should be assessed.
Measurements of sulfur species, nitrogen species, and black car-
bon should be used to further validate and improve existing air
8.6.5. Effects monitoring and research
quality and deposition models. Measurements should be con-
ducted during field campaigns to improve models, for example
The work on ecosystem effects has clearly shown that it is
determining dry deposition velocities during summer.
very difficult to differentiate the effects caused by differ-
ent pollutants, for example effects caused by acidification,
There is a need to integrate aircraft, ground-based, and long-
poor air quality, and toxic metals. Data on effects on biota
term data sets for use in three-dimensional arctic climate models
are sparse and isolated and key chemical data for cause-
designed to evaluate climate forcing by arctic haze. Existing data
effect assessments are often incomplete. Episodic effects
are primarily long-term ground-based measurements of aerosol
are very important in the Arctic due to the extreme climate
composition and, at a few sites, scattering and absorption. To es-
and the large emission point sources. Surface waters are
timate aerosol radiative forcing in the Arctic requires additional
generally more sensitive to inputs of acidifying pollut-
data on the vertical and horizontal distributions of composition
ants than soils. For this reason there is a greater and more
and amount of the haze as well as its variability. Such data are
extensive exceedance of critical loads to lakes than soils.
only derived from periodic aircraft measurements and long-term
Recovery will initially be observed as decreases in acid-
ground-based observations.
99
References
Aamlid, D., 1993. Symptoms of sulphur dioxide injuries on some boreal
tents in the organic horizon of podzols in the central part of the
plants. In: R. Jalkanen and T. Aalto (eds.). Forest pathological re-
Barents region (Finland, Norway and Russia), with special refe-
search in northern forests with special reference to abiotic stress
rence to heavy metals (Co, Cr, Fe, Ni, Pb, V and Zn) and sulphur
factors. Extended SNS meeting in forest pathology in Lapland,
as indicators of airborne pollution. Journal of Exploration Geoche-
Finland, 3-7 August 1992. Metsðntutkimuslaitoksen tiedonantoja,
mistry, 68:127-144.
451:93-102.
áyrðs, M., H. Niskavaara, I. Bogatyrev, V. Chekushin, V. Pavlov, P. de
Aamlid, D. and I. Skogheim, 2001. The occurrence of Hypogymnia phy-
Caritat, J.H. Halleraker, T.E. Finne, G. Kashulina and C. Reimann,
sodes and Melanelia olivacea lichens on birch stems in northern
1997. Regional patterns of heavy metals (Co, Cr, Cu, Fe, Ni, Pb, V
boreal forest influenced by local air pollution. Norsk geografisk
and Zn) and sulphur in terrestrial moss samples as indication of
Tidsskrift, 55:94-98.
airborne pollution in a 188,000 km2 area in northern Finland, Nor-
Aamlid, D., H. T½mmervik, M. Gytarsky, R. Karaban, K. Venn, T. Rin-
way and Russia. Journal of Geochemical Exploration, 58:269-
dal, N. Vassilieva, G. Koptsik and E. L½bersli, 1995. Determination
281.
of exceedance of critical levels in the border area between Norway
BÍÍth, E., 1989. Effects of heavy metals in soil on microbial processes
and Russia. In: E. L½bersli and K. Venn (eds.). Effect of air pollu-
and populations (a review). Water Air and Soil Pollution, 47:335-
tion on terrestrial ecosystems in the border area between Norway
379.
and Russia. Proceedings of the second symposium, Svanvik, Nor-
BÌkken, T. and K.J. Aanes, 1990. Bruk av vassdragets bunnfauna i
way, 3-5 October 1994, pp. 19-23. Directorate for Nature Manage-
annkvalitetsklassifiseringen. NIVA-rapport O-87119, Norwegian
ment, Trondheim, Norway.
Institute for Water Research, Oslo. (In Norwegian)
Aamlid, D., N. Vassilieva, P.A. Aarrestad, M.L. Gytarsky, S. Lindmo,
Baker, J.P., D.P. Bernard, S.W. Christensen, M.J. Sale, J. Freda, K. Helt-
R. Karaban, V. Korotkov, T. Rindal, V. Kuzmicheva and K. Venn,
cher, D. Marmorek, L. Rowe, P. Scanlon, G. Suter, W. Warren-Hicks
2000. The ecological state of the ecosystems in the border area
and P. Welbourn, 1990. Biological effects of changes in surface
between Norway and Russia. Boreal Environment Research, 5:257-
water acid-base chemistry. NAPAP Rep. 13. In: P.M. Irving (ed.),
278.
Acidic Deposition: State of Science and Technology. Vol. II. Aqua-
Aarrestad, P.A. and D. Aamlid, 1999. Vegetation monitoring in South-
tic Processes and Effects, U.S. National Acid Precipitation Assess-
Varanger, Norway Ù species composition of ground vegetation and
ment Program, Washington, D.C. 381p.
its relation to environmental variables and pollution impact. En-
Barlaup, B.T. and é. étland, 1996. Episodic mortality of brown trout
vironmental Monitoring and Assessment, 58:1-21.
(Salmo trutta L.) caused by sea-salt-induced acidification in west-
ACIA, 2004. Impacts of a Warming Arctic: Arctic Climate Impact As-
ern Norway: effects on different life stages within three popula-
sessment. Cambridge University Press. 139p.
tions. Canadian Journal of Fisheries and Aquatic Science, 53:1835-
Aherne, J. and S.A. Watmough, 2005. Critical loads of acidity for North
1843.
America. Conference Abstracts, Acid Rain 2005, 7th International
Barrie, L.A., 1986. Arctic air pollution: An overview of current knowl-
Conference on Acid Deposition, p. 476. Prague, Czech Republic,
edge. Atmospheric Environment, 20:643-663.
12-17 June 2005.
Barrie, L.A., 1996. Occurrence and trends of pollution in the Arctic
Ahlbrandt, T.S., 2002. Future petroleum energy resources of the world.
troposphere. In: E.W. Wolff and R.C. Bales (eds.), Chemical Ex-
International Geology Review, 44:1092-1104.
change between the Atmosphere and Polar Snow, pp. 93-130.
Albrecht, B.A., 1989. Aerosols, cloud microphysics, and fractional clou-
NATO ASI Series 1: Global Environmental Change 43.
diness. Science, 245:1227-1230.
Barrie, L.A. and R.M. Hoff, 1984. The oxidation rate and residence time
Alekseev, A.S. and A.R. Soroka, 2002. Scots pine growth trends in
of sulphur dioxide in the Arctic atmosphere. Atmospheric Envi-
northwestern Kola Peninsula as an indicator of positive changes
ronment, 18:2711-2722.
in the carbon cycle. Climatic Change, 55:183-196.
Barrie, L.A., R.M. Hoff and S.M. Daggupaty, 1981. The influence of
Alexeyev, V.A., 1995. Impacts of air pollution on far north forest vege-
mid-latitudinal pollution sources on haze in the Canadian Arctic.
tation. Science of the Total Environment, 160/161:605-617.
Atmospheric Environment, 15:1407-1419.
Allen, D.J., J.E. Dibb, B. Ridley, K.E. Pickering and R.W. Talbot, 2003.
Battarbee, R.W., V.J. Jones, R.J. Flower, N.G. Cameron, H. Bennion, L.
An estimate of the stratospheric contribution to springtime tro-
Carvalho and S. Juggins, 2001. Diatoms. In: E.F. Stoermer, H.J.B.
pospheric ozone maxima using TOPSE measurements and beryl-
Birks, W.M. Last (eds.). Tracking Environmental Change Using
lium-7 simulations. Journal of Geophysical Research, 108:8355,
Lake Sediments, Vol. 3, Terrestrial, Algal and Siliceous Indicators,
doi:10.1029/2001JD001428.
pp. 155-202. Kluwer Academic Publishers.
Allen-Gil, S.M., C.P. Gubala, D.H. Landers, B.K. Lasorsa, E.A. Crecelius
Belikova T.V., V.N. Vasilenko, I.M. Nararov, A.N. Pegoeva and Kh. D.
and L.R. Curtis, 1997. Heavy metal accumulation in sediment and
Fridman, 1984. Characterization of snow cover background pol-
freshwater fish in U.S. Arctic lakes. Environmental Toxicology and
lution by sulphur at the territory of USSR. Meteorology and hy-
Chemistry, 16:733-741.
drology, 9.
AMAP, 1997. Arctic Pollution Issues: A State of the Arctic Environment
Berresheim, H., P.H. Wine and D.D. Davis, 1995. Sulphur in the atmos-
Report. Arctic Monitoring and Assessment Programme.
phere. In: H.B. Singh (ed.), Composition, Chemistry, and Climate
xii+188p.
of the Atmosphere, pp. 251-307. Van Nostrand Reinhold.
AMAP, 1998. AMAP Assessment Report: Arctic Pollution Issues. Arctic
Betts-Piper, A.M., B.A. Zeeb and J.P. Smol, 2004. Distribution and au-
Monitoring and Assessment Programme. xii+859p.
tecology of chrysophyte cysts from high Arctic Svalbard lakes:
AMAP, 2002. Arctic Pollution 2002. Persistent Organic Pollutants, Hea-
preliminary evidence of recent environmental change. Journal of
vy Metals, Radioactivity, Human Health, Changing Pathways.
Paleolimnology, 31:467-481.
Arctic Monitoring and Assessment Programme, Oslo. xii+112p.
Bigler, C. and R.I. Hall, 2002. Diatoms as indicators of climatic and
AMAP, 2003. AMAP Assessment 2002: Human Health in the Arctic.
limnological change in Swedish Lapland: a 100-lake calibration
Arctic Monitoring and Assessment Programme, Oslo, Norway. xiv
set and its validation for paleoecological reconstructions. Journal
+ 137p.
of Paleolimnology, 27:97-115.
AMAP, 2005. AMAP Assessment 2002: Heavy Metals in the Arctic.
Bigler, C. and R.I. Hall, 2003. Diatoms as quantitative indicators of
Arctic Monitoring and Assessment Programme, Oslo, Norway. xvi
July temperature: a validation attempt at century-scale with me-
+ 265p.
teorological data from northern Sweden. Palaeogeography Pal-
American Thoracic Society, 2000. What constitutes an adverse health
aeoclimatology Palaeoecology, 189:147-160.
effect of air pollution? Official statement of the American Thoracic
Bigler, C., I. Larocque, S,M. Peglar, H.J.B. Birks and R. Hall, 2002a.
Society. American Journal of Respiratory and Critical Care Medi-
Quantitative multiproxy assessment of long-term patterns of
cine; 161:665-673.
Holocene environmental change from a small lake near Abisko,
Andreae, M.O., D. Rosenfeld, P. Artaxo, A.A. Costa, G.P. Frank, K.M.
northern Sweden. The Holocene, 12:481-496.
Longo and M.A.F. Silva-Dias, 2004. Smoking rain clouds over the
Bigler, M., D. Wagenbach, H. Fischer, J. Kipfstuhl, H. Miller, S. Sommer
Amazon. Science, 303:1337-1342.
and B. Stauffer, 2002b. Sulphate record from a northeast Greenland
Antoniades, D., M.S.V Douglas and J.P. Smol, 2003a. Comparative
ice core over the last 1200 years based on continuous flow analysis.
physical and chemical limnology of two Canadian High Arctic
Annals of Glaciology, 35:250-256.
regions: Alert (Ellesmere Island, NU) and Mould Bay (Prince Pat-
Bigler, C., E. Grahn, I. Larocque, A. Jeziorski and R.I. Hall, 2003.
rick Island, NWT). Archiv fur Hydrobiologie, 158:485-516.
Holocene environmental change at Lake Njulla (999 m a.s.l.),
Antoniades, D., M.S.V Douglas and J.P. Smol, 2003b. The physical and
northern Sweden: a comparison with four small nearby lakes
chemical limnology of 24 ponds and one lake from Isachsen, Ellef
along an altitudinal gradient. Journal of Paleolimnology, 29:13-
Ringnes Island, Canadian High Arctic. International Review of
29.
Hydrobiology, 88:519-538.
Bishop, K., H. Laudon and S. K—hler, 2000. Separating the natural and
áyrðs, M. and G. Kashulina, 2000. Regional patterns of element con-
anthropogenic components of spring flood pH decline: A method
100
AMAP Assessment 2006: Acidifying Pollutants, Arctic Haze, and Acidification in the Arctic
for areas that are not chronically acidified. Water Resources
A Three Dimensional Air Pollution Model used for the Arctic.
Research, 30:1873-1889.
Atmospheric Environment, 31:4169-4191.
Blais, J.M., K.E. Duff, T.E. Laing and J.P. Smol, 1999. Regional con-
Christensen, J., 1999. An overview of modelling the Arctic mass budg-
tamination in lakes from the Noril'sk region in Siberia, Russia.
et of metals and sulphur: Emphasis on source apportionment of
Water Air and Soil Pollution, 3-4:389-404.
atmospheric burden and deposition. In: Modelling and Sources:
Blanchet, J.-P. and E. Girard, 1995. Water-vapor temperature feedback
A Workshop on Techniques and Associated Uncertainties in Quan-
in the formation of continental arctic air: implications for climate.
tifying the Origin and Long-Range Transport of Contaminants to
Science of the Total Environment, 160/161:793-802.
the Arctic, Annex 15, 1-5. Report and extended abstracts. Bergen,
Blanchet, J.-P. and R. List, 1987. Estimation of optical properties of
14-16 June 1999.
Arctic haze using a numerical model. Atmosphere-Ocean, 21:444-
Christensen, J.H., J. Brandt, L.M. Frohn and H. Skov, 2004. Modelling
464.
of mercury in the Arctic with the Danish Eulerian Hemispheric
Blaustein, A.R., J.M. Romansic, J.M. Kiesecker and A.C. Hatch, 2003.
Model. Atmospheric Chemistry and Physics, 4:2251-2257.
Ultraviolet radiation, toxic chemicals and amphibian population
Clancy, L., P. Goodman, H. Sinclair and D.W. Dockery, 2002. Effect of
declines. Diversity and Distributions, 9:123-140.
air-pollution control on death rates in Dublin, Ireland: an inter-
Bobbink, R., M. Ashmore, S. Braun, W. Fl■ckiger and I.J.J. Van den
vention study. Lancet, 360:1210-1214.
Wyngaert, 2002. Empirical nitrogen critical loads for natural and
Clark, K.L. and R.J. Hall, 1985. Effects of elevated hydrogen ion and
semi-natural ecosystems: 2002 update. Background document for
aluminum concentration on the survival of amphibian embryos
the Expert Workshop on Empirical Critical Loads for Nitrogen on
and larvae. Canadian Journal of Zoology, 63:116-123.
(Semi-)natural Ecosystems Ù Berne Switzerland, 11-13 November.
Clark, K.L. and B. LaZerte, 1985. A laboratory study on the effects of
UN/ECE Convention on Long-range Transboundary Air Pollu-
aluminum and pH on amphibians eggs and tadpoles. Canadian
tion.
Journal of Fisheries and Aquatic Sciences, 42:1544-1551.
Bodhaine, B.A., 1989. Barrow surface aerosol: 1976Ù1986. Atmospheric
Clarke, A.D., 1989. In-situ measurements of the aerosol size distri-
Environment, 23:2357-2369.
butions, physicochemistry, and light absorption properties of
Bodhaine, B.A. and E.G. Dutton, 1993. A long-term decrease in Arctic
Arctic haze. Journal of Atmospheric Chemistry, 9:255-267.
haze at Barrow, Alaska. Geophysical Research Letters, 20:947-
Clarke, A.D. and K.J. Noone, 1985. Soot in the Arctic snowpack:
950.
A cause for perturbation in radiative transfer. Atmospheric Envi-
Boltneva, L.I., A.A. Ignatiev, R.T. Karaban, I.M. Nazarov, I.A. Rudneva
ronment, 19:2045-2053.
and T.I. Sysygina, 1982. Aerosol and gaseous industrial emission
Coppola, E., F. Kucharski, F. Giorgi and F. Molteni, 2005. Bimodality
impact on Northern Taiga Pine Forests. Ecology, 4:37-43. (In Rus-
of the North Atlantic Oscillation in simulations with greenhouse
sian)
gas forcing. Geophysical Research Letters 32:L23709, doi:10.1029/
Borys, R.D., 1989. Studies of ice nucleation by arctic aerosol on AGASP-
2005GL024080.
II. Journal of Atmospheric Chemistry, 9:169-185.
Cornelissen, J.H.C., T.V. Callaghan, J.M. Alatalo, A. Michelsen, E.
Bottenheim, J.B., L.A. Barrie and E. Atlas, 1993. The partitioning of
Graglia, A.E. Hartley, D.S. Hik, S.E. Hobbie, M.C. Press, C.H. Ro-
nitrogen oxides in the lower arctic troposphere during spring 1988.
binson, G.H.R. Henry, G.R. Shaver, G.K. Phoenix, D.G. Jones, S.
Journal of Atmospheric Chemistry, 17:15-28.
Jonasson, F.S. Chapin III, U. Molau, C. Neill, J.A. Lee, J.M. Melillo,
Bowling, S.A. and G.E. Shaw, 1992. The thermodynamics of pollution
B. Sveinbj—rnsson and R. Aerts, 2001. Global change and arctic
removal as an indicator of possible source areas for Arctic Haze.
ecosystems: is lichen decline a function of increases in vascular
Atmospheric Environment, 26A:2953-2961.
plant biomass? Journal of Ecology, 89:984-994.
Boyd, R.S. and S.N. Martens, 1994. Nickel hyperaccumulated by Thlaspi
Curry, J.A., 1995. Interactions among aerosols, clouds, and climate of
montanum var. montanum is acutely toxic to an insect herbivore.
the Arctic Ocean. Science of the Total Environment, 160/161:777-
Oikos, 70:21-25.
791.
Brakefield, P.M., 1987. Industrial melanism: do we have the answer?
Curry, J.A. and G.F. Herman, 1985. Infrared radiative properties of
Trends in Ecology and Evolution, 2:117-121.
Arctic stratus clouds. Journal of Climate and Applied Meteorolo-
Brigham, L. and B. Ellis (eds), 2004. Arctic Marine Transport Workshop.
gy, 24:525-538.
Proceedings of a Workshop (Cambridge, UK, 28-30 September
Damoah, R., N. Spichtinger, C. Forster, P. James, I. Mattis, U. Wandin-
2004). Institute of the North/US Arctic Research Commission/
ger, S. Beirle and A. Stohl, 2004. Around the world in 17 days Ù
IASC. 18+31p.
hemispheric-scale transport of forest fire smoke from Russia in
Brock, C.A., L.F. Radke, J.H. Lyons and P.V. Hobbs, 1989. Arctic hazes
May 2003. Atmospheric Chemistry and Physics, 4:1311-1321.
in summer over Greenland and the North American Arctic, I, In-
Danielson, R.M. and S. Visser, 1989. Effects of forest soil acidification
cidence and origins. Journal of Atmospheric Chemistry, 9:129-
on ectomycorrhizal and vesicular-arbuscular mycorrhizal deve-
148.
lopment. New Phytologist, 112:41-47.
Brook, J.R., 1995. Wet acid deposition episodicity in eastern North
Dauvalter, V., 1995. Influence of pollution and acidification on metal
America and the influence of deposition episodes on annual dep-
concentrations in Finnish Lapland lake sediments. Water Air and
osition amounts. Atmospheric Environment, 29:1795-1807.
Soil Pollution, 85:853-858.
Brooks, S.J. and H.J.B. Birks, 2004. The dynamics of Chironomidae
Dauvalter, V., 1997. Metal concentrations in sediments in acidifying
(Insecta: Diptera) assemblages in response to environmental
lakes in Finnish Lapland. Boreal Environment Research, 2:369-
change during the past 700 years on Svalbard. Journal of Paleolim-
379.
nology, 31:483-498.
Dauvalter, V., 2003. Impact of mining and refining on the distribution
Brunekreef, B. and S.T. Holgate, 2002. Air pollution and health. Lancet,
and accumulation of nickel and other heavy metals in sediments
360:1233-1242.
of subarctic Lake Kuetsjðrvi, Murmansk Region, Russia. Journal
Brunner, I., 2001. Ectomycorrhizas: their role in forest ecosystems un-
of Environmental Monitoring, 5:210-215.
der the impact of acidifying pollutants. Perspectives in Plant Ecol-
Dauvalter, V.A. and S. Rognerud, 2001. Heavy metal pollution in se-
ogy, Evolution and Systematics, 4:13-27.
diments of the Pasvik River drainage. Chemosphere, 42:9-18.
Byrne, R.H., J.G. Acker, B.R. Betzer, R.A. Feely and M.H. Cates, 1984.
de Caritat, P., M. áyrðs, H. Niskavaara, V. Chekushin, I. Bogatyrev and
Water column dissolution of aragonite in the Pacific Ocean.
C. Reimann, 1998. Snow composition in eight catchments in the
Nature, 312:321-326.
central Barents Euro-Arctic Region. Atmospheric Environment,
Caldeira, K. and M.E. Wickett, 2003. Anthropogenic carbon and ocean
32:2609-2626.
pH. Nature, 425:365-365.
de Caritat, P., G. Hall, S. Gislason, W. Belsey, M. Braun, N.I. Goloube-
Callaghan, V., 2005. Chapter 7. Arctic Tundra and Polar Desert Ecosys-
va, H.K. Olsen, J.O. Scheie and J.E. Vaive, 2005. Chemical compo-
tems. In: Arctic Climate Impact Assessment, pp. 243-352. Cam-
sition of arctic snow: concentration levels and regional distributi-
bridge University Press.
on of major elements. Science of The Total Environment, 336:183-
Carlson, T.N., 1981. Speculations on the movement of polluted air to
199.
the Arctic. Atmospheric Environment, 15:1473-1477.
Denison, L, R. Simpson, A. Petroeschevsky, L. Thalib and G. Williams,
Cess, C.R., 1983. Arctic aerosol: model estimates of the interactive influ-
2001. Ambient air pollution and daily hospital admissions in
ences upon the surface-troposphere radiation budget. Atmos-
Melbourne 1994-1997. Melbourne: EPA Victoria; 2001 November.
pheric Environment, 17:2555-2564.
Report No. 789.
Chapman, W.E. and J.E. Walsh, 1993. Recent variations in sea ice and
Department of Environment, 2003. Research on air pollution in Perth,
air temperature in high latitudes. Bulletin of the American Mete-
morbidity and mortality: A case-crossover analysis 1992Ù1997.
orological Society, 74:33-47.
Technical Series 114. Government of Western Australia.
Chertov, O.G., M. Nadporozshkaya, I. Lapshina and O. Grigorieva,
Deyeva, N.M. and E.A. Maznaja, 1993. The state of the bilberry in
1993. Soil degradation in surrounding of "Pechenganikel" smelter
polluted and unpolluted forests of the Kola Peninsula. In: M.V.
complex. In: M.V. Kozlov, E. Haukioja and V.T. Yarmishko (eds.).
Kozlov, E. Haukioja and V.T. Yarmishko (eds.). Aerial pollution on
Aerial Pollution on Kola Peninsula, pp.159-162. Proceeding of the
Kola Peninsula, pp. 308-311. Proceedings of the International
International Workshop, April 14-16 1992. St. Petersburg. Kola
Workshop, April 14-16 1992. St. Petersburg. Kola Science Centre,
Science Centre, Apatity.
Apatity.
Christensen, J., 1997. The Danish Eulerian Hemispheric Model -
Dibb, J.E., L.D. Meeker, R.C. Finkel, J.R. Southon, M.W. Caffee and
101
References
L.A. Barrie, 1994. Estimation of the stratospheric input to the Arctic
Council of Ministers, Copenhagen.
troposphere: 7Be and 10Be in aerosols at Alert, Canada. Journal of
Erkinaro, H., J. Erkinaro, M. Rask and E. Niemelð, 2001. Status of
Geophysical Research, 99:12855-12864, doi:10.1029/94JD00742.
zoobenthos and fish populations in subarctic rivers of northern-
Dibb, J.E., R.W. Talbot, S.I. Whitlow, M.C. Shipham, J. Winterle, J. Mc-
most Finland: possible effects of acid emissions from Russian Ko-
Connell and R. Bales, 1996. Biomass burning signatures in the
la Peninsula. Water Air and Soil Pollution, 130:831-836.
atmosphere and snow at Summit, Greenland: An event on 5
Erola, U.-R., 1999. Herkðt pohjoiset alueet ilmastonmuutoksen kuvas-
August 1994. Atmospheric Environment, 30:553-561.
tajina Ù piilevðstratigrafinen tutkimus subarktisista lammista Kil-
Dibb, J.E., R.W. Talbot, E. Scheuer, G. Seid, L. DeBell, B. Lefer and B.
pisjðrvellð. Unpublished M.Sc. Thesis, University of Helsinki,
Ridley, 2003. Stratospheric influence on the northern North Ame-
Helsinki, Finland, 90p.(In Finnish).
rican free troposphere during TOPSE: 7Be as a stratospheric tracer.
Evans, C.D. and D. Monteith, 2001. Trends in surface water chemistry
Journal of Geophysical Research, 108:8363, doi:10.1029/
at AWMN sites 1988Ù2000: Evidence for recent recovery at a na-
2001JD001347.
tional scale. Hydrology and Earth System Sciences, 5:351-366.
Dillon, P.J. and B.D. LaZerte, 1992. Response of Plastic Lake catchment,
Evans, C.D., J. Cullen, C. Alewell, J. KopÃcek, A. Marchetto, F. Moldan,
Ontario, to reduced sulphur deposition. Environmental Pollution,
A. Prechtel, M. Rogora, J. Vesely and R.F. Wright, 2001. Recovery
77:211-217.
from acidification in European surface waters. Hydrology and
Dillon, P.J., H.E. Evans and P.J. Scholer, 1988. The effects of acidificati-
Earth System Sciences, 5:283-298.
on on metal budgets of lakes and catchments. Biogeochemistry,
Evans, C.D., C. Freeman, D. Monteith, B. Reynolds and N. Fenner, 2002.
5:201-220.
Climate change Ù terrestrial export of organic carbon: Communi-
Dillon, P.J., L.A. Molot and M. Futter, 1997. The effect of El Niþo-rela-
cation arising. Nature, 415:861-862.
ted drought on the recovery of acidified lakes. Environmental
Evans, C.D., D.T. Monteith and D.M. Cooper, 2005. Long-term increa-
Monitoring and Assessment, 46:105-111.
ses in surface water dissolved organic carbon: Observations, pos-
Disney, R.H.L., E.L. Zvereva and M. Mostovsky, 2001. A scuttle fly
sible causes and environmental impacts. Environmental Pollution,
(Diptera: Phoridae) parasitizing a beetle (Coleoptera: Chrysome-
137:55-71.
lidae) in Russia. Entomologica Fennica, 12:59-63.
Evdokimova, G.A., 2000. The impact of heavy metals on the microbial
DNV, 1999. Reference values for ship pollution. Report 99-2034. Det
diversity of podzolic soils in the Kola Peninsula. Forest dynamics
NorskeVeritas, Norway.
in heavily polluted regions. Report no. 1 of the IUFRO Task Force
DNV, 2003. Utredning av helÍrig petroleumsvirksomhet i omrÍdet
on Environmental Change. pp. 67-76.
Lofoten Ù Barentshavet: Konsekvenser for og fra skipstrafikk. ULB
Evdokimova, G.A., 2001. Fluorine in the soils of the White Sea Basin
Studie Nr. 14, Rapport 2003-0331.Det Norske Veritas, Norway.
and bioindication of pollution. Chemosphere, 42:35-43.
Doka, S.E., D.K. McNicol, M.L. Mallory, I. Wong, C.K. Minns and N.D.
Evdokimova, G.A., E.V. Beresneva, E.V. Lebedeva and M.V. Scjatkovs-
Yan, 2003. Assessing potential for recovery of biotic richness and
kaja, 2004. The influence of fluorine on the soil fungi of forest
indicator species due to changes in acidic deposition and lake pH
podzols in the impact zone of aluminium plant. Mikologija I Fito-
of five areas of southeastern Canada. Environmental Monitoring
patologija, 38:66-70. (In Russian)
and Assessment, 88:53-101.
Evseev, A.V., V.I. Nikolaev and T.G. Sukhova, 2000. Geochemical pat-
Dotterud, L.K., J.O. Odland and E.S. Falk, 2001. Atopic diseases among
tern in macro and microelements distribution in snow cover and
school children in Nikel, Russia, an Arctic area with heavy air
glaciers of Severnaya Zemlya. Data of Glaciological Studies, 89:11-
pollution. Acta Dermato-Venereologica, 81:198-201.
17.
Douglas, M.S.V., J.P. Smol and W. Blake, Jr., 1994. Marked post-18th
Ferek, R.J., P.V. Hobbs, L.F. Radke, J.A. Herring, W.T. Sturges and G.F.
century environmental change in high-arctic ecosystems. Science,
Cota, 1995. Dimethyl sulfide in the arctic atmosphere. Journal of
266:416-419.
Geophysical Research, 100:26093-26104.
Douglas, T.A. and M. Sturm, 2004. Arctic haze, mercury, and the chem-
Findlay, S.E.G., 2005. Increased carbon transport in the Hudson River:
ical composition of snow across northwestern Alaska. Atmos-
unexpected consequence of nitrogen deposition? Frontiers in Eco-
pheric Environment, 38:805-820.
logy and the Environment, 3:133-137.
Downing, R.J., J.-P. Hettelingh and P.A.M. de Smet, 1993. Calculation
Fjeld, E., S. Rognerud and E. Steinnes, 1994. Influence of environmen-
and mapping of critical loads in Europe: Status report 1993. Coor-
tal factors on heavy metal concentration in lake sediments in sout-
dination Center for Effects, National Institute for Public Health
hern Norway indicated by path analysis. Canadian Journal of
and Environmental Protection, Bilthoven, The Netherlands.
Fisheries and Aquatic Sciences, 51:1708-1720.
Dudley, N. and S. Stolton, 1996. Air pollution and Biodiversity: a re-
Flanagan, K.M., E. McCauley, F. Wrona and T. Prowse, 2003. Climate
view. WWF International.
change: the potential for latitudinal effects on algal biomass in
Duff, K.E., T.E. Laing, J.P., Smol and D.R.S. Lean, 1998. Limnological
aquatic ecosystems. Canadian Journal of Fisheries and Aquatic
characteristics of lakes located across arctic treeline in northern
Sciences, 60:635-639.
Russia. Hydrobiologia, 391:205-222.
Folt, C.L., C.Y. Chen, M.V. Moore and J. Burnaford, 1999. Synergism
Duncan, B.N. and I. Bey, 2004. A modeling study of the export path-
and antagonism among multiple stressors. Limnology and Ocea-
ways of pollution from Europe: Seasonal and interannual varia-
nography, 44:864-877.
tions (1987-1997). Journal of Geophysical Research, 109, D08301,
Forsius, M., S. Kleemola, J. Vuorenmaa and S. Syri, 2001. Fluxes and
doi:10.1029/2003JD004079.
trends of nitrogen and sulphur compounds at Integrated Monito-
Dutton, E.G., J.J. DeLuisi and B.A. Bodhaine, 1984. Features of aerosol
ring Sites in Europe. Water Air and Soil Pollution, 130:1641-1648.
optical depth observed at Barrow, March 10-20, 1983. Geophysical
Forsius, M., J. Vuorenmaa, J. Mannio and S. Syri, S. 2003. Recovery
Research Letters, 11:385-388.
from acidification of Finnish lakes: regional patterns and relation
Eckhardt, S., A. Stohl, S. Beirle, N. Spichtinger, P. James, C. Forster, C.
to emission reduction policy. Science of The Total Environment,
Junker, T. Wagner, U. Platt and S.G. Jennings, 2003. The North
310:121-132.
Atlantic Oscillation controls air pollution transport to the Arctic.
Forster, C., U. Wandinger, G. Wotawa, P. James, I. Mattis, D. Althausen,
Atmospheric Chemistry and Physics, 3:1769-1778.
P. Simmonds, S. O'Doherty, C. Kleefeld, S.G. Jennings, J. Schneider,
Eeva, T., E. Lehikoinen and M. Nikinmaa, 2003. Pollution-induced
T. Trickl, S. Kreipl, H. Jðger and A. Stohl, 2001. Transport of boreal
nutritional stress in birds: An experimental study of direct and
forest fire emissions from Canada to Europe. Journal of Geophy-
indirect effects. Ecological Applications, 13:1242-1249.
sical Research, 106:22887-22906.
Eilers, J.M., D.H. Landers, A.D. Newell, M.E. Mitch, M. Morrison and
Foster, J.S., J.W. Winchester and E.G. Dutton, 1992. The date of snow
J. Ford, 1993. Major ion chemistry of lakes on the Kenai Peninsula,
disappearance on the Arctic tundra as determined from satellite,
Alaska. Canadian Journal of Fisheries and Aquatic Sciences,
meteorological station and radiometric in situ observations. IEEE
50:816-826.
Transactions on Geoscience and Remote Sensing, 30:793-798.
Ekimov, S.V., I.V. Samodova, I.M. Petrov, V.V. Troitsky and M.A.
Framstad, E., 2002. Terrestrisk naturovervÍking. Markvegetasjon, epi-
Burstein, 2001. Russian smelter emissions. Mining Journal, Lon-
fytter, smÍgnagere og fugl I TOV-omrÍdene, 2002. Norsk Institutt
don, November 23, 2001, pp. 393.
for Naturforskning, 70p. (In Norwegian)
EMEP, 2004. EMEP Assessment. Part I, European perspective. G. L—v-
Frantzen, B. and A. Bambulyak, 2003. Oil transport from the Russian
blad, L. Tarrason, K. T½rseth and S. Dutchak (eds). Norwegian
part of the Barents Region. On July 2003. Report, Svanhovd Mil-
Meteorological Institute, Oslo.
j½senter, Planteforsk. Barents Secretariat, Norway.
Emery, C.A., R. Haberle and T.P. Ackermann, 1992. A one-dimension-
Freda, J. and D. McDonald, 1990. Effects of aluminum on the leopard
al modeling study of carbonaceous haze effects on the springtime
frog Rana pipiens: life stage comparisons and aluminum uptake.
Arctic environment. Journal of Geophysical Research, 97:20599-
Canadian Journal of Fisheries and Aquatic Sciences, 47:210-216.
20613.
Freedman, B. and S. Beauchamp, 1998. Implications of atmospheric
Erkinaro, J., E. Niemelð, H. Erkinaro and M. Rask, 1992. Monitoring of
change for biodiversity of aquatic ecosystems in Canada. Environ-
the possible effects of acidification on fish populations and zoo-
mental Monitoring and Assessment, 49:271-280.
benthos of rivers and lakes in northeastern Finnish Lapland. In:
Freeman, C., C.D. Evans, D.T. Monteith, B. Reynolds and N. Fenner,
K. Kinnunen and M. Varmola (eds.). Effects of Air Pollutants and
2001. Export of organic carbon from peat soils. Nature, 412:785-
Acidification in Combination with Climatic Factors on Forests,
785.
Soils and Waters in Northern Fennoscandia, pp. 168-171. Nordic
Freeman, C., N. Fenner, N.J. Ostle, H. Kang, D.J. Dowrick, B. Reynolds,
102
AMAP Assessment 2006: Acidifying Pollutants, Arctic Haze, and Acidification in the Arctic
M.A. Lock, D. Sleep, S. Hughes and J. Hudson, 2004. Export of
Mineralogy and mineral chemistry of snow filter residues in the
dissolved organic carbon from peatlands under elevated carbon
vicinity of the nickel-copper processing industry, Kola Peninsula,
dioxide levels. Nature, 430:195-198.
NW Russia. Mineralogy and Petrology, 65:87-111.
Fremstad, E., J. Paal and T. M—ls, 2005. Impacts of increased nitrogen
Grell, G.A., J. Dudhia and D.R. Stauffer, 1994. A description of the
supply on Norwegian lichen-rich alpine communities: a 10-year
fifth-generation Penn State/NCAR mesoscale model (MM5).
experiment. Journal of Ecology, 93:471-481.
NCAR Tech. Note TN-398+STR, 122 pp. [Available from UCAR
Frohn, L.M., J.H. Christensen and J. Brandt, 2002. Development of a
Communications, P.O. Box 3000, Boulder, CO 80307.]
high resolution nested air pollution model Ù the numerical appro-
Gr—nlund, T. and T. Kauppila, 2002. Holocene history of Lake Soldats-
ach. Journal of Computational Physics, 179:68-94.
koje (Kola Peninsula, Russia) inferred from sedimentary diatom
Frohn, L.M., J.H. Christensen, J. Brandt, C. Geels and K.M. Hansen,
assemblages. Boreas, 31:273-284.
2003. Validation of a 3-D hemispheric nested air pollution model.
Guerreiro, C., T. Larssen and P.A. Aarrestad, 2003. Konsekvenser av
Atmospheric Chemistry and Physics Discussions, 3:3543-3588.
utslipp til luft av helÍrig petroleumsvirksomhet I omrÍdet Lofoten
Fromm, M., R. Bevilacqua, R. Servrancks, J. Rosen, J.P. Thayer, J. Her-
Ù Barentshavet. NILU OR 16/2003. (In Norwegian)
man and D. Larko, 2005. Pyro-cumulonimbus injection of smoke
Gytarsky, M.L., R.T., Karaban, I.M. Nazarov, T.I. Sysygina and M.V.
to the stratosphere: Observations and impact of a super blowup
Chemeris, 1995. Monitoring of forest ecosystems in the Russian
in northwestern Canada on 3-4 August 1998. Journal of Geophy-
subarctic: effects of industrial pollution. Science of the Total Envi-
sical Research, 110:D08205, doi:10.1029/2004/JD005350.
ronment, 164:57-68.
Gaare, E. and H. T½mmervik, 2000. Monitoring lichen grazing in East
Gytarsky, M.L., R.T. Karaban and I.M. Nazarov, 1997. On the assess-
Finnmark. NINA Oppdragsmelding 669. Norwegian Institute For
ment of sulphur deposition on forests growing over the areas of
Nature, pp. 1-28.
industrial impact. Environmental Monitoring and Assessment,
Galloway, J.N., 1995. Acid deposition: perspectives in time and space.
48:125-137.
Water, Air and Soil Pollution, 85:15-24.
Hagen, L.O., B. Sivertsen and K. Arnesen, 2005. GrenseomrÍdene i
Garland, J.A., 1977. The dry deposition of sulphur dioxide to land and
Norge og Russland Ù Luft- og nedb½rkvalitet, april 2003-mars
water surfaces. Proceedings of the Royal Society of London A,
2004. Norsk institutt for luftforskning (NILU). Rapport NILU OR
354:245-268.
61/2004. 74 pp. (In Norwegian with English Summary: Air Qua-
Garrett, T.J., L.F. Radke and P.V. Hobbs, 2002. Aerosol effects on the
lity Monitoring in the Border Areas of Norway and Russia - Prog-
cloud emissivity and surface longwave heating in the Arctic. Jour-
ress Report April 2004-March 2005).
nal of Atmospheric Sciences, 59:769-778.
Hðmðlðinen, J. and P. Huttunen, 1998. Macroinvertebrate-inferred
Garrett, T.J., C. Zhao, X. Dong, G.G. Mace and P.V. Hobbs, 2004. Effects
stream-water acidity in north eastern Finland along a sulphur
of varying aerosol regimes on low-level Arctic stratus. Geophysi-
deposition gradient. Water Air and Soil Pollution, 104:223-236.
cal Research Letters, 31, doi:10.1029/2004GL019928.
Hammar, J., 1989. Freshwater ecosystems of polar regions: Vulnerable
Geels, C., S. Doney, R. Dargaville, J. Brandt and J.H. Christensen, 2004.
resources. Ambio, 19:6-22.
Investigating the sources of synoptic variability in atmospheric
Hansen, A.D.A. and H. Rosen, 1984. Vertical distribution of particula-
CO2 measurements over the northern hemisphere continents:
te carbon, sulphur and bromine in the Arctic haze and comparison
A regional model study. Tellus, 56B:35-50.
with ground-level measurements at Barrow, Alaska. Geophysical
Gilbert, R.O., 1987. Statistical methods for environmental pollution
Research Letters, 11:381-384.
monitoring. Van Nostrand Reinhold, 320p.
Hansen, J. and L. Nazarenko, 2004. Soot climate forcing via snow and
Gilmour, C.C. and E.A. Henry, 1991. Mercury methylation in aquatic
ice albedos. Proceedings of the National Academy of Sciences of
systems affected by acid deposition. Environmental Pollution,
the United States of America, 101(2):423-428, doi:10.1073/
71:131-169.
pnas.2237157100
Gilyazov, A.S., 1993. Air pollution impact on the bird communities of
Hansen, K.M., J.H. Christensen, J. Brandt, L.M. Frohn and C. Geels,
the Lapland biosphere reserve. In: M.V. Kozlov, E. Haukioja and
2004. Modelling atmospheric transport of I-hexachlorocyclohexa-
V.T. Yarmishko (eds.). Aerial pollution on Kola Peninsula, pp.
ne in the Northern Hemisphere with a 3-D dynamic model:
383-390. Proceedings of the International Workshop, April 14-16
DEHM-POP. Atmospheric Chemistry and Physics, 4:1-13.
1992, St. Petersburg. Kola Science Centre, Apatity.
Hanski, I., H. Henttonen, E. Korpimðki, L. Oksanen and P. Turchin,
Gilyazov, A.S. and G.D. Kataev, 1990. An experience of zooindication
2001. Small-rodent dynamics and predation. Ecology, 82:1505-
of industrial pollution in the Kola Peninsula. In: Y.D. Nukhimovs-
1520.
kaja and L.A. Bibikova (eds.). Anthropogenic Impacts on the Na-
Hansson, L., 1999. Intraspecific variation in dynamics: small rodents
ture of Reserves. Central Research Laboratory of Game and Re-
between food and predation in changing landscapes. Oikos,
serves, Moscow, pp. 5-24. (In Russian)
86:159-169.
Gilyazova, E.V., 1993. Pollution impact on soil mesofauna of Lapland
Harriman, R., A.W. Watt, A.E.G. Christie, P. Collen, D.W Moore, A.G.
Biosphere Reserve. In: M.V. Kozlov, E. Haukioja, V.T. Yarmishko
McCartney, E.M. Taylor and J. Watson, 2001. Interpretation of
(eds.). Aerial Pollution in the Kola Peninsula, pp. 366-368. Proceed-
trends in acidic deposition and surface water chemistry in Scot-
ings of the International Workshop, April 14-16 1992, St. Petersburg.
land during the last three decades. Hydrology and Earth System
Kola Science Centre, Apatity.
Sciences, 5:407-420.
Girard, E., J.-P. Blanchet and Y. Dubois, 2005. Effects of arctic sulphuric
Havas, M. and T.C. Hutchinson, 1983. The smoking hills: natural aci-
acid aerosols on wintertime low-level atmospheric ice crystals,
dification of an aquatic ecosystem. Nature, 301:23-27.
humidity and temperature at Alert, Nunavut. Atmospheric Rese-
Heidam, N.Z., J. Christensen, P. Wahlin and H. Skov, 2004. Arctic at-
arch, 73:131-148.
mospheric contaminants in NE Greenland: levels, variations, ori-
Givelet, N., F. Roos-Barraclough, M.E. Goodsite, A.K. Cheburkin and
gins, transport, transformations, and trends 1990Ù2001. Science of
W. Shotyk, 2004. Atmospheric mercury accumulation rates bet-
the Total Environment, 331:5-28.
ween 5900 and 800 calibrated years BP in the high arctic of Canada
Heintzenberg, J., 1980. Particle size distribution and optical properties
recorded by peat hummocks. Environmental Science and Techno-
of Arctic haze. Tellus, 32:251-260.
logy, 38:4964-4972.
Heintzenberg, J. and S. Larssen, 1983. SO2 and SO4 in the Arctic. Inter-
Glowacki, P., 1997. The mass balance of Hans glacier in the light of
pretation of observations at three Norwegian Arctic-subarctic
cryochemical investigations. Polish Polar Studies (24th Polar Sym-
stations. Tellus, 35B:255-265.
posium), Warszawa, pp. 75-79.
Heintzenberg, J., T. Tuch, B. Wehner, A. Wiedensohler, A. Ansmann, I.
Gordon, C., J.M. Wynn and S.J. Woodin, 2001. Impacts of increased
Mattis, D. M■ller, M. Wendisch, S. Eckhardt and A. Stohl, 2002.
nitrogen supply on high Arctic heath: the importance of bryophytes
Arctic Haze over Central Europe. Tellus, 55B:796-807.
and phosphorus availability. New Phytologist, 149:461-471.
Heinz, G.H., 1989. How lethal are sublethal effects. Environmental
Gorham, E., 1998. Acid deposition and its ecological effects: a brief
Toxicology and Chemistry, 8:463-464.
history of research. Environmental Science and Policy, 1:153-166.
Hejzlar, J., M. Dubrovsk», J. Buchtele and M. Ruzi ka, 2003. The appa-
Goryainova, V. and V. Nikonov, 1997. Heavy metals in pine ecosystems
rent and potential effects of climate change on the inferred con-
of the Kola Peninsula subjected to acid precipitation. In: K. Aoya-
centration of dissolved organic matter on a temperate stream (The
ma, K. Katoh, T. Murano, T. Paces and Y. Taguchi (eds.). Acid Snow
M lse River, South Bohemia). Science of the Total Environment,
and Rain, pp. 463-467. Proceedings of International Congress of
310:143-152.
Acid Snow and Rain, Niigata University, Japan.
Heli—vaara, K. and R. Vðisðnen, 1993. Insects and Pollution. CRC
Goto-Azuma, K., R.M. Koerner and D.A. Fisher, 2002. An ice core re-
Press.
cord over the last two centuries from Penny Ice Cap, Baffin Island,
Helle, T. and I. Kojola, 1992. Harmaaporonjðkðlðn kasvuvaihtelu Itð-
Canada. Annals of Glaciology, 35:29-35.
Fennoskandiassa. In: H. Kauhanen and M. Varmola (eds.). Itð-
Greenaway, K.R., 1950. Experiences with Arctic flying weather, Royal
Lapin metsðvaurioprojektin vðliraportti. The Lapland Forest Da-
Meteorological Society Canadian Branch, Toronto.
mage Project Ù Interim Report, pp. 106-114. Finnish Forest Rese-
Gregorauskiene, V., R. Salminen, C. Reimann and V. Chekushin, 2000.
arch Institute, Rovaniemi, Research Paper 413. (In Finnish, English
Field Manual for Barents Ecogeochemistry project. Geological
abstract: The variation in the growth rate of Cladonia rangiferina in
Survey of Finland, Report S/44/0000/2/2000.
eastern Fennoscandia).
Gregurek, D., F. Melcher, V. Pavlov, C. Reimann and E.F. Stumpfl, 1999.
Helsel, D.R R.M. and Hirsch, 1995. Statistical Methods in Water Re-
103
References
sources. Studies in Environmental Sciences 49. Elsevier Science
pH 6 as a recovery goal. Ambio, 32:203-207.
B.V.
Hopper, J.E., D.E.J. Worthy, L.A. Barrie and N.B.A. Trivett, 1994. At-
Henriksen, A. and M. Posch, 2001. Steady-state models for calculating
mospheric observations of aerosol black carbon, carbon dioxide
critical loads of acidity for surface waters. Water Air and Soil Pol-
and methane in the High Arctic. Atmospheric Environment,
lution: Focus 1:375-398.
28:3047-3054.
Henriksen, A., L. Lien, T.S. Traaen, I. Sevaldrud and D.F. Brakke, 1988.
H—rnfeldt, B., 2004. Long-term decline in number of cyclic voles in
Lake acidification in Norway Ù present and predicted chemical
boreal Sweden: analysis and presentation of hypotheses. Oikos,
status. Ambio, 17:259-266.
107:376-392.
Henriksen, A., J. Kðmðri, M. Posch and A. Wilander, 1992. Critical loads
Hughes, P.R., 1988. Insect populations on host plants subjected to air
of acidity: Nordic surface waters. Ambio, 21:356-363.
pollution. In: E.A. Heinrichs (ed.). Plant StressÙInsect Interactions,
Henriksen, A., J. Kðmðri, M. Posch, M. Forsius, A. Wilander, H. Baxe-
pp. 249-319. J. Wiley and Sons.
ndale and T. Tarvainen, 1994. Critical loads for acidification of
Hurrell, J.W. and H. van Loon, 1997. Decadal variations in climate
surface waters in Northern Fennoscandia (Nordkalotten): Nord-
associated with the North Atlantic Oscillation. Climatic Change,
kalottkommiteens publikasjonsserie Rapport 33.
36:301-326.
Henriksen, A., B.L. SkjelkvÍle, J. Mannio, A. Wilander, J.P. Jensen, T.
Ilyashuk, B.P. and E.A. Ilyashuk, 2001. Response of alpine chironomid
Moiseenko, R. Harriman, T.S. Traaen, E. Fjeld, J. Vuorenmaa, P.
communities (Lake Chuna, Kola Peninsula, northwest Russia) to
Kortelainen and M. Forsius, 1997a. Results of national lake surve-
atmospheric contamination. Journal of Paleolimnology, 25:467-
ys 1995 in Finland, Norway, Sweden, Denmark, Russian Kola,
475.
Russian Karelia, Scotland and Wales, Report 47/97. Norwegian
Ilyashuk, B.P., E.A. Ilyashuk and V.A. Dauvalter, 2003. Chironomid
Institute of Water Research, Oslo, Norway, 43p.
responses to long-term metal contamination: a paleolimnological
Henriksen, A., J. Mannio, A. Wilander, T. Moiseenko, T.S. Traaen, B.L.
study in two bays of Lake Imandra, Kola Peninsula, northern
SkjelkvÍle, E. Fjeld and J. Vuorenmaa, 1997b. Regional Lake Sur-
Russia. Journal of Paleolimnology, 30:217-230.
veys in The Barents region of Finland Ù Norway Ù Sweden and
Isaeva, L., 2004. Influence of air pollution on species diversity of aphyl-
Russian Kola 1995 Ù Results. NIVA-report SNO 3633-97, Acid Rain
lophoraceous fungi. In: V. Kulikov, V. Razumovskij, O. Chervya-
Research Report 45/97. 36p.
kov and O. Kislova (eds.). Man and environment in the Barents
Henriksen, A., B.L. SkjelkvÍle, J. Mannio, A. Wilander, R. Harriman,
region at the threshold of the XXI century, pp. 180-182. Internatio-
C. Curtis, J.P. Jensen and T. Moiseenko, 1998. Northern European
nal Conference Proceedings, Aug. 6-11, 2001. Karelian Research
Lake Survey Ù 1995. Finland, Norway, Sweden, Denmark, Russian
Centre, Russian Academy of Sciences, Petrozavodsk. (In Russi-
Kola Russian Karelia, Scotland and Wales. Ambio, 27:80-91.
an)
Herber, A., L.W. Thomason, H. Gernandt, U. Leiterer, D. Nagel, K.-H.
Isaksson, E., M. Hermanson, S. Hicks, M. Igarashi, K. Kamiyama, J.
Schulz, J. Kaptur,T. Albrecht and J. Not, 2002. Continuous day and
Moore, H. Motoyama, D. Muir, V. Pohjola, R. Vaikmae, R.S.W. van
night aerosol optical depth observations in the Arctic between 1991
de Wal and O. Watanabe, 2003. Ice cores from Svalbard Ù useful
and 1999. Journal of Geophysical Research, 107(D10):
archives of past climate and pollution history. Physics and Che-
10.1029/2001JD000536.
mistry of the Earth, 28:1217-1228.
Hesthagen, T., H.M. Berger and B.M. Larsen, 1992. Fish population
Ivarsson, H. and M. Jansson, 1995. Sources of acidity in running waters
studies in acid-sensitive areas in eastern Finnmark, northern Nor-
in Central-Northern Sweden. Water, Air and Soil Pollution, 84:233-
way. In: K. Kinnunen and M. Varmola (eds.). Effects of Air Pollu-
251.
tants and Acidification in Combination with Climatic Factors on
Iversen, T., 1984. On the atmospheric transport of pollution to the
Forests, Soils and Waters in Northern Fennoscandia, pp. 172-176.
Arctic. Geophysical Research Letters, 11:457-460.
Nordic Council of Ministers, Copenhagen.
Iversen, T. and E. Joranger, 1985. Arctic air pollution and large scale
Hesthagen, T., A. Langeland and H.M. Berger, 1998. Effects of acidifi-
atmospheric flows. Atmospheric Environment, 19:2099-2108.
cation due to emissions from the Kola Peninsula on fish popula-
Jackson, T.A., 1997. Long range atmospheric transport of mercury in
tions in lakes near the Russian border in northern Norway. Water
ecosystems, and the importance of anthropogenic emissions: A
Air and Soil Pollution, 102:17-36.
critical review and evaluation of the published evidence. Environ-
Hettelingh J.-P., M. Posch and P.A.M. De Smet, 2001. Multi-effect cri-
mental Reviews, 5:99-120.
tical loads used in multi-pollutant reduction agreements in Euro-
Jaffe, D., T. Iversen and G. Shaw, 1995. Comment on "A long term
pe. Water Air and Soil Pollution, 130:1133-1138.
decrease in arctic haze at Barrow, Alaska" by B.A. Bodhaine and
Hettelingh, J.-P., Slootweg, J., and M. Posch, 2004. Critical Loads and
E.G. Dutton. Geophysical Research Letters, 22:739-740.
Dynamic Modelling Results. 259101014/2004, RIVM, Bilthoven.
James, P., A. Stohl, C. Forster, S. Eckhardt, P. Seibert and A. Frank, 2003.
134p.
A 15-year climatology of stratosphere-troposphere exchange with
Hillamo, R.E., V.-M. Kerminen, W. Maenhaut, J.-L. Jaffrezo, S. Bala-
a Lagrangian particle dispersion model: 2. Mean climate and
chandran and C.I. Davidson, 1993. Size distributions of atmosphe-
seasonal variability. Journal of Geophysical Research, 108:8522,
ric trace elements at Dye 3, Greenland Ù 1. Distribution characte-
doi:10.1029/2002JD002639.
ristics and dry deposition velocities. Atmospheric Environment,
Jeffrey, S.K., S.A. Norton, T.A. Haines, E.A. Rochette, R.H. Heath and
27A:2787-2803.
S.C. Nodvin, 1992. Mechanisms of episodic acidification in low-
Hilmo, O. and H.C. Larsen, 1994. Morphology of epiphytic lichens in
order streams in Maine, USA. Environmental Pollution, 78:37-
areas with different air quality. Stiftelsen Forskning I Trondheim,
44.
Universitetet Trondheim, ALLFORSK Report 2, pp. 1-44.
Jeffries, D.S., 1995. A preliminary assessment of nitrogen-based fresh
Hirsch, R.M., J.R. Slack and R.A. Smith, 1982. Techniques of trend
water acidification in southeastern Canada. Water, Air and Soil
analysis for monthly water quality analysis. Water Resources Re-
Pollution, 85:433-438.
search, 18:107-121.
Jeffries, D.S. (ed.), 1997. Canadian acid rain assessment, Vol. 3: The
Hobbie, J.E., 1984. Polar limnology. In: F.E. Taub (ed.). Ecosystems of
Effects on Canada's Lakes, Rivers and Wetlands. Environment,
the World. 23. Lakes and Rivers. Science Publication 22, Elsevier.
Ottawa, Ontario. 178p.
Hobbie, J.E., B.J. Paterson, N. Bettez, L. Deegan, W.J. O'Brien, G.W.
Jeffries, D.S., T.A. Clair, S. Couture, P.J. Dillon, J. Dupont, W. Keller,
Kling, G.W. Kipphut, W.B. Bowden and A.E. Hershey, 1999. Impact
D.K. McNicol, M.A. Turner, R. Vet and R. Weeber, 2003. Assessing
of global change on the biogeochemistry and ecology of an Arctic
the recovery of lakes in Southeastern Canada from the effects of
freshwater system. Polar Research, 18:207-214.
acid deposition. Ambio, 32:176-182.
Hobbs, P.V. and A.L. Rangno, 1998. Microstructures of low and middle-
Jenkins, A., L. Camarero, B.J. Cosby, R. Ferrier, M. Forsius, R. Helliwell,
level clouds over the Beaufort Sea. Quarterly Journal of the Royal
J. Kopacek, V. Majer, F. Moldan. M. Posch, M. Rogara, W. Sch—pp
Meteorological Society, 124:2035-2071.
and R.F. Wright, 2003. A modelling assessment of acidification and
Hoff, R.M., 1988. Vertical structure of Arctic haze observed by Lidar.
recovery of European surface waters. Hydrology and Earth Sys-
Journal of Applied Meteorology, 27:125-139.
tem Sciences, 7:447-455.
Hoff, R.M., W.R. Leaitch, P. Fellin and L.A. Barrie, 1983. Mass-size
Jerre, J., 1994. Mapping terrestrial effects in the border area. Summary
distributions of chemical constituents of the winter Arctic aerosol.
of activities and results. In: B. Sivertsen (ed.). Air pollution prob-
Journal of Geophysical Research, 88:10947-10956.
lems in the northern region of Fennoscandia included Kola, pp.
H½gda, K.A., H. T½mmervik, I. Solheim and Ä. Marhaug, 1995. Use of
151-156. Proceedings from the Seminar at Svanvik, Norway, 1-3
multitemporal Landsat image data for mapping the effects from
June 1993.
air pollution in the Kirkenes-Pechenga area in the period 1973-
Jones, V.J. and H.J.B. Birks, 2004. Lake-sediment records of recent en-
1994. University of Troms½, Foundation for applied Research,
vironmental change on Svalbard: results of diatom analysis. Jour-
NORUT-IT Report, IT2039/1-95.
nal of Paleolimnology, 31:445-466.
Holopainen, T., H. Heinonen-Tanski and A. Halonen, 1996. Injuries to
Joynt, E.H. and A.P. Wolfe, 2001. Paleoenvironmental inference models
Scots pine mycorrhizas and chemical gradients in forest soil in the
from sediment diatom assemblages in Baffin Island lakes (Nuna-
environment of a pulp mill in Central Finland. Water, Air and Soil
vut, Canada) and reconstruction of summer water temperature.
Pollution, 87:111-130.
Canadian Journal of Fisheries and Aquatic Sciences, 58:1222-
Holt, C. and N.D. Yan, 2003. Recovery of crustacean zooplankton com-
1243.
munities from acidification in Killarney Park, Ontario, 1971-2000:
Julin, A.C., 2003. Atmospheric transport of nitrate to Svalbard, a trajec-
104
AMAP Assessment 2006: Acidifying Pollutants, Arctic Haze, and Acidification in the Arctic
tory and model study. Master thesis, University of Stockholm. (In
Kataev, G.D., J. Suomela and P. Palokangas, 1994. Densities of micro-
Swedish).
tine rodents along a pollution gradient from a copper-nickel smel-
Kðhk—nen, A.-M., 1996. Soil geochemistry in relation to water chem-
ter. Oecologia, 97:491-498.
istry and sensitivity to acid deposition in Finnish Lapland. Water,
Kattsov, V.M. and E. KðllÕn, 2005. Chapter 4. Future climate change:
Air and Soil Pollution, 87:311-327.
modeling and scenarios for the Arctic. In: Arctic Climate Impact
Kahl, J.D., 1990. Characteristics of the low-level temperature inversion
Assessment, pp. 99-150. Cambridge University Press.
along the Alaskan Arctic coast, International Journal of Climatol-
Kawamura, K., H. Kasukabe and L.A. Barrie, 1996. Source and reacti-
ogy, 10:537-548.
on pathways of dicarboxylic acids, ketoacids, and dicarbonyls in
Kahl, J.D. and A.D.A. Hansen, 1989. Determination of regional sourc-
Arctic aerosols: One year of observations. Atmospheric Environ-
es of aerosol black carbon in the Arctic. Geophysical Research
ment, 30:1709-1722.
Letters, 16:327-330.
Kekonen, T., J.C. Moore, R. Mulvaney, E. Isaksson, V. Pohjola and R.
Kalabin, G., 1991. Ecological situation in the Pechenga Region. Report
S.W. v.d Wal, 2002. An 800 year record of nitrate from the Lomo-
INEP, Kola Science Center, Apatity, Russia.
nosovfonna ice core, Svalbard. Annals of Glaciology, 35:261-265.
Kalela, O., 1957. Regulation of reproduction rate in sub-arctic popula-
Keller, W., N.D. Yan, K.M. Somers and H. Heneberry, 2002. Crustacean
tions of the vole Clethrionomys rufocanus (Sund.). Annales Acade-
zooplankton communities in lakes recovering from acidification.
miae Scientiarum Fennicae, Series A, IV Biologica, 34:1-60.
Canadian Journal of Fisheries and Aquatic Science, 59:726-735.
Kðmðri, J. (ed.), 1998. Acidifying Pollutants, Arctic Haze, and Acidifi-
Kellogg, W.W., 1995. Contaminants affecting the Arctic climate, and
cation in the Arctic. In: AMAP Assessment Report: Arctic Polluti-
the role of the oceans. Science of the Total Environment,
on Issues, Chapter 9, pp. 621-659. Arctic Monitoring and Assess-
160/161:769-775.
ment Programme, Oslo.
Kim, Y., H. Hatsushika, R.R. Muskett and K. Yamazaki, 2005. Possible
Kapitsa, A.P. and E.I. Golubeva, 1997. The structure of tundra plant
effect of boreal wildfire soot on Arctic sea ice and Alaska glaciers.
cover as an ecological indicator in the Kola Peninsula. In: R.M.M.
Atmospheric Environment, 39:3513-3520.
Crawford (ed.). Disturbance and Recovery in Arctic Lands. NATO
Kinnunen, K., 1992. Acidification of waters in Finnish Lapland. In: K.
ASI Series, Kluwer Academic Publishers, 620p.
Kinnunen, M. Varmola (eds.). Effect of Air and Acidification in
Kaplan, J.O., N.H. Bigelow, I.C. Prentice, S.P. Harrison, P.J. Bartlein,
Combination with Climatic Factors on Forest, Soils and Waters in
T.R. Christensen, W. Cramer, N.V. Matveyeva, A.D. McGuire, D.
Northern Fennoscandia, pp. 72-78. Nordic Council of Ministers.
F. Murray, V.Y, Razzhivin, B. Smith, D.A. Walker, P.M. Anderson,
Kirtsideli, I.J., N.I. Vorobeva and O.M. Tereshenkova, 1995. Influence
A.A. Andreev, L.B. Brubaker, M.E. Edwards and A.V. Lozhkin,
of industrial pollution on the communities of soil micromycetes
2003. Climate change and Arctic ecosystems: 1. Modeling, paleo-
of forest tundra in Taimyr Peninsula. Mikologiya i Fitopatologiya
data-model comparisons, and future projections. Journal of
(Mycology and phytopathology), 29:12-19.
Geophysical Research, 108(D19):8171, doi:10.1029/
Kjellstr—m, T.E., A. Neller and R.W. Simpson, 2002. Air pollution and
2002JD002559.
its health impacts: the changing panorama. Medical Journal of
Karaban, R.T., I.M. Nazarov and N.P. Pavlinov, 1988. Principles of the
Australia, 177:604-608.
environmental pollution and plant state integrated impact moni-
Klonecki, A., P. Hess, L. Emmons, L. Smith, J. Orlando and D. Blake,
toring. Inst. Appl. Geophys. Proc. 72:4-10. (In Russian)
2003. Seasonal changes in the transport of pollutants into the Arctic
Kashulina, G.M., 2002. Anthropogenic transformation of soils in su-
troposphere- model study. Journal of Geophysical Research,
barctic European region. Kola Science Centre, Apatity, Russia. Part
108:8367, doi:10.1029/2002JD002199.
1, 158 pp., Part 2, 234 pp. (In Russian)
Koch, D. and J. Hansen, 2005. Distant origins of Arctic black carbon: A
Kashulina, G. and V. Gregorauskiene, 2000. Complete soil profiles Ù
Goddard Institute for Space Studies ModelE experiment. Journal
technical report from the catchment stage of BARENTS Ecogeoche-
of Geophysical Research, 100, D04204, doi:10.1029/
mistry project. Geological Survey of Finland, Report No.
2004JD005296.
S/41/0000/11/2000.
Koneva, G.G., 1993. Changes in soil macrofauna around "Severonikel"
Kashulina, G. and C. Reimann, 2001. Sulphur in the Arctic environment
smelter complex,. In: M.V. Kozlov, E. Haukioja and V.T. Yarmishko
(1): results of a catchment-based multi-medium study. Environ-
(eds.). Aerial pollution on Kola Peninsula, pp. 362-364. Procee-
mental Pollution, 114:3-19.
dings of the International Workshop, April 14-16 1992, St. Peters-
Kashulina, G. and C. Reimann, 2002. Sulphur in the Arctic environment
burg. Kola Science Centre, Apatity.
(2): results of multi-medium regional mapping. Environmental
Koneva, G.G. and S. Koponen, 1993. Density of ground-living spiders
Pollution, 116:337-350.
(Araneae) near smelter in Kola Peninsula. In: M.V. Kozlov, E. Hau-
Kashulina, G., C. Reimann, T.E. Finne, J.H. Halleraker, M. áyrðs and
kioja and V.T. Yarmishko (eds.). Aerial pollution on Kola Peninsu-
V.A. Chekushin, 1997. The state of ecosystems in the central Ba-
la, pp. 365. Proceedings of the International Workshop, April 14-16
rents Region: scale, factors and mechanism of disturbance. Scien-
1992, St. Petersburg. Kola Science Centre, Apatity.
ce of the Total Environment, 206:203-225.
Koponen, S., 2005. Spiders (Araneae) along a pollution gradient. In: C.
Kashulina, G., C. Reimann, T.E. Finne, P. de Caritat and H. Niskavaa-
Deltschev (ed.). 22nd European Colloquium of Arachnology, 1-6
ra, 1998a. Factors influencing NO3 concentrations in rain, stream
August 2005, Blagoevgrad, Bulgaria, p. 36. Institute of Zoology &
water, ground water and podzol profiles of eight small catchments
National Museum of Natural History, Bulgarian Academy of
in the European Arctic. Environmental Pollution, 102:559-568.
Sciences.
Kashulina, G., M.-L. Rðisðnen, C. Reimann, P. de Caritat and I. Boga-
Koptsik, G. and S. Koptsik, 1995. Critical loads of acid deposition for
tyrev, 1998b. Acidity status and mobility of Al in podzols near SO2
forest ecosystems in the Kola Peninsula. Water, Air and Soil Pol-
emission sources on the Kola Peninsula, NW Russia. Applied
lution, 85:2553-2558.
Geochemistry, 13/3:391-402.
Koptsik, G. and I. Muchina, 1995. Effect of acid deposition on acidity
Kashulina, G., C. Reimann and D. Banks, 2003. Sulphur in the Arctic
and exchangeable cations in the podzols of Kola Peninsula. Water,
environment (3). environmental impact. Environmental Pollution,
Air and Soil Pollution, 85:1209-1214.
124:151-171.
Koptsik, G.N., S.V. Koptsik and D. Aamlid, 1999a. Transformation of
Kasischke, E.S., E.J. Hyer, P.C. Novelli, L.P. Bruhwiler, N.H.F. French,
the elemental composition of plants in northern taiga biogeo-
A.I. Sukhinin, J.H. Hewson and B.J. Stocks, 2005. Influences of
coenoses under air pollution impact. Moscow University Soil
boreal fire emissions on Northern Hemisphere atmospheric carbon
Science Bulletin, 54:39-51.
and carbon monoxide. Global Biogeochemical Cycles, 19, GB1012,
Koptsik, G.N., S.V. Koptsik, K. Venn, D. Aamlid, L. Strand and M.A.
doi:10.1029/2004GB002300.
Zhuravleva, 1999b. Variations in acidity and cation exchange pro-
Kaste, Ä. and B.L. SkjelkvÍle, 2002. Nitrogen dynamics in runoff from
perties of forest soils under impact of acid atmospheric precipita-
two small heathland catchments representing opposite extremes
tion. Eurasian Soil Science, 32:787-798.
with respect to climate and N deposition in Norway. Hydrology
Koptsik, G.N., S.V. Koptsik and D. Aamlid, 2001. Pine needle chemistry
and Earth System Sciences, 6:351-362.
near a large point SO2 source in northern Fennoscandia. Water, Air
Kataev, G.D., 1995. Small mammals. In: W.W. Sytchev (ed.). Forest
and Soil Pollution, 130:929-934.
ecosystems of Kola Peninsula under atmospheric pollution in-
Koptsik, S., G. Koptsik, S. Livantsova, L. Eruslankina, T. Zhmelkova
fluence of smelters, pp. 102-110. Russian Academy of Sciences. St.
and Zh. Vologdina, 2003. Heavy metals in soils near the nickel
Petersburg, Russia. (In Russian)
smelter: chemistry, spatial variation, and impacts on plant diver-
Kataev, G.D. and O.A. Makarova, 1984. Changes in fauna of terrestrial
sity. Journal of Environmental Monitoring, 5:441-450.
vertebrates of the Lapland reserve during a half of century. In: V.V.
Korhola, A. and J. Weckstr—m, 2004. Paleolimnological studies in Arctic
Kryuchkov, (ed.). Monitoring of natural environment of the Kola
Fennoscandia and the Kola Peninsula (Russia). In: R. Pienitz, M.
North, pp. 75-92. Kola Science Centre, Apatity.
Douglas and J.P. Smol (eds.). Long-term environmental change in
Kataev, G.D. and M.F. Popova, 1993. Cytological and morpho-physio-
Arctic and Antarctic lakes, pp. 381-418. Kluwer Academic Publis-
logical characteristics of voles from Monchegorsk area. In: M.V.
hers.
Kozlov, E. Haukioja and V.T. Yarmishko (eds.). Aerial pollution on
Korhola, A., J. Weckstr—m and M. Nyman, 1999. Predicting the long-
Kola Peninsula, pp. 379-382. Proceedings of the International
term acidification trends in small subarctic lakes using diatoms.
Workshop, April 14-16 1992, St. Petersburg. Kola Science Centre,
Journal of Applied Ecology, 36:1021-1034.
Apatity.
Korhola, A., J. Weckstr—m and T. Blom, 2002. Relationships between
105
References
lake and land-cover features along latitudinal vegetation ecotones
ression during spring flood episodes in Northern Sweden. Envi-
in arctic Fennoscandia. Archive fur Hydrobiologie Supplement,
ronmental Pollution, 105:427-455.
139/2, 203-235.
Laudon, H. and K.H. Bishop, 2002. The rapid and extensive recovery
Korsman, T., 1999. Temporal and spatial trends of lake acidity in nort-
from episodic acidification in northern Sweden due to declines in
hern Sweden. Journal of Paleolimnology, 22:1-15.
SO 2-
4 deposition. Geophysical Research Letters, 29:1594-1597.
Kortelainen, P., 1993. Content of total organic carbon in Finnish lakes
Laudon, H. and H.F. Hemond, 2002. Recovery of streams from episo-
and its relationship to catchment characteristics. Canadian Journal
dic acidification in northern Sweden. Environmental Science and
of Fisheries and Aquatic Sciences, 50:1477-1483.
Technology, 36:921-928.
Kozlov, M.V., 1987. Responses of Insect Populations to Human Impact.
Laudon, H., S. K—hler and K. Bishop, 1999. Natural acidity or anthro-
Institute of Forest and Timber. Krasnoyarsk (in Russian, English
pogenic acidification in the spring flood of northern Sweden?
summary).
Science of the Total Environment, 234:63-73.
Kozlov, M.V., 1996. Subalpine and alpine assemblages of Lepidoptera
Laudon, H., O. Westling and K. Bishop, 2000. Cause of pH decline in
in the surroundings of a powerful smelter on the Kola Peninsula,
stream water during spring melt runoff in Northern Sweden. Ca-
NW Russia. Nota Lepidopterologica, 18:17-37.
nadian Journal of Fisheries and Aquatic Sciences, 57:1888-1900.
Kozlov, M.V., 1997. Pollution impact on insect biodiversity in boreal
Laudon, H., O. Westling, A. Bergkvist and K. Bishop, 2004. Episodic
forests: evaluation of effects and perspectives of recovery. In:
acidification in northern Sweden: a regional assessment of the
R.M.M. Crawford (ed.). Disturbance and Recovery in Arctic Lands:
anthropogenic component. Journal of Hydrology, 297:162-173.
An Ecological Perspective, pp. 213-250. Proceedings of the NATO
LavouÕ, D., 2000. Transport to the Arctic region of carbon aerosols
Advanced Research Workshop on Disturbance and Recovery of
emitted by biomass burning in boreal and temperate regions (In
Arctic Terrestrial Ecosystems, Rovaniemi, Finland, 24-30 Septem-
French: Transport vers la region arctique de l'aÕrosol carbonÕ emis
ber 1995. NATO ASI series. Partnership subseries 2. Environment:
par les feux de biomasse des regions boreale et temperÕe). PhD
vol. 25. Kluwer Academic Publishers.
thesis at the University of Paris VII.
Kozlov, M.V., 2001. Snowpack changes around a nickel-copper smelter
LavouÕ, D., C. Liousse, H. Cachier, B.J. Stocks and J.G. Goldammer,
at Monchegorsk, northwestern Russia. Canadian Journal of Forest
2000. Modeling of carbonaceous particles emitted by boreal and
Research, 31:1684-1690.
temperate wildfires at northern latitudes. Journal of Geophysical
Kozlov, M.V., 2002. Changes in wind regime around a nickel-copper
Research, 105:26871-26890.
smelter at Monchegorsk, northwestern Russia. International Jour-
Leaitch, W.R., R.M. Hoff, S. Melnichuk and A. Hogan, 1984. Some
nal of Biometeorology, 46:76-80.
physical and chemical properties of the Arctic winter aerosol in
Kozlov, M.V., 2003. Density fluctuations of the leafminer Phyllonorycter
northeastern Canada. Journal of Climate and Applied Meteorolo-
strigulatella (Lepidoptera: Gracillariidae) in the impact zone of a
gy, 23:916-928.
power plant. Environmental Pollution, 121:1-10.
Leaitch, W.R., R.M. Hoff and J.L. MacPherson, 1989. Airborne and
Kozlov, M., 2005. Pollution resistance of mountain birch, Betula pubes-
Lidar measurements of aerosol and cloud particles in the tro-
cens subsp. czerepanovii, near the copper-nickel smelter: natural
posphere over Alert Canada in April 1986. Journal of Atmospheric
selection or phenotypic acclimation? Chemosphere, 59:189-197.
Chemistry, 9:187-212.
Kozlov, M.V. and V.S. Barcan, 2000. Environmental contamination in
Lebedeva, E.V., 1993. Soil micromycetes of the non-ferrous metallurgy
the central part of the Kola Peninsula: history, documentation, and
enterprise environs on the Kola Peninsula. Mikologiya i Fitopato-
perception. Ambio, 29:512-517.
logiya (Mycology and phytopathology), 27:12-17. (In Russian)
Kozlov, M.V. and E. Haukioja, 1997. Microclimate changes along a st-
Lee Behrens, H., S. Oftedal and P.W. Schive, 2000. PAME Ù Snap Shot
rong pollution gradient in northern boreal forest zone. In: J.L. Uso,
Analysis of Maritime Activities in the Arctic. Revision No. 01,
C.A. Brebbia and H. Power, (eds.). Ecosystems and Sustainable
REPORT NO. 2000-3220. Norwegian Maritime Directorate, 75p.
development, pp. 603-614. Advances in Ecological Sciences, vol
Lehtonen, J., 1987. Recovery and development of birch forests dama-
1.
ged by Epirrita autumnata in Utsjoki area, North Finland. Reports
Kozlov, M.V. and J. Jalava, 1994. Lepidoptera of Kola Peninsula, Nort-
from the Kevo Subarctic Research Station, 20:35-39.
hwestern Russia. Entomologica Fennica, 5:65-85.
Leighton, H., 1983. Influence of the Arctic haze on the solar radiation
Kozlov, M.V. and A.V. Selikhovkin, 1997. No effects of sulphur dioxide
budget. Atmospheric Environment, 17:2065-2068.
on larval performance of Epirrita autumnata (Lepidoptera: Geo-
Leiterer, U., D. Nagel and R. Stolte, 1997. Typical vertical profiles of
metridae). Environmental Entomology, 26:1361-1363.
aerosol spectral extinction coefficients derived from observations
Kozlov, M.V. and T. Whitworth, 2002. Population densities and diver-
of direct solar radiation extinction during the aircraft experiments
sity of Calliphoridae (Diptera) around a nickel-copper smelter at
Arctic Haze 94/95 and Merisec 93/94. Atmospheric Research,
Monchegorsk, Northwestern Russia. Entomologica Fennica, 13:98-
44:73-88.
104.
Levina, V.I., 1969. Seasonal dynamic of humidity and chemical proper-
Kozlov, M.V. and E.L. Zvereva, 2004. Reproduction of mountain birch
ties of podzolic, mountain-podzolic and mountain-tundra soils in
along a strong pollution gradient near Monchegorsk, Northwes-
Murmansk region. In: Soils regimes on the Polar North. Leningrad:
tern Russia. Environmental Pollution, 132:443-451.
"Nauka", pp. 5-58. (In Russian)
Kozlov, M.V., J. Jalava, A.L. Lvovsky and K. Mikkola, 1996a. Population
Levine, S.Z. and S.E. Schwarz, 1982. In-cloud and below-cloud scaven-
densities and diversity of Noctuidae (Lepidoptera) along an air
ging of nitric acid vapor. Atmospheric Environment, 16:1725-
pollution gradient on the Kola Peninsula, Russia. Entomologica
1734.
Fennica, 7:9-15.
Li, S.M. and L.A. Barrie, 1993. Biogenic sulphur aerosols in the Arctic
Kozlov, M.V., A.L. Lvovsky and K. Mikkola, 1996b. Abundance of
troposphere. 1. Contributions to sulphate. Journal of Geophysical
day-flying Lepidoptera along an air pollution gradient in the
Research, 98D:20613-20622.
northern boreal forest zone. Entomologica Fennica, 7:137-144.
Lidmar-Bergstr—m, K. and J.-O. Nðslund, 2005. Major Landforms and
Kozlov, M.V., E.L. Zvereva and A.V. Selikhovkin, 1996c. Decreased
Bedrock. In: M. Seppðlð (ed.). The Physical Geography of Fennos-
performance of Melasoma lapponica (Coleoptera: Chrysomelidae)
candia, pp. 3-15. Oxford Regional Environments Series. Oxford
fumigated by sulphur dioxide: direct toxicity versus host plant
University Press.
quality. Environmental Entomology, 25:143-146.
Lien, L., A. Henriksen and T.S. Traaen, 1995. Critical loads of acidity
Kozlov, M.V., E. Haukioja and E.F. Kovnatsky, 2000. Uptake and exc-
to surface waters: Svalbard. Science of the Total Environment,
retion of nickel and copper by leaf-mining larvae of Eriocrania
160/161:703-713.
semipurpurella (Lepidoptera: Eriocraniidae) feeding on contami-
Lobersli, E. and K. Venn (eds.), 1995. Effects of air pollutants on ter-
nated birch foliage. Environmental Pollution, 108:303-310.
restrial ecosystems in the border area between Norway and Rus-
Kozlov, M.V., E.L. Zvereva, A.S. Gilyazov and G.D. Kataev, 2005a.
sia. DN-utredning 1995-8 Directorate for Nature Management,
Contaminated zone around a nickel-copper smelter: a death trap
Trondheim, 140p.
for birds and mammals? In: A.R. Burk (ed.). Trends in Biodiversi-
Lockhart, W.L., P. Wilkinson, B.N. Billeck, R.V. Hunt, R. Wagemann
ty, pp. 81-99. Nova Science Publishers.
and G.J. Brunskill, 1995. Current and historical inputs of mercury
Kozlov, M.V., N.K. Brodskaya, A. Haarto, K. Kuusela, M. Schðfer and
to high-latitude lakes in Canada and to Hudson Bay. Water, Air
V. Zverev, 2005b. Population densities and diversity of blood-
and Soil Pollution, 80:603-610.
sucking flies (Diptera: Ceratopogonidae, Culicidae, Tabanidae,
Lockhart, W.L., P. Wilkinson, B.N. Billeck, R.A. Danell, R.V. Hunt, G.J.
Simuliidae) around a nickel-copper smelter at Monchegorsk,
Brunskill, J. Delaronde and V. St. Louis, 1998. Fluxes of mercury
North western Russia. Journal of Vector Ecology, 30:263-271.
to lake sediments in central and northern Canada inferred from
Kuylenstierna, J.C.I., H. Rodhe, S. Cinderby and K. Hicks, 2001. Aci-
dated sediment cores. Biogeochemistry, 40:163-173.
dification in developing countries: Ecosystem sensitivity and the
L—fgren, O., 1995. Niche expansion and increased maturation rate of
critical load approach on a global scale. Ambio, 30:20-28.
C. glareolus in the absence of competitors. Journal of Mammalogy,
Lappalainen, A., O. Mðh—nen, J. Erkinaro, M. Rask and E. Niemelð,
76:1100-1112.
1995. Acid deposition from the Russian Kola Peninsula: are sensi-
Logan, J.A., 1983. Nitrogen oxides in the troposphere; global and re-
tive fish populations in north-eastern Finnish Lapland affected?
gional budgets. Journal of Geophysical Research, 88:10785-
Water, Air and Soil Pollution, 85:439-444.
10807.
Laudon, H. and K.H. Bishop, 1999. Quantifying sources of ANC dep-
Lukina, N. and V. Nikonov, 1996. Biogeochemical cycles in the northern
106
AMAP Assessment 2006: Acidifying Pollutants, Arctic Haze, and Acidification in the Arctic
forest ecosystems subjected to air pollution. Kola Science Centre.
Mikkola, K., 1996. A remote sensing analysis of vegetation damage
RAS. Part 1, 195 pp. Part 2, 216p.
around smelters in the Kola Peninsula, Russia. International Jour-
Luyssaert, S., M. Sulkava, H. Raitio and J. HollmÕn, 2005. Are N and
nal of Remote Sensing, 17(18):3675-3690.
S deposition altering the mineral composition of Norway spruce
Miskimmin, B.M., J.W.M. Rudd and C.A. Kelly, 1992. Influence of dis-
and Scots pine needles in Finland? Environmental Pollution, 138:5-
solved organic carbon, pH, and microbial respiration rates on
17.
mercury methylation and demethylation in lake water. Canadian
MacCracken, M.C., R.D. Cess and G. L. Potter, 1986. Climatic effects
Journal of Fisheries and Aquatic Sciences, 49:17-22.
of anthropogenic Arctic aerosols: An illustration of climatic feed-
Mitchell Jr., J.M., 1956. Visual range in the polar regions with particu-
back mechanisms with one-and two-dimensional climate models.
lar reference to the Alaskan Arctic. Journal of Atmospheric and
Journal of Geophysical Research, 91:14445-14450.
Terrestrial Physics Special Supplement, 1:195-211.
Macdonald, R.W., B.L.A., T.F. Bidleman, M.L. Diamond, D.J. Gregor,
Mitchell, M.J., D.J. Raynal and C.T. Driscoll, 1996. Biogeochemistry of
R.G. Semkin, W.M.J. Strachan, Y.F. Li, F. Wania, M. Alaee, L.B.
a forested watershed in the central Adirondack mountains: tem-
Alexeeva, S.M. Backus, R. Bailey, J.M. Bewers, C. Gobeil, C.J. Hal-
poral changes and mass balances. Water, Air and Soil Pollution,
sall, T. Harner, J.T. Hoff, L.M.M. Jantunen, W.L. Lockhart, D.
88:355-369.
Mackay, D.C.G. Muir, J. Pudykiewicz, K.J. Reimer, J.N. Smith, G.A.
Moberg, A., H. Tuomenvirta and P.Ä. Nordli, 2005. In: M. Seppðlð (ed.).
Stern, W.H. Schroeder, R. Wagemann and M.B. Yunker, 2000. Con-
The Physical Geography of Fennoscandia, pp. 113-133. Oxford
taminants in the Canadian Arctic: 5 years of progress in under-
Regional Environments Series. Oxford University Press.
standing sources, occurrence and pathways. Science of the Total
Moiseenko, T.I., 1994. Acidification and critical loads in surface waters:
Environment, 254:93-234.
Kola, northern Russia. Ambio, 23:418-424.
Macdonald, R.W., T. Harner, J. Fyfe, H. Loeng and T. Weingartner, 2003.
Moiseenko, T.I., 1997. Theoretical bases of critical limit values of an-
AMAP Assessment 2002: The influence of global change on con-
thropogenic loads on subarctic surface waters. Kola Science Cent-
taminant pathways to, within, and from the Arctic. Arctic Monitor-
er, Russian Academy of Science, Apatity. 261p. (In Russian)
ing and Assessment Programme, Oslo, xii+65p.
Moiseenko, T.I., 1999. The fate of metals in Arctic surface waters.
Macdonald, R.W., T. Harner and J. Fyfe, 2005. Recent climate change
Method for defining critical levels. Science of the Total Environ-
in the Arctic and its impact on contaminant pathways and inter-
ment, 236:19-39.
pretation of temporal trend data. Science of the Total Environment,
Moiseenko, T.I., L.P. Kudryavtseva, I.V. Rodyushkin, V.A. Dauvalter,
342:5-86.
A.A. Lukin and N.A. Kashulin, 1995. Airborne contamination by
Mallory, M.L., A.J. Fontaine, P.A. Smith, M.O. W. Robertson and H.G.
heavy metals and aluminum in the freshwater ecosystems of the
Gilchrist, 2006. Water chemistry of ponds on Southampton Island,
Kola Subarctic region (Russia). Science of the Total Environment,
Nunavut, Canada: effects of habitat and ornithogenic inputs. Ar-
160/161:715-727.
chive fur Hydrobiologie, accepted.
Moiseenko, T.I., V.A. Dauvalter, B.P. Ilyashuk, L.Y. Kagan and E.A.
Manninen, S., 1995. Assessing the Critical Level of SO
Ilyashuk, 2000. Paleoecological reconstruction of the anthropo-
2 for Scots Pine
(Pinus sylvestris L.) in Northern Europe on the Basis of Needle
genic load. Doklady Earth Sciences, 307(1):102-105.
Sulphur Fractions, Sulphur/Nitrogen Ratios and Needle Damage.
Moiseenko, T.I., L. Kudrjavzeva and I. Rodyshkin, 2001. The episodic
PhD Thesis, University of Oulu, Finland.
acidification of small streams in the spring flood period of indus-
Manninen, S. and S. Huttunen, 2000. Response of needle sulphur and
trial polar region, Russia. Chemosphere, 42:45-50.
nitrogen concentrations of Scots pine versus Norway spruce to
Monteith, D.T., C.D. Evans and B. Reynolds, 2000. Are temporal vari-
SO
ations in the nitrate content of UK upland freshwaters linked to
2 and NO2. Environmental Pollution, 107:421-436.
Manninen, S., S. Huttunen and M. Kontio, 1997a. Accumulation of
the North Atlantic Oscillation? Hydrological Processes, 14:1745-
sulphur in and on Scots pine needles in the subarctic. Water, Air
1749.
and Soil Pollution, 95:147-164.
Moore, J.C., A. Grinsted, T. Kekonen and V. Pohjola, 2005. Separation
Manninen, S., S. Huttunen and P. Perðmðki, 1997b. Needle S fractions
of melting and environmental signals in an ice core with seasonal
and S to N ratios as indices of SO
melt. Geophysical Research Letters, 32:L10501.
2 deposition. Water, Air and Soil
Pollution, 95:277-297.
Morgan, G., S. Corbett and J. Wlodarczyk, 1998. Air pollution and
Manninen, S., S. Huttunen and P. Perðmðki, 1998. Effect of ambient
hospital admissions in Sydney, Australia, 1990 to 1994. American
SO
Journal of Public Health, 88:1761-1766.
2 levels on S fractions in Pinus sylvestris foliage growing in the
subarctic. Scandinavian Journal of Forest Research, 13:306-316.
Moser, K.A., J.P. Smol, D.R.S. Lean, G.M. MacDonald, 1998. Physical
Masclet, P., V. Hoyau, J.L. Jaffrezo and H. Cachier, 2000. Polycyclic
and chemical limnology of northern boreal lakes, Wood Buffalo
aromatic hydrocarbon deposition on the ice sheet of Greenland.
National Park, northern Alberta and the Northwest Territories,
Part 1: Superficial snow. Atmospheric Environment, 34:3195-
Canada. Hydrobiologia, 377:25-43.
3207.
Motova, A. and V.V. Nikonov, 1993. Aluminium compounds in pod-
McBean, G., 2005. Chapter 2. Arctic climate Ù past and present. In:
zolic Al-Fe-humus soils in the surroundings of the "Severonikel"
Arctic Climate Impact Assessment, pp. 21-60. Cambridge Univer-
smelter. In: M.V. Kozlov, E. Haukioja and V.T. Yarmishko (eds.).
sity Press.
Aerial pollution on Kola Peninsula, pp.178-183. Proceedings of the
McGowan, J., P. Hider, E. Chacko and G. Town, 2000. Particulate air
International Workshop, April 14-16 1992, St. Petersburg. Kola
pollution and hospital admissions in Christchurch, New Zealand.
Science Centre, Apatity.
Australian and New Zealand Journal of Public Health, 26:23-29.
MRCENR, 1995. Review of pollutant fallout in the atmosphere in the
McMahon, T.A. and P.J. Denison, 1979. Empirical atmospheric deposi-
Murmansk region in 1993 and 1994. Murmansk Regional Com-
tion parameters Ù A survey. Atmospheric Environment, 13:571-
mittee for Ecology and Natural Resources, Murmansk. (In Rus-
585.
sian)
McMichael, A.J., A. Haines, R. Sloof and S. Kovats, 1996. Climate
Muir, D.C.G., N.P. Grift, W.L. Lockhart, P. Wilkinson, B.N. Billeck and
Change and Human Health. World Health Organization.
G.J. Brunskill, 1995. Spatial trends and historical profiles of orga-
Meijer, S.N., W.A. Ockenden, A. Sweetman, K. Breivik, J.O. Grimalt
nochlorine pesticides in Arctic lake sediments. Science of the Total
and K.C. Jones, 2003. Global distribution and budget of PCBs and
Environment, 160/161:447-457.
HCB in background surface soils: Implications for sources and
Murdoch, P.S., J.S. Baron and T.L. Miller, 2000. Potential effects of cli-
environmental processes. Environmental Science and Technology,
mate change on surface water quality in North America. Journal
37:667-672.
of the American Water Resources Association, 36:347-366.
Mendonca, B.G., J.J. DeLuisi and J.A. Schroeder, 1981. Arctic Haze and
Mylona, S., 1996. Sulphur dioxide emissions in Europe 1880-1991 and
perturbation in the solar radiation fluxes at Barrow, Alaska, Pro-
their effect on sulphur concentrations and depositions. Tellus,
ceedings from the 4th Conference on Atmospheric Radiation. Atm.
B48:662-689.
Met. Sco., Toronto, pp. 95-96.
Naldrett, A.J., P.C. Lightfoot, V. Fedorenko, W. Doherty and N.S. Gor-
Michelutti, N., T.E. Laing and J.P. Smol, 2001. Diatom assessment of
bachev, 1992. Geology and geochemistry of intrusions and flood
past environmental changes in lakes located near the Noril'sk
basalts of the Norilsk region USSR, with implications for the origin
(Siberia) smelters. Water, Air and Soil Pollution, 125:231-241.
of the Ni-Cu ores. Economic Geology, 87:975-1004.
Michelutti, N., M.S.V. Douglas, D.C.G. Muir, X. Wang and J.P. Smol,
Nash, III, T.H. and C. Gries, 1995. The response of lichens to atmos-
2002a. Limnological characteristics of 38 lakes and ponds on Axel
pheric deposition with an emphasis on the Arctic. Science of the
Heiberg Island, High Arctic Canada. International Review of Hy-
Total Environment, 160/161:737-747.
drobiology, 87:385-399.
Nelson, W.O. and P.G.C. Campbell, 1991. The effects of acidification
Michelutti, N., M.S.V. Douglas, D.R.S. Lean and J.P. Smol, 2002b. Phys-
on the geochemistry of Al, Cd, Pb and Hg in freshwater environ-
ical and chemical limnology of 34 ultra-oligotrophic lakes and
ments: A literature review. Environmental Pollution, 71:91-130.
ponds near Wynniatt Bay, Victoria Island, Arctic Canada. Hydro-
Newell, A.D. and M.E. Mitch, 1992. User's Guide and Data Dictionary
biologia, 482:1-13.
for Kenai Lakes Investigation Project. EPA/600/R-92/070, U.S.
Michelutti, N., M.S.V. Douglas and J.P. Smol, 2003. Diatom response
Environmental Protection Agency, Washington, DC.
to recent climatic change in a high arctic lake (Char Lake, Cornwal-
Nikonov, V.V., N.V. Lukina, L.M. Polyanskaya and A.N. Panikova,
lis Island, Nunavut). Global and Planetary Change, 38:257-271.
2001. Distribution of microorganisms in the Al-Fe-humus podzols
of natural and anthropogenically impacted boreal spruce forests.
107
References
Mikrobiologiya, 70:374-383. (In Russian)
404:484-487.
Nilsson, J. and P. Grennfelt (eds.), 1988. Critical loads for sulphur and
Pienitz, R., J.P. Smol and D.R.S. Lean, 1997a. Physical and chemical
nitrogen. Nord 1988:97, Nordic Council of Ministers, 418p.
limnology of 59 lakes located between the southern Yukon and the
Noone, K.J. and A.D. Clarke, 1988. Soot scavenging measurements in
Tuktoyaktuk Peninsula, Northwest Territories (Canada). Cana-
Arctic snowfall. Atmospheric Environment, 22:2773-2779.
dian Journal of Fisheries and Aquatic Sciences, 54:330-346.
Nordin, A., J. Strengbom, J. Witzell, T. Nðsholm and L. Ericson, 2005.
Pienitz, R., J.P. Smol and D.R.S. Lean, 1997b. Physical and chemical
Nitrogen deposition and the biodiversity of boreal forests: impli-
limnology of 24 lakes located between Yellowknife and Contwoy-
cations for the nitrogen critical load. Ambio, 34:20-24.
to Lake, Northwest Territories (Canada). Canadian Journal of
Norwegian Maritime Directorate, 2000. PAME Ù Snap Shot Analysis
Fisheries and Aquatic Sciences, 54:347-358.
of Maritime Activities in the Arctic. Norwegian Maritime Direc-
PolÕo, A.B.S. and F. Bjerkely, 2000. Effect of unstable aluminium chem-
torate Report No. 2000-3220. 72p.
istry on Arctic char (Salvelinus alpinus). Canadian Journal of Fish-
N½st, T., V. Yakovlev, H.M. Berger, N. Kashulin, A. Langeland, A. Lukin
eries and Aquatic Sciences, 57:1423-1433.
and H. Muladal, 1992. Impacts of pollution on freshwater com-
Polyanskaya, L.M., V.V. Nikonov, N.V. Lukina, A.N. Panikova and D.G.
munities in the border region between Russia and Norway. In: M.
Zvyagintsev, 2001. Microorganisms of Al-Fe-humus podzols of
Varmola and T. Katermaa (eds.). Symposium on the state of the
lichen pine forests as affected by aerotechnogenic pollution. Po-
environment and environmental monitoring in Northern Fenno-
chovovedenie (Eurasian Soil Science), 2:215-226. (In Russian)
scandia and the Kola Peninsula, Oct. 6-8 1992, Rovaniemi, Ex-
Pope, C.A. III, M.J. Thun, M.M. Namboodiri, D.W. Dockery, J.S. Evans,
tended Abstracts, pp. 152-155. Arctic Centre Publications 4.
F.E. Speizer and C.W. Heath, Jr., 1995. Particulate air pollution as
Novikov, G.A., 1981. Life on and under snow: Life of our birds and
a predictor of mortality in a prospective study of U.S. adults.
animals, Issue 3. Leningrad University. (In Russian)
American Journal of Respiratory and Critical Care Medicine,
Nuorteva, P., S. Autio, K. Bergbom, H. Braunschweiler and E. Koski,
151:669-674.
1987. Effect of acidification on mobility of heavy metals and alu-
Pope, C.A., R.T. Burnett, M.J. Thun, E.E. Calle, D. Krewski, K. Ito and
minum in forest and lake ecosystems (Happamoitumisen vaikutus
G.D. Thurston, 2002. Lung cancer, cardiopulmonary mortality, and
raskasmetallien ja alumiinin liikuvuuteen metsa- ja jarviekosys-
long-term exposure to fine particulate air pollution. The Journal
teemissa). Aquilo Series Botanica 25:122-128.
of the American Medical Association, 287:1132-1141.
Nyman, M., A. Korhola and S.J. Brooks, 2005. The distribution and
Porch, W.M. and M.C. MacCracken, 1982. Parametric study of the ef-
diversity of Chironomidae (Insecta: Diptera) in western Finnish
fects of Arctic soot on the solar radiation. Atmospheric Environ-
Lapland, with special emphasis on shallow lakes. Global Ecology
ment, 16:1365-1371.
and Biogeography, 14:137-153.
Psenner, R. and R. Schmidt, 1992. Climate-driven pH control of remote
Odland, J.O., E. Nieboer, N. Romanova and Y. Thomassen, 2004. Ele-
alpine lakes and effects of acid deposition. Nature, 356:781-783.
ments in placenta and pregnancy outcome in arctic and subarctic
Pueschel, R.F. and S.A. Kinne, 1995. Physical and radiative properties
areas. International Journal of Circumpolar Health, 63:169-187.
of Arctic atmospheric aerosols. Science of the Total Environment,
Ohtonen, R. and H. Vðre, 1996. Importance of site homogeneity in
161:811-824.
gradient studies on soil ecology. II. Soil microbiology. In: H. Vðre
Quinn, P.K., T.S. Bates, T.L. Miller, D.J. Coffman, J.E. Johnson, J.M.
(ed.). Relationships between spatial heterogeneity in vegetation
Harris, J.A. Ogren, G. Forbes, T.L. Anderson, D.S. Covert and M.J.
communities and in belowground ecosystems. Acta Universitas
Rood, 2000. Surface submicron aerosol chemical composition:
Ouluensis, A 275, III:1-11.
What fraction is not sulfate? Journal of Geophysical Research,
Olofsson, J., H. Kitti, P. Rautiainen, S. Stark and L. Oksanen, 2001. Ef-
105:6785-6806.
fects of summer grazing by reindeer on composition of vegetation,
Quinn, P.K., T.L. Miller, T.S. Bates, J.A. Ogren, E. Andrews and G.E.
productivity and nitrogen cycling. Ecography, 24:13-24.
Shaw, 2002. A three-year record of simultaneously measured
Orr, J.C., V.J. Fabry, O. Aumont, L. Bopp, S.C. Doney, R.A. Feely, A.
aerosol chemical and optical properties at Barrow, Alaska. Journal
Gnanadesikan, N. Gruber, A. Ishida, F. Joos, R.M. Key, K. Lindsay,
of Geophysical Research, 107(D11). 10.1029/2001JD001248.
E. Maier-Reimer, R. Matear, P. Monfray, A. Mouchet, R.G. Najjar,
Raatz, W.E. and G.E. Shaw, 1984. Long-range tropospheric transport
G.-K. Plattner, K.B. Rodgers, C.L. Sabine, J.L. Sarmiento, R. Schl-
of pollution aerosols into the Alaskan Arctic. Journal of Climate
itzer, R.D. Slater, I.J. Totterdell, M.-F. Weirig, Y. Yamanaka and A.
and Applied Meteorology, 23:1052-1064.
Yool, 2005. Anthropogenic ocean acidification over the twenty-first
Radke, F.S., J.H. Lyons, D.A. Hegg, P.V. Hobbs and I.H. Bailey, 1984.
century and its impact on calcifying organisms. Nature, 437:681-
Airborne observations of arctic aerosols, I: Characteristics of arctic
686.
haze. Geophysical Research Letters, 11:393-396.
Ottar, B., Y. Gotaas, O. Hov, T. Iversen, E. Joranger, M. Oehme, J. Pa-
Raguotis, A.D., 1989. Impact of industrial emissions on soil microflora
cyna, A. Semb, W. Thomas and V. Vitolas, 1986. Air pollutants in
in forests of extreme North. In: G.M. Kozubov (ed.). Ecology of
the Arctic. Final report of a research programme conducted on the
northern forests: Abstracts of presentations of the 1st All-Union
behalf of British Petroleum, Ltd. Norwegian Institute of Air Re-
Meeting, 2-7 October 1989, vol. 2, pp 45-46. Institute of Biology,
search, NILU OR 30/86, 80p.
Komi Science Centre, Syktyvkar. (In Russian)
Overpeck,, J.K., K. Hughen, D. Hardy, R. Bradley, R. Case, M. Douglas,
Rahn, K.A., 1981. Relative importance of North America and Eurasia
B. Finney, K. Gajewski, G. Jacoby, A. Jennings, S. Lamoureux, A.
as sources of Arctic aerosol. Atmospheric Environment, 15:1447-
Lasca, G. MacDonald, J. Moore, M. Retelle, S. Smith, A. Wolfe and
1455.
G. Zielinski, 1997. Arctic environmental change of the last four
Rahn, K.A., 1989. Proceedings of the International Symposium on
centuries. Science, 278:1251-1256.
Arctic Air Chemistry. Atmospheric Environment, 23:2345-2347.
Pacyna, J.M. and B. Ottar, 1988. Vertical distribution of aerosols in the
Rahn, K.A. and R.J. McCaffrey, 1979. Long range transport of pollution
Norwegian Arctic. Atmospheric Environment, 22:2213-2223.
aerosol to the Arctic. A problem without borders. Proceedings of
Pacyna, E.G. and J.M. Pacyna, 2002. Global emission of mercury from
the WMO symposium on the Long-range Transport of Pollutants
anthropogenic sources in 1995. Water, Air and Soil Pollution,
and its relation to the General Circulation including Stratospheric/
137:149-165.
Tropospheric Exchange Processes, pp. 25-35, Sofia, 1-5 Oct 1979.
Pacyna, J.M., V. Vitolis and J.E. Hanssen, 1984. Size differentiated com-
WMO No. 538.
position of the Arctic aerosol at Ny Alesund Zeppelin. Atmos-
Rahn, K.A., R. Borys and G.E. Shaw, 1977. The Asian source of Arctic
pheric Environment, 18:2447-2459.
Haze bands. Nature, 268:713-715.
Park, R.J., D.J. Jacob, P.I. Palmer, A.D. Clarke, R.J. Weber, M.A. Zondlo,
Rahn, K.A., R.D. Borys and G.E. Shaw, 1981. Asian desert dust over
F.L. Eisele, A.R. Bandy, D.C. Thornton, G.W. Sachse and T.C. Bond,
Alaska: Anatomy of an Arctic Haze Episode. In: T.L. Pewe (ed.).
2005. Export efficiency of black carbon aerosol in continental out-
Desert dust: origin, characteristic and effect on man, pp. 37-70.
flow: Global implications. Journal of Geophysical Research, 110:
Special paper No. 186. The Geological Society of America.
D11205, doi:10.1029/2004JD005432.
Rðisðnen, M.L., G. Kashulina and I. Bogatyrev, 1997. Mobility and
Penkett, S.A., N.J. Blake, P. Lightman, A.R.W. Marsh, P. Anwyl and G.
retention of heavy metals, arsenic and sulphur in podzols at eight
Butcher, 1993. The seasonal variation of nonmethane hydrocar-
locations in northern Finland and Norway and the western half
bons in the free troposphere over the North Atlantic Ocean: Pos-
of the Kola Peninsula. Journal of Geochemical Exploration, 59:175-
sible evidence for extensive reaction of hydrocarbons with the
195.
nitrate radical. Journal of Geophysical Research, 98:2865-2885.
Ramlal, P.S., C.A. Kelly, J.W.M. Rudd and A. Furutani, 1993. Sites of
Perez-Fuentetaja, A., P.J. Dillon, N.D. Yan and D.J. McQueen, 1999.
methyl mercury production in remote Canadian Shield lakes. Ca-
Significance of dissolved organic carbon in the prediction of ther-
nadian Journal of Fisheries and Aquatic Sciences, 50:972-979.
mocline depth in small Canadian shield lakes. Aquatic Ecology,
Rao, T.N. and S. Kirkwood, 2005. Characteristics of tropopause folds
33:127-133.
over Arctic latitudes. Journal of Geophysical Research, 110:D18102,
Petroeschevsky, A., R.W. Simpson, L. Thalib and S. Rutherford, 2001.
doi:10.1029/2004JD005374.
Associations between outdoor air pollution and hospital admis-
Rask, M., M. Appelberg, T. Hesthagen, J. Tammi and A. Lappalainen,
sions in Brisbane, Australia. Archives of Environmental Health,
Fish Status Survey of Nordic Lakes Ù species composition, distri-
56:37-52.
bution, effects of environmental changes. Nordic Council of Min-
Pienitz, R. and W.F. Vincent, 2000. Effect of climate change relative to
isters. TemaNord 2000:508.
ozone depletion on UV exposure in subarctic lakes. Nature,
Rasmussen, S.O., K.K. Andersen, M.-L. Siggaard-Andersen and H.B.
108
AMAP Assessment 2006: Acidifying Pollutants, Arctic Haze, and Acidification in the Arctic
Clausen, 2002. Extracting the annual signal from Greenland ice-
radiative forcing of tropospheric aerosol in the Arctic measured
core chemistry and isotopic records Annals of Glaciology, 35:131-
by ground based infrared spectrometry. Geophysical Research
135.
Letters, 32:L23816, doi:10.1029/2005GL024331.
Rautio, P. and S. Huttunen, 2003. Total vs. internal element concentra-
Rose, N.L., C.L. Rose, J.F. Boyle and P.G. Appleby, 2004. Lake-sediment
tions in Scots pine needles along a sulphur and metal pollution
evidence for local and remote sources of atmospherically deposi-
gradient. Environmental Pollution, 122:273-289.
ted pollutants on Svalbard. Journal of Paleolimnology, 31:499-
Rautio, M. and A. Korhola, 2002. Effects of ultraviolet radiation and
513.
dissolved organic carbon on the survival of subarctic zooplankton:
Rouse, W.R., M.S.W. Douglas, R.E. Hecky, A.E. Hershey, G.W. Kling,
Implications to climate change. Polar Biology, 25:460-468.
L. Lesack, P. Marsh, M. McDonald, B.J. Nicholson, N.T. Roulet and
Rautio, P., S. Huttunen and J. Lamppu, 1998a. Element concentrations
J.P. Smol, 1997. Effects of climate change on the freshwaters of
in Scots pine needles on radial transects across subarctic area.
arctic and subarctic North America. Hydrological Processes,
Water, Air and Soil Pollution, 102:389-405.
11:873-902.
Rautio, P., S. Huttunen and J. Lamppu, 1998b. Seasonal foliar chemistry
R■hland, K.M. and J.P. Smol, 1998. Limnological characteristics of 70
of northern Scots pines under sulphur and heavy metal pollution.
lakes spanning Arctic treeline from Coronation Gulf to Great Sla-
Chemosphere, 37:271-287.
ve Lake in the Central Northwest Territories, Canada. Internatio-
Rautio, P., S. Huttunen, E. Kukkola, R. Peura and J. Lamppu, 1998c.
nal Review of Hydrobiology, 83:183-203.
Deposited particles, element concentrations and needle injuries
R■hland, K.M., J.P. Smol, X. Wang and D.C.G. Muir, 2003. Limnologi-
on Scots pines along an industrial pollution transect in northern
cal characteristics of 56 lakes in the central Canadian Arctic tree-
Europe. Environmental Pollution, 103:81-89.
line region. Journal of Limnology, 62:9-27.
Reimann, C., P.de Caritat, J.H. Halleraker, T. Volden, M. áyrðs, H.
Ruoho-Airola, T. and T. Salmi, 2001. Episodicity of sulphate deposition
Niskavaara, V.A. Chekushin and V.A. Pavlov, 1997. Rainwater
in Finland. Water, Air and Soil Pollution, 130:529-534.
composition in eight arctic catchments of Northern Europe (Fin-
Ruoho-Airola, T., P. Anttila and T. Salmi, 2004. Airborne sulphur and
land, Norway and Russia). Atmospheric Environment, 31/2:159-
nitrogen in Finland Ù trends and exposure in relation to air tran-
170.
sport sector. Journal of Environmental Monitoring, 6:1-11.
Reimann, C., M. áyrðs, V. Chekushin, I. Bogatyrev, R. Boyd, P. de Ca-
Ruohomðki, K., P. Kaitaniemi, M.V. Kozlov, T. Tammaru and E. Hau-
ritat, R. Dutter, T.E. Finne, Ä. JÌger, G. Kashulina, O. Lehto, H.
kioja, 1996. Density and performance of Epirrita autumnata (Lep.,
Niskavaara, V. Pavlov, M.L. Raisanen, T. Strand and T. Volden,
Geometridae) along three air pollution gradients in northern Eu-
1998a. Environmental Geochemical Atlas of the Central Barents
rope. Journal of Applied Ecology, 33:773-785.
Region. Special Publication, Geological Survey of Norway, Trond-
Ruotsalainen, A.L., A.M. Markkola and M.V. Kozlov, 2006. Root fungal
heim, 745p.
colonization in Deschampsia flexuosa: effects of pollution and neigh-
Reimann, C., P.de Caritat, T.E. Finne, G. Kashulina, H. Niskavaara and
bouring trees. Environmental Pollution. In press.
V. Pavlov, 1998b. Comparison of elements in O- and C-horizon
Sala, O.E., F.S. Chapin III, J.J. Armesto, E. Berlow, J. Bloomfield, R.
soils from the surroundings of Nikel, Kola Peninsula, using diffe-
Dirzo, E. Huber-Sanwald, L.F. Huenneke, R.B. Jackson, A. Kinzig,
rent grain size fractions and extractions. Geoderma 84:65-87.
R. Leemans, D.M. Lodge, H.A. Mooney, M. Oesterheld, N.L. Poff,
Reimann, C., D. Banks and P. de Caritat, 2000a. Impacts of airborne
M.T. Sykes, B.H. Walker, M. Walker and D.H. Wall, 2000. Global
contamination on regional soil and water quality: The Kola Penin-
Biodiversity scenarios for the year 2100. Science, 287:1770-1774.
sula, Russia. Environmental Science and Technology, 34:2727-
Salmi, T., A. Mððttð, P. Anttila, T. Ruoho-Airola and T. Amnell, 2002.
2732.
Detecting trends of annual values of atmospheric pollutants by
Reimann, C., D. Banks and G. Kashulina, 2000b. Processes influencing
the Mann-Kendall test and Sen's slope estimates Ù the Excel tem-
the chemical composition of the O-horizon of podzols along a
plate application MAKESENS, Publications on Air Quality, no. 31,
500-km north-south profile from the coast of the Barents Sea to the
FMI-AQ-31.
Arctic Circle. Geoderma, 95:113-139.
Salminen, R. and V. Gregorauskiene, 2002. Geochemistry of four soil
Reimann, C., G. Kashulina, P.de Caritat and H. Niskavaara, 2001a.
profiles from Norilsk area, Taimyr region, Russia. Geological Sur-
Multi-element, multi-medium regional geochemistry in the Euro-
vey of Finland, Report No. S/41/0000/4/2002. 17p.
pean Arctic: element concentrations, variation and correlation.
Salminen, R., V. Chekushin, M. Tenhola, I. Bogatyrev, S.P. Glavatskikh,
Applied Geochemistry, 16:759-780.
E. Fedotova, V. Gregorauskiene, G. Kashulina, H. Niskavaara, A.
Reimann, C., F. Koller, G. Kashulina, H. Niskavaara and P. Englmaier,
Polischuk, K. Rissanen, L. Selenok, O. Tomilina and L. Zhdanova,
2001b. Influence of extreme pollution on the inorganic chemical
2004. Geochemical atlas of Eastern Barents region. Journal of Geo-
composition of some plants. Environmental Pollution, 115:239-
chemical Exploration, 83:1-3. Special issue, 530p.
252.
Sandgren, C.D., 1988. The ecology of chrysophyte flagellates: their
Reimann, C., F. Koller, B. Frengstad, G. Kashulina, H. Niskavaara and
growth and perennation strategies as freshwater phytoplankton.
P. Englmaier, 2001c. Comparison of the element composition in
In: C.D. Sandgren (ed.). Growth and reproductive strategies of
several plant species and their substrate from a 1 500 000 km2 area
freshwater phytoplankton, pp 9-104. Cambridge University
in Northern Europe. Science of the Total Environment, 278:87-
Press.
112.
Sarmaja-Korjonen, K., M. Nyman, S. Kultti and M. Vðliranta, 2006.
Reimann, C., H. Niskavaara, G. Kashulina, P. Filzmoser, R. Boyd, T.
Palaeolimnological development of Lake Njargajavri, northern
Volden, O. Tomilina and I. Bogatyrev, 2001d. Critical remarks on
Finnish Lapland, in a changing Holocene climate and environ-
the use of terrestrial moss (Hylocomium splendens and Pleurozium
ment. Journal of Paleolimnology, 35:65-81.
schreberi) for monitoring airborne pollution. Environmental Pol-
Scheuer, E., R.W. Talbot, J.E. Dibb, G.K. Seid, L. DeBell and B. Lefer,
lution, 113:41-57.
2003. Seasonal distributions of fine aerosol sulfate in the North
Reimann, C., F. Koller, B. Frengstad, G. Kashulina, H. Niskavaara and
American Arctic basin during TOPSE. Journal of Geophysical Re-
P. Englmaier, 2003. Total sulphur in leaves of several plant species
search, 108(D4):8370, doi:10.1029/2001JD001364.
from nine catchments within a 1 500 000 km2 area in northern
Schiff, S., M. English, M. Ecclestone, R. Elgood, M. Hinton and L. Pez-
Europe: local vs. regional variability. Geochemistry: Exploration,
zuto, 1991. Constraints on the origin of acidity in Colour Lake,
Environment, Analysis, 3:205-215.
Axel Heiberg Island (79¤25'N). In: T.D. Prowse, C.S.L. Ommaney
Reuss, J.O. and D.W. Johnson, 1986. Acid Deposition and the Acidifi-
(eds.). NHRI Symposium No. 6, 532 pp. Environment Canada.
cation of Soils and Waters. Ecological Studies. Springer Verlag,
Schindler, D.W., 1997. Widespread effects of climatic warming on fresh-
119p.
water ecosystems. Hydrological Processes, 11:1043-1067.
Reviews of the state of environment in Russian Federation in 1995,
Schindler, D.W., 1999. From acid rain to toxic snow. Ambio, 28:350-
1996, 1997, 1998, 1999, 2000, 2001, 2002. Moscow, Hydromeoizda.
355.
(In Russian)
Schindler, D.W., 2001. The cumulative effects of climate warming and
Ricard, V., J.-L. Jaffrezo, V.-M. Kerminen, R.E. Hillamo, M. Sillanpaa,
other human stresses on Canadian freshwaters in the new millen-
S. Ruellan, C. Liousse and H. Cachier, 2002. Two years of conti-
nium. Canadian Journal of Fisheries and Aquatic Sciences, 58,18-
nuous aerosol measurements in northern Finland. Journal of
29.
Geophysical Research, 107(D11), 10.1029/2001JD000952.
Schindler, D.W. and P.J. Curtis, 1997. The role of DOC in protecting
Richter, V.A. and E.L. Zvereva, 1996. The tachinid species Cleonice ni-
freshwaters subjected to climatic warming and acidification from
tidiuscula Zetterstedt new for fauna of Murmansk Province (Dip-
UV exposure. Biogeochemistry, 36:1-8.
tera: Tachinidae). Zoosystematica Rossica, 6:202.
Schindler, D.W., K.A. Kidd, D.C.G. Muir and W.L. Lockhart, 1995. The
Riemer, J. and J.B. Whittaker, 1989. Air pollution and insect herbivores:
effects of ecosystem characteristics on contaminant distribution in
observed interactions and possible mechanisms. In: E.A. Bernays
northern freshwater lakes. Science of the Total Environment, 161:1-
(ed.). InsectÙPlant Interactions, pp. 73-105. vol. 1. CRC Press.
17.
Rigina, O. and M. Kozlov, 1999. Pollution impact on sub-Arctic nort-
Schindler, D.W., P.J. Curtis, B.R. Parker and M.P. Stainton, 1996. Con-
hern taiga forests in the Kola Peninsula, Russia. In: J.L. Innes and
sequences of climate warming and lake acidification for UV-B
J. Oleksyn (eds.). Forest Dynamics in Heavily Polluted Regions,
penetration in North American boreal lakes. Nature, 379:705-
pp. 37-65. IUFRO Research Series, No. 1. CAB International.
708.
Ritter, C., J. Notholt, J. Fischer and C. Rathke, 2005. Direct thermal
Schwarz, S.E., 1979. Residence times in reservoirs under non-steady-
109
References
state conditions: application to atmospheric SO
waters acidification in Europe and North America (1989Ù1998).
2 and aerosol sul-
phate. Tellus, 31:520-547.
Water, Air and Soil Pollution, 130:787-792.
Sehmel, G.A., 1980. Particle and gas dry deposition: A review. Atmos-
SkjelkvÍle, B.L., T. Andersen, E. Fjeld, J. Mannio and A. Wilander,
pheric Environment, 14:983-1011.
2001b. Recovery from acidification of lakes in Finland, Norway
Seinfeld, J.H. and S.N. Pandis, 1998. Atmospheric Chemistry and Phys-
and Sweden 1990Ù1999. Hydrology and Earth System Sciences,
ics: From Air Pollution to Climate Change. John Wiley & Sons,
5:327-338.
1326p.
SkjelkvÍle, B.L., A. Henriksen, G.S. Jµnsson, J. Mannio, A. Wilander,
Seip, H.M. and K.A., 2002. Toward an integrated approach to environ-
J.P. Jensen, E. Fjeld and L. Lien, 2001c. Chemistry of lakes in the
mental problems. Cicerone, 2002 (5).
Nordic region Ù Denmark, Finland with éland, Iceland, Norway
Sellers, P., C.A. Kelly, J.W.M. Rudd and A.R. MacHutchon, 1996. Pho-
with Svalbard and Bear Island, and Sweden. Acid Rain Research
todegradation of methylmercury in lakes. Nature, 380:694-697.
Report 52/2001 SNO 4391-2001, Norwegian Institute for Water
Sen, P.K., 1968. Estimates of the regression coefficient based on Kend-
Research (NIVA) Oslo. 39p.
all's tau. Journal of the American Statistical Association, 63:1379-
SkjelkvÍle, B.L., C. Evans, T. Larssen, A. Hindar and G. Raddum, 2003.
1389.
Recovery from acidification in European surface waters: a view to
Seppð, H. and J. Weckstr—m, 1999. Holocene vegetational and limno-
the future. Ambio, 32:170-175.
logical changes in the Fennoscandian tree-line area as document-
SkjelkvÍle B.L., J.L. Stoddard, D.S. Jeffries, K. T½rseth, T. H½gÍsen, J.
ed by pollen and diatom records from Lake Tsuolbmajavri, Fin-
Bowman, J. Mannio, D.T. Monteith, R. Mosello, M. Rogora, D.
land. ècoscience, 6:621-635.
Rzychon, J. Vesel», J. Wieting, A. Wilander and A. Worsztynowicz,
Seppð, H., M. Nyman, A. Korhola and J. Weckstr—m, 2002. Changes of
2005. Regional scale evidence for improvements in surface water
treelines and alpine vegetation in relation to post-glacial climate
chemistry 1990-2001. Environmental Pollution, 137:165-176.
dynamics in northern Fennoscandia based on pollen and chirono-
Sliggers, J. and W. Kakebeeke (eds.), 2004. Clearing the Air: 25 years
mid records. Journal of Quaternary Science, 17:287-301.
of the Convention on Long-range Transboundary Air Pollution.
SFT, 2002. Air Pollution Effects in the Norwegian Ù Russian Border
Geneva, United Nations Economic Commission for Europe.
Area. A Status Report. Norwegian Pollution Control Authority,
Smith, F.B. and R.D. Hunt, 1978. Meteorological aspects of the transport
Oslo. 34p.
of pollution over long distances. Atmospheric Environment,
SFT, 2004. Norwegian monitoring programme for long-range trans-
12:461-477.
ported air pollutants. Annual report Ù Effects 2003. Report
Smith, S.E. and D.J. Read, 1997. Mycorrhizal symbiosis. 2nd ed. Aca-
913/2004. Norwegian Pollution Control Authority (SFT), Oslo.
demic Press. 605p.
172p.
Smith-Sivertsen, T., V. Tchachtchine, E. Lund, V. Bykov, Y. Thomassen
SFT, 2005. Monitoring of long-range transported air pollution. Annual
and T. Norseth, 1998. Urinary nickel excretion in populations liv-
report Ù Effects 2004. Report 941/2005. Norwegian Pollution Con-
ing in the proximity of two russian nickel refineries: A Norwegian-
trol Authority (SFT), Oslo. 149p.
Russian Population-based Study. Environmental Health Perspec-
Sharma, S., D. Lavoue, H. Cachier, L.A. Barrie and S.L. Gong, 2004.
tives, 106:503-511.
Long-term trends of the black carbon concentrations in the Cana-
Smith-Sivertsen, T., V. Bykov, H. Melbye, V. Tchachtchine, A. Selnes
dian Arctic. Journal of Geophysical Research, 109, doi:10.1029/
and E. Lund, 2001. Sulphur diocide exposure and lung function
2003JD004331.
in a Norwegian and Russian population living close to a nickel
Sharma, S., E. Andrews, L.A. Barrie, J.A. Ogren, and D. Lavoues, 2006.
smelter. International Journal of Circumpolar Health, 60:342-359.
Variations and sources of the equivalent black carbon in the High
Smith-Sivertsen, T., V. Tchachtchine and E. Lund, 2003. Atopi in Nor-
Arctic revealed by long term observations at Alert and Barrow:
wegian and Russian adults: a population-based study from the
1989 Ù 2003, Journal of Geophysical Research, in press.
common border area. Allergy, 58:357.
Sharp, M., M. Skidmore and P. Nienow, 2002. Seasonal and spatial
Smol, J.P., 1992. Paleolimnology: an important tool for effective eco-
variations in the chemistry of a High Arctic supraglacial snow
system management. Journal of Aquatic Ecosystem Health, 1:49-
cover. Journal of Glaciology, 48:149-158.
58.
Shaw, G.E., 1975. The vertical distribution of atmospheric aerosols at
Smol, J.P., A.P. Wolfe, H.J.B. Birks, M.S.V. Douglas, V.J. Jones, A. Ko-
Barrow, Alaska. Tellus, 27:39-50.
rhola, R. Pienitz, K. R■hland, S. Sorvari, D. Antoniades, S.J. Brooks,
Shaw, G.E., 1981. Eddy diffusion transport of Arctic pollution from the
M.-A. Fallu, M. Hughes, B.E. Keatley, T.E. Laing, N. Michelutti, L.
mid-latitudes: a preliminary model. Atmospheric Environment,
Nazarova, M. Nyman, A.M. Paterson, B. Perren, R. Quinlan, M.
15:1483-1490.
Rautio, E. Saulnier-Talbot, S. Siitonen, N. Solovieva and J. Weck-
Shaw, G.E., 1983. Evidence for a central Eurasian source area of Arctic
str—m, 2005. Climate-Driven Regime Shifts in Arctic Lake Ecosys-
Haze in Alaska. Nature, 299:815-818.
tems. Proceedings of the National Academy of Sciences of the
Shaw, G.E., 1984. Microparticle size spectrum of Arctic haze. Geophysi-
United States of America, 102:4397-4402.
cal Research Letters, 11:409-412.
Solberg, S., C. Dye and N. Schmidbauer, 1996. Carbonyls and nonmeth-
Shaw, G.E., 1987. Aerosols as climate regulators: A climate biosphere
ane hydrocarbons at rural European sites from the Mediterranean
linkage? Atmospheric Environment, 21:985-986.
to the Arctic. Journal of Atmospheric Chemistry, 25:33-66.
Shaw, G.E., 1995. The Arctic Haze phenomenon. Bulletin of the Amer-
Solberg, S., B.L. SkjelkvÍle, P.A. Aarrestad, O. Reitan and S.E. Walker,
ican Meteorological Society, 76:2403-2412.
1999. Regional konsekvensutredning for oljevirksomheten in Nor-
Shaw, G.E. and K. Stamnes, 1980. Arctic haze: perturbation of the Polar
dj½en. Report 5: RegulÌre utslipp til luft Ù konsekvenser. (In Nor-
radiation budget. Annals of the New York Academy of Sciences,
wegian)
338:533-539.
Solberg, S., M. Lazaridis, S.-E. Walker, S. Knudsen and A. Semb, 2003.
Shaw, G.E., and G. Wendler, 1972. Atmospheric turbidity at McCall
The contribution to nitrogen deposition and ozone formation in
Glacier in northern Alaska, Proceedings of the Atmospheric Ra-
south Norway from atmospheric emissions related to the petro-
diation Conference, Fort Collins, Colorado, August 7-9, 1972.
leum activity in the North Sea. Water, Air and Soil Pollution,
Shaw, G.E., K. Stamnes and Y.X. Hu, 1993. Arctic haze: Perturbation to
148:289-321.
the radiation field. Meteorology and Atmospheric Physics, 51:227-
Solovieva, N., 2000. A palaeolimnological study of Holocene environ-
235.
mental change in a small upland lake from the Kola Peninsula,
Shipham, M.C., A.S. Bachmeier, D.R. Cahoon Jr. and E.V. Browell, 1992.
Russia. Ph.D. Thesis, University College London. 413p.
Meteorological overview of the Arctic Boundary Layer Expedition
Solovieva, N. and V.J. Jones, 2002. A multiproxy record of Holocene
(ABLE 3A) flight series. Journal of Geophysical Research, 97:16395-
environmental changes in the Kola Peninsula, northwest Russia.
16419.
Journal of Quaternary Science, 17:303-318.
Simonich, S.L. and R.A. Hites, 1995. Global distribution of persistent
Solovieva, N., V.J. Jones, P.G. Appleby and B.M. Kondratenok, 2002.
organochlorine compounds. Science, 269:1851-1854.
Extent, environmental impact and long-term trends in atmos-
Simpson, R., G. Williams, A. Petroeschevsky et al. 2001. The assessment
pheric contamination in the Usa Basin of East-European Russian
of the impact of air pollution on daily mortality and morbidity in
Arctic. Water, Air and Soil Pollution, 139:237-260.
Australian cities: description of a study. Environmental Health,
Solovieva, N., V.J. Jones, L. Nazarova, S.J. Brooks, H.J.B. Birks, J.-A.
1:13-17.
Grytnes, P.G. Appleby, T. Kauppila, B. Kondratenok, I. Renberg
Singh, H.B., D. O'Hara, D. Herlth, J.D. Bradshaw, S.T. Sandholm, G.L.
and V. Ponomarev, 2005. Palaeolimnological evidence for recent
Gregory, G.W. Sachse, D.R. Blake, P.J. Crutzen and M.A. Kanaki-
climatic change in lakes from the northern Urals, Arctic Russia.
dou, 1992. Atmospheric measurements of peroxyacetylnitrate and
Journal of Paleolimnology, 33:463-482.
other organic nitrates at high latitudes: possible sources and sinks.
Sorvari, S., A. Korhola and R. Thompson, 2002. Lake diatom response
Journal of Geophysical Research, 97(D15):16511-16522.
to recent Arctic warming in Finnish Lapland. Global Change Biol-
Sirois, A. and L.A. Barrie, 1999. Arctic lower tropospheric aerosol
ogy, 8:171-181.
trends and composition at Alert, Canada: 1980Ù1995. Journal of
Sprenger, M. and H. Wernli, 2003. A northern hemispheric climatology
Geophysical Research, 104:11599-11618.
of cross tropopause exchange for the ERA15 time period (1979-
Sj—rs, H. and U. Gunnarsson, 2002. Calcium and pH in north and
1993). Journal of Geophysical Research, 108:8521, doi:10.1029/
central Swedish mire waters. Journal of Ecology, 90:650-657.
2002JD002636.
SkjelkvÍle, B.L., J.L. Stoddard and T. Andersen, 2001a. Trends in surface
Steinnes, E., 1995. A critical evaluation of the use of naturally growing
110
AMAP Assessment 2006: Acidifying Pollutants, Arctic Haze, and Acidification in the Arctic
moss to monitor the deposition of atmospheric metals. Science of
(Russia) using multitemporal Landsat MSS/TM data. Remote
the Total Environment, 160/161:243-249.
Sensing of Environment, 85:370-388.
Steinnes, E., N. Lukina, V. Nikonov, D. Aamlid and O. R½yset, 2000. A
T½mmervik, H., B. Johansen, I. Tombre, D. Thannheiser, K.A. H½gda,
gradient study of 34 elements in the vicinity of a copper-nickel
E. Gaare and F.E. Wielgolaski, 2004. Vegetation changes in the
smelter in the Kola Peninsula. Environmental Monitoring and
Nordic mountain birch forest: the influence of grazing and climate
Assessment, 60:71-88.
change. Arctic, Antarctic, and Alpine Research, 36:323-332.
Stocks, B.J., M.A. Fosberg, T.J. Lynham, L. Mearns, B.M. Wotton, Q.
Traaen, T.S., 1987. Forsuring av innsj½er i Finnmark. SFT-Rapport
Yang, J.-Z. Jin, K. Lawrence, G.R. Hartley, J.A. Mason and D.W.
299/87, SFT, Oslo.
McKennedy, 1998. Climate change and forest fire potential in Rus-
Traaen, T.S., 1991. Forsuring og tungmetallforurensning i S½r-Var-
sian and Canadian boreal forests. Climatic Change, 38:1-13.
anger. Framdriftsrapport for 1990. SFT-Rapport 481/92, SFT,
Stoddard, J.L., D.S. Jeffries, A. L■kewille, T.A. Clair, P.J. Dillon, C.T.
Oslo.
Driscoll, M. Forsius, M. Johannessen, J.S. Kahl, J.H. Kellogg, A
Tranvik, L.J. and M. Jansson, 2002. Climate change Ù Terrestrial export
Kemp, J. Mannio, D. Monteith, P.S. Murdoch, S. Patrick, A. Reb-
of organic carbon. Nature, 415:861-862.
sdorf, B.L. SkjelkvÍle, M.P. Stainton, T.S. Traaen, H. van Dam, K.E.
Treffeisen, R., A. Herber, J. Str—m, M. Shiobara, T. Yamanouchi, S.
Webster, J. Wieting and A. Wilander, 1999. Regional trends in
Yamagata, K. HolmÕn, M. Kriews and O. Schrems, 2004. Interpre-
aquatic recovery from acidification in North America and Europe
tation of Arctic aerosol properties using cluster analysis applied
1980Ù95. Nature, 401:575-578.
to observations in the Svalbard area. Tellus, 56B:457-476.
Stoddard, J.L., J.S. Kahl, F.A. Deviney, D.R. DeWalle, C.T. Driscoll, A.
Trivett, N.B.A., L.A. Barrie, J.P. Blanchet, R.M. Bottenheim, R.M. Hoff
T. Herlihy, J.H. Kellogg, P.S. Murdoch, J.R. Webb and K.E. Webster,
and R.E. Mickle, 1989. An experimental investigation of Arctic
2003. Response of Surface Water Chemistry to the Clean Air Act
haze at Alert, NWT, March 1985. Atmosphere-Ocean, 26:341-376.
Amendments of 1990. EPA/620/R-03/001, U.S. Environmental
Tsvetkov, V.F., 1993. Threshold levels of air pollution and forest decline
Protection Agency. 92p.
in surroundings of "Severonikel" smelter complex. In: M.V. Ko-
Stohl, A., 2001. A one-year Lagrangian "climatology" of airstreams in
zlov, E. Haukioja and V.T. Yarmishko (eds.). Aerial pollution on
the northern hemisphere troposphere and lowermost stratosphere.
Kola Peninsula, pp. 397-401. Proceedings of the International
Journal of Geophysical Research, 106:7263-7279.
Workshop, April 14-16 1992, St. Petersburg. Kola Science Centre,
Stohl, A., 2006. Characteristics of atmospheric transport into the Arctic
Apatity.
troposphere. Journal of Geophysical Research, 111. No. D11, D11306
Tuovinen, J.-P., T. Laurila, H. Lðttilð, A. Ryaboshapko, P. Brukhanov
10.1029/2005JD006888.
and S. Korolev, 1993. Impact of the sulpur dioxide sources in the
Stohl, A., S. Eckhardt, C. Forster, P. James and N. Spichtinger, 2002. On
Kola Peninsula on air quality in northernmost Europe. Atmos-
the pathways and timescales of intercontinental air pollution
pheric Environment, 27A:1379-1395.
transport. Journal of Geophysical Research, 107:4684, doi:
Tutubalina, O.V. and W.G. Rees, 2001. Vegetation degradation in a
10.1029/2001JD001396.
permafrost region as seen from space: Noril'sk (1961-1999). Cold
Sturges, W.T. and L.A. Barrie, 1988. Chlorine, bromine, and iodine in
Regions Science and Technology, 32:191-203.
Arctic aerosols. Atmospheric Environment, 22:1179-1194.
Twomey, S., 1977. The influence of pollution on the shortwave albedo
Sturges, W.T. and G.E. Shaw, 1983. Halogens in aerosols in central
of clouds. Journal of the Atmospheric Sciences, 34:1149-1152.
Alaska. Atmospheric Environment, 27A:2969-2977.
Twomey, S., 1991. Aerosols, clouds and radiation. Atmospheric Envi-
Suomela, J. and P. Palokangas, 1993. Effects of aerial pollutants on plant
ronment, 25A:2435-2442.
quality for small northern mammalian herbivores. In: M.V. Kozlov,
UBA, 2004. Manual on methodologies and criteria for modelling and
E. Haukioja and V.T. Yarmishko (eds.). Aerial pollution on Kola
mapping critical loads & levels and air pollution effects, risks and
Peninsula, pp. 377-378. Proceedings of the International Work-
trends. Texte 52/04, Umweltbundesamt, www.icpmapping.org
shop, April 14-16 1992, St. Petersburg. Kola Science Centre, Apat-
UNECE, 1993. The 1993 report of the task force on mapping. EB.AIR/
ity.
WG.1/R.85
Swart, R., M. Amann, F. Raes and W. Tuinstra, 2004. A good climate
UNECE, 1994. Protocol to the 1979 Convention on Long-range Trans-
for clean air: Linkages between climate change and air pollution.
boundary Air Pollution on Further Reduction of Sulphur Emissi-
Climatic Change, 66:263-269.
ons. Document ECE/EB.AIR/40, United Nations Economic Com-
Tammi, J., M. Appelberg, U. Beier, T. Hesthagen, A. Lappalainen and
mission for Europe, 106p.
M. Rask, 2003a. Fish status of Nordic lakes: effects of acidification,
UNECE, 1999. The 1999 Protocol to Abate Acidification, Eutrophicati-
eutrophication and stocking activity on present fish species com-
on and Ground-level Ozone. Document ECE/EB.AIR, United
position. Ambio, 32:98-105.
nations Economic Commission for Europe.
Tammi, J., A. Lappalainen and T. Bergman, 2003b. Water quality and
UNECE, 2004a. Mapping Manual 2004. UNECE Convention on Long-
fish populations of acid sensitive waters in the Vðtsðri area, north-
range Transboundary Air Pollution. Manual on methodologies
eastern Finland: responses to reduced sulphur emissions from the
and criteria for modelling and mapping critical loads and levels
Kola Peninsula, Russia, in the 1990s. Boreal Environment Re-
and air pollution effects, risks and trends.
search, 8:1-7.
UNECE, 2004b. Review and assessment of air pollution effects and
Targulian, V.O., 1971. Soil formation and weathering in cold humid
their recorded trends. Report of the Working Group on Effects of
regions. Moscow: "Nauka". 268p. (In Russian)
the Convention on Long-range Transboundary Air Pollution. Uni-
Tarhanen, S., S. Metsðrinne, T. Holopainen and J. Oksanen, 1999. Mem-
ted Nations Economic Commission for Europe.
brane permeability response of lichen Bryoria fuscescens to wet
Valero, F.P.J., T.P. Ackerman and W.J.R. Gore, 1989. The effects of the
deposited heavy metals and acid rain. Environmental Pollution,
arctic haze as determined from airborne radiometric measure-
104:101-129.
ments during AGASP II. Journal of Atmospheric Chemistry, 9:225-
Tenow, O. and H. Bylund, 2000. Recovery of a Betula pubescent forest
244.
in northern Sweden after severe defoliation by Epirrita autumnata.
Valkama, J. and M.V. Kozlov, 2001. Impact of climatic factors on the
Journal of Vegetation Science, 11:855-862.
developmental stability of mountain birch growing in a contami-
The Royal Society, 2005. Ocean acidification due to increasing atmos-
nated area. Journal of Applied Ecology, 38:665-673.
pheric carbon dioxide. Policy document 12/05.
van Rompaey, R.S.A.R., 1995. Acidification interacting with global
Thurston, D., 2003. Offshore Oil and Gas Activities in the Arctic. PAME
changes: research to manage drifting systems. In: G.J. Heij and J.W.
Background paper.
Erisman (eds.). Acid rain research: do we have enough answers?
Thurston, G.D. and K. Ito, 2001. Epidemiological studies of acute ozone
pp. 381-384. Elsevier Science.
exposures and mortality. Journal of Exposure Analysis and Envi-
Vassilieva, N., M. Gytarsky and R. Karaban, 1995. Changes of the
ronmental Epidemiology, 11:286-294.
dominant species of the epiphytic lichens and ground vegetation
Tikkanen, E. and I. Niemelð, 1995. Kola Peninsula pollutants and for-
cover in the forests subjected to "Pechenganicel" smelter impact.
est ecosystems in Lapland. Final Report of the Lapland Forest
In: E. L½bersli and K. Venn (eds.). Effect of air pollution on terrest-
Damage Project. Finland's Ministry of Agriculture and Forestry
rial ecosystems in the border area between Norway and Russia,
and The Finnish Forest Research Institute, Gummerus, Jyvðskylð,
pp. 103-111. Proceedings from the second symposium, Svanvik,
82p.
Norway, 3-5 October 1994. Directorate for Nature Management,
T½mmervik, H., B.E. Johansen and J.P. Pedersen, 1995. Monitoring the
Trondheim.
effects of air pollution on terrestrial ecosystems in Varanger (Nor-
Vestreng, V., 2003. Review and revision of emission data reported to
way) and Nikel-Pechenga (Russia) using remote sensing. Science
CLRTAP. EMEP/MSC-W Note1. Norwegian Meteorological Insti-
of the Total Environment, 160/161:753-767.
tute.
T½mmervik, H., M.E. Johansen, J.P. Pedersen and T. Guneriussen, 1998.
Vinebrooke, R.D., K.L. Cottingham, J. Norberg, M. Scheffer, S.I. Dod-
Integration of remote sensed and in-situ data in an analysis of the
son, S.C. Maberly and U. Sommer, 2004. Impacts of multiple stres-
air pollution effects on terrestrial ecosystems in the border areas
sors on biodiversity and ecosystem functioning: the role of species
between Norway and Russia. Environmental Monitoring and As-
co-tolerance. OIKOS, 104:451-457.
sessment, 49:51-85.
Virtanen, T., K. Mikkola, E. Patova and A. Nikula, 2002. Satellite ima-
T½mmervik, H., K.A. H—gda and I. Solheim, 2003. Monitoring vegeta-
ge analysis of human caused changes in the tundra vegetation
tion changes in Pasvik (Norway) and Pechenga in Kola Peninsula
around the city of Vorkuta, North-European Russia. Environmen-
111
References
tal Pollution, 120:647-658.
Wrona, F.J., T.D. Prowse and J.D. Reist, 2005. Chapter 8. Freshwater
Vollenweider, R.A. and J. Kerekes, 1982. Eutrophication of waters,
ecosystems and fisheries. In: Arctic Climate Impact Assessment,
monitoring, assessment and control. Oganization for Economic
pp. 353-452. Cambridge University Press.
Cooperation and Development, Paris, 154p.
WWF, 2005. Areas vulnerable to acute oil pollution in the Norwegian
VTI/IVL, 2004. Data on SOx and NOx emissions from Russian Coal
Barents Sea. Report: 2005-0456. World Wide Fund for Nature.
Fired Power Plants for the year 2000; compiled by the VTI All
Yakovlev, V.A., 1992. Benthic invertebrates, zooplankton and phytop-
Russia Thermal Engineering Institute, for the project `Mercury
lankton communities in relation to pollution of waters in the Ko-
Co-Benefit Activities with SO2 Control Technology Development
la Peninsula. In: K. Kinnunen and M. Varmola (eds.). Effects of air
in Russia' led by the Swedish Environmental Research Institute
pollutants and acidification in combination with climatic factors
(IVL) and funded by the US EPA Office of International Affairs
on forests, soils and waters in Northern Fennoscandia, pp. 109-114.
International Cooperation.
Nordic Council of Ministers, Copenhagen.
Vuorenmaa, J., M. Forsius and J. Mannio, 2006. Increasing trends of
Yakovlev, V.A., 1999. Acidity of small lakes in Finnish Lapland Ù based
total organic carbon concentrations in small forest lakes in Finland
on aquatic macroinvertebrate studies in 1993-1995. Publication/
from 1987 to 2003. Science of the Total Environment, 365:47-65.
brochure 1/18/1999, Lapland Regional Environmental Centre,
Waggoner, A.P. and R.E. Weiss, 1980. Comparison of the fine particle
Rovaniemi.
mass concentration and light scattering extinction in ambient ae-
Yakovlev, V.A., 2000. Trophic structure of zoobenthos as an ecological
rosol. Atmospheric Environment, 14:623-626.
indicator for aquatic ecosystems and a water quality index. Vod-
WÍhlin, P., F. Palmgren and R.V. Dingenen, 2002. Experimental studies
nye Resursy (Water Resources), 27:237-244.
of ultrafine particles in streets and the relationship to traffic. At-
Zaguralskaya, L.M. and S.S. Ziabchenko, 1994. Impact of industrial
mospheric Environment, 35(Suppl. 1):S63-S69.
pollution on microbial processes in boreal forests of Kostomuksha
Walker, T.R., P.D. Crittenden and S.D. Young, 2003a. Regional variati-
region. Pochvovedenie (Eurasian Soil Science), 5:105-110. (In Rus-
on in the chemical composition of winter snow pack and terrico-
sian)
lous lichens in relation to sources of acid emissions in the Usa river
Zenkova, I.V., 1999. The state of soil fauna in the impact zone of the
basin, northeast European Russia. Environmental Pollution,
`Severonikel' smelter. In: Y.A. Izrael, G.V. Kalabin and V.V. Niko-
125:401-412.
nov (eds.). Anthropogenic impact on northern nature and its eco-
Walker, T.R., S.D. Young, P.D. Crittenden and H. Zhang, 2003b. Anthro-
logical consequences, pp. 293-310. Kola Science Centre, Apatity.
pogenic metal enrichment of snow and soil in North-Eastern Eu-
(In Russian)
ropean Russia. Environmental Pollution, 121:11-21.
Zenkova, I.V. and E.M. Zainagutdinova, 2002. Industrial pollution of
Wania, F., 2003. Assessing the potential of persistent organic chemicals
soils and individual parameters of soil inhabited group of beetles.
for long-range transport and accumulation in polar regions. En-
In: N.B. Hitrov (ed.). Steadiness of soils to natural and human-
vironmental Science and Technology, 37:1344-1351.
induced impacts, pp. 257-258. Abstracts to presentations of All-
Warren, S.G. and W.J. Wiscombe, 1980. A model for the spectral albedo
Russian conference, 24-25 April 2002, Moscow. (In Russian)
of snow. II. Snow containing atmospheric aerosols. Aerosol Scien-
Zhang, T., K. Stamnes and S.A. Bowling, 1996. Impact of clouds on
ce and Technology, 4:31-43.
surface radiative fluxes and snowmelt in the Arctic and subarctic.
Watanabe, O., H. Motoyama, M. Igarashi, K. Kamiyama, S. Matoba, K.
Journal of Climate, 9:2110-2123.
Goto-Azuma, H. Narita, H. Kameda, 2001. Studies on climatic and
Zvereva, E.L., 1993a. Population densities of some flies in an air pol-
environmental changes during the last few hundred years using
lution gradient near Monchegorsk,. In: M.V. Kozlov, E. Haukioja
ice cores from various sites in Nordaustlandet, Svalbard. Mem.
and V.T. Yarmishko (eds.). Aerial pollution on Kola Peninsula, pp.
Natl. Inst. Polar Reseach, 54: 227Ù242.
371-373. Proceedings of the International Workshop, April 14-16
Weatherhead, B., A. Tanskanen and A. Stevermer, 2005. Chapter 5.
1992, St. Petersburg. Kola Science Centre, Apatity.
Ozone and ultraviolet radiation. In: Arctic Climate Impact Assess-
Zvereva, E.L., 1993b. Effect of industrial pollution on fly communities
ment, pp. 151-182. Cambridge University Press.
(Diptera, Brachycera). Entomol. Obozr., 72:558-569. (In Russian;
Weckstr—m, J., A. Korhola and T. Blom, 1997. Diatoms as quantitative
English translation: Ent. Rev. 1994, 73(2):45-57).
indicators of pH and water temperature in subarctic Fennoscan-
Zvereva, E.L., 1999. Can global warming promote insect outbreaks by
dian lakes. Hydrobiologia, 347:171-184.
changing host plant quality? In: M.A. Lange, B. Bartling and K.
Weckstr—m, J., A. Korhola, J.A. Snyder, T.E. Laing and G.M. MacDo-
Grosfeld (eds.). Global Changes and the Barents Sea Region. Pro-
nald, 2003. Diatom inferred acidity history of 32 lakes on the Kola
ceedings of the First International BASIS Research Conference, pp
Peninsula, Russia. Water, Air and Soil Pollution, 149:339-361.
393-394. St.Petersburg, February 22-25 1998.
Wesely, M.L. and B.B. Hicks, 2000. A review of the current status of
Zvereva, E.L. and M.V. Kozlov, 2000. Natural enemies of the leaf beet-
knowledge on dry deposition. Atmospheric Environment, 34:2261-
le, Melasoma lapponica, in the impact zone of a nickel-copper smel-
2282.
ter: density dependence and effects of air pollution. Journal of
WHO, 1996. Diesel fuel and exhausts emissions. Environmental health
Applied Ecology, 37:298-308.
criteria No 171. World Health Organization.
Zvereva, E.L. and M.V. Kozlov, 2001. Effects of pollution-induced ha-
WHO, 1997. Health and environment in sustainable development.
bitat disturbance on the response of willows to simulated herbi-
(WHO/EHG/97.8). World Health Organization.
vory. Journal of Ecology, 89:21-30.
WHO, 2001. Air quality guidelines for Europe. Updated version. World
Zvereva, E.L. and M.V. Kozlov, 2005. Growth and reproduction of
Health Organization.
dwarf shrubs, Vaccinium myrtillus and V. vitis-idaea, in a severely
Wigington, P.J., T.O. Davices, M. Tranter and K.N. Eshleman, 1992.
polluted area. Basic and Applied Ecology, 6:261-274.
Comparison of episodic acidification in Canada, Europe and the
Zvereva, E., M.V. Kozlov and S. Neuvonen, 1995a. Population density
United States. Environmental Pollution, 78:29-35.
and performance of Melasoma lapponica (Coleoptera: Chrysomeli-
Wilander, A., 1994. Estimation of ground sulphate in natural surface
dae) in surroundings of smelter complex. Environmental Entomo-
waters in Sweden. Water Air Soil Pollution, 75:371-387.
logy, 24:707-715.
Wilander, A., 1998. Water chemistry in reference lakes during 12 years;
Zvereva, E.L., M.V. Kozlov and S. Neuvonen, 1995b. Decrease in fee-
status and trends. Report 4652, NaturvÍrdsverket F—rlag, Stock-
ding niche breadth of Melasoma lapponica (Coleoptera: Chrysome-
holm, Sweden. 79p. (In Swedish)
lidae) with increase in pollution. Oecologia, 104:323-329.
WillÕn, E., 2003. Dominance patterns of planktonic algae in Swedish
Zvereva, E.L., M.V. Kozlov, P. Niemelð and E. Haukioja, 1997a. Delayed
forest lakes. Hydrobiologia, 502:315-324.
induced resistance and increase in leaf fluctuating asymmetry as
Wolfe, A., 2002. Climate modulates the acidity of Arctic lakes on mil-
responses of Salix borealis to insect herbivory. Oecologia, 102:368-
lennial time scales. Geology, 3:215-218.
373.
Wotawa, G., P.C. Novelli, M. Trainer and C. Granier, 2001. Interannual
Zvereva, E.L., M.V. Kozlov and E. Haukioja, 1997b. Population dyna-
variability of summertime CO concentrations in the Northern
mics of a herbivore in an industrially modified landscape: case
Hemisphere explained by boreal forest fires in North America and
study with Melasoma lapponica (Coleoptera: Chrysomelidae). Acta
Russia. Geophysical Research Letters, 28:4575-4578.
Phytoipatologica et Entomologica Hungarica, 32:251-258.
Wright, R.F. and A. Jenkins, 2001. Climate change as a confounding
Zvereva, E.L., M.V. Kozlov and O. Yu. Kruglova, 2002. Color polymor-
factor in reversibility of acidification: RAIN and CLIMEX projects.
phism in relation to population dynamics of the leaf beetle Chryso-
Hydrology and Earth System Sciences, 5:477-486.
mela lapponica. Evolutionary Ecology, 16:523-539.
Wright, R.F., L. Camarero, B.J. Cosby, R.C. Ferrier, M. Forsius, R. Hel-
Zvereva, E.L., V. Serebrov, V. Glupov and I. Dubovsky, 2003. Activity
liwell, A. Jenkins, J. Kopà ek, T. Larssen, V. Majer, F. Moldan, M.
and heavy metal resistance of non-specific esterases in leaf beetle
Posch, M. Rogora and W. Sch—pp, 2005. Recovery of acidified
Chrysomela lapponica from polluted and unpolluted habitats. Com-
European surface waters. Environmental Science and Technology,
parative Biochemistry and Physiology, Part C 135:383-391.
39:64A-72A.
Abbreviations
LRTAP Convention
Convention on Long-Range
Transboundary Air Pollution
*
of non-marine origin
MFR scenario
emissions scenario based on
maximum technically feasible
1-D
one-dimensional
reductions
3-D
three-dimensional
Mg
magnesium
Al
aluminum
Mn
manganese
AMAP
Arctic Monitoring and
N
nitrogen
Assessment Programme
Na
sodium
ANC
acid neutralizing capacity
NAO
North Atlantic Oscillation
AO
Arctic Oscillation
N O
nitrous oxide
2
AOD
aerosol optical depth
NH
ammonia
3
BC
black carbon / base cation
NH
ammonium
4
C
carbon
NH -N
ammonium nitrogen
4
Ca
calcium
Ni
nickel
C-horizon
parent material of soil
NILU
Norwegian Institute for
Air Research
CH
methane
4
Cl
chloride
nmVOC
non-methane volatile
organic compounds
CL
critical load of acidity
Ac
CLE scenario
emissions scenario based
NO
nitrogen dioxide
2
on current legislation
NO
nitrate
3
CO
carbon monoxide
NO -N
nitrate nitrogen
3
CO
carbon dioxide
NO
nitrogen oxides
2
X
Cu
copper
NO -N
nitrogen oxides nitrogen
X
DEHM
Danish Eulerian
NSR
Northern Sea Route
Hemispheric Model
O-horizon
organic horizon of soil
DIC
dissolved inorganic carbon
S
sulfur
DI-pH
diatom-inferred pH
SO
sulfur dioxide
2
DOC
dissolved organic carbon
SO
sulfate
4
EANET
Acid Deposition Monitoring
SO -S
sulfate sulfur
4
Network in East Asia
SO
sulfur oxides
X
EMEP
Co-operative Programme for
UN ECE
UN Economic Commission
Monitoring and Evaluation of
for Europe
the Long-range Transmission
of Air Pollutants in Europe
UV
ultraviolet
K
potassium
Zn
zinc

A
M
A
P
AMAP Assessment 2006:
A
s
s
e
Acidifying Pol utants, Arctic Haze,
s
s
m
e
and Acidification in the Arctic
n
t
2
0
0
6
:
A
c
i
d
i
f
y
i
n
g
P
o
l
u
t
a
n
t
s
,
A
r
c
t
i
c
H
a
z
e
,
a
n
d
A
c
i
d
i
fi
c
a
t
i
o
n
i
n
t
h
e
A
r
c
t
i
c
Arctic Monitoring and Assessment Programme (AMAP)
ISBN 82-7971-046-9
Document Outline
- Chapter 5: Effects on Terrestrial Ecosystems
- 5.1. Effects on soils
- 5.1.1. Acidity status of soils on the Kola Peninsula
- 5.1.1.1. Natural factors affecting soil acidity
- 5.1.1.2. Sulfur dioxide emissions and soil acidity
- 5.1.1.3. The role of overburden and bedrock chemistry
- 5.1.1.4. Connections between soil condition and ecosystem quality
- 5.1.1.5. Temporal trends in soil acidity
- 5.1.2. Acidification and the acidity status of soils in the Norilsk area
- 5.1.3. Effects on soil micro-organisms
- 5.2. Effects on vegetation in the European Arctic
- 5.2.1. Lichen-dominated and mountain birch (tundra) ecosystems
- 5.2.2. Coniferous forest ecosystems
- 5.2.3. Reindeer grazing, climate change, nitrogen deposition, and other factors
- 5.2.4. Needs and recommendations for future research and monitoring
- 5.3. Effects on fauna
- 5.3.1. Effects on birds and mammals
- 5.3.1.1. Mammals
- 5.3.1.2. Birds
- 5.3.1.3. Concluding comments on birds and mammals
- 5.3.2. Effects on invertebrates
- 5.3.2.1. Size, individual performance, and population structure
- 5.3.2.2. Changes in population densities
- 5.3.2.3. Changes in species richness, diversity, and community structure
- 5.3.2.4. Concluding comments on invertebrates
- 5.4. Critical loads of acidity and their exceedance
- Chapter 6: Effects on Freshwater Ecosystems
- 6.1. Evidence from waterquality monitoring
- 6.1.1. Current status
- 6.1.1.1. Northern Fennoscandia and the Kola Peninsula
- 6.1.1.2. Iceland
- 6.1.1.3. Svalbard and Bear Island
- 6.1.1.4. New critical loads and exceedance calculations for the Euro-Arctic Barents region
- 6.1.1.5. Current status in Arctic Canada
- 6.1.1.6. Naturally acidic lakes in Arctic Canada
- 6.1.1.7. Alaska
- 6.1.1.8. Northern Russia, Siberia
- 6.1.2. Temporal trends
- 6.1.2.1. Lakes in Finland, Norway, and Sweden
- 6.1.2.2. Lakes on the Kola Peninsula
- 6.1.2.3. Swedish repeated lake survey
- 6.1.2.4. Concluding comments on trends
- 6.2. Effects of acidification on arctic biota
- 6.2.1. Current status
- 6.2.1.1. Phytoplankton and periphyton
- 6.2.1.2. Macroinvertebrates
- 6.2.1.3. Fish
- 6.2.2. Temporal trends
- 6.2.2.1. Invertebrates
- 6.2.2.2. Fish
- 6.3. Episodic acidification
- 6.3.1. Acidic episodes in the Kola region
- 6.3.2. Acidic episodes in the Dalelva catchment in eastern Finnmark, Norway
- 6.3.3. Acidic episodes in northern Sweden
- 6.3.4. Concluding comments on episodic acidification
- 6.4. Evidence from paleolimnological studies
- 6.4.1. Millennial trends in lake acidification
- 6.4.1.1. Fennoscandia and the Kola Peninsula
- 6.4.1.2. Concluding comments on millennial-scale acidification
- 6.4.2. Recent acidification
- 6.4.2.1. Fennoscandia and the Kola Peninsula
- 6.4.2.2. Siberia
- 6.4.2.3. Svalbard
- 6.4.2.4. Concluding comments on recent acidification
- 6.5. Interaction between acidification and other environmental issues
- 6.5.1. Interactions concerning climate change and UV radiation
- 6.5.1.1. Anticipated changes in climate
- 6.5.1.2. Anticipated changes in hydrology and water quality
- 6.5.1.3. Recovery from acidification in surface waters
- 6.5.1.4. Impacts of DOC changes on UV radiation in lakes
- 6.5.2. Interactions concerning heavymetals/contaminants
- 6.5.2.1. Processes in air
- 6.5.2.2. Processes in terrestrial areas
- 6.5.2.3. Processes in surface waters
- Chapter 7: Air Pollution and Health Impacts in the Arctic
- 7.1. Major air pollutants of health concern
- 7.2. Key epidemiological findings
- 7.3. The arctic perspective
- 7.4. The shifting panorama
- Chapter 8: Conclusions and Recommendations
- 8.1. Sources of acidifying pollutants and arctic haze precursors
- 8.2. Trends in air concentrationsand deposition
- 8.2.1. Air and precipitation
- 8.2.2. Model projections
- 8.3. Arctic haze
- 8.4. Effects
- 8.4.1. Human health
- 8.4.2. Terrestrial ecosystems
- 8.4.3. Freshwater ecosystems
- 8.5. Links between acidification, arctic haze, and other environmental issues
- 8.6. Gaps in knowledge and recommendations concerning monitoring and research needs
- 8.6.1. Geographical gaps
- 8.6.2. Data availability
- 8.6.3. Trends in air and precipitation
- 8.6.4. Pathways
- 8.6.5. Effects monitoring and research
- 8.6.6. Models
- References
- Abbreviations