Chapter 4
Persistant toxic substances (PTS)
sources and pathways
4.1. Introduction
Chapter 4
4.1. Introduction
4.2. Assessment of distant sources:
In general, the human environment is a combination
Long range atmospheric transport
of the physical, chemical, biological, social and cultur-
Due to the nature of atmospheric circulation, emission
al factors that affect human health. It should be recog-
sources located within the Northern Hemisphere, par-
nized that exposure of humans to PTS can, to certain
ticularly those in Europe and Asia, play a dominant
extent, be dependant on each of these factors. The pre-
role in the contamination of the Arctic. Given the spa-
cise role differs depending on the contaminant con-
tial distribution of PTS emission sources, and their
cerned, however, with respect to human intake, the
potential for `global' transport, evaluation of long-
chain consisting of `source pathway biological avail-
range atmospheric transport of PTS to the Arctic
ability' applies to all contaminants. Leaving aside the
region necessarily involves modeling on the hemi-
biological aspect of the problem, this chapter focuses
spheric/global scale using a multi-compartment
on PTS sources, and their physical transport pathways.
approach. To meet these requirements, appropriate
modeling tools have been developed.
Contaminant sources can be provisionally separated
into three categories:
Extensive efforts were made in the collection and
·
Distant sources: Located far from receptor sites in
preparation of input data for modeling. This included
the Arctic. Contaminants can reach receptor areas
the required meteorological and geophysical informa-
via air currents, riverine flow, and ocean currents.
tion, and data on the physical and chemical properties
During their transport, contaminants are affected by
of both the selected substances and of their emissions.
the combined effects of physical and chemical fac-
It should be noted that reliable and relatively compre-
tors. Persistence in the environment is, therefore,
hensive information on emission sources is currently
one of the most important characteristic in deter-
not available for most PTS. Therefore, an assessment of
mining the ability of contaminants to reach the
long-range atmospheric transport was undertaken for
Arctic. In this respect, PTS, due to their low degra-
substances for which emission source information is
dation rates, are often considered to be `global con-
sufficient to meet modeling requirements, namely,
taminants' subject to long-range transportation.
mercury (Hg), polychlorinated biphenyls (PCBs) and
-hexachlorocyclohexane (-HCH). It was considered
·
Local sources: These are located in receptor
that modeling results obtained for these contaminants
region, often in the vicinity of indigenous commu-
could be extrapolated to give a general overview on the
nities. Although transport of contaminants from
situation with respect to long-range atmospheric trans-
local sources to recipients is determined by the same
port of other PTS in the study.
physical and chemical processes as contaminants
from distant sources, there are a wider range of path-
An assessment of mercury, PCB and -HCH pollution
ways and mechanisms that may be involved in the
arising from emission sources in the Northern
case of local sources. For example, mechanisms of
Hemisphere and affecting regions of the Russian
soil contamination from local sources can differ sig-
North inhabited by indigenous peoples, was carried
nificantly, such that effects of local contamination
out for the reference year 1996. This assessment
can be much greater than those resulting from con-
included an evaluation of air concentrations and dep-
tamination from distant sources. In contrast to dis-
osition levels, as well as source-receptor relationships
tant sources, local sources can also affect recipients
for selected regions and for the Arctic as a whole.
through contamination by more readily degradable
Particular attention was given to the fate of contami-
substances as well as the persistent contaminants.
nants in different environmental compartments (air,
Although non-persistent contaminants are beyond
soil, water, etc.). The effect of PCBs and -HCH trans-
the scope of this project, it is important to note that
port via ocean currents, ice cover dynamics, and
the effects of PTS, when combined with those of
`Mercury Depletion Event' (MDE) (Schroeder et al.,
other types of contaminants originating from local
1998) chemistry on Arctic pollution were also exam-
sources, may be substantially increased. Similarly,
ined.
humans exposed to and affected by PTS may be
more sensitive to the acute toxic effects of other less
4.2.1. Climate conditions
persistent contaminants from local sources.
and atmospheric circulation patterns
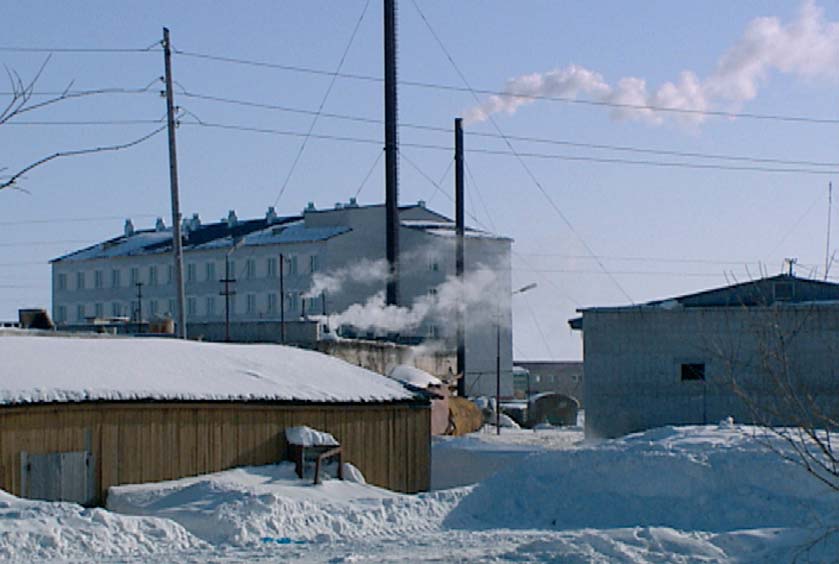
The climate of the Russian Arctic is characterized by a
·
Contact sources: These comprise the intentional or
lack of solar radiation during the winter, which leads to
unintentional use of chemicals by recipients in every-
very low temperatures. In contrast, solar radiation flux
day household and occupational uses. For example,
in the summer is significant, but temperatures are still
the health of individuals using PTS-containing insec-
not high, as most incoming solar energy is utilized in
ticides for pest control or for the treatment of rein-
the melting of ice and snow. Atmospheric circulation is
deer may be directly affected by the products. A typi-
characterized by cyclonic activity in all seasons, which
cal example of an unintentional contact contaminant
promotes the exchange of air masses between the mid-
source would be the use of paints and insulating mate-
dle and high latitudes. As a result of the prevailing west-
rials containing PTS in the indoor environment.
erly airflows, the Russian Arctic experiences the mod-
34
Chapter 4
4.2. Assessment of distant sources: Long range atmospheric transport
erating influence of the Atlantic (North Atlantic
Current). This influence is stronger in western parts
than in central and eastern parts. The western Russian
Arctic is therefore warmer, with a much lower temper-
ature variation between winter and summer than that
found in the eastern part of the Russian North, which
is characterized by the more severe climatic conditions.
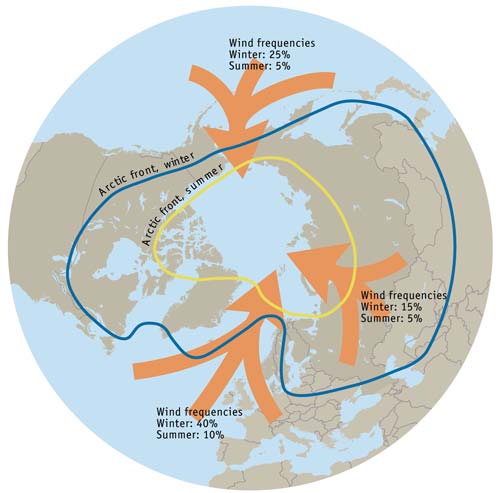
Atmospheric circulation in the Arctic region differs
between winter and summer (Figure 4.1) with the pre-
vailing atmospheric currents in the lower Arctic tropo-
sphere depending upon the location of quasi-station-
ary pressure systems in the Northern Hemisphere, the
Icelandic and Aleutian Lows, and Siberian and North
American Highs.
In winter, due to the geographical position of these sys-
tems, air masses move into the Arctic from Europe in a
northeasterly direction, or from central Asia and
Siberia. Western regions of the Russian North
Murmansk Oblast and the Nenets Autonomous Okrug
Figure 4.1. Mean position of the Arctic air mass in January and July,
(AO) are affected mainly by southwesterly or westerly
and the winter and summer frequencies of winds (AMAP, 1997).
airflows, bringing air masses from Eastern and Central
Europe, as well as from central Russia. In the central
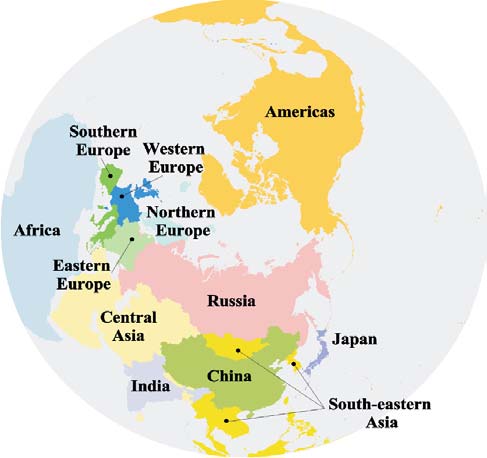
4.2.2. Emission sources
regions Yamalo-Nenets AO, Taymir AO, and the
Emission sources of Hg, PCBs and -HCH were divided
Republic of Sakha (Yakutia) southerly airflows pre-
into several groups according to their geographical
vail, transporting air masses from central Russia, the
location (Figure 4.2). The key criterion used for the
Urals, the south of Siberia and central and eastern
selection of a specific region as an aggregate emission
Asia. Over the easternmost region the Chukchi AO
source was the possible influence of emissions from
northerly airflows predominate in winter.
this region on the Russian North.
In summer, the continental high-pressure systems dis-
appear and oceanic low-pressure systems weaken. Over
the Arctic Ocean, high-pressure systems occur more
frequently than in winter, causing an outflow of Arctic
air in the meridional direction. The European region
comes under the impact of the Azores anticyclone.
Over central Eurasia and the central part of North
America, low-pressure systems dominate. The influx of
air masses to the Arctic mainly occurs over the Aleutian
Islands/Bering Sea region in the east, and from the
North Atlantic, along the north-western periphery of
Azores anticyclone, in the west. Compared with winter,
the northerly component is more frequent in atmos-
pheric transport in summer across all regions of the
Russian Arctic except for Chukotka. Chukotka, during
the summer, is predominantly affected by transport
either from the Pacific Ocean, or from Eastern Asia
and the Russian Far East, some transport from the
north still occurs however.
Figure 4.2. Source regions of the Northern Hemisphere considered
Atmospheric circulation is also responsible for the pre-
in the source receptor analysis.
cipitation pattern in the Russian Arctic. The most abun-
dant annual precipitation takes place in the western part
The number of the selected regions varies for different
and can reach 500-600 mm/y. Annual precipitation
pollutants. For simplicity, generalized names were used
decreases from the west towards the east, and over the
for some regions, e.g., the region identified as `Central
north of the Republic of Sakha (Yakutia) is mainly within
Asia' actually includes central, western, and southern
the range of 100-150 mm/y. In the easternmost part of the
Asia. Selected emission sources regions for the pollutants
Russian Arctic, precipitation is relatively high (300-
under consideration are presented in Table 4.1. Source
600 mm/y), and caused by the southerly transport of air
region boundaries also vary depending upon the contam-
masses from the Pacific Ocean, especially during summer.
inant in question. For example, China and Japan are con-
35
4.2. Assessment of distant sources: Long range atmospheric transport
Chapter 4
sidered as separate sources for mercury, but included in
Mercury
larger Asian source regions for the other contaminants.
The industrial and urbanized regions of the world
For -HCH, China and India are important enough
account for the majority of anthropogenic mercury
sources to consider their emissions separately, whereas
emissions to the atmosphere. To evaluate the anthro-
Northern Europe was omitted as -HCH emissions in this
pogenic input of mercury to the Northern
region in 1996 were insignificant. The Americas (North
Hemisphere, the most recently available global emis-
and Central) are included as a single source region, due
sion inventory, that for 1995, (Pacyna and Pacyna,
to their greater distance from the Russian North.
2002) was used. The original global emissions dataset
has a resolution of 1°x1° lat./long., with mercury emis-
sions speciated into three chemical forms: gaseous ele-
mental mercury (Hg0), gaseous oxidized mercury
(Hg2+), and particulate mercury (Hgpart). These emis-
sion data were redistributed to a lower resolution
(2.5°x2.5°), suitable for input to the air transport
model employed, assuming uniform distribution over
each grid cell.
The most significant emission sources are in Eastern
Asia, Europe and the eastern part of North America.
Considerable emissions also occur in the Indian sub-
continent and the Arabian Peninsula. The total
amount of anthropogenic mercury emissions in 1995
from the Northern Hemisphere was estimated as 1887
tonnes.
Table 4.1. Regions of the Northern Hemisphere selected as source areas
In order to assess the impact of different mercury emis-
for long range transported pollutants.
sion sources on the contamination of the Russian
North, the entire hemispheric emission field was divid-
Due to their proximity to the Russian North and the sig-
ed into 11 regions: Russia, China, Central Asia, the
nificant polluting influence of some regions of the
Americas, Japan, Southeast Asia, Africa, Eastern
Russian Federation, the territory of Russia was subdivid-
Europe, Western Europe, Southern Europe, and
ed into twelve source regions according to current
Northern Europe. The relative contribution of each
administrative boundaries and to their potential impact
region to total mercury emissions in the Northern
on Arctic ecosystems. The Location of these regions and
Hemisphere is presented in Figure 4.4(a).
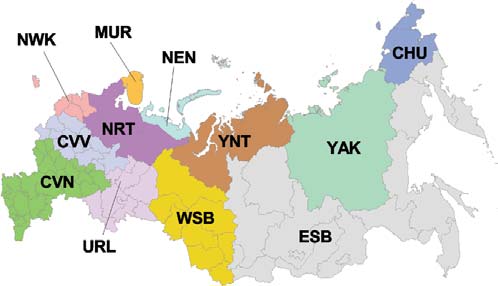
abbreviated identification codes is shown in Figure 4.3.
The first five regions (MUR, NEN, YNT, YAK, and
This diagram shows that more than one third (34%) of
CHU) are also considered as the receptor regions.
the total mercury emissions originate in China.
Considerable emissions also originate in Central Asia
(14%), the Americas (11%), Japan (9%), and Russia
(8%). The contribution of other regions specified does
not exceed 7%.
Figure 4.4(b) shows total mercury emissions from differ-
ent regions of the Russian Federation. The most signifi-
cant emission sources are located in the Central-
Chernozem, Volga, and North-Caucasian regions (CVN),
the Ural region (URL), and the Central and Volgo-Viatsky
regions (CVV).
Mercury emissions from natural sources contribute a
MUR Murmansk Oblast;
NWK North-Western region
significant proportion of the total mercury input to the
and Kaliningrad Oblast;
atmosphere. Estimates for the value of natural emis-
NEN The Nenets AO;
CVV Central
and Volgo-Viatsky regions;
sions and re-emissions were based on a literature sur-
YNT The Yamalo-Nenets AO
CVN Central-Chernozem, Volga
vey. Mercury emissions from natural sources were
and Taymir AO;
and Northern Caucasus regions;
YAK The Republic of Sakha (Yakutia); URL Ural region;
apportioned over the Northern Hemisphere on the
CHU The Chukchi AO;
WSB West Siberian region;
basis of the nature of the underlying land/sea surface.
NRT Northern region;
ESB East Siberian and Far-Eastern
Five surface categories were distinguished: ice covered
regions.
land (glaciers, etc), seawater, soil developed from geo-
chemical mercury belts, soils in areas of mercury
Figure 4.3. Aggregated regions of the Russian Federation chosen for source recep
tor analysis. The first five regions listed (MUR, NEN, YNT, YAK, and CHU) are consid
deposits, and other (background) soils. It was assumed
ered as both source and receptor regions, the rest are considered as source regions.
that there is zero mercury emission from ice caps/gla-
36
Chapter 4
4.2. Assessment of distant sources: Long range atmospheric transport
b
Figure 4.4.
(a) Contribution of different regions of the Northern Hemisphere
to total anthropogenic mercury emissions, (b) total anthropogenic
mercury emissions from different regions of the Russian Federation.
a
ciers. Natural emissions from seawater were distributed
in 1996 were about 80, 23, 16, and 4.5 tonnes, respec-
proportionally to the ocean's primary production of
tively. Congener composition of PCB emissions varies
carbon. Emissions from soil are most significant from
between source regions.
soils occurring over mercury deposits and lowest for
background soils. In addition, the temperature
In order to study the contributions of different source
dependence of emission fluxes was also calculated,
regions in the Northern Hemisphere to the contami-
based on data obtained through measurements.
nation of the receptor-regions in the Russian Arctic, six
main regional sources were identified, based on the
PCBs
emission distribution: Russia, Northwest Europe,
Modeling long-range transport of individual PCB con-
Southeast Europe, the Americas, Southeast Asia, and
geners to the Russian North was made using a global
Central Asia and Africa.
emission inventory concerning 22 individual PCB con-
geners covering the period 1930-2000 (Breivik et al.,
The major emission sources of PCBs in the Northern
2002b). This inventory is based on estimates of the
Hemisphere in 1996 were the Americas (24%),
global production and consumption of these PCBs in
Russia (23%), Southeast Europe (19%), and
114 countries (Breivik et al., 2002a). The emissions
Northwest Europe (16%) (Figure 4.5(a)). The main
were distributed to the (2.5° x 2.5° lat./long.) model
Russian emission sources are located in Central-
grid using (as a proxy for emission distribution) a 1990
Chernozem, Volga and North-Caucasus regions (CVN)
population distribution data set obtained from the
as well as in Central and Volgo-Viatsky regions (CVV)
CGEIC website (http://www.ortech.ca/cgeic).
(Figure 4.5(b)).
The total global production of PCBs from 1930-1993
-HCH
amounted to approximately 1.3 million tonnes. Almost
The scenario for -HCH emissions in the Northern
97% of intentionally produced PCBs were used in the
Hemisphere was based on official data submitted to
Northern Hemisphere. Emission data for individual
the UN ECE Secretariat in 2002 (Vestreng and Klein,
congeners for 1996 were used in all model calculations
2000) and available expert estimates (Pacyna et al.,
and, according to the high emission scenario discussed
1999). In addition, -HCH emissions for 1990-1996
by Breivik et al. (2002b), total emissions of the 22 PCB
from the Russian Federation, and some other coun-
congeners in the Northern Hemisphere in 1996
tries in the Northern Hemisphere were estimated
amounted to about 662 tonnes. Total emissions of PCB-
from information in a range of literature sources
28, -118, -153, and -180 from the Northern Hemisphere
(Revich et al., 1999, Year-books, 1992, 1993 1999,
b
Figure 4.5.
(a) Contribution of different regions to PCB emissions (22 congeners)
in the Northern Hemisphere for 1996, (b) PCB emissions (22 congeners)
a
from different regions of the Russian Federation in 1996.
37
4.2. Assessment of distant sources: Long range atmospheric transport
Chapter 4
b
Figure 4.6.
(a) Contribution of different regions to HCH emission
in the Northern Hemisphere for 1996, (b) HCH emissions
a
from different regions of the Russian Federation in 1996.
Ananieva et al., 1990, Li et al., 1996, 1998,1999, and
Mercury, PCB and -HCH concentrations in air and
Macdonald et al., 2000) regarding the use of this insec-
their deposition loads as evaluated for the Northern
ticide. To estimate emissions from data on insecticide
Hemisphere and the Arctic for 1996, are discussed
use, the emission factor for lindane in agricultural use
below in the relevant subsections. Particular attention
(0.5) (Guidebook, 1999) was applied. The resulting
has been given to atmospheric long-range transport to,
estimate for total -HCH emissions from the Northern
and deposition of these pollutants in the Russian
Hemisphere in 1996 was about 3445 tonnes. The spa-
Arctic. For mercury, the effect of Mercury Depletion
tial distribution of these -HCH emissions in the
Event (MDE) chemistry on Arctic deposition was con-
Northern Hemisphere, for modeling purposes, was
sidered. In addition, for the assessment of environ-
made using crop area as a surrogate parameter
mental pollution by PCBs and -HCH, the role of trans-
(Pacyna et al., 1999).
port via sea currents and ice cover dynamics were taken
into account. The marine environment is particularly
To model long-range atmospheric transport of -HCH
important in relation to the transport and fate of
to the Russian North, nine source regions were identi-
-HCH. Characteristic values of mean annual air con-
fied in the Northern Hemisphere: Russia, Western
centrations and deposition fluxes of mercury, PCBs
Europe, Eastern Europe, Southern Europe, the
and -HCH over the Arctic area are summarized in
Americas, China, India, the rest of Asia, and Africa.
Table 4.2. The consistency of the modeling results was
China and India were considered as individual source
verified by comparison with available measurements.
regions due to their high use of this insecticide com-
pared to the rest of Asia. Estimates of the contribution
of main source regions to total -HCH emissions in the
Northern Hemisphere in 1996, based on the selected
emission scenario, is shown in Figure 4.6(a). -HCH
emissions from Russian regions in 1996 are shown in
Figure 4.6(b).
The main contribution to -HCH emissions in the
Northern Hemisphere, was made by India (53%) and
Western Europe (18%). The contribution from
Table 4.2. Characteristic values of mean annual air concentrations and annual
Russia is only 2%. Major Russian -HCH emissions in
deposition fluxes for mercury, selected PCBs, and µ HCH over the Arctic in 1996.
1996 originated from the European part of the
Russian Federation. The highest Russian -HCH con-
Mercury
tributions were made by sources located in the
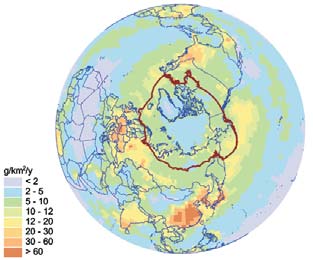
Figure 4.7 shows the annual deposition flux of mer-
Central-Chernozem, Volga and North-Caucasian
cury in the Northern Hemisphere. Highest deposi-
regions (CVN).
tion levels are in those regions with considerable
emissions: i.e. Southeast Asia, Europe, and the east-
4.2.3. Contamination levels in the Arctic resulting
ern part of North America. For other areas, the depo-
from long range atmospheric transport
sition pattern, to some extent, corresponds to annual
To evaluate levels of contamination of the Arctic region
precipitation values, since wet deposition plays a
by global pollutants (mercury, PCBs, and -HCH)
dominant role in removing mercury from the atmos-
resulting from long-range atmospheric transport, a
phere. From the model results, total deposition over
hemispheric modeling approach was employed. For
the Arctic region in 1996 amounted to 240 tonnes.
this purpose, the EMEP Meteorological Synthesizing
The influence of MDEs on deposition fluxes within
Centre-East (MSC-E) have developed hemispheric
the Arctic region has been the subject of considerable
multi-compartment transport models `MSCE-Hg-Hem'
research in recent years. The postulated MDE mecha-
and `MSCE-POP'.
nism (Lindberg et al., 2002) includes complicated
38
Chapter 4
4.2. Assessment of distant sources: Long range atmospheric transport
chemistry, involving the formation of halogen related
Figure 4.7.
radicals. The development of a detailed model com-
Annual deposition
of total mercury in the
ponent for MDE chemistry is the subject of a separate
Northern Hemisphere.
study. For the purposes of this study, an attempt was
The enlarged panel shows
made to qualitatively estimate the effect of MDE on
elevated mercury deposition
over the Arctic coast due
Arctic Hg contamination by using a simplified set of
to MDEs.
parameters.
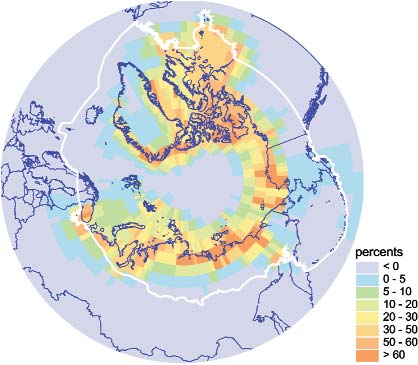
As illustrated in the enlarged panel in Figure 4.7, even
short-term phenomena such as MDEs, which occur
during only a few weeks of the year, can considerably
increase the annual deposition of mercury in some
regions of the Arctic, in particular coastal areas. The
influence of MDEs on total annual mercury deposition
is illustrated in Figure 4.8(a). Additional contributions
of mercury as a result of MDEs can amount to more
than 50 percent of total deposition values in areas adja-
cent to Arctic coasts (i.e. within about 300 km of the
coast inland and offshore). These areas include the
Queen Elizabeth Islands, Hudson Bay, the White Sea,
the Gulf of the Ob river, and the Laptev Sea coast,
among others. Negative values (for percentage
increase in deposition due to MDEs) show that
increased deposition fluxes due to MDEs in some
to the model parameters used), when monthly depo-
regions, lead to decreased fluxes in other areas. A part
sition in the Arctic increased two-fold or greater.
of the mercury transported by the air therefore does
The calculations predict that MDE are responsible
not enter the High Arctic during springtime, due to it
for deposition of about 50 tonnes of mercury per
being scavenged during MDEs over coastal and con-
year in the Arctic about 20% of the total annual
tiguous regions.
deposition.
Figure 4.8(b) shows the seasonal variation in total
Due to the high transport potential of mercury in the
mercury deposition in the Arctic. The model pre-
atmosphere, many anthropogenic and natural sources
dicts that the most pronounced MDE effect is in May
from different regions of the Northern Hemisphere
and June (taking into account a temporal shift due
contribute to Arctic pollution. The contribution from
Figure 4.8.
(a) Influence of MDEs on
total annual mercury deposi
tion in the Arctic (area
defined by the white (AMAP
area) boundary), and (b) sea
sonal variation in total mer
cury deposition to the Arctic
with and without MDEs. The
figures present the difference
between two model compu
tational runs one with and
one without MDEs included.
a
b
a
Figure 4.9. Contribution of different source regions to the annual deposition
of mercury in the Arctic arising from (a) anthropogenic sources and (b) natural
b
sources and re emissions.
39
4.2. Assessment of distant sources: Long range atmospheric transport
Chapter 4
the various regions of the Northern Hemisphere to total
annual mercury deposition in the Arctic from anthro-
pogenic and from natural sources is shown in Figures
4.9(a) and 4.9(b), respectively for the upper (Scenario I)
and lower (Scenario II) limits of emission estimates.
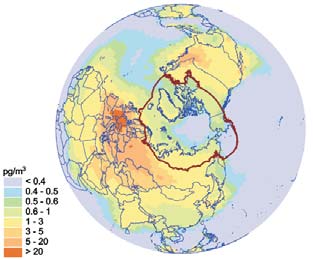
Figure 4.10.
Mean annual air
concentrations of PCB 153
over the Northern
Hemisphere. The enlarged
panel shows the air
concentration pattern
over the Arctic region.
Figure 4.11.
Seasonal variation in the relative contributions of different source regions to PCB 153
deposition in the Arctic.
considerable uncertainty regarding the input parameters
used for the modeling of natural emission and re-emis-
sion processes, and that natural emissions cannot be con-
trolled by political decisions, attention should be focused
on deposition from anthropogenic sources.
PCBs
Levels of PCB contamination are exemplified by PCB-
153. Figure 4.10 shows that areas with the highest air
concentrations of PCB-153 are located close to
European and North American source regions. Air
The most significant contribution to anthropogenic mer-
concentrations range from 5 to 20 pg/m3 in contami-
cury deposition in the Arctic come from sources located
nated areas of North America, and can exceed
in Southeast Asia, Europe and Russia. The most signifi-
20 pg/m3 in Europe. European sources make the
cant contributions to the natural component of annual
largest contribution to the contamination of the Arctic
deposition in the Arctic are from the Pacific and Atlantic
region. The mean annual air concentration of PCB-153
Oceans, and from Asia. Bearing in mind that there is still
over the Arctic ranges from 0.2 to 4 pg/m3.
Figure 4.12.
Air concentrations
of PCB 153 emitted in
January and May from
sources in the Americas
and Northwest Europe.
respectively, from modelling
results for 1996.
a
b
Americas
January
Northwest Europe
c
d
Americas
May
Northwest Europe
40
Chapter 4
4.2. Assessment of distant sources: Long range atmospheric transport
The relative contributions made by different source
preceding 1996 equals 629 kg. Therefore, the esti-
regions to PCB-153 deposition in the Arctic are subject
mated total PCB-153 deposition to the Arctic in 1996
to seasonal variations, as shown in Figure 4.11. The
was 1.15 tonnes.
contribution from sources in Northwest Europe is the
most variable, varying from about 70% in January, to
On the basis of the transport simulations for the four
about 25% in May. The amount contributed by the
congeners (PCB-28, -118, -153, and -180), and taking
Americas is only about 5% in January, but in May it
into account the fractions of these congeners in the
amounts to 26%, and is comparable with the contribu-
typical PCB mixture in air, a rough estimate of total
tion from sources in Northwest Europe.
PCB deposition in the Arctic in 1996 of approximately
40 tonnes was made.
These noticeable variations are explained by the
peculiarities of atmospheric circulation in the Arctic
-HCH
during various seasons, and also by seasonal varia-
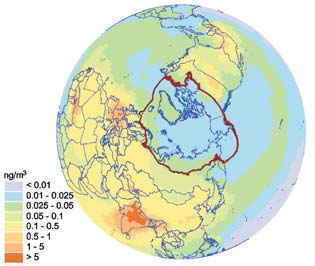
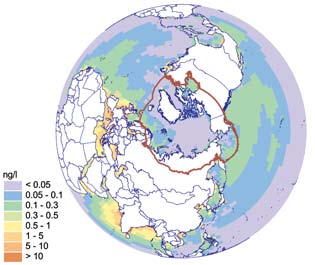
Figure 4.14 represents the spatial distribution of -
tions in temperature, precipitation, and degradation
HCH concentrations in the air over the Northern
rates. Seasonal variation of emissions are not taken
Hemisphere and the Arctic. High concentrations (up
into account in this assessment. To illustrate pathways
to 5 ng/m3 or more) are mainly characteristic of
of atmospheric transport, simulation results of regions with high emissions. However, in spite of the
PCB-153 transport from two source regions (the
fact that there are no significant sources in the Arctic
Americas and Northwest Europe) for 1996 were
region, relatively high concentrations (from 0.01 to
examined. Figures. 4.12 show air concentrations of
0.11 ng/m3) are also observed there. These concentra-
PCB-153 emitted in the Americas and Northwestern
tions result from long-range transport of -HCH from
Europe in January. The air concentrations of PCB-
remote sources, mainly in Western Europe, India, and
153 originating from the same sources in May are
the Americas.
given in Figures. 4.12.
Figure 4.13 shows the contribution of different source
regions to PCB-153 deposition in the Arctic. The major
contribution is from sources in Northwest Europe
(about 40%). Other significant contributors are Russia
(19%), the Americas (17%) and Southeast Europe
(16%). For PCB-28 and PCB-118, Northwest Europe
and Russia are the main contributors. However, for
PCB-180, main contributors are Northwest Europe and
the Americas.
The total amount of PCB-153 deposited in the Arctic
region from emissions in 1996 was estimated at
527 kg. The contribution from re-emission of PCB-
Figure 4.13. Contributions of different source regions to PCB 153
153 accumulated in the environment in the period
deposition in the Arctic region in 1996.
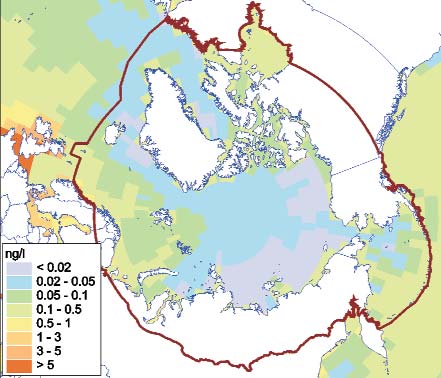
Figure 4.14.
Figure 4.15.
HCH concentrations
Mean annual concentrations
in air of the lower
of HCH in seawater
atmosphere over
in the Northern Hemisphere.
the Northern Hemisphere
The enlarged panel shows
and the Arctic.
the seawater concentrations
pattern over the Arctic
Ocean.
41
4.2. Assessment of distant sources: Long range atmospheric transport
Chapter 4
Since -HCH tends to accumulate in seawater (which
accounts for about 80% of the overall environmental
pool of this substance), the spatial distribution of -
HCH in seawater is of interest. The distribution of -
HCH in seawater (Figure 4.15) reveals that maximum
concentrations are found in the Indian Ocean, the
Mediterranean Sea, and the East Atlantic.
Considerable amounts of -HCH flow into the Arctic
Ocean from the North Atlantic, as reflected in the
higher seawater concentrations in the Barents Sea in
the region between northern Norway and Svalbard.
Seawater concentrations in the seas along the coast of
northern Russian are in the range 0.012 ng/L.
Figure 4.17. Spatial distribution of mean annual air concentrations
of total gaseous mercury in the Russian North.
The total amount of -HCH deposited in the Arctic
region in 1996 from the atmosphere was estimated to
regions including the Yamalo-Nenets AO, the Republic
be 78 tonnes. Due to high deposition rates over the sea
of Sakha (Yakutia), and the Chukchi AO. A possible
(the models assume this rate to be twice as high over
reason for this, in addition to distance from main emis-
sea as on land), and taking into account the large pro-
sions areas, is the decrease in elemental mercury con-
portion of the Arctic area that is covered by ocean
centration over the Arctic coast during springtime, as a
(about 60%, according to figures provided by AMAP,
result of MDEs.
1998), this equates to an estimate for -HCH deposited
Table 4.3.
to the Arctic Ocean in 1996 of 58 tonnes.
Characteristic values of mer
cury air concentrations in the
Modeling results have been used to indicate contribu-
Russian North, ng/m3.
tions of different emission sources to the contamina-
tion of the Arctic region by -HCH (Figure 4.16).
Western Europe is the largest contributor to this region
(about 40%), followed by India (19%), the Americas
(17%), China (10%), and Russia (6%), with other
source regions responsible for the remaining 8%.
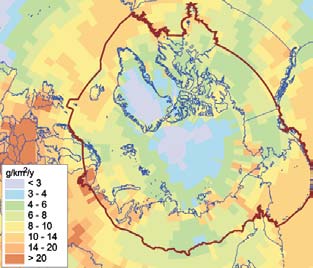
The spatial distribution of annual deposition loads of
total mercury in the Russian North is shown in Figure
4.18. The highest depositions, exceeding 20 g/km2/y,
are observed over the coast of the Arctic Ocean, due to
MDEs (Table 4.4). The lowest depositions (less than
5 g/km2/y), are in Central Yakutia, an area of low
annual precipitation. Values of total mercury deposi-
tion for regions of the Russian North and the Arctic as
a whole are given in Table 4.5.
Figure 4.16. Contributions of different source regions to HCH deposition
in the Arctic in 1996.
4.2.4. Contamination levels and deposition loads
resulting from long range atmospheric transport
to the Russian North
Mercury
Figure 4.17 shows the modeled spatial distribution of
Figure 4.18. Annual deposition of total mercury
mean annual concentrations of total gaseous mercury
in the Russian North.
(TGM) in the air in northern Russia, which are fairly
Table 4.4.
constant across the territory (from 1.4 to 1.8 ng/m3)
Characteristic values of total
(see also Table 4.3). Concentration levels over
annual mercury deposition
Murmansk Oblast and in the central Republic of Sakha
loads in the Russian North,
g/km2/y.
(Yakutia) are slightly elevated, mainly due to local
emission sources. There is also a weak decreasing gra-
dient in mercury concentrations to the north over
42
Chapter 4
4.2. Assessment of distant sources: Long range atmospheric transport
A similar pattern is seen for deposition loads.
Substantial values (>150 mg/km2/y) are estimated for
Murmansk Oblast, the Nenets AO and the southern
part of the Yamalo-Nenets and Taymir AOs as well as for
Table 4.5. Total deposition of mercury in 1996 in different regions
the western part of the Sakha Republic. Moderate val-
of the Russian North, and the Arctic as a whole, t/y.
ues (70-150 mg/km2/y) are obtained for the northern
part of the Yamalo-Nenets and Taymir AOs, the
PCBs
Republic of Sakha (Yakutia), and the western part of
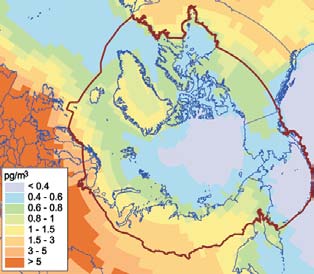
Figures 4.19 and 4.20 show the spatial distributions of
Chukchi AO. The northern parts of the Russian North
mean annual air concentrations and annual deposition
are characterized by lower values for deposition loads
loads of PCB-153 over selected regions of the Russian
(<70 mg/km2/y) (Table 4.7).
North for 1996. There is a clear decrease in PCB-153
Table 4.7.
air concentrations from western to eastern areas of the
Characteristic values
Russian North, with increasing distance from source
of PCB 153 annual deposition
areas in Europe. Relatively high air concentrations (up
loads in the Russian North,
mg/km2/y.
to 4 pg/m3) occur in Murmansk Oblast, the Nenets
AO, and the southern part of the Yamalo-Nenets and
Taymir AOs (Table 4.6). Moderate values (12 pg/m3)
are characteristic of the northern part of the Yamalo-
Nenets AO, the Taymir AO, and the Republic of Sakha
(Yakutia). The Chukchi AO is characterized by low val-
Depositions of PCB-153 and of total PCBs to the
ues (<1 pg/m3).
Russian North and the Arctic are given in Table 4.8. To
calculate these depositions, emissions of the 22 PCB
congeners considered, from all source regions, were
divided into four groups: di- plus tri-chlorinated PCBs,
tetra- plus penta-chlorinated PCBs, hexachlorinated
PCBs, and hepta- plus octa-chlorinated PCBs. It was
assumed that these groups are transported in a similar
way to PCB-28, -118, -153 and -180, respectively.
Together, these 22 congeners represent about one half
of total PCB emissions, a fact that was taken into
account in the calculation.
Figure 4.19. Spatial distribution of mean annual air concentrations
of PCB 153 in the Russian North, calculated for 1996.
Table 4.8. Total deposition of PCB 153 and total PCB in 1996
Table 4.6.
in different regions of the Russian North, and the Arctic as a whole, t/y.
Characteristic values
of PCB 153 air concentrations
in the Russian North, pg/m3.
By undertaking simulations of long-range transport
and the accumulation of four PCB congeners (PCB-28,
-118, -153 and -180), it was possible to compare the con-
gener compositions in the air of different regions of
the Russian North (Figure 4.21).
Figure 4.21.
PCB congener composition
in air of different regions
of the Russian North.
For all receptor regions, the fraction of PCB-28 is the
highest and PCB-180 the lowest, with other congeners
Figure 4.20. Annual deposition of PCB 153 in the Russian North,
falling between, however, the congener patterns vary
calculated for 1996.
noticeably between the regions.
43
4.2. Assessment of distant sources: Long range atmospheric transport
Chapter 4
-HCH
lower for the Taymir AO, the Republic of Sakha
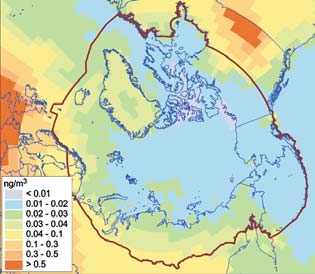
Mean annual air concentrations of -HCH in the recep-
(Yakutia), and the Chukchi AO (0.13 g/km2/y).
tor regions of the Russian North, for 1996, are illustrat-
Annual deposition loads vary from region to region
ed in Figure 4.22. Higher air concentration levels (from
(Table 4.10). This is mainly due to different precipita-
0.02 to 0.07 ng/m3) are characteristic for Murmansk
tion levels in these regions.
Oblast, the Nenets AO, the south of the Yamalo-Nenets
AO, and the Republic of Sakha (Yakutia). Lower levels
Estimated values for total deposition of -HCH in the
(from 0.01 to 0.3 ng/m3) are characteristic for the
regions of the Russian North and the Arctic as a whole
Taymir AO, the Chukchi AO, and the north of the
are given in Table 4.11.
Republic of Sakha (Yakutia) (Table 4.9).
Table 4.11. Total deposition of HCH in 1996 in different regions of the Russian
North, and the Arctic as a whole, t/y.
4.2.5. Source receptor relationships
for the selected pilot study regions.
4.2.5.1. Murmansk Oblast
Mercury
Murmansk Oblast is the most westerly region of
Russia and is located on the Kola Peninsula. This
Figure 4.22. Spatial distribution of mean annual air concentrations of
explains the greater influence of European sources
HCH
in the Russian North, calculated for 1996.
of mercury on this region (including sources both
inside and outside the territories of Russia). Figures
Table 4.9.
4.24(a) and 4.24(b) illustrate the contributions of
Characteristic values
of HCH air concentrations
major Northern Hemispheric and Russian anthro-
in the Russian North, ng/m3.
pogenic mercury source regions to annual mercury
deposition in Murmansk Oblast. The largest contri-
bution is made by Russian sources (35%). Among
these, about 13% is from Murmansk Oblast itself
(MUR) and 18% from other Russian European
regions (NRT, NWK, CVV, CVN and URL). The most
The spatial distribution of -HCH annual deposition
important sources outside of Russia are those in
loads is shown in Figure 4.23. Deposition loads are larg-
Eastern Europe (12%), China (11%), the Americas
er for Murmansk Oblast, the Nenets AO, and the
(10%), and Western Europe (10%). The `other' cate-
Yamalo-Nenets AO (from 2 to 7 g/km2/y or more) and
gory (defined in this and other sections addressing
mercury source-receptor relationships) includes
Northern and Southern Europe, Southeast Asia
(excluding China and Japan), and Africa, due to
their relatively small contributions to depositions in
the receptor area.
PCB
The largest contributions to PCB-153 deposition in
Murmansk Oblast are from emission sources in
Russia (44%), Northwest Europe (35%) and
Southeast Europe (14%) (Figure 4.25(a)). Contri-
butions from sources located in the Americas, Africa,
and Central Asia are less significant due to their con-
Figure 4.23. Annual deposition of
siderable distance from the Oblast. Amongst Russian
HCH in the Russian North,
calculated for 1996.
sources (Figure 4.25(b)), the major contribution is
made by emissions from Murmansk Oblast itself
Table 4.10.
(22%).
Characteristic values of HCH
annual deposition loads in the
Russian North, g/km2/y.
-HCH
-HCH sources in Western Europe make the largest
contribution to deposition in Murmansk Oblast (more
than 50%). Other significant contributors are Russia
(17 %) and India (9%) (Figure 4.26(a)).
44
Chapter 4
4.2. Assessment of distant sources: Long range atmospheric transport
b
Figure 4.24. Contributions from anthropogenic sources in (a) regions
of the Northern Hemisphere, (b) regions of Russia to annual mercury deposition
a
in Murmansk Oblast.
b
Figure 4.25. Contributions from anthropogenic sources in (a) regions
of the Northern Hemisphere, (b) regions of Russia to annual PCB 153 deposition
a
in Murmansk Oblast.
b
Figure 4.26. Contributions from anthropogenic sources in (a) regions
of the Northern Hemisphere, and (b) regions of Russia to annual HCH deposition
a
in Murmansk Oblast.
Russian contributions to -HCH depositions in
4.2.5.2. The Nenets Autonomous Okrug
Murmansk Oblast are mostly made by the Central and
Volgo-Viatsky regions (CVV) and the Central-
Mercury
Chernozem, Volga, and North-Caucasian regions
The Nenets AO is located in the northern part of
(CVN), 5% and 4%, respectively. The inputs from
European Russia. Therefore the main source areas of
other regions are comparatively small (Figure 4.26(b)).
long-range atmospherically transported pollution
For the purposes of this report, contributions from
affecting the region are similar to those affecting
Russian emission sources to -HCH depositions in
Murmansk Oblast. Differences in deposition are asso-
receptor areas are shown only for those regions with
ciated mainly with the greater significance of Russian
significant emissions of -HCH.
emission source regions. Figures 4.27(a) and 4.27(b)
b
Figure 4.27. Contributions from anthropogenic sources in (a) regions of the
a
Northern Hemisphere, (b) regions of Russia to annual mercury deposition in the
Nenets AO.
45
4.2. Assessment of distant sources: Long range atmospheric transport
Chapter 4
show the relative contribution of the different regions
-HCH
to the total annual deposition of mercury in the Nenets
The major contributions to the contamination of the
AO from anthropogenic sources. The largest contribu-
Nenets AO by -HCH are from emission sources in
tion is from Russian sources (35%). However, sources
Western Europe (49%), Russia (23%), and India (9%)
within the Nenets AO itself only contribute 7%, where-
(Figure 4.29(a)). The main sources within the Russian
as the combined contribution of regions in European
Federation are the Central and Volgo-Viatsky regions
Russia make up 24% of the deposition. The most
(CVV) and the Central-Chernozem, Volga, and North-
important of these are the Northern region (NRT) and
Caucasian regions (CNV), contributing 8% each
the Central and Volgo-Viatsky regions (CVV). The most
(Figure. 4.29(b)).
significant external contributors are Eastern Europe
(13%), China (11%), the Americas (10%), Western
4.2.5.3. The Yamalo Nenets and Taymir Autonomous Okrugs
Europe (9%), and Central Asia (9%).
Mercury
PCB
The location of the Yamalo-Nenets AO and the Taymir
The largest contributions to PCB-153 depositions are
AO in the northern part of western Siberia, accounts
made by Russia (41%), Northwest Europe (31%) and
for the fact that Asian sources play a noticeable role in
Southeast Europe (18%) (Figure 4.28(a)). The main
their contamination. European sources, however, still
contributions among Russian sources (Figure 4.28(b))
continue to exert a considerable influence. Up to 30%
are made by the Central and Volgo-Viatsky regions
of all mercury annually deposited in these two regions
(CVV) and the Northern region (NRT), with values of
is from Russian sources (Figure 4.30(a)). The contri-
15% and 10%, respectively.
bution from sources within the Yamalo-Nenets and
b
Figure 4.28. Contributions from anthropogenic sources in (a) regions
of the Northern Hemisphere, (b) regions of Russia to annual PCB 153 deposition
a
in the Nenets AO.
b
Figure 4.29. Contributions from anthropogenic sources in (a) regions
of the Northern Hemisphere, (b) regions of Russia to annual HCH deposition
a
in the Nenets AO.
b
Figure 4.30. Contributions from anthropogenic sources in (a) regions
of the Northern Hemisphere, (b) regions of Russia to annual mercury deposition
a
in the Yamalo Nenets AO and the Taymir AO.
46
Chapter 4
4.2. Assessment of distant sources: Long range atmospheric transport
b
Figure 4.31. Contributions from anthropogenic sources in (a) regions
of the Northern Hemisphere, (b) regions of Russia to annual PCB 153 deposition
a
in the Yamalo Nenets AO and the Taymir AO.
b
Figure 4.32. Contributions from anthropogenic sources in (a) regions
of the Northern Hemisphere, (b) regions of Russia to annual HCH deposition
a
in the Yamalo Nenets AO and the Taymir AO.
b
Figure 4.33. Contributions from anthropogenic sources
in (a) regions of the Northern Hemisphere, (b) regions of Russia
a
to annual mercury deposition in the Chukchi AO.
Taymir AOs themselves is comparatively low (only
10% (Figure 4.32(a)). Russian contributions to deposi-
about 3%), whereas three major Russian contributors
tions in the Yamalo-Nenets and Taymir AOs are mainly
(CVV, CVN, and URL) make up 16% of total deposi-
from the Central and Volga-Viatsky regions (CVV) and
tion (Figure 4.30(b)). The two major external contrib-
the Central-Chernozem, Volga, and North-Caucasian
utors are China (12%) and Eastern Europe (12%).
regions (CVN), 7% and 8% respectively (Figure 4.32(b)).
Some impact is also made by the Americas (11%),
Central Asia (11%) and Western Europe (9%).
4.2.5.4. Chukchi Autonomous Okrug
Mercury
PCB
The Chukchi AO is the most eastern and remote region
Major contributions to PCB deposition in the Yamalo-
of the Russian North. Its location, far from major indus-
Nenets and Taymir AOs are made by sources in Russia
trial regions, accounts for the fact that the global back-
(47%), Northwest Europe (26%) and Southeast Europe
ground pool of atmospheric mercury is the main source
(16%) (Figure 4.31(a)). Among Russian sources (Figure
of mercury contamination in this region. Figure 4.33(a)
4.31(b)), the largest contribution (12%) to depositions
demonstrates the relative contributions of different
are made by the Central and Volgo-Viatsky regions
source regions to annual mercury deposition in the
CVV). The contribution of emission sources located
Chukchi AO. The main contributor is Russia (26%),
within the Yamalo-Nenets and Taymir AOs is 9%.
however, contributions from China are also consider-
able (17%). Among other sources, the Americas (11%),
-HCH
Central Asia (10%), and Eastern Europe (10%) are of
Main contributors to depositions of -HCH in the
note. The contribution from the Chukotka AO itself is
Yamalo-Nenets and Taymir AOs are similar to those for
insignificant compared to emission sources located in
the Nenets AO. Sources in Western Europe make the
Eastern Siberia and the Far East (Figure 4.33(b)).
largest contribution to ongoing deposition in these terri-
However, the influence of major emission regions in
tories (48%). Russia is responsible for 21% and India, for
European Russia (CVV, CVN, URL) are also apparent.
47
4.2. Assessment of distant sources: Long range atmospheric transport
Chapter 4
b
Figure 4.34. Contributions from anthropogenic sources in (a) regions
of the Northern Hemisphere, (b) regions of Russia to annual PCB 153 deposition
a
in the Chukchi AO.
b
Figure 4.35. Contributions from anthropogenic sources in (a) regions
of the Northern Hemisphere, (b) regions of Russia to annual HCH deposition
a
in the Chukchi AO.
PCB
Main contributions to -HCH deposition are made by
The most important contributions to PCB-153 depo-
sources within Western Europe (54%), Russia (17%),
sition in the Chukchi AO are made by sources locat-
and India (9%). Russian contributions to deposition
ed in Russia (25%), Northwest Europe (22%), and
are mainly from sources located in the Central and
Southeast Europe (19%), followed by American
Volgo-Viatsky regions (5%), and Central-Chernozem,
sources (17%). (Figure 4.34(a)). The main contribu-
Volga, and North-Caucasian regions (4%). Total annu-
tion from the Russian source regions (Figure
al deposition of -HCH amounts to 0.8 t.
4.34(b)) is made by emissions from the Chukchi
AO itself (8%).
The Nenets Autonomous Okrug
The most important contribution to anthropogenic
-HCH
mercury depositions in the Nenets AO is made by
For the Chukchi AO, the main contributions to -HCH
Russian emission sources (35%). As well as deposition
contamination are made by India (27%), Western
from sources within the Nenets AO itself (7%), emis-
Europe (27%), China (19%), and the Americas (11%)
sions from regions in the European part of Russia con-
(Figure 4.35(a)). The contribution from all Russian
tribute considerably to the pollution of this region
sources accounts for only 5% (Figure 4.35(b)).
(24%). The most important external contributors are
Eastern Europe (13%), China (11%), and the
4.2.6. Conclusions
Americas (10%). Total annual deposition of mercury in
Murmansk Oblast
the Nenets AO amounts to 4 t, of which 1.8 t is from
The largest contribution to anthropogenic mercury
anthropogenic sources.
deposition in the Oblast is made by Russian sources
(35%) of which 13% is from sources within Murmansk
Main contributions to PCB deposition in the Nenets
Oblast itself. The most important external sources are
AO are from sources in Russia (41%), Northwest
Eastern Europe (12%), China (11%), the Americas
Europe (31%), and Southeast Europe (18%). Major
(10%), and Western Europe (10%). Total annual depo-
contributions from sources within the Russian
sition of mercury is around 3 t, including 1.5 t from
Federation are made by the Central and Volgo-Viatsky
anthropogenic sources.
regions (15%), and the Northern region (10%). The
contribution of local sources to deposition in the
A major contribution to PCB deposition is made by
Nenets AO is negligible. Total annual deposition of
Russian sources (44%) including 22% from sources
PCB-153 in this Okrug amounts to 31 kg, and of total
within Murmansk Oblast itself. Among other emission
PCBs, 1 t.
sources, significant contributions originate in
Northwest Europe (35%), and Southeast Europe
-HCH pollution of the Nenets AO is due to emission
(14%). Total annual deposition of PCB-153 in
sources in Western Europe (49%), Russia (23%), and
Murmansk Oblast amounts to 20 kg, and of total
India (9%). The main sources within the Russian
PCBs, 0.7 t.
Federation are the Central and Volgo-Viatsky regions
48
Chapter 4
4.3. Preliminary assessment of riverine fluxes as PTS sources
(8%), and the Central-Chernozem, Volga, and North-
In addition, the following general conclusions can be
Caucasian regions (8%). Total annual deposition of made, based on the studies undertaken:
-HCH to this Okrug is 1.1 t.
·
Europe, North America, and Southeast Asia are the
most significant emission source regions for mer-
The Yamalo-Nenets
cury, PCBs and -HCH. The main Russian emission
and Taymir Autonomous Okrugs
sources are located in the European part of the
The major contribution to anthropogenic mercury
Russian Federation. Due to their geographical
deposition in these regions is from emissions sources
location, and to meteorological conditions,
in Russia (30%). Among Russian sources, the main
European sources make the greatest contribution
contributors are sources in the Ural, Central and
to the contamination of the western regions of the
Volgo-Viatsky regions, and the Central-Chernozem,
Russian North. Asian and North American sources
Volga, and North-Caucasian regions (16% in total).
play a more significant role in the pollution of the
Main external contributors are China (12%), Eastern
eastern territories of the Russian Arctic, although
Europe (12%), the Americas (11%), and Central Asia
the contribution of European sources is still con-
(11%). Total annual deposition of mercury is estimat-
siderable.
ed at 15 t, of which 6.6 t is from anthropogenic
sources.
·
The results obtained make it possible to make some
predictions for the near future regarding contami-
Major contributions to PCB depositions are made by
nation levels in the Russian Arctic. An analysis of
sources located in Russia (47%), Northwest Europe
emission data shows that mercury emissions are
(26%) and Southeast Europe (16%). Among Russian
decreasing in Europe and North America, whereas
sources, the largest contribution to deposition is made
emissions from Southeast Asia are increasing. Asian
by the Central and Volgo-Viatsky regions (12%). Total
sources may eventually become the more signifi-
annual deposition of PCB-153 is 95 kg, and 3.2 t for
cant, thus contamination levels of this pollutant in
total PCBs.
some regions of the Russian North, in particular the
Chukchi AO, may increase in the future. Regarding
Main contributions to -HCH depositions are made by
-HCH, use of technical-HCH (a mixture of HCH
Western Europe (48%), Russia (21%), and India
isomers, including -HCH) is now banned in most
(10%). Main sources within the Russian Federation are
western countries, and in Russia since the late-
the Central and Volgo-Viatsky regions (7%) and the
1980s; China, a major user, also switched to lindane
Central-Chernozem, Volga, and North-Caucasian
(pure -HCH) in 1984. Although restricted in most
regions (8%). Total annual deposition of -HCH
countries, lindane is still widely used in North
amounts to 4 t.
America, Europe and Asia, for seed treatment and
other applications (AMAP, 2002). Thus the relative
The Chukchi Autonomous Okrug
influence of Asian countries on pollution of the
The main contributions to anthropogenic mercury
Russian Arctic by -HCH is likely to increase. PCB
deposition in this Okrug originate from Russian
contamination levels are expected to decrease with
sources (26%). Emission sources from Eastern Siberia
emission reductions resulting from bans and con-
and the Far East are the dominant influences on mer-
trols on use of PCBs. However PCB contamination
cury contamination of the Chukchi AO. The main
is likely to continue for many years as a result of re-
external contributor to the region's pollution is China
emissions from PCBs accumulated in the general
(17%), with a contribution comparable to that of
environment over the last 50-years.
Russian sources, although this varies slightly during
the year. Among others, the Americas contribute 11%
and Central Asia 10% to the deposition. Total annual
4.3. Preliminary assessment
deposition of mercury is estimated at 7 t, of which 2.9 t
of riverine fluxes as PTS sources
is from anthropogenic sources.
4.3.1. Introduction
The main contributors to PCB deposition are the fol-
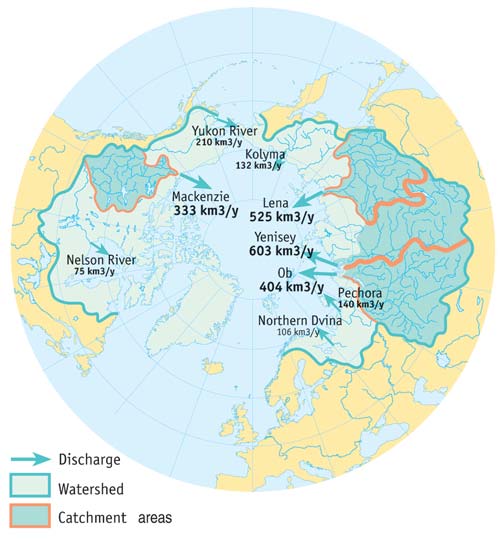
Flows of large Arctic rivers are considered one of the
lowing: Russia (25%), Northwest Europe (22%), and
most significant pathways by which contaminants reach
Southeast Europe (19%), followed by American
the Arctic. Riverine transport is particularly relevant
sources (17%). The Chukchi AO itself contributes 8%.
for PTS, as potentially PTS contamination within the
The total annual deposition of PCB-153 amounts to
entire catchment areas of these rivers can be transport-
11.8 kg, and of total PCBs, 0.4 t.
ed to the Arctic through watershed runoff, and these
catchments include heavily industrialized areas and
Main contributions to -HCH deposition are made
agricultural regions (Figure 4.36).
by India (27%), Western Europe (27%), China
(19%), and the Americas (11%). The contribution
Riverine PTS transport is particularly important for
from Russian sources accounts for 5%. Total annual
two of the study areas selected for project implementa-
deposition of -HCH in the Chukchi AO is estimated
tion: the lower Pechora basin, and the eastern part of
at 1.4 t.
the Taymir Peninsula, in the area of the Yenisey river.
49
4.3. Preliminary assessment of riverine fluxes as PTS sources
Chapter 4
Yenisey basin, are heavily industrialized. Industrial
enterprises within these areas include non-ferrous met-
allurgy, pulp and paper manufacture, chemical indus-
tries, and mining, etc., which are recognized as signifi-
cant sources of PTS emissions and discharges.
The catchment area of the Pechora river comprises
0.325 million km2 (world ranking 46), with a mean
long-term annual runoff of 141 km3 (world ranking:
30). The Pechora river basin, including the catchments
of its primary and secondary tributaries the Vorkuta,
Bol'shaya Inta, Kolva, Izhma and Ukhta rivers, contain
areas rich in mineral resources, with associated oil, gas
and coal extraction activities.
4.3.2. Objectives and methodology of the study
The objective of this study was to estimate PTS fluxes in
the flows of the Pechora and Yenisey rivers to areas
inhabited by indigenous peoples. Calculations of PTS
loads in the lower reaches of the Pechora and Yenisey
rivers used a range of data, included hydrometric meas-
urements at the closing cross-sections of the
Roshydromet basic hydrological network (in the area of
Figure 4.36. Arctic Ocean watershed, and catchment areas
Oksino settlement on the Pechora River and Igarka set-
of the largest Arctic rivers (AMAP, 1998).
tlement on the Yenisey River), and at the lowermost
cross-sections in the delta apexes, upstream of the rivers'
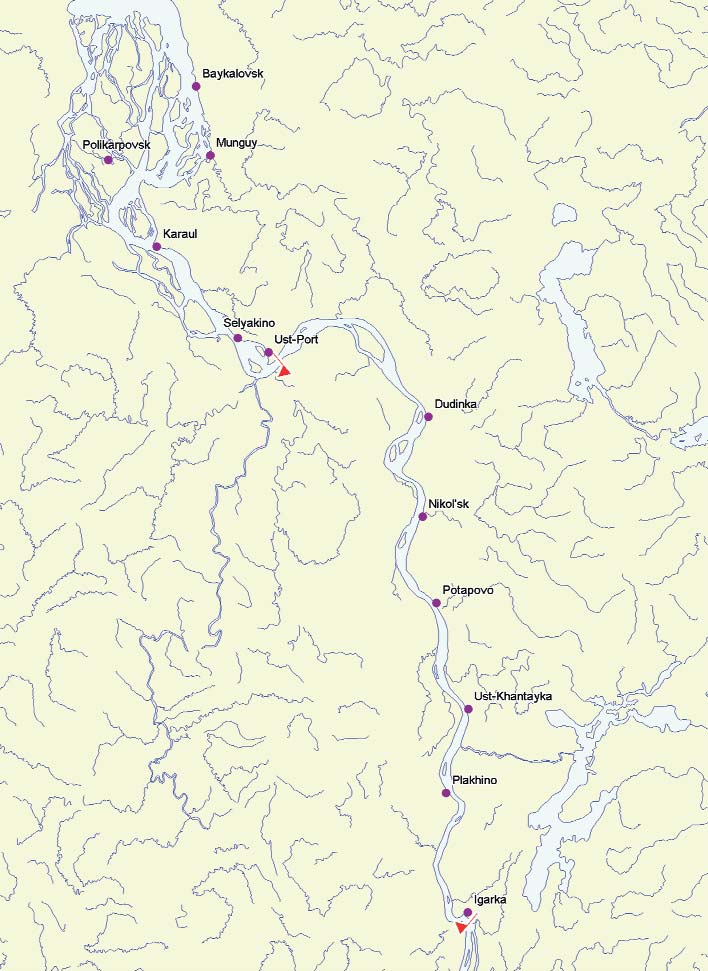
The Yenisey is one of the world's ten largest rivers, with
main branching points (in the vicinity of Andeg settle-
a catchment area of 2.59 million km2 (world ranking: 7)
ment, on both the Large and Small Pechora rivers, and
and mean long-term annual runoff of 603 km3 (world
of Ust'-Port settlement, on the Yenisey River) (Figures
ranking 5) (GRDC, 1994). Its basin incorporates the
4.37 and 4.38). In addition, data were obtained from
East-Siberian economic region, parts of which, particu-
analysis of pooled water and suspended matter samples
larly those located in the upper and central parts of the
collected during periods of hydrological observations.
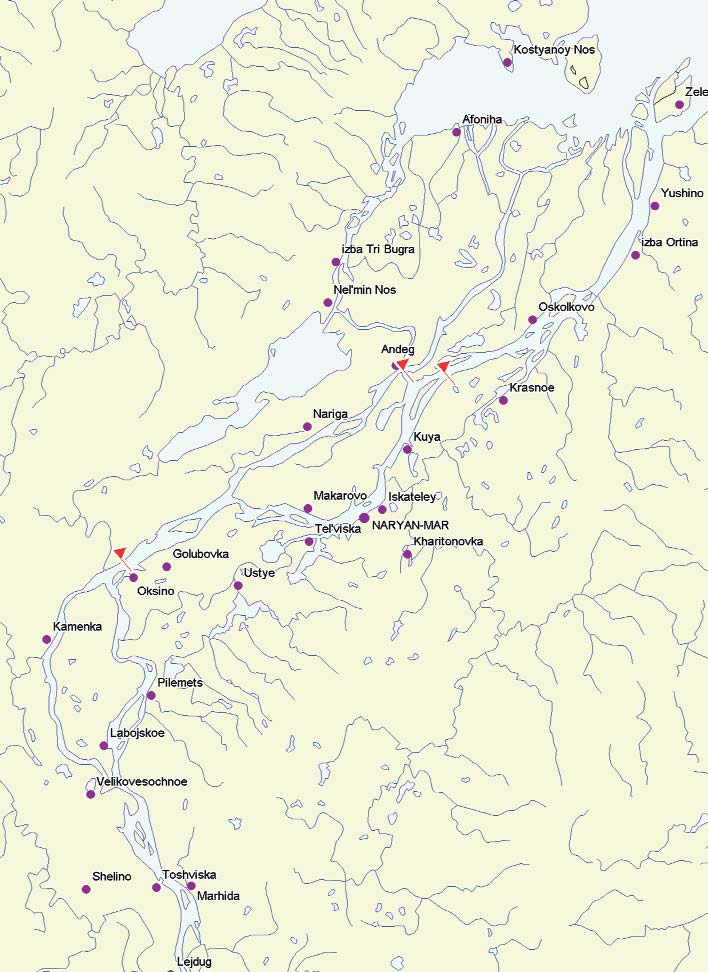
Figure 4.37. Location of hydrometric cross sections on the Pechora river.
Figure 4.38. Location of hydrometric cross sections on the Yenisey river.
50
Chapter 4
4.3. Preliminary assessment of riverine fluxes as PTS sources
Hydrometric measurements and water sampling at
each of the cross-sections were carried out according to
internationally accepted methodologies (GEMS, 1991;
Chapman, 1996) during four typical hydrological
water regime phases: during the spring flood fall peri-
od (late-June to early-July), during the summer low
water period (late-July to early-August), before ice for-
mation during the period of rain-fed floods (late-
September to October), and during the winter low
water period (March to April).
During each field survey period, measurements of
flow velocity at various sampling points in the channel
Figure 4.39. Channel profile and sampling/measurement points
profile were made every 6 hours, for 3 days. Water
on the Large Pechora river at the closing cross section near Oksino settlement.
level observations were conducted every 2 hours.
Water sampling was carried out twice during the first
observation day and once a day during the next two
days (a total of 4 single samples for each sampling
point). The volume of each pooled sample was not less
than 20 litres.
Initial data for each water regime phase included:
·
For the Pechora river at the closing cross-section
near Oksino settlement (see Figure 4.39):
15 flow velocity measurements (3 horizontal lev-
els on each of 5 vertical profiles );
measurement of the channel profile;
Figure 4.40. Channel profile and sampling/measurement points on the Large
36 measurements of the river water level;
Pechora river at the downstream cross section near Andeg settlement.
analytical data on PTS concentrations in 11
pooled water and 11 pooled suspended matter
samples collected over a 3-day period in 11 cross-
section segments;
suspended matter concentrations for samples
taken at the flow velocity measurement points,
in 11 pooled water samples, collected over a
3-day period in 11 cross-section segments.
·
For the Large and Small Pechora rivers at the down-
stream cross-sections near Andeg settlement (see
Figures 4.40 and 4.41):
Figure 4.41. Channel profile and sampling/measurement points on the Small
12 flow velocity measurements (3 horizontal lev-
Pechora river at the downstream cross section near Andeg settlement.
els on each of 4 vertical profiles, in both rivers);
measurement of the channel profile;
36 measurements of the river water level;
analytical data on PTS concentrations in 3
pooled water samples and 3 pooled suspended
matter samples from the surface, middle and
near-bottom horizons collected over a 3-day
period;
suspended matter concentrations in 3 pooled
water samples collected over a 3-day period from
the surface, middle and near-bottom horizons.
Figure 4.42. Channel profile and sampling/measurement points on the Yenisey
·
For the Yenisey river at the closing cross-section
river at the closing cross section near Igarka settlement.
near Igarka settlement (see Figure 4.42):
15 flow velocity measurements (3 horizontal lev-
matter samples collected over a 3-day period in
els on each of 5 vertical profiles);
11 cross-section segments;
measurement of the channel profile;
suspended matter concentrations for the flow
36 measurements of the river water level;
velocity measurement points in 11 pooled water
analytical data on PTS concentrations in 11
samples, collected over a 3-day period from 11
pooled water samples and 11 pooled suspended
cross-section segments.
51
4.3. Preliminary assessment of riverine fluxes as PTS sources
Chapter 4
4. calculation of partial and total mean daily fluxes of
PTS in dissolved form during the typical water
regime phases;
5. calculation of partial and total mean daily fluxes of
PTS in suspended matter during the typical water
regime phases.
The river channel profiles used in the hydrometric
measurement cross-sections were evaluated on the
basis of depth measurements and water level observa-
tions. Depth measurements (at various points across
Figure 4.43. Channel profile and sampling/measurement points on the Yenisey
the channel) were taken once, prior to the start of the
river at the downstream cross section near Ust' Port.
3-day observation period. Water level observations
were then made every two hours for three days. To
·
For the Yenisey river at the downstream cross-sec-
model the channel profile, an averaged single value
tion near Ust'-Port settlement (see Figure 4.43):
for water level above the original gauging station
15 flow velocity measurements (3 horizontal lev-
datum was applied across the river cross section.
els on each of 5 vertical profiles);
Thus, 16 profiles were evaluated (one for each of the
measurement of the channel profile;
four cross-sections in each of the four water regime
36 measurements of the river water level;
phases) on the basis of average `effective' cross-sec-
analytical data on PTS concentrations for 3
tional areas during the 3-day observational periods.
pooled water samples and 3 pooled suspended
Ice thickness was taken into account in the construc-
matter samples from the surface, middle and
tion of the channel profile during the winter low
near-bottom horizons collected over a 3-day
water period.
period;
suspended matter concentrations in 3 pooled
The cross-section areas were subdivided into seg-
water samples collected over a 3-day period from
ments corresponding to the points of flow velocity
the surface, middle and near-bottom horizons.
measurements and sampling. The profile schemes
During the winter low water period, ice thickness was
for each cross-section showing segments are pre-
also measured at each of the cross-sections.
sented in Figures 4.39 to 4.43. The numbers of seg-
ments coincides with the number of observations
For calculations of mean monthly and annual PTS flux-
points.
es through the closing and downstream cross-sections
for the year in which the observations were made, oper-
In order to calculate partial and total mean daily PTS
ational data consisting of water discharge measure-
fluxes in dissolved and suspended form during the typ-
ments at river cross-sections in the area of Oksino and
ical water regime phases, the following assumptions
Igarka settlements were used. These data were provid-
were made:
ed by the Northern (Pechora river) and Central
·
At the closing cross-section, within a given segment,
Siberian (Yenisey river) Territorial Branches of
the PTS concentrations in water and suspended
Roshydromet.
matter do not vary over the time period being rep-
resented, and are equal to the measured concentra-
In order to calculate mean monthly and annual PTS
tion at the corresponding observation point.
fluxes through the closing cross-sections of the rivers for
·
At the downstream cross-section, within the com-
a year with `average' runoff, and to assist in the prepara-
bined segments identified, the PTS concentrations
tion of a brief review of the inter-annual variability in
in water and suspended matter do not vary over the
water runoff via the Pechora and Yenisey rivers, pub-
time period being represented, and are equal to the
lished hydrographical data from 1932-1998, obtained
measured concentrations in the corresponding
from the Roshydromet hydrological network, were used.
pooled samples.
·
Any PTS that were either not found in any of the
Calculation of mean daily PTS fluxes over the 3-day
samples during the entire observation period, or
observation periods was undertaken in several stages:
were found in less than 10% of the total number of
1. evaluation of the river channel profiles at the cross-
samples collected at both the closing and the more
sections where hydrometric measurements were
downstream cross-sections of a river, were excluded
taken;
from PTS flux calculations for the given hydrologi-
2. division of the cross-sectional area into segments,
cal phase.
for calculation of partial discharges and PTS fluxes;
·
Edge effects are not taken into account.
3. calculation of the partial mean daily water and sus-
pended matter discharges (for each segment iden-
An assessment of mean monthly PTS flux (µy) in dis-
tified) and total water and suspended matter dis-
solved and suspended form was made according to the
charges (for the whole cross-section) during each of
calculation method proposed by E.M.L. Beal (Frazer
the typical water regime phases;
and Wilson, 1981).
52
Chapter 4
4.3. Preliminary assessment of riverine fluxes as PTS sources
(4.1)
where:
µx mean daily water discharge for the given month
(L/day);
my mean daily flux of the substance under considera-
tion in the dissolved or suspended forms (kg/day),
obtained for a 3-day observation period;
mx mean daily water discharge (L/day), obtained for
a 3-day observation period;
n number of observation days in a month (using
our assumptions three).
and:
Xi, Yi values of the water discharge and flux of the sub-
stance under consideration for each specific day when
measurements were conducted.
In our case Yi=my and Xi=mx, as the concentration of
suspended matter and PTS concentrations were deter-
mined from a single integral sample collected during
the 3-day observation period and the water discharges
were calculated on the basis of the average flow veloci-
ty for a 3-day period.
In this case, equation (1) above for the calculation of
mean monthly PTS flux can be simplified to:
(4.2)
In applying this, the following assumptions were
adopted:
·
Values of my and mx were assumed to be constant
for the months which fall within each hydrological
season: i.e., May-July (spring flood); August-
September (summer low water period); October
(period before the onset of ice formation);
Table 4.12. PCB flux (kg/y) at the closing cross sections of the Roshydromet
November-April (winter low water period).
network, calculated for the period of observations (2001 2002), and for the long term
·
The ratio of the PTS fluxes in dissolved and particu-
mean annual water discharge.
late associated phases is constant inside the cross-sec-
tion and during the hydrological season represented.
·
For the Pechora, mean monthly water discharges at
·
The ratio of the PTS fluxes in dissolved and partic-
the Andeg cross-section were assumed to be equal to
ulate associated phases during the spring freshet is
the discharges at the Oksino cross-section.
assumed to be equal to the ratio during periods of
·
For the Yenisey, mean monthly water discharges at the
low discharge.
Ust'-Port cross-section were assumed to be 3% higher
than the discharges at the Igarka cross-section.
As mentioned above, mean monthly water discharges at
the closing cross-sections of the Pechora and Yenisey
Analytical studies covered the whole range of PTS includ-
rivers (near Oksino settlement and Igarka, respectively)
ed within the project scope, with the exception of dioxins
for both the observation year and an `average' water dis-
and brominated compounds, which were excluded due
charge year, for use in the calculations, were provided by
to their extremely low levels in abiotic freshwater environ-
Roshydromet. For the two downstream cross-sections,
ments. However, analysis of samples collected during field
similar data were not available. Consequently, the follow-
work also showed that levels of toxaphene compounds
ing assumptions were adopted for calculation purposes:
in all samples from the Pechora and Yenisey were lower
53
4.3. Preliminary assessment of riverine fluxes as PTS sources
Chapter 4
than effective detection limits (0.05 ng/L for water,
Although it is difficult to make a definite conclusion
and 0.01 ng/mg for suspended matter), therefore toxa-
regarding the cause of this peak appearance, the fol-
phene was also excluded from the assessment of fluxes.
lowing information should be noted:
·
the peak was observed not only during the summer
4.3.3. Overview of the assessment results
low water period, when it was detected for the first
time, but also during the period before ice forma-
PCB
tion in October (Figure 4.62);
Estimated PCB fluxes via the Pechora and Yenisey
·
the peak is due to increased fluxes in PCB con-
rivers are presented in Table 4.12. It is worth noting
geners associated with suspended matter, with dis-
that the estimated fluxes of specific PCB congeners
solved forms showing practically unchanged fluxes;
through both the closing cross-sections of the regular
·
compared to the spring flood peak, which, as in the
hydrometric network and the downstream cross-sec-
case of the Pechora, is a result of fluxes of tri- and
tions are very similar (Figure 4.44). Based on this infor-
tetra-chlorobiphenyls, the second flux peak has a
mation, the overview of assessment results for other
higher contribution of penta- and hexa-chloro-
contaminant groups, below, focuses mainly on fluxes in
biphenyls, particularly CB118 and CB138 (Figure
the closing cross-sections of the rivers.
4.46).
Figure 4.46.
Monthly fluxes (kg)
of selected PCB congeners in
(a) dissolved
(b) suspended form
in the Yenisey river.
a
Figure 4.44. Estimated fluxes (kg/y) of PCB congeners at the closing (Oksino)
and downstream (Andeg) cross sections of the Pechora river.
The total PCB flux in the Pechora river consists almost
entirely of tri- and tetra-chlorobiphenyls. Fluxes of the
heavier PCB congeners are negligible. This is consis-
tent with information presented to the OSPAR
Commission by Sweden (Axelman, 1998).
The structure of PCB fluxes in the Yenisey river are
b
more complex. As expected, peak PCB fluxes in both
rivers coincide with springtime peaks in water dis-
charge, which occur later in the lower Yenisey than in
the lower Pechora. However, flux values for the Yenisey
river also exhibit a distinct second peak in the late sum-
mer-autumn period (Figure 4.45).
Figure 4.45.
Monthly fluxes (kg) of PCB
in the Pechora and Yenisey
rivers.
Two possible explanations for the second peak are:
·
instrumental/procedural errors during analysis of
the samples;
Table 4.13. Fluxes of polychlorinated benzenes (kg/y) in flows of the Pechora
·
accidental PCB release from some unknown pollu-
and Yenisey rivers, calculated for the period of observations (2001 2002),
tion source.
and for the long term mean annual water discharge.
54
Chapter 4
4.3. Preliminary assessment of riverine fluxes as PTS sources
This evidence, whilst indirect, argues for the likely
explanation being an accidental PCB release from a
non-identified local source. However, in case of a short-
term release, estimation of the annual flux based of
this data can be overestimated.
Polychlorinated benzenes
Estimates of annual fluxes of polychlorinated benzenes
(PCBz) in the flows of the Pechora and Yenisey rivers
are presented in Table 4.13. As expected, hexa-
chlorobenzene (HCB) is the main compound in this
contaminant group, with relatively high fluxes in both
rivers. Although tetra-chlorinated benzenes (TeCBz)
have occasionally been found in both water and sus-
pended matter of both rivers, their concentrations
were close to detection levels, and as such they cannot
be considered contaminants that pose a significant
threat to either the aquatic environment or humans.
Seasonal distribution of fluxes exhibit the a typical pat-
tern of a peak during the spring flood period (Figure
4.47).
Figure 4.47. Monthly fluxes (kg) of QCB and HCB
in the Pechora river.
Table 4.15. Fluxes of DDT compounds (kg/y) in flows of the Pechora
and Yenisey rivers for 2001 2002.
HCH compounds increase downstream in the Pechora
river, while the Yenisey shows the opposite trend. A pos-
sible explanation is that the downstream section of the
Pechora rivers shows the impact of local HCH usage,
while HCH fluxes in the lower Yenisey river are the
result of long-range transport alone, and thus the down-
stream section of the river has lower loads due to self-
purification processes in the aquatic environment. It
should be noted however that in case of short-term envi-
ronmental releases annual fluxes can be overestimated.
(b) DDTs
Fluxes of DDTs in flows of the Pechora and Yenisey
Table 4.14. Fluxes of HCH compounds (kg/y) in flows of the Pechora
rivers show similar trends as for HCHs (Table 4.15),
and Yenisey rivers for 2001 2002.
with a strong increase in concentrations between the
Oksino and Andeg cross-sections of the Pechora, and a
Organochlorine pesticides and their metabolites
decrease between the Igarka and Ust'-Port cross-sec-
tions of the Yenisey. This can be explained by a large
(a) Hexachlorocyclohexane (HCH)
local input of DDT into the lower part of Pechora, par-
Data on HCH fluxes in the Pechora and Yenisey rivers
ticularly during the spring flood period (Figure 4.48),
are presented in Table 4.14. For both rivers, total HCH
whereas in the Yenisey, the contamination is the result
fluxes are dominated by - and -HCH isomers, with -
of long-range transport of contaminants in the Yenisey,
HCH the most prevalent. However, the two rivers do
with fluxes decreasing downstream due to self-purifica-
not show consistent trends between the closing cross-
tion. This conclusion is supported by the significant
sections of the regular observation network and the
change seen in the composition of the total DDTs flux
more downstream cross-sections, established close to
at the downstream Andeg cross-section when com-
areas inhabited by indigenous population. Fluxes of all
pared to Oksino. At Andeg, the proportion of the DDT
55
4.3. Preliminary assessment of riverine fluxes as PTS sources
Chapter 4
Figure 4.50.
DDT concentrations (ng/mg)
in suspended matter of the
Pechora river at the Andeg
cross section (PA 1: surface
layer, PA 2: middle layer,
PA 3: bottom layer)
(see Figures 4.40 and 4.49).
(c) Other chlorinated pesticides
Figure 4.48. Monthly fluxes (kg)
of DDT in the Pechora river.
Other chlorinated pesticides included in the priority
list of PTS considered in the project were either found
component is far greater (Figure 4.49). Considering
only at levels below detection limits, or had fluxes that
that the absolute value of DDD, which is a dechlori-
would not be expected to have any noticeable impact
nated DDT analog in the technical DDT mixture
on the health of indigenous human populations (Table
(AMAP, 1998), also shows an almost three-fold
4.16).
increase, it is reasonable to assume that the DDT flux
increase is due to fresh local input of DDT. For the
Yenisey river, the DDT flux composition did not alter
between the two cross-sections. In this case, like in case
of HCH, annual fluxes can be overestimated.
It should be noted that the increase in DDT flux at the
Pechora, Oksino
Pechora, Andeg
Table 4.16. Fluxes of other chlorinated pesticides (kg/y) in flows of the Pechora
and Yenisey rivers for 2001 2002.
Yenisey, Igarka
Yenisey, Ust-Port
Polycyclic aromatic hydrocarbons (PAHs)
DDT
DDE
DDD
The list of PAHs included in the scope of the prelimi-
nary assessment of riverine fluxes included 20 com-
Figure 4.49. Composition of total DDT fluxes in the Pechora and Yenisey rivers.
pounds. Annual fluxes of 10 PAHs in the Pechora and
Yenisey are presented in Figures 4.51 and 4.52, respec-
Andeg cross-section is mostly determined by an
tively. However, fluxes of several PAHs could not be
increase in its suspended form. Data quality can be ver-
assessed, as their concentrations in water and suspend-
ified from the comparability of data obtained for the
ed matter in both rivers were below detection limits.
suspended matter flux in different layers of the Andeg
These were:
cross-section (Figure 4.50). The ratio of o,p'-DDT to
acenaphthene, benzo[a]anthracene,
p,p'-DDT in the surface, middle and bottom layers of
benzo[b]fluoranthene, benzo[e]pyrene, perylene,
the river flow remains constant, however, the surface
benzo[k]fluoranthene, benzo[a]pyrene,
layer shows lower levels of DDT when compared to the
dibenzo[a,h]anthraceneindeno[1,2,3-c,d]pyrene,
middle and bottom layers.
and benzo[ghi]perylene.
56
Chapter 4
4.4. Preliminary assessment of riverine fluxes as PTS sources
In both rivers, PAH fluxes are dominated by the more
PAHs (fluoranthene and pyrene). Increase in fluxes of
soluble 2-cyclic PAHs (naphthalene, 2-methylnaphtha-
these less readily transported 4-cyclic PAHs provides
lene, biphenyl) and, to certain extent, 3-cyclic PAHs
additional evidence of local pollution sources between
(fluorene, phenanthrene). At the downstream Ust'-
the Oksino and Andeg cross-sections of the Pechora
Port cross-section of the Yenisey river, PAH fluxes are
river.
significantly lower. This confirms an absence of addi-
tional PAH sources between the two cross-sections
Heavy metals.
along this part of the river. However, fluxes of some
Data on annual fluxes of heavy metals that were includ-
PAHs at the downstream Andeg cross-section of the
ed in the study (lead, cadmium, and mercury) are pre-
Pechora river are significantly higher than at the
sented in Table 4.17.
upstream Oksino cross-section. This is true not only for
2- and 3-cyclic PAHs, such as 2-methylnaphthalene, flu-
(a) Lead
orene and phenanthrene, but also for the heavier
The intra-annual distribution of lead fluxes in flows of
the Pechora and Yenisey rivers are presented in Figures
4.53 and 4.54. For both rivers, peaks of lead fluxes coin-
cide with the peak of the spring flood. It is noticeable
that the composition and annual distribution of lead
flux in the Yenisey river has a more complicated pat-
tern than that of the Pechora river. During low-water
periods, and particularly during the ice cover season,
lead flux at both the Igarka and Ust'-Port cross-sections
is dominated by the dissolved form of the metal, with
levels almost twice as high at the upstream cross-sec-
tion. However, during the flood period, the flux at the
Table 4.17. Fluxes of heavy metals (t/y) in flows of the Pechora and Yenisey rivers
Ust'-Port cross-section is significantly higher than at
for 2001 2002.
Igarka, and is mostly due to suspended forms of lead.
Figure 4.51.
Estimated fluxes (t/y)
of PAHs in the flow
of the Pechora river.
Oksino
Andeg
Figure 4.52.
Estimated fluxes (t/y)
of PAHs in the flow
of the Yenisey river.
Igarka
Ust-Port
57
4.3. Preliminary assessment of riverine fluxes as PTS sources
Chapter 4
during the spring flood period (Figures 4.58 and 4.59).
The Yenisey river mercury flux almost totally consists of
suspended forms of the metal. The composition of the
mercury flux of the Pechora river is more complicated,
and differs between the Oksino and Andeg cross-sec-
tions (Figure 4.60). Total flux at the upstream Oksino
cross-section is higher relative to that at Andeg (Figure
4.61). During the spring flood period, suspended forms
of mercury are dominant in the flux, particularly at
Figure 4.53. Monthly fluxes (t)
of lead in the Pechora river.
July
September
Figure 4.54. Monthly fluxes (t)
of lead in the Yenisey river.
This suggests that during the ice cover season, lead flux
is almost totally determined by long-range transport of
the more mobile dissolved form of lead, from industri-
alized regions in the central part of the Yenisey basin;
whereas, during the flood period, lead flux is dominat-
ed by local runoff from the area between Igarka and
November
April
Ust'-Port, which can be significantly affected by the
dissolved
suspended
Norilsk industrial region.
Figure 4.56. Seasonal changes in the ratio of dissolved and suspended fluxes
of cadmium in the Pechora river flow.
(b) Cadmium
Compared to the other PTS, the difference in cadmi-
um fluxes seen in the flows of the Pechora and Yenisey
rivers is much more pronounced (Figure 4.55). It is
also notable that the composition of cadmium fluxes in
the two rivers are different (Figures 4.56 and 4.57). The
Pechora river flux has a much greater proportion of
the suspended form of cadmium, particularly during
the spring flood period. During the ice cover season,
this difference is not so noticeable. This could be
explained by the higher sediment load of the Pechora,
July
September
compared to the Yenisey.
Figure 4.55.
Monthly fluxes (t)
of (dissolved+suspended)
cadmium in the Pechora
and Yenisey rivers.
November
April
(c) Mercury
In general, the intra-annual distribution of mercury
dissolved
suspended
fluxes in the Pechora and Yenisey correspond to the
Figure 4.57. Seasonal changes in the ratio of dissolved and suspended fluxes
respective river hydrographs, with the highest fluxes
of cadmium in the Yenisey river flow.
58
Chapter 4
4.3. Preliminary assessment of riverine fluxes as PTS sources
a
July
b
Figure 4.58. Monthly fluxes (kg)
of mercury in the Pechora river.
Figure 4.59.
Monthly fluxes (kg)
of mercury in the Yenisey
river.
a
September
b
Andeg. During low water periods, the dissolved pro-
portion of the total mercury flux is larger, amounting
to 74% of the total at Andeg during the ice cover sea-
son. It should be also noted that during this period, the
dissolved flux at these two cross-sections is fairly con-
stant (17-20 kg), while suspended flux is noticeably
lower at Andeg than at Oksino (Figure 4.61); this can
be explained by sedimentation processes.
a
November
b
The significant difference in the composition of mer-
cury fluxes in the Pechora and Yenisey rivers may be
explained by differences in their water composition.
Concentrations of total organic matter in the Pechora
are almost twice as high as those in the Yenisey, reach-
ing 13-15 mg/L Total Organic Carbon (TOC), 98% of
which is in dissolved form (Kimstach et al., 1998). As
TOC in natural waters is mostly represented by humic
and fulvic acids, which form strong complexes with
mercury, the trends in the Pechora mercury fluxes are
understandable.
a
April
b
dissolved
suspended
4.3.4. Conclusions
1. In general, PTS fluxes in the Pechora and Yenisey
Figure 4.60. Ratio of dissolved and suspended fluxes of mercury
river flows correspond to seasonal river discharges.
at (a) the Oksino and (b) the Andeg cross sections of the Pechora river
Highest fluxes usually coincide with spring peak
discharges.
2. Among the chlorinated persistent organic pollu-
tants, the highest fluxes are observed for PCBs,
HCH and DDTs. The amounts of these contami-
nants transported by river flows to areas inhabited
by indigenous peoples are such that they could con-
tribute to risks to human health.
3. Levels of other chlorinated organic pollutants are
Oksino
Andeg
either below detection limits, or their fluxes are not
dissolved
suspended
sufficiently high to represent a significant risk to the
Figure 4.61.
indigenous population.
Mercury fluxes (kg) at two cross sections in the Pechora river
in April 2002
59
4.4. Local pollution sources in the vicinities of indigenous communities
Chapter 4
4. PCB fluxes are mostly in the form of tri- and tetra-
North (RAIPON), and also from expert estimates of
chlorobiphenyls. Fluxes of the heavier PCB con-
PTS release resulting from use of organic fuel (as this
geners are practically negligible.
information is not included in official statistical data
on PTS emissions). This latter source of atmospheric
5. HCH and DDT fluxes in the Yenisey river flow are
PTS is important for pollutants such as heavy metals,
the result of long-range transport. In the Pechora
PAHs, and dioxins. It should be mentioned that in
river, local sources may contribute to the fluxes of
Russia, dioxin emissions have not been recorded and,
HCH and DDT in the lower reaches of the river.
among PAHs, only benzo[a]pyrene emissions are
DDE to DDT ratios indicates that the increased
recorded.
DDT flux in the lower part of the river may be
caused by fresh use of this pesticide. However, tak-
Under the study, expert estimates were made for emis-
ing into account possible short-term environmental
sions of the following PTS: lead, cadmium, mercury,
release of these substances, their annual fluxes can
benzo[a]pyrene, benzo[k]fluoranthene, indeno[1,2,3-
be overestimated.
c,d]pyrene, and dioxins. These estimates were made
using statistical data relating to consumption of the var-
6. Fluxes of polycyclic aromatic hydrocarbons (PAHs)
ious kinds of fuels and associated emission factors (for
in both rivers consist mostly of 2- and 3-cyclic com-
the amount of contaminants released to the atmos-
pounds. In addition to contamination through
phere per tonne of a specific fuel). Emission factors
long-range transport, the lower reaches of the
were determined either in accordance with existing
Pechora river may also be affected by local sources
Russian methodology, or by adapting Western Euro-
of PAHs, which contribute some heavier com-
pean emissions factors to take account of Russian tech-
pounds.
nologies.
7. Fluxes of heavy metals (lead, cadmium and mercu-
Statistical data were provided by the State statistic
ry) in the flow of the Yenisey river, are the result of
offices of the relevant administrative territories of the
local contamination, in addition to contamination
Russian Federation, environmental protection author-
from long-range transport, particularly during the
ities, and reports by the Russian Federation's State
spring flood period. This can be explained by the
Committee for Statistics (Goskomstat).
influence of pollution from the Norilsk industrial
complex.
Regional Branches (Committees) of the Russian
Federation's Ministry of Natural Resources were
4.4. Local pollution sources
responsible for the initial collection and processing of
in the vicinities of indigenous communities
data and information. The inventory of pollution
sources was based upon the following sources of infor-
4.4.1. Introduction
mation:
The main objectives of undertaking an assessment of
local pollution sources were to determine their role in
State Statistic Reports on emissions of gaseous
general environmental pollution, in the contamina-
pollutants discharges of waste waters, and solid
tion of traditional food products and, accordingly, to
waste from industrial, municipal and agricultur-
determine their influence on human health. For inven-
al enterprises and transport;
tory purposes, `local sources' were taken to mean
Ecological passports of industrial enterprises;
sources within an approximate maximum distance of
Reports on environmental protection activities
100 km of sites of residence of indigenous peoples.
of the local environmental protection authori-
Specific boundaries for inventory zones, however, were
ties, sanitary-epidemiological control services,
defined more exactly in each case by taking account of
agricultural administrative authorities, and
local conditions (dominating winds, river flows and the
other information sources (Murmansk, 1991-
scale of regional sources, etc.). As some of the pilot
2000; Murmansk, 1996-2000; Murmansk, 2001;
study areas within the project are affected by pollution
Murmansk, 1994-2000; Nenets, 1998; Nenets,
which originates from large industrial complexes locat-
1999; Nenets, 2001);
ed in their vicinity, the pollution source inventory
Annual reports and reviews of Federal Ministries
included such towns as Apatity, Monchegorsk,
and Departments (MNR, 2001; Roshydromet,
Olenegorsk, Revda, and Kirovsk (in Murmansk
1995-2000);
Oblast); Nar'yan-Mar (in the Nenets AO); Norilsk
Other relevant official sources and literature.
(located in the Taymir AO, but under the administra-
tive authority of Krasnoyarsk Krai); and Anadyr (in the
It is necessary to mention, however, that there was
Chukotka AO).
variation in the completeness and volume of infor-
mation provided by the various regions for the inven-
The assessment was based on official data relating to
tory, due to different technical, organizational, and
PTS emissions, obtained from the various administra-
other aspects of the relevant local services. Due to
tive territories and regions, representatives of the
this, a certain amount of data are derived from
Russian Association of Indigenous People of the
expert estimates.
60
Chapter 4
4.4. Local pollution sources in the vicinities of indigenous communities
Table 4.19. Total air emissions of pollutants (thousand tonnes) from major
industrial pollution sources in the inventory area in Murmansk Oblast, 2002,
and their percentage contribution to emissions from the
corresponding cities/districts.
Table 4.18. Industrial air emissions of major contaminants in the cities
and districts of the Murmansk Oblast in 2002, thousand tonnes (NEFCO, 2003).
4.4.2. Murmansk Oblast
4.4.2.1. General description
The inventory of PTS sources covered the territory
Table 4.20. Wastewater discharges (million m3) from selected large industrial
within a radius of at least 100 km of the settlement of
enterprises in 2002, and associated discharges (tonnes) (NEFCO, 2002).
Lovozero. It includes the cities of Monchegorsk,
Olenegorsk, Apatity, Kirovsk, and Revda.
These include the Nickel and Copper Combined
Smelter JSC GMK Pechenganikel, in the city of
Murmansk Oblast is one of the largest and most eco-
Zapolyarny and the town of Nikel; the Iron Ore
nomically developed regions of Russia's European
Concentration Plant JSC Olkon, in the city
North. Almost the entire territory lies to the North of
of Olenegorsk; the Nickel and Copper Combined
the Arctic Circle. The population amounts to 958,400
Smelter JSC Severonikel, in the city of Monche-gorsk;
residents, of whom 91.7% are urban and 8.3% percent
the Mining Plant Apaptit JSC, in the cities of Kirovsk
are rural. The northern indigenous peoples, mostly
and Apatity; the Iron Ore Kovdor Mining and
Saami, amount to 0.2% of the total population.
Concentration Plant JSC, and the Concen-
tration Plant Kovdorslyuda JSC, in the city of Kovdor;
The economy of Murmansk Oblast is mainly oriented
and the rare metals extraction and concentration plant
towards the extraction and reprocessing of natural
Sevredmet JSC, in the settlement of Revda. The contri-
resources. The region produces 100% of Russia's
butions made by the large enterprises located in the
apatite concentrate, 12% of iron-ore concentrate, 14%
inventory area to total air emissions in the correspon-
of refined copper, 43% of nickel, and 14% of fish food-
ding city/district are presented in Table 4.19.
stuffs. Concerning production industries, 90% of the
gross regional product is created by primary industrial
Surface water bodies located close to settlements and
enterprises.
industrial complexes have a high degree of pollution,
as determined by their acidification (pH) and levels of
Estimates of emissions of general air pollutants (SO2,
fluorine (F), aluminium (Al), iron (Fe), and man-
NOx, CO, and dust) from industries in the region are
ganese (Mn), which all exceed maximum permissible
presented in Table 4.18. Although these pollutants are
concentrations. Data on wastewater discharges from
not representative of any specific PTS, they do charac-
the selected large industrial enterprises in the survey
terize levels of general environmental pollution, and
area are presented in Table 4.20.
thus are related to pollution impacts on human health.
As shown, industrial enterprises located in the vicinity
Monchegorsk area
of the study area, which is densely populated by the
A zone of `extremely unfavorable environmental pol-
Saami people, emit a significant part of the total indus-
lution' lies within the area influenced by the cities of
trial air emissions in Murmansk Oblast, particularly
Monchegorsk and Olenegorsk. This zone occupies
NOx and dust.
an area of about 1400 km2, and has the form of an
ellipse with the city of Monchegorsk at its epicenter
Mining and processing plants provide the basis for the
and its long axis extending 48-50 km to the south
economies of the majority of the regions large towns
(due to the prevailing wind direction). In the north,
and cities where a third of the Oblast's population live.
the zone extends as far as the city of Olenegorsk,
61
4.4. Local pollution sources in the vicinities of indigenous communities
Chapter 4
incorporating the urban agglomeration, and in the
km2), hazardous (200 km2), moderately hazardous
south, it extends to Viteguba. The Monchegorsk
(240 km2) and acceptable (435 km2) with respect to
area is characterized by extreme levels of annual
pollution of soils. The total area of polluted land
deposition of nickel (Ni) and copper (Cu) (115.9
amounted to 565 km2. With increasing distance from
and 136.5 kg/km2, respectively). Cadmium levels in
the industrial pollution sources and the Lovozero
the surface geological horizon in this area are five
Massif (an ore-rich feature, which itself creates a natu-
times higher than the background level for the
ral geochemical anomaly), a drastic reduction in the
region. These figures confirm the high environmen-
content of all polluting substances in soils, with the
tal impact of the Monchegorsk `Severonickel' com-
exception of sulphur, can be observed. Sulphur con-
bined smelter.
tent in soils has a patchy occurrence, with localised
`hotspots', usually seen in remote places, far from the
Kirovsk Apatity
sources of gas and dust emissions.
This area is located within the limits of the Khibiny
Massif, which is a natural geochemical anomaly with
As in the case of soils, the highest pollution levels in
respect to the vast number elements and the unique
mineral bottom sediments of water bodies are
deposits of apatite and nepheline ores. `Apatit' JSC,
observed in the area of the Lovozero Massif and its
which processes and enriches deposits of apatite and
spurs, where the main mining and concentration
nepheline ores, is considered as the main pollution
plants are located. Similar to soils, the maximum levels
source for this area. The plant is one of the world's
of toxic elements (for the same group of main pollu-
biggest manufacturers of raw phosphate used in the
tants) found in bottom sediments generally corre-
production of mineral fertilizers. `Apatit' JSC is a huge
spond to the level of emissions. Contrary to its distri-
mining and chemical complex which currently
bution in soils, however, maximum concentrations of
includes four mines, a concentration plant, railway
sulphur are found in the bottom sediments of water
facilities, an automobile workshop, and about thirty
courses in urban areas.
other service workshops.
4.4.2.2. Inventory of PTS pollution sources
Since opening, the `Apatit' plant has extracted and
transported more than 1.4 x 10⁹ tonnes of ore to the
Pesticides
concentration plant, and produced about 520 million
According to data provided by the Murmansk
tonnes of apatite and more than 52 million tonnes of
Territorial Station for Plant Protection, chlorinated
nepheline concentrates. The concentrates also con-
pesticides that are the main subject of the PTS inven-
tain fluorine, strontium oxide, and rare-earth ele-
tory have not been used, and are not currently used, in
ments, which may be separated as individual products
Murmansk Oblast. Other types of pesticides used over
during processing. Nepheline concentrate is used as a
the last twenty years, according to the information
raw material for producing alumina, and in the glass
available from this office, are shown in Table 4.21. The
and ceramic industries. It is also used as a raw materi-
quantity of pesticides used on open ground varies from
al for producing soda, potash, cement, and other
tens to a few hundred kilograms in weight, because the
products.
area of agricultural land is limited.
Lovozero Revda
This area is located in a zone of heavy metal contami-
nation created by the `Severonickel' combined
smelter. The largest local pollution source is the rare
metals combined enterprise JSC `Lovozero GOC' (for-
merly known as `Sevredmet'), located in the settle-
ment of Revda. The enterprise consists of two mines
(Karnasurt and Umbozero) and two concentration
plants. Tailings and rocks left after drifting and strip-
ping are stockpiled in surface dumps and storage sites.
Mining and drainage waters are discharged into sur-
face water bodies.
The river with the highest anthropogenic load is the
Sergevan, which receives untreated and poorly-treated
mining, filtration, and domestic wastewaters from the
Karnasurt mine and concentration plant. Fluorine, sul-
phates, and nitrates are typical constituents of the min-
ing waters. Environmental and geochemical mapping
of the northern part of the Lovozero Massif which was
carried out between 1993 and 1996, (Lipov, 1997),
Table 4.21. Use of pesticides in 1990 2000 in the Murmansk Oblast inventory area,
depicted areas classed as extremely hazardous (125
data from the Murmansk Territorial Station for Plant Protection.
62
Chapter 4
4.4. Local pollution sources in the vicinities of indigenous communities
Such agricultural enterprises as `Industria', `Revda',
which, according to available information, contain no
and `Monchegorsky' and "POSVIR", store pesticides in
synthetic PCB additives. The PCB-containing trans-
standard or customized warehouses, which are regis-
former fluid `Sovtol' (total amount: 35.92 t) is used
tered by the sanitary and epidemiological surveillance
only in 13 transformers of the TNZ type at `Apatit' JSC.
bodies. The agricultural enterprise `Tundra' has
The inventory did not find any other enterprises with-
received one-off permissions for delivery and use of
in Murmansk Oblast that use PCB-containing fluids in
plant protection chemicals.
any type of electric equipment.
It should be noted that the table contains data on her-
At the same time, it is notable that of the 180000 t of
bicides only, and that no other types of pesticides, par-
PCB that was produced in the former USSR/Russia,
ticularly insecticides, are included. It is, therefore, like-
53000 t were in the form of the product `Sovol' that was
ly that the data and information provided by the
used in the production of varnish and paint (37000 t)
regional authorities responsible for pesticide use and
and lubricants (10000 t). In addition, ca. 5500 t were
handling is incomplete.
used by defence-related industrial enterprises for
unknown purposes (AMAP, 2000) and tracing the fate
According to the Regional Veterinary Medicine
of these PCB-containing products has proved problem-
Administration (pers. comm.: letter no. 38/482 of
atic. In view of the fact that Murmansk Oblast is known
08.04.2003), the pesticide `Etacyde' was used in the
to have a high concentration of defence-related activi-
1960-1970s on reindeer farms in the Murmansk region
ties, particularly in previous decades, it might reason-
to treat the animals against subcutaneous reindeer gad-
ably be assumed that a considerable proportion of
flies. From the early-1980s until the present, the pesti-
these products were used here, and probably con-
cide `Ivomex' has been used. According to the infor-
tributed to PCB contamination of the area.
mation received, there has been no treatment used
against blood-sucking insects.
Dioxins and Furans
Data on emissions of dioxins and furans from industrial
A tentative (but not comprehensive) inventory of
enterprises are not included in the state statistical
stocks of obsolete pesticides in Murmansk Oblast, has
reporting system, and therefore there is no information
identified a number of stocks in the study area (Table
on their contribution to pollution of the survey area.
4.22). It should be noted that this information also
Some enterprises, such as the combined nickel smelter
lacks data on stocks of chlorinated pesticides, except
`Severonikel' are likely to be sources of dioxins, but
one enterprise in the city of Murmansk.
there is no information available to confirm this assump-
tion. Overall, there are a number of dioxin sources that
are likely to affect the survey area (Table 4.23).
Table 4.22. Stocks of obsolete pesticides in the Murmansk Oblast, kg.
(in bold letters the inventory area)
Polychlorinated biphenyls (PCBs)
There is no statistical registration or control of PCB
release to the environment. Therefore, for the invento-
ry of possible PCB pollution sources, all enterprises in
the cities and villages mentioned above, plus the enter-
prises of the regional energy company `Kolenergo' JSC
were canvassed. According to data provided by these
enterprises, the total number of power transformers in
the survey area is 1590, including 1458 in operation
and 132 in reserve. However, most of them are filled
with the following mineral oils: T-1500, Tkp, Tk, T-750,
Table 4.23. Main sources of dioxin formation
GOST 982-56, GOST 10121-76, TP-22, and OMTI,
and emissions (Kluyev et al., 2001).
63
4.4. Local pollution sources in the vicinities of indigenous communities
Chapter 4
Polyaromatic hydrocarbons (PAHs)
·
`Rick-market' Ltd (Kolsky Distrikt), a new installa-
Of the large group of PAH compounds, only emissions
tion with environmentally sound recovery of mer-
of benzo[a]pyrene are documented. No instrumental
cury wastes;
control measurements of benzo[a]pyrene emissions are
·
`Ecord' Ltd (Kirovsk), an outdated installation that
carried out, however. Emissions have therefore been
entered into operation in 1994. According to envi-
estimated for heat and power plants using fossil fuels;
ronmental protection authorities, this plant,
metallurgical plants (`Severonikel' JSC, `Olcon' JSC);
although utilizing a proportion of lamps from
and mining enterprises (`Apatit' JSC, `Sevredmet' JSC).
Murmansk Oblast, actually contributes itself to mer-
cury contamination of the environment. It should
In general, the two major PAH pollution sources are
be stressed that this enterprise is located within the
fossil fuel, including raw oil, combustion, and the
survey area.
incomplete incineration of organic materials such as
wood, coal and oil. Usually, the heavier the fuel source,
Re-cycling of other equipment and instruments con-
the higher the PAH content.
taining mercury, as well as of metallic mercury itself, is
not systematically organized. Also, the two plants men-
The main anthropogenic sources of PAH are:
tioned above only treat used lamps from industrial
production of acetylene from raw gas;
enterprises and not from the wider community.
pyrolysis of wood, producing charcoal, tar and
soot;
Another significant source of mercury contamination
pyrolysis of kerosene, producing benzene,
is the mobilisation of mercury impurities within differ-
toluene and other organic solvents;
ent industrial activities. According to expert estimates,
electrolytic aluminum production with graphite
the annual mobilization of mercury impurities within
electrodes;
the Russian Federation comprises 83% of the annual
coke production;
intentional use of this metal. However, the amount of
coal gasification;
mercury released to the air through mobilisation is six
production of synthetic alcohol;
times greater than that from intentional use (COWI,
oil-cracking.
2004).
Large amounts of PAH can also be formed as a result
Nickel and copper production are among the most
of:
important sources of mercury mobilisation. As one of
incineration of industrial and domestic wastes;
the largest producers of primary nickel in the Russian
forest fires;
Federation, the `Severonickel' combined smelter (with
energy production based on the incineration of
annual production of 103000 t of nickel and 132700 t of
fossil fuel;
copper in 2001) is located in Monchegorsk, it must be
motor vehicles.
considered as a significant source of mercury contami-
nation in the area. The average content of mercury in
Benzo[a]pyrene emission data for the inventory area
the sulphide copper-and-nickel ore that is used in this
(Table 4.24), clearly show that information on emis-
smelter is 1 mg/kg (Fedorchuk, 1983). However, this
sions from industrial enterprises, even based on esti-
level can vary depending on the origin of the ore, from
mates, is extremely scarce.
0.05-0.11 mg/kg in ore from the Monchegorsk deposit
to 2.78 mg/kg in ore from the Nittis-Kumuzhie (Kola
Mercury
peninsula) deposit. It should be noted that, in recent
Intentional use of mercury in industrial production
decades, the `Severonickel' combined smelter has also
within Murmansk Oblast has not been documented.
used ore from different deposits, including those on
However, mercury-containing devices, luminescent
the Taymir peninsula. Given this, the average content of
lamps in particular, are widely used and contribute to
1 mg/kg provided above may be considered as a fair
environmental contamination, due to the lack of envi-
estimate. Expert estimates carried out within the ACAP
ronmentally sound waste handling. Mercury-contain-
project `Assessment of Mercury Releases from the
ing wastes (mostly discarded luminescent lamps), are
Russian Federation' concluded that mercury emissions
the main contributors to wastes of the highest hazard
from the `Severonickel' combined smelter were 0.18-
class (31.7 t in 2001. There are two enterprises involved
0.22 t in 2001. In addition, a further 0.0750.111 t was
in the treatment of spent luminescent lamps:
accumulated in captured dust (COWI, 2004).
Table 4.24.
Trends in emissions
of benzo[a]pyrene to the
atmosphere in the Murmansk
Oblast inventory area.
64
Chapter 4
4.4. Local pollution sources in the vicinities of indigenous communities
Lead
Coal combustion is considered a major contributor to
lead emissions, along with the combustion of other fos-
sil fuels. (Figure 4.62). In the middle of the 1990s, con-
tributions from coal and gasoline combustion were
comparable. However, in the late-1990s, due to the
reduction in the use of leaded gasoline, coal became
the dominant source of lead emissions. Total emissions
Figure 4.62. Trends in lead emissions from the combustion of fossil fuels
from the combustion of fossil fuels in the area have
in the Lovozero area, kg.
decreased in recent years, mainly due to the reduction
in emissions from motor vehicles (Figure 4.63).
Figure 4.63.
Contribution of different
branches of economic
Mercury
activity to total lead
Mercury mobilization due to the use of fossil fuels is
emissions through the use
mostly determined by fuel combustion in industrial
of fossil fuels in the
Lovozero area, kg.
sectors and energy plants (heat and power plants,
HPP). Fuel consumption by municipal services and the
general population comprises only a minor part of
total emissions (Figure 4.64). It should be noted that
mercury emissions from this source have not changed
significantly during recent years.
The role played by fossil fuel combustion in total mer-
cury contamination arising from local sources, is sig-
nificantly less than that due to mercury mobilization
through nickel and copper production at the
`Severonickel' combined smelter (not more than 3%).
However, given that domestic use of organic fuel, par-
ticularly coal, often contributes to the contamination
of the indoor environment, its significance in terms of
Figure. 4.64. Contribution of different branches of the economy to total mercury
human intake may be much greater.
emissions through fossil fuel combustion in the Lovozero area, kg.
Polyaromatic hydrocarbons (PAHs)
Estimates of PAH mobilization through the use of
organic fuel in the Lovozero area were made using
methods similar to those for heavy metals (Figure 4.65).
PAH releases have gradually decreased since the early-
1990s, possibly due to changes in the fuel types used.
However, after 1998, the amount of PAH released sta-
bilized, possibly due to the recovery of economy after
the 1997 crisis.
Figure 4.65. Mobilization of PAH compounds (benzo[a]pyrene, benzo[b]fluoran
thene, benzo[k]flouranthene, and indeno[1,2,3 c,d]pyrene) through the combustion
Dioxins
of organic fuel in the Lovozero area.
The trend in dioxin emissions with organic fuel com-
bustion in the Lovozero area is presented in Figure
4.66, which shows a decline during the early-1990s, but
4.4.2.3. PTS mobilization from combustion of fossil fuels
little change in emission levels since the mid-1990s.
Official statistical data exists on the consumption of
fossil fuels in Murmansk Oblast as a whole, but there
Industrial enterprises are the main source of dioxin
are no data on organic fuel consumption in the survey
pollution from organic fuel in the Lovozero area
area itself. According to statistics, about 23% of the
according to Figure 4.67. However, it should be noted
total population of the Murmansk Oblast live in the
Figure 4.66.
survey area, and in order to estimate emissions from
Dioxin emission trend
fossil fuel consumption it was therefore decided to
in the Lovozero area from
assume that use of fuel is proportional to the share of
organic fuel combustion.
the population. For calculation of dioxin and lead
emissions from gasoline combustion, it was assumed
that consumption of leaded gasoline in the survey area
comprised about 20% of total gasoline consumption
within the Oblast.
65
4.4. Local pollution sources in the vicinities of indigenous communities
Chapter 4
condensate; four of gas condensate; one of gas; and
one of gas and oil. The city of Nar'yan-Mar and the set-
tlement of Harjaga could both be considered as region-
al pollution sources.
Growth of activities associated with the development of
oil and gas deposits has been followed by an increase in
anthropogenic pollution impacts on the environment,
including:
·
air pollution due to emissions of hazardous sub-
1993
2000
stances (including that from associated gas flaring);
Heat and power plants (HPP)
Industry that the
·
pollution of surface and ground waters through dis-
Municipal
Domestic
Transport
charges of polluting substances;
·
extraction, together with oil, of associated highly
Figure 4.67. Contribution of different types of activities in the Lovozero area
mineralized production water;
to dioxin emissions through the combustion of organic fuel.
·
changes in the landscape (excavations, extraction
contribution from the municipal sector, particularly
of materials for construction of the oil and gas pro-
from local boilers used for non-centralized heating, has
duction infrastructure, building, cargo transporta-
significantly increased in recent years. Although still
tion, construction of roads, etc.), deforestation, soil
much less than emissions from industrial enterprises,
pollution by petroleum products, etc.;
the three-fold growth in dioxin emissions from munici-
·
landfill disposal of drilling waste;
pal sources within seven years (from 42.23 mg TEQ in
·
oil spill emergencies.
1993 to 122 mg TEQ in 2000) is a matter of concern.
In 2002, air emissions from stationary and mobile pol-
4.4.3. Nenets Autonomous Okrug (NAO)
lution sources amounted to 35.1 kt (in 2001 the total
amount of emissions was 36.6 kt), including 1.47 kt of
4.4.3.1. General description
dust and 36.6 kt of gaseous and liquid pollutants. Gas
The main focus of the PTS source inventory within the
emissions associated with oil extraction are very high,
NAO is data acquired from the city of Nar'yan-Mar,
and methods of utilising the gas have not yet been
which is the most significant pollution source in the
developed in NAO.
vicinity of the indigenous settlement of Nelmin-Nos.
In 2002, 24.5 kt of pollutants were emitted to the
Construction of various industrial facilities, and roads,
atmosphere by stationary pollution sources. The basic
as well as extraction and transportation of minerals
components of these air emissions were: ashes (720 t);
(primarily oil and gas), have had a considerable impact
soot (720 t); SO2 (3750 t); CO (12200 t); NO2 (4600 t)
on the environment in the NAO. A total of eighty-one
and hydrocarbons (2400 t). Although these pollutants
deposits of petroleum hydrocarbons have been found
cannot be considered as PTS, their emissions are a
in the territory of the NAO, of which seventy-eight are
measure of total environmental stress in the region.
on land and three on the Barents Sea shelf. Among the
The major polluters of the atmosphere are the energy
terrestrial deposits, sixty-six are of oil; six of oil and gas
producing companies: `Total RRR', JSC `Varandeygaz';
Table 4.25.
Industrial emissions from
major enterprises in the NAO
in 2002, tonnes.
66
Chapter 4
4.4. Local pollution sources in the vicinities of indigenous communities
ment facilities, and work to increase the capacity of
older sites, the volume of household wastewater enter-
ing landfills is decreasing every year. In other NAO set-
tlements, solid and liquid household waste is removed
not only to authorized sites, but also, to a large extent,
to illegal landfills.
The system of solid household waste collection does
not allow the separation of hazardous wastes (e.g.,
those containing mercury batteries, plastics, etc.) and
dumping of such wastes at landfill sites results in envi-
ronmental contamination by dangerous toxic sub-
stances, including dioxins, especially if fires occur.
Communal solid waste, together with hazardous waste
in landfills is also subjected to the effect of precipita-
tion which washes pollutants down into the soil profile,
Figure 4.68. Air emissions in major NAO
settlements in 1999, tonnes.
and subsequently leads to their transport with ground
waters. The situation is aggravated by a lack of landfill
JSC `Arcticneft'; `Kompaniya Polyarnoye Siyanie' Ltd;
sites equipped with environmental facilities, and the
JSC `Pechoraneft'; and `Lukoil-Komi' Ltd. (Table
low capacity of waste treatment facilities in Nar'yan-
4.25). Air emissions from the largest NAO settlements
Mar and other NAO settlements. Existing landfills do
are shown in Figure 4.68.
not meet environmental or sanitary requirements as:
they lack sanitary protection zones,
Official statistics do not document any significant pol-
they lack rainwater filtrate removal
lution sources in the lower part of the Pechora basin,
and treatment systems;
although wastewater discharges have increased 1.7-fold
they lack waterproof screens.
since 1998, mostly due to water use in oil and gas pro-
duction and by municipal services.
The most hazardous and widespread waste products are
luminescent lamps containing mercury (2.49 t in 2000),
Nar'yan-Mar port is one of pollution sources and is
obsolete accumulators (4.1 t), used motor oil (119.3 t),
located on the right bank of a narrow channel, the
drilling sludge (7908 t) and oil-slime (329.2 t).
Gorodetsky Shar, which joins the Great Pechora river
1.5 km upstream of its mouth and 110 km from the
There are no facilities specifically designed for the pro-
Bolvansky cape. The port has no storage tanks and,
cessing or incineration of solid communal waste in
therefore, wastewater is discharged directly into the
NAO, and only a small amount of solid communal
Pechora river without treatment.
waste is incinerated at industrial sites, generally those
involved in oil and gas development activities.
Levels of pollutants in the Pechora delta tend to be ele-
vated. Contamination is connected, not only with the
Processing of medical waste, rubber waste products,
local activities, but also, to a large extent, with pollu-
and ash-and-slag wastes from boiler-houses, has also
tion due to wastewater discharges from enterprises
not been developed in NAO. The medical institutions
located in the Pechora basin involved in gas and oil
of the city of Nar'yan-Mar generated 16.8 t of waste
production (i.e, polluting substances transported with
products that were transported to the municipal land-
the Pechora flow). However, based on the data and
fill site in 2001.
information obtained from project activities con-
cerned with the assessment of riverine pollution fluxes,
4.4.3.2. Inventory of PTS pollution sources
it may be possible that there are also considerable
sources of PTS located between the settlements of
Pesticides
Oksino and Andeg (an area which includes Nar'yan-
According to information obtained from the
Mar and its suburbs) which contribute to PTS fluxes in
Department of Agriculture and Foodstuffs of the NAO
the river flow.
Administration, no chlorinated pesticides, insecti-
cides, disinfectants, etc., have been used in the last ten
The current system of handling solid household wastes
years in the Pechora river flood-plain by any agro-
in Nar'yan-Mar consists of the collection of waste in
industrial enterprises or related organizations.
containers, cesspools, and auto-dumpers, followed by
Hexachlorobenzene (HCB) has not been used as a dis-
their transportation to landfill using specialized and
infectant.
other motor transport. In addition, household waste-
water is also transported to landfills, since most exist-
Industrial chemical compounds
ing housing is not connected to sewer systems, and the
According to information received, no enterprises
capacity of older treatment facilities is insufficient.
exist in Nar'yan-Mar or in territories adjoining the set-
However, due to the recently commissioned new treat-
tlement of Nelmin-Nos that could represent a potential
67
4.4. Local pollution sources in the vicinities of indigenous communities
Chapter 4
Mercury
Leaded
Mercury mobilization from the combustion of fossil fuels
gasoline
in the Nelmin-Nos area is rather small. For example, in
Coal
1997 it did not exceed 1 kg. Such low levels of mobiliza-
Firewood
tion can be explained by the widespread use of natural
gas by major consumers, in particular the Nar'yan-Mar
heat and power plant and municipal boilers.
Polyaromatic hydrocarbons (PAHs)
Data on PAH emissions from the combustion of vari-
Figure 4.69. Lead emissions from organic fuel combustion
in the Nelmin Nos area.
ous kinds of hydrocarbon fuels in the Nelmin-Nos area,
including Nar'yan-Mar, are presented in Figure 4.72. A
major contribution to total PAH emissions is made by
Cars
the gasoline-fueled motor vehicles. It is notable that
Trucks
the role of gasoline in total PAH emissions has
Busses
increased drastically in recent years, due to a signifi-
Snowmobiles
cant growth in the number of cars in the area, particu-
larly in Nar'yan-Mar. Before that, diesel fuel had played
a dominant role (Figure 4.73).
Figure 4.70. Lead emissions resulting from different means
of transportation in the Nelmin Nos area.
Figure 4.71.
Lead emissions from
the combustion of leaded
gasoline in the Nelmin Nos
area, kg.
Figure 4.72. PAH (benzo[a]pyrene, benzo[b]fluoranthene, benzo[k]flouranthene,
and indeno[1,2,3 c,d]pyrene) emissions from the combustion of hydrocarbon fuel
types in the Nelmin Nos area in 2001, kg.
Firewood
Diesel fuel
source of polychlorinated biphenyls (PCBs), originat-
Natural gas
ing from equipment containing PCBs, or brominated
Coal
flame retardants.
Gasoline
4.4.3.3. PTS mobilization from combustion of fossil fuels
Official statistical data on fossil fuel consumption in
the NAO was used to calculate PTS emissions. The fuel
amount consumed in the NAO within the Nelmin-Nos
area was estimated based on the assumption that the
Figure 4.73. Contribution of different types of organic fuel
population of this area (including Naryan-Mar, the set-
to benzo[a]pyrene emissions in the NAO in 1995.
tlement of Krasny, and Nelmin-Nos itself), comprises
65% of the total NAO population. Account was also
taken of the fact that that most of the population in the
Diesel fuel
area (27000 out of 29300) live in Nar'yan-Mar.
Coal
Firewood
Lead
In the Nelmin-Nos area, lead emissions from organic
fuel combustion arise mainly from leaded gasoline
(Figure 4.69) used by vehicles with internal combustion
engines (Figure 4.70). However, the total annual emis-
sions of lead from fossil fuel combustion are very low.
Figure 4.74. Contributions to total dioxin emissions from combustion
It should be noted that, due to a significant growth in
of major organic fuel types in the NAO in 1997.
the number of motor vehicles in the area in recent
years, an increase in lead emissions has been docu-
The contribution of coal to PAH emissions in this area
mented, despite the introduction of unleaded gasoline
is much lower than in other project pilot study areas,
(Figure 4.71).
since petroleum hydrocarbon fuel types dominate in
68
Chapter 4
4.4. Local pollution sources in the vicinities of indigenous communities
this oil and gas producing region. However, the largest
The Norilsk Industrial Area, the largest copper and
contribution to PAHs comes from firewood. As fire-
nickel producer in the Arctic and the Russian
wood is mainly used for domestic heating, this fact is of
Federation, is located about 60 km from Dudinka, to
particularly concern in relation to possible impacts on
the east of the river Yenisey, covering an area of
human health.
about 60 thousand km2 in the northwestern part of
mid-Siberian plateau between longitudes 8692°E,
Dioxins
and latitudes 68-70°N. It is acknowledged as the
According to expert estimates, total dioxin emissions
largest single source of environmental pollutants,
in the inventory area in 1997 were 687.15 mg TEQ.
not only in the region, but in the whole circumpolar
Contributions of different types of organic fuel to total
Arctic.
dioxin emissions are shown in Figure 4.74. Fuels such
as natural gas, gasoline, and kerosine contribute con-
4.4.4.2. Geographical areas of concern
siderably less than 1% of total emissions.
Norilsk Industrial Area (NIA)
Attention should be paid to the fact that a major con-
The former Norilsk Mining and Metallurgical
tribution to total dioxin emissions arises from the use
Combined Plant, now called `Norilsky Nickel' JSC, is
of firewood for heating and other domestic needs. As
the main polluter in the territory.
these emissions arise from the burning of organic fuels
in the home, and particularly from open fires com-
In the 1980s, it began operating a number of plants
monly used by indigenous peoples in their traditional
producing elemental sulphur, which through recovery
dwellings, this fact is a matter of particular concern in
of sulphur (at a maximum recovery of 20%) substan-
the context of possible exposures to humans and relat-
tially decreased SO2 emissions and significantly
ed health implications.
improved the environment of the region. However,
SO2 is still the main contaminant emitted in the NIA,
4.4.4. Taimyr Autonomous Okrug (TAO)
accounting for 96.7% of total emissions. In addition to
SO2, `Norilsky Nickel' JSC emits a wide range of con-
4.4.4.1. General description
taminants, among which are heavy metals, including
In the TAO, the inventory of local sources covered
those addressed in the project.
the vast territory around the city of Norilsk, which
forms the main basis for the economy of the entire
Automobiles are acknowledged as an important source
TAO. Norilsk has a dominating influence on the
of some PTS emissions. In this respect, the NIA is sin-
environment of adjacent territories, including the
gular because it does not have any extensive railway
areas of the settlements Dudinka and Khatanga,
network for passenger or cargo transport. To compen-
which are the centers of residence for the indige-
sate for this drawback use of road vehicles is wide-
nous population.
spread, with associated negative impacts on air quality
in residential areas. In winter, when temperature inver-
The TAO population, including the Norilsk Industrial
sions are common, pollution of the lowermost atmos-
Area (NIA), is 288600 (based on 1996 data). The pop-
pheric layer from vehicle exhausts often exceeds pollu-
ulation of the NIA itself is 44100. The population of
tion from stationary emission sources.
the town of Khatanga is about 5000, and that of the
town of Dudinka and settlement Dikson more than
High levels of sulphur dioxide in air are recorded in
31300. Most of the urban population resides in the city
the city on about 350 days a year, including 120 to 150
of Norilsk, however, this city is formally outside of the
days with levels from 5 to 10 times the Maximum
TAO jurisdiction, and administered as a subsidiary of
Acceptable Concentration (MAC), and 40 to 60 days
the Krasnoyarsk Krai.
with a level exceeding 10 times the MAC.
Annual industrial air emissions from enterprises locat-
The total duration of air pollution amounts to around
ed in the TAO territory amount to more than 50% of the year, 80% of this time with a level of under
2 million tonnes of pollutants. Thirty-nine different
5 MAC, 15 to 17% of the time with a level from 5 to 10
pollutants are monitored in these emissions. The bulk
MAC, and 2 to 4% of the time with levels of 10 MAC or
of the emissions comprise sulphur dioxide, followed by
more Due to the prevailing wind directions, the main
sulphuric acid, inorganic dust, carbon monoxide, and
pollution sources for the city's atmosphere are the cop-
nitrogen dioxide. Emissions from stationary sources
per plant, the nickel plant, and the sinter plant. In
are dominant and amount to about 99% of total indus-
spite of protection measures in place, the atmospheric
trial emissions in the region. This equates to two-thirds
air pollution level in the city is gradually increasing
of emissions in the Krasnoyarsk Krai, and 14% of all
(Table 4.26).
industrial emissions in the Russian Federation. 2309
stationary industrial emission sources have been regis-
About 20 million tonnes of solid waste are produced
tered in the TAO territory, of which only 318 are
annually in the NIA (23.4 million tonnes in 2000). Over
equipped with gas treatment facilities to reduce emis-
the entire period of industrial activities in the area,
sions.
more than 400 million tonnes of mining and industrial
69
4.4. Local pollution sources in the vicinities of indigenous communities
Chapter 4
Table 4.26.
Average concentrations of air
pollutants in the city of
Norilsk (mg/m3), and their
trend (mean annual change
based on linear regression)
over the period 1996 2000;
and total emissions (thou
sand tonnes) from the com
bined smelter, 'Norilsky
Nickel' JSC during the same
period.
wastes have been accumulated, whilst no more than 5%
Dudinka port works practically all year round and spe-
of the existing waste have been recycled. The waste
cializes in the offloading of imported cargo (petroleum
composition is 99% mining and industrial waste (of
products, food stuffs, and construction materials for
which 94% are bearing strata and overburden), and
the Norilsk plant and for the town of Dudinka), and
1% waste from domestic consumption.
the export of copper-nickel concentrate for the various
mining and smelting companies and enterprises. The
About 2400 hectares are occupied by rock dumps. In
port is equipped with its own transport infrastructure,
addition, 1500 hectares have been damaged by strip-
a large oil depot, and the facilities necessary for han-
ping. Tailing dumps occupy a further 1500 hectares.
dling of contaminated bilge waters and household
About 10 million tonnes of toxic waste containing
wastewater. In total, the port (based on data for the
more than 50 different components, and more than a
early-1990s) receives about 7600 t of waste products
million tonnes of slag are stockpiled in the territory
from vessels, including about 300 t of oil-containing
each year. Almost no waste-storage sites conform fully
waste.
to current legal and regulatory requirements.
Pollution of water around the port occurs a result of
The NIA drainage system falls mainly within the basin
wastewater discharges from both the port, and from
of lake Piasino. The bulk of `Norilsky Nickel' JSC's
entities located nearby. More than two million m3 of
wastewater is discharged into this hydrological system.
wastewater is discharged to the waters around the port
The biggest water course in the region is the river
each year. A proportion of bilge and domestic waste-
Norilskaya, which connects the lakes Melkoye and
water from shipping is released directly into the waters
Piasino. Secondary rivers, namely the Shchuchya,
of the port. Some of the polluting heavy metals (cop-
Kupets, Yergalakh, Ambarnaya, Daldykan, and others,
per, nickel, cobalt, etc.) enter the water as a result of
are tributaries of the Norilskaya or flow directly into
the wash-out from bulk copper-nickel concentrates.
the lake Piasino, which is the biggest lake in the region
(Figure 4.75).
Air operations are located in the Dudinsky area, and
construction and geological prospecting organizations
Dudinka area
also operate from the city. The town infrastructure is
The town of Dudinka is located on the right bank of
maintained by the bodies responsible for municipal
the river Yenisey at its confluence with the Dudinka
housing and communal services. These, the road
river, 433 km upstream from the mouth of the Yenisey.
department, trade organizations, and a smoke-house
Figure 4.75.
The drainage network
of the Norilsk Industrial Area.
70
Chapter 4
4.4. Local pollution sources in the vicinities of indigenous communities
are not formally considered as PTS sources under the
8 million m3 per year. The port has the technical capa-
inventory of local sources, but as a whole exert a very
bility to collect wastewater from sea-going vessels. After
insignificant influence on the environmental state of
fuel and oil separation, remaining oil and slag are
the adjoining territories, when compared to the neigh-
incinerated in boiler-houses and operational waste is
boring Norilsk smelter.
transferred to landfill.
Khatanga area
The main air pollution sources in the settlement are
The Khatanga settlement is located on the left bank of
the eleven departmental boiler-houses utilizing local
the river Khatanga, 110 km from its mouth. The popu-
coal, and the airport facilities, which use diesel fuel. In
lation of the settlement numbers 5000. There are rela-
total, heating the settlement of Khatanga requires
tively few large enterprises based in the settlement.
about 4550000 t of coal per year. About 3000 t of sus-
Those present include an aviation enterprise connect-
pended substances, more than 500 t of sulphur diox-
ed with the local airport, a sea cargo port, a fish-pro-
ide, more than 750 t of carbon monoxide and approx-
cessing factory, housing and municipal services, three
imately 180 t of nitrogen oxides are emitted into the
oil depots, a base for polar expeditions, and a number
atmosphere. About 85% of emissions deposit directly
of state agricultural producers and co-operative enter-
onto the area occupied by the settlement, over a radius
prises, etc.
of 33.5 km.
The settlement municipal services share a water supply
4.4.4.3. Inventory results
and sewage network with the industrial enterprises,
and water is taken from the river Khatanga upstream of
Pesticides
the settlement. Wastewater enters a main settlement
According to the TAO Veterinary Medicine Admi-
collector, and after mechanical treatment, is dis-
nistration (pers. comm., letter no. 144 of 10.04.2003),
charged back into the river Khatanga 1.5 km down-
the district veterinary service regularly used the
stream of the settlement. Water consumption by the
insecticide dichlorodivinylphosphate (DDVP)
settlement and industrial enterprises has reduced over
against mosquitoes and gadflies in the summer, dur-
the last few years. According to figures from the Sea
ing the period 1980 to 1991. In total, up to 1270
Inspectorate of the Krasnoyarsk Krai, wastewater dis-
litres of the insecticide were used on farms in
charge into the river Khatanga from the settlement col-
Khatanga, Ust-Yenisey and Dudinka Districts.
lector in 1994 was about 1 million m3. There are no
Currently, no pesticides are used in the TAO for
data available, however, on the chemical composition
agricultural purposes.
of wastewaters.
Polychlorinated biphenyls (PCBs)
Khatanga port, which is located at the left bank of the
The PCB inventory carried out in 1999 in the NIA
river Khatanga 112 km upstream from its mouth, oper-
revealed the presence of electric equipment, name-
ates for three to three-and-a-half months during the
ly, transformers and capacitors, filled with the
summer navigation period. There are 5 berths in the
dielectric fluids, Sovtol-10, Askarel, and Pyralene.
port adapted to serve sea vessels up to 5000 tonnes.
The quantity of these synthetic PCB-containing flu-
Handling operations are carried out along the port
ids amounts to 451.5, 145.0, and 10.38 t, respective-
road, and also along the road in Kozhevnikova bay. The
ly (Table 4.27). These figures have not changed
port has no oil depot of its own, however, there are
since 1999.
three depots near the harbour area, belonging to other
departments.
Most pieces of equipment containing the above flu-
ids are operative. Among 226 transformers, 222 are
The port itself consumes up to 400000 m3 of water,
in service, three have been decommissioned, and
including 140000 m3 for industrial needs, and
one is held in reserve. Among 643 capacitors, 368
260000 m3 for economic and household needs.
are in service, 246 have been decommissioned, and
Wastewater is discharged into the main settlement col-
29 are held as a reserve stock. Decommissioned
lector. The total discharge of untreated waters is 6-
equipment contains 5.64 t of Askarel and 0.89 t of
Table 4.27.
Inventory of PCB containing
electric equipment located
at 'Norilsky Nickel' JSC
(data for 1999).
71
4.4. Local pollution sources in the vicinities of indigenous communities
Chapter 4
Table 4.28.
Nomenclature
and characteristics of PCB
containing waste at 'Norilsky
Nickel' JSC (data for 1999).
Wastes were generated for
1996 1999 as a result
of the decommissioning
of 3 transformers
and 246 capacitors.
Pyralene (Table 4.28), and is still located at the plant
The presence of Cl2 in the air of Norilsk in previous
sites. There have been no documented discharges or
years (see Table 4.26) could be an indicater of possible
incidents of site pollution from transformer oils.
dioxin formation in the area, as there is no pulp and
paper industry in the TAO territory and no community
The inventory of PCB discharges has shown that,
solid waste incineration plants or production of chlori-
during the operation and maintenance of trans-
nated organic products.
formers, about 10 litres of PCB per annum on aver-
age are spilled from each transformer (AMAP, 2000).
Mercury
According to these estimates, transformers used by
As stated above, non-ferrous metal production is a sig-
the Norilsk Mining Plant discharge 3.33 t of PCB per
nificant source in the mobilization of mercury. In 2001,
annum. Over the whole operating period (the serv-
the NIA produced 120000 t of primary nickel and
ice life of transformers is assumed to be 25 years),
357000 t of primary copper. According to expert esti-
83.25 t of PCB will have been discharged to the envi-
mates, production of these amounts of non-ferrous
ronment.
metals would be accompanied by the mobilization of
1.72.02 t of mercury, emitted to the atmosphere. In
Dioxins and furans
addition, 0.650.99 t of mercury would have accumu-
Within the TAO, unintentional formation of dioxins
lated in captured dust (COWI, 2004).
and furans is related to industrial production and may
occur during thermal processes carried out at the met-
Lead
allurgical plants of `Norilsky Nickel' JSC, which
According to official statistics, annual emissions of lead
reprocess sulphurous ores in the production of non-
in the inventory area vary from 26.5 to 32.8 t.
ferrous metals. It is very likely that, regardless of the
lack of studies to date on the presence of dioxins and
4.4.4.4. PTS mobilization from combustion of fossil fuels
furans in environmental emissions from its production
As in the other pilot areas, estimates of PTS emissions were
lines, the plant may be a source of pollution in connec-
based on the consumption of different types of organic
tion with these substances.
fuel. It is important to note, that the inventory areas of the
TAO, and the NIA in particular, are characterized by high
Other possible sources of these contaminants may
levels of coal consumption, and this essentially determines
include:
PTS mobilization associated with fossil fuel combustion.
·
incineration of fossil fuels in the boilers of public
utilities in the studied localities;
Lead
·
vehicles, mainly those running on leaded gasoline;
Due to high coal consumption, and a decrease in the
·
sources related to fossil fuel burning for house-
use of leaded gasoline, lead mobilization from coal
hold heating;
dominates, particularly in the NIA (Figure 4.76).
·
open uncontrolled burning of solid household
It should be noted that the annual amount of lead
waste at dumps.
mobilized through coal combustion in the NIA is high-
er than lead emissions by the `Norilsky Nickel' JSC in
the production of non-ferrous metals due to lead mobi-
lization from the ores (Figure 4.77). Total lead mobi-
lization through coal combustion in Dudinka and
Khatanga comprises about 0.5% of that in the NIA.
Figure 4.77.
Lead emissions in the NIA
from industrial production
and coal combustion.
Norilsk
Dudinka
Gasoline
Coal
Figure 4.76. Lead mobilization through the combustion of coal and gasoline
in the TAO in 1997.
72
Chapter 4
4.4. Local pollution sources in the vicinities of indigenous communities
NIA
Industrial
production
Dudinka
Coal
Khatanga
combustion
Figure 4.78. Sources of atmospheric emissions of mercury
Figure 4.80. Contributions of different source regions to benzo[a]pyrene
in the Norilsk Industrial Production in 2000.
emissions from the combustion of hydrocarbon fuels in the TAO.
Mercury
Use of natural gas and other types of petroleum hydro-
carbon fuels for energy production produces a rela-
tively minor contribution to mercury mobilization. For
example, use of natural gas in the NIA, contributes
annually about 10g of mercury. A more significant con-
tribution to mercury emissions is made by coal used for
heat and power production. As almost 99% of total coal
Figure 4.81. Contribution of different types of fossil fuel combustion
combustion in the TAO occurs in the NIA, and (in
to benzo[a]pyrene emissions in the NIA, kg.
addition to the even more substantial emissions from
production of non-ferrous metals) coal contributes
Dioxins
10% of the NAI emissions of mercury to the atmos-
The use of coal for heat and energy production is a
phere (Figure 4.78), the NIA is clearly responsible for
dominant source of dioxin emissions when compared
the greater part of the mercury contamination from
to other types of organic fuel in the TAO. As expected,
the TAO.
the NIA is responsible for almost 99.5% of dioxin emis-
sions from coal combustion in the TAO. However, the
Polyaromatic hydrocarbons (PAHs)
TAO dioxin emissions from petroleum hydrocarbon
Total PAH emissions to the atmosphere due to the con-
fuel combustion (including those from the NIA), are
sumption of hydrocarbon fuels in the TAO, including
comparable to the dioxin emissions from coal combus-
the NIA, are presented in Figure 4.79. For all PAHs, as
tion in the TAO when the NIA is excluded.
in the case of benzo[a]pyrene (Figure 4.80), the main
contribution is made by the NIA. It should be noted
4.4.5. The Chukchi Autonomous Okrug (CAO)
that contributions from defense-related activities have
not been included in the inventory estimates, since this
4.4.5.1. General description
information was not available to the assessment.
The CAO, which is located in the extreme far north-
Because of this, contributions from areas outside of the
east of continental Russia, consists of eight districts.
NIA, for example Khatanga, may be higher. However,
These are: Anadyrsky (settlement Ugolnye Kopi);
the pre-eminent role of NIA will not change.
Beringovsky (settlement Beringovsky); Bilibinsky (set-
tlement Bilibino); Iultinsky (settlement Egvekinot);
Provedensky region (settlement Provedeniya);
Chaunsky (town of Pevek); Chukotsky (settlement
Lavrentiya); and Shmidtovsky (settlement Mys
Schmidta). The CAO capital, Anadyr, is located in the
Anadyrsky District.
According to the census, the population of the CAO
was 164783 persons in 1989. In recent years its popu-
lation has decreased and, by the beginning of 2000, the
Figure 4.79. PAH (benzo[a]pyrene, benzo[b]fluoranthene, benzo[k]flouranthene,
and indeno[1,2,3 c,d]pyrene) emissions from combustion of hydrocarbon fuels
figure was 72180 persons of whom 49106 are in urban
in the TAO (including the NIA), kg.
areas and 23074 classed as rural.
As a rule, specific PAH emissions occurring through
The settlements involved in the inventory of local
coal combustion are higher than those associated with
sources are located in three rayons: the city of Anadyr
combustion of petroleum hydrocarbon fuels. As coal
and settlement of Kanchalan in Anadyrsky District, the
consumption in the TAO is higher than, for example,
settlement of Provideniya in Providensky District, and
in Murmansk Oblast, and the NAO even more so, coal
the settlement of Uelen in Chukotsky District.
combustion sources dominate PAH emissions from the
Population characteristics of the inventory areas are
TAO (Figure 4.81).
presented in Table 4.29.
73
4.4. Local pollution sources in the vicinities of indigenous communities
Chapter 4
Table 4.29. Population characteristics of areas in the CAO included
Table 4.30. Discharges of contaminants with wastewater in the CAO,
in the inventory of local sources.
thousands of tonnes.
on air emissions from non-private motor vehicles are
presented in Figure 4.83. Official statistics also exclude
data on emissions of, for example, lead from the use of
leaded gasoline by motor vehicles. This information,
based on expert estimates, is provided below.
Official statistical data on pollutants in wastewater dis-
charges in the CAO are presented in Table 4.30.
Figure 4.82. Atmospheric emissions of major pollutants from stationary sources
Polluted wastewater is discharged from treatment facil-
in the CAO, t/y.
ities belonging to the various utilities in the cities of
Anadyr and Pevek and the settlements of Bilibino and
Main local pollution sources are related to the develop-
Iultin. Main areas of pollution were found around the
ment of mineral resources such as gold, tin, tungsten,
city of Anadyr (affecting 185 km2) and the settlement
mercury, coal, and lignite. Together, in 1995, industrial
of Nagorny (affecting 60 km2). Within the inventory
entities emitted 72500 t of pollutants into the atmos-
area, wastewaters are discharged into natural water
phere, and discharged 39.3 million m3 of sewage into
bodies without any form of treatment, with the excep-
surface water bodies (including 8 million m3 of pollut-
tion of Kanchalan settlement, where effluents are col-
ed wastewater). In 2000, these figures were, respectively,
lected from cesspits and transported to the settle-
35500 t, and 20.0 and 5.3 million m3. The main pollu-
ment's dump for further partial treatment.
tion sources are the Pevek Mining and Concentration
Plant, the Iultin Mining and Concentration Plant, and
4.4.5.2. Main settlements in the inventory areas
also numerous boiler houses.
Anadyr
Provideniya is the biggest settlement inhabited by
Anadyr is the capital of CAO, and has the most devel-
indigenous peoples in the CAO. The settlement has a
oped infrastructure in the CAO. Emissions for the city
seaport, a shipyard terminal, a tannery, and a meat-and-
of Anadyr, based on State statistical data, are presented
dairy plant. The indigenous population is involved in
in Table 4.31. The city has no wastewater treatment
reindeer-breeding, fishing, the fur trade, and hunting.
facilities. There are no enterprises registered as poten-
There are practically no industrial facilities in the set-
tial sources of PCB contamination in the area of
tlements of Uelen and Kanchalan where the indige-
Anadyr, and no information on users of PCB-contain-
nous population is engaged in reindeer-breeding,
ing equipment. Similarly, there are no industrial wastes
hunting, and the fur trade. There are no major pollu-
in Anadyr which are likely to contain PCB, or hexa-
tion sources except for solid household waste and pol-
chlorobenzene (HCB), as there are no activities con-
lution of coastal waters by petroleum products.
nected with either their production, or use.
Data on air emissions from stationary sources in the
A potential source of brominated flame-retardant com-
CAO are presented in Figure 4.82. Although official
pounds (BFRs) is land occupied by municipal landfills,
statistics do not include data on PTS emissions, there is
but there are no data currently available on their con-
a well-defined general trend of decreasing emissions. It
tent due to a lack of information on types of solid
may be assumed that PTS emissions in this region are
household waste dumped at the landfill. In the opinion
also decreasing, in accordance with this general trend.
of experts from the municipal services, household and
Official statistics on air emissions in the CAO from
electronic apparatus that could represent a source of
motor vehicles do not include private vehicles. Based
BFRs are seldom found among debris located at the
on expert estimates, vehicles used for personal trans-
landfills. The Anadyr municipal landfill and is located
port exceed the number of vehicles belonging to the
two kilometers from city. The amount of waste dumped
state and to the various enterprises by about 50%. Data
annually in the landfill is 28000 m3. It is important to
74
Chapter 4
4.4. Local pollution sources in the vicinities of indigenous communities
Table 4.31. Trend in air emissions of major pollutants in Anadyr,
thousands of tonnes.
Figure 4.83. Atmospheric emissions from motor vehicles (excluding private cars)
in the CAO, t/y.
ment and port is discharged into the bay of
note that landfills in Chukotka are in a permanently
Komsomolskaya. The enterprises listed above are the
frozen state and therefore among the safest landfills
main water pollution sources.
and, as certified by the communal services, has low
potential for spontaneous combustion. and percola-
The following contaminants enter the bay with waste-
tion from the landfill into groundwater.
water: suspended mineral substances (4.32 t), petrole-
um products (0.13 t), organic matter (24.84 t), chlo-
Although no special studies have been undertaken,
rides (14.06 t), sulphates (8.33 t), total nitrogen (23 t),
and there are no directly relevant data available, it is
surfactants (0.012 t), and phosphorus (0.04 t). Of
possible, on the basis of the information presented
these pollutants, housing and municipal services
above, to infer the possible presence of dioxins and
release the following: mineral suspensions (3.82 t),
furans in the city. Furhtermore, there has been no work
organic chemicals (22.31 t), chlorides (12.96 t), sul-
associated with organizing an inventory, collection,
phates (6.06 t), total nitrogen (2.13 t), and phospho-
storage and treatment of mercury-containing lumines-
rus (0.04 t).
cent lamps and such equipment.
Air pollution in the settlement of Provideniya and its
Kanchalan
nearest neighbours, originates from the burning of
The settlement of Kanchalan is located in Anadyrsky
solid fuel (Beringov coal). In the mid-1990s, about
District, on the bank of the river Kanchalan, part of the
47500 t/yr were burned in boiler installations. Major
Anadyr river system. At present the settlement has no
pollutant sources include: the thermal power station at
industry, and agriculture is represented only by rein-
the seaport (coal consumption of 9728 t/y), boilers
deer-breeding farms, which only use the settlement as
operated by housing and municipal service enterprises
a base. The settlement's housing and municipal servic-
(8685 t/y), boilers in the village of Ureliki (7000 t/y),
es operate a diesel electric power station and a coal-
and boiler-houses run by the military infrastructure
fired boiler-house, which uses coal from the Anadyr
(7000 t/y).
deposit.
More than 9600 t of black oil (Mazut) and diesel fuel
There is no sewage system in the settlement, and col-
are burned annually in the settlement. The major pol-
lection is in cesspools, which are periodically
lutant sources include boiler-houses belonging to the
cleaned, with the solid waste Being removed to the
seaport and the communal service and diesel-fired
settlement landfill. According to environmental pro-
power stations.
tection authorities, the level of air pollution in the
settlement has never been investigated, and there-
Annual emissions of pollutants to the atmosphere
fore available data is limited to potential sources of
around Providenya are: 1390 t of dust, 500 t of sulphur
PTS only.
dioxide, 750 t of carbon monoxide and 200 t of nitro-
gen oxides. Emissions from motor vehicles for the
Provideniya
whole of Providensky District include: carbon dioxide
The settlement of Provideniya is located to the north of
(256 t), nitrogen dioxide (11 t), and methane (53 t).
the Gulf of Anadyr, in the Emma Bay (Komso-
Mean atmospheric deposition of mineral salts in the
molskaya). Ureliki village directly adjoins the settle-
areas of settlement for the last few years have been
ment. Infrastructure in the settlement of Provideniya is
about 50 kg/ha/y, with wet deposition of sulphur at 4-
similar to that of Anadyr city. The main enterprises are
6 kg/ha/yr and nitrogen at about 2 kg/ha/y.
the sea trading port, the airport, a meat-and-milk com-
plex, the `Providensky kozhzavod' JSC, enterprises run
An additional pollution source is solid household and
by housing and municipal services, construction oper-
industrial non-toxic debris, which is stored in planned
ations, and military infrastructure. The port is respon-
landfills. In total, 33800 m3 of solid waste are exported
sible for the water supply for the settlement. Water is
to landfills each year from all the enterprises within
taken from lake Istihet and the river Krasivyi. Effluent
the settlements of Provideniya and Ureliki, and an
discharge amounts to 4.3 million m3. There are no
additional 858 t/y from neighboring villages. There
treatment facilities for industrial or domestic waste-
are no data currently available on PTS sources in the
water; and practically all waste water from the settle-
area.
75
4.4. Local pollution sources in the vicinities of indigenous communities
Chapter 4
Uelen
quate for contemporary requirements. That is, a
The settlement of Uelen is administered under
reporting system suitable for documenting the effi-
Chukotsky District Uelen's infrastructure only includes
ciency of actions taken by countries in connection
enterprises belonging to the housing and municipal
with international measures to reduce environ-
service departments: the Uelen workshop, farm, and
mental releases of PTS, and in particular the
social institutions (consisting of the school, medical
`Stockholm Convention on Persistent Organic
station, and kindergarten).
Pollutants'.
·
The control and reporting systems of the environ-
Environmental pollution sources are as follows: the diesel-
mental protection authorities do not adequately
fired power station, coal-fired boiler, landfill for house-
cover environmental releases from defence-related
hold debris, coal and ash waste repository, and household
activities in the Arctic regions.
heating sources. Air emissions in the settlement in 2001
·
The existing environmental monitoring systems,
were: dust (939 t), carbon monoxide (1130 t), sulphur
in almost all cases, do not cover secondary pollu-
dioxide (668 t), and oxides of nitrogen (536 t).
tion sources; that is sources that are not directly
linked to environmental pollution by industrial
According to information provided by the local author-
enterprises, although these may strongly influ-
ities, chlorinated pesticides have not been used in the
ence the state of the environment, and ecosystems
areas of the above settlements.
and human health. For example, monitoring of
anthropogenic sources such as harbours and ports
4.4.5.3. PTS mobilization from combustion of fossil fuels
only covers petroleum hydrocarbons and few
As for other project pilot study areas, estimates of PTS
other contaminants, and not important PTS that
emissions from the combustion of organic fuel are
can originate from shipping activities and associ-
based on statistical data on fuel consumption and pop-
ated wastes, and particularly from scrapping of
ulation distribution. About 30% of the population of
ships.
the CAO reside in or around the city of Anadyr and the
settlements of Kanchalan, Provideniya and Uelen. Due
4.4.6.2. Murmansk Oblast
to a lack of data on fossil fuel consumption in the these
Despite the fact that full, representative figures for
areas, it was assumed that consumption therefore
releases to the environment are missing for some enter-
amounts to about 30% of the total fuel consumption in
prises and that figures for some of the controlled vari-
the CAO as a whole.
ables have been obtained by calculation; based on the
available information, it is possible to note the follow-
Estimates of total PTS emissions from the combustion
ing:
of fossil fuel in the inventory area are presented in
·
The main persistent pollutants emitted to the
Table 4.32.
atmosphere of this area are copper and nickel, with
emissions amounting to about 1000 tonnes per year.
Compared to the emission of copper and nickel
from industrial enterprises, fuel combustion makes
a relatively small contribution to the total emissions
of heavy metals in this region.
·
Industrial enterprises located in the vicinity of the
area where the Saami population is most dense,
emit a significant proportion of the total industrial
air emissions in Murmansk Oblast. Within the proj-
Table 4.32. Estimated emissions of selected PTS from the combustion
ect study area, the most significant pollution source
of fossil fuels in Anadyr, Kanchalan, Provideniya, and Uelen, kg.
is the `Severonikel' combined smelter in
Monchegorsk. There are a number of other impor-
Due to the high consumption of local coal, lead emis-
tant pollution sources in the area, mainly with
sions to air as a result of coal combustion are far greater
respect to heavy metals.
than emissions from the use of leaded gasoline, even in
·
Emissions of benzo[a]pyrene from industrial enter-
the years when leaded gasoline was more widely used.
prises are approximately equal to those from the
burning of organic fuels.
4.4.6. Conclusions
·
According to official data, chlorinated pesticides
have not been used and are not currently used in
4.4.6.1. General conclusions
Murmansk Oblast.
·
An assessment of official statistics on the environ-
·
PCB-containing transformer fluids are used in only
mental release of pollutants, as well as data
13 transformers at `Apatit' JSC. However, taking
obtained by environmental protection authorities
account of the high concentration of defence-relat-
of the various administrative territories of the
ed activities in Murmansk Oblast, it may be
Russian Federation under the scope of the project,
assumed that a considerable proportion of PCB-
clearly indicates that existing environmental
containing paints, varnishes, and lubricants pro-
release control and reporting systems are not ade-
duced in the former USSR have been used there.
76
Chapter 4
4.4. Local pollution sources in the vicinities of indigenous communities
·
In general, there are a number of dioxin sources
·
Gas emissions during oil extraction are very high in
that might be relevant to the survey area. Some
the NAO, and methods of utilising the associated
enterprises, such as the nickel combined smelter
gas have not yet been developed or applied.
`Severonickel' are considered potential dioxin pol-
·
The port at Nar'yan-Mar, located in a narrow chan-
lution sources, but no information is available to
nel connected to the Great Pechora river, is a source
confirm this assumption.
of pollution. The port has no treatment facility or
·
Intentional mercury use in industrial production in
storage tanks for liquid wastes and, therefore, waste-
Murmansk Oblast has not been documented.
water is discharged directly into the river without
However, mercury-containing devices, in particular
treatment.
luminescent lamps, contribute to environmental
·
The system of solid waste collection does not allow
contamination. The enterprise `Ecord Ltd.'
for separation of hazardous wastes, including those
involved in handling of used luminescent lamps
containing mercury. Disposal of such wastes at land-
and located in the area has outdated equipment
fill sites results in environmental contamination by
and itself contributes to mercury contamination of
dangerous substances, which can include dioxins in
the environment.
the event of uncontrolled burning at the landfill
·
The `Severonickel' combined smelter is considered
site. Methods for handling of medical waste, rubber
to be a significant source of mercury contamination
waste products, and ash and slag waste from boiler-
in the area due to mercury mobilisation during
houses has not been developed in the NAO
nickel and copper production. Annual mercury
·
Automotive vehicles are the main source of lead
emissions from this enterprise are estimated to be
emissions in the NAO. The total amount of lead
about 0.2 tonnes. In addition, about 0.1 tonnes is
mobilized through fossil fuel combustion is rela-
accumulated annually in captured dust.
tively low. However, due to a significant increase in
·
Coal combustion is considered to be the major con-
the number of motor vehicles in the area in recent
tributor to lead emissions that result from fossil fuel
years, an increase in lead emissions has been
combustion. Total lead emissions from the combus-
observed, despite greater use of unleaded gasoline.
tion of fossil fuels in the Lovozero area have
·
Coal consumption in the NAO is relatively low, since
decreased in recent years, mainly due to a reduction
use of petroleum hydrocarbon-based fuels predom-
in emissions from motor vehicles.
inates in this region. However, use of firewood as a
·
Mercury contamination from local sources as a
fuel is relatively common, particularly for domestic
result of fossil fuel combustion is significantly less
heating. As the result, this fuel contributes, for
than that due to mercury mobilization from nickel
example, about three quarters of the total emissions
and copper production at `Severonickel' JSC
of benzo[a]pyrene, and 80% of total dioxin emis-
However, given that domestic coal burning con-
sions from the combustion of organic fuel.
tributes to contamination of the indoor environ-
ment, the role of the latter in human intake may be
4.4.6.4. The Taimyr Autonomous Okrug (TAO)
much greater.
·
The Norilsk Industrial Area, the largest producer of
·
Releases of PAHs from organic fuel combustion
copper and nickel in the Arctic and in the Russian
have gradually decreased, possibly, due to changes
Federation, is acknowledged as the largest single
in the types of fuel used. However, after 1998, PAH
source of environmental pollutants, not only in its
emissions stabilized, presumably due to the recov-
immediate locality, but in the circumpolar Arctic. It
ery of the economy after the 1997 crisis.
emits a wide range of contaminants, including a
·
Industrial enterprises appear to be the main source
number of heavy metals that fall within the scope of
of dioxin pollution from fossil fuel combustion in
the project.
the Lovozero area. The role of municipal services,
·
Automotive vehicles are an important source of
particularly local boilers used for non-centralized
some PTS emissions. The Norilsk area in winter is
heating, in dioxin emissions has significantly
characterized by numerous temperature inversions,
increased in recent years. Although still much less
and during these periods, pollution of the lower
than from industrial enterprises, the three-fold
atmosphere by vehicle exhaust fumes often exceeds
growth in emissions from municipal sources within
pollution from stationary combustion sources.
7 years should be a matter of concern.
·
About 10 million tonnes of toxic wastes containing
over 50 different major pollutants, and more than 1
4.4.6.3. The Nenets Autonomous Okrug (NAO)
million tonnes of slag are stockpiled in the Norilsk
·
Main local pollution sources in the NAO are associ-
area each year. Almost none of the waste-storage
ated with oil and gas production and shipping.
sites conforms fully to current legal and regulatory
·
In spite of the fact that official statistical data do not
requirements.
document significant PTS pollution sources in the
·
According to the results of the PCB inventory for
lower part of the Pechora basin, the assessment of
the Russian Federation, significant amounts of
PTS fluxes in the river flow indicate a possible input
PCB-containing fluids are used in electric equip-
of some PTSs between Oksino and Andeg, i.e. in the
ment within the various enterprises of the Norilsk
vicinity of Naryan-Mar. Pollution levels in the
Industrial Area. According to estimates, the trans-
Pechora delta tend to be elevated.
formers used in this area discharge 3.33 tonnes of
77
4.5. Household and occupational sources of exposure
Chapter 4
PCB annually, and over the whole operating period
of the transformers, more than 83 tonnes of PCB
4.5. Household and occupational
will have been released to the environment. In addi-
sources of exposure
tion, an unknown amount of PCB may enter the
The knowledge accumulated over the last decade
environment as a result of releases from PCB-con-
about effects of persistent organic pollutants on health
taining paints and varnishes, and compounds used
indigenous people of the North has caused much pub-
in building construction, etc.
lic concern about their traditional food considered to
·
In 2001, the production of non-ferrous metals in
be the major pathway of human exposures to highly
the Norilsk area was accompanied by the mobi-
toxic chlorinated organic compounds and metals. In
lization of 1.72.02 tonnes of mercury, which was
the meantime other exposure sources and pathways of
emitted to the atmosphere. In addition, 0.65-0.99
PTS were generally ignored.
tons of mercury were accumulated in captured
dust.
To clarify potential indoor (household) and occupa-
·
Dudinka port operates practically all year round. In
tional sources and pathways of exposure, a targeted
spite of the fact that it is equipped with an adequate
survey including human blood sampling among select-
transport infrastructure and oil storage depots,
ed families and domestic and workplace matters were
large-scale loading activities, and washout of bulk
carried out. The targeted survey was designed as a case
copper-nickel concentrates causes contamination
study involving 28 families from 3 selected native set-
of the Yenisey river with a range of hazardous sub-
tlements. The selection of families was based on those
stances, in particular heavy metals.
measurements of cord blood concentrations of total
·
About 1 million m3 of waste waters are discharged
PCBs derived from the basic survey of the project.
annually into the Khatanga river from the collector
at the Khatanga settlement. There are no data avail-
The work programme included re-interviewing and
able regarding the chemical composition of the
blood re-sampling of those women shown higher cord
wastewater discharged. The total volume of untreat-
blood concentrations of total PCBs (over 500 ng/g
ed wastewater discharged in the Khatanga area
lipids) at time of birth as well as interviewing and blood
amounts to 68 million m3 annually.
sampling of adult family members living together with
·
The TAO, and the Norilsk Industrial Area in partic-
target women. The referent group has been represent-
ular, is characterized by high coal consumption lev-
ed by families of those women found to have lower
els. Coal burning therefore plays a predominant
cord blood concentrations of total PCBs (below 500
role in PTS emissions associated with fossil fuel
ng/g lipids) living either in the same native communi-
combustion, for example, mobilization of lead. It
ty or in the closest vicinity of it. It has been proven that
should be noted that the amount of lead mobilized
the sufficient number (at least 4) of families of
annually from the combustion of coal in the TAO is
"exposed" and "less exposed" newborns were available
greater than the amount emitted by the Norilsk
by the planning period only in:
combined smelter during the production of non-
the settlement of Lorino, Chukotka coastal study
ferrous metals.
area;
·
Mercury mobilized from coal combustion at heat
the district of Khatanga, Taimyr Peninsula;
and power plants contributes up to 10% of atmos-
and the settlement of Nelmin Nos, Pechora River
pheric emissions, the remainder being due to mer-
Basin;
cury mobilization from ores used in the production
of non-ferrous metals.
The invitation and interviewing procedures and blood
·
Dioxin emissions from the combustion of petrole-
sampling protocol were identical to the those applied for
um hydrocarbon-based fuels in the entire TAO,
the general indigenous population in the 2001 survey but
including the Norilsk Industrial Area, are compa-
supplemented with the extended questionnaire focused
rable to dioxin emissions from coal combustion in
on occupational and household sources of exposure to
the TAO when the Norilsk Industrial Area is
PTS since the treatment of animals against mosquito
excluded.
bites, protection of houses against rodents, bed-bugs and
cockroaches are widely occurred in the northern commu-
4.4.6.5. The Chukchi Autonomous Okrug (CAO)
nities The work programme thereof involved visiting the
·
Main local pollution sources in the CAO are related
houses of selected families as well as work places and,
to the development of mineral resources including
where possible, sampling wash-outs and scrapes in home
gold, tin, tungsten, mercury, and coal and lignite.
and occupational settings for further analyses for con-
Main pollution areas occur around the city of
taminants. Activities potentially associated with the
Anadyr (affecting 185 km2) and the settlement of
human exposure to PTS are summarized in Table 4.33.
Nagorny (affecting 60 km2).
·
Coal dominates organic fuel consumption within
The impression on to what extent the indigenous pop-
the CAO, and, correspondingly, coal burning is
ulation is at higher risk of exposure to PTS through the
responsible for emissions of a number of PTS.
sources other than local foods can be illustrated by fol-
·
Sea ports in Anadyr, Lavrentiya and Provedeniya are
lowing information obtained from the questionnaire
considered to be local pollution sources.
study :
78
Chapter 4
4.5. Household and occupational sources of exposure
Table 4.33.
Activities associated with risk
of PTS exposure (according
to questionnaire).
·
Casting of shot (plummet) and other hunting and
HCB, DDT in considerable concentrations (Table
fishing appliances can hardly be accounted as a
4.34). The chemical named "Medifox super" produced
source of significant lead exposure in surveyed pop-
by "Fox Company" (Russia) is the exception.
ulations. Only 7% indigenous people and below
According to its certificate the main constituent is the
than 1% of pregnant indigenous women have
permitrin concentrate and "is used for pediculosis
reported activities potentially associated with con-
treatment and for disinfections of rooms against
tacting lead.
pediculosis and sarcoptoid ticks". "Medifox" has been
Smoking is likely to remain one of the most signifi-
found to be used widely in Chukotka kindergartens,
cant source of cadmium intake in indigenous peo-
schools, health institutions, residential buildings for
ple, since 54% of adults of general population and
scabies treatment since early 1990's.
35% pregnant women have reported tobacco smok-
ing habits.
"Mashen'ka" crayon imported from China and widely
·
Household use of toxicants is reported by 34-41% of
used in the North of Russia for cockroach combating
respondents. However, despite the fact that over
does not appear to contain the POPs in question.
30% of surveyed population grow vegetables in gar-
However composition of this crayon as well as of other
den plots or greenhouses, only few reported on the
protectors may differ significantly from those used 10-
use of insecticides to protect cultivated plants.
20 years ago. Information about the insecticide com-
·
70% respondents of general population and 58 %
position used in the past, is not available.
of pregnant women reported the frequent consum-
ing alcohol. The significant number of respondents
The wash-outs were taken indoor (mainly from kitchen
reported to consume homemade alcoholic drinks.
walls) whereas the scrapes were taken from surfaces of
A specific source of PTS contamination is that the
the kitchen furniture and appliances. Results of their
indigenous people frequently use, for economical
POPs measurements are summarized in the Table 4.35.
reasons, the wasted (second-hand) technical barrels
Judging by these results the indoor environment of
and plastic containers to produce and store liquids
indigenous residencies is likely to be one of the most
including homemade alcohols.
common source of exposure to POPs.
Chemical analysis of some insecticides sampled as
The highest levels of DDT, PCB and HCH were found in
result of targeted survey shows that the most common
the native communities of Chukotka. DDE/DDT ratios
household toxicants available in the market in Nenets,
in wash-outs and scrapes amount to 10-70 % allow to sug-
Taimyr and Chukchi AOs do not contain PCB, HCH,
gest relatively recent contamination of the residencies by
Table 4.34.
POPs concentrations in
insecticides and in skin
tanning fluids collected
in Nenetz, Taimyr, and
Chukotka regions in 2003,
ng/g
79
4.5. Household and occupational sources of exposure
Chapter 4
deer skin by various insecticides to protect the animals
against mosquito bites. Blood-sucking insects, especial-
ly gadflies, can penetrate into animal's subcutaneous
tissues as well as through naso-pharynx, impose a seri-
ous problem for animal health, and during the long-
range running, the efficiency of insect combating may
be a determinant of the deer herd livestock. The cur-
rent variety of chemicals against mosquitoes and gad-
flies combating are different to those used in the past.
Nowadays the most common are the synthetic
Table 4.35. POPs concentrations in wash outs and scrapes collected inside the
piretroids which do not contain organo-chlorines, and
dwellings (geometric means)
they are not persistent and not capable of accumulating
in the body at detectable levels. In the early 1970's
DDT containing chemicals. The intensive past use of
organophosphines (chlorophos) with ammonium car-
household insecticides seems to be the major contribu-
bonate or with sodium hydroxide, hexamide with spin-
tor to the persistent pesticide contamination of indoor
dle oil and emulsifier, DDVP (dimethyldichlorvinyl-
environment. However, lack of awareness shown by
phosphate), etacide, trichlorometaphos-3, sulphur
interviewed indigenous people does not permit to spec-
dioxide, smoke hexachlorane shells, cryoline-hexachlo-
ify the exact insecticide(s) which had been applied
rane liniment and other hexachlorane compounds
indoor. The chemical composition of retailed insecti-
were widely used in reindeer collective farms. Among
cides is generally unknown since these products had
the above-mentioned chemicals only "hexachlorane"
been supplied to the market mostly unlabelled.
has been found to contain HCH at significant levels.
Other currently used insecticides are generally free of
The potential occupational exposure to POPs was most
POPs containing an array of organo-chlorine com-
frequently reported as in form of the treatment of rein-
pounds, and are readily degradable in the nature.
80