Reversal of Land and Water Degradation Trends in the Lake Chad Basin Ecosystem
Establishment of Mechanism for Land and Water Management
RAF/00/G31/P070252
Statement of Requirements
For Establishing
Lake Chad Basin Decision Support System
First Draft
February 1, 2005
Mohammed Bila
Information Technology & Scientific Officer
Introduction 4
Chapter 1 5
1.Overview of the Lake Chad Basin 5
1.1.The Lake Chad Basin 5
1.2.Review of Hydrology and Water Resources 5
1.3.Environmental Concerns of the Lake Chad Basin and Priority Issues 6
1.4.Establishment of Mechanisms for Land and Water Management 8
Chapter 2 10
2. Lake Chad Basin Decision Support System 10
2.1.Design Objectives of LCBDSS 11
Chapter 3 12
3.Management of the Lake Chad Basin Environment 12
3.1.Strategic Management 12
3.2.Operational Management 12
Chapter 4 13
4.Information Requirement for the Management of Lake Chad Basin 13
4.1.Conceptual Structure of the LCBDSS 13
4.2.Data Model and Database 15
4.3.Sources of Data for Establishing Baseline Knowledge Base for LCBDSS 18
Chapter 5 Detail Statement of Requirements for LCBDSS 20
Schedule of Activities 52
References 53
Annex 1 Organs of Management Within the Lake Chad Basin 54
Annex 2 TOR for the Development of LCBDSS 55
Annex 3 Hydrography Data Model 56
Annex 4 Biodiversity Data Model 57
Annex 6 TOR for the Development of Project Website 58
Annex 7 Ad Hoc Survey 1 59
Ground Cartographic Survey to Determine Parameters for River Morphology and Flood Forecasting 59
Annex 8 Ad Hoc Survey 2 60
Ground Survey for Lake Bathymetry and Development of Lake Area – Volume Relationship Curve 60
The Lake Chad is a unique sahel ecosystem home to a population of 27 million people and supports biodiversity consisting of 372 species of bird, 140 species of fish and numerous plants and animal species.
Since the drought of 1970’s the Lake Chad basin ecosystem has been undergoing environmental stress due largely to decline in annual rainfall, drought, desertification, population pressure, unsustainable agricultural practices and competition for scarce resources, focus on the short term and uncoordinated development effort.
The GEF Trust provided intervention funds to the member countries of the Lake Chad Basin Commission for the establishment of a regional mechanism for the management of the naturally integrated land and water resources of the basin. Part of this funding is directed towards improving the scientific understanding of the linkages between the surface and groundwater by building a comprehensive database and for setting up a descriptive model for long term planning and allocation of the resources of the basin.
This report is a design guideline for a new spatial based Lake Chad Basin Decision Support System (LCBDSS) for the use of the management of the Lake Chad basin environment. The report provides a brief system analysis of the Lake Chad basin hydrological system, reviews the environmental concerns of the inhabitants, analyses the existing environmental management institutions and detail the information requirement for successful management of the Lake Chad basin.
The requirement specification identifies 344 items of management information about the Lake Chad.
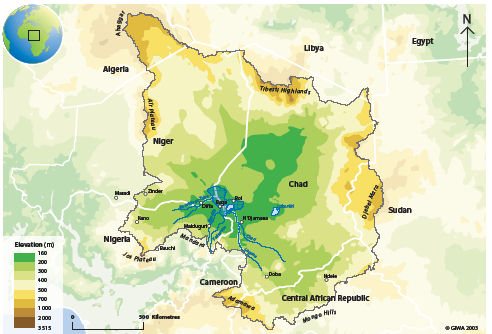
The Lake Chad basin with an area of 2,434,000 km2 is a unique sahelian ecosystem situated in West Central Africa between 6° to 24° N and 8° to 24° E. The ecosystem nourished by two rivers systems, Chari-Logone and Komadougou – Yobe is home to a population of 27 million people and supports biodiversity consisting of 372 species of bird, 140 species of fish and numerous plants and animal species.
The Lake Chad water body, a transboundary wetland of international importance can be classified as a seepage lake with receives a large contribution from precipitation. It has a surface area that shrunk from 25,000 km2 in 1964 to 576 km2 in May 2003 and constitutes the final drain of the Chari-Logone and Komadougou – Yobe river systems.
The hydrological Lake Chad basin is a transboundary water basin shared between the countries of Algeria, Cameroon, Central African Republic (CAR), Chad, Libya, Niger, Nigeria and Sudan. The basin itself originated as a result of cretaceous tectonic expansion and sinking along the West and Central African Rift System. The Basin comprises a number of transboundary waters that include three main aquifers and a network of Catchment Rivers. The water supply of the basin arises from the outer lying ring of volcanic and plutonic highlands and plateaux and drains towards the sedimentary central depression of the Lake Chad.
The Chari-Logone River sub-system which contributes approximately 95% of flow to the Lake Chad, arose from the Mongos Hills of Central African Republic (CAR) and drains an area of 216,000 Km2 before it is join by the River Logone that arose from the Adamawa highlands along the border between Nigeria and Cameroon and drains an area of 47,000 km2 in the Cameroon. The Chari-Logone River sub-system contributes an average of 37.8 km3/year to Lake Chad but has decline in the last decade to 21.8 km3/year due to the persistent change in rainfall patterns over the contributing catchments.
The Komadougou – Yobe River sub-system which contributes less than 5 % of the flow into the Lake Chad rises from the Jos plateau in the Western portion of the basin and the Aïr Plateau in the Northern portion of the basin in Niger. The Komadougou – Yobe drains 179,300 km2 of Nigeria while the Niger portion of the basin covers an area of 674,800 km2. The Komadougou – Yobe River sub-system contributes less than 7 km3/yr to the Lake Chad.
The portion of the basin that lies within Chad totals 1,123,400 km2 and constitute a regional hydrological sink fed from the southern Ahaggar (Algeria) and Tibesti (Libya and Chad) Highlands, the Aïr (Niger), Ennedi, Darfour and Ouaddai (Sudan) plateaux and other uplands.
The groundwater resource and its interaction with surface water of the basin is not yet fully understood except that there are three main aquifers, the quaternary phreatic aquifer that is made up of fine-grained sediments approximately 30 m thick, the middle aquifer that essentially comprises an alternation of sandstone and clay encountered between 450 and 620 m from the surface and the lower aquifer consisting of sediments deposited in the cretaceous.
Figure 1 Lake Chad Hydrological Basin from GIWA
The Lake Chad basin is under severe environmental stress due principally to natural causes that are exacerbated by human pressures. Previous studies in the Lake Chad Basin have identified the following hydro-environmental issues whose impacts are trans-boundary in nature among the countries sharing the basin.
There is a general decline in the Lake water level due to persistent drought of over 3 decades. The decline in Lake water level is linked to the following issues;
Decline in perennial vegetation and an increase in vulnerability to erosion
Declining water levels and continuing drought have led to trans-boundary migration of human populations
Increased ecological stress on upstream resources and abandonment of traditional, effective resource management practices.
Falling levels create problems of fishing access for two of the riparian states, Niger and Nigeria
Nigeria also experiences increased problems accessing surface water resources for its large-scale irrigation projects
Decrease in wet season flooding, with the consequent effect of a decline in reception capability of natural habitats dependent on water
A combination of deforestation, bush burning, unsustainable agricultural practices and drought is creating a circular relationship between environmental degradation and poverty among the rural population. The consequence of inaction against the threat of human pressure and rural poverty is likely to lead to the following;
The potential for the mis-allocation of the water resource base, particularly between the large irrigated systems and elements of the natural system.
The formation of spirals of degradation, with one harmful action having a cascading effect resulting in additional harmful actions.
Increased competition for the natural resource base among production activities, leading to disputes that will prove difficult to resolve and will create serious tension between and among various countries and interests.
The creation of tangible threats to the environment with consequent environmental diminution.
A possible increase in pollution from such sources as oil drilling and production, mining, unsustainable agricultural practices, and increasing pesticide use.
Further deterioration of the natural environment if there continues to be an absence of co-operation at all levels and a continuing inability of existing institutions to develop and implement a clear and consistent strategy at the regional level.
A focus on the short term often results in unsustainable policy decisions. The consequences of these unsustainable policy decisions include;
Absence of an integrated approach to water resources management at the national and basin levels
Costly investment that is abandoned because of unforeseen changes in water availability
Construction of large dams upstream without taking sufficient account of downstream human and ecosystem considerations
Mining operations are often not sufficiently co-ordinated with regional water and environmental policies
Failure of development strategies in rural areas
Development of agricultural and industrial activities geared to production quantities often at the expense of environmental sustainability
The region is characterized by the following;
Absence of integrated, regionally based water management programs
Insufficient knowledge of water resources generally and of the functioning of aquatic systems specifically
No effective system for monitoring the quantity and quality of freshwater resources
No effective water quality protection programs
Ineffective management of water demand and little attention paid to adapting production methods to natural resource limitations
Too little value accorded to water and the environment in economic policies
Absence of economic instruments and incentive measures
Absence of specific programs to promote and support local initiatives.
Low-level public participation and inadequate mechanisms to secure such participation further characterise the region.
There is insufficient co-operation between and among sectors within countries, and between and among the countries themselves
Environment-centred public education is virtually non-existent
Few efforts have been undertaken to harmonise legal frameworks at the regional level to protect and make sustainable the use of shared water resources
National and regional organisations do not respond or adapt well to rapidly changing circumstances
donors historically have provided little incentive for the creation of a co-ordinated and sustained policy of long term assistance aimed at autonomous and lasting development
In order to address the environmental concerns of the Lake Chad basin, GEF is providing a grant of US$ 9,600,000 to establish a mechanism for land and water management.
The objectives of the project “Reversal of Land and Water Degradation Trends
In the Lake Chad Basin Ecosystem” is to achieve global environmental benefits through concerted management of the naturally integrated land and water resources of the Lake Chad Basin. The specific purpose of the project is to overcome barriers to the concerted management of the basin through well-orchestrated and enhanced collaboration and capacity building among riparians and stakeholders.
The project has 6 Outputs;
Output 1: An established Program Co-ordination Unit (PMU) and a Lead Agency in each of the participating countries to ensure inter-sectoral co-ordination for duration of the project.
Output 2: Enhanced regional policy initiatives and institutional mechanisms to address trans-boundary issues beyond the project life
Output 3: Strengthened community level participation and education, involve stakeholders through development of local planning initiatives (mini-Agenda 21’s)
Output 4: A completed TDA and a synthetic framework for concerted management of the basin
Output 5: Regional Program Development and Demonstration projects to test methodologies, stakeholder involvement and implementation modalities
Output 6: Donor support mobilised for GEF SAP and LCBC Plan implementation. Finalisation of the TDA and regional agreement on GEF SAP
The project Reversal of Land and Water Degradation Trends in the Lake Chad basin Ecosystem aims to set up a new regional mechanism for the coordinated management of the resources of the Lake Chad basin.
The project document identifies the key issues that need to be addressed in the TDA and the formulation of SAP. These are;
Lack of knowledge on the precise linkages between environmental and socio-economic systems and their trans-boundary impacts.
Lack of the means for accurate monitoring of resource flows and uses within the Lake Chad basin.
Lack of knowledge on the role of groundwater in the basin and its precise role in trans-boundary issues and management solution.
Specific hydro-environmental data is lacking
Data analysis at the national level, to the extent that data is available and has been analysed, is not effectively disseminated among the relevant institutions at national and international levels
The mechanisms for national and international analysis are absent
A clear regional hydro geological overview is not available
Broad range of relevant scientific studies in the region have not been synthesised into a working basin-wide framework
These issues can only be addressed when a new information system that support operational management and provide decision support to higher management is operational in the member countries and the LCBC. The new information system will support management to efficiently perform its role of long-term planning, monitoring and adaptive readjustment to attain regional environmental goals.
The LCBDSS is conceived as a database that will provide information to support the scientific understanding of the Lake Chad hydro system and a management decision support tool to evaluate the impacts of hydrodynamics changes on biodiversity, the environment and the socio-economic life of Lake Chad basin inhabitants. LCBDSS will therefore serve two purposes;
Provide a long-term database of hydro-environmental data to provide operational support to the TDA process and subsequently to operational management of the LCBC.
Provide a means for regular capture and update of data about the state of the environment of Lake Chad basin
Serves as a descriptive model of the Lake Chad basin and a model driven decision support system for the simulation of the impacts of alternative management decisions on the hydrodynamics of the Lake Chad basin, socio-economy and the environment.
The LCBDSS has the following design objectives
Demand driven user friendly system.
The system shall be demand driven, with the users determining the output of the system.
Comprehensive database and easily accessible across national boundaries.
The LCBDSS shall be built on a database covering all aspect of the management of the resources of the basin. National and local authorities shall have access to easily update or search for data.
Integration with national and regional databases
The LCBDSS shall be implemented according to regional and international standards in order to guarantee full integration across national boundaries.
Adequate infrastructural base to ensure sustainability
Management of the Lake Chad basin environment is distributed between different layers of government in each of the riparian states. In each riparian state, different organ of government manage specific sector of the environment. A federal government organ is responsible for policy decisions on the water sector or the environment in all the riparian states.
At the regional inter-governmental level, the Lake Chad Basin Commission has been given the responsibility for the coordination of trans-boundary management of the resources of the basin. The commission is made up of the Council of Ministers with two members from each member state and reports to the Summit of Head of States of member countries of commission.
Regional strategic management in the basin is provided by the Council of Ministers and in the each member state by an advisory or coordination council whose core composition includes Minister’s in charge of water resources and the environment in the countries.
The information need of strategic management is supplied by the operational organs of resource management within the member states and from operational management of the LCBC. Other sources of information are external to the formal organs of management within the basin.
Operational management comprises federal or States organs for natural resource and environmental management in Nigeria, CAR and Chad and provincial administration in Niger and Cameroon. The executive secretariat of LCBC also participates in operational management on issues that cut across member states and on decisions of the Summit of Head of States.
The information needs of the management of the LCBC executive secretariat is provided by operational management within the organization and other lower management in States organs for natural resource and environmental management in Nigeria, CAR and Chad and provincial administration in Niger and Cameroon through the respective members of the Council of Ministers.
All levels of management in the scheme of environmental management within Lake Chad basin depends on the availability of timely and relevant information for effective decision-making.
Similarly, the population of the basin whose activities exert pressures on the environment needs to be provided with information showing linkages between the consequences of their activities and the degradation of the environment and long-term plans of managers of the environment. The population of the basin should also be given scientific information on the status of the so that they can participate fully in the development and of implementation of a regional management plan.
The goals of information management for the management of the land and water resources in the Lake Chad basin can therefore be summarise as follows;
Provide information for the assessment of Lake Chad Basin’s Water Resources
Provide information for the planning, design and operations of transboundary water projects
Provide information for the assessment of environmental, economic and social impacts of water resources management practices (existing and proposed).
Provide information for the assessment of the status of individual watersheds
Provide information for the assessment of the impacts on water resources of other non-water sector activities
Provide information for the assessment of existing and potential water related hazards
The LCBDSS will be the primary tool for the storage, analysis and dissemination of management information regarding the status of environment of the Lake Chad basin.
The LCBDSS will be partitioned into a back end and front end components for long term sustainability and ease of maintenance. The back end will consist of server components made up of core GIS application for the creation of thematic layers, a DBMS for data storage and a web server for giving web access to data. The front end will consist of client components such as map readers or internet browsers.
User interactions for the LCBDSS will be through a GIS representation of the Lake Chad basin hydrographic system. GIS provides the tools, analysis and processes to create and maintain a database of thematic feature layers that can give instant information on the status of the environment at any moment. User commands are provided through user interaction with menus, icons and mouse clicks on the screen. Program codes for the execution of each user command are coded as an extension to the GIS interface.
GIS thematic feature layers in LCBDSS will serve the following purposes;
Provide a cartographic representation of elements within the Lake Chad basin
Serves as a high level view of the status of the Lake Chad basin environment and
Display the result of the simulation of hydrologic processes and result of alternative management scenario within the system.
The Lake Chad basin covers a spatial area of 2,434,000 km2. Conceptually, the Lake Chad basin is an administrative entity delineated for the convenience of water administration. The Lake Chad basin is composed of natural entities called catchments. Catchments are simply the land that water flows across or through on its way to a common stream, river, or lake. The Lake Chad basin comprises several river catchments that aggregate into a basin.
In the past, the delineation of catchment area was done manually using topographic maps. The advent of computers, satellite imageries and new processing techniques has given rise to several databases of elevation data which can be use to efficiently delineate a catchment area.
The most recent scientifically recorded delineation of the catchments of the Lake Chad was done using USGS Hydro1K one kilometer grid elevation data by UNEP GRID. Figure 2 below is the map of the catchments that made up the Lake Chad basin copiled from data processed by GIWA using USGS Hydro1K grid.
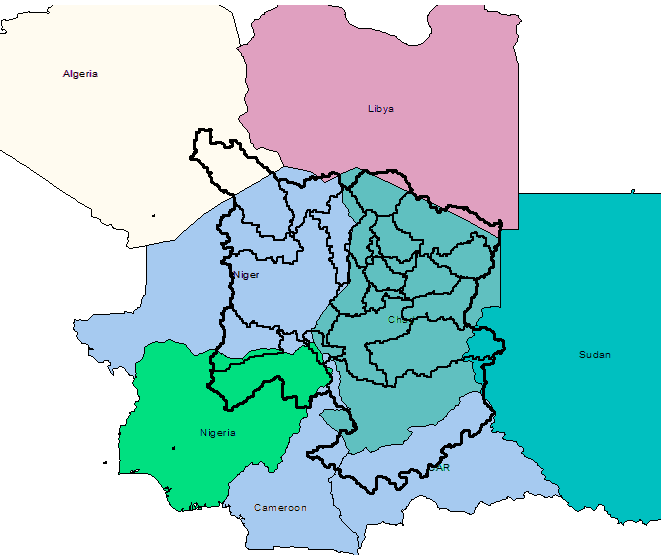
Figure 2 Lake Chad Basin Catchments
Today, the possibility of having a yet more accurate representation of the Lake Chad catchments exists with the availability of SRTM 90 m DEM data. SRTM data could also be further process to obtain 30 m elevation data. The most accurate representation of the hydrographic system by using the 30 m resolution DEM is required to lay an accurate basis for the spatial representation of all entities of the environment.
The WMO programme World Hydrological Cycle Observing System (WHYCOS) aims to improve the availability of real-time hydrological information for operational purpose. An important component of the system is the ability to give real-time access to hydrological information through the Internet to the end users. At some point in the future, in line with the WHYCOS vision, LCBDSS will give end users access to its database through the world wide web.
One goal of the system is to ensure sustainability of the operation of the system. The strategy to achieve sustainability for LCBDSS includes;
Separating the data from the application
Separating the data from the application can be achieved by the deployment of an industry standard SQL database management system for the management of the data.
Adoption of an industry standard data model
Recent development in GIS application has focus on the development of industry standard data model for each industrial application. A widely accepted industrial standard data model will eliminate the problem of incompatibility in data storage and exchange and will make it possible to have uniform metadata that describes the content of a database for prospective users.
A summary of management information that will be provide by LCBDSS is given in Table 1 below. The information processed from the data will be used in the evaluation of the status of the environment, evaluation of individual catchment water balance and of the overall Lake water balance. The water balance model could also be linked with a suitable climate model to simulate future water balance of the basin.
|
Feature |
Data Source |
Map Use |
Representation |
Map Scale & Accuracy |
|
|
Water Resources Feature Classes |
|||||
|
Streams |
Existing topographic maps or derived from digital elevation models |
Cartography and stream analysis |
Edge and nodes for stream network, polygons for lake |
1:24,000, locational accuracy of 10 meters |
|
|
Hydrographic points |
Create from existing records or GPS position data |
Gauge stations on a stream network and features such as dams |
Junctions, network flags, and points on a stream network |
1:24,000, locational accuracy of 10 meters |
|
|
Drainage areas |
Derived from digital elevation models |
Drainage areas are use to estimate water flows into rivers |
Polygon with points at drainage outlets |
1:24,000, locational accuracy of 10 meters |
|
|
Hydrography |
Existing topographic maps |
Hydrographic layer in topographic maps |
Point, line, polygon and annotation for water features |
1:24,000, locational accuracy of 10 meters |
|
|
Channels |
Derived from surface model or land survey |
Hydraulic analysis |
Cross sections & longitudinal profiles along river channel |
1:24,000, locational accuracy of 1 meters |
|
|
Surface terrain |
Digital elevation models |
Deriving streams & drainage areas, also cartographic background |
Raster with elevations |
1:24,000, locational accuracy of 1 meters |
|
|
Rainfall response |
Derived from combining layers such as soil, vegetation and land use |
Overlayed with rainfall grid to estimate flood or drought conditions |
Polygon |
1:24,000, locational accuracy of 10 meters |
|
|
Digital orthophotography |
Aerial photogrammetry and satellite collection |
Map background |
Raster |
Pixel resolution typically is 1 to 2.5 meters or better |
|
|
Other Feature Classes |
|||||
|
Well points |
Create from existing records or GPS position data |
Wells with measurement of depth |
Points |
1:24,000, locational accuracy of 10 meters |
|
|
Geology |
Create from existing map |
Geological formations and rock type |
Polygon |
1:24,000, locational accuracy of 10 meters |
|
|
Vegetation |
|
|
|
|
|
|
Soil |
|
|
|
|
|
|
Land use |
|
|
|
|
|
|
Population density |
|
|
|
|
|
|
Rainfall |
|
|
|
|
|
|
Temperature |
|
|
|
|
|
|
Evaporation |
|
|
|
|
|
|
Transport infrastructure |
|
|
|
|
|
|
Towns and cities |
|
|
|
|
|
|
Population densities |
|
|
|
|
|
|
Ethnicity |
|
|
|
|
|
|
Nature reserves |
|
|
|
|
|
Table 1 Summary of information requirement
The GIS representation of the hydrographic system provides an important user friendly interface element for modeling the processes within the hydrological system in any given year. The GIS feature classes can act as a user friendly front end to the data contained within a database management system. The GIS model can serve as a basis for a complete simulation of the processes within the environment. The conceptual data model and information requirement for the modeling of a river system has been defined by the GIS Water Resources Consortium (www.crwr.utexas.edu/giswr) and is presented in annex 3.
The management of biodiversity involves information on species, distribution area, the natural environment and records of sightings by observers. The conceptual data model and information requirement for the management of biodiversity has been determined by an NGO NatureServe (www.natureserve.org) working with ESRI and is presented in annex 4.
Administration is organised within administrative units in the 5 member states of the Lake Chad basin. The minimal administrative unit in Chad and Niger is the Canton, Arrondissement in Cameroon, District in Nigeria and Sous-prefecture in CAR. Information on population, economic activities, ethnicity and transport is best organized and presented in administrative entities. Annex 5 is a conceptual and data model for administrative information.. The administrative and census data model is based on US data and will need to be modified to reflect the realities in the member states of LCBC.
In the context of GEF support, the first priority is to establish and strengthen the baseline framework by improving the knowledge base for water management. A key requirement to establishing a baseline knowledge base is the compilation of existing scientific, hydro-environmental and socio-economic data and information.
In the history of the LCBC, various studies have been undertaken whose report provides an assessment of the knowledge of the state of the Lake Chad basin environment.
A 1966-1968 UNDP/UNESCO funded study “Study of Water Resources in the Lake Chad Basin” captures the status of what is known about the Lake Chad basin environment at the creation of the Lake Chad Basin Commission.
Other reports and studies can provide most of the data and information needed to improve the knowledge base. An analysis of the existing information may reveal gaps that have to be filled by ad hoc surveys.
The following are preliminary list of ad hoc surveys that will help in filling the data gaps prior to full development of a new LCBDSS. The planned study of hydrological and hydrogeological situation of the Lake Chad basin will identify more gaps that need to be filled by ad hoc surveys.
Stratigraphy and aquifer characteristic of Lake Chad geological formation
Bathymetric survey for Lake Chad area – volume relationship
Lake water quality study
River channel morphology and bathymetric survey for flood risk assessment.
(1000-1003) Land Area Population and Population Density in Chad by MAU1
1000 Area of MAU: sq km
1002 Population of MAU: '000
1003 Population Density: Persons per sq km
Dimension: Population by square kilometer
Coverage: MAUs in Chad that falls within the Lake Chad Basin.
List of MAUs in Chad to be used as details for items coded 1000-1003 above.
Administration HQ Chari – Baguirmi
MAU
Sub-Administration HQ Bokoro
01 Ambaladoba
02 Dababa
03 Gama
04 Moito
05 Tania
Sub-Administration HQ Bousso
Ba Illi
Bougomoro
Bousso
Gourgara
Miltou
Sub-Administration HQ Massatory
Arabe Dagana
Assale
Bilala
Dagana (Massakory)
Hadda
Kanembou
Toundjour
Sub-Administration HQ Massenya
Abouguerne
Batha
Bougoumene
Deredia
Mandjaffa
Massenya
May Ache
Sub-Administration HQ Ndjamena Rural
Afrouk
El Fass
Kadada
Mandiago
Mani
Massaguet
Suburbain (Ndjamena Ville)
Administration HQ Guera
Sub-Administration HQ Bitkine
Kenga
Sub-Administration HQ Melfi
Dekarin
Gogmi
Melfi
Mokofi
Mousmare
Administration HQ Kanem
Sub-Administration HQ Mao
Amdoback
Dokora
Illili
Mao
Moal
Mondo
Motowa
Mourzougui
Sub-Administration HQ Moussoro
Moussoro
Sub-Administration HQ Nokou
Nokou
Administration HQ Prefecture du Lac
Sub-Administration HQ Bol
Bol
Kankallom
Kiskra
Liwa
Ngarangou
Nguelewa
Tataverom
Sub-Administration HQ Ngouri
About
Ameron
Baderi
Dibinintchi
Djigdada
Isseirom
Kouloudia
Malloum
Ngouri
Yalita
Administration HQ Mayo Kebbi
Sub-Administration HQ Bongor
Bongor Ville et Rural
Djoumane
Ere
Ham
Katoa
Kim
Kolobo
Koumi
Magao
Malboum
Mitao
Mogroum
Ngam
Teleme
Tougoude
Toura
Sub-Administration HQ Fianga
Fianga
Games
Hollom
Kera
Tikem
Youe
Sub-Administration HQ Gounou Gaya
Berem
Djarao
Domo
Gaya
Gouin
Leo
Tagal
Sub-Administration HQ Lere
Binder Centre
Binder Rural
Lagon
Lere Centre
Lere Rural
Sub-Administration HQ Pala
Goum
Goye Goudoum
Pala Erde
Pala Ville
Torrock
Administration HQ Tandjile
Sub-Administration HQ Bere
Bere
Sub-Administration HQ Kelo
Bagaye
Kelo
Kolon
Marba
Mesme
Monogoye
Sub-Administration HQ Lai
Deressia
Kabalaye
Lai
Ndam
Ninga
Soumraye
Tchaguine Ngolo
(1004-1009) Land Use by Administrative Division in Chad
1004 Chari – Baguirmi: Landuse
1005 Guera: Landuse
1006 Kanem: Landuse
1007 Prefecture du Lac: Landuse
1008 Mayo Kebbi: Landuse
1009 Tandjile: Landuse
The following details will be used for administrative areas coded as 1004-1009 above.
Area covered by desert dunes and sands in administrative area: km2
Total area of desert dunes and sands in administrative area as per cent of Lake Chad basin total area
Area covered by desert plains and plateaux with scattered vegetation in administrative area: km2
Total area of desert plains and plateaux with scattered vegetation in administrative area as per cent of Lake Chad basin total area
Area covered by decidous subdesert shrublands and degrated types in administrative area: km2
Total area of decidous subdesert shrublands and degrated types in administrative area as per cent of Lake Chad basin total area
Area covered by torn sahel steppes in administrative area: km2
Total area of torn sahel steppes in administrative area as per cent of Lake Chad basin total area
Area covered by sudan savanna woodland (with isoberline) and degraded types in administrative area: km2
Total area of sudan savanna woodland (with isoberline) and degraded types in administrative area as per cent of Lake Chad basin total area
Area covered by derived guinea savanna in administrative area: km2
Total area of derived guinea savanna in administrative area as per cent of Lake Chad basin total area
Area covered by congo-guinea post forest zone in administrative area: km2
Total area of congo-guinea post forest zone in administrative area as per cent of Lake Chad basin total area
Area covered by desert mountain vegetation in administrative area: km2
Total area of desert mountain vegetation in administrative area as per cent of Lake Chad basin total area
Area covered by high altitude Sudan groups (with Isoberlinia and montane species) in administrative area: km2
Total area of high altitude Sudan groups (with Isoberlinia and montane species) in administrative area as per cent of Lake Chad basin total area
Area covered by mountain groups in administrative area: km2
Total area of mountain groups in administrative area as per cent of Lake Chad basin total area
Area covered by herbaceous halophilous vegetation in administrative area: km2
Total area of herbaceous halophilous vegetation in administrative area as per cent of Lake Chad basin total area
Area covered by herbaceous halophilous vegetation in administrative area: km2
Total area of herbaceous halophilous vegetation in administrative area as per cent of Lake Chad basin total area
Area covered by fresh water swamp vegetation in administrative area: km2
Total area of fresh water swamp vegetation in administrative area as per cent of Lake Chad basin total area
Area of agricultural land in administrative area: km2
Area of agriculture land as per cent of Lake Chad basin total area
Area of wetland in administrative area: km2
Area of barren land in administrative area: km2
Water area in administrative area: km2
Urban land in administrative area: km2
Other land area in administrative area: km2
Other land area in administrative area as per cent of Lake Chad basin total area
(1010-1012) Land Area Population and Population Density in Niger by MAU
1010 Area of MAU: sq km
1011 Population of MAU: '000
1012 Population Density: Persons per sq km
Dimension: Population by square kilometer
Coverage: MAUs in Niger that falls within the Lake Chad Basin.
List of MAUs in Niger to be used as details for items coded 1010-1012 above.
Administration HQ Diffa
MAU
District HQ Diffa
Diffa
Chetimari
Komadougou (Diffa)
District HQ Nguimi
Nguimi
District HQ Maine Soroa
Maine Soroa
Goudoumaria
(1013-1015) Land Use by Administrative Division in Niger
1013 Diffa: Landuse
1014 Nguimi: Landuse
1015 Maine Soroa: Landuse
The following details will be used for administrative areas coded as 1013-1015 above.
Area covered by desert dunes and sands in administrative area: km2
Total area of desert dunes and sands in administrative area as per cent of Lake Chad basin total area
Area covered by desert plains and plateaux with scattered vegetation in administrative area: km2
Total area of desert plains and plateaux with scattered vegetation in administrative area as per cent of Lake Chad basin total area
Area covered by decidous subdesert shrublands and degrated types in administrative area: km2
Total area of decidous subdesert shrublands and degrated types in administrative area as per cent of Lake Chad basin total area
Area covered by torn sahel steppes in administrative area: km2
Total area of torn sahel steppes in administrative area as per cent of Lake Chad basin total area
Area covered by sudan savanna woodland (with isoberline) and degraded types in administrative area: km2
Total area of sudan savanna woodland (with isoberline) and degraded types in administrative area as per cent of Lake Chad basin total area
Area covered by derived guinea savanna in administrative area: km2
Total area of derived guinea savanna in administrative area as per cent of Lake Chad basin total area
Area covered by congo-guinea post forest zone in administrative area: km2
Total area of congo-guinea post forest zone in administrative area as per cent of Lake Chad basin total area
Area covered by desert mountain vegetation in administrative area: km2
Total area of desert mountain vegetation in administrative area as per cent of Lake Chad basin total area
Area covered by high altitude Sudan groups (with Isoberlinia and montane species) in administrative area: km2
Total area of high altitude Sudan groups (with Isoberlinia and montane species) in administrative area as per cent of Lake Chad basin total area
Area covered by mountain groups in administrative area: km2
Total area of mountain groups in administrative area as per cent of Lake Chad basin total area
Area covered by herbaceous halophilous vegetation in administrative area: km2
Total area of herbaceous halophilous vegetation in administrative area as per cent of Lake Chad basin total area
Area covered by herbaceous halophilous vegetation in administrative area: km2
Total area of herbaceous halophilous vegetation in administrative area as per cent of Lake Chad basin total area
Area covered by fresh water swamp vegetation in administrative area: km2
Total area of fresh water swamp vegetation in administrative area as per cent of Lake Chad basin total area
Area of agricultural land in administrative area: km2
Area of agriculture land as per cent of Lake Chad basin total area
Area of wetland in administrative area: km2
Area of barren land in administrative area: km2
Water area in administrative area: km2
Urban land in administrative area: km2
Other land area in administrative area: km2
Other land area in administrative area as per cent of Lake Chad basin total area
(1016-1018) Land Area Population and Population Density in Cameroon by MAU
1016 Area of MAU: sq km
1017 Population of MAU: '000
1018 Population Density: Persons per sq km
Dimension: Population by square kilometer
Coverage: MAUs in Cameroon that falls within the Lake Chad Basin.
List of MAUs in Cameroon to be used as details for items coded 1016-1018 above.
Department HQ Extreme-Nord
MAU
District HQ Diamare
Bogo
Maroua
Gazawa
Meri
District HQ Kaele
Kaele
Moutourwa
Guidiuis
Mindif
Moulvoudaye
District HQ Mayo Danay
Kar-Hay
Kalfou
Yagoua
Wina
Guere
Maga
District HQ Logone et Chari
Kousseri
Makary
Fotokol
Hile-Halifa
Logone-Birni
Goulfey
Blangoa
Waza
District HQ Mayo Sava
Mora
Tokombere
Kolofata
District HQ Mayo Tsanaga
Mokolo
Hina
Bourrha
Koza
Department HQ Province du Nord
District HQ Mayo Louti
Guider
Mayo Oulo
Figuil
(1019-1020) Land Use by Administrative Division in Cameroon
1019 Extreme-Nord: Landuse
1020 Province du Nord: Landuse
The following details will be used for administrative areas coded as 1019-1020 above.
Area covered by desert dunes and sands in administrative area: km2
Total area of desert dunes and sands in administrative area as per cent of Lake Chad basin total area
Area covered by desert plains and plateaux with scattered vegetation in administrative area: km2
Total area of desert plains and plateaux with scattered vegetation in administrative area as per cent of Lake Chad basin total area
Area covered by decidous subdesert shrublands and degrated types in administrative area: km2
Total area of decidous subdesert shrublands and degrated types in administrative area as per cent of Lake Chad basin total area
Area covered by torn sahel steppes in administrative area: km2
Total area of torn sahel steppes in administrative area as per cent of Lake Chad basin total area
Area covered by sudan savanna woodland (with isoberline) and degraded types in administrative area: km2
Total area of sudan savanna woodland (with isoberline) and degraded types in administrative area as per cent of Lake Chad basin total area
Area covered by derived guinea savanna in administrative area: km2
Total area of derived guinea savanna in administrative area as per cent of Lake Chad basin total area
Area covered by congo-guinea post forest zone in administrative area: km2
Total area of congo-guinea post forest zone in administrative area as per cent of Lake Chad basin total area
Area covered by desert mountain vegetation in administrative area: km2
Total area of desert mountain vegetation in administrative area as per cent of Lake Chad basin total area
Area covered by high altitude Sudan groups (with Isoberlinia and montane species) in administrative area: km2
Total area of high altitude Sudan groups (with Isoberlinia and montane species) in administrative area as per cent of Lake Chad basin total area
Area covered by mountain groups in administrative area: km2
Total area of mountain groups in administrative area as per cent of Lake Chad basin total area
Area covered by herbaceous halophilous vegetation in administrative area: km2
Total area of herbaceous halophilous vegetation in administrative area as per cent of Lake Chad basin total area
Area covered by herbaceous halophilous vegetation in administrative area: km2
Total area of herbaceous halophilous vegetation in administrative area as per cent of Lake Chad basin total area
Area covered by fresh water swamp vegetation in administrative area: km2
Total area of fresh water swamp vegetation in administrative area as per cent of Lake Chad basin total area
Area of agricultural land in administrative area: km2
Area of agriculture land as per cent of Lake Chad basin total area
Area of wetland in administrative area: km2
Area of barren land in administrative area: km2
Water area in administrative area: km2
Urban land in administrative area: km2
Other land area in administrative area: km2
Other land area in administrative area as per cent of Lake Chad basin total area
(1021-1023) Land Area Population and Population Density in Nigeria by MAU
1021 Area of MAU: sq km
1022 Population of MAU: '000
1023 Population Density: Persons per sq km
Dimension: Population by square kilometer
Coverage: MAUs in Nigeria that falls within the Lake Chad Basin.
List of MAUs in Nigeria to be used as details for items coded 1021-1023 above.
State HQ Borno
MAU
LGA HQ Machina
Machina
Yusufari
LGA HQ Mobbar
Mobbar
Gubio
LGA HQ Kanembu
Kanembu
Nganzai
LGA HQ Monguno
Monguno
Marte
LGA HQ Kaga
Kaga
Magumeri
LGA HQ Auno
Auno
Mafa
Konduga
LGA HQ Maiduguri
Maiduguri
Yerwa
LGA HQ Ngala
Ngala
Rann
Kala
LGA HQ Gajibo
Gajibo
Gumsu
LGA HQ Gulumba
Gulumba
Bama
Kumshe/Woloji
LGA HQ Damboa
Damboa
LGA HQ Izghe
Izghe
Gwoza
Ashgashiya
LGA HQ Ngulde
Ngulde
Ngobi
Askira
Wamdeo
Uba
Mussa
Lassa
State HQ Yobe
LGA HQ Nguru
Nguru
LGA HQ Gashua
Gasua
Gogaram
LGA HQ Bursari
Bursari
Damaturu
LGA HQ Kanamna-Yunusari
Kanamna-Yunusari
LGA HQ Geidam
Geidam
(1024-1028) Land Use by Administrative Division in Nigeria
1024 Borno: Landuse
1025 Yobe: Landuse
1026 Jigawa: Landuse
1027 Kano: Landuse
1028 Bauchi: Landuse
The following details will be used for administrative areas coded as 1024-1028 above.
Area covered by desert dunes and sands in administrative area: km2
Total area of desert dunes and sands in administrative area as per cent of Lake Chad basin total area
Area covered by desert plains and plateaux with scattered vegetation in administrative area: km2
Total area of desert plains and plateaux with scattered vegetation in administrative area as per cent of Lake Chad basin total area
Area covered by decidous subdesert shrublands and degrated types in administrative area: km2
Total area of decidous subdesert shrublands and degrated types in administrative area as per cent of Lake Chad basin total area
Area covered by torn sahel steppes in administrative area: km2
Total area of torn sahel steppes in administrative area as per cent of Lake Chad basin total area
Area covered by sudan savanna woodland (with isoberline) and degraded types in administrative area: km2
Total area of sudan savanna woodland (with isoberline) and degraded types in administrative area as per cent of Lake Chad basin total area
Area covered by derived guinea savanna in administrative area: km2
Total area of derived guinea savanna in administrative area as per cent of Lake Chad basin total area
Area covered by congo-guinea post forest zone in administrative area: km2
Total area of congo-guinea post forest zone in administrative area as per cent of Lake Chad basin total area
Area covered by desert mountain vegetation in administrative area: km2
Total area of desert mountain vegetation in administrative area as per cent of Lake Chad basin total area
Area covered by high altitude Sudan groups (with Isoberlinia and montane species) in administrative area: km2
Total area of high altitude Sudan groups (with Isoberlinia and montane species) in administrative area as per cent of Lake Chad basin total area
Area covered by mountain groups in administrative area: km2
Total area of mountain groups in administrative area as per cent of Lake Chad basin total area
Area covered by herbaceous halophilous vegetation in administrative area: km2
Total area of herbaceous halophilous vegetation in administrative area as per cent of Lake Chad basin total area
Area covered by herbaceous halophilous vegetation in administrative area: km2
Total area of herbaceous halophilous vegetation in administrative area as per cent of Lake Chad basin total area
Area covered by fresh water swamp vegetation in administrative area: km2
Total area of fresh water swamp vegetation in administrative area as per cent of Lake Chad basin total area
Area of agricultural land in administrative area: km2
Area of agriculture land as per cent of Lake Chad basin total area
Area of wetland in administrative area: km2
Area of barren land in administrative area: km2
Water area in administrative area: km2
Urban land in administrative area: km2
Other land area in administrative area: km2
Other land area in administrative area as per cent of Lake Chad basin total area
(1029-1031) Land Area Population and Population Density in CAR by MAU
1029 Area of MAU: sq km
1030 Population of MAU: '000
1031 Population Density: Persons per sq km
Dimension: Population by square kilometer
Coverage: MAUs in CAR that falls within the Lake Chad Basin.
List of MAUs in CAR to be used as details for items coded 1029-1031 above.
Prefecture
Ouham Péndé
Ouham
Bamingui-Bangoran
Nana-Gribizi
Vakaga
(1032-1036) Land Use by Prefecture in CAR
1032 Ouham Péndé: Landuse
1033 Ouham: Landuse
1034 Bamingui-Bangoran: Landuse
1035 Nana-Gribizi: Landuse
1036 Vakaga: Landuse
The following details will be used for administrative areas coded as 1032-1036 above.
Area covered by desert dunes and sands in administrative area: km2
Total area of desert dunes and sands in administrative area as per cent of Lake Chad basin total area
Area covered by desert plains and plateaux with scattered vegetation in administrative area: km2
Total area of desert plains and plateaux with scattered vegetation in administrative area as per cent of Lake Chad basin total area
Area covered by decidous subdesert shrublands and degrated types in administrative area: km2
Total area of decidous subdesert shrublands and degrated types in administrative area as per cent of Lake Chad basin total area
Area covered by torn sahel steppes in administrative area: km2
Total area of torn sahel steppes in administrative area as per cent of Lake Chad basin total area
Area covered by sudan savanna woodland (with isoberline) and degraded types in administrative area: km2
Total area of sudan savanna woodland (with isoberline) and degraded types in administrative area as per cent of Lake Chad basin total area
Area covered by derived guinea savanna in administrative area: km2
Total area of derived guinea savanna in administrative area as per cent of Lake Chad basin total area
Area covered by congo-guinea post forest zone in administrative area: km2
Total area of congo-guinea post forest zone in administrative area as per cent of Lake Chad basin total area
Area covered by desert mountain vegetation in administrative area: km2
Total area of desert mountain vegetation in administrative area as per cent of Lake Chad basin total area
Area covered by high altitude Sudan groups (with Isoberlinia and montane species) in administrative area: km2
Total area of high altitude Sudan groups (with Isoberlinia and montane species) in administrative area as per cent of Lake Chad basin total area
Area covered by mountain groups in administrative area: km2
Total area of mountain groups in administrative area as per cent of Lake Chad basin total area
Area covered by herbaceous halophilous vegetation in administrative area: km2
Total area of herbaceous halophilous vegetation in administrative area as per cent of Lake Chad basin total area
Area covered by herbaceous halophilous vegetation in administrative area: km2
Total area of herbaceous halophilous vegetation in administrative area as per cent of Lake Chad basin total area
Area covered by fresh water swamp vegetation in administrative area: km2
Total area of fresh water swamp vegetation in administrative area as per cent of Lake Chad basin total area
Area of agricultural land in administrative area: km2
Area of agriculture land as per cent of Lake Chad basin total area
Area of wetland in administrative area: km2
Area of barren land in administrative area: km2
Water area in administrative area: km2
Urban land in administrative area: km2
Other land area in administrative area: km2
Other land area in administrative area as per cent of Lake Chad basin total area
(1037-1040) Land Resources: Land Use (Land cover) by drainage area
1037 Komadougou-Yobe drainage area: Landuse
1038 Lake Chad : Landuse
1039 Chari-Logone drainage area: Landuse
1040 Yaeres-El Beid drainage area: Landuse
The following details will be used for drainage areas coded as 1037-1040 above.
Area covered by desert dunes and sands in drainage area: km2
Total area of desert dunes and sands in drainage area as per cent of Lake Chad basin total area
Area covered by desert plains and plateaux with scattered vegetation in drainage area: km2
Total area of desert plains and plateaux with scattered vegetation in drainage area as per cent of Lake Chad basin total area
Area covered by decidous subdesert shrublands and degrated types in drainage area: km2
Total area of decidous subdesert shrublands and degrated types in drainage area as per cent of Lake Chad basin total area
Area covered by torn sahel steppes in drainage area: km2
Total area of torn sahel steppes in drainage area as per cent of Lake Chad basin total area
Area covered by sudan savanna woodland (with isoberline) and degraded types in drainage area: km2
Total area of sudan savanna woodland (with isoberline) and degraded types in drainage area as per cent of Lake Chad basin total area
Area covered by derived guinea savanna in drainage area: km2
Total area of derived guinea savanna in drainage area as per cent of Lake Chad basin total area
Area covered by congo-guinea post forest zone in drainage area: km2
Total area of congo-guinea post forest zone in drainage area as per cent of Lake Chad basin total area
Area covered by desert mountain vegetation in drainage area: km2
Total area of desert mountain vegetation in drainage area as per cent of Lake Chad basin total area
Area covered by high altitude Sudan groups (with Isoberlinia and montane species) in drainage area: km2
Total area of high altitude Sudan groups (with Isoberlinia and montane species) in drainage area as per cent of Lake Chad basin total area
Area covered by mountain groups in drainage area: km2
Total area of mountain groups in drainage area as per cent of Lake Chad basin total area
Area covered by herbaceous halophilous vegetation in drainage area: km2
Total area of herbaceous halophilous vegetation in drainage area as per cent of Lake Chad basin total area
Area covered by herbaceous halophilous vegetation in drainage area: km2
Total area of herbaceous halophilous vegetation in drainage area as per cent of Lake Chad basin total area
Area covered by fresh water swamp vegetation in drainage area: km2
Total area of fresh water swamp vegetation in drainage area as per cent of Lake Chad basin total area
Area of agricultural land in drainage area: km2
Area of agriculture land as per cent of Lake Chad basin total area
Area of wetland in drainage area: km2
Area of barren land in drainage area: km2
Water area in drainage area: km2
Urban land in drainage area: km2
Other land area in drainage area: km2
Other land area in drainage area as per cent of Lake Chad basin total area
(1041-1052) Land Resources: Geology by drainage area
1041 Area of Ac-N (Neogene Rhyolite, Dacite) rock type in drainage area: km2
1042 Area of Bas-Q (Quatenary Basalt, Andesite) rock type in drainage area: km2
1043 Area of Bas-T (Tertiary Basalt, Andesite) rock type in drainage area: km2
1044 Area of Ac-T (Tertiary granite) rock type in drainage area: km2
1045 Area of Ac-M (Mesozoic granite) rock type in drainage area: km2
1046 Area of Ac-J (Jurassic granite) rock type in drainage area: km2
1047 Area of Pr (Proterozoic) rock type in drainage area: km2
1048 Area of Ps (Upper Proterozoic) rock type in drainage area: km2
1049 Area of Pm (Middle Proterozoic) rock type in drainage area: km2
1050 Area of Pl (Lower Proterozoic) rock type in drainage area: km2
1051 Area of Arc (Archaeon) rock type in drainage area: km2
1052 Area of Px (Metamorphic rocks of undetermined age) rock type in drainage area: km2
(1053-11000 Land Resources: Pedology by Drainage area
1053 Area of A (desert soils, eolian soils on siliceous sands) soil type in drainage area: km2
1054 Area of B (lithosoils on crystalline rocks essentially granites) soil type in drainage area: km2
1055 Area of C (soils of stony desert with ferruginous facies on natural gravel derived from alteration product of granites: toposequence with hydromorphic soils or with soils of brown facies) soil type in drainage area: km2
1056 Area of Cb (soils of stony desert with ferruginous facies on natural gravel derived from alteration product of granites: toposequence with leached halomorphic soils) soil type in drainage area: km2
1057 Area of Cd (soils of stony desert with ferruginous facies on kaolinic and ferruginous sandstones) soil type in drainage area: km2
1058 Area of D (weakly developed soils formed by deposition or hydromorphic soils on alluvia) soil type in drainage area: km2
1059 Area of E (weakly developed soils formed by deposition, intergrade towards leached halomorphic soils on clayed sands) soil type in drainage area: km2
1060 Area of F (topomorphic vertisols and soils with vertic gley on clayed alluvia) soil type in drainage area: km2
1061 Area of FH (topomorphic vertisols and soils with vertic gley covering brown soils) soil type in drainage area: km2
1062 Area of G (topomorphic vertisols, topolithomorphic vertisols, alkali vertic soils on sandy clays derived from granitic and sometimes basic metamorphic rocks) soil type in drainage area: km2
1063 Area of Gb (topomorphic vertisols, topolithomorphic vertisols, alkali vertic soils on shales (argillites)) soil type in drainage area: km2
1064 Area of H (brown soils, weakly developed soils of brown facies, reddish brown facies and weakly leached ferruginous facies on siliceous sands) soil type in drainage area: km2
1065 Area of Hb (brown soils, weakly developed soils of brown facies, reddish brown facies and weakly leached ferruginous facies: perilacustrine ridge complex) soil type in drainage area: km2
1066 Area of Hc (brown soils, weakly developed soils of brown facies, reddish brown facies and weakly leached ferruginous facies: beach complex) soil type in drainage area: km2
1067 Area of Hd (brown soils, weakly developed soils of brown facies, reddish brown facies and weakly leached ferruginous facies: zones covered with fine, lacustrine or fluvio-lacustrine alluvia (halomorphic and hydromorphic soils)) soil type in drainage area: km2
1068 Area of He (brown soils, weakly developed soils of brown facies, reddish brown facies and weakly leached ferruginous facies: toposequence with limestone accumulation at depth) soil type in drainage area: km2
1069 Area of Hf (brown soils, weakly developed soils of brown facies, reddish brown facies and weakly leached ferruginous facies: with depressions with watertable near surface(salin soils, soils with gley)) soil type in drainage area: km2
1070 Area of J (brown soils, weakly developed soils of brown facies, reddish brown facies and weakly leached ferruginous facies on siliceous sands(dunes)) soil type in drainage area: km2
1071 Area of K (brown and reddish brown semi-arid soils on piedmont slopes on sandy clays derived from alteration of metamorphic rocks) soil type in drainage area: km2
1072 Area of M (reddish brown semi-arid soils, weakly leached ferruginous soils on siliceous soils) soil type in drainage area: km2
1073 Area of M1 (reddish brown semi-arid soils, weakly leached ferruginous soils sanding up modified by substratum: soft sandstone) soil type in drainage area: km2
1074 Area of M2 (reddish brown semi-arid soils, weakly leached ferruginous soils sanding up modified by substratum: granites) soil type in drainage area: km2
1075 Area of M3 (reddish brown semi-arid soils, weakly leached ferruginous soils sanding up modified by substratum: ironstone cap, ferruginous sandstone) soil type in drainage area: km2
1076 Area of N (weakly leached ferruginous soils with unfinished drainage on siliceous sands) soil type in drainage area: km2
1077 Area of O (leached and weakly leached ferruginous soils: toposequence with hydromorphic soils) soil type in drainage area: km2
1079 Area of P (leached and weakly leached ferruginous soils on siliceous sands and clayed sands: toposequence with leached hydromorphic soils) soil type in drainage area: km2
1080 Area of Q (leached and weakly leached ferruginous soils on siliceous sands and clayed sands: toposequence with leached hydromorphic and halomorphic soils and soils with limestone concretions) soil type in drainage area: km2
1081 Area of R (leached ferruginous soils without concretions on sandstones: toposequence with hydromorphic soils) soil type in drainage area: km2
1082 Area of Rb (leached ferruginous soils without concretions on granites: toposequence with halomorphic soils and vertisols) soil type in drainage area: km2
1083 Area of RR1 (ferruginous soils with oblique leaching on granites: toposequence with leached hydromorphic and halomorphic soils and with vertic soils) soil type in drainage area: km2
1084 Area of RR2 (ferruginous soils with oblique leaching on clayed sands: toposequence with leached hydromorphic and halomorphic soils and with vertisols) soil type in drainage area: km2
1085 Area of T0 (leached ferruginous soils with concretions and or ironpan on different rocks (sandstones, granites, metamorphic) with concretions dominant) soil type in drainage area: km2
1086 Area of T1 (leached ferruginous soils with concretions and or ironpan on different rocks (sandstones, granites, metamorphic) soils with ironpan dominant) soil type in drainage area: km2
1087 Area of T2 (leached ferruginous soils with concretions and or ironpan on different rocks (sandstones, granites, metamorphic) toposequence with vertic soils) soil type in drainage area: km2
1088 Area of T3 (leached ferruginous soils with concretions and or ironpan on different rocks (sandstones, granites, metamorphic) indurated eroded soils) soil type in drainage area: km2
1089 Area of U (red tropical soils on sandy clay derived from alteration of basic rocks) soil type in drainage area: km2
1090 Area of S (weakly ferrallitic and ferruginous tropical soils on old ferrallitic soils on different rocks (sandstones, granites, basic rocks) soil type in drainage area: km2
1091 Area of L (halomorphic soils due to watertable on alluvia (salin soils, alkali soils, gley soils)) soil type in drainage area: km2
1092 Area of X (halomorphic soils due to watertable complex of the lake shores) soil type in drainage area: km2
1093 Area of V (leached alkali soils solodised solonets on sandy clays derived from granite) soil type in drainage area: km2
1094 Area of W (leached alkali soils hydromorphic solodised solonets on alluvia) soil type in drainage area: km2
1095 Area of Wb (leached alkali soils hydromorphic solodised solonets toposequence with hydromorphic vertisols) soil type in drainage area: km2
1096 Area of Wp (leached alkali soils hydromorphic solodised solonets association with leached ferruginous soils) soil type in drainage area: km2
1097 Area of Y (hydromorphic mineral soils with surface of pseudo-gley or gley generally acid soils, sometimes leached on alluvia) soil type in drainage area: km2
1098 Area of Yb (hydromorphic mineral soils with surface of pseudo-gley or gley generally acid soils, sometimes leached on sandstone) soil type in drainage area: km2
1099 Area of Z (hydromorphic mineral soils with surface of pseudo-gley or gley neutral to alkaline soils, with tendency towards halomorphic soils, vertisols on alluvia) soil type in drainage area: km2
1100 Area of Zb (hydromorphic mineral soils with surface of pseudo-gley or gley neutral to alkaline soils, with tendency towards halomorphic soils, vertisols brown soils with reduced drainage or leached brown soils) soil type in drainage area: km2
(1101-1111) Rainfall and other Weather Information collected in Selected Stations
1101 Average monthly annual rainfall: mm
1102 Average annual rainfall: mm
1103 Number of rain days:
1104 Amount of Radiation:
1105 Amount of evaporation:
1106 Amount of sunshine: hours
1107 Average daily minimum temperature: degrees centigrade
1108 Average daily maximum temperature: degrees centigrade
1109 Average monthly minimum temperature: degrees centigrade
1110 Average monthly maximum temperature: degrees centigrade
1111 Average daily wind speed: km/hr
Dimension: As stated
Coverage: selected meteorological stations
Frequency: Daily, monthly, annually.
The following selected stations details will be used with the items coded as 1101-1111 above
Country/Station
Chad
N’djamena
Bébedjia
Bol
Bongor
Mao
Moïssala
Moundou
Sarh
Cameroon
Garoua
Guider
Maroua
Mokolo
Mora
Ngaoundere
Poli
Nigeria
Kano
Maiduguri
Nguru
Potiskum
Niger
Magaria
Maine-Soroa
Nguigmi
Zinder
(1112-1114) Water Run-Off at Selected Stations
1112 Run Off at selected station: mcm
1113 Maximum observed water stage at selected station: metres above sea level
1114 Mamimum observed water stage at selected station: metres above sea level
Dimension: mcm, metres above sea level
Coverage: Selected river gauging station
Frequency: Daily, monthly and annual
Selected stations to be used as details for items coded as 1112-1114 above.
1115 Evaporation at selected stations
1116 Mean monthly and Annual Evaporation at selected stations: mm
Dimension: mm
Coverage: Selected Stations
Frequency: Monthly and Annual
Selected station to be used as details for item coded as 1115-1116 above
(1117-1127) Area of Selected Crops Produced Under Irrigation in drainage areas: Hectares
1117 Area of Wheat irrigated: Hectares
1118 Area of rice irrigated: Hectares
1119 Area of maize irrigated: Hectares
1120 Area of sorghum irrigated: Hectares
1121 Area of other cereals irrigated: Hectares
1122 Area of legumes irrigated: Hectares
1123 Area of fodder irrigated: Hectares
1124 Area of vegetables irrigated: Hectares
1125 Area of other crops irrigated: Hectares
1126 Area of all crops irrigated: Hectares
1127 Area that can be potentially irrigated for all crops: Hectares
Dimension: Hectares
Coverage: All irrigation projects
Frequency: Annually
(1128-1135) Quantity of Selected Crops Produced under irrigation: tons
1128 Quantity of wheat produced under irrigation: tons
1129 Quantity of rice produced under irrigation: tons
1130 Quantity of maize produced under irrigation: tons
1131 Quantity of sorghum produced under irrigation: tons
1132 Quantity of other cereal produced under irrigation: tons
1133 Quantity of legumes produced under irrigation: tons
1134 Quantity of fodder produced under irrigation: tons
1135 Quantity of vegetables produced under irrigation: tons
Dimension: Tons
Coverage: All irrigation projects
Frequency: Annual
(1136-1156) Value and Prices of Crops Produced under Irrigation, Capital and Recurrent Costs of Irrigation: CFA
1136 Value of wheat produced under irrigation: CFA
1137 Value of rice produced under irrigation: CFA
1138 Value of maize produced under irrigation: CFA
1139 Value of sorghum produced under irrigation: CFA
1140 Value of other cereals produced under irrigation: CFA
1141 Value of legumes produced under irrigation: CFA
1142 Value of fodder produced under irrigation: CFA
1143 Value of vegetables produced under irrigation: CFA
1144 Value of other crops produced under irrigation: CFA
1145 Value of all crops produced under irrigation: CFA
1146 Farm gate price of wheat CFA/ton
1147 Farm gate price of rice: CFA/ton
1148 Farm gate price of maize: CFA/ton
1149 Farm gate price of sorghum: CFA/ton
1150 Farm gate price of other cereal: CFA/ton
1151 Farm gate price of legumes: CFA/ton
1152 Farm gate price of fodder: CFA/ton
1153 Farm gate price of vegetables: CFA/ton
1154 Farm gate price of other crops: CFA/ton
1155 Total capital cost of irrigation: CFA
1156 Total recurrent cost of irrigation: CFA
Dimension: CFA
Coverage: All irrigation projects
Frequency: Annually
(1157-1159) Location of major animal grazing sites in administrative areas
1157 Location of cattle grazing sites in administrative area
1158 Location of goats grazing sites in administrative area
1159 Location of sheep grazing sites in administrative area
Coverage: Administrative areas within the Lake Chad basin
Frequency: Annual
(1160-1163) Quantity and type of animal produce in administrative area
1160 Quantities of cattle produce in administrative area
1161 Quantities of goats produce in administrative area
1162 Quantities of sheep produce in administrative area
1163 Quantities of pigs produce in administrative area
Dimension: number of animals
Coverage: Administrative areas within the Lake Chad basin
Frequency: Annual
(1164-1167) Market value of animal produce in administrative area
1164 Value of cattle produce in administrative area: CFA
1165 Value of goats produce in administrative area: CFA
1166 Value of sheep produce in administrative area: CFA
1167 Value of pigs produce in administrative area: CFA
Dimension: CFA
Coverage: Administrative areas within the Lake Chad basin
Frequency: Annual
(1168-1169) Location of Fishing Grounds in Administrative Areas
1168 Location of Alestes baremoze fishing ground by administrative areas
1169 Location of A. dentex fishing ground by administrative areas
(1168-1171) Quantity and type of fish produce annually
1170 Quantities of produce in administrative areas
1171 Quantities of produce in administrative areas
Dimension: metric tons
Coverage: Administrative areas within the Lake Chad basin
Frequency: Annual
(1172-1173) Market value of fish produce
1172 Value of Alestes baremoze produce in administrative areas: CFA
1173 Value of A. dentex produce in administrative areas: CFA
Dimension: CFA
Coverage: Administrative areas within the Lake Chad basin
Frequency: Annual
(1174-1178) Location of industrial activity
1174 Location of cotton spinning industries in administrative areas
1175 Location of breweries in administrative areas
1176 Location of leather industries in administrative areas
1177 Location of machine industries in administrative areas
1178 Location of milling and food industries administrative areas
(1179-1183) Quantities of industrial products produce annually
1179 Quantities of cotton product produce in administrative areas: [metric tons]
1180 Quantities of liquor produce in administrative areas: [metric tons]
1181 Quantities of leather products produce in administrative areas: [metric tons]
1182 Quantities of machines produce in administrative areas: [metric tons]
1183 Quantities of food products produce in administrative areas: [metric tons]
Dimension: metric tons
Coverage: Administrative areas within the Lake Chad basin
Frequency: Annual
(1184-1188) Value of industrial products produce annually
1184 Value of cotton product produce in administrative areas: CFA
1185 Value of liquor produce in administrative areas: CFA
1186 Value of leather products produce in administrative areas: CFA
1187 Value of machines produce in administrative areas: CFA
1188 Value of food products produce in administrative areas: CFA
Dimension: CFA
Coverage: Administrative areas within the Lake Chad basin
Frequency: Annual
(1189-1192) Location of mineral production
1189 Location of natron mine in administrative areas
1190 Location of gold exploitation in administrative areas
1191 Location of diamond exploitation in administrative areas
1192 Location of hydrocarbon exploitation in administrative areas
(1193-1196) Quantities of mineral production
1193 Quantities of natron produce in administrative areas: [metric tons]
1194 Quantities of gold produce in administrative areas: [metric tons]
1195 Quantities of diamond produce in administrative areas: [metric tons]
1196 Quantities of hydrocarbon produce in administrative areas: [metric tons]
Dimension: metric tons
Coverage: Administrative areas within the Lake Chad basin
Frequency: Annual
(1197-11100) Value of mineral production
1197 Value of natron produce in administrative areas: CFA
1198 Value of gold produce in administrative areas: CFA
1199 Value of diamond produce in administrative areas: CFA
1200 Value of hydrocarbon produce in administrative areas: CFA
Dimension: CFA
Coverage: Administrative areas within the Lake Chad basin
Frequency: Annual
(1201-1218) Urban/Rural Water Supply Indicators by Drainage Areas
1201 Total urban population in drainage area: 103
1202 Service urban population in drainage area: 103
1203 In take urban water supply capacity (planned) million litres per day
1204 Per capita urban water supply capacity planned: litres per day
1205 In take urban water supply capacity available million litres per day
1206 Per capita urban water supply capacity available: litres per day
1207 Per capita urban water demand assumed: litres per day
1208 Urban water supply service population: 103
1209 Urban water supply service population rate: per cent
1210 Total rural population in drainage area: 103
1211 Service rural population in drainage area: 103
1212 Intake rural water supply capacity (planned): million litres per day
1213 Per capita rural water supply capacity (planned): litres per day
1214 Intake rural water supply capacity available: million litres per day
1215 Per capita urban water supply capacity available: litres per day
1216 Per capita rural water demand assumed: litres per day
1217 Rural water supply service population : 103
1218 Rural water supply service population rate : per cent
Dimension: As stated
Coverage: Drainage Areas
Frequency: Annual
Drainage Areas are to be used as details for the items coded 1157-1174 above
(1219-1230) Water Use and Balance by Drainage Area
1219 Potentially available surface water: million litres per day
1220 Demand for surface water for public irrigation: million litres per day
1221 Demand for surface water for private irrigation: million litres per day
1222 Other public demand for surface water: million litres per day
1223 Total demand for surface water: (1176+1177+1178) million litres per day
1224 Use rate of surface water: (1179/1175): per cent
1225 Potentially available ground water: million litres per day
1226 Demand for ground water for public irrigation: million litres per day
1227 Demand for surface water for private irrigation: million litres per day
1228 Other public demand for ground water: million litres per day
1229 Total demand for ground water: million litres per day
1230 Use rate of ground water (1185/1181) per cent
Dimension: As stated
Coverage: Drainage Areas
Frequency: Annual
Drainage Areas are to be used as details for items coded 1219-1230
(1231-1236) Characteristics of Lake Chad Basin’s Rivers
1231 Length of river: km
1232 Catchment area of the river: sq km
1233 Stream density of river
1234 Drainage density of river
1235 River basin slope
1236 River channel slope
Dimension: As stated
Coverage: Selected major rivers
Frequency: Daily, monthly, and Annual Average
Details for items on characteristics of Lake Chad Basin’s Rivers are selected rivers
(1237-1246) Environmental Problems by Drainage Area
1237 Severity of drought/desertification in drainage area:
1238 Severity of soil degradation in drainage area
1239 Severity of deforestation in drainage area
1240 Severity of soil erosion in drainage area
1241 Severity of wildlife/fishery losses in drainage area
1242 Severity of flooding erosion in drainage area
1243 Severity of reduced water availability downstream in drainage area
1244 Severity of water pollution in drainage area
1245 Severity of water euthrophication in drainage area
1246 Severity of socio-economic impact on drainage area
Dimension: Three – point rating scale: 3 = severe, 2= moderate 1 = minor
Coverage: Drainage Area
Frequency: As considered necessary
Drainage areas are to be used as details for items coded as 1237-1246 above
(1247-1251) Species Distribution by Drainage Areas
1247 Specie historical distribution area: ha
1248 Specie known distribution area: ha
1249 Specie potential distribution area: ha
1250 Specie predicted distribution area: ha
1251 Specie natural distribution area: ha
Dimension: hectares
Coverage: Drainage areas within the Lake Chad basin
Frequency: 5 years
(1252-1261) Nature Reserve by Member State
1252 Location of nature reserves in Chad
1253 Total area of nature reserve in Chad
1254 Location of nature reserves in RCA
1255 Total area of nature reserve in RCA
1256 Location of nature reserves in Cameroon
1257 Total area of nature reserve in Cameroon
1258 Location of nature reserves in Niger
1259 Total area of nature reserve in Niger
1260 Location of nature reserves in Nigeria
1261 Total area of nature reserve in Nigeria
Dimension: hectares
Coverage: Member States of the Lake Chad basin
Frequency: 5 years
(1262-1266) Location of Wetland by Drainage Areas
1262 Geographical position
1263 Coordinates of site center
1264 Total site area
1265 Minimum elevation
1266 Number of separate unit
Coverage: Drainage areas of the Lake Chad basin
Frequency: 5 years
(1267-1268) Wetland Uses
1267 Current land use: Within the wetland's catchment: km2
1268 Current land use: Within the wetland: km2
Dimension: Square kilometers
Coverage: Identified wetlands within the Lake Chad Basin
Frequency: 5 years
(1269-1270) Wetland Threats
1269 Threat: Within the wetland's catchment
1270 Threat: Within the wetland
Dimension: Number of identified threat
Coverage: Identified wetlands within the Lake Chad Basin
Frequency: 5 years
1271 Social and cultural values of the wetland
(1272-1273) Land Tenure
1272 Land tenure/ownership: Wetland's catchment
1273 Land tenure/ownership: Within the wetland
Dimension: Number of land tenure types
Coverage: Identified wetlands within the Lake Chad Basin
Frequency: 5 years
1274 Ecological Changes
Dimension: Number of identified ecological change
Coverage: Identified wetlands within the Lake Chad Basin
Frequency: 5 years
1275 Physical Data: Salinity
Dimension: Description
Coverage: Identified wetlands within the Lake Chad Basin
Frequency: 5 years
1276 Physical Data: Permanence:
Dimension: Description
Coverage: Identified wetlands within the Lake Chad Basin
Frequency: 5 years
1277 Wetland Category
Dimension: Description
Coverage: Identified wetlands within the Lake Chad Basin
1278 Wetland Type
Dimension: Description
Coverage: Identified wetlands within the Lake Chad Basin
(1279-1280) Biological Value of Wetland
1279 Biological Values: Fauna type
1280 Biological Values: Flora type
Dimension: Number of Fauna and Flora type
Coverage: Identified wetlands within the Lake Chad Basin
Frequency: 5 years
(1281-1285) Lake Chad
1281 Bounding Coordinates
1282 Elevation
1283 Bathymetry
1284 Names of main islands
1285 Number of outflowing rivers and channels (name)
1286 Description of Lake
1287 Physical Dimensions: Surface area [km2]
1288 Physical Dimensions: Volume [km3]
1289 Physical Dimensions: Maximum depth [m]
1290 Physical Dimensions: Mean depth [m] North Pool
1291 Physical Dimensions: Mean depth [m] South Pool
1292 Physical Dimensions: Water level
1293 Physical Dimensions: Normal range of annual water level fluctuation [m]
1294 Physical Dimensions: Length of shoreline [km]
1295 Physical Dimensions: Residence time [yr] North Pool
1296 Physical Dimensions: Residence time [yr] South Pool
1297 Physical Dimensions: Catchment area [km2]
(1298-1305) Lake Chad Water Quality
1298 Transparency: January - December North Pool
1299 Transparency: January - December South Pool
1300 pH: January – December North Pool
1301 pH: January – December South Pool
1302 DO: January – December North Pool
1303 DO: January – December South Pool
1304 Chlorophyll Concentration: January – December North Pool
1305 Chlorophyll Concentration: January – December South Pool
(1306-1307) Biological Features of Lake Chad
1306 Biological Features: Flora
1307 Biological Features: Fauna
Dimension: Number of Fauna and Flora type
Coverage: Lake Chad
Frequency: 5 years
(1308-1316) Primary Biological Production Rate
1308 Phytoplankton (Copepoda) production in South Basin Open water [kg ha-1 yr-1]
1309 Phytoplankton (Copepoda) production in South Archipelago [kg ha-1 yr-1]
1310 Phytoplankton (Copepoda) production in North Basin Open water [kg ha-1 yr-1]
1311 Phytoplankton (Copepoda) production in Archipelago [kg ha-1 yr-1]
1312 Phytoplankton (Mollusca) production in South Basin Open water [kg ha-1 yr-1]
1314 Phytoplankton (Mollusca) production in South Archipelago [kg ha-1 yr-1]
1315 Phytoplankton (Mollusca) production in North Basin Open water [kg ha-1 yr-1]
1316 Phytoplankton (Mollusca) production in Archipelago [kg ha-1 yr-1]
(1317-1330) Lake Chad Biomass
1317 Biomass (Phytoplankton) in South Basin Open water [kg (dry wt.) ha-1]
1318 Biomass (Phytoplankton) in South Archipelago [kg (dry wt.) ha-1]
1319 Biomass (Phytoplankton) in North Basin Open water [kg (dry wt.) ha-1]
1320 Biomass (Phytoplankton) in North Archipelago [kg (dry wt.) ha-1]
1321 Biomass (Macrophytes) in South Basin Open water [kg (dry wt.) ha-1]
1322 Biomass (Macrophytes) in South Archipelago [kg (dry wt.) ha-1]
1323 Biomass (Macrophytes) in North Basin Open water [kg (dry wt.) ha-1]
1324 Biomass (Macrophytes) in North Archipelago [kg (dry wt.) ha-1]
1325 Biomass (Copepoda) in South Basin Open water [kg (dry wt.) ha-1]
1326 Biomass (Copepoda) in South Archipelago [kg (dry wt.) ha-1]
1327 Biomass (Copepoda) in North Basin Open water [kg (dry wt.) ha-1]
1328 Biomass (Copepoda) in North Archipelago [kg (dry wt.) ha-1]
1329 Biomass (Mollusca) in South Basin Open water [kg (dry wt.) ha-1]
1330 Biomass (Mollusca) in South Archipelago [kg (dry wt.) ha-1]
1331 Biomass (Mollusca) in North Basin Open water [kg (dry wt.) ha-1]
1332 Biomass (Mollusca) in North Archipelago [kg (dry wt.) ha-1]
1333 Biomass (Worms) in South Basin Open water [kg (dry wt.) ha-1]
1334 Biomass (Worms) in South Archipelago [kg (dry wt.) ha-1]
1335 Biomass (Worms) in North Basin Open water [kg (dry wt.) ha-1]
1336 Biomass (Worms) in North Archipelago [kg (dry wt.) ha-1]
1337 Biomass (Insects) in South Basin Open water [kg (dry wt.) ha-1]
1338 Biomass (Insects) in South Archipelago [kg (dry wt.) ha-1]
1339 Biomass (Insects) in North Basin Open water [kg (dry wt.) ha-1]
1340 Biomass (Insects) in North Archipelago [kg (dry wt.) ha-1]
1341 Fishery Products: Annual fish catch [metric tons]
Dimension: metric tons
Coverage: Lake Chad
Frequency: Annual
1342 Transport and Navigation: Number of River Crafts
Dimension: Number of River crafts
Coverage: Lake Chad
Frequency: Annual
1343 Transport and Navigation: Total Number of Passengers Transported
Coverage: Lake Chad
Frequency: Annual
1344 Transport and Navigation: Total Quantity of Goods Transported [metric tons]
Dimension: Metric tons
Coverage: Lake Chad
Frequency: Annual
Reversal of Land and Water Degradation Trends In the Lake Chad Basin Ecosystem:
Establishment of Mechanisms for Land and Water Management, Expedited Project Document, 2003
Global International Waters Assessment, Regional assessment 43, Lake Chad Basin, United Nations Environment Programme, 2004
*Report on management organs
*RAF project report
Livestock Atlas of the Lake Chad Basin, Centre Technique de Cooperation Agricole et Rurale 1996, Wageningen, Netherlands.
Study of Water Resources in the Lake Chad, UNDP/UNESCO, 1968
*Diagnostic file Socio-Economic
*LCBC Masterplan
David Arctur and Michael Zeiler Designing Geodatabases, Case Studies in GIS Data Modeling, Draft Confidential, ESRI, 2004 Redlands, California.
Get PDF B document
CAR
• National
• States
• Local
Cameroon
• National
• State
• Local
Chad
• National
• State
• Local
Niger
• National
• State
• Local
Nigeria
• National
At the national level, 3 federal ministries are responsible for decision-making affecting water resources, agricultural and environmental management. The federal Ministry of Water Resources is responsible for the overall management of water resources of the federation. It highest policy making body is the National Council on Water Resources. The National Council on Water Resources is made up of 29 States Commisioners responsible for managing the water sector in each state, Managing Directors of 13 the River Basin Development authorities, chaired by the Minister of Water Resources
• State
• Local
Regional LCBC
Functions of the Commission
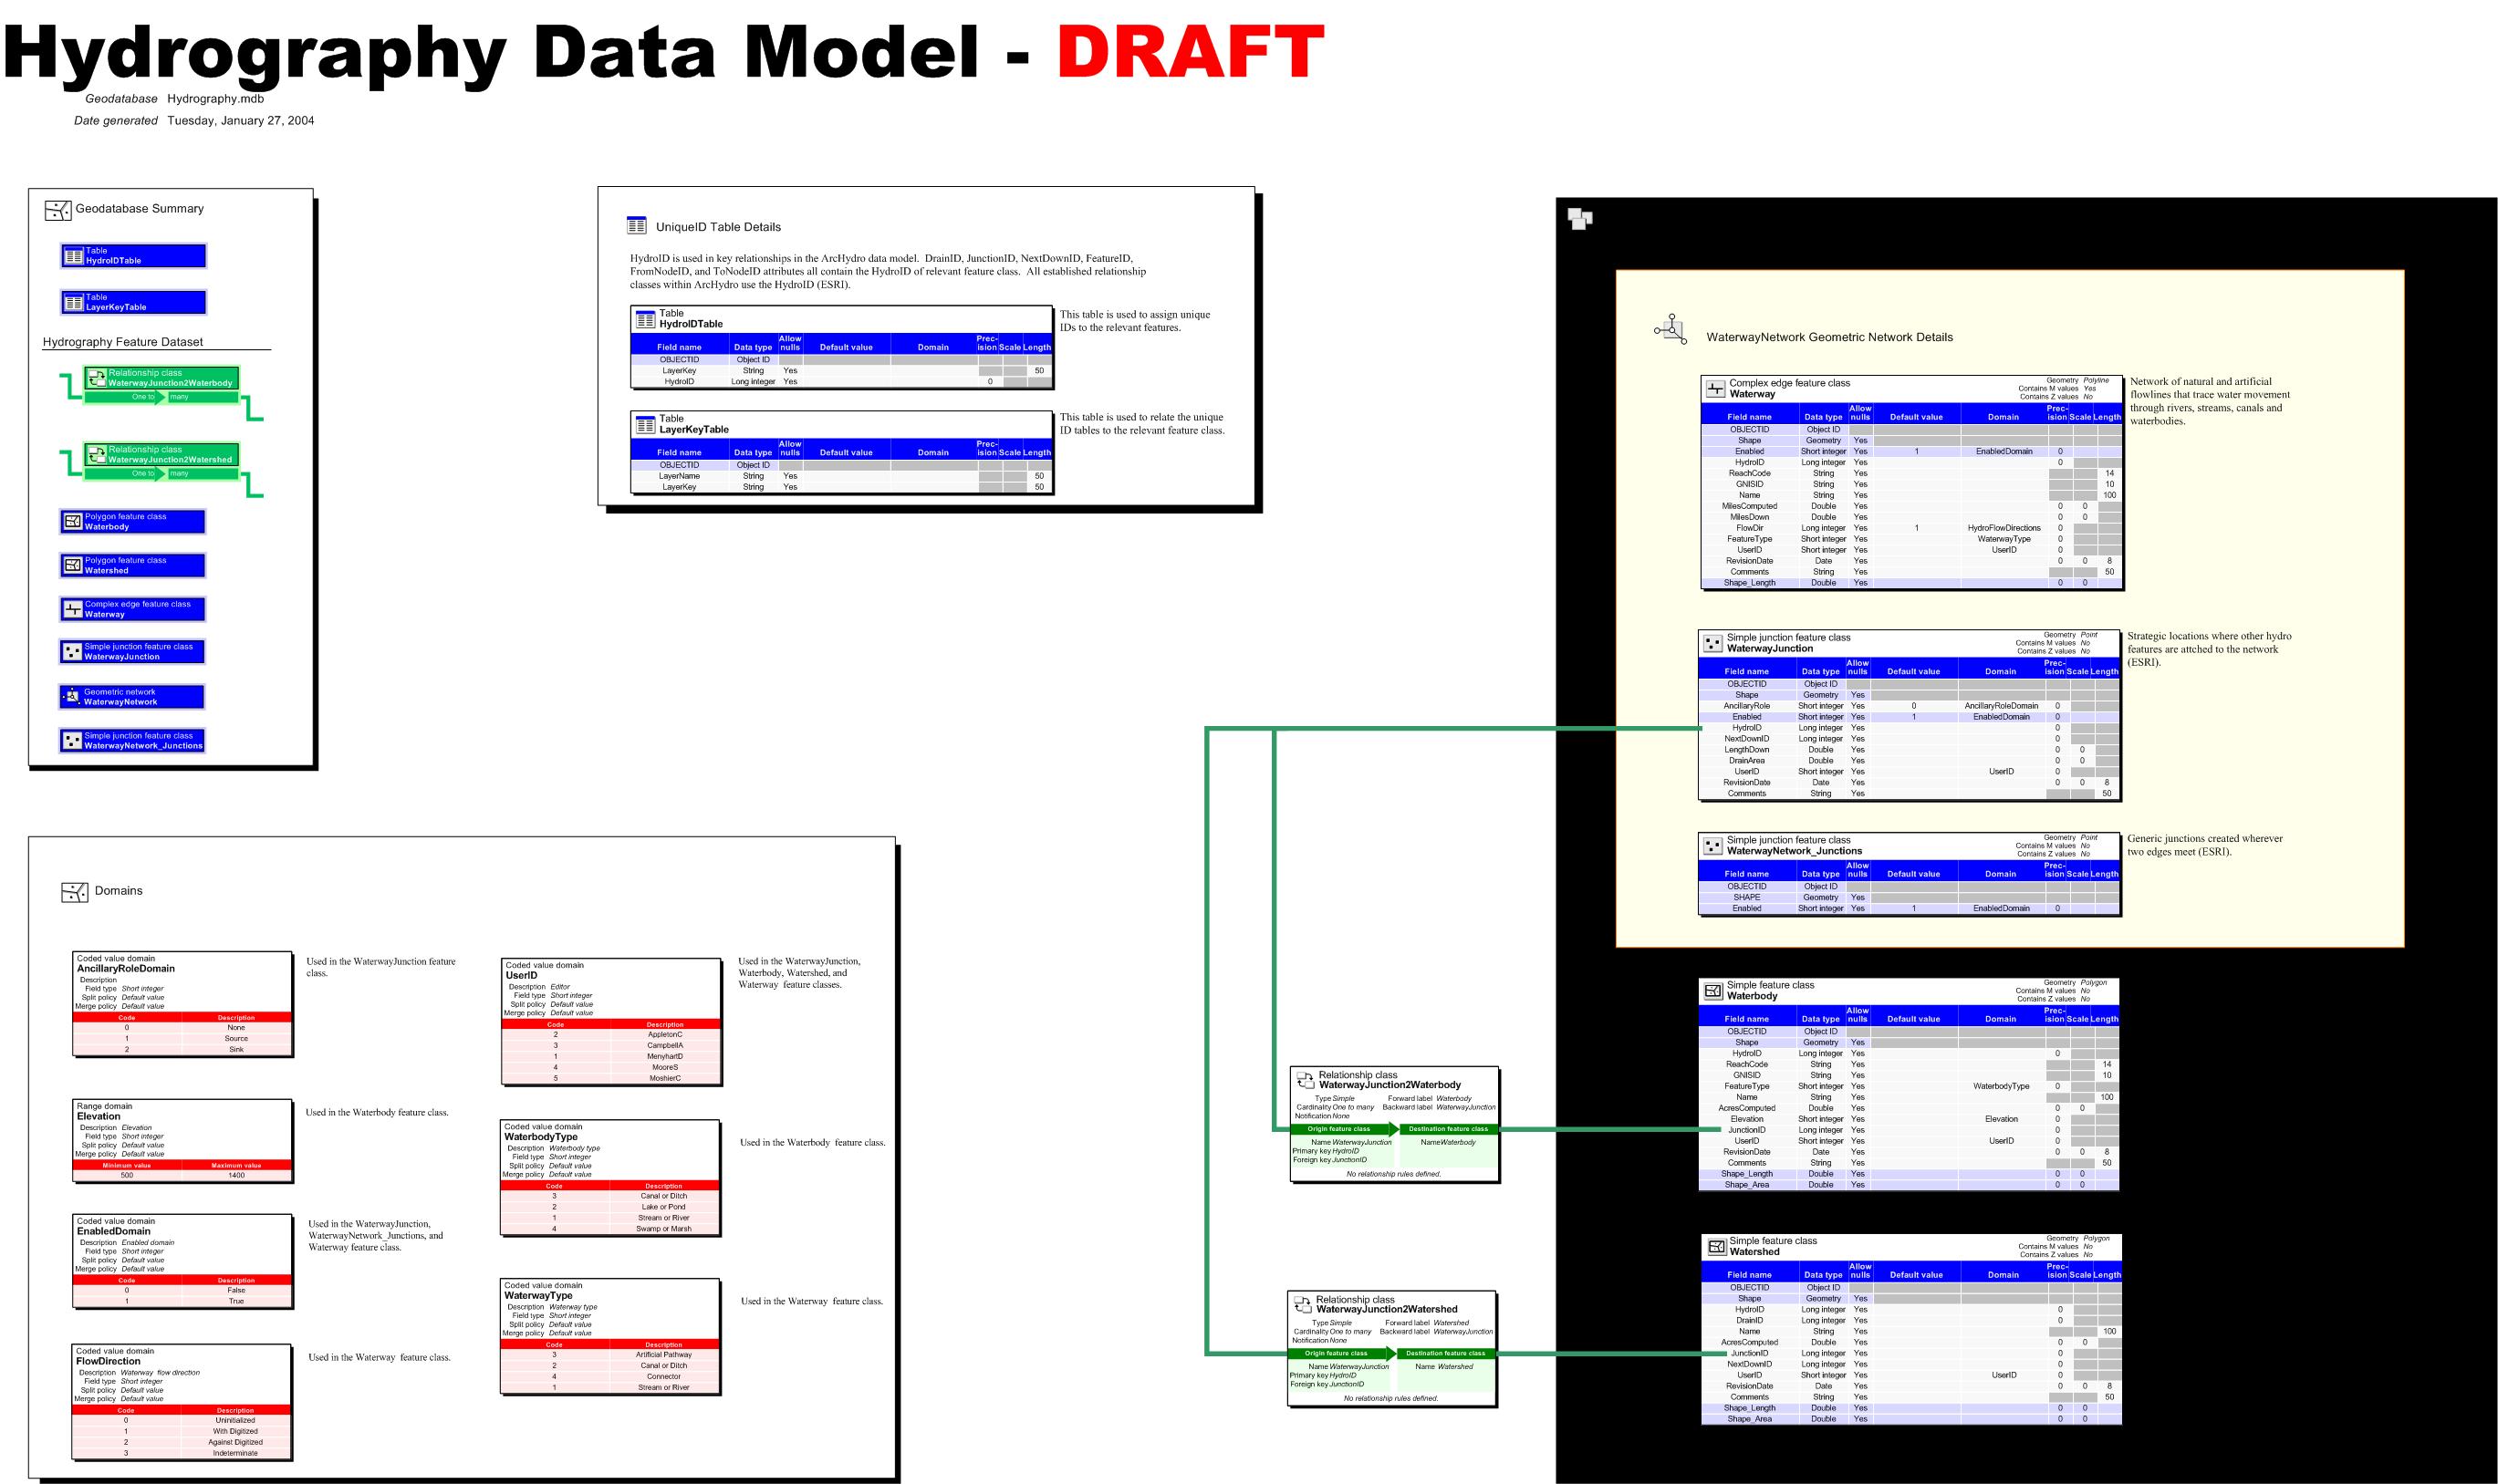
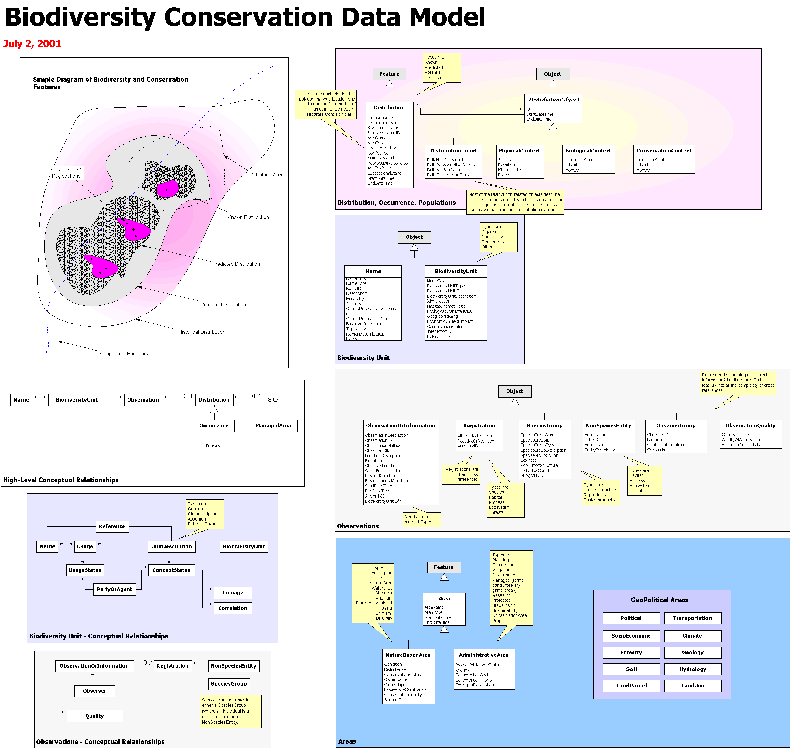
1 MAU stands for Minimal Administrative Unit. This is the smallest institutional administrative authority. In Chad and Niger the MAU is the Canton, Arrondissement in Cameroon and District in Nigeria, Sus-prefecture in CAR.