


Global International
Waters Assessment
Regional assessments
Other reports in this series:
Caribbean Sea/Small Islands ş GIWA Regional assessment 3a
Caribbean Islands ş GIWA Regional assessment 4
Barents Sea ş GIWA Regional assessment 11
Baltic Sea ş GIWA Regional assessment 17
Caspian Sea ş GIWA Regional assessment 23
Gulf of California/Colorado River Basin ş GIWA Regional assessment 27
Patagonian Shelf ş GIWA Regional assessment 38
Brazil Current ş GIWA Regional assessment 39
Amazon Basin ş GIWA Regional assessment 40b
Guinea Current ş GIWA Regional assessment 42
Lake Chad Basin ş GIWA Regional assessment 43
Indian Ocean Islands ş GIWA Regional assessment 45b
East African Rift Valley Lakes ş GIWA Regional assessment 47
Indonesian Seas ş GIWA Regional assessment 57
Pacifi c Islands ş GIWA Regional assessment 62
Global International
Waters Assessment
Regional assessment 54
South China Sea
GIWA report production
Series editor: Ulla Li Zweifel
Editorial assistance: Johanna Egerup, Monique Stolte
Maps & GIS: Rasmus G÷ransson
Design & graphics: Joakim Palmqvist
Global International Waters Assessment
South China Sea, GIWA Regional assessment 54
Published by the University of Kalmar on behalf of
United Nations Environment Programme
ę 2005 United Nations Environment Programme
ISSN 1651-940X
University of Kalmar
SE-391 82 Kalmar
Sweden
United Nations Environment Programme
PO Box 30552,
Nairobi, Kenya
This publication may be reproduced in whole or in part and
in any form for educational or non-profi t purposes without
special permission from the copyright holder, provided
acknowledgement of the source is made. No use of this
publication may be made for resale or for any other commercial
purpose whatsoever without prior permission in writing from the
United Nations Environment Programme.
CITATIONS
When citing this report, please use:
UNEP, 2005. Wilkinson, C., DeVantier, L., Talaue-McManus, L.,
Lawrence, D. and D. Souter. South China Sea, GIWA Regional
assessment 54. University of Kalmar, Kalmar, Sweden.
DISCLAIMER
The views expressed in this publication are those of the authors
and do not necessarily refl ect those of UNEP. The designations
employed and the presentations do not imply the expressions
of any opinion whatsoever on the part of UNEP or cooperating
agencies concerning the legal status of any country, territory,
city or areas or its authority, or concerning the delimitation of its
frontiers or boundaries.
This publication has been peer-reviewed and the information
herein is believed to be reliable, but the publisher does not
warrant its completeness or accuracy.
Printed and bound in Kalmar, Sweden, by Sunds Tryck Íland AB.
Contents
Executive summary
9
Abbreviations and acronyms
12
Regional defi nition
14
Boundaries of the region
14
Physical characteristics
15
Socio-economic characteristics
20
Assessment 26
Freshwater shortage
26
Pollution
31
Habitat and community modifi cation
35
Unsustainable exploitation of fi sh and other living resources
40
Global change
44
Priority concerns for further analysis
46
Causal chain analysis
48
Environmental and socio-economic impacts
49
Immediate causes
49
Root causes
51
Conclusions
54
Policy options
55
Defi nition of the problem
55
Construction of the policy options
56
Policy defi ciencies and needs
56
Identifi ed policy options
59
Performance of the chosen alternatives
59
References 61
Annexes 65
Annex I List of contributing authors and organisations
65
Annex II Detailed scoring tables
67
Annex III List of important water-related programmes and assessments
70
Annex IV List of institutions that aff ect water use
74
Annex V Criteria for scoring environmental impacts
77
Annex VI The South China Sea Large Marine Ecosystem
78
Annex VII Irrigation, water withdrawal, and drainage development
81
The Global International Waters Assessment
i
The GIWA methodology
vii
CONTENTS
Executive summary
This GIWA report presents the results of Scaling, Scoping, Causal chain
At the time of the assessment, many of the relevant laws and regulations
and Policy options analyses conducted for the GIWA region 54 South
were not well accepted and there was little eff ective implementation.
China Sea region in 2001-2002. The South China Sea region contains
This was compounded by insuffi
cient capacity for eff ective alleviation,
nine nations; China, Vietnam, Cambodia, Thailand, Malaysia, Singapore,
which was, in part, related to currency depreciation, shifts in government
Indonesia, Brunei and the Philippines. This Large Marine Ecosystem
spending and diffi
culties in establishing strong multilateral support for
and its catchments are bounded to the west by the Mekong River
large-scale interventions.
(GIWA region 55), north by East China Sea (GIWA region 36), east by
the Sulu-Celebes (Sulawesi) Sea (GIWA region 56) and Small Island
Total pressures are likely to increase moderately to 2020, being driven
States (GIWA region 62), and south and southeast by Indonesian Seas
by the continued population growth. This is expected to cause
(GIWA region 57). The assessment determined that the most severe
signifi cant deterioration in environmental and most socio-economic
environmental issues facing the South China Sea include:
aspects of international waters in the South China Sea region.
Suspended solids resulting from deforestation and agriculture in
The rate of deterioration will be contingent upon the success of
hundreds of watersheds;
improved regulation and ongoing and future planned interventions.
Habitat loss and modifi cation, through massive deforestation and
Priority concerns for the future are the same as those for the present,
associated siltation, conversion to agriculture and other land uses
Unsustainable exploitation of fi sh and Habitat and community
(freshwater, coastal and estuarine habitats) and destructive fi shing
modifi cation.
practices (coastal, estuarine and marine habitats);
Overexploitation and destructive fi shing practices.
The Causal chain and Policy options analyses focused on the linkages
between habitat loss and unsustainable exploitation, particularly the
Priority environmental and socio-economic concerns are Unsustainable
environmental and socio-economic impacts, causes and policy options
exploitation of fi sh and Habitat loss and modifi cation. Pollution and
of overfi shing and destructive fi shing practices. Environmental and
Freshwater shortage are of secondary environmental and socio-economic
socio-economic impacts are as follows:
concern, with Global change presently of tertiary importance.
Loss and fragmentation of mangrove forests from development,
including massive conversion for aquaculture;
The present human population of the region is approximately
Loss and fragmentation of coral reefs from coastal development,
350 million, and future scenarios suggest an overall human population
sedimentation and destructive fi shing;
increase of approximately 2% per year. There is expected to be
Loss and fragmentation of seagrass areas;
increasing urbanisation and reliance on extractive industries (mining,
Reclamation of wetlands for urbanisation, industry and
plantation agriculture, forestry and industrial fi shing), although there
agriculture;
will be considerable variation in sectoral changes among the nations.
Confl icts among villagers and outside fi shers;
There is already widespread overexploitation and use of inappropriate
Injuries
to
fi
shers;
technologies, raising serious concerns as to even the medium-term
Changes to market prices.
sustainability of the production systems.
EXECUTIVE SUMMARY
9
The following immediate causes are identifi ed in the analysis:
Ongoing and expanded community education programmes;
Urbanisation
and
industrial
development;
Improved options for the generation of alternative income/
Expansion of mining activities with coastal run-off ;
ecologically sustainable livelihoods for the burgeoning poor
Deforestation of old growth forests for settlement and
coastal populations, particularly among the fi sheries sector;
agriculture;
National and international surveillance strategies, with
Expansion of fi sheries, including the use of destructive methods,
participation from all levels of government, IGOs, NGOs, and local
and development of aquaculture.
communities;
Much-improved enforcement supported by stronger legal
The identifi ed root causes behind habitat modifi cation and overfi shing
penalties;
in the South China Sea are:
Improved transparency in governance and policing, with stronger
Economic:
anti-corruption legislation and enforcement.
- Economic
growth;
- Overcapitalisation;
This framework is crucial in bridging the gaps between policy
- Foreign
aid;
formulation, development of legislation and enforcement of
- Market
demand;
regulations. Five recommendations and eleven strategic actions
- Export pressures for forest products - building materials;
relevant to implementing immediate interventions are proposed.
- Export pressures for fi sheries products, aquarium trade and
alien species.
Policy recommendations include the development or expansion of:
Political:
Bio-physical (biodiversity) and socio-economic research focused
- Military infl uence.
on improving management eff ectiveness and effi
ciency;
Demographic:
Functional, integrated networks of marine protected areas founded
- Overpopulation, particularly among poor coastal communities;
on the above research and with strong co-management focus;
- Urban migration;
Sustainable
livelihoods;
- Poverty and limited access to alternative livelihoods.
Information, education and communication networks;
Knowledge:
Institution and capacity-building, including establishment of inter-
- Perpetuation of environmentally damaging traditional
governmental mechanisms.
practices;
- Lack of awareness of environmental change.
Key strategic actions include:
Governance:
Prioritisation of key data and information required for developing
- Lack of political will;
and refi ning policy, legislation and interventions;
- Poor
governance;
Building or expansion of partnerships at local, provincial, national
- Inadequate
regulation;
and multilateral levels, in governments, IGOs, NGOs, and the private
- Multilateral/inter-sectoral
disputes.
sector, in research and development and implementation;
Ensuring equitability and ecological and economic sustainability
The policy option analysis was greatly complicated by the complex
in future resource exploitation, including protection of intellectual
interaction of national and regional jurisdictions and the diff erent
property and traditional knowledge;
socio-cultural and religious beliefs, including widely diff ering views on
Gathering responsible fi
sheries authorities together with
family planning. There are also many transboundary issues that remain
expertise from national and international academic and research
unresolved due to the aftermath of regional confl icts, colonial heritage
institutions to adequately assess the state of fi sheries in territorial
and international political affi
liations. In this regard, the implementation
waters;
of improved policy can only succeed with the following support
Developing regional agreements on providing MPAs within territorial
structure in place:
waters to help ease the pressure on sites that are heavily overfi shed;
Consolidation of national laws and multilateral agreements to
Developing national coastal management plans to underpin
encompass all sectors;
these regional MPA agreements (even if MPAs will remain elusive
Improved coordination in management across sectors and levels
for contested areas);
of governance (local/provincial/national/multilateral);
10
GIWA REGIONAL ASSESSMENT 54 SOUTH CHINA SEA
Promoting a united call to establish a regional database and
monitoring that allows for periodic assessments of key coastal
ecosystems;
Banning further conversion of wetlands, estuaries and mangroves
into man-made facilities;
Establishing protocols to assist national environment ministries
to determine carrying capacities of estuaries for extensive and
intensive aquaculture facilities (e.g. through SEAFDEC);
Providing concrete mechanisms to engage IRRI and FAO to provide
organic farming protocols for adoption by small-scale farmers and
multi-national food companies to address impacts caused by
nutrient loading from agriculture;
Identifying low-cost sanitation technologies, to address domestic
sewage inputs, that can be maintained and established in both
rural and urban settings (e.g. through the Water Group of the World
and Asian Development Banks).
Initial steps towards implementing some of these policy
recommendations and strategic actions are already under way,
with a World Bank/GEF International Waters project currently being
implemented in the region. A `critical mass' of expertise and a
framework for change are developing, involving science, policy, private
sector and government, but there is a need to better integrate water-
related sectors in policy planning and legislation. In particular, the key
linkages among food security, poverty, natural resources, environment
pressures, market forces and governance need to be addressed.
Development and population policies in some countries require
urgent review if growth over the next several decades is to be
managed eff ectively and the present rapid rate of increase of impacts
is to be curbed. There is misallocation of signifi cant amounts of local
and international funds, and better allocation and use of government
funds and continuing international assistance are urgently required to
redress these spiraling impacts. The rapidly changing global situation
will cause changes in funding priorities, requiring more effi
cient
allocation of funds to work towards improving future scenarios. Given
that the region, with its neighbours Sulu-Celebes (Sulawesi) Sea and
Indonesian Seas, lies at the global centre of biodiversity, these fi ndings
are of critical international signifi cance.
EXECUTIVE SUMMARY
11
Abbreviations and acronyms
ADB
Asian Development Bank
MARPOL International Convention on Prevention of Marine Pollution
ANWRA ASEAN Network of Water Resources Agencies
MOH
Ministry of Health
ASCMS
ASEAN Subcommittee on Marine Science
MPA
Marine Protected Area
ASEAN
Association of Southeast Asian Nations
MSY
Maximum Sustainable Yield
ASOEN
ASEAN Senior Offi
cials on Environment
MWR
Ministry of Water Resources
BRS
Bureau of Research and Standards
NWRB
National Water Resources Board
BSWM
Bureau of Soils and Water Management
MWSS
Metropolitan Waterworks and Sewerage System
BOD
Biochemical Oxygen Demand
NEA
National Electrifi cation Administration
CBD
Conservation on Biological Diversity
NIS
National Irrigation System
CCA
Causal Chain Analysis
NPC
National Power Corporation
CITES
Convention on International Trade in Endangered Species
NIA
National Irrigation Administration
COBSEA Coordinating Body on the Seas of East Asia
NWRC
National Water Resources Committee
COMAR Project on Research and Training on Integrated Management
OECD
Organisation for Economic Co-operation and Development
of Coastal Systems
PAGASA Philippine Atmospheric, Geophysical and Astronomical
COMEMIS Coastal Marine Environment Management Information System
Services
Administration
CPUE
Catch Per Unit Eff ort
PEMSEA Partnerships in Environmental Management for the Seas of
DGWRD Directorate General of Water Resources Development
East
Asia
DID
Department of Irrigation and Drainage
PMO
Project Management Offi
ce
DOE
Department of Environment
PWD
Public Works Department
DPWH
Department of Public Works and Highways
RID
Royal Irrigation Department
EEZ
Exclusive Economic Zone
SEAPOL Southeast Asian Programme in Ocean Law, Policy and
EGAT
Electricity Generating Authority of Thailand
Management
ENSO
El Ni˝o Southern Oscillation
Sida
Swedish International Development Cooperation
FAO
Food and Agriculture Organization of the United Nations
SPAE
ASEAN Strategic Plan of Action on the Environment
FMB
Forest Management Bureau
SST
Sea Surface Temperature
GEF
Global Environment Facility
SWIM
Small Water Impounding Management
GCRMN Global Coral Reef Monitoring Network
ROAP
Regional Offi
ce for Asia and the Pacifi c
ICLARM International Centre for Living Aquatic Resources Management
TDA
Transboundary Diagnostic Analysis
IUCN
World Conservation Union
UNCLOS United Nations Convention on the Law of the Sea
IUU
Illegal, Unreported and Unregulated
UNDP
United Nations Development Programme
LME
Large Marine Ecosystem
UNEP
United Nations Environment Programme
LWUA
Local Water Utilities Administration
UNFCCC United Nations Framework Convention on Climate Change
MARD
Ministry of Agriculture and Rural Development
WHO
World Health Organization
12
GIWA REGIONAL ASSESSMENT 54 SOUTH CHINA SEA
List of figures
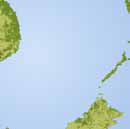
Figure 1
Boundaries of the South China Sea region. . . . . . . . . . . . . . . . . . . . . . . . . . . . . . . . . . . . . . . . . . . . . . . . . . . . . . . . . . . . . . . . . . . . . . . . . . . . . . . . . . . . . . . . . . . . . . . . . . . . . . . . . . . . . . . . . . . . . . 14
Figure 2
Marine life. . . . . . . . . . . . . . . . . . . . . . . . . . . . . . . . . . . . . . . . . . . . . . . . . . . . . . . . . . . . . . . . . . . . . . . . . . . . . . . . . . . . . . . . . . . . . . . . . . . . . . . . . . . . . . . . . . . . . . . . . . . . . . . . . . . . . . . . . . . . . . . . . . . . . . 19
Figure 3
Exclusive economic zones and territorial seas of the South China Sea region. . . . . . . . . . . . . . . . . . . . . . . . . . . . . . . . . . . . . . . . . . . . . . . . . . . . . . . . . . . . . . . . . . . . . . . . . . . . . . . . . . . 20
Figure 4
Population density in the South China Sea region. . . . . . . . . . . . . . . . . . . . . . . . . . . . . . . . . . . . . . . . . . . . . . . . . . . . . . . . . . . . . . . . . . . . . . . . . . . . . . . . . . . . . . . . . . . . . . . . . . . . . . . . . . . . . . . 21
Figure 5
Recently established prawn aquaculture ponds north of Merang, Malaysia. . . . . . . . . . . . . . . . . . . . . . . . . . . . . . . . . . . . . . . . . . . . . . . . . . . . . . . . . . . . . . . . . . . . . . . . . . . . . . . . . . . . 22
Figure 6
Original forest in the South China Sea region. . . . . . . . . . . . . . . . . . . . . . . . . . . . . . . . . . . . . . . . . . . . . . . . . . . . . . . . . . . . . . . . . . . . . . . . . . . . . . . . . . . . . . . . . . . . . . . . . . . . . . . . . . . . . . . . . . 23
Figure 7
Development along Pasig River, Manila, Philippines. . . . . . . . . . . . . . . . . . . . . . . . . . . . . . . . . . . . . . . . . . . . . . . . . . . . . . . . . . . . . . . . . . . . . . . . . . . . . . . . . . . . . . . . . . . . . . . . . . . . . . . . . . . . 31
Figure 8
Major shipping lanes in the South China Sea region.. . . . . . . . . . . . . . . . . . . . . . . . . . . . . . . . . . . . . . . . . . . . . . . . . . . . . . . . . . . . . . . . . . . . . . . . . . . . . . . . . . . . . . . . . . . . . . . . . . . . . . . . . . . 33
Figure 9
Newly excavated aquaculture ponds north of Merang, Malaysia. . . . . . . . . . . . . . . . . . . . . . . . . . . . . . . . . . . . . . . . . . . . . . . . . . . . . . . . . . . . . . . . . . . . . . . . . . . . . . . . . . . . . . . . . . . . . . 35
Figure 10
Coastal development near a mangrove estuary, Singapore. . . . . . . . . . . . . . . . . . . . . . . . . . . . . . . . . . . . . . . . . . . . . . . . . . . . . . . . . . . . . . . . . . . . . . . . . . . . . . . . . . . . . . . . . . . . . . . . . . . . 36
Figure 11
Reefs at risk in the South China Sea region. . . . . . . . . . . . . . . . . . . . . . . . . . . . . . . . . . . . . . . . . . . . . . . . . . . . . . . . . . . . . . . . . . . . . . . . . . . . . . . . . . . . . . . . . . . . . . . . . . . . . . . . . . . . . . . . . . . . . 37
Figure 12
Coral reefs. . . . . . . . . . . . . . . . . . . . . . . . . . . . . . . . . . . . . . . . . . . . . . . . . . . . . . . . . . . . . . . . . . . . . . . . . . . . . . . . . . . . . . . . . . . . . . . . . . . . . . . . . . . . . . . . . . . . . . . . . . . . . . . . . . . . . . . . . . . . . . . . . . . . . 38
Figure 13
International and national protected areas in the South China Sea region. . . . . . . . . . . . . . . . . . . . . . . . . . . . . . . . . . . . . . . . . . . . . . . . . . . . . . . . . . . . . . . . . . . . . . . . . . . . . . . . . . . . . 39
Figure 14
Catches in the South China Sea LME by country. . . . . . . . . . . . . . . . . . . . . . . . . . . . . . . . . . . . . . . . . . . . . . . . . . . . . . . . . . . . . . . . . . . . . . . . . . . . . . . . . . . . . . . . . . . . . . . . . . . . . . . . . . . . . . . . 41
Figure 15
Fish trap off the coast of Sharp Island, Hong Kong.. . . . . . . . . . . . . . . . . . . . . . . . . . . . . . . . . . . . . . . . . . . . . . . . . . . . . . . . . . . . . . . . . . . . . . . . . . . . . . . . . . . . . . . . . . . . . . . . . . . . . . . . . . . . . 42
Figure 16
Fish pens in Manila Bay, Philippines.. . . . . . . . . . . . . . . . . . . . . . . . . . . . . . . . . . . . . . . . . . . . . . . . . . . . . . . . . . . . . . . . . . . . . . . . . . . . . . . . . . . . . . . . . . . . . . . . . . . . . . . . . . . . . . . . . . . . . . . . . . . 43
Figure 17
Typhoon Imbudo over the South China Sea, 23 July 2003.. . . . . . . . . . . . . . . . . . . . . . . . . . . . . . . . . . . . . . . . . . . . . . . . . . . . . . . . . . . . . . . . . . . . . . . . . . . . . . . . . . . . . . . . . . . . . . . . . . . . . . 45
Figure 18
Causal chain diagram illustrating the causal links for Habitat and community modification and
Unsustainable exploitation of living resources in the South China Sea region. . . . . . . . . . . . . . . . . . . . . . . . . . . . . . . . . . . . . . . . . . . . . . . . . . . . . . . . . . . . . . . . . . . . . . . . . . . . . . . . . . 48
Figure 19
Islands and fringing reefs near Singapore showing a golf course and road development. . . . . . . . . . . . . . . . . . . . . . . . . . . . . . . . . . . . . . . . . . . . . . . . . . . . . . . . . . . . . . . . . . . . . . . 50
Figure 20
Damaged corals, North of Pulau Gut, Malaysia. . . . . . . . . . . . . . . . . . . . . . . . . . . . . . . . . . . . . . . . . . . . . . . . . . . . . . . . . . . . . . . . . . . . . . . . . . . . . . . . . . . . . . . . . . . . . . . . . . . . . . . . . . . . . . . . 51
Figure 21
Pulau Redang Marine Park Center, Malaysia. . . . . . . . . . . . . . . . . . . . . . . . . . . . . . . . . . . . . . . . . . . . . . . . . . . . . . . . . . . . . . . . . . . . . . . . . . . . . . . . . . . . . . . . . . . . . . . . . . . . . . . . . . . . . . . . . . . 57
Figure 22
School of silverside (Atherinomorus sp.) near surface, Cagar Hutang, Redang Island, Malaysia.. . . . . . . . . . . . . . . . . . . . . . . . . . . . . . . . . . . . . . . . . . . . . . . . . . . . . . . . . . . . . . . . 58
List of tables
Table 1
Population characterstics in the South China Sea region. . . . . . . . . . . . . . . . . . . . . . . . . . . . . . . . . . . . . . . . . . . . . . . . . . . . . . . . . . . . . . . . . . . . . . . . . . . . . . . . . . . . . . . . . . . . . . . . . . . . . . . . 21
Table 2
Economic data in the South China Sea region. . . . . . . . . . . . . . . . . . . . . . . . . . . . . . . . . . . . . . . . . . . . . . . . . . . . . . . . . . . . . . . . . . . . . . . . . . . . . . . . . . . . . . . . . . . . . . . . . . . . . . . . . . . . . . . . . . . 21
Table 3
Agriculture characteristics in the South China Sea region. . . . . . . . . . . . . . . . . . . . . . . . . . . . . . . . . . . . . . . . . . . . . . . . . . . . . . . . . . . . . . . . . . . . . . . . . . . . . . . . . . . . . . . . . . . . . . . . . . . . . . 23
Table 4
Scoring table for the South China Sea region. . . . . . . . . . . . . . . . . . . . . . . . . . . . . . . . . . . . . . . . . . . . . . . . . . . . . . . . . . . . . . . . . . . . . . . . . . . . . . . . . . . . . . . . . . . . . . . . . . . . . . . . . . . . . . . . . . . 26
Table 5
Water-borne diseases in some countries of the region. . . . . . . . . . . . . . . . . . . . . . . . . . . . . . . . . . . . . . . . . . . . . . . . . . . . . . . . . . . . . . . . . . . . . . . . . . . . . . . . . . . . . . . . . . . . . . . . . . . . . . . . . . 28
Table 6
Access to improved water sources in the region. . . . . . . . . . . . . . . . . . . . . . . . . . . . . . . . . . . . . . . . . . . . . . . . . . . . . . . . . . . . . . . . . . . . . . . . . . . . . . . . . . . . . . . . . . . . . . . . . . . . . . . . . . . . . . . . 29
Table 7
Emissions of organic water pollutants in the South China Sea region.. . . . . . . . . . . . . . . . . . . . . . . . . . . . . . . . . . . . . . . . . . . . . . . . . . . . . . . . . . . . . . . . . . . . . . . . . . . . . . . . . . . . . . . . . . 32
List of boxes
Box 1
Transboundary environmental issues in the South China Sea region. . . . . . . . . . . . . . . . . . . . . . . . . . . . . . . . . . . . . . . . . . . . . . . . . . . . . . . . . . . . . . . . . . . . . . . . . . . . . . . . . . . . . . . . . . . 25
Box 2
Projects in the South China Sea region.. . . . . . . . . . . . . . . . . . . . . . . . . . . . . . . . . . . . . . . . . . . . . . . . . . . . . . . . . . . . . . . . . . . . . . . . . . . . . . . . . . . . . . . . . . . . . . . . . . . . . . . . . . . . . . . . . . . . . . . . 25
Box 3
Marine Protected Areas in Southeast Asia. . . . . . . . . . . . . . . . . . . . . . . . . . . . . . . . . . . . . . . . . . . . . . . . . . . . . . . . . . . . . . . . . . . . . . . . . . . . . . . . . . . . . . . . . . . . . . . . . . . . . . . . . . . . . . . . . . . . . . 40
Box 4
The South China Sea Large Marine Ecosystem.. . . . . . . . . . . . . . . . . . . . . . . . . . . . . . . . . . . . . . . . . . . . . . . . . . . . . . . . . . . . . . . . . . . . . . . . . . . . . . . . . . . . . . . . . . . . . . . . . . . . . . . . . . . . . . . . . 41
Box 5
Overexploitation in the South China Sea region. . . . . . . . . . . . . . . . . . . . . . . . . . . . . . . . . . . . . . . . . . . . . . . . . . . . . . . . . . . . . . . . . . . . . . . . . . . . . . . . . . . . . . . . . . . . . . . . . . . . . . . . . . . . . . . . 41
Box 6
Fisheries status and prognosis for South China Sea. . . . . . . . . . . . . . . . . . . . . . . . . . . . . . . . . . . . . . . . . . . . . . . . . . . . . . . . . . . . . . . . . . . . . . . . . . . . . . . . . . . . . . . . . . . . . . . . . . . . . . . . . . . . 44
Box 7
Transboundary disputes in the South China Sea region. . . . . . . . . . . . . . . . . . . . . . . . . . . . . . . . . . . . . . . . . . . . . . . . . . . . . . . . . . . . . . . . . . . . . . . . . . . . . . . . . . . . . . . . . . . . . . . . . . . . . . . . 49
Box 8
Committments to multilateral programmes. . . . . . . . . . . . . . . . . . . . . . . . . . . . . . . . . . . . . . . . . . . . . . . . . . . . . . . . . . . . . . . . . . . . . . . . . . . . . . . . . . . . . . . . . . . . . . . . . . . . . . . . . . . . . . . . . . . 53
Box 9
Approaches to managing the South China Sea.. . . . . . . . . . . . . . . . . . . . . . . . . . . . . . . . . . . . . . . . . . . . . . . . . . . . . . . . . . . . . . . . . . . . . . . . . . . . . . . . . . . . . . . . . . . . . . . . . . . . . . . . . . . . . . . . 56
ABBREVIATIONS AND ACRONYMS
13

Regional defi nition
This section describes the boundaries
Elevation/
and the main physical and socio-
Depth (m)
economic characteristics of the region
4 000
2 000
China
in order to defi ne the area considered
1 000
in the regional GIWA Assessment
500
Bei
100
Xun Xi
and to provide suffi
cient background
0
Red
-50
Macau
information to establish the context
-200
Hanoi
within which the assessment was
-1 000
Haiphong
-2 000
conducted.
G U L F O F
TO N K I N
Laos
Lingayen
Gulf
Thailand
Boundaries of the
Paracel Islands
Mae
Kh
Ch
Philippines
lon
region
ao Ph
Manila
g
Manila Bay
r
Bangkok aya
The GIWA region 54 South China Sea is
Cambodia
Vietnam
bounded on its eastern extent by the Sulu-
Sulawesi Sea (GIWA region 56) and Pacifi c
Mek
ng Nai
ong
Do
Spratly Islands
Ho Chi Minh
Islands (GIWA region 62), southern and
G U L F O F T H A I L A N D
southeastern extent by the Indonesian
Seas (GIWA region 57), northern extent by
East China Sea (GIWA region 36) and part
of its western extent by the Mekong River
n
lanta
(GIWA region 55). The region is formed
Ke
nu
ga
Treng
Brunei
of the marine, coastal and hinterland
Bar
am
Kuala Lumpur
river catchments of nine nations: China,
Pahang
Malaysia
Vietnam, Cambodia, Thailand, Malaysia,
Rajang
ka
Se
w
Ba
rib
Singapore, Indonesia, Brunei and the
Singapore
ta
a
r
a
n
s
g Lu
Sa
par
Philippines. Laos and Myanmar are also part
Indonesia
Kapuas
of the region but have no impacts on the
Indragiri
-Hari
water balance and are therefore not further
Tembesi
0
1 000 Kilometres
discussed. Figure 1 shows the boundaries
ę GIWA 2005
of the region.
Figure 1
Boundaries of the South China Sea region.
14
A review of the regional boundaries indicated that a minor revision of
Climate
the original boundaries was required. The original GIWA boundaries
Most of the region lies within the tropical and equatorial zones (from
were generally compatible with oceanographic conditions, and
near the Equator to ~22░ N). In much of the region there are two seasons,
also with catchment and river drainage in the region. A slight
the dry season and the wet season, as the climate is governed by the
modifi cation of the land boundary on Borneo was required to
regime of the northeast and southwest monsoons. The northeast
include the catchment of the Baram River, while Taiwan is included in
monsoon blows from October to March in much of the region, and
the adjacent East China Sea region. The modifi ed boundaries match
is responsible for the heavy rains that frequently cause widespread
reasonably with those adopted by UNEP's Transboundary Diagnostic
fl oods (e.g. in Borneo). The southwest monsoon occurs between May
Analysis (TDA) (Talaue-McManus 2000), with the exclusion from the
and September, and is a drier period. The period between these two
present analysis of the Indonesian Island of Java and part of South
monsoons is often marked by heavy rainfall. The temperature usually
Kalimantan (both of which have been included in the GIWA region 57
ranges from 21░ to 33░C, but at higher altitudes the climate is cooler.
Indonesian Seas). Within the South China Sea Large Marine Ecosystem
The average temperature throughout the year in many areas is very
(LME), species genetic diversity and oceanographic considerations
stable (26░C). Annual minimum temperatures are usually greater than
suggest three ecoregions:
10░C other than in the highlands and inland areas of Vietnam and China,
The northern area (Chinese catchments and coastal waters to the
where cooler winter temperatures can prevail.
north of Vietnam);
The southwestern area (Vietnam, Cambodia, Thailand, Malaysia,
Rainfall in the region is highest on the upland and some coastal areas.
Singapore, Sumatra catchments and coastal waters);
These areas receive more than 3 000 mm of rain annually. Some parts of
The southeastern area (Borneo, Western Philippines and Spratly
the lowlands, coastal areas and other areas in rain-shadows receive far
Islands).
less rain (<1 000 mm/year), and may experience severe water shortages.
However, annual rainfall is usually in excess of 1 000 mm in most areas.
The delineation of precise boundaries of the ecoregions vary within the
Regional variations in temperature and rainfall are mainly due to relief.
region, in relation to the specifi c life histories and dispersal patterns of
Humidity is usually between 60 and 80%, due to the high evaporation
diff erent groups of organisms, and in this assessment, the region has
rate (FAO AQUASTAT 2003).
been considered as a single international waters system.
The northern and central parts of the region are aff ected by tropical
storms (typhoons) during the southwest monsoon months, bringing
intense rains and destructive winds to coastal areas. Passing from the
Physical characteristics
Pacifi c into the South China Sea through the Philippines Archipelago,
typhoons can deliver in excess of 1 000 mm of rain in less than one
Most of the region, extending east to the island of Borneo, lies on the
week, causing extensive fl ooding and loss of life in worst aff ected areas.
Asian continental shelf and is physically stable. The coastal area includes
The region is particularly sensitive to ENSO (El Ni˝o Southern Oscillation)
low-lying areas composed of sandy beaches and dune systems, mud
fl uctuations, notably the major events of the 1990s, which caused
fl ats, swamps and marshes, seagrass beds and mangroves and lake
signifi cant changes in rainfall patterns (e.g. in Indonesia and Malaysia),
systems, to gravel/rocky coasts. Fringing coral reefs are developed in
and also contributed to major forest fi res, which, in turn, had regional
areas away from major rivers or areas of terrestrial run-off . Inland from
climate and environmental eff ects (e.g. smoke haze and associated air
the coast, large coastal plains have developed, particularly around
pollution in Indonesia, Singapore and Malaysia).
the major river systems, with the hinterland being predominantly
mountainous. Much of the land area was originally covered by tropical
Rivers of the region
forest, however, substantial deforestation has taken place during recent
There are approximately 125 major rivers in the South China Sea region,
centuries and continuing logging is further reducing the original forest
draining 2.5 million km2. The major basins include:
cover. Fertile lowlands and hill areas have been extensively developed
Kampar, Indragiri and Tembesi-Hari rivers (Sumatra);
for rice production, as paddy fi elds and upland terraces. Lowland areas
Pahang, Trengganu and Kelantan rivers (Peninsular Malaysia);
and river fl ood-plains also support mixed agriculture.
Batang Lupar, Sarawak and Seribas rivers (South Sarawak);
Kapuas
River
(West
Kalimantan);
Rajang and Baram rivers (Sarawak);
REGIONAL DEFINITION
15
Mae Klong and Chao Phraya rivers (Thailand);
annual run-off is approximately 880 km3 per year, of which only about
Mekong, Red and Dong Nai rivers (Vietnam);
40% originates from within the country. The remaining 60% of the
Xun Xi and Bei rivers (Pearl River estuary - China).
total fl ow in Vietnam originates outside the country. For example, over
90% of the Mekong River Basin lies outside Vietnam. Half of the Red
There are numerous smaller rivers and streams fl owing from the
River Basin, about 40% of the Ma and Ca basins and 15% of the Dong
mountainous interior of parts of the region. The Mekong River also fl ows
Nai Basin area lie outside the country. The contribution of Cambodia
into the South China Sea, and in the context of GIWA, provides major
(Mekong and Dong Nai rivers), China (Red River) and Laos (Ca and Ma
transboundary considerations. However, this river basin is assessed
rivers) to total run-off is estimated at 471.5 km3/year, 44.1 km3/year and
separately in GIWA regional assessment 55, Mekong River.
9.1 km3/year respectively (FAO AQUASTAT 2003).
Water resources
The distribution of water resources in Vietnam during the year is highly
For more information on irrigation, drainage development and water
variable due to unevenly distributed monsoon rainfalls. High variations
withdrawal in the region, see Annex VIII.
combined with limited storage and fl ood control infrastructure result
in devastating fl oods in the wet season and extreme low fl ows in the
China
dry season. About 70-75% of the annual run-off is generated in three
Overall, the average annual river run-off generated in China is 2 711 km3
to four months.
of which 1 724.3 km3 discharge into the sea and 719 km3 fl ow into
neighbouring countries (FAO AQUASTAT 2003). Although China has
There are two natural lakes in Vietnam; Lake Ho-Tay with a surface area of
several transboundary rivers that fl ow into neighbouring countries,
4.13 km2 and a volume of 8 million m3; and Lake Ba Be with a surface area
those that infl uence the South China Sea region are the Yuanjiang,
of 4.5 km2 and a volume of 90 million m3 (FAO AQUASTAT 2003). There
Lixianjiang, Panlongjiang, which become the Red River when they reach
are approximately 3 500 small and 650 large and medium reservoirs
Vietnam. The average annual groundwater resources for the whole of
in the country. These reservoirs are multipurpose; hydropower, fl ood
China are estimated at 829 km3. In addition, China has about 2 300 lakes
control, navigation, irrigation and fi sheries. Hydropower generates 70%
(excluding seasonal ones) with a total storage capacity of 710 km3 and,
of the electricity in Vietnam.
at the end of 1995, China also had the capacity to store 480 km3 of water
in 84 800 artifi cial reservoirs. The majority of this water (~349 km3) is
The groundwater recharge in Vietnam is estimated at 48 km3/year
stored within a few (~ 400) large reservoirs (FAO AQUASTAT 2003).
(FAO AQUASTAT 2003). Over 50% of these resources are in the central
part, about 40% in the north and 10% in the south. A large amount of
Vietnam
water is stored in unconsolidated alluvial sand and gravel geological
Vietnam has 16 river basins larger than 2 000 km2, nine of which have
formations found in plains and valleys. A substantial part of these
a catchment area that exceeds 10 000 km2 (Bang-Ky Cung, Red River/
resources (estimated at 35 km3/year) returns to the rivers as base fl ow.
Thai Binh, Ma, Ca, Thu Bon, Ba, Dong Nai and the Mekong Delta (part
The exploitable reserves (the volumes of fl ows of satisfactory quality
of GIWA region 55 Mekong River)). Other basins are either small in area
which can be extracted economically given the present technology) are
(the Tien Yen and Muc) or have several small rivers grouped together
estimated at about 6-7 km3/year, and total renewable water resources
such as the Giang/Huong, Tra Khuc and Cai-Luy. The nine major basins
are estimated at 891 km3/year.
occupy 80% of Vietnam's area and 70% of its water resources (FAO
AQUASTAT 2003). The largest basins in Vietnam are the Mekong and
Thailand
Red River/Thai Binh basins, covering half of the country's territory. Six
Thailand has seven major river basins with a total surface water
major rivers cross international boundaries: Bang-Ky Cung and Red
availability of 199 km3/year. Aquifer recharge from rainfall is estimated
Rivers which are shared with China; Ma and Ca River which cross from
at 42 km3/year (about 5-6% of the total precipitation), of which
Laos; and Dong Nai and Mekong Rivers which cross the Cambodian
approximately 73% is estimated to return to the river system. The
border.
total renewable water resources are estimated at approximately
410 km3/year. The Mekong River, which forms the northern and eastern
Vietnam has abundant surface water resources in terms of total run-off .
border with the Laos and was assessed separately as GIWA region 55,
The Red and Mekong Rivers carry 75%, while each of the other basins
is Thailand's only transboundary river that infl uences the South China
carries 1-3% of the water resources (FAO AQUASTAT 2003). The mean
Sea signifi cantly.
16
The total dam capacity in the country is estimated at 85 km3, which
The total dam capacity in 1995 was 4 753 million m3, consisting of about
is about 43% of the annual run-off . However, a lot of dams have been
54 small dams (for a total capacity of 80 million m3) and six large dams.
overdesigned compared with the annual recharge obtainable (FAO
The two largest dams, Magat and Pantabangan which have a total
AQUASTAT 2003). There are four categories of dams in Thailand:
capacity of 3 196 million m3,, are managed by the National Irrigation
Large dams with a hydropower component are built by the Electricity
Administration (NIA). The National Power Corporation (NPC) manages
Generating Authority of Thailand (EGAT), the Royal Irrigation
three other large dams, Angat, Ambuklao and Palangui IV which have
Department (RID) or the Department of Energy Development and
a total capacity of 1 426 million m3, while the Metropolitan Waterworks
Promotion and managed by the EGAT. Hydropower generation is
and Sewerage System manages the sixth large dam, La Mesa, which
important in Thailand as its 21 hydropower plants account for 18%
holds 51 million m3. Most small dams in the Philippines have been
of installed capacity and 5% of energy production. However, all
created with various objectives within the framework of the small water
these dams are multipurpose dams, and the irrigation component
impounding management (SWIM) projects, which are implemented by
receives priority over the other components.
several agencies.
Large dams with no hydropower component, and therefore mainly
destined for irrigation, are operated by the RID. Their total capacity
There are four major groundwater reservoirs in the country; Cagayan
was estimated at 31.4 km3 in 1995.
10 000 km2, Central Luzon 9 000 km2, Agusan 8 500 km2 and Cotobato
Small dams, which cost about 200 000 USD, are developed by the
6 000 km2. Private wells are extensively used in rural areas for domestic
Offi
ce of Accelerated Rural Development under the Ministry of
purposes. Municipal waterworks wells are drilled by the Local Water
Interior, mainly for irrigation, livestock and domestic purposes.
Utilities Administration for domestic purposes and deep wells have
Small dams of around 100 000 m3 each, developed by the Land
been drilled by the NIA for irrigation purposes. The groundwater
Development Department of the Ministry of Agriculture and
resources are estimated at 180 km3/year, of which 80% (145 km3/year)
Co-operatives. They cost about 120 000 USD each and are used
constitute the base fl ow of the river systems (FAO AQUASTAT 2003).
for agricultural and domestic purposes. Their total capacity
is estimated at 0.1 km3. Each year, about 200 such dams are
Malaysia
constructed or rehabilitated.
The Malaysian Peninsula is drained by a dense network of rivers and
streams, the longest being the Pahang River which follows a course
Philippines
of 434 km before reaching the South China Sea, draining a catchment
In the Philippines, rivers are an important means of transportation
area of 29 000 km2. Other major rivers that also drain into the South
and a valuable source of water for irrigation for the fi elds and farms
China Sea are the Kelantan, Terengganu, Dungun, Endau and Sedili
through which they pass. The main river basins in the Philippines part
rivers. Major river basins in the east of Malaysia tend to be larger than
of the region are the Cagayan River Basin in north Luzon (25 470 km2),
those on the Malaysian Peninsula. Malaysia's longest river is the Rajang
the Pampanga River Basin (9 760 km2) near Manila in Luzon island, and
River (563 km) in Sarawak. Major fl oods have occurred in 1967, 1971,
the Agno River Basin (5 950 km2) in Luzon Island. The country's annual
1973 and 1983 and some 29 000 km2 of the country are considered
average run-off is estimated at 444 km3 and, in nine years out of ten,
fl ood-prone, aff ecting about 2.7 million people (FAO AQUASTAT 2003).
the annual run-off exceeds 257 km3. The total internal water resources
In 1980, the average annual economic damage caused by fl oods was
amount to 479 km3/year (FAO AQUASTAT 2003).
estimated at 40 million USD. Malaysia has two large dams located in
the region. In 1995, the total hydropower generation in Malaysia was
The Philippines National Water Resources Council has divided the country
about 5 800 GWh, or 30% of all power production in Malaysia (FAO
into 12 water resources regions in order to have manageable units for
AQUASTAT 2003).
comprehensive planning of water resources. Major considerations taken
into account in this regionalisation were the hydrological boundaries
Indonesia
defi ned by physiographic features and homogeneity in climate of the
Indonesia has over 5 590 rivers, although the vast majority are in
diff erent parts of the country. However, in fact, these water resources
GIWA region 57 Indonesian Seas and are not considered within this
regions generally correspond to the existing political regions in the
assessment. Although water resources are abundant, the seasonal
country. Minor deviations dictated by hydrography have aff ected only
and spatial variation in the rainfall pattern and lack of adequate
northern Luzon and northern Mindanao.
storage create competition and confl icts among users. The annual
renewable water resources are estimated to be about 2 800 km3
REGIONAL DEFINITION
17
(FAO AQUASTAT 2003). Most of the lakes in Indonesia are of volcanic
Brunei has two dams with a total storage capacity of 45 million m3
origin. Lake Toba is the largest volcanic lake in the world with an average
(FAO AQUASTAT 2003). At present, no hydropower dams have been
surface area of 1 100 km2 and an average volume of 1 260 km3. In 1995,
constructed, although one suitable site has been located within the
the large dam capacity was 15.8 km3. In 1991, the total installed power
National Forest Reserve of Temburong. Limited reserves of groundwater
capacity was 2 061 MW and hydropower accounted for 16.3% of the
have been identifi ed in the Sungai Liang and Seria areas of the Belait
electricity generated. Indonesia's groundwater resources are estimated
district and in the Berakas area of the Brunei-Muara district. The
at 455 km3/year, although about 90% returns as base fl ow to the rivers.
estimated safe yield is 17.3 million m3/year (FAO AQUASTAT 2003).
Therefore, the groundwater potential in Indonesia is limited and can
meet only part of the urban and rural needs for water supply, while
Marine characteristics
providing irrigation water for very limited areas.
Large Marine Ecosystems
The South China Sea is recognised as a Large Marine Ecosystem (LME)
Cambodia
with specifi c characteristics of oceanography, biogeography and
Cambodia has an unique hydrological system. The Mekong River and
ecology (see also Annex VII). Much of the southern half of the South
Lake Tonle Sap are connected by the Tonle Sap River which twice a year
China Sea lies on the Sunda Shelf and its coastal waters are shallow
reverses its direction of fl ow. Approximately 85% of Cambodia's territory
(<200 m deep) and infl uenced by both marine and river/terrestrial
(156 000 km2) is included in the Mekong River Basin, the remaining 15%
inputs. Further north, the South China Sea Basin and Palawan Trough are
draining directly towards the Gulf of Thailand. The internal renewable
much deeper (>1 000 m) and are bounded by the shallower continental
surface water resources are 116 km3. The capacity of the existing dams
margins and shelves of China, Vietnam, Cambodia, Thailand, Malaysia,
is very low and has not been estimated. Only one small dam (Ochum, in
Indonesia and the Philippines. The major gulfs and bays are the Gulf of
the northeastern province of Ratanakiri) is used as a hydropower station
Thailand, Gulf of Tonkin, Lingayen Gulf and Manila Bay.
with an installed capacity of 1 MW (FAO AQUASTAT 2003). The Kirirom
power plant, which was installed in 1968 in Kompong Speu province
The South China Sea is considered a semi-enclosed sea by the UN
with a capacity of 10 MW, has not been in operation since 1970 due to
Convention on the Law of the Sea (UNCLOS): "A gulf, basin or sea
war damage. A number of dams with high storage capacity are planned
surrounded by two or more States and connected to another sea or
for the near future. Groundwater resources are estimated at 17.6 km3, of
the ocean by a narrow outlet or consisting entirely or primarily of the
which about 74% is drained by rivers and thus cannot be considered
territorial seas and exclusive economic zones of two or more coastal
as additional water resources. The quality of groundwater is generally
States" (Article 122 UNCLOS 1982).
satisfactory, although high iron concentrations and increased salinity
levels have been encountered in some provinces such as Svay Rieng,
Oceanography
Prey Veng and Takeo.
Major oceanographic currents include those generated by the seasonal
monsoons:
Brunei
West fl owing current around West Kalimantan;
There are four main river basins in Brunei; Temburong, Belait, Tutong and
North fl owing current between West Kalimantan and the Malaysia
Brunei. The Temburong, the smallest of the rivers, drains a catchment
Peninsula bifurcating into the Gulf of Thailand and South China Sea
area of about 430 km2. The Belait River has the largest catchment, with
and fl owing north to the east of Vietnam with a gyre developed
an area of 2 700 km2. The lower catchment comprises an extensive area
to the east of central Vietnam, and northeast from east of Hainan
of peat swamp forest. The river narrows at the town of Kuala Belait
towards Taiwan;
and a sandbar restricts the discharge of water to the South China Sea.
Upwelling areas of northwestern Philippines and off Vietnam.
Some areas in the upper catchment have been cleared for agriculture.
The Tutong River Basin, which is about 1 300 km2, has a complex
Waters from the South China Sea may also fl ow seasonally into the Sulu
estuary system formed between two sand spits. Subject to fairly high
Sea and Java Sea, contributing to the Indonesian through-fl ow (Bate 1999).
tidal infl uence, its lower catchment is mainly fl oodplain. The upper
Local current patterns form complex eddies and counter-currents.
catchment is jungle with patches of agriculture. The Brunei River fl ows
into Brunei Bay. The upper reaches of the River are a major freshwater
Coastal and marine habitats and biodiversity
source particularly for the western part of the country.
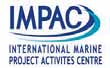
The South China Sea region lies within the global centre of biodiversity
for marine species, with for example more than 2 500 species of marine
18
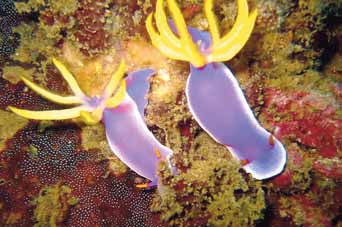


fi shes and 500 species of reef-building corals
present (Figure 2) (Chou 1997, Veron 2000). The
region also supports some of the world's most
diverse mangrove forests and seagrass beds.
River mouths and estuaries, and much of the
protected coastlines, were originally fringed by
mangrove forests and seagrass beds. However,
extensive cutting for timber, conversion for
aquaculture, other forms of coastal development
and sedimentation have caused major
fragmentation and reduction in the area of these
habitats (Talaue-McManus 2000). Only one-third
of the original mangrove forests remain, while
seagrass beds have been reduced or degraded
by 20-50% through increased sediments,
nutrients and destructive fi shing.
The coast under the immediate infl uence of
the major river systems is mostly devoid of
fringing coral reefs, although small fringing and
patch reefs are present in some places. Fringing
reefs are well developed away from the major
river estuaries, particularly in the Philippines
and the central-southern areas of the region.
All major reef types: fringing, patch, platforms
(including barrier) and atolls occur, with a total
estimated reef area of the order of 10 000 km2
(based on aggregation and de-aggregation
of national statistics) (Spalding et al. 2001).
Off shore, a number of large platform reefs and
atolls exist, most notably the Spratly Islands,
Tung-Sha (Dongsha Qundao) Reefs and Paracel
Islands. These reefs are enormously diverse, play
Figure 2
Marine life: Upper: Branching Acropora and damselfi shes. Lower left:
key roles in maintenance and replenishment of
Nudibranch (Chromodoris bulloscki). Centre: Orange cup coral (Tubastraea
regional biodiversity, and may be particularly
coccinea). Lower right: Yellow pygmy seahorse (Hippocampus denise).
important in replenishment of harvested species
(Photo: B. Huzaimi ReefBase, W. Greiner ICRIN, C. Stearns ICRIN)
(McManus 1994, Talaue-McManus pers. comm.).
The territorial jurisdictions of the diff erent reef complexes and individual
exhibit transboundary migratory behaviour, making them particularly
reefs are disputed among several nations, notably China, Philippines,
vulnerable to threats and providing major challenges for conservation
Vietnam, Malaysia and Brunei, with episodic armed clashes among navy
management.
and fi shermen from the diff erent countries.
International waters
Six species of marine turtles, all considered either endangered or
The South China Sea is one of the world's most contentious areas in
vulnerable by the World Conservation Union (IUCN) occur, as does the
relation to international waters, with signifi cant territorial disputes
dugong (Dugong dugon) and many other species of marine mammal
among neighbouring countries, particularly relating to access to
also included on IUCN's Red List of Threatened Animals. Many of these
fi sheries and minerals. In the sense of this assessment, international
REGIONAL DEFINITION
19
Convention on the Law of the Sea III (UNCLOS) that all littoral states
can demand an Exclusive Economic Zone (EEZ) of 200 nautical miles
measured from the coastline. This provision has caused a number of
China
disputes over maritime delimitation. . In the area around the Spratlys,
Myanmar
Vietnam
six of seven states, depending on whether Taiwan is considered a state,
have made overlapping claims to ocean space. And, since the sea also
Laos
includes four island groups - the Paracels, Pratas, the Macclesfi eld Bank
Philippines
Paracel
and Scarborough Reef - the territorial disputes have become extremely
Islands
Thailand
complex. Some of the states have even used arms to prevent other
Cambodia
nations from occupying islands or reefs".
Spratly
Islands
Thus, the South China Sea provides a crucial test case for the resolution
of international waters disputes, being highly resource-rich, of global
importance to biodiversity, and surrounded by emerging nations with
Brunei
burgeoning coastal populations.
Malaysia
The Malacca and Singapore Straits carry approximately one-quarter
Singapore
Indonesia
of the world's commerce and half of the world's oil. Indonesia,
Territorial Sea
Malaysia and Singapore have begun tri-lateral coordinated patrols to
Disputed Economic Zone
ę GIWA 2005
Undisputed Economic Zone
bolster maritime security, partly in response to International Maritime
Figure 3
Exclusive economic zones and territorial seas of the
Organization initiatives to catalyse international cooperation on the
South China Sea region.
security of vital shipping lanes. A regional consensus has been made
(Source: GMBD 2003)
on the basis of three principles: (i) the primary role of the littoral
states; (ii) the important role of other stakeholders; (iii) and the need
waters include all coastal and marine waters, major ports and river
for consultation and to proceed in accordance with international law
systems, as these are all potential sources or recipients of transboundary
(Hean pers. comm.).
impacts. These impacts arise primarily from shipping, fi sheries (with
both legal and illegal foreign fi shing eff ort), migratory species (e.g.
larval dispersal and movement of pelagic fi shes, turtles and marine
mammals), pollution and riverine discharges, and the passive transport
Socio-economic characteristics
of waters and organisms in ocean currents.
Population
The South China Sea is also an area of great multilateral importance,
The region's human population is represented by a diverse mix of
being one of the world's busiest sea-lanes, and a source of potential
ethnic groups of nine nations, some forming ancestral tribal groups
confl ict. There have been signifi cant territorial disputes among nations
(e.g. in China, Thailand, Vietnam, Malaysia and Indonesia), others of more
over sovereignty of the Spratly Islands and other off shore resources
recent arrival (e.g. Indian traders). Within the broad ethnic groups, there
(Christy 1980, Catley & Keliat 1997, Castro 1998, Naess 1999) (Figure 3).
are substantial cultural diff erences and various forms of religious belief,
As pointed out by Naess (1999): "The South China Sea is the maritime
principally Christianity, Islam and Buddhism. The Philippines is mostly
heart of a region binding southern China to Southeast Asia. The sea is
Christian. Indonesia, Malaysia and Brunei are mostly Islamic. Thailand
of great importance economically, politically and environmentally to
and Cambodia are mostly Buddhist, while Vietnam and China have
surrounding nations: China and Taiwan, the Philippines, Vietnam, Brunei
diverse mixes of Buddhism, Taoism, Christianity and other religions.
Darussalam, Malaysia, Indonesia, Cambodia, Singapore and Thailand.
There is a broad acceptance of diff erent religious viewpoints in most
The sea is known to most policy-analysts as an area where China and
parts of the region, although racial, cultural and religious tensions have
Taiwan stand against their Southeast Asian neighbours in an unresolved
been building in some areas in recent times, concomitant with the
sovereignty confl ict over the Spratly Islands. The increased tensions in
economic diffi
culties of the late 1990s.
the South China Sea stem from the provision in the 1982 United Nations
20
Table 1
Population characterstics in the South China Sea region.
(>10 million in total, Vietnam), Bangkok (>5 million, Thailand), Kuala
Population
Population density
Lumpur (>5 million, Malaysia), Singapore (>2 million), and Brunei
Population
(inhab./km2)
Country
Total
GIWA region
Rural
growth (%)
(<1 million). Outside the cities, coastal population densities are highest
(million)
(million)
(%)
Average
Highest
Lowest
in Vietnam (Gulf of Tonkin >500 persons km2), and China and Philippines
Brunei
0.36
0.36
42
1.4
52
ND
ND
(470 persons/km2) (Figure 4).
Cambodia
13.4
1
79
1.6
57
4
236
China
1 290
200
70
0.7
129
670a
10
For the larger South China Sea LME, some 270 million people (5% of the
Indonesia
214
10
63
1.3
105
800
77
world's population) are present in coastal areas, and this population is
Malaysia
24.8
12
46
1.9
63
ND
ND
expected to double in the next three decades (LME 2004). Populations
Philippines
81.5
30
45
1.9
231
348b
47
are increasing between 1-5% annually (see Table 1), with an overall
Thailand
62.0
40
80
0.7
114
ND
ND
average increase of ~2.2% per year (Talaue-McManus 2000). Population
growth is highest in coastal areas of Cambodia, Indonesia and Malaysia.
Vietnam
81.3
60
79
1.1
227
1 085
115
Note: ND = No Data, aShanghai 2 042 inhab./km2, bMetropolitan Manila 13 000 inhab./km2.
Parts of the region (e.g. Malaysian Sabah) are experiencing substantial
(Source: World Bank 2004, FAO AQUASTAT 2003)
immigration, of the order of 4% annually, mainly from Indonesia and
the Philippines (WWF 2001).
The total population in the region in estimated at 350 million (Table 1).
The urban population is distributed in some 100 cities with local
Economic activities
populations of more than 100 000. Outside the cities, the population
The region spans the full gamut of economic activities, from subsistence
is distributed in thousands of villages spread along the coast, across
agriculture and artisanal fi sheries to light and heavy manufacturing and
the lowlands and into the highlands. The larger urban centres in
high technology industries, being composed of several of the `Asian Tiger'
the region include Manila (>10 million, Philippines), Hong Kong/
economies. The Southeast Asian region, along with East Asia, is particularly
Macao (~10 million, China), Hanoi, Haiphong and Ho Chi Minh cities
dynamic with the most rapidly expanding economies of any part of the
world, especially during the last three decades (Wilkinson et al. In press).
The region is referred to as `emerging' as opposed to `developing' (Fryer
1979), as it is progressively adjusting to the market economies of the
China
North. The region is extremely heterogeneous and includes some of
the poorest countries of the world (Cambodia, Laos, Myanmar, Vietnam)
alongside extremely wealthy countries like Singapore and Brunei.
Laos
Recent GDP growth (1996-2000) has been very low in Thailand (0.6%),
Myanmar
but high in Cambodia (6.3%) and Vietnam (7.0%) as these economies
Vietnam
Philippines
recover from the economic `meltdown' of the mid-1990s (Table 2).
Thailand
Cambodia
Table 2
Economic data in the South China Sea region.
GDP growth
GDP growth
Tertiary gross
GNP per capita
Country
2001
1996-2000
enrolment ratio
(USD)
(%)
(%)
(%)
Brunei
18 000
1.5
2.83
12
Population
density
Cambodia
260
6.3
6.32
3
Brunei
(persons/km2)
<1
Indonesia
570
3.3
3.52
14
Malaysia
1 - 2
Malaysia
3 380
0.4
3.06
28
Singapore
3 -5
Indonesia
6 - 10
Philippines
1 040
3.2
3.64
31
11 - 100
Singapore
24 740
-2.0
6.66
45
>100
ę GIWA 2005
Thailand
2 000
1.8
0.60
35
Figure 4
Population density in the South China Sea region.
Vietnam
390
6.0
6.98
11
(Source: ORNL 2003)
(Source: Rosen 2002, Asian Development Bank 2003, Fukuda-Parr 2003, World Bank 2004)
REGIONAL DEFINITION
21
The region can be considered as an entity because of its cultural, social
GIWA regional boundaries for South China Sea (see GIWA region 57
and political affi
nities, and its specifi c `East Asian Model' of development
Indonesian Seas). Output and consumption varies among nations in
through the Association of Southeast Asian Nations (ASEAN), which
relation to degree of industrialisation. For example, Cambodia has a
was established in 1967. Similar structural components of agriculture,
high reliance on agriculture (45% of GDP), less on industry (20% of GDP),
international trade and tourism provide the major economic benefi ts
whereas in Indonesia 57% of GDP is derived from the industry sector
for the ASEAN countries. Most of the ASEAN countries are part of the
(mostly concentrated in Java). Overall, the annual rate of increase in
70 countries that develop active relationships with the Organisation
output is of the order of 5%.
for Economic Co-operation and Development (OECD) through its
Centre for Cooperation with non-members. They participate at OECD
In terms of per capita GNI (Gross National Income, formerly GNP), the
meetings such as Forums for Asian Insolvency Reform or Roundtables
city-states of Brunei and Singapore are highest, followed by Malaysia,
for Corporate Governance.
Thailand, Philippines, Indonesia, Vietnam and Cambodia (Talaue-
McManus 2000). In general, there has been increasing output from
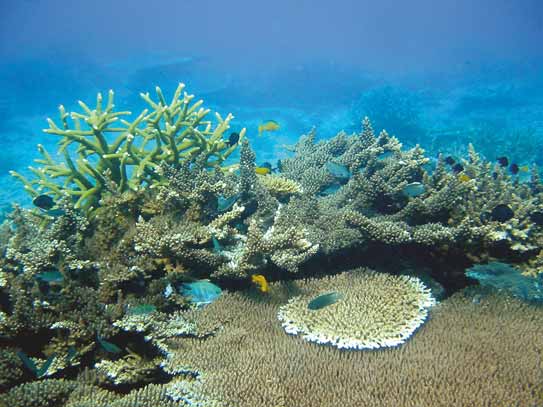
The sectoral composition and contribution to GDP varies widely
agriculture, fi sheries/aquaculture (net exporters) (Figure 5), plantations,
among the nations in the region. In terms of industrialisation,
forestry, mining, manufacturing.
Singapore, Malaysia, Brunei and Indonesia are ranked ahead of China,
Thailand, Philippines, Vietnam and Cambodia (Talaue-McManus 2000),
Subsistence farming and fi shing are the major activities for a large
although much of Indonesia's industrial output is in Java, outside the
number of people outside of the main urban and industrial centres.
Figure 5
Recently established prawn aquaculture ponds north of Merang, Malaysia.
(Photo: J. Oliver, ReefBase)
22


Philippines, agriculture is the prime mover of the country's economy
and was at the time of the assessment the least import-dependent
China
activity. In Thailand in 1991, the agriculture sector accounted for 11.5%
of GDP and agricultural exports represented 23% of total export
Myanmar
Laos
earnings. In Indonesia, agricultural crop production and livestock
contribute approximately 18% of GDP and provides employment for
Philippines
Paracel Islands
49% of the population. In Malaysia, the contribution of agriculture
Thailand
to GDP declined from 18.7% in 1990 to 13.6% in 1995. In Cambodia,
Cambodia
approximately 73% of the active population is currently engaged in
Vietnam
Spratly Islands
agriculture, and agriculture accounted for 45% of GDP in 1994. In Brunei
and Singapore, agriculture accounts for less than 3% of GDP and the
countries import >80% of food. Agricultural characteristics in the region
are presented in Table 3.
Brunei
Malaysia
Singapore
Table 3
Agriculture characteristics in the South China Sea region.
Indonesia
Contributor to
Country
Employment (%)
Change share in GNI (%)
Original forest
GDP (%)
Present forest
Brunei
3
ND
ND
ND
Figure 6
Original forest in the South China Sea region.
China
20
71
28.4 (1978)
21.2 (1993)
(Source: UNEP/WCMC 2004)
Cambodia
45
73
ND
ND
Indonesia
18
49
ND
ND
Malaysia
13.6
ND
ND
ND
The major export earners include commercial exploitation of natural
Philippines
30
41.5
17 (1988)
17 (1990)
resources, particularly fi sheries, aquaculture, mariculture, oil palm and
Thailand
11.5
55
ND
ND
other forms of plantation agriculture and mining. Since the 1980s, there
Vietnam
34
69
ND
ND
have been major increases in aquaculture (notably Tilapia in lakes and
Note: ND = No Data.
inland waters) and mariculture (shrimps) in coastal ponds, and also in
(Source: FAO AQUASTAT 2003)
supplying the live fi sh trade to Hong Kong, China and Japan. At present,
mariculture is largely dependent on wild stocks, although hatcheries
Fisheries
are being developed. Forestry is also a major industry although large
Fisheries in the South China Sea are of great local, national and
areas of the loggable forests have already been exploited or are now
international importance, being a major contributor to both food and
protected (e.g. Palawan, Philippines) (Figure 6). Secondary industries
income. In total, the South China Sea produces around 5 million tonnes
including resource processing and manufacturing and tertiary
of catch each year, some 10% of the total global catch (LME 2004). Five
industries including electronics are of growing importance.
of the littoral nations are among the top eight shrimp producers
globally, mostly through aquaculture with large-scale consequences
Service industries, including tourism, have also expanded. However,
to habitats and water quality. Domestic fi sheries consumption is highest
the Asian fi nancial crisis of the late 1990s and more recent events
in the Philippines, with increased production required in Cambodia,
(international terrorism, SARS) since 2001 have caused a recent decline
Indonesia and Vietnam to meet increasing domestic demand. Reef
in international tourism. Overall, the eff ects of globalisation on the
fi sheries provide essential sustenance for artisanal fi shermen and
region are not well understood.
their families throughout the region, and also play an important role
in supplying commercial quantities of high value products for export
Agriculture
to expanding international, national, and local markets. Live reef fi sh
In China, the share of agriculture in GNI declined from 28.4% in 1978 to
export operations to Hong Kong and the Chinese mainland have
21.2% in 1993 (FAO AQUASTAT 2003). In Vietnam, agriculture, including
burgeoned since the 1980s (Johannes & Reipen 1995), with removal
forestry and fi sheries, is the largest sector in the economy accounting
of large numbers of demersal coral reef fi shes, mostly through poison
for 34% of GDP and employing 69% of the labour force. The agriculture
fi shing, initially using cyanide but more recently also using locally-
sector grew at an annual rate of 4.2% between 1991 and 1995. In the
produced and inexpensive vegetable poisons.
REGIONAL DEFINITION
23
There are clear indications of overfi shing, with two-thirds of the
a phase of rapid economic development and population growth, have
major fi sh species and several major fi shing grounds already fully or
not accounted for the environmental consequences such as the
overexploited (LME 2004). On reefs throughout the region, there is
degradation of its resources and water quality. Until now, narrow state
widespread use of destructive fi shing methods such as blasting and
interests and power politics have characterised the interaction between
poisons. Benthic trawling also occurs in close proximity to reefs, with
countries, and the infl uence of environmental groups has remained
adverse direct eff ects on reef community structure. Trawl fi shermen
inconsequential. Rapid economic growth has also sharpened confl icts
now target virtually all the catch, and so by-catch and discards are
between the various sectors within governments. This was especially
no longer an issue. Collecting of ornamental reef fi shes and other
true of China in the past decade. Governments of the South China Sea
organisms for the global aquarium market is also widespread and is
region are now coming to see that the marine environment in the
expanding. It has already caused serious damage to reefs in some
region is under threat. Environmental ministries are now in place, and
areas through use of destructive techniques of poison fi shing and/or
environmental laws and regulations are being formulated (LME 2004).
coral breakage. All these fi sheries issues are covered in detail in the
Assessment section below.
The nations are signatory to various international conventions and have
enacted national laws and regulations that are relevant to water-related
Mining and shipping
issues in the region (Annex IV). For example, most nations have ratifi ed
The region is a globally important source of minerals, with considerable
the following conventions:
reserves of oil and gas, which continue to cause international tensions.
Conservation on Biological Diversity (CBD);
Vietnam and China have unresolved overlapping claims that have
Convention on International Trade in Endangered Species (CITES);
delayed exploration of undeveloped oil and gas reserves off Vietnam's
Ramsar
Wetlands
convention;
coast. Similarly, China has disputed Indonesia's sovereignty of the
United Nations Framework Convention on Climate Change
Natura Islands. The South China Sea is the second busiest international
(UNFCCC);
sea-lane, carrying more than half the world's super tanker traffi
c. As an
United Nations Convention on the Law of the Sea (UNCLOS);
example, more than 80% of Japan's oil import comes through the South
International Convention on Prevention of Marine Pollution from
China Sea (Naess 1999).
ships (MARPOL);
World
Heritage
Convention.
Shipping, navigation and transportation all depend on stable
international relations, and states with a will and capacity to repress
Most nations, having now ratifi ed UNCLOS, recognise sovereign rights
piracy (Naess 1999). As the littoral states of the South China Sea are
to the 12 nautical mile limit and have also declared 200 nautical mile
dependent on the sea to export and import goods, and for fi shing,
Exclusive Economic Zone. The Philippines and Indonesia unilaterally use
tourism, and other uses, there is a critical need for regional cooperation
the `Archipelagic Doctrine' to defi ne their territorial waters.
on these issues. Concerns in Malaysia, Singapore and Indonesia for the
environmental security in the highly congested Malacca Strait need to
National government sectors concerned with use of natural resources
be addressed. As one of the world's key throughfares for shipping, it is
have proposed policies or legislation relevant to obligations under
important for both the regional and outside powers to uphold peace,
the various international conventions. However, it is apparent that
safety and stability, so as not to disturb the economies dependent on
despite the ratifi cations, there have been delays in achieving eff ective
the sea lanes passing through1.
implementation and the resolution of related problems. This has
been attributed to the lack of action by the various governments
Legal framework
in addressing their obligations under the conventions. A recently
The South China Sea countries exhibit a wide variety of socio-political
developed `Environmental Strategy for the Seas of East Asia' provides
systems, from constitutional democracies (Malaysia, Philippines,
many pertinent recommendations and solutions to these problems
Indonesia, Singapore), and social-democratic republics (China and
(Chua pers. comm.).
Vietnam) to Sultanates (Brunei). The various national constitutions
provide the legal basis for development of legislature relevant to use
A recent collaborative project between littoral countries of the region
and management of water resources. Seven nations are involved in the
and UNEP, with initial funding from the Global Environment Facility,
governance of the South China Sea LME; Cambodia, China, Indonesia,
produced a comprehensive Transboundary Diagnostic Analysis (TDA),
Malaysia, Philippines, Thailand and Vietnam. The region, in experiencing
a study of issues and problems, and their societal root causes (Talaue-
1Detailed maps of oil and gas fields, shipping lanes and crude oil flows in the South China Sea have recently been declassified and can be obtained from http://cat.middlebury.edu/southchinasea.
24
McManus 2000). This was formulated by UNEP and senior marine
There have been major increases in regional capacity for biodiversity
scientists of the region in the period 1996 to 1998. This TDA was later
assessment, conservation measures and the establishment and
used as a basis for the development of a Strategic Action Programme for
management of protected areas, science and policy over the past several
the South China Sea. In the preparation of these documents, scientists
decades. For example, a critical mass of regional expertise now resides in
and governmental agencies from seven littoral states; Thailand,
inter-government and government agencies, academic institutions and
Malaysia, Cambodia, Indonesia, Vietnam, China and the Philippines,
NGOs. Nevertheless, considerable challenges still remain in engendering
have been involved in making country-specifi c studies that were used
and coordinating government support among nations and across the
as a basis for the transboundary analysis, as well as for the Strategic
diff erent levels; national, state-provincial and local (see Policy options
Action Programme (UNEP 1994, 1997, 1999) (Box 1).
section later, Box 2 and Wilkinson et al. in press).
Box 1
Transboundary environmental issues in the South
Box 2
Projects in the South China Sea region.
China Sea region.
The United Nations Environment Programme has unveiled a regional plan to try
Important transboundary environmental problems of the South China Sea region
to reverse the degradation of the South China Sea by starting nine pilot projects
have been identified by the UNEP in cooperation with the national committees.
for sustainable development at priority transboundary sites in the region. UNEP's
The Transboundary Diagnostic Analysis (TDA) identifies the priorities among water-
Strategic Action Plan for the South China Sea has been endorsed by all ASEAN
related problems and concerns, their socio-economic root causes, the sectoral
members as well as by the People's Republic of China. This is the first time the seven
implications of actions needed to mitigate them and the extent to which the
countries have agreed to collaborate around the marine biology of the region.
problems are transboundary in either origin and effect. The actions proposed in
The Chinese government has asked for help from UNDP to implement integrated
the framework of the Strategic Action Programme are wide ranging in both context
coastal management through the establishment of demonstration zones. This
and proposed areas for action. Successful implementation of the Programme
project was initiated in 1997, with an investment of 1.1 million USD from UNDP, and
will depend upon coordination of actions by diverse organisations, agencies,
2.2 million USD from China.
non-governmental organisations, private sectors, and stakeholder groups at both
Several of the countries have contending claims to large areas of the South China
the national and regional levels. Recognising the mandate of the United Nations
Sea, leading to political tensions among them. The claims are about the status of the
Environment Programme to coordinate environmental action across the United
Paracel Islands and the Spratly Islands, which are said to contain minerals, oil and gas
Nations System, the widest possible range of appropriate partners at national and
resources. In 2001, these Asian nations agreed to set aside their quarrels in order to
regional levels will be encouraged and assisted to participate in the execution of
save the South China Sea, and signed a joint agreement to the UNEP project. They
the Programme. It is the intention of the participating countries that all actions be
will cooperate on a 32 million USD plan to protect the marine environment. The
undertaken in a spirit of collaboration and partnership, to enhance the synergy
Global Environment Facility (GEF) is contributing 16 million USD to this plan. As
between on-going initiatives at national and regional levels, and eliminate
knowledge of environmental hazard is spread through the region, the impetus for
duplicative and conflicting actions.
conflict resolution will grow. GEF funding will secure a comprehensive package of
(Source: UNEP 1994, 1997, 1999)
marine environmental research and projects that will build human and institutional
capacity. Through their concern for the environment the countries of the South
China Sea can be brought closer together as they discover their common heritage
and the importance of the Sea as a source of protein for the growing coastal
populations.
(Source: LME 2004)
REGIONAL DEFINITION
25
Assessment
Table 4
Scoring table for the South China Sea region.
This section presents the results of the assessment of the impacts
Assessment of GIWA concerns and issues according
The arrow indicates the likely
of each of the fi ve predefi ned GIWA concerns i.e. Freshwater
to scoring criteria (see Methodology chapter)
direction of future changes.
T
T
C
C
Increased impact
A
A
shortage, Pollution, Habitat and community modifi cation,
0 No known impacts
2 Moderate
impacts
IMP
IMP
T
T
No changes
C
C
A
A
Unsustainable exploitation of fi sh and other living resources,
1 Slight
impacts
3 Severe
impacts
IMP
IMP
Decreased impact
Global change, and their constituent issues and the priorities
i
t
y
a
l
a
c
t
s
p
n
u
*
*
identifi ed during this process. The evaluation of severity of each
a
c
t
s
South China Sea
ent
p
m
m
i
c
i
m
m
n
i
m
o
Score
issue adheres to a set of predefi ned criteria as provided in the
c
t
s
m
o
c
t
s
r
i
t
y
***
v
i
r
o
n
e
r c
o
a
l
t
h
t
h
erall
r
i
o
chapter describing the GIWA methodology. In this section, the
En
impa
Ec
He
O
impa
Ov
P
scoring of GIWA concerns and issues is presented in Table 4.
Freshwater shortage
2*
2
1
1
1.8
4
Modification of stream flow
2
Pollution of existing supplies
1
The results presented herein are supported wherever possible by
Changes in the water table
2
published data. However, for some of the issues and concerns raised
Pollution
2*
2
2
2
2.0
3
in this analysis, some publications are of a confi dential nature, either in
Microbiological pollution
2
Eutrophication
1
government or `commercial in confi dence' and thus were unavailable
Chemical
2
for inclusion in this report. Geo-political issues and sensitivities
Suspended solids
3
are of particular signifi cance, notably in relation to foreign fi shing,
Solid waste
2
Thermal 1
mineral extraction and related territorial/sovereignty disputes. The
Radionuclide
0
Transboundary Diagnostic Analysis for the South China Sea prepared
Spills
2
for UNEP provides much useful data in support of the present analysis
Habitat and community modification
3*
3
1
3
2.5
2
Loss of ecosystems
3
(Talaue-McManus 2000).
Modification of ecosystems
3
Unsustainable exploitation of fish
3*
3
2
3
2.8
1
Overexploitation
3
Excessive by-catch and discards
3
T
C
A
Destructive fishing practices
3
Freshwater shortage
IMP
Decreased viability of stock
0
Impact on biological and genetic diversity
2
The large range of climates in the region generates a variety of
Global change
1*
1
1
1
1.1
5
hydrological regimes. The South China Sea is host to some of the most
Changes in hydrological cycle
1
Sea level change
0
humid climates (with annual precipitation above 10 000 mm in places)
Increased UV-B radiation
0
giving rise to major rivers, while in other parts it has a very arid climate,
Changes in ocean CO source/sink function
0
2
with closed hydrologic systems (FAO 1999). As a result, the region
Changes in sea surface temperature
1
*
This value represents an average weighted score of the environmental issues associated
shows a very uneven distribution of its water resources and of its water
to the concern.
** This value represents the overall score including environmental, socio-economic and
use conditions. In the humid areas, water management concerns have
likely future impacts.
mostly been dominated by considerations related to fl ood control. In
*** Priority refers to the ranking of GIWA concerns.
26
GIWA REGIONAL ASSESSMENT 54 SOUTH CHINA SEA
the arid areas, where water is scarce, hydrological studies have been
due to low average ground level, high tides and inadequate drainage
oriented much more towards water resources assessment.
(FAO 1999). The Metropolitan Waterworks Authority is unable to supply
water to meet all domestic and industrial demand. As a result, in the
The hydrology of the region is dominated by the typical monsoon
outskirts of Bangkok, private and industrial abstraction of groundwater
climate, which induces large inter-seasonal variations of river fl ows. In
exceeds the safe yield of the aquifer. This accelerates the rate of land
this situation, average annual values of river fl ows are poor indicators of
subsidence (5-10 cm/year), which in turn aggravates the problem of
the water resources available for use. In the absence of fl ow regulation,
fl ooding. Indeed, subsidence has caused some parts of the drainage
most of the water fl ows during a short season when it is usually less
systems to be below the normal water level and has rendered them
needed. A fair estimate of water resources available to a country for
ineff ective. The minimal discharge to maintain a water level of 1.7 m
use should include fi gures of dry season low fl ow. However, such
for navigation (this means 300 m3/s released in the navigation channel
information is available only for a very limited number of countries.
from Nakhon Sawan to the Chao Phraya Dam, and 80 m3/s downstream
In view of the hydrological regime of the rivers in the region, run-
of the dam) cannot be maintained due to large amounts of water
off in Southeast Asia and the islands is not signifi cantly aff ected by
diverted from the rivers for dry season irrigation in the northern and
withdrawals, while the diff erence between natural and actual fl ow may
central regions. This reduced the volume of inland waterway transport
be much more important in the arid regions (mostly China).
fi ve-fold between 1978 and 1990. The volumes of water released by
the Bhumipol and Sirikit dams are increasingly important to prevent
In terms of shared water resources, the region is characterised on
saltwater intrusion, even if they do not meet the navigation demand
the one hand by a series of insular, archipelagic countries among
(FAO 1999).
which no exchange is possible, and on the other hand by a littoral
zone in which shared river basins play a critical role and make the
Pollution of existing supplies
computation of water resources relatively complex. In several cases,
Pollution of existing supplies has caused slight environmental impact
large inconsistencies were noted when comparing the fl ow at the
across the region as a whole, but with moderate to severe localised
border recorded by neighbouring countries. Indeed, compilation
impacts. Fish kills from various chemical inputs have been reported,
of information on water resources shows large methodological
and rivers close to urban centres in all countries (e.g. Bangkok, Thailand;
discrepancies between countries.
Haiphong, Hanoi and Ho Chi Minh City, Vietnam; Manila, Philippines;
Hong Kong, China) are usually polluted. There have also been signifi cant
Agriculture is a major feature of the socio-economies of most South
increases in nutrient loads in many rivers and lakes from aquaculture
China Sea nations, and thus irrigation, drainage and water withdrawal
activities, with likely increases in other inputs. In large parts of the region
are of signifi cant relevance to the issues of freshwater shortage and
(e.g. Indonesia, Thailand, Cambodia, Vietnam), municipal and industrial
pollution, as outlined for each nation in Annex VIII.
wastewater is often discharged virtually untreated into the waterways
causing rapid deterioration in the quality of river water (FAO 1999). In
Environmental impacts
Thailand for example, approximately 833 million m3 of wastewater were
Modifi cation of stream fl ow
produced in 1992. In 1995, only 35 million m3 of wastewater were treated
Modifi cation of stream fl ow, including that caused by water withdrawal,
(FAO AQUASTAT 2003). Numerous wastewater treatment projects are
has moderate environmental impact in the region, with severe impacts
being developed in the Bangkok metropolitan area. There is little to no
in some areas. In Vietnam, the seasonal discharge of rivers has been
re-use of treated wastewater in Thailand, or indeed throughout most
altered, mostly as a consequence of loss of hinterland forests and
of the region. In Vietnam, no treatment facilities have been available in
riparian vegetation. In Thailand and Malaysia, stream fl ow has been
manufacturing plants, factories and sewer systems before wastes are
aff ected by loss of riparian vegetation and dam construction, with
discharged into water bodies. In Hanoi, 300 000 m3/day of wastewater
signifi cant saline intrusion in some areas. In Borneo, signifi cant loss
are discharged into the rivers (FAO AQUASTAT 2003).
of riparian vegetation has occurred through eff ects of logging. In the
Philippines, there has been saltwater intrusion to large freshwater lake
Virtually all urban streams in the region are highly polluted. Failure to
systems and loss of riparian vegetation.
provide adequate sanitation services not only translates to vulnerabilities
to contagious and infectious diseases but also increases likelihood of
In Thailand, the capital city Bangkok faces problems of both over- and
sewage dumping-induced eutrophication in estuarine areas. More
under-supply of water. Flooding occurs frequently in the wet season
detail on sanitation data for individual countries is available from the
ASSESSMENT
27
web sites of WHO's Joint Monitoring Programme for Water Supply and
Table 5
Water-borne diseases in some countries of the region.
Sanitation, and World Resources Institute's EarthTrends Environmental
Number of inhabitants affected
Country
Information Portal2.
Total
% of population
Cambodia
500 000
4.9
Changes in the water table
Philippines
782 000
1.1
Changes in water tables have exerted moderate environmental impacts
Thailand
1 040 000
1.8
in the region, with severe impact in some areas, notably coastal Thailand
(Source: FAO 1999)
(see also Annex VIII). Wells have been deepened over hundreds of
square kilometres, with major aquifer draw-down, saline intrusion, and
of the Philippines and elsewhere, there is insuffi
cient water supply and
there is little to no potable water available from some of the traditional
irrigation, loss of agricultural and tourism uses, and low productivity.
coastal sources. In Cambodia, the quality of groundwater is generally
satisfactory, although high iron concentrations and increased salinity
Health impacts
levels have been encountered in some provinces (Svay Rieng, Prey
Although considered as slight overall, health impacts are moderate
Veng and Takeo). In Indonesia, overexploitation of groundwater has
to severe in some areas, with two of the most common water-related
led to critical problems in some areas. For example, in Jakarta, excessive
diseases, malaria and schistosomiasis, linked to the development of
groundwater abstraction (32.6 million m│ in 1993) has caused saline
irrigation (Table 5) (FAO 1999). Malaria is already a serious problem
groundwater to reach about 10 km inland from the coastline and led to
throughout most countries in the region. In Cambodia alone, estimates
land subsidence at a rate of 2-34 cm/year (FAO AQUASTAT 2003).
of about 500 000 cases of malaria per year are common, and between
5 000 to 10 000 people die annually. Schistosomiasis was reported
Socio-economic impacts
in the Kratie area of Cambodia in 1993, while dengue haemorrhagic
Overall socio-economic impacts ranged from slight (Health and Other
fever has recently become an important cause of child morbidity in
social and community) to moderate (Economic). Economic impacts
Cambodia. In 1990, about 7 000 cases resulting in 340 deaths were
included insuffi
cient water supply and irrigation, causing loss of
recorded. In 2003-2004 in Indonesia, dengue fever has killed hundreds
agricultural and tourism uses and lowered productivity.
of people and incapacitated thousands of others for long periods. In
the Philippines in 1989, 782 200 people were aff ected by water-related
Economic impacts
diseases, including gastroenteritis, schistosomiasis and hepatitis. In
There are numerous economic problems associated with freshwater
Thailand, the main water-borne diseases are acute diarrhoea (aff ecting
shortage. These include growing water competition among users for
1.48% of the population), dysentery (0.14%), malaria (0.12%) and enteric
potable water supply, industrial water supply, hydropower, environment,
fever (0.03%) (FAO AQUASTAT 2003).
fi shing, and watershed management, all competing with irrigation
(FAO AQUASTAT 2003).
Drinking water across some parts of the region is of acceptable quality
because of pollution management, although in many other areas
Erosion and siltation of canals have resulted in high costs for the
surface water does not meet WHO drinking water criteria, because
operation and maintenance of irrigation schemes, and many are in
of the agricultural, industrial and human inputs. For example, many
need of frequent rehabilitation. The conversion of agricultural lands to
Filipinos, especially the poor, lack safe potable drinking water to meet
industrial or residential use has signifi cantly reduced the area equipped
even their basic survival needs. About one third of the population of
for irrigation that can actually be used for irrigated agriculture. Finally,
Philippines, some 25 million people, devise their own ways of obtaining
the high cost of energy hampers the development of pump irrigation
water because they have no access to formal sources such as deep wells
systems (see Annex VIII for detail). In most countries, fees collected from
or piped/reticulated water (FAO AQUASTAT 2003). Many poor people
farmers to cover costs of irrigation and water supply do not meet the
are required to buy water, with the daily consumption levels averaging
actual operational cost. Governments generally do not seek full cost
just 15 litres per day, dangerously close to the survival minimum. Of
recovery because the farming community is considered a low income
the 25 million Filipinos whose water supply is self-provided, many are
group. For example, in Malaysia, fees cover only 10-12% of the actual
getting water from contaminated sources.
operational cost (FAO AQUASTAT 2003). Further, about 32% of the
water produced is lost in the distribution system due to pipe leakage,
Thus, for millions of people in the region, and indeed the larger area of
under-metering, and other unaccounted water losses. In many areas
Southeast Asia as a whole, there is little to no access to wells or piped
2www.wssinfo.org and www.earthtrends.wri.org
28
GIWA REGIONAL ASSESSMENT 54 SOUTH CHINA SEA
supplies. Even in some areas with reticulated water, there are frequent
and not functioning properly. Drainage water often mixes with
interruptions to supply. Precise and comprehensive data on access to
drinking water with obvious health implications; fl oods are frequent
water supply are not available, and there are major diff erences in data
during the rainy season as the sewers clog rapidly. According to FAO
quoted by diff erent agencies (e.g. FAO and World Bank). FAO (1999)
(1999), providing a safe water supply to 65% of the rural population in
estimated that in Indonesia in 1990, just 35% of the urban population
Cambodia during the period 1996-2000 would have required a capital
and 33% of the rural population had access to safe water supply. In
investment of nearly 31 million USD.
Cambodia, some 1.75 million people (just 19% of the population) had
access to clean drinking water in 1992, representing approximately
Many local programmes are underway to address river pollution, as
40% of the urban population and 15% of the rural population. At that
for example in Ho Chi Minh City, Vietnam, where polluted waterways
time, only 7 000 of the 30 000 wells needed had been constructed by
are being cleaned as part of the World Bank-funded `Urban Upgrading
international organisations.
Project', including drainage, sewage systems and infrastructure. The
once beautiful and clean waterways have been turned unintentionally
Access to an improved water source refers to the percentage of the
into a dumping site. The project will work in 109 slums in Ho Chi
population with reasonable access to an adequate amount of water
Minh City, focusing on drainage and sewage networks, costing some
from an improved source, such as a household connection, public
298 million USD over the period 2004-2112, and should benefi t some
standpipe, borehole, protected well or spring, and rainwater collection
1.55 million residents). The project is based on the principle that active
(Table 6). Unimproved sources include vendors, tanker trucks, and
participation by communities in critical stages of preparation, design
unprotected wells and springs. Reasonable access is defi ned as the
and implementation is a pre-requisite to eff ectively respond to the
availability of at least 20 litres per person per day from a source within
needs of these areas. This should ensure that numerous low-income
1 km of the dwelling (WHO/UNICEF 2000). These estimates show
communities will have clean water, better sanitation and sewage
signifi cant disparities with FAO estimates (e.g. Indonesia), in part
systems, and reduced fl ooding, pollution and water-borne diseases
because of diff erent criteria.
(Nhan pers. comm.).
Table 6
Access to improved water sources in the region.
Other social and community impacts
Access to improved water sources (%)
There are signifi cant transboundary implications on the socio-
Country
economy of freshwater shortage, particularly in relation to the
Average Rural
Urban
international nature of many of the river systems, and related potential
Cambodia
75
66
94
for upstream/downstream confl icts. An example is Singapore which
China
78
69
90
relies on the State of Johor in Malaysia for most of its water supply. This
Indonesia
78
69
90
has been the focus of signifi cant recent disputation between these
Malaysia
100
94
100
two neighbouring nations. Singapore's water supply from Malaysia is
Philippines
86
79
91
based on agreements made in 1961 and 1962. Malaysia has, for several
Singapore
100
-
-
years, wanted a major review of the price, which it regards as too
Thailand
84
81
95
low. However, the two agreements provided for price revisions after
Vietnam
77
72
95
25 years, in 1986 and 1987. Singapore's stand is that since the 25-year
(Source: UNDP 2001)
period passed without review, Malaysia now has no legal basis to raise
the price. Malaysia and Singapore continue to hold top-level meetings
Precise and comprehensive data on the provision of environmental
attempting to resolve this long-standing dispute.
sanitation are not available for the region. In Cambodia, access to
sanitation is limited to an estimated 1.24 million people (just 13% of the
In summary, major socio-economic impacts are spread widely across
population), representing approximately 53% of the urban population
the region, and include:
(mostly in Phnom Penh) and 6% of the rural population (FAO 1999).
Loss/interruptions to human drinking water supplies (e.g. rural areas
A 1995 survey assessed the quality of water supply, wastewater and
of Philippines);
sanitation in the main towns of Cambodia. Most of the systems
Increased potential for upstream/downstream confl icts (e.g.
combined sewage and drainage water, and have not been maintained
Malaysia, Singapore), or confl icts among urban and squatter groups
over the past two decades. As a result, they are now in poor condition
(e.g. China). The water authorities in much of the region presently
ASSESSMENT
29
do not have adequate capacity for eff ective enforcement, and
intensifi cation of the problem due mainly to the rapid growth of the
much of the infrastructure dates from colonial times;
domestic and industrial sectors in these countries. Major inter-basin
Increased costs of alternative water supplies (see Annex VIII);
transfer programmes are being developed in China and Thailand.
Reduction in future use options;
Water scarcity and the interdependency between water use sectors are
Human health impacts (e.g. dengue fever, malaria);
pushing countries to develop integrated water resources management
Increased damage to water-related equipment, increased costs
programmes, as in Malaysia, Vietnam and Thailand. Water quality is also
of deepening wells and pumping and damage to infrastructure
a growing concern in several countries where industrial development
(see Annex VIII).
is important, including Malaysia and the Philippines. There is increased
importance of water conservation and protection in the national
Conclusions and future outlook
programmes of Indonesia and the Philippines, while in Thailand, the
Despite its moderate impact for the region as a whole at present,
transfer of populations from high density to low density areas has
freshwater shortage is a `food-security' concern in some areas, and
encountered serious socio-economic problems.
is the focus of national and international interventions (e.g. Philwater
International Conference and Exhibition on Water Resources
Despite the best eff orts of governments, IGOs and NGOs, and
Management). Expanded programmes targeting both rural and urban
improvement in regulation and environmental control, the expanding
water supplies, with the goal of delivering a reliable potable supply are
population pressures are expected to cause further deterioration in
beginning to be implemented, with the goal of achieving signifi cant
environmental and socio-economic aspects of freshwater shortage.
alleviation (see Annex VIII).
The rate of deterioration will depend to some extent on the success
of the planned interventions. In Thailand for example, in order to
The overall environmental situation in regard to freshwater shortage
solve the problem of competition between sectors, there are plans
in the South China Sea is expected to deteriorate slightly, remaining
to establish a water rights market where all parties would be able
moderate by 2020. Socio-economic impacts are all expected to
to trade water rights (FAO 1999). This would stabilise water demand
deteriorate, with health eff ects remaining as slight, other social and
but would have important negative consequences on agriculture.
community impacts becoming moderate and economic impacts
Throughout the region generally, water resources development lacks
becoming severe. Although major improvements are expected in some
a comprehensive planning and coordination of all the actions carried
locations (e.g. Singapore), many poorer areas in South China Sea do not
out in the sector by the diff erent agencies, although in Thailand, this
have the resources or infrastructure to act, compounded by poverty
has been improved since establishment of the Ministry of Natural
and inadequate sources of water supply. In Indonesia for example, as
Resources and Environment of Thailand on October 3, 2002 where
the nation has started to implement development programmes to
water is under responsibility of the Department of Water Resources
meet the sharply increasing needs for irrigation, safe drinking water,
and Department of Ground Water Resources. There is now a tendency
industrial water, energy, and other uses, the demand on water resources
to include the Department of Irrigation to form the Ministry of Water
has increased rapidly. It is estimated that between 1990 and 2020, the
Resources in the near future. Also, Thailand is implementing the water
demand will increase by about 220% (FAO 1999).
grid project to eff ectively supply water by pipeline system throughout
the country.
Thus major forcing factors include widespread increases in human
populations, with a doubling expected by 2033, and industrialisation,
Although the Mekong River is considered as part of GIWA region 55
with the compounding problem of increasing contamination. Although
Mekong River, the 1995 agreement established by the four lower
either directly or indirectly in all nations in the region, much legislation
Mekong riparian countries provides a useful model for the larger
touches on water resources (Annexes IV and V), most of the existing
region and new opportunities for regional collaboration in developing
laws are outdated. For example, in Malaysia, the Water Act of 1920 is
the Mekong Basin resources (water and related ecological resources).
inadequate for dealing with the current complex issues related to water
Some examples of promising collaboration are related to fl ood control
abstraction, pollution and river basin management.
in the Mekong Delta with Cambodia, and the possible importation of
hydropower from upper riparian states. Importantly however, there are
Water scarcity is a major issue in China and the Philippines, and
as yet no similar arrangements for other transboundary rivers.
increased competition for water between sectors already aff ects
agriculture in China, Malaysia and Thailand. The trend is towards an
30
GIWA REGIONAL ASSESSMENT 54 SOUTH CHINA SEA
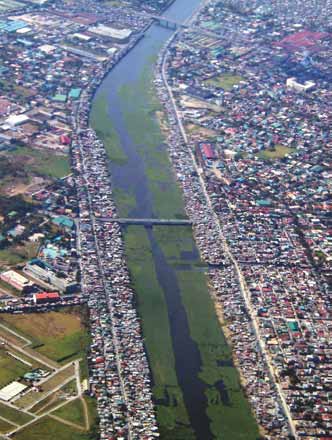
T
C
A
Pollution
IMP
Industrial forms of water pollution are concentrated in the major
urban centres. In much of the region, sewage treatment is superfi cial
The health of the South China Sea Large Marine Ecosystem is in serious
at best, with raw and/or primary treated sewage discharged directly
decline due mainly to coastal development. Around 270 million people
into water courses (see Freshwater shortage). Agricultural pollution
live in the coastal areas of the South China Sea Large Marine Ecosystem,
is also widespread, through leaching of fertilisers and pesticides into
and this population is expected to double in the next three decades
watercourses, massive loss of soils following land clearing and forestry
(LME 2004). The area's rapid economic development and population
and increasing aquaculture activities. Pollution from shipping and ports
growth are the cause of signifi cant ecological damage in coastal and
is also signifi cant, as the South China Sea contains some of the world's
marine areas. The primary environmental threats by humans in the
busiest international sea-lanes, with two of the busiest ports in the
South China Sea are the destruction of mangrove forests, sewage
world, Singapore and Hong Kong (Coulter 1996).
pollution, exploitative fi shing practices and overfi shing, coral reef
degradation, and damage to seagrasses and wetlands. Sewage
The environmental impacts and threats from pollution in the South
pollution aff ects biodiversity and fi sheries, and has health impacts on
China Sea have been well documented in many reports (e.g. Gomez
the downstream population. Pollution, overexploitation and destructive
1988, Johnston 1988, Chua & Pauly 1989, Soegiarto 1989, Piyakarnchana
fi shing practices are threatening 80% of the coral reefs in the region.
& Johnston 1990, Chua 1991, Chua & Scura 1991, Chua & Garces 1992,
Other pollution problems are increased river sedimentation and
Coulter 1996, Low et al. 1996, Chua & Ross 1998, Johnston 1998, UNEP
nutrients, plus destructive fi shing practices, are being felt in the region's
1999). The degraded water quality of Ha Long Bay (Hai Phong province,
other major habitat, seagrass communities, of which 20 to 50% were
Vietnam) is a typical example. Pollution of the Bay and man-made
found to be degraded. Many fi sh nursery areas and breeding grounds
changes to the environment have threaten coral reefs, marine life and
are being degraded (LME 2004). Figure 7 shows urban development
the livelihood of fi shermen and hoteliers. In 10 years, 900 million tonnes
along Pasig River, Manila.
of sediments polluted by the nearby coal mining, have been transported
by the rivers into the Bay. Adding to this, close to 9 million m3 industrial
wastewater contaminated by lead and petrol is discharged into the
Bay every year (South China Morning Post in Naess 1999). The coral
reefs suff er from the dynamite fi shing by the Cat Ba Island fi shermen,
and untreated wastewater from Haiphong, Vietnam's third-largest city
with two million inhabitants, pollutes the Bay. It is also estimated that
hundreds of visitor boats spill about 2 tonnes of oil each day. Similar levels
of pollution occur at many locations in the South China Sea, although
many are not as well documented as the latter World Heritage site.
Thermal pollution has only slight environmental impact in the region,
being notable only in the immediate vicinity of the few power
plants where ocean or riverine discharge of cooling waters occurs.
Radionuclide pollution has no known environmental impact of at
present; there are no nuclear power plants in the region, although
there may be some episodic discharge from nuclear-powered ships
navigating through the area.
Environmental impacts
Microbiological
Microbiological pollution has caused moderate environmental impact
in the region. Many areas have high levels of faecal coliform bacteria
(e.g. Manila Bay) from inadequate sewage disposal and treatment,
with, at best, rudimentary sewage treatment for much of the region.
Figure 7
Development along Pasig River, Manila, Philippines.
The production of wastewater in the region of the Philippines national
(Photo: J. Oliver, ReefBase)
ASSESSMENT
31
capital and nearby provinces is estimated at 74 million m3, while the
Chemical
volume of treated wastewater reached just 10 million m3 in 1994 at
Chemical pollution has had moderate environmental impact, with
the Ayala and Dagat-Dagatan pond (FAO AQUASTAT 2003). Sewage
use of pesticides in agriculture being a signifi cant problem in areas of
is mostly treated by settlement and primary treatment consists of
Vietnam, Philippines, Thailand and Malaysia. Use of chemical defoliants
screening, particularly in the urban areas. Disposal of wastewater is
by the United States military during the Vietnam War has caused long-
expected to increase as new sewer lines are being built every year. In
term pollution of some catchments and sediments. Mostly localised
Indonesia, municipal and industrial wastewater is discharged virtually
water contamination also occurs from industry (manufacturing, metal
untreated into the waterways causing rapid deterioration in the quality
fabrication, ship repair and agricultural and food processing industries
of river water.
such as oil milling, sugar refi ning and meat and fi sh processing) and
from mining, with contaminant loads concentrated near the discharges.
Eutrophication
Releases of chemical and other forms of pollution from shipping in
Eutrophication in the region as a whole has had slight impact,
harbours also commonly occurs, as regulations and controls relating
although with moderate impact in some estuarine and coastal
to ship-derived pollution are rarely enforced. Much industrial waste, a
areas of the Philippines and Thailand. Nevertheless, it is important
result of economic activity along the coast, also goes straight into the
to note that eutrophication may be more extensive than has so far
ocean without treatment.
been scientifi cally documented because of generally high nutrient
loading from agricultural as well as domestic sewage sources (Talaue-
Overall emissions of organic water pollutants, measured by biochemical
McManus pers. comm.). Hotspots certainly occur in the vicinity of
oxygen demand (BOD), vary widely among nations (Table 7). In the
coastal cities, and estuarine areas in non-urban settings where sewage
Philippines, emissions appear to have remained relatively steady from
or industrial discharges are directly dumped because of the lack of
1980 to 1993 with an average input per worker of 0.19 kg/day (World
sewer connections to centralised sewage treatment facilities. This is
Bank 1999). The industrial sector's share of organic water pollution was
commonplace in Indonesia, Vietnam and the Philippines, all of which
mostly contributed by food. In Indonesia by contrast, there appears to
have high total population and population densities. Impacts are most
have been a rapid increase in emissions, during the same period. Here
signifi cant in enclosed bays, harbours and lagoons with limited water
food is the major industrial contributor. Similarly in Malaysia, emissions
circulation (e.g. Manila Bay). Use of fertilisers, particularly in plantation
of organic water pollution have increased, again with food being the
agriculture, contributes to eutrophication through leaching into
major industrial contributor (Table 7). Pargal et al. (1997) note that in
watercourses, although by world standards use is low.
the case of Indonesia, the industrial sectors of textiles, leather tanning,
food products, and pulp and paper are more BOD-intensive than other
At present, scientifi c data are scarce to non-existent and the eff ects of
manufacturing sectors. Pulp and paper is signifi cantly more intensive
the nutrients are uncertain, depending partly on rates of mineralisation
in organic water pollution than food products, although textiles
and retention of the dissolved nutrients. There is little evidence of
and leather tanning are also relatively BOD-intensive; metals and
visible eff ects on the abundance and distributions of biota, or fi sh
machinery are least BOD-intensive. Pulp and paper and miscellaneous
or zoobenthos mortality other than in some enclosed bays and in
manufacturing are most intensive in total suspended solids (TSS), while
the immediate vicinity of river mouths. There are no indications that
eutrophication from agricultural run-off is a signifi cant problem at the
Table 7
Emissions of organic water pollutants in the South
scale of the region as a whole, although occurrences of hypoxia have
China Sea region.
been reported in areas crowded with fi sh pens and cages especially
BOD load (kg/day)
Food industry
Country
contribution (%)
during extended periods of reduced trade winds and reduced
1980
1993
water turbulence, such as during the 1997-1998 ENSO event (Talaue-
Cambodia
ND
12 078
ND
McManus pers. comm.). Examples of blooms of toxic dinofl agellates
China
ND
6 500 000
ND
that have caused paralytic shellfi sh poisoning have been reported in
Indonesia
214 010
537 000
59
some parts of the region. Initial estimates of global nutrient loading
Malaysia
77 215
136 055
32
can be found in Smith et al. (2003), and the environmental dataset
Philippines
182 052
181 714
53
Singapore
ND
33 331
ND
is available from the Land-Ocean Interactions in the Coastal Zone
Thailand
ND
355 800
ND
(LOICZ) web site3.
Note: ND = No Data.
(Source: World Bank 1999)
3 www.loicz.org
32
GIWA REGIONAL ASSESSMENT 54 SOUTH CHINA SEA
Machinery is least intensive. In the other South China Sea nations, total
on the banks of rivers, and cannot manage their waste. The rivers are
BOD emissions range across several orders of magnitude.
therefore used as deposits for solid waste (Naess 1999).
Suspended solids
Spills
Suspended solids have had severe environmental impact in coastal
Spills have had moderate environmental impact at present. The South
waters throughout most of the region. This has resulted from land use
China Sea forms part of the major oil tanker routes between the Indian
practices causing extensive deforestation in many watersheds, logging
and Pacifi c Oceans (Figure 8), with episodic discharges from shipping
and mining, and urban development, compounded by high rates of
(tankers, fi shing boats, bulk carriers, ferries etc.), and occasional spills
erosion and siltation. Erosion is a major problem throughout the region
from oil exploration and production.
(Naess 1999). Logging and `slash and burn' agriculture create millions
of tonnes of sediments that are transported through the rivers to
coastal areas and river deltas. Sediments smother coral reef, mangrove
and coastal ecosystems, and consequently destroy the productive
China
Hong Kong
breeding grounds for fi sh. There have been major changes in turbidity
Myanmar
Vietnam
and levels of suspended sediments in Malaysia, Vietnam, Philippines,
Laos
Indonesia (Sumatra and Kalimantan) and Thailand. These impacts, with
extensive dredging and land reclamation, have caused major changes
Paracel
Islands
Philippines Manila
in biodiversity of aff ected benthic communities.
Thailand
Bangkok Cambodia
In the Philippines, of the order of 1 billion m3 of sediment is discharged
Ho Chi Minh
Spratly
Islands
into coastal waters annually, carrying high loads of particle-bound
nutrients. This is of particular concern given that the timber industry
has traditionally suff ered from mismanagement and corruption,
Brunei
although there have been some recent improvements. Nonetheless,
Malaysia
implementation of `best-practice' forestry management, such as the
Singapore
retention of buff er zones along watercourses, is rarely enforced and
Indonesia
violations are common. One exception to this is Palawan (Philippines),
Major ship lanes
where logging was halted through eff ective implementation of
Figure 8
Major shipping lanes in the South China Sea region.
legislation in the early 1990s, providing a major reduction in sediment
(Source: US Pacific Command 2005)
loss from the catchments and much needed protection for the fringing
coral reefs and other coastal and marine habitats (Hodgson & Dixon
1992). As noted above, in Vietnam's Halong Bay, 900 million tonnes
Ship ballast discharges and `ballast-washing' also regularly occur,
of polluted earth has been carried into the sea by rivers that traverse
impacting on all littoral countries to varying degrees. Etkin (1997)
nearby coal-mining zones (South China Morning Post in Naess 1999).
reported that over 800 million litres of oil had spilled into East Asian seas,
Underwater `hills of mud' up to 30 m high have been created.
including South China Sea, since 1965. International trade is expected
to triple by 2020, and much of this trade will be transported by sea
Solid wastes
(Chua pers. comm.). Most of the countries in the region have ratifi ed the
Solid wastes have caused moderate environmental impact in the region
UN Convention on the Law of the Sea (UNCLOS) and the International
but with severe impact locally, particularly around towns and villages
Convention on Prevention of Marine Pollution from ships (MARPOL),
where waste management is poor or non-existent. There is widespread
and have taken some steps towards developing oil spill contingency
litter on beaches giving rise to public concerns regarding recreational
plans. Yet little spill control equipment is in place and implementation
use, and impacting the tourism industry (e.g. many areas of Thailand,
of emergency procedures is not well developed.
Vietnam, Philippines, Malaysia, Indonesia). There are high frequencies
of benthic litter recovery and interference with trawling activities (e.g.
Socio-economic impacts
Manila Bay and some other near-shore areas where half the trawls may
Socio-economic impacts of pollution in the South China Sea are all
be fi lled with solid wastes). Most cities, towns and villages are situated
moderate. Most impacts are related to poverty and are concentrated in
ASSESSMENT
33
the major urban centres. There have been losses in fi sheries (e.g. off the
control projects as irrecoverable and unproductive investments (Naess
Malaysian Sarawak coast), economic losses to aquaculture facilities and
1999). Consequently, these have a very low rating when government
shellfi sh industry through regular advisories of high levels of toxicity (e.g.
funds are allocated to various sectors. The general lack of expertise
Philippines, Vietnam, Indonesia, Thailand). There have also been losses
and experience in implementing and conducting integrated and
in wildlife and recreational value in parts of the Philippines, and confl icts
sustainable management of marine related pollution problems are
of land use in Philippines, Thailand and Malaysia. Health issues include
a serious obstacle to their eff ectiveness. Data management and
harmful algal blooms and cases of mercury poisoning. There have also
methodologies also vary from country to country, making it diffi
cult to
been costs associated with clean-ups and coastal restoration. There is
compare and synthesise data (Low et al. 1996, Naess 1999).
a lack of data in the region to support these statements, however, the
key impacts include:
However, in some areas of most nations, eff orts are now beginning
Increased risks to human health;
to be made to clean up local pollution sources and impact sites, and
Increased costs of human health protection;
implementation of regulations is improving. An early example was the
Loss of water supplies (e.g. potable water);
establishment in February 1981 of the Memorandum of Understanding
Increased costs of water treatment;
between Indonesia, Malaysia, Singapore and Japan of the Malacca Strait
Costs of preventive medicine;
Council, when a Revolving Fund was set up to combat oil pollution from
Costs of medical treatment;
vessels in the Straits of Malacca and Singapore.
Costs of clean-up;
Loss
in
fi
sheries;
Nevertheless, the overall socio-economic prognosis for the future is
Change
in
fi
sheries
value;
for deterioration causing severe impact to the economies. By contrast,
Costs of reduced fi sh marketability due to aesthetic perceptions;
there is expected to be an improvement in health issues (becoming
Reduction in options of other uses of freshwater;
slight), and both improvement and deterioration in other social and
Potential
for
international
confl
icts;
community aspects (remaining moderate), mostly because of an
Damage to equipment (e.g. particle impacts);
increase in projects for pollution mitigation and control (e.g. sewage
Avoidance of amenities and products due to perceptions of eff ects
treatment). There are expected to be marked diff erences in the
of contamination;
magnitude and success of such interventions among the diff erent
Costs of preventative measures;
South China Sea nations, and both the direction of change and the
Costs of contingency measures.
rates of deterioration and/or improvement will depend on the success
of ongoing and planned interventions. In the latter regard, an important
Conclusions and future outlook
recent initiative is the GEF funded UNDP/GEF/IMO Regional Programme
For the Pollution concern as a whole, the present level of environmental
for the Prevention and Management of Marine Pollution in the East
impact is moderate. However, environmental impact of suspended
Asian Seas. The project focuses on four activities:
solids is already severe, primarily resulting from deforestation over the
Demonstration
sites;
past 150 years. To 2020, environmental impacts from pollution are likely
Promotion of ratifi cation of international conventions;
to deteriorate, but remaining as moderate, primarily because of the
Development of sustainable fi nancing mechanisms;
predicted increases in forestry and agriculture, and a major increase in
Capacity
building.
population overriding the improvements in infrastructure. Regulations
and laws governing the sources of pollution have not been suffi
ciently
This regional programme has been successful in bringing national and
developed or followed up by local and national governments as
local governments, industry, donor agencies, NGOs and organisations in
economic growth and industrial development are more highly valued
the international community together in environmental management
than protection and management of the marine environment.
projects in three selected sites. Ten countries are members of the
programme, established in 1994. Detailed recommendations and
Although most of the countries have signed and ratifi ed relevant
strategies for implementing eff ective pollution management strategies
conventions and treaties, many are unable to implement regulations
in the region are contained in reports by Chua (1991), Chua & Pauly
eff ectively. There is seldom one ministry or department that
(1989), Chua & Scura (1991), Chua & Garces (1992) and Chua & Ross (1998)
coordinates the implementation and enforcement of anti-pollution
among many others.
laws. Further, policy makers generally view pollution mitigation or
34
GIWA REGIONAL ASSESSMENT 54 SOUTH CHINA SEA
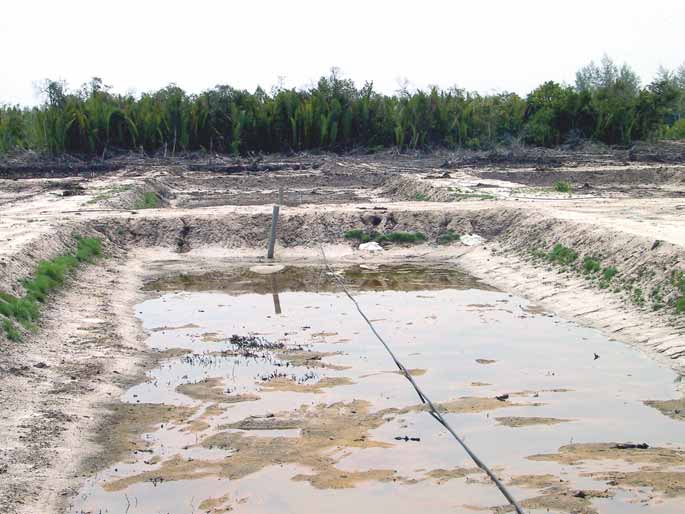
T
C
A
Habitat and community
Environmental impacts
IMP
modification
Loss of ecosystems or ecotones
Loss of ecosystems has already caused severe environmental impacts,
The South China Sea region lies within the global centre of biodiversity
with permanent destruction having reduced the surface area of
for marine species. The region supports some of the world's most
mangroves, seagrasse beds, coral reefs, and riparian vegetation by
diverse seagrass beds and mangrove forests, as well as more than
more than 30% in the past several decades, from siltation, development
2 500 species of marine fi shes and 500 species of reef-building corals
and destructive fi shing practices. Development of ports has resulted
(Chou 1997, Veron 2000). Extensive cutting for timber, conversion
in foreshore reclamation and channel dredging, while muro-ami,
for aquaculture (Figure 9), other forms of coastal development and
blasting and poison fi shing has damaged or destroyed large areas of
sedimentation have caused major fragmentation and reduction in
coral reef. Seagrass beds, muddy and sand-gravel bottoms and fringing
the area of these habitats (Talaue-McManus 2000). Only one-third
coral reefs are also impacted by trawling and siltation. For marshes,
of the original mangrove forests remain, while seagrass beds have
swamps, riparian belts, fast fl owing stony bottomed streams and slow
been reduced or degraded by 20-50% through increased sediments,
fl owing sandy/muddy fl oodplain rivers the combined eff ects of human
nutrients and destructive fi shing. Key aspects of the ecosystems,
impacts, including agricultural expansion and, in the case of Vietnam,
habitats and biodiversity of the South China Sea are further discussed
widespread military use of defoliants, have caused extensive habitat
in the Regional defi nition.
loss and fragmentation in many parts of the region.
Figure 9
Newly excavated aquaculture ponds north of Merang, Malaysia.
(Photo: J. Oliver, ReefBase)
ASSESSMENT
35
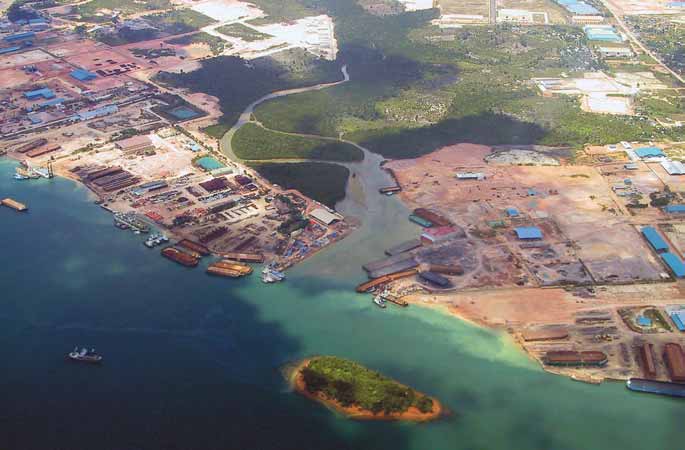
Figure 10 Coastal development near a mangrove estuary, Singapore.
(Photo: J. Oliver, ReefBase)
The original area of mangroves in the South China Sea has decreased by
Modifi cation of habitats or ecotones
70% during the last 70 years. With a continuation of the current trend
Modifi cation of habitats is also severe, with changes in species
all mangroves will have been lost by the year 2030 (UNEP 1999), with
compliment/community structure (e.g. coral reefs), changes in
millions of hectares of land, mostly mangrove forests, having already
population structures and/or functional group composition (e.g.
been converted for shrimp hatcheries and mariculture. In Singapore,
coral reef fi shes) and major changes in ecosystem services (e.g. reef
more than 95% of mangroves and 60% of coral reefs have been lost
fi sheries, mangrove resources). For example, the important fi sheries
(Figure 10). In Thailand, there has been major loss of mangroves and
`nursery-ground' roles of large sections of mangroves and seagrass
marshlands through changing land use patterns, loss of coral reefs
beds have been seriously depleted, while about 80% of coral reefs
through siltation, pollution and destructive fi shing exacerbated by the
have been degraded or are under severe threat from destructive and
lack of protection, and loss of seagrasses through coastal construction.
overfi shing, siltation, pollution and development (Bryant et al. 1998,
In Malaysia, loss of mangroves is continuing through coastal
Burke et al. 2002). Freshwater habitats have also been impacted from
development. In Indonesia, of the estimated 39 million ha of coastal and
introductions for example Tilapia and African catfi sh. There have been
inland swamps, some 7.5 million ha have been identifi ed as potentially
local extinctions in some areas for example loss of mud crabs in Rayong,
convertible to arable land (FAO 1999). In Vietnam, by contrast, the loss
loss of turtles and dugongs in many parts of Philippines and Vietnam
of mangroves is being addressed through a major rehabilitation project
through habitat loss and exploitation, and loss of freshwater fi shes.
at Can Gio (43 000 ha). Despite the continuing destruction, signifi cant
areas supporting good quality coastal and marine habitats still remain
Socio-economic impacts
(e.g. Spratly and Paracel Islands; western Palawan, Philippines; and
Coastal ecosystems
Con Dao Islands, Vietnam), both within and outside MPAs.
Loss of riparian and coastal vegetation, including mangroves
and seagrasses, has had enormous socio-economic implications.
36
GIWA REGIONAL ASSESSMENT 54 SOUTH CHINA SEA
Mangroves of the South China Sea cover 4 million ha of the coastal
areas, representing 28% of the world's mangrove forest and have
enormous economic (and environmental) value (UNEP 2004). Products
and ecological services provided by these systems are estimated to be
China
worth about 16 billion USD per year (Low et al.1996, Naess 1999, UNEP
1999). Further, the estimated value of seagrass and coastal swamp
Myanmar
areas in the South China Sea region is 191 billion USD per year (UNEP
Laos
1999). As noted above, the original area of mangroves has decreased
by 70% during the last 70 years. With a continuation of the current
Vietnam
trend all mangroves will have been lost by the year 2030 (UNEP 1999).
Thailand
Subsequently, many of the shrimp farms had been abandoned, because
Philippines
the operators found them unsustainable due to the high concentrations
Cambodia
of chemicals and the destruction of the mangrove habitat. Local NGOs
claim that the donor agencies (including the World Bank) should be
held accountable for environmental destruction caused by shrimp
farming, and that the government should establish and implement
clear criteria for sustainable shrimp farming and ways to rehabilitate
Brunei
damaged mangroves.
Malaysia
Reefs at risk
Marine ecosystems
Singapore
High
Major economic costs are accruing from loss and modifi cation of
Indonesia
Medium
coral reef habitats, which are also of immense economic value. The
Low
reefs provide nursery and breeding grounds for 12% of the world's
Mangrove
ę GIWA 2005
total fi sh catch; contributing some 30% of East Malaysia's total catch
Figure 11 Reefs at risk in the South China Sea region.
and 25% in the Philippines (Gomez 1988, Brookfi eld & Byron 1993,
(Source: Bryant et al. 1998)
Low et al. 1996). In Southeast Asia, reefs are estimated to be worth
more than 2.4 billion USD per year, based on their value in food
security, employment, tourism, pharmaceutical research and shoreline
to more sustainable, but time-consuming, technology like spears
protection (Burke et al. 2002). The reefs of Indonesia provide annual
and hooks. As a result, in many coastal areas, bombed reef fi sh often
economic benefi ts of 1.6 billion USD per year in 2002, however over
dominate local markets. But the practice has a devastating eff ect on
the next 20 years, human impacts, notably overfi shing, destructive
coral reefs, which may take more than 50 years to recover.
fi shing and sedimentation could cost Indonesia some 2.6 billion USD
(Burke et al. 2002). Figure 11 shows the reefs at risk in the South China
Cyanide use can be nearly as destructive as blast fi shing, but its focus is
Sea region.
often the international market, rather than local supply. Prized reef fi sh
like grouper (Serranidae) and Napoleon wrasse (Chelinus undulatus) are
Fishing
chased into corals, where the diver uses cyanide-fi lled squirt bottles to
In the case of destructive fi shing, the bombs, usually constructed from
stun the fi sh for capture and sale on the live reef fi sh market. These fi sh
bottles stuff ed with explosive potassium nitrate, detonate underwater,
are usually shipped aboard large cargo ships to discerning diners in Hong
killing or stunning fi sh so that they are easy to net. There is considerable
Kong, Singapore, and Taiwan, where the fi sh are picked out of aquariums
collateral damage to reef communities, with localised death and injury
just prior to cooking. The cyanide does more than stun the fi sh, though,
to all incident species, and coral mortality rates of 50 to 80% (Hopley
as coral is killed as well, particularly since the divers often have to tear
& Suharsono 2000). For the fi sherman, the short-term gains from
apart the coral structure with crowbars to pull the fi sh out.
bombing may be impressive, with a 1-2 USD investment returning up
to 15-40 USD in profi t on the local market. Moreover, given the ease
Tourism
with which fi sh bombs are assembled (potassium nitrate is a common
Although often considered a relatively benign `non-extractive' industry,
component of fertiliser), fi shermen seldom want to make the switch
additional socio-economic impacts can accrue from tourism, usually at
ASSESSMENT
37
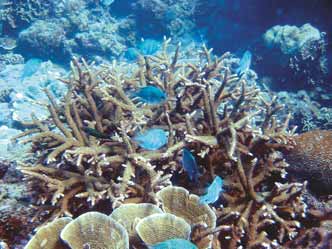
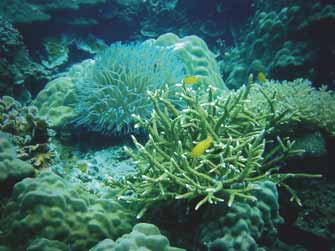
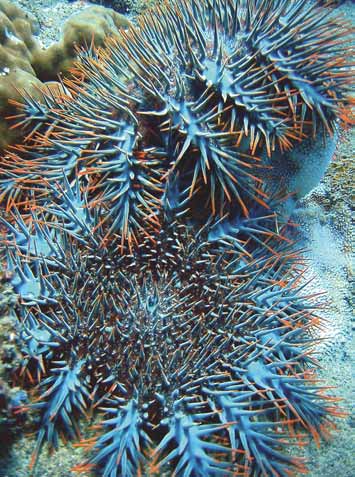
two stages in the development of the industry (Hopley & Suharsono
Loss or reduction of existing income and foreign exchange from
2000). The early construction phase may employ damaging techniques
fi sheries, tourism, and other uses (many areas, but also attributable
of land clearing and quarrying of the coastline and fringing reefs for
to factors additional to habitat loss);
resort construction. After the resort is occupied, damage may result
Human confl icts, national and international (e.g. territorial disputes
from sewage disposal, anchor damage at dive sites (mooring facilities
over exploitation of Spratly Islands reefs);
are not normally installed) and breakage of corals by inexperienced
Injury and death to fi shermen using destructive fi shing methods
divers and snorkelers (particularly where operators are not trained to
(e.g. blast fi shing in many areas);
give environmental advice to the tourists). Tourism may also create
Loss of future opportunity for investment income and foreign
confl ict with the local communities (e.g. Djohani 1995).
exchange, and increased risks to capital investment (e.g. failure of
coastal aquaculture projects in many parts of the region);
Thus present socio-economic impacts of habitat and community
Costs of controlling invasive species (e.g. Tilapia);
modifi cation range from slight (Health) to severe (Economic and Other
Costs of restoration of modifi ed ecosystems (e.g. coral reef and
social and community impacts), primarily because of:
mangrove forest restoration programmes are already being
Reduced capacity to meet basic human needs (food, fuel) for local
undertaken);
populations (many areas of South China Sea);
Inter-generational
inequity.
Changes in employment opportunities for local populations and
associated changes in social structures (e.g. Thailand, Vietnam,
There are particularly serious economic issues in fi shing communities,
Philippines);
where local fi shermen are unable to catch suffi
cient fi sh for sustenance.
Figure 12 Cora reefs: Left: Lemon damsel (Pomacentrus mollucensis) and mixed coral species, Pulau Perhentian, Malaysia.
Right: Crown of thorns starfi sh, north of Pulau Gut off Pulau Tioman, Malaysia.
(Photo: B. Huzaimi, ReefBase)
38
GIWA REGIONAL ASSESSMENT 54 SOUTH CHINA SEA
There are also economic confl icts between investors and local users,
two international protected areas conserving coral reef habitats in the
and also from loss of mangrove habitats, loss of charcoal production and
region (Figure 13). Approximately 125 other marine protected areas
costs of rehabilitation, and failures in aquaculture. There are also health
have already been gazetted, although there are insuffi
cient resources
(loss of traditional medicines, pharmaceuticals, potential increases in
for management and enforcement of fi sheries and other regulations
mosquito-borne diseases), educational and scientifi c issues arising from
in many MPAs at present, which limit their eff ectiveness. By contrast,
habitat loss. Other social and community impacts include relocation of
several small community-based management initiatives have proven
villages and confl icts among diff erent user groups (e.g. among shallow
very successful at protecting coral reefs and facilitating replenishment
and deep water fi sheries). Progress in managing human use of habitats
of reef-based fi sheries (e.g. Apo Island in the neighbouring Sulu-Celebes
is not expected to be suffi
cient to fully mitigate the damaging eff ects
(Sulawesi) Sea region) (Russ 1985, Russ & Alcala 1996a, b).
of population growth.
Future levels of environmental impact are expected to remain as severe,
Conclusions and future outlook
with both some improvement and some deterioration to 2020. Future
As with the neighbouring regions of Sulu-Sulawesi Sea and Indonesian
socio-economic scenarios are also for signifi cant deterioration by 2020,
Seas, the major causes of loss and modifi cation of the freshwater, coastal
with severe economic and other social and community impacts, and
and marine habitats include:
both deterioration and improvement in the health situation, which
Siltation, conversion for aquaculture, agriculture, industrial
should remain as slight.
development aff ecting marshes, swamps, rice paddies and riparian
belts;
Given that the region lies at the centre of global biodiversity, with
Deforestation, siltation, damming and waste disposal aff ecting rice
adjacent regions of Indonesian Seas and Sulu-Sulawesi Sea, the
paddies and rivers;
present situation and future prognosis indicate that more extensive and
Silica mining and solid wastes aff ecting sandy foreshores;
intensive intervention is required, including (PEMSEA pers. comm.):
Aquaculture conversion and timber collecting aff ecting
Direct on-the-ground community-based conservation
mangroves;
programmes, including further development of protected areas;
Sediment
run-off , siltation and dredging aff ecting seagrass beds
Training programmes to build additional long-term capacity
and coral reefs;
among governments, NGOs, and communities;
Destructive
fi
shing
aff ecting coral reefs;
Trawling
aff ecting soft-bottom habitats;
Mid-water trawling, drift netting and other forms of pelagic fi sheries,
China
oil and gas exploration and pipelines aff ecting oceanic habitats.
Mai Po Marshes &
Myanmar
Inner Deep Bay, Ramsar
Ha Long Bay, World
^
Heritage Convention ^
For the Habitat and community modifi cation concern as a whole,
#
Dongzhaigang Nature
Laos
present level of environmental impact is already severe, although
Reserve, Ramsar
there are some positive steps. These include mangrove rehabilitation
Philippines
Paracel
Islands
programmes, notably in Vietnam, and the protection of forests,
Thailand
watersheds and reefs in some areas (e.g. Palawan, Philippines). UNEP has
Cambodia
undertaken the Coastal Marine Environment Management Information
#
Vietnam
Spratly
Islands
System (COMEMIS), to help improve the region's capacity to make
Koh Kapik and Associated
Islets, Ramsar
sound environmental assessments through GIS. Even some habitat
#
Kuan Ki Sian of the Thale Noi
Non-Hunting Area, Ramsar
modifi cations, such as a coastal reclamation project in Singapore, have
Brunei
had positive eff ects, providing a nesting site for turtles and birds.
Malaysia
Singapore
At present, most habitats are only poorly represented in protected areas
International Protected Areas (2)
Indonesia
National Protected Areas (193)
and of those, many are poorly managed. For example, approximately
ę GIWA 2005
Ramsar
4% of Philippine coral reefs are listed as being protected, although most
Figure 13 International and national protected areas in the South
of these are being degraded at increasing rates from destructive fi shing,
China Sea region.
sedimentation and pollution, and a lack of enforcement. There are only
(Source: UNEP/WCMC 2003)
ASSESSMENT
39
Assessment programmes for identifi cation of critical areas for
Box 3
Marine Protected Areas in Southeast Asia.
The ASEAN countries have developed several models for the management of MPAs:
biodiversity (e.g. through government agencies and NGOs
- Centralised or top-down whereby they are managed by a single authority,
such as WWF, IUCN, The Nature Conservancy and Conservation
normally the government. This often applies in Indonesia, Malaysia, Thailand
and Vietnam.
International);
- Local, bottom-up level, such as the predominantly community-based
Multilateral integration to maximise eff ectiveness of obligations
management projects in Indonesia, Thailand or the Philippines.
- Shared between several stakeholders. This usually involves the community
under international conventions and treaties (e.g. the Convention
and government, but could also include NGOs, IGOs and universities, thereby
on Biodiversity, UNCLOS, MARPOL, Ramsar Wetland Convention).
constituting collaborative or co-management strategies.
There are numerous case studies of successful management of MPAs in Southeast
Asia, with the collaborative and community-based management strategies being
especially fruitful, demonstrating that the paradigms for sustainable management
Conservation of representative habitats through continued
of coastal and marine resources in the region have already been developed.
development of protected areas is a regional priority of global
However, these examples appear to be the exception, as the statistics illustrate
that marine resources are failing to get the adequate attention that they require.
importance. Nations bordering the South China Sea already have
Only 7% of the total number of MPAs in the region are effectively managed, while
68% have poor or unknown management. Thus, most MPAs, while they look good
many legally designated protected areas including coastal and marine
on paper, can be regarded as `paper parks'. They have been declared as MPAs, but
they are protected only in theory and not in practice, as there are no management
habitats, and some multilateral conservation agreements have been
plans and only weak attempts at implementing effective control of national
regulations. For many, the management effectiveness rating is `unknown' (48.6%
established. Of the more than 125 coastal and marine protected areas
of the MPAs in the region), which probably indicates that there is no management.
in the region, many contain coral reefs (Spalding et al. 2001, and see
Alternatively, this lack of information may be partly explained by the political and
security sensitivities in Southeast Asia with some areas inaccessible for research
Cheung et al. 2002 for comprehensive lists and tables). There are also
and monitoring. This status is largely due to a lack of field knowledge, experience,
and political will from the governments.
two World Heritage sites (Halong Bay, Vietnam and Puerto Princesa
(Source: Wilkinson et al. in press)
Subterranean River National Park, Philippines), although their inscription
on the World Heritage Register was primarily for geomorphological and
cultural features, rather than habitats. The eff ectiveness of many MPAs
is limited at present by insuffi
cient resources for management and
T
C
A
enforcement of regulations, with just 10-20% considered as eff ectively
Unsustainable exploitation of
IMP
managed (Box 3) (Cheung et al. 2002).
fish and other living resources
Recommendations for priority actions in regard to improving MPAs in
The South China Sea ranks fourth among the world's 19 fi shing zones in
the region include (Cheung et al. 2002):
terms of total annual marine production. Southeast Asian Seas annually
Implement legislative reforms;
yield approximately 7 million tonnes of fi shery resources (McManus
Incorporate planning and management into an Integrated Coastal
1994). The annual value of this catch exceeds 6.5 billion USD. The ASEAN
Management framework;
nations export nearly 1 billion USD worth of fi sh products annually.
Develop/enhance sustainable fi nancing to continue adaptive
More signifi cantly, fi sheries contribute approximately 65% of the animal
management including co-management;
protein consumed in countries such as the Philippines, Malaysia, and
Fill gaps in establishment of representative MPAs in Indonesia, with the highest dependencies being found among the
underrepresented biogeographic zones;
poorest coastal people (McManus 1994).
Establish/improve joint research and cooperative management
areas.
Areas adjacent to the Spratly Islands are particularly productive, such that
the annual catch from the reef-studded waters of the Sabah-Palawan
Many lessons have already been learned from the few successful
area is about 10 000 tonnes, valued at approximately 15 million USD.
MPA models, and the future successful development of protected
The local fi sh stocks in most of these areas are heavily fi shed. Adult fi sh
areas will include extensive community and stakeholder consultation,
are very diffi
cult to fi nd on some reefs in the region (McManus1994).
education and regulations off ering real protection, with agreement
Figure 14 shows catches in the South China Sea LME by country. For
and strong support from the customary resource owners and users. In
more information on the South China Sea LME see Box 4.
collaboration with the respective governments, national to local, several
international NGOs, including WWF, IUCN and The Nature Conservancy,
As with neighbouring regions, neither status nor future viability of the
are presently working towards assessment and management of critical
fi sh stocks are well understood, and for many fi sheries, their status may
biodiversity sites in the region.
be summarised as being illegal, unreported and unregulated (IUU).
There are signifi cant gaps in data on population dynamics for some
40
GIWA REGIONAL ASSESSMENT 54 SOUTH CHINA SEA
needed to defi ne what is unique and what is shared, what works
6
and does not;
China
Philippines
Thailand
Korea (North)
Macau (China)
Vietnam
Japan
Taiwan
Korea (South)
Brunei
Funding
diffi
culties in developing standard data collection and
5
Indonesia
Malaysia
Hong Kong
Singapore
USSR (former)
reporting for shared fi sheries - relevant to management of the
onnes) 4
South China Sea as a whole (e.g. PISCES genetic project to defi ne
3
relations among stocks in South China Sea).
(million t
h
2
Catc
Scale of the diff erent fi sheries is another major issue, with substantial
1
diff erences among diff erent fi sheries; commercial inshore/off shore/
international foreign off shore, in terms of boat numbers, sizes, catch
0
capacity, area sizes fi shed and gear types. This leads to increasingly
1950
1955
1960
1965
1970
1975
1980
1985
1990
1995
2000
Year
complicated management strategies related to multi-species
fi sheries.
Figure 14 Catches in the South China Sea LME by country.
(Source: LME 2004)
Environmental impacts
fi sheries. Data issues aff ecting signifi cant areas of the region include
Overexploitation
(Alban pers. comm.):
Overexploitation in the South China Sea region has already had severe
No village statistics, with little or no capacity to collect fi sheries
environmental impacts (Box 5). Many stocks, including demersal reef
statistics at village level;
fi sh, holothurians, molluscs and crustacean stocks, are considered to
No data on reef and other fi sheries;
be exploited beyond Maximum Sustainable Yield (MSY), partly through
For artisanal fi sherman, a resistance to collect or understand/use
overinvestment and with encroachment of large-scale commercial
data, rather traditional judgements/knowledge prevail;
operations, including incursions by foreign vessels using long drift nets
Lack of data on fi shing grounds, their location, extent, seasonality,
into traditional/artisanal fi shing areas. There is also overexploitation of
productivity;
sharks, tuna, bill-fi sh and other pelagic species. Sharks are also caught as
Lack of integration, appropriate use of data in management, with
urgent need for better coordination;
Box 5
Overexploitation in the South China Sea region.
Data often not management-related, having been collected for
The GIWA regional Task team raised concerns about the GIWA definition of
science, not for fi sheries management;
overexploitation: "Overexploitation refers to the capture of fish, shellfish or marine
invertebrates at a level that exceeds the maximum sustainable yield of the stock."
Data reliability issues;
The concepts of Maximum Sustainable Yield (MSY) are outdated , see e.g.
Jackson et al. (2001) and Pauly et al. (2002). More appropriate criteria would include
Field data reporting systems and standardisation varies across
proportions of spawning biomass for individual species and a `whole of ecosystem'
fi sheries and countries (e.g. log books), with signifi cant eff ort
approach to multi-species fisheries. In particular, there are significant differences
between tropical multi-species and multiple trophic level fisheries versus
temperate single-few species and trophic level fisheries, in relation to:
- Multiple gear selection, adaptation, modification in response to fisheries
Box 4
The South China Sea Large Marine Ecosystem.
diversity and level of poverty of fishermen (some fisherman cannot afford to
diversify into specialised gear);
The coastal and estuarine areas off of Vietnam, China and Cambodia are very
productive. In the past, a substantial fraction of the Vietnamese catch was taken
- Increasing coastal populations, initially target common species (e.g. mullet), but
by artisanal, non-mechanised boats. South Vietnam's demersal resources were
overexploitation leads to diversification to non-target species;
exploited primarily by Taiwanese vessels. The northwestern coast of the Philippines
- Fish meal/oil production encourages fishermen to take everything;
is a soft-bottom area fished intensively by trawlers. The deep shelf area of South
- Targeted by-catch e.g. turtles.
China Sea is predominantly fished by Taiwanese vessels. There are no catch or
biomass data for shrimp or crabs, and information on catches of demersal fish is
Given the above, the four defined categories of overfishing; recruitment, growth,
sparse. In deep oceanic waters (200 to 4 000 m), fisheries are limited to large pelagic
target and malthusian, all occur in the region and have different impacts in the
fishes, mainly tuna. Other species harvested are billfish, swordfish, shark, porpoise,
different fisheries/nations, in relation to natural fluctuations in stock population
mackerel, flying fish, anglerfish and shrimp. The total fish harvest is approximately
sizes from:
5 million tonnes per year. This is about 13% of the area's total fish production,
- Recruitment variability, large annual fluctuations in recruitment, cohorts,
the rest being eaten by predators. Five of the countries are among the top eight
size/year classes, differences in susceptibility to overfishing among year classes,
shrimp producers of the world. Fishermen sometimes use small meshed nets and
climate effects on recruitment and distribution;
practice destructive fishing methods, such as cyanide and dynamite fishing. While
two thirds of the major fish species are overexploited, carefully constructed fishing
- Differences in life history characteristics across species, degree of aggregation,
regimes could result in increased catches. The Vietnam/China area was lightly
spawning sites susceptibility to overfishing.
exploited from the mid-1970s to the mid-1980s. By now much of this potential has
These natural fluctuations produce significant inter-annual variability in stock sizes
probably been realised. The deeper coralline areas and those situated in the central
that in turn affect productivity and the socio-economics of the different fisheries,
portion of the LME are only slightly exploited, leaving room for an increase in
be they subsistence or industrial. Subsistence fisheries are largely limited to shallow
production there. The potential areas for an increase lie in the deeper areas of the
coastal waters because of lack of equipment and/or knowledge. This can lead to
LME, but these are areas difficult to fish.
tension with foreign fishermen who have broader options.
(Source: LME 2004)
(Source: GIWA Task team 2004)
ASSESSMENT
41
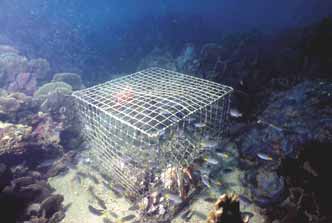
by-catch of the trawl fi sheries and the tuna long-line fi shery. Additionally,
There is however widespread capture, either intentional or accidental, of
the benthic invertebrate fi sheries, particularly for sedentary species of
rare, threatened and endangered species in traditional and commercial
holothurian sea cucumbers (Trepang or Beche-de-mer), trochus, green
fi sheries. These are usually kept as part of the catch. Smaller `trash' fi sh
snails and clams, are overfi shed, particularly around the major coastal
taken in trawls are used as feed in aquaculture. Further, substantial,
population centres. Spiny lobsters are also targeted in oceanic waters,
though unquantifi ed, levels of by-catch are produced by distant waters
sandy reef lagoons and fl ats and mangrove areas.
fl eets, through use of blast fi shing and poison methods, and in the
milkfi sh and shrimp fry fi sheries, where juveniles of all other species are
Poison fi shing for demersal reef fi sh is also widespread having
discarded. There is also considerable targeted and incidental capture
burgeoned in the 1990s to supply the live fi sh food trade in Hong
of endangered species of turtles and dugong. The Philippines and
Kong and China, and also the aquarium trade, with prices increasing but
Malaysia have developed a bi-national agreement for conservation of
catch per unit eff ort (CPUE) declining sharply (Cesar et al. 2000). Existing
marine turtles, but this is not observed in remote areas. In many areas
fi sheries for endangered species (turtles and dugong) are continuing,
there are few biological regulations in fi sheries, or enforcement.
and there have been localised species extinctions.
Destructive fi shing practices
There has also been a signifi cant recent increase in eff ort in the
Destructive fi shing is also having severe environmental impacts.
pelagic fi sheries. For example, data from the Philippines Department
Massive habitat destruction and fragmentation, and changes in
of Agriculture suggest that yields of some pelagic species have
population and community structure are occurring from trawling and
continued to increase, but that catch per unit eff ort has declined
mechanised `push-netting' (with minimal use of by-catch exclusion
steadily, suggestive of `ecosystem overfi shing'. In Malaysia, Sabah's
devices), widespread use of explosives (reef bombing), electric fi shing,
fi shery stocks have declined by 70% since 1995. In Thailand, the Gulf of
`muro-ami' and use of poisons for fi shing. Widespread reef bombing
Thailand provides a classic case-study of a collapsed fi shery (Pimoljinda
has been attributed to increasing competition among fi shers and
& Boonraksa 1999).
corresponding declines in catches. Many reefs in the region have also
been targeted with poison fi shing for the live fi sh food trade in Hong
Further, around 70% of coral reefs in the broader region (including Sulu-
Kong and mainland China, initially using potassium cyanide or sodium
Sulawesi Sea and Indonesian Seas) are heavily overfi shed, producing less
cyanide and more recently also using poisons derived locally from
than 5 tonnes/km2/year, with clear indications of `trophic overfi shing',
plants. Poison fi shing has also been used in collection of ornamental
in comparison with the remaining 30% of reefs which produce of the
reef fi shes for the international aquarium trade. Figure 15 shows a fi sh
order of 15-20 tonnes/km2/year (DeVantier et al. 2004). Data from
trap off the coast of Sharp Island, Hong Kong.
reefs of the Philippines indicate that carnivorous families of reef fi sh
will not fully recover their pre-fi shed levels of biomass for 20-40 years
Decreased viability of stocks through contamination and disease
after eff ective protection has been implemented, when 20-25 kg of
Decreased viability of stocks has no known environmental impact at
catch may be taken from 1 000 m2 of reef area annually (equivalent to
present. However, there are some developing problems arising from
20-25 tonnes/km2) (Alcala pers. comm.).
At present, neither status nor future viability of some fi sheries are well
understood in parts of the region, and their status may be summarised
as being illegal, unreported and unregulated.
Excessive by-catch and discards
Environmental impacts of excessive by-catch and discards are also
severe, although some of the assessment criteria are largely irrelevant to
the situation in the region. Here, there is little to no by-catch or discards,
as virtually all of the much-diminished catch - including turtles, sharks
and even whales - is kept and eaten, with massive overexploitation of
species regarded as by-catch in other regions.
Figure 15 Fish trap off the coast of Sharp Island, Hong Kong.
(Photo: A. Cornish, ReefBase)
42
GIWA REGIONAL ASSESSMENT 54 SOUTH CHINA SEA
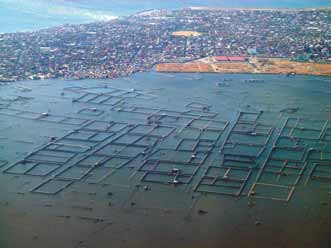
the increased occurrence of `red tides', diseases in pilchards and diseases
spreading from aquaculture farms. In areas adjacent to the region, there
has been a marked decline in aquaculture production in some lakes,
with Tilapia culturing aff ected in approximately 10% of lakes in the
Philippines. In the Java Sea, part of GIWA region 57 Indonesian Seas,
major loss of maricultured prawns has occurred, with disease spreading
into wild stocks.
Biological and genetic diversity
Biological and genetic diversity has moderate environmental impact in
the region, but with severe local impacts. There have been extinctions
of native species and local stocks as a result of introductions and a
clear decrease in heterozygosity in cultured fi sh stocks (e.g. Tilapia).
The introduced fi shes are eating and displacing endemic fi shes in the
Figure 16 Fish pens in Manila Bay, Philippines.
Philippines, Vietnam and other areas, with corresponding changes in
(Photo: J. Oliver, ReefBase)
community structure and diversity. There is also evidence of reduction
in genetic diversity in milkfi sh stocks in the Philippines due to repeated
spawning of cultured off spring, and release of cultured broodstock
caught fi sh production by 2010, to be supplemented by aquaculture.
into the wild.
Figure 16 shows fi sh pens in Manilia Bay, Philippines.
Socio-economic impacts
Disputes over sovereignty of the Spratly Islands have resulted in signifi cant
Socio-economic impacts related to unsustainable exploitation of fi sh
levels of multilateral tension in recent years. Some of the states have even
are severe from economic and other social and community aspects,
used arms to prevent other nations from occupying islands or reefs (Naess
with moderate health eff ects. There has been widespread loss of
1999). Examples include an incident in 1988 when a Vietnamese attempt
income from fi sheries collapse and loss of productivity (e.g. Gulf of
to stop the Chinese occupation forces led to the sinking of Vietnamese
Thailand), with concomitant shifts in target species. Fishing `down the
ships and drowning of more than 70 men. Subsequently, tensions have
food-chain' is widespread in most, if not all, countries of the South China
developed between the Philippines and China.
Sea. There have also been increasing levels of competition for fi sheries
resources among traditional artisanal fi shermen and commercial and
Given the above, the key socio-economic impacts of unsustainable
foreign fl eets.
exploitation of living resources in the South China Sea region
include:
In the Philippines and elsewhere, the fi shing sector has the highest
Reduced economic returns and loss of employment/livelihood
birth rate and highest levels of poverty. In many areas, fi sher
(e.g. from overexploitation causing fi shery collapse in the Gulf of
families' children are malnourished as most fi sh are sold and fi sh
Thailand and elsewhere);
consumption has declined from approximately 36 kg/person/year
Confl ict between user groups for shared resources (e.g. between
to 24 kg/person/year, with consequent high levels of malnutrition
local and outside/foreign fi shermen, Vietnam and elsewhere);
(DeVantier et al. 2004). There are few alternative options, and the
Loss of food sources (e.g. sources of protein) for human and animal
levels of poverty are such that many children are `trapped' into fi shing.
consumption (e.g. reduction in consumption among poor fi sher
Injuries and deaths from blast fi shing and diving are common, with
families in Philippines and elsewhere);
frequent deaths of children during muro-ami fi shing. There are also
Reduced earnings in one area by destruction of breeding
confl icts among diff erent fi shing groups, infl ux of foreign nationals to
populations and/or juveniles in other areas (migrating populations,
the fi sheries, with confl icts on the fi shing grounds. It is estimated that a
widespread throughout the region);
50% reduction in fi shing eff ort will be needed to restore many fi sheries
Loss of protected species (e.g. turtles, dugongs, whales, which is
to sustainable levels, particularly in the municipal coastal fi sheries
widespread throughout the region);
which, at present, are 90% artisanal and 10% commercial (DeVantier
Reduced commercial value resulting from tainting (particularly in
et al. 2004). It is also predicted that there will be a major defi cit in wild-
areas adjacent to major population centres);
ASSESSMENT
43
one of the most heavily populated. The governments have to provide
Box 6
Fisheries status and prognosis for South China Sea.
food for their people, and seafood is the main source of animal protein
In the South China Sea, the fisheries situation resembles malignant and
incongruent problem. Fishing fleets of individual countries are depleting the
for most Asians (two-thirds of the animal protein consumed in Asia
common resources of the sea, thereby causing long-term costs (loss of future
fishing opportunities) to all, and reaping short-term benefits at the cost of others.
comes from fi sh and crustaceans) (Coulter 1996). Thus, there is constant
Although there are unilateral attempts at improving the current situation (e.g.
China's fishing ban), regulation of fisheries is dependent on a regional approach
competition between socio-economic and environmental concerns,
to the problem where all littoral (states) have to commit themselves to agree
where the socio-economic concerns often win as food and economic
upon a limit to annual catches. The long-term effect of this development might
lead to the break down of the ecosystem. Scientists of the region have published
income are more important to the individual and the government than
widely on the current situation of important ecosystems and of fisheries, they have
attended numerous regional conferences, and they participate in government
sustainable use of coastal resources (Naess 1999).
funded projects, but as the political will to pursue environmental policies, based
on this knowledge, remains limited, as protection and management of South China
Sea ecosystems is left to the individual state. Consequently, no political space
is left for non-state actors, such as marine scientists, to influence in practice the
It was the unanimous view of the GIWA Task team that the region's
development of the marine environment of the region.
fi sheries stocks, as with stocks in neighbouring Sulu-Celebes (Sulawesi)
(Source: Excerpted from Naess 1999)
Sea and Indonesian Seas, are in urgent need of careful stewardship if
their sustainable future utilisation is to be assured. This will primarily
Increased risks of disease in commercially valuable stocks
require a high degree of local intervention and community-based
(aquaculture diseases aff ecting productivity and also infecting
support, and eff ective enforcement of fi sheries regulations. There also
wild stocks are all widespread throughout the region);
needs to be more reliable stock assessment and monitoring, founded
Inter-generational equity issues (access to resources);
in improved understanding of the population biology of the target
Human health impacts (child malnutrition, direct risks to blast
species and issues of ecological scale and connectivity in relation to
fi shermen, diving injuries to dive fi shermen are all widespread
replenishment. There is strong potential for well-planned mariculture
throughout the region).
of some ornamental and food species, with the need for development
of appropriate policy and legislation.
Conclusions and future outlook
For the GIWA concern of Unsustainable exploitation of living resources,
the present level of environmental impact is severe. Because of the
T
C
A
increasing coastal population, greater commercialisation, decline
Global change
IMP
in resources, lack of eff ective regulation and poor to non-existent
enforcement, there is expected to be a signifi cant environmental
The southern part of the marine region, with adjacent Indonesian
deterioration. This will be manifested mostly through overexploitation,
Seas and Sulu-Sulawesi Sea, forms part of the "heat engine" of global
lack of by-catch and discards, destructive fi shing and changes in diversity,
atmospheric circulation, with complex ocean-atmospheric dynamics.
and with the potential for decreased viability of stocks, such that the level
The northern and central parts of the region are aff ected by typhoons
of environmental impact in 2020 is expected to remain as severe, and get
during the southwest monsoon months, bringing destructive winds as
worse than the current situation (Box 6).
well as intense rains in excess of 1 000 mm of rain in less than 1 week
(Figure 17). The warm ocean and its links to the atmosphere contribute
Furthermore, all the socio-economic indicators are expected to
to the El Ni˝o Southern Oscillation (ENSO) phenomenon. The infl uence
deteriorate, with severe economic and social and community impacts
of El Ni˝o, La Ni˝a and the Australian and Asian monsoons contribute
and moderate health impacts associated with overexploitation of
to the unique climate conditions in this region, an object of global
fi sh by 2020. This prediction may be ameliorated to some degree
climatology research. The region also has complex oceanography and
by improved enforcement of regulations (e.g. Philippines Fisheries
current fl ow (see Regional defi nition).
Code, Chinese fi shing bans in some areas) and through successful
interventions by government and NGOs.
The GIWA Task team identifi ed the need to include an additional
issue with major implications for coral reefs in the region: Changes in
Most South China Sea nations recognise that fi sheries are resources
sea surface temperature (SST). Criteria used for scoring this Issue are
that are threatened if the current trend continues, but they also need
appended in Annex VI. At the time of the assessment in 2001, there were
the fi shery products to feed their populations and to uphold industries
no known environmental impacts associated with sea level change,
based on fi shery production (Naess 1999). East Asia was the fastest
increased UV-B radiation and changes in ocean CO source/sink function
2
growing economic region in the world in the 1980s and 1990s, and also
in the region.
44
GIWA REGIONAL ASSESSMENT 54 SOUTH CHINA SEA
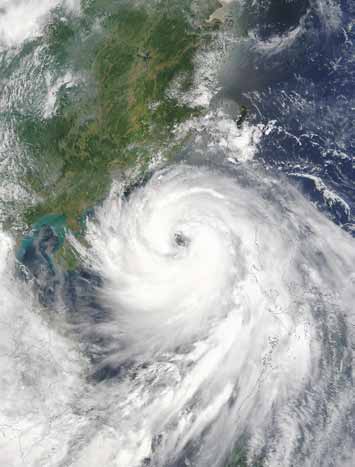
Socio-economic impacts
The socio-economic impacts associated with Global change, as they
relate specifi cally to international waters, are negligible to slight, with
a major degree of uncertainty remaining. There have been some
economic and health eff ects associated with drought and linkages
to habitat loss (clearing and forest fi res) and freshwater shortage,
particularly overextraction of freshwaters and salination of wells. Health
eff ects include potential links to dengue and haemorrhagic fever and
respiratory illnesses from haze and forest fi res, with some displacement
of communities due to fi res and fl oods.
The following key socio-economic indicators are likely to be adversely
aff ected to greater or lesser degree:
Freshwater
availability;
Food
security;
Employment
security;
Changes in productivity of agriculture, fi sheries and forestry;
Changes in resources distribution and political jurisdiction;
Response costs for extreme events;
Loss of income and employment;
Loss of incomes and foreign exchange from fi sheries;
Loss of opportunity for investments (both domestic and
foreign);
Figure 17 Typhoon Imbudo over the South China Sea,
Increased costs of human health care.
23 July 2003.
(Photo: NASA)
Conclusions and future outlook
According to Talaue-McManus (2000 and pers. comm.) there is suffi
cient
Environmental impacts
evidence of major environmental changes resulting from global climate
Changes in hydrological cycle and ocean circulation
change in the region. While the socio-economic impacts are yet to
Changes in the local/regional water balance in recent decades and
be evaluated, their signature on SSTs as well as long term changes
increased variability of current regimes (including those caused by
in air temperatures and on atmospheric chemistry are unequivocal.
changes in ENSO events) have had slight environmental impacts.
Nevertheless, assessing the impacts of Global change using the GIWA
There is anecdotal evidence for changes in coastal currents and erosion
scoring criteria determined that this concern had only slight overall
patterns in Thailand and in oceanographic upwelling patterns following
environmental impacts at the time of the assessment. Environmental
ENSO (e.g. Philippines) and hydrological evidence of changes in rainfall
impacts are expected to deteriorate, but remain slight by 2020. There
and storm patterns (e.g. Sabah).
are increasing per capita releases of CO and the increasing population
2
will increase local production of greenhouse gases. However, there is
Changes in sea surface temperature
considerable uncertainty in climate model predictions of changes in
Changes in the sea surface temperature has also had a slight impact
temperature and sea level, and also in the capacity for acclimation and
already, with changes in the structure of coral reef communities from
adaptation of species and ecosystems. Corresponding socio-economic
elevated SSTs during various coral reef bleaching events since 1983,
aspects are also expected to deteriorate, with moderate levels of
notably during mid-1998. There has been good recovery of most
economic impact and other social and community impacts and slight
bleached areas and, on average, none of the bleaching events appear
health impacts by 2020.
to have been as severe as those from some other countries, with the
caveat that most data are anecdotal (Wilkinson 2000, 2002).
ASSESSMENT
45
Priority concerns for
likely to impact on a large proportion of the population. There will be
further analysis
limits on other sectors from freshwater shortage and other concerns.
Thus, total pressures on international water resources are likely to increase
Future scenarios suggest a rapid human population increase, with
moderately, causing signifi cant deterioration in both the environment
increasing urbanisation and increasing reliance on industrialisation
and socio-economic structures, despite improved regulation.
and extractive industries. This population explosion is driven primarily
by socio-cultural and religious attitudes, and infl uenced by factors
The worst aff ected areas face moderate to severe environmental
as diverse as world trade, tourism, industrialisation, fi sheries, and oil
impacts causing severe socio-economic hardship by 2020. Despite
exploration and exploitation. The region's rapid economic development
recent improvements in national and regional capacity, there remains
and population growth are the cause of signifi cant ecological damage in
insuffi
cient capacity for eff ective policing or enforcement of regulations
coastal and marine areas. The primary environmental threats by humans
or for developing measures for alleviation of existing water-related
in the South China Sea are the destruction of mangrove forests, sewage
problems, primarily because of low fi nance and a relatively small taxation
pollution, exploitative fi shing practices and overfi shing, coral reef
base. There are already serious health issues arising from episodic
degradation, and damage to seagrasses and wetlands (LME 2004).
freshwater shortage. The rate of deterioration can be minimised by on-
going and future planned interventions, including those at multilateral,
There are likely to be signifi cant increases in industrial fi shing and
national, provincial and local government levels and through the
aquaculture (shrimps, seaweeds) in the region. Exploitation of
concerted eff orts of several international NGOs. Nonetheless, continuing
commercial pelagic fi sheries for tuna and billfi sh is expected to
international assistance will be required in the short term for major
increase by 2020. The increasing reliance on motorised fi shing craft
improvement in international waters-related issues.
and major increase in industrial fi shing is expected to cause severe
overexploitation with decreasing production from coastal and
For the present, six of the 23 environmental GIWA issues are already
reef fi sheries, and concomitant food shortages. Regulating fi shing
having severe impacts:
pressure provides a complex management challenge, with important
Suspended
solids;
linkages to the application of Marine Protected Areas (MPAs) in stock
Loss of ecosystems;
replenishment. Future protection of coastal and coral reef areas will be
Modifi
cation
of
ecosystems;
important if these key habitats at the global centre of biodiversity are
Overexploitation
of
fi
sh;
to be sustained.
Excessive by-catch and discards;
Destructive
fi
shing
practices.
There are trends of increasingly large-scale forestry, by both national
and international commercial operators. Large areas of the `loggable
There was an unambiguous overall prioritisation of the fi ve GIWA
forests' have already been logged and other areas have been assigned
concerns, when assigning equal weight to environmental, economic,
for logging, contributing to severe soil erosion in many areas. Large-
human health and social and community impacts:
scale sediment mobilisation from unregulated forestry and agriculture
1. Unsustainable exploitation of fi sh and other living resources is
has already impacted on water quality of streams and rivers and
of highest priority, with severe present levels of environmental,
ultimately on estuarine and coastal habitats (e.g. fringing reefs) and
economic and other social and community concerns and moderate
processes in much of the region.
health impacts.
2. Habitat loss and community modifi cation is of equal priority
There is potential for expanded off shore oil and mineral exploration,
from environmental, economic and other social and community
and increased tanker traffi
c through South China Sea between Japan
impacts, but of slightly less priority in terms of health impacts.
and the greater Pacifi c Ocean and the Indian Ocean - west Asia-Europe,
3. Pollution is of third priority, with moderate levels of environmental
with attendant risks of collisions and spills (Etkin 1997, MPP/EAS 1998,
and socio-economic impact.
Chua pers. comm.).
4. Freshwater shortage is of fourth priority, with moderate levels of
environmental and economic impact, but only slight health and
Expansion of fi sheries, mining, various forms of plantation agriculture and
other social and community impacts at present.
forestry, increasing urbanisation and manufacturing will further increase
5. Global change is of fi fth priority, with only slight present
pressures on catchments and rivers, and increasing water shortages are
environmental and socio-economic impacts.
46
GIWA REGIONAL ASSESSMENT 54 SOUTH CHINA SEA
These fi ndings are consistent with those of the UNEP Transboundary
of the region and fl ooding in others. Future predicted increases in both
Diagnostic Analysis (TDA), which rated habitats (mangroves, coral reefs,
the frequency and intensity of ENSO events are likely to have major
seagrasses and estuaries) and marine and freshwater fi sheries as the
environmental and socio-economic impacts, particularly given that the
highest priority concerns, followed closely by pollution (sewage and
human population is expected to double by 2033. Global change eff ects
freshwater contamination) and freshwater concerns (Talaue-McManus
on habitats are predicted to be manifested through both freshwater
2000). Thus, these two large-scale analyses (TDA and GIWA), using
shortages and fl ooding, particularly in lowland stream, river, marshland
diff erent approaches, have concurred on the key international waters
and riparian communities. Potentially severe global change eff ects are
concerns in the region. Both analyses confi rm that the international
also expected for coral reef habitats, through the synergistic eff ects
waters environment and socio-economy of much of the South China
of changes in ocean alkalinity aff ecting reef calcifi cation processes
Sea are already under severe impact, requiring continued concerted
(Kleypas et al. 1999) and through elevated SSTs causing widespread
national and international intervention for any chance of amelioration
reef bleaching and death (Hoegh-Guldberg 1999, Wilkinson 2000,
in the short to medium-term.
2002). There are also expected to be severe consequences from
complex linkages between habitat loss and fi sheries, and pollution
There is expected to be deterioration in the environmental and
and fi sheries. It is expected that environmental and socio-economic
economic impacts of most GIWA concerns, but with some stabilisation
impacts of climate change will increase after 2020.
and even improvement in others, notably for health and other social
and community aspects. There is also expected to be widening gaps
The following cuasal chain analysis will focuses on the linkages between
in both implementation and success of interventions among diff erent
Habitat and community modifi cation and Unsustainable exploitation
countries.
of living resources, particularly the environmental and socio-economic
impacts and causes of overfi shing and destructive fi shing practices.
With equal weighting applied to the four indicators, there was little
overall change in scores or ranking for the future:
1. Unsustainable exploitation of living resources.
2. Habitat loss and community modifi cation remain jointly of primary
concern and are expected to have severe environmental and
mostly moderate to severe socio-economic impacts.
3. Freshwater shortage ranked third and is expected to have moderate
environmental and socio-economic impacts.
4. Pollution is also expected to have moderate environmental and
socio-economic impacts and is ranked fourth because there will
be an increase in pollution-mitigation projects in the region.
5. Global change, with slight to moderate impact, ranked fi fth.
Future impacts from Global change were suffi
ciently uncertain
for it to rank as the least of the GIWA concerns for 2020, although
potentially strong linkages with freshwater shortage and habitat
loss and community modifi cation were identifi ed, complicating the
prioritisation analysis.
Global change is expected to impact on freshwater shortage and
oceanography and on habitat loss. Other two-way linkages with
high potential for `feedback' will occur between freshwater shortage,
pollution and habitat loss and between habitat loss and overexploitation
of fi sh. Global change eff ects on freshwater shortage are likely to be
manifested through changes in the frequency and intensity of ENSO
events. ENSO during the 1990s caused water shortages in some parts
ASSESSMENT
47
Causal chain analysis
This section aims to identify the root causes of the environmental
analyses of the GIWA adopt relatively simple and practical
and socio-economic impacts resulting from those issues and
analytical models and focus on specifi c sites within the region.
concerns that were prioritised during the assessment, so that
For further details on the methodology, please refer to the GIWA
appropriate policy interventions can be developed and focused
methodology chapter.
where they will yield the greatest benefi ts for the region. In order
to achieve this aim, the analysis involves a step-by-step process
The Causal chain analysis focuses on the linkages between the two
that identifi es the most important causal links between the
GIWA concerns Habitat and community modifi cation and Unsustainable
environmental and socio-economic impacts, their immediate
exploitation of living resources, particularly the environmental and
causes, the human activities and economic sectors responsible
socio-economic impacts and causes of overfi shing and destructive
and, fi nally, the root causes that determine the behaviour of
fi shing practices. The causal chain diagram illustrating the causal
those sectors. The GIWA Causal chain analysis also recognises
links for Habitat and community modifi cation and Unsustainable
that, within each region, there is often enormous variation in
exploitation of living resources is shown in Figure 18.
capacity and great social, cultural, political and environmental
diversity. In order to ensure that the fi nal outcomes of the GIWA
The overall setting for the following analysis is summarised by Naess
are viable options for future remediation, the Causal chain
(1999) (see Box 7).
Impacts
Issues
Immediate causes
Sectors/Activities
Root causes
Urbanisation
Environmental:
Modification of
Urbanisation and industrial
Loss and fragmentation of
habitats
development
Economic
mangrove forest, coral reefs,
seagrass beds, wetlands
Expansion of mining activities
Industry
with coastal run-off
Demographic
Destructive fishing
Deforestation for
practices
Mining
settlement and agriculture
Political
Expansion of palm oil plantages
Overfishing
Expansion of fisheries and
Socio-economic:
Deforestation and
Knowledge
aquaculture and the use of
Conflicts among villages
agriculture
destructive fishing methods
and outside fishers
Trawling, drift nets
Injuries to fishers
Blast fishing
Changes to market prices
Use of poisons for live fish trade
Governance
Expansion of tambak
Fishery
Figure 18 Causal chain diagram illustrating the causal links for Habitat and community modifi cation and Unsustainable exploitation of
living resources in the South China Sea region.
48
GIWA REGIONAL ASSESSMENT 54 SOUTH CHINA SEA
Box 7
Transboundary disputes in the South China Sea region.
and easily manipulated fi nancial environment assist the growth of
More than 70% of the population in the South China Sea area live in coastal areas,
industry. This in turn contributes to growing urbanisation, as workers
and their dependency on the sea for resources and a means of transportation is
high. Fisheries in the Southeast Asian region represented 23% of the total catch
are drawn from the lowly paid rural occupations to the comparatively
in Asia, and about 10% of the total world catch in 1992. At the same time, high
economic growth is overshadowing environmental problems like overfishing,
better paid urban industries. This is especially true of young women
destructive fishing methods, habitat devastation and marine pollution. The
who make up much of the industrial working-class.
environmental security aspect is therefore pertinent. High economic growth, often
coupled with depletion of natural resources, intensifies conflicts like the one in the
South China Sea. The fact that the area is rich in marine resources, and potentially
rich in oil and gas, are some of the reasons why the claimants are aggressive
Poorly regulated development of industry, and the overcrowding
and stubborn in their claims and political rhetoric. The environmental security
concept refers to a field of research where the relationship between security issues
that results from intensive resettlement near industrial areas, or
and environmental issues is in focus. Increasing transboundary environmental
within industrial dormitories, has had a detrimental eff ect on local
problems generated by economic growth and a lack of commitment to protect and
manage marine resources need integrated political action between the countries
environments. Wetlands have been reclaimed, many are poorly
of the region. Fisheries make a good example. Their high economic value and the
fact that seafood is the main source of animal protein for a rapidly growing coastal
drained and subject to seasonal fl ooding, and mangrove forests have
population, have made countries around the South China Sea publicly exhort
their fishermen to venture into disputed waters to catch fish. This has resulted in
been removed in order to gain access to cheap land close to cities and
a number of incidents, notably within the disputed Spratly area. Illegal fishing,
overfishing, and poaching of rare species are not an exception, but the norm. In
the coast.
this case, the `ASEAN way' represents an impediment to establishing regional
regulatory instruments. While fish stocks are being depleted, and the ASEAN
member states recognise the need for conservationist programmes, they continue
Expansion of mining activities with coastal
to implement production-oriented policies and encourage their fishermen to catch
more and more living resources.
run-off
(Source: Excerpted from Naess 1999)
As with industrial development, the growth of mining has resulted in
the alteration of the coastal environment. Coral mining for building and
making of cement is common, and the need for sand and gravel has
been stimulated by the development of urban and industrial growth.
Environmental and socio-
Changes to the fl ow of rivers have been signifi cant and siltation of river
economic impacts
systems is common.
Loss and fragmentation of mangrove forests from development,
Deforestation for settlement and agriculture
including conversion for aquaculture;
The growth of the population in coastal Southeast Asia and the
Loss and fragmentation of coral reefs from coastal development,
simultaneous growth of an affl
uent middle class have stimulated the
sediment pollution etc. (Figure 19);
demand for high quality timber for use as furniture and in building.
Reclamation of wetlands for urbanisation, industry and
Old growth rainforest timbers are especially prized, both in the region
agriculture;
and abroad. With the rise in rural populations has come the need to
Loss and fragmentation of seagrass areas;
expand agricultural areas to provide food for growing populations.
Confl icts among villagers and outside fi shers;
The demands of the urban middle-class are also changing with the
Injuries
to
fi
shers;
importation of western packaged foodstuff s and the fashion for
Changes to market prices.
American foods. This has means that more land has been given over to
the production of varieties of food, not just staples.
Expansion of palm oil plantations
Immediate causes
Palm oil plantations have increased in area right throughout the
Southeast Asian and Pacifi c region. Coconut plantations and virgin
Urbanisation and industrial development
coastal wetlands are now increasingly being removed and replaced by
The countries bordering the South China Sea are undergoing intensive
the more economically profi table oil palms. These are closely planted
economic development, despite the Asian fi nancial crisis of the late
and the undercover areas are often dark, mosquito-infested and home
1990s. The high population growth and population density has
to feral animals and pests, including snakes and rats. The land also
made the region a focus for the location of manufacture, and many
becomes covered in refuse and palm branches and has a tendency
multinational companies have relocated to the Southeast Asian region
to become sour. Plantations are often close to, or in, watercourses and
seeking to reduce labour costs. Political stability and low infrastructure
coastal lowlands.
costs, as well as a favourable climate for investment in a poorly regulated
CAUSAL CHAIN ANALYSIS
49
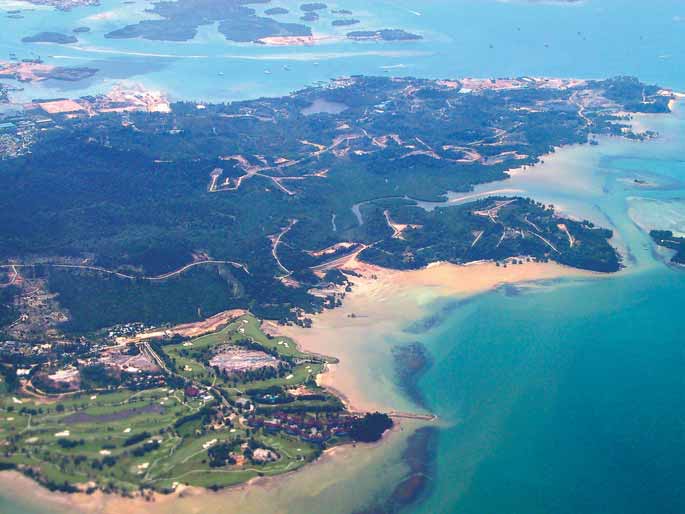
Figure 19 Islands and fringing reefs near Singapore showing a golf course and road development.
(Photo: J. Oliver, ReefBase)
Expansion of fisheries and aquaculture and the
Trawling, drift nets, use of mechanised push nets by commercial
use of destructive fishing methods
operators
The growth of coastal populations, the high demand for fi sh as a
The intensive use of large-scale fi sh nets has been a major component
source of protein (particularly needed by poor coastal populations)
in the overexploitation of fi sh and destruction of habitats in the South
and the demand for high quality large fi sh for the luxury and tourist
China Sea. Trawlers and drift net commercial operators are often part
markets have all stimulated the rapid expansion of fi sheries. There
of foreign fi shing fl eets that are not based in the region and do not
has been recent major expansion in large foreign capital commercial
market products in the region. The value-added component of the
operations and mariculture, notably the development of the live fi sh
industry, services, labour, accommodation, fuel and equipment supply,
trade. The live fi sh trade, where fi sh captured from regional waters are
is also sourced away from the region, generally in north Asia. The region
transported to large holding cages, sometimes in international waters,
therefore suff ers the eff ects of declining resources and environmental
before shipping to the luxury market in Hong Kong, Singapore and
quality with few if any economic benefi ts, either short- or long-term.
China, provides improved, but still negligible returns for local fi shers.
Trawling is a high capital industry, numbers of trawlers are not
Blast fi shing, trawling and other destructive fi shing techniques are
regulated and activities are not monitored. The result is widespread
`endemic' in the region, including within MPAs, and have caused
environmental damage.
massive destruction to coral reefs (e.g. Hon Mun MPA, Vietnam)
Large drift nets are a major environmental threat. Nets may be
(Vo et al. 2002).
several kilometres long and many metres deep and trap virtually all
50
GIWA REGIONAL ASSESSMENT 54 SOUTH CHINA SEA
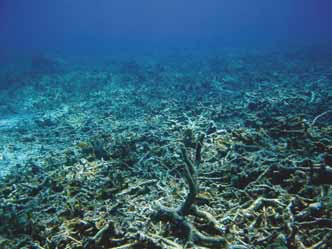
pelagic animals. When they are abandoned or lost, they drag over
Expansion of tambak
the bottom and collect any benthic marine organism regardless of
Tambaks are small prawn and fi sh ponds built in mangrove areas, and
size, protected status or possible economic use and continue to
are a popular means for increasing local fi sh production. However, the
trap animals drawn to the trapped carcasses.
use of tambaks is not controlled and the water in most ponds is only
Push-nets, nets attached to large poles spread from the front of a
cleaned and aerated by tidal action. The tambaks generally last only
boat, scour the ocean bed and eff ectively remove bottom dwelling
one or two seasons unless there is careful management of the water
organisms. The three forms of netting over time can denude large
and walls; the ponds are then neglected and the area becomes useless
productive marine areas.
for long periods. Many coastal mangrove forests have been lost to the
construction of poor quality tambaks.
Blast fi shing by artisanal, small-scale commercial operators
In order to compete in a declining, overexploited market, local artisanal
and small-scale commercial fi shers are reverting to the use of explosives
rather than line fi shing (Figure 20). Blast fi shing stuns all fi sh in the
Root causes
immediate radius of the explosive charge and these fi sh can then be
gathered from the surface of the ocean; other organisms are shattered
Economic
and die on the bottom. Fish caught using this method can be identifi ed
Economic growth
at the market by the glassy state of their eyes but are often sold cheaply
Negative aspects of increasing economic growth have placed high
due to size, type and quantity.
pressures on the environment. While the fi nancial and social stability
of the Southeast Asian region have been welcomed after decades of
stagnation and political crises, the management of the terrestrial and
marine environments has been neglected.
Foreign aid
High levels of foreign aid have been expended in the South China Sea
region, particularly as support for poverty alleviation programmes
and infrastructure development (e.g. following the Vietnam War).
Industrialisation is capital intensive, as are programmes to improve
agricultural productivity and fi shing effi
ciency. The region remains a
focus for international aid. These programmes have both positive and
negative aspects: production and employment have been increased;
living standards for the general middle classes have improved; education
and health facilities are comparatively high; but the overcapitalisation
of fi sheries has meant that high operational costs have forced fi shers to
Figure 20 Damaged corals, North of Pulau Gut, Malaysia.
(Photo: B. Huzaimi, ReefBase)
seriously overfi sh, particularly in the inshore regions.
Market demand
Use of poisons by commercial and small-scale operators for live
Local and international market demands have been important in driving
fi sh trade
the exploitation of resources that have resulted in the destruction of
Reef food fi shes and ornamental aquarium fi shes are frequently
habitats and community modifi cation. A key example is the rapidly
caught using cyanide and other poisons. The immediate eff ects are
increasing demand for high quality, expensive fi sh and seafood, a
not noticeable, and as the market depends on a speedy delivery from
product of rising living standards and the growth of the affl
uent middle-
fi sher to market and diner, the fi nal consumer is unaware of the method
class in Southeast and East Asia.
of catch. The aim of the live fi sh trade is to provide large fi sh, preferably
species that are red or blue in colour (signs of good luck) quickly and
Export pressures for forest products - building materials
cheaply. The diner however, is charged a considerable mark-up for the
Market demand, both local and international, for high quality rainforest
supply of fresh, live swimming marine organisms.
timbers, is driving the forestry industry to use clear felling techniques.
CAUSAL CHAIN ANALYSIS
51
Companies, some being Malaysian in origin, are now establishing
Overcapitalisation, subsidies (national/international) to increase fi sh
operations as far away as Papua New Guinea where forests are relatively
catch through improvement of gear, with increasing eff ort, and little or
pristine. Economic pressures are driving this approach and most of the
no consideration for long-term sustainability is widespread (e.g. in the
high quality material is exported as manufactured furniture or as
Philippines there has been gear improvement but no consideration of
sawn timber. The results are loss of ecosystems, reduction of native
habitat or stock sustainability). Competition among diff erent fi sheries
forests and erosion following the heavy wet season rains. Many of the
sectors to continually increase catches usually overrides eff orts to
rainforest areas that have been modifi ed or destroyed are located in
sustain fi sheries.
fragile environments, frequently mountainous with seasonally high rain,
tropical storms and generally shallow soils.
Political
Military infl uence
Export pressures for fi sheries products, aquarium trade and
The region has a high military presence, due to long periods of political
alien species
instability, and the military in all countries have considerable political
Economic growth, increasing prosperity and changing cultures have
infl uence. China, to the north, exerts considerable infl uence in all regions
altered export market demand for diversity of fi sheries foodstuff s.
of Southeast Asia and has growing economic power. Territorial disputes
This has increased the exploitation of alien species once reserved for
(e.g. Spratly Islands) with military involvement have contributed to the
festivals or eaten by the richer members of local societies. In coastal
failure to implement ameliorative policies addressing habitat loss and
communities, especially those marginalised by economic development,
overexploitation (e.g. establishment of a multilateral MPA network
negative social attitudes, or lacking access to regional infrastructure, the
including Spratly Islands).
pressures on marine resources are considerable. Poor communities still
rely on catches of small fi sh, shellfi sh and animals collected by gleaning
Demographic
and strand gathering.
Overpopulation - migration to cities
Rapid population growth and migration of rural populations to the
Increasing market demand in the live reef fi sh food trade has caused
large commercial and industrial cities of the region is a common
expanded use of large cages, in both national and international waters,
aspect of social change in the last 20 years. The cities are centres of
as holding pens for live fi sh. The collection of fi sh by mother ships for
health, education and employment infrastructure and the rural poor
rapid transport to markets in Singapore, Hong Kong and other wealthy
have little opportunity to access a better quality of life in the provinces
centres supports the development of the industry. Many aspects of
that have often been neglected by the urban-based bureaucracy and
the fi shery are in contravention of local and national regulations, but
wealthy elite.
continue because of inadequate policing, lack of governance, local and
regional corruption, and declining infrastructure.
Most of the impacts and their immediate causes (poor management of
agriculture, forestry, coastal fi shing pressure and exploitation of inshore
The foreign aquarium trade that relied on the supply of high quality
resources) are exacerbated by population growth and migration.
small ornamental reef fi sh to international markets is also highly
Throughout the region, there has been signifi cant settlement on
profi table. The increasing popularity of live coral aquaria around the
`marginal' lands in recent decades; coastal wetlands are often the only
world increases the demand for particular, mostly colourful, species.
available land for the landless. It can be expected that this will continue.
This has contributed to changes in species composition/abundance,
The recent purges of transmigration settlers by local inhabitants in
ecological structure and function of coral reefs that are closely
Indonesia is only one example of the consequences of internal forced
targeted.
migrations.
Overcapitalisation, technology `creep', stock targeting
Poverty - limited access to other forms of livelihood
The commercial fi shery in the South China Sea is overcapitalised and
Poverty, overpopulation and the limited access to other forms of
depends on rapidly changing technology in order to keeps boats at sea
livelihood for the rural subsistence farmers and workers are all factors
for longer periods as well as specialised computer aids for locating shoals
that continue to impact on the overexploitation of inshore fi sheries and
of species highly prized by the market. This has led to excessive stock
other living marine resources. Almost everything from the sea will be
targeting of particular species of fi sh, especially those in high demand.
eaten or otherwise used, unless it is harmful. Biodiversity, protection of
native stocks and environmental management are complex questions
52
GIWA REGIONAL ASSESSMENT 54 SOUTH CHINA SEA
to explain to people who are at subsistence levels reliant largely on their
All forms of natural resource exploitation are subject to considerable
immediate environment for food.
manipulation by bureaucratic agencies and entrepreneurial groups
with vested interests in expansion of industry and wealth generation.
Knowledge
Poor governance, which impacts on inadequate legislation, lack
Perpetuation of environmentally damaging traditional practices
of management expertise and fi nancial resources, and political
exacerbated by a lack of awareness of environmental change
interference in decision-making, has meant that environmental
At village and local community levels, traditional practices are still
management programmes have often fallen short of their planned
highly regarded, with both positive and negative eff ects. In regional
targets.
Indonesia, for example, the Adat laws are still powerful and regulate
daily life in villages. Awareness of the holistic nature of contemporary
Effi
cient environmental management in Southeast Asian nations is still in
environmental management and broader issues such as climate
its infancy. Fisheries management lags behind terrestrial environmental
change, overexploitation of marine resources, poor management of
management. The large-scale nature of the commercial fi shing industry
terrestrial soils and vegetation, and disposal of garbage and human
means that it can manipulate government and bureaucracy and the
wastes are still inadequate. Although the people are not ignorant, they
consequent lack of incentives on the part of both industry and
need to be reached in ways that do not imply lecturing by government
government to change the situation makes it possible for inappropriate
bureaucrats or foreign experts, and local attitudes and opinions must
practices to continue (Box 8).
be considered. In many cases, the education resources are not available
at a level of instruction suitable for regional communities that often
In relation to management systems, major improvements are required
have poor literacy and speak dialects.
in relation to:
Lack of feasibility assessment (or EIA) in developing new fi sheries,
Governance
stock assessments and data for planning and managing fi sheries;
Lack of political will, poor governance, inadequate regulation,
Box 8
Committments to multilateral programmes.
multilateral/inter-sectoral disputes
Although an Action Plan for the East Asian Seas was agreed upon as early as 1981,
Lack of political will, combined with inadequate legislation is a major
this plan has had minor effects on the South China Sea region, because of a lack of
commitment by the signatory states to fund and undertake activities in accordance
driving force behind environmental degradation. Political structures
with the initial idea of the plan. Initially, only the five original ASEAN members
in Southeast Asia are still dominated by hierarchy and patronage and
joined the Coordinating Body on Seas of East Asia (COBSEA). Thus the scope of
the East Asian Seas Action Plan was limited. This is not to say that nothing has
democratic decision-making is not a feature of most policy making,
been done regarding environmental problems, it is rather that the management
of common resources depends on the individual state, or a sub-regional group
even in countries with reasonably open electoral systems. The political
of states. Numerous sub-regional projects have been established without help
from the COBSEA, for example the Asian Development Bank's Coastal and
and educated elite have extremely high levels of power in most regional
Marine Environmental Management in the South China Sea project, involving
Cambodia, Vietnam and China; and the Malacca Strait Co-operative Programme,
societies.
established by Singapore, Malaysia and Indonesia. In addition to these three, a
sub-regional programme on the Gulf of Thailand, including Malaysia, Thailand,
Cambodia and Vietnam, seems to be on its way with help from the Southeast Asian
Widespread, ineff ective governance leads to the growth of corruption.
Programme in Ocean Law, Policy and Management. Although there is a lack of a
binding environmental agreement among South China Sea littoral states, ASEAN
This is endemic in many nations of the region. Bureaucratic inaction,
has achieved a lot in terms of bringing the ASEAN member states together in
maritime environmental projects. The ASEAN Subcommittee on Marine Science
lack of fi nancial resources and a general mistrust of government offi
cials
(ASCMS) and the ASEAN Senior Officials on Environment (ASOEN) have been
at village levels makes it diffi
cult to obtain accurate statistics on issues
responsible for cooperative projects with Australia (the ASEAN-Australia Marine
Science Programme), Canada (ASEAN-Canadian Marine Pollution Programme),
such as resource exploitation. Regional language diff erences, lack of
the USA (ASEAN-US AID Coastal Resources Management Programme), Japan,
the Republic of Korea, and the European Community. Most of these projects
education standards and complex notions of quantifying catch in
have come about as a result of cooperation among marine scientists, decision-
makers and foreign aid agencies.Other projects have been established with help
provincial areas are also issues to be overcome in attempting to rectify
from NGOs, IGOs or international aid agencies. Various UN organisations have
sponsored marine scientific research projects like the UN-ESCAP Regional Mineral
the problems of overexploitation of marine resources.
Resources Development Centre and UNESCO's major Inter-Regional Project on
Research and Training on Integrated Management of Coastal Systems (COMAR)
in Asia-Pacific. An influential NGO is the International Centre for Living Aquatic
Control of commercial fi sheries by the operators in circumstances of
Resources Management (ICLARM, now WorldFish Center), which has sponsored a
range of activities, from conferences and workshops on waste management and
poor governance and inadequate regulation foster the continuance
marine pollution management, to the establishment of important databases like
FishBase, ReefBase, etc. The Asian Development Bank (ADB), with assistance from
of poor management practices. There is limited, generally ineff ective,
the Swedish International Development Cooperation (Sida), has been managing
a project since 1993 called Coastal and Marine Environmental Management in the
fi sheries regulation and enforcement in the marine states of the
South China Sea. The project aims at improving Vietnamese, South Chinese and
region, as the resources required to maintain surveillance and eff ect
Cambodian capabilities in coastal environmental management, and has succeeded
in bringing the two ASEAN countries and China together.
prosecution of off enders is prohibitive.
(Source: Excerpted from Naess 1999)
CAUSAL CHAIN ANALYSIS
53
Introduction of management schemes by international `experts'
with no local knowledge;
Top-down
decision
making
systems;
Little complementarity/communication across fi sheries sectors in
most nations (e.g. Thailand where there is some complementarity);
Insuffi
cient transboundary communication on fi sheries statistics,
planning and management, although FAO, ICLARM, UNEP-GEF and
APEC fi sheries advisory group among others, are working towards
improving this;
Insuffi
cient collective vision for sustainability of fi sheries e.g.
`Tragedy of the Commons' at local, national and regional levels;
Permit issues: Some areas are not well defi ned in terms of necessity
for permit (e.g. Spratly Islands, Sulu Sea) and foreign boats
overexploit resources. In other areas, foreign boats gain permits to
fi sh then overexploit resources, particularly in some MPAs. This can
lead to tensions from local and international competition.
There is a general lack of data, which contributes to the
management diffi
culties (see Assessment, Overexploitation);
There is endemic corruption, including the illegal selling of permits/
licenses, and production of fake permits (e.g. Taiwanese boats
`registered' in Indonesia).
These all contribute to the lack of management control of exploitation
of natural resources and development of capacity in the region.
Conclusions
The key root causes of Habitat and community modifi cation and
Overexploitation, and indeed of most other international waters-related
issues, were easily identifi ed and almost axiomatic throughout much
of the region. However, addressing these root causes will continue to
be extremely diffi
cult. The rule of law is being steadily eroded in many
areas, with endemic corruption among enforcement agencies and
legislature, and there has been insuffi
cient commitment and progress
in eff ective implementation of multilateral treaties and agreements
(Box 8). Thus, by 2020, the predicted population increase is expected to
cause a moderate increase in impacts and pressures despite improved
technical, policy and regulatory changes, surveillance and enforcement
of regulations.
54
GIWA REGIONAL ASSESSMENT 54 SOUTH CHINA SEA
Policy options
This section aims to identify feasible policy options that target
the South China Sea lacks formalised cooperative instruments that
key components identifi ed in the Causal chain analysis in order to
integrate and coordinate eff orts by littoral states at managing and
minimise future impacts on the transboundary aquatic environment.
protecting the marine life, and regulating marine economic activities
Recommended policy options were identifi ed through a pragmatic
(Naess 1999).
process that evaluated a wide range of potential policy options
proposed by regional experts and key political actors according
The nations of the South China Sea region have not established
to a number of criteria that were appropriate for the institutional
eff ective conventions or legal frameworks for common governance of
context, such as political and social acceptability, costs and benefi ts
the marine environment. Of the multilateral treaties and conventions
and capacity for implementation. The policy options presented in
already in place, there has been insuffi
cient implementation to
the report require additional detailed analysis that is beyond the
date. Fisheries, ecosystems, shipping and pollution are all regularly
scope of the GIWA and, as a consequence, they are not formal
discussed in meetings among scientists and at various levels of
recommendations to governments but rather contributions to
government and inter-governmental meetings (e.g. ASEAN), but the
broader policy processes in the region.
attempts at addressing these important questions multilaterally remain
elementary.
The few attempts at bringing the littoral states together in creating
regional regimes by UNEP, and also by individual ASEAN member
Definition of the problem
states, appear to run into diffi
culties as proposals for cooperation are
often blocked by one or several states; often because of economic or
The policy analysis for the South China Sea region is, like that for
other selfi sh state interests. As pointed out by Naess (1999): "The states
the related region of the Sulu-Celebes (Sulawesi) Sea (GIWA region
around the South China Sea have not clarifi ed their claims to maritime
56), greatly complicated by the complex interaction of national and
zones in accordance with the provisions of UNCLOS ... regardless of
regional jurisdictions. There are many transboundary issues that
the political situation. The use or abuse of international law will have
remain unresolved due to the aftermath of regional confl icts, colonial
important eff ects on all claimants, and how the LOS is interpreted and
heritage and international political affi
liations. Within this unique
implemented in the South China Sea has and will have important
transboundary milieu, the concept of sustainable development has
implications. Almost everything remains to be done in terms of
many interpretations: economic development is a leading feature of
implementing UNCLOS".
national planning is all countries of the region and environmentally
sustainable development is often a minor component within
The following Policy options analysis seeks approaches that will address
government policy.
these issues and are suggested to assist government thinking on the
search for national and regional solutions.
If the South China Sea is compared with other semi-enclosed seas
like the Mediterranean, Baltic, and Caribbean, it is apparent that
POLICY OPTIONS
55
Construction of the policy
qualifi ed and experienced staff , and also by funding short-falls and cut-
options
backs. There is widespread lack of awareness and acceptance of most
laws, and lack of compliance with regulations. There is also insuffi
cient
The initial step in construction of useful policy options is defi nition of
capacity for enforcement of regulations and quotas (Box 9).
some key present defi ciencies and needs, as detailed above and below.
While the Philippines, Malaysia and Indonesia have adequate
environmental legislation to overcome many of the issues and concerns
Policy deficiencies and needs
aff ecting their waters in the region, other nations, such as Vietnam,
Cambodia and China, have inadequate environmental regulations and
Insuffi
cient information transfer and linkages among science, policy
operate political systems that do not participate as freely in multilateral
and management;
environmental coordination. Capacity building is a major issue in the
In
many
cases
fi sheries legislation adopts a single species approach,
region at all levels.
rather than managing multi-species, with compounding lack of
consideration of trophic level eff ects;
Thus, at both international and national levels, there is a wide range
Lack of fi sheries habitat protection across and within fi sheries
in the processes and capacity for policy development (and enabling
sectors (gear type, eff ort, MPAs, no take zones);
legislation) to address resource management and protection.
Lack of consideration of threatened/endangered species status and
Furthermore, in all nations of the region, there are ineffi
ciencies related
compounding lack of data;
to the transfer and application of international and national legislation
Lack of clear inter-sectoral demarcation of responsibility (e.g.
at provincial and local levels. The national and provincial laws relevant
mangrove management versus fi sheries versus aquaculture versus
to diff erent sectors such as fi sheries, mining, forestry and environmental
construction);
protection, are also not fully integrated. Some legislation does not refer
Low
enforcement
capacity;
specifi cally to particular sectoral or environmental systems, thereby
Problems in national and local interpretation of international
causing uncertainty in the application of legislative instruments. This
conventions and data (e.g. UNCLOS, CBD, MARPOL, CITES for
has caused confusion over which laws have priority, responsibility
smuggling stocks of sharks, migratory species, transboundary
for management, and the rights of stakeholders and interest groups.
straddling stocks);
Furthermore, some government departments are hampered by a lack of
Maritime limitations in relation to EEZ, continental shelf boundaries
and UNCLOS;
Box 9
Approaches to managing the South China Sea.
Lack of regional conventions and adherence to obligations/
In the South China Sea, so far, there has been no integrated, formal approach to
coordination among nations in international conventions;
management of resources. The lack of a formal agreement means that there is
no regulation of fisheries, no regional regulation or cooperation in combating
Lack of partnerships and urgent need to implement transboundary
pollution. Overlapping claims to maritime zones make it impossible to decide
which state is responsible for environmental protection and management, and
approaches in stocks management;
there is no sense of any temporary shared responsibility although many speak of
joint development or joint management. This sounds very much like a situation
Lack of policy development to provide alternative livelihoods;
that Garrett Hardin (1968) named the `Tragedy of the Commons'. As the South
Lack of policy development for sustainable fi
nancing of
China Sea is not partitioned according to the UNCLOS in Exclusive Economic Zones
(EEZ), where the individual state has the jurisdiction to the resources that exist
management;
within the zone, large areas of sea, and especially the living resources in these
areas, are left to the ones who manage to catch them. This means that one littoral
Insuffi
cient communication across government departments/
state has the opportunity to exploit and deplete the living resources that actually
belong to all the littoral states in the area. According to Oran Young (1994), there
agencies in terms of coordination of fi sheries and MPAs etc.;
are roughly three ways to regulate this problem. One is to solve the sovereignty
question with reference to ideas developed in UNCLOS. Normally, this would lead
Urgent need to address pressures and investment on lower trophic
to a delimitation agreement between all claimants on how to define the limits
level fi sheries because upper levels are already overexploited;
of EEZs and solve the question of sovereignty to islands. This is not very likely to
happen in the near future. A second solution is to establish a joint development
Urgent need to expand community-based sustainable
zone in the disputed area, share the cost and responsibility for development and
divide the benefits of resource exploitation between themselves. This is what China
management approaches more widely;
and Taiwan have suggested in principle since 1993, without, however, presenting
any concrete proposals. No joint development zone is likely to be established in
Urgent need to develop more equitable distribution of benefi ts and
the near future. China's understanding of joint development also seems to imply
that the other participants must negotiate bilaterally with China, not multilaterally.
address the loss of benefi ts to local stakeholders;
The third option is to create a regime or formalised agreement where all states in
Urgent need to develop better fi sheries security against poaching;
the region join forces to set up a joint management regime (fisheries regulation,
environmental protection and marine scientific research) while abstaining from
Urgent need to develop stronger political will for habitat protection
drilling oil and gas.
(Source: Excerpted from Naess 1999)
and fi sheries sustainability;
56
GIWA REGIONAL ASSESSMENT 54 SOUTH CHINA SEA

Urgent need to increase assertiveness of international funding
and overexploitation of the marine resources of the South China Sea
agencies in terms of implementation of policy;
region is still limited in scope.
Urgent need to develop better conduits for getting research
fi ndings into policy and collaboration;
The major policy factors relating to a lack of progress are poor
Urgent need to increase coordination and cooperation across
governance, lack of human and fi scal resources, and social issues
agencies (e.g. use of navy vessels in research, and an enforcement
such as high population growth, poverty and large-scale urban
`green navy')
development. Environmental management and education are still
Urgent need to develop transboundary, international approaches
generally poor. Scientifi c understanding, monitoring and surveillance
to policy analysis, an essential factor in determining policy issues
of regional fi sheries activities is limited; the enforcement of laws is
and future options (Box 9).
even more diffi
cult in such a diverse, complex and multi-jurisdictional
environment.
Integrated, multilateral environmental conservation and development
is a requirement for the success of any future policy development, as
Furthermore, the infl uence of scientifi c research on the political process
policies must conform to international multilateral conventions, treaties
in the South China Sea is not straightforward (Naess 1999). Research
and obligations. Regional government support and cooperative inter-
fi ndings rarely speak for themselves, and whether the decision-makers
sectoral and jurisdictional agreements are factors in the success of any
consider scientifi c advice to be important or not depends on several
forward planning. However, regional cooperation concerning the use
conditions. In this process, science can be `contaminated' by political
Figure 21 Pulau Redang Marine Park Center, Malaysia.
(Photo: J. Oliver, ReefBase)
POLICY OPTIONS
57
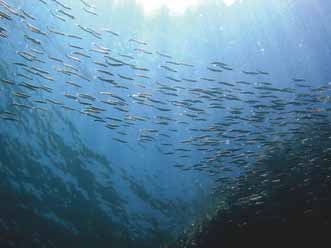
agendas, if political factions or governments use professionals as a
means for promoting their political agendas (Andresen et al. 1994,
Naess 1999). Because the claimant states regard the resources of the
South China Sea as aff ecting vital national interests, the trust given to
expert advice can be presumed to be extremely limited when such
interests are at stake (Naess 1999). Thus overcoming state self-interest
is of crucial importance.
At the broadest policy development levels, recommendations for
improvement include implementation of an integrated multi-national
conservation and development approach for the South China Sea,
complemented by an eff ective strategy to address multilateral and
international obligations under the various conventions and treaties. As
each of the nations has signed UNCLOS, and all except Cambodia and
Figure 22 School of silverside (Atherinomorus sp.) near surface,
Thailand have ratifi ed it, the states are obliged to take into consideration
Cagar Hutang, Redang Island, Malaysia.
(Photo: B. Huzaimi, ReefBase)
the terms of the Law of the Sea regime. In particular, the emphasis
should be on states to endeavour to cooperate directly or through
a regional organisation to manage the sea together, to coordinate
scientifi c research policies and to coordinate implementation of rights
Consolidation of national laws and multilateral agreements to
and duties under the convention (Article 123 UNCLOS 1982, Thayer
encompass all sectors;
1999, Naess 1999).
Improved coordination in management across sectors and levels
of governance (local, national and multilateral);
However, at the national level, the multiplicity of agencies dealing
National and international surveillance strategies, with participation
with the maritime environment, and an apparent lack of interest at
from all levels of government, NGOs and local communities;
the highest political levels, make effi
cient and integrative ocean policy
Much-improved
enforcement;
development and implementation almost impossible (Naess 1999). This
Improved transparency in governance/policing, with stronger anti-
problem has accumulated on the regional level, where no agency exists
corruption legislation and enforcement;
that can coordinate eff orts at improving the maritime environment.
Ongoing and expanded community education programmes;
The ASEAN institutions and non-ASEAN institutions that operate in the
Improved options for the generation of alternative income and
region are not coordinated at the regional level (Papoyo 1996).
ecologically sustainable livelihoods for the burgeoning poor of
coastal populations, particularly among the fi sheries sectors.
As noted above, there is a wide range among South China Sea nations in
the adequacy of both policy and enabling legislation to address the key
This framework is crucial in bridging the gaps between policy
concerns analysed in this assessment. Most nations are already parties to
formulation, development of legislation and enforcement of
the key international conventions and treaties. What is currently lacking
regulations (Box 9). As Talaue-McManus (pers. comm.) notes: "Tracing
is multilateral coordination and capacity to apply the existing legislation
root causes is important in highlighting the bigger socio-economic
and to review and amend the legislation to improve its functionality,
and political contexts with which to view environmental problems.
particularly cross-sectorally. It is particularly important to ease tensions
However, it becomes counterproductive to orient policy options
arising from sovereignty and jurisdictional disputes over the Spratly and
to only the root causes, as these will not be doable within 10 times
Paracel Island groups, and ocean space adjacent to the littoral states.
the lifetime of any project or initiative. What then becomes crucial is
This approach is compatible with the regime for semi-enclosed seas
breaking the policy options into doable segments, addressing both
as set forth in UNCLOS 1982 (Dr. Hasjim Djalal and Prof. Ian Townsend-
immediate and intermediate causes and cognizant that signifi cant
Gault, quoted by Naess 1999).
changes could be achieved if these were implemented even if the
root causes remain."
In this regard, improved policy can only succeed with the following
support structures in place:
58
GIWA REGIONAL ASSESSMENT 54 SOUTH CHINA SEA
Identified policy options
Identify low-cost sanitation technologies, to address domestic
sewage inputs, that can be maintained and established in both
Five policy recommendations and eleven strategic actions are proposed
rural and urban settings (e.g. through the Water Group of the World
as relevant to implementing immediate interventions.
and Asian Development Banks).
Key policy recommendations
One of the major root causes of overfi shing is, like in forestry and
The key policy recommendations include the development and
mining, the ever increasing need for foreign exchange. It is important
expansion of:
to monitor whether countries around the South China Sea remain
Institutional and capacity-building, including establishment of
net exporters of fi shery products as indicated in the Transboundary
inter-governmental mechanisms;
Diagnostic Analysis for South China Sea (Talaue-McManus 2000).
Information, education and communication networks;
Globalised trade will seem to exacerbate this pattern. A free and
Functional, integrated network of marine protected areas founded
reliable source of trade statistics is available at the US National Marine
in focused, applied research;
Fisheries Service web site4.
Alternative, sustainable livelihoods for poor coastal populations;
Bio-physical (biodiversity) and socio-economic research focused
on improving management eff ectiveness and effi
ciency.
Performance of the chosen
Key strategic actions
alternatives
The key strategic actions include:
Prioritise key data and information required for developing and
Initial steps towards implementing these policy recommendations and
refi ning policy, legislation and interventions;
strategic actions are already under way, though a variety of interventions.
Build and expand partnerships at local, provincial, national and
A pertinent example is the World Bank Global Environment Facility
multilateral levels, in government, NGOs, and the private sector, in
International Waters project administered by UNEP. The goal of the
Research and Development and implementation;
project is conserving the marine environment of the South China Sea
Ensure equitability and ecological and economic sustainability in
from the eff ects of climate change, coastal development, pollution and
future resource exploitation, including protection of intellectual
overfi shing. Initiation of the project followed agreement among seven
property and traditional knowledge;
nations (Cambodia, China, Indonesia, Malaysia, Philippines, Thailand
Gather responsible fi sheries authorities together with expertise
and Vietnam). The project is both timely and highly relevant to the
from national and international academic and research institutions
present analysis. As noted by Dr. Klaus Toepfer (Executive Director of
to adequately assess the state of fi sheries in territorial waters;
UNEP): "Without a concerted regional approach to environmental
Develop regional agreements on providing MPAs within territorial
management, it is unlikely that the present rates of habitat degradation
waters to help ease the pressure on sites that are heavily overfi shed;
will be slowed, resulting in the loss of globally signifi cant biodiversity
Develop national coastal management plans to underpin these
and the livelihoods of millions of people".
regional MPA agreements (even if MPAs will remain elusive for
contested areas);
The major cause of environmental degradation is the density and
Promote a united call to establish a regional database and monitoring
growth of coastal populations, which are expected to double by 2033,
that allows for periodic assessments of key coastal ecosystems;
with concomitant increases in world trade, industrialisation, fi sheries
Ban further conversion of wetlands, estuaries and mangroves into
and mineral exploitation.
man-made facilities;
Establish protocols to assist national environment ministries
Funding for the project comes from the GEF (16 million USD),
to determine carrying capacities of estuaries for extensive and
from participating countries (9 million USD) and other donors
intensive aquaculture facilities (e.g. through SEAFDEC);
(7 million USD). The seven nation project is producing a programme
Provide concrete mechanisms to engage IRRI and FAO to provide
of action and framework for regional cooperation in management.
organic farming protocols for adoption by small-scale farmers and
Initial implementation is focused on nine pilot projects for sustainable
multi-national food companies to address impacts caused by
development of marine resources (Kirkman pers. comm.).
nutrient loading from agriculture;
4 www.st.nmfs.gov
POLICY OPTIONS
59
Klaus Toepfer (UNEP) concluded: "The real success of the project will be
SEAFDEC should work on establishing protocols to assist national
in providing a platform for ongoing marine protection programmes,
environment ministries to determine carrying capacities of
beyond its fi ve year span. Its major goals are to establish the national
estuaries for extensive and intensive aquaculture facilities.
capacity, the mechanisms and the regional cooperation necessary to
In the case of nutrient loading from agriculture, provide concrete
protect the marine environments of the seven participating countries".
mechanisms to engage IRRI and FAO to provide organic farming
protocols for adoption by small-scale farmers and multi-national
In the latter regard, the eff ectiveness, effi
ciency, equity, political
food companies.
feasibility and implementation capacity of the policy recommendations
To address domestic sewage inputs, the Water Group of the World
arising from the present analysis will all be contingent, to greater or
and Asian Development Banks should assist in identifying low-cost
lesser degree, on the success of the present intervention and lessons
sanitation technologies that can be maintained and established in
learned. If successful, the present intervention should provide much
both rural and urban settings.
of the necessary key framework for successful future interventions.
However, signifi cant problems and diffi
culties remain, and the present
Much remains to be done, at local, provincial, national and multilateral
project is only the beginning of this process.
levels. In the latter regard, the multilateral security dialogue in this
region has, in the past, functioned as an impediment to regional
And, as Talaue-McManus (pers. comm.) cogently argues: "It is imperative
environmental cooperation, and thus also blocked attempts by non-
to lay out policy initiatives at both the national and regional scales, so
state actors to infl uence regional political processes (Naess 1999).
that these are formulated more or less in tandem and with substantive
Environmental experts try to inform their governments about risks
harmony, thus creating a synergy that ultimately enhances political will
and challenges, but so far the governments of the region have not
at the national level of governance. ASEAN and ASEAN-based initiatives
adequately prioritised management of the marine environment.
have tried to foster this spirit and in some ways have had some success.
Recent developments, such as the ASEAN Regional Forum on Regional
For the most part, however, the politics cannot break away from the
Cooperation in Maritime Security, may be a step in the right direction,
tradition of "non-binding agreements that will never impose on
and similar mechanisms are required to address the other threats and
any country's sovereignty". The UNEP Regional Seas Programme for
impacts described herein. Environmental experts try to inform their
the East Asian Seas has failed miserably to achieve any substantive
governments about risks and challenges, but so far the governments of
regional agreements in the last 30 years because the COBSEA never
the region have not adequately prioritised management of the marine
grew beyond representing the lack of national political will".
environment.
Talaue-McManus (pers. comm.) suggests several key strategies which
overlap and support the policy strategies proposed herein:
Bring
the
fi sheries bodies together with expertise from national and
international academic and research institutions to pin down the
state of fi sheries in territorial waters.
Develop regional agreements on providing MPAs within territorial
waters to help ease the overfi shed status of sites where this state is
established.
Develop national coastal management plans to underpin these
regional MPA agreements (even if MPAs will remain elusive for
contested areas).
Promote a united call to establish a regional database and
monitoring that allows for periodic assessments of key coastal
ecosystems.
Talaue-McManus also suggests several criteria for key actions:
Banning more conversion of wetlands, estuaries and mangroves
into man-made facilities.
60
GIWA REGIONAL ASSESSMENT 54 SOUTH CHINA SEA
References
Acharya, A. (1997). Ideas, identity, and institutions-building: from the
Burke, L, Selig, E. and Spalding, M. (2002). Reefs at Risk in South-east Asia.
`ASEAN way' to the `Asia-Pacifi c way'? The Pacifi c Review 10(2):
World Resources Institute.
319-346.
Carlton, J.T. (1998). Apostrophe to the Ocean. Conservation Biology 12:
Andresen, S., Skodvin, T., Underdal, A. and Wettestad, J. (1994). "Scientifi c"
1165-1167.
Management of the Environment? Science, Politics and Institutional
Castro, R.C.D. (1998). The Controversy in the Spratlys: Exploring the Limits
Design. Oslo: Fridtjof Nansens Institute R:006-1994.
to ASEAN's Engagement Policy. Issues and Studies 34:95-123.
ASEAN (1994). ASEAN Strategic Plan of Action on the Environment.
Catley, B. and Keliat, M. (1997). Spratlys: The Dispute in the South China
Jakarta: ASEAN Secretariat, Indonesia.
Sea. Singapore: Ashgate.
ASEAN (1998). The First ASEAN State of the Environment Report. Jakarta:
Cesar, H.S.J., Warren, K.A., Sadovy, Y., Lau, P., Meijer, S. and van Ierland,
ASEAN Secretariat, Indonesia.
E. (2000). Marine market transformation of the live reef fi sh food
Asian Development Bank (2003). Economic Trends and Prospects in
trade in Southeast Asia. p 137-157 In: Cesar, H.S.J. (ed.) Collected
Developing Asia; Southeast Asia. p 60-103 In: Asian Development
Essays on the Economics of Coral Reefs. CORDIO, Dept. Biology and
Outlook 2003, Oxford University Press Inc. New York, USA.
Environmental Sciences, Kalmar University, Sweden.
Bate, E. (1999). Biophysical assessment of the Sulu-Sulawesi Large Marine
Cheung, C.P.S., Alino, P.M., Uychiaoco, A.J. and Arceo, H.O. (2002).
Ecosystem: Geology module. A report prepared for the Sulu-
Marine Protected Areas in South-east Asia. ASEAN Regional Centre
Sulawesi Marine Ecoregion Conservation Program Development,
for Biodiversity Conservation, Department of Environment and
WWF-Philippines.
Natural Resources.
Bateman, S. (1999). East Asia's Marine Resources and Regional Security,
Chou, L.M. (1997). Southeast Asia as the global center of marine
Retrieved Aug. 2003 from: uniserve.edu.au/law/publ/icl...tudies_
biodiversity. Tropical Coasts 4:4-8.
89/ms_marine_resources.html
Christy, F.T. (ed.) (1980). Law of the sea: Problems of confl ict and
Bateman, S. and Bates, S. (eds.) (1996a). Calming the Waters: Initiatives
management of fi sheries in Southeast Asia. Manila: ICLARM,
for Asia Pacifi c Maritime Cooperation. Canberra: Australian National
Proceedings of the ICLARM/ISEAS Workshop on the Law of the
University. Canberra Papers on Strategy and Defence No 114.
Sea, ICLARM Conference Proceedings, No. 2.
Bateman, S. and Bates S. (eds.) (1996b). The Seas Unite: Maritime
Chua, T.-E. (1991). Managing coastal resources for sustainable
Cooperation in the Asia Pacifi c Region. Canberra: Australian
development: the ASEAN initiative. p 21-35 In: Chua, T.-E. and Scura,
National University. Canberra Papers on Strategy and Defence
L.F. (eds.) Managing ASEAN's coastal resources for sustainable
No 118.
development: roles of policymakers, scientists, donors, media and
Brookfi eld, H. and Byron, Y. (eds.) (1993). South-East Asia's Environmental
communities. Manila: ICLARM, ICLARM Conference Proceedings 30.
Future: the Search for Sustainability. The United Nations University,
Chua, T.-E. and Pauly, D. (eds.) (1989). Coastal management in Southeast
Kuala Lumpur: Oxford University Press.
Asia: policies, management strategies and case studies. Manila:
Bryant, D., Burke, L., McManus, J. and Spalding, M. (1998). Reefs at Risk.
ICLARM, ICLARM Conference Proceedings 19.
A map based indicator of threats to the world's coral reefs. WRI,
ICLARM, WCMC and UNEP, Washington D.C.
REFERENCES
61
Chua, T.-E. and Scura, L.F. (eds.) (1991). Managing ASEAN's coastal
Hodgson, G. and Dixon, J.A. (1992). Sedimentation damage to marine
resources for sustainable development: roles of policymakers,
resources: Environmental and economic analysis. In: Marsh, J.B.
scientists, donors, media and communities. Manila: ICLARM,
(ed.) Resources and environment in Asia's marine sector. Taylor
ICLARM Conference Proceedings 30.
and Francis, Washington.
Chua, T.-E. and Garces, L.R. (eds.) (1992). Waste management in the
Hoegh-Guldberg, O. (1999). Climate change, coral bleaching and the
coastal areas of the ASEAN region: roles of governments, banking
future of the world's coral reefs. Marine and Freshwater Research
institutions, donor agencies, private sector and communities.
50:839-866.
Manila: ICLARM, ICLARM Conference Proceedings 33.
Hopley, D. and Suharsono. (2000). The Status of Coral Reefs in Eastern
Chua, T.-E. and Ross, S.A. (1998). Pollution Prevention and Management
Indonesia. Australian Institute of Marine Science, Townsville,
in the East Asian Seas: A Paradigm Shift in Concept, Approach and
Australia.
Methodology. Manila: GEF/UNDP/IMO Regional Programme for the
Jackson, J.B.C. (1997). Reefs since Columbus. Coral Reefs 16:S23-S32.
Prevention and Management of Marine pollution in the East Asian
Jackson, J.B.C., Kirby, M.X., Berger, W.H., Bjorndal, K.A., Botsford, L.W.,
Seas, MPP-EAS Technical Report No 15.
Bourque, B.J., Bradbury, R.H., Cooke, R., Erlandson, J., Estes, J.A.,
Coulter, D.Y. (1996). South China Sea Fisheries: Countdown to Calamity.
Hughes, T.P., Kidwell, S., Lange, C.B., Lenihan, H.S., Pandolfi , J.M.,
Contemporary Southeast Asia 17(4).
Peterson, C.H., Steneck, R.S., Tegner, M.J. and Warner, R.R. (2001).
DeVantier, L., Alcala, A. and Wilkinson, C. (2004). The Sulu-Sulawesi Sea:
Historical overfi shing and the recent collapse of coastal ecosystems.
Environmental and Socioeconomic Status, Future Prognosis and
Science 293:629-638.
Ameliorative Policy Options. Ambio 33(1):88-97.
Johannes, R.E. and Riepen, M. (1995). Environmental, Economic, and
Etkin, D.S. (1997). Oil spill in East Asia: Over 220 million gallons spilled
Social Implications of the Live Reef Fish Trade in Asia and the
since 1965. Oil Spill Intelligence Report.
Western Pacifi c. Report for the Nature Conservancy and South
FAO (1999). Irrigation in Asia in Figures. Water Report No. 18. Food and
Pacifi c Forum Fisheries Agency.
Agriculture Organization of the United Nations, Rome, Italy.
Johnston, D.M. (1988). Marine pollution agreements: successes and
FAO AQUASTAT (2003). FAO Database. Retrieved Feb 2004 from:
problems. In: Carrroll, J.E. (ed.) International environmental
www.fao.org/waicent/faoinfo/agricult//AGL/AGLW/aquastat/
diplomacy: The management and resolution of transfrontier
dbase/index.stm
environmental problems. Cambridge University Press, Cambridge.
Fryer, D.W. (1979). Emerging Southeast Asia: A Study in Growth and
Johnston, D.M. (ed.) (1998). SEAPOL Integrated Studies of the Gulf of
Stagnation. Philip, London, England.
Thailand. Bangkok: Southeast Asian Programme in Ocean Law,
Fukuda-Parr, S. (ed.) (2003). Human Development Reports 2003:
policy and Management.
Millennium Development Goals: A compact among nations to
Kleypas, J.A., Buddemeier, R.W., Archer, D., Gattuso, J-P., Langdon, C.
end human poverty. United Nations Development Programme,
and Opdyke, B.N. (1999). Geochemical consequences of increased
Oxford University Press, Oxford, New York.
atmospheric carbon dioxide on coral reefs. Science 284:118-120.
GMBD (2003). Global Maritime Boundaries Database, Maritime Claims
LME (2004). LME 36: South China Sea. Large Marine Ecosystems of the
and Boundaries GIS Database. General Dynamics Advanced
World. Retrieved March 2004 from: http://na.nefsc.noaa.gov/lme/
Information Systems.
text/lme36.htm
Gomez, E. (1988). Achievements of the Action Plan for the East Asian
Low, J., Beverly, K.Y., Goh P.L. and Chou, L.M. (1996). Regional Cooperation
Seas. In: UNEP Cooperation for Environmental Protection in the
in Prevention and Response to Marine Pollution in the South China
Pacifi c. Bangkok: UNEP Regional Seas Reports and Studies No 97.
Sea. Paper presented to the Second ASEAMS Scientifi c Symposium,
Harris, S. (1994). Policy Networks and Economic Cooperation: Policy
UNEP, Bangkok.
Coordination in the Asia-Pacifi c Region. The Pacifi c Review 7:381-
McManus, J.W. (1994). The Spratly Islands: A Marine Park. Ambio 23:
395.
181-186.
Hearns, G.S and Stormont, W.G. (1996). Managing Potential Confl icts in
MPP-EAS (1998). Marine pollution management in the Malacca/
the South China Sea. Marine Policy 20:177-181.
Singapore Straits: Lessons learned. MPP-EAS/Info99/195. GEF/UNDP/
Higgott, R. (1994). Ideas, Identity and Policy Coordination in the Asia-
IMO Regional Programme for the Prevention and Management of
Pacifi c. The Pacifi c Review 7:367-379.
Marine Pollution in the East Asian Seas. Quezon City, Philippines.
62
GIWA REGIONAL ASSESSMENT 54 SOUTH CHINA SEA
Naess, T. (1999). Environment and security in the South China
Soegiarto, A. (1989). The Status of Marine and Coastal Pollution
Sea Region: The role of experts, non-government actors and
in Southeast Asia. p 71-75 In: Chua, T.-E. and Pauly, D. (eds.)
governments in regime building processes. PhD Thesis, University
Coastal management in Southeast Asia: policies, management
of Oslo, Norway.
strategies and case studies. Manila: ICLARM, ICLARM Conference
ORNL (2003). Landscan 2002. Oak Ridge National Laboratory. Retrieved
Proceedings 19.
Nov. 2003 from: http://www.ornl.gov/gist
Swanstr÷m, N. (1999). Confl ict Management and Negotiations in
Pargal, S., Hettige, H., Singh, M. and Wheeler, D. (1997). Formal and
the South China Sea: The ASEAN way?. Paper presented to the
informal regulation of industrial pollution: Comparative Evidence
Workshop in the South China Sea, Oslo, Norway, 24-26 April.
from Indonesia and the US. PRD Working Paper No. 1797 World Bank
Talaue-McManus, L. (2000). Transboundary Diagnostic Analysis for the
Policy Research Working Paper Series.
South China Sea. EAS/RCU Technical Report Series No. 14, UNEP,
Pauly, D., Christensen, V., GuÚnette, S., Pitcher, T.J., Sumaila, U.R., Walters,
Bangkok, Thailand.
C.J., Watson, R. and Zeller, D. (2002). Towards sustainability in world
Thayer, C.A. (1999). Southeast Asia Borders: Maritime Issues Retrieved
fi sheries. Nature 418:689-695.
Aug. 2003 from: http://coombs.anu.edu.au/coombspapers/
Pauly, D., Alder, J., Bennett, E., Christensen, V., Tyedmers, P. and Payoyo,
otherarchives/asian-studies-archives/seasia-archives/politics/
P.B. (1996). Ocean Governance in the ASEAN Region and the
seasia-maritime-issues.txt.
United Nations Convention on the Law of the Sea. International
UNCLOS (1982). United Nations Convention on the Law of the Sea. UN
Law Quarterly 45:57-71.
New York.
Pimoljinda, J. and Boonraksa, V. (1999). Community-based Fisheries Co-
UNDP (2001). Human Development Report 2001. United Nations
management, Case-study Phang-Nga Bay, Thailand. Andaman Sea
Development Programme, New York. Oxford University Press.
Fisheries Development Center. Proceedings of the International
UNEP (1994). Fifth Meeting of the Experts on the East Asian Seas Action
Workshop on Fisheries Co-Management, Malaysia, 23-28 August.
Plan: Report of the Meeting. Bangkok: UNEP (OCA)/EAS WG.5/5.
Piyakarnchana, V.M. and Johnston, D.M. (eds.) (1990). Land-Based
UNEP (1997). Regional Coordinating Unit/East Asian Seas Action
Marine Pollution Problems in the Asia-Pacifi c Region: Status and
Plan: East Asian Seas regional report on the Issues and Activities
Legal Developments. Bangkok: SEAPOL, Proceedings of workshop
Associated with Coral Reefs and Related Ecosystems. Bangkok:
held on May 7-10, 1989, under the auspices of the Southeast Asian
Bangkok: UNEP RCU/EAS, RCU/EAS Technical Reports Series
Programme on Ocean Law, Policy and Management (SEAPOL),
No. 11.
organised by the Institute of Asian Studies, Chulalongkorn
UNEP (1999). Strategic Action Programme for the South China Sea. Draft
University.
Version 3, February 1999. UNEP SCS/SAP Ver. 3 (24/2/99).
Rosen, C. (ed.) (2002). World Resources 2000-2001: People and
UNEP (2004). Mangroves in the South China Sea. UNEP/GEF/SCS
ecosystems: The fraying web of life, World Resource Institute,
Technical Publication No. 1. UNEP, Bangkok, Thailand.
Washington D.C, USA.
UNEP/WCMC (2003). World Database on Protected Areas. UNEP Geo Data
Rosenberg, D. (1999). Environmental Pollution around the South China
Portal. Retrieved Nov. 2003 from: http://geodata.grid.unep.ch
Sea: Developing a Regional Response. Contemporary South East
UNEP/WCMC (2004). Original forest cover. UNEP Geo Data Portal.
Asia 21:119-145.
Retrieved Jan. 2004 from: http://geodata.grid.unep.ch/
Russ, G. (1985). Eff ects of protective management on coral reef fi shes
US Pacifi c Command (2005). Major Asia-Pacifi c shipping lanes. Retrieved
in the central Philippines. Proceedings 5th International Coral Reef
Feb. 2005 from: http://cat.middlebury.edu/southchinasea/
Congress 4:219-224.
Valencia, M., Van Dyke, J.M. and Ludwig, N.A. (1997). Sharing the
Russ, G. and Alcala, A. (1996a). Marine reserves: rates and patterns
Resources of the South China Sea. The Hague: Martin Nijhoff
of recovery and decline in abundance of large predatory fi sh.
Publishers.
Ecological Applications 6:947-961.
Veron, J.E.N. (2000). Corals of the World. 3 Vols. Australian Institute of
Russ, G. and Alcala, A. (1996b). Do marine reserves export adult fi sh
Marine Science.
biomass? Evidence from Apo Island, central Philippines. Marine
Vo, S.T., Nguyen, V.L., Hua, T.T., Nguyen, X.H., Kim, H. and DeVantier,
Ecology Progress Series 132:1-9.
L.M. (2002). Coral reefs of the Hon Mun Marine Protected Area,
Spalding, M., Ravilious, C. and Green, E.P. (2001). World Atlas of Coral
Nha Trang Bay, Vietnam, 2002: Species composition, community
Reefs. United Nations Environment Programme World Conservation
structure, status and management recommendations. Report to
Monitoring Centre.
Hon Mun MPA Pilot Project.
REFERENCES
63
WHO/UNICEF (2000). Global Water Supply and Sanitation Assessment,
2000. World Health Organization, Water Supply and Sanitation
Collaborative Council, United Nations Children's Fund. World
Health Organization and United Nations Children's Fund, Geneva
and New York.
Wilkinson, C.R. (ed.) (2000). Status of Coral Reefs of the World 2000.
Australian Institute of Marine Science.
Wilkinson, C.R. (ed.) (2002). Status of Coral Reefs of the World 2002.
Australian Institute of Marine Science.
Wilkinson, C.R., Caillaud, A., DeVantier, L. and South, R. (In press).
Strategies to reverse the decline in valuable and diverse coral reefs,
mangroves and fi sheries. The bottom of the J-Curve in Southeast
Asia? Ocean and Coastal Management.
World Bank (1999). World Development Report 1998/99. The
International Bank for Reconstruction and Development/The
World Bank, Washington DC, USA. Retrieved Feb. 2004 from:
http//:www.worldbank.org/nipr/wdi98/index.html
World Bank (2004). World Development Indicators Database. Retrieved
Jan. 2005 from: http://devdata.worldbank.org/data-query/
WWF (2001). Sulu-Sulawesi Seas Ecoregion: Users, Uses and Threats.
A report integrated by Raoul Cola for the Sulu-Sulawesi Marine
Ecoregion Program, WWF, Manila, Philippines.
Personal communication
Alban, M. (World Fish Centre ICLARM, Penang, Malaysia)
Alcala, A. (SUAKCREM Marine Laboratory, Dumaguete City, Philippines)
Chua, T.E. (Partnership in Environmental Management for the Seas of
East Asia (PEMSEA), Manila, Philippines)
Hean, T.C. (Singapore Defence Minister, ASEAN Regional Forum on
Regional Cooperation in Maritime Security)
Kirkman, H. (Formerly UNEP Regional Coordinator, Bangkok, Thailand)
Nhan, N.H (Director of Urban Upgrading Project, Ho Chi Minh City,
Vietnam)
Talue-McManus, J. (National Center for Caribbean Coral Reef Research
(NCORE), Miami, USA)
64
GIWA REGIONAL ASSESSMENT 54 SOUTH CHINA SEA
Annexes
Annex I
List of contributing authors and organisations
The senior authors gratefully acknowledge the invaluable assistance of these people listed below. They participated during the meetings in the
region and also provided valuable material during the production of this report. Most importantly was the extensive experience of the region that
they were able to provide, particularly advice on policy options that would be applicable in some cultures but not in others. We wish to thank them
for their help and sadly note that two of these have since deceased and will be sorely missed: Achmad Abdullah and Suraphol Sudara.
Name
Institutional affiliation
Country
Field of work
Dr. Achmad Abdullah
Conservation and Marine National Parks, Ministry of Marine Affairs and Fisheries, Jakarta
Indonesia
Natural resources management and protected areas policy
Directorate for Marine and Coastal Degradation Control, Environmental Impact Management
Mrs. Heni Agustina
Indonesia
Coastal and marine pollution, health and EIA policy
Agency (BAPEDAL)
Dr. Porfirio Alino
Marine Science Institute, University of the Philippines
Philippines
Coral reef ecology and sustainable development
Dr. Angel Alcala
SUAKCREM Marine Laboratory, Dumaguete City
Philippines
Environment and coral reefs
Dr. Imam Bachtiar
Biology Department, FKIP Universitas Mataram, Lombok
Indonesia
Coral reef ecosystems, global change and fisheries
Mr. David Bizot
UNEP EAS/RCU, Bangkok
Thailand
Coastal and marine environmental management policy
Mr. Ronald Bonifacio
Coastal Management Center, Manila
Philippines
Integrated Coastal Zone Management
Dr. Annadel Cabanban
Ichthyologist, Borneo Marine Research Unit, Universiti Malaysia Sabah
Malaysia
Coral reef and fish ecology, and sustainable development
Dr. Hansa Chansang
Phuket Marine Biological Center
Thailand
Coral reef ecology and sustainable development
Dr. Pornsook Chongprasith
Pollution Control Department, Bangkok
Thailand
Coastal pollution assessment and control
Dr. Sansanee Choowaew
Faculty of Environment and Resource Studies, Mahidol University, Salaya
Thailand
Tropical resource ecology and management
Dr. Chou Loke Ming
Department of Biological Sciences, Faculty of Science, National University of Singapore
Singapore
Coral reef and coastal ecology and sustainable development
GEF/UNDP/IMO Regional Programme on Partnerships in Environmental Management for the
Integrated Coastal Zone Management, fisheries management, and
Dr. Chua Thia-Eng
Philippines
Seas of East Asia (PEMSEA), Quezon City
rehabilitation of damaged ecosystems
Dr. Ian Dutton
Indonesia Country Program at The Nature Conservancy
Indonesia
Integrated Coastal Zone Management and sustainable development
Marine protected areas and fisheries - assessment, planning,
Mrs. Rili Djohani
Nature Conservancy
Indonesia
management and policy
Dr. Ong Jin Eong
Center for Marine and Coastal Studies, Universiti Sains Malaysia, Penang
Malaysia
Mangrove ecology and rehabilitation
Dr. Stefano Fazi
UNESCO, Jakarta
Indonesia
Natural resources management and protected areas
Dr. Miguel Fortes
Marine Science Institute, University of the Philippines, Diliman, Quezon City
Philippines
Seagrass and other tropical ecosystem ecology.
Dr. Hans Friederich
IUCN Asian Regional Office, Bangkok
Thailand
Natural resources management and mammal conservation
Dr. Sapta Putra Ginting
General Coasts and Small Islands Ministry of Marine Affairs and Fisheries
Indonesia
Natural resources management and protected areas
Dr. Ed Gomez
Marine Science Institute, University of the Philippines, Diliman, Quezon City
Philippines
Coral reef and coastal ecology and sustainable development
Dr. Tran Minh Hien
Marine and Coastal Program, Coordinator, WWF IndoChina Programme, Hanoi
Vietnam
Marine protected area planning, management and policy
Dr. Kevin Hiew
National Program Director WWF
Malaysia
Coastal zone policy formulation
Dr. Jose Inglis
WWF Philippines, Quezon City
Philippines
Marine protected area planning, management and policy
ANNEXES
65
Dr. Gil Jacinto
Marine Science Institute, University of the Philippines, Quezon City
Philippines
Coastal pollution assessment and control
Dr. Vudhichai Janekarn
Phuket Marine Biological Center
Thailand
Coastal ecology and sustainable development
ASEAN and Asia-Pacific Section, International Environmental Affairs Division, Office of
Dr. Srisuda Jarayabhand
Thailand
Coastal zone policy formulation
Environmental Policy and Planning, Ministry of Science, Technology and Environment, Bangkok
Dr. Jamal Jompa
University, Makassar, Sulawesi
Indonesia
Coral reef ecosystems and fisheries
Dr. Roger Juliano
Coastal Management Center, Manila
Philippines
Coastal zone policy formulation
Dr. Somkiat Khokiattiwong
Phuket Marine Biological Center
Thailand
Coral reef and seagrass ecosystems analysis
Natural Resources and Environmental Management Coordination Division, Office of
Dr. Nawarat Krairanond
Thailand
Coastal zone policy formulation and planning
Environmental Policy and Planning, Ministry of Science, Technology and Environment, Bangkok
Dr. Maarten Kuijper
UNESCO IOC/WESPAC Secretariat
Thailand
Tropical natural resources management and protected areas
Dr. Al Licuanan
Marine Science Institute, University of the Philippines, Diliman, Quezon City
Philippines
Coral reef ecosystems research and management
Dr. Medel Limsuan
Department of Environment and Natural Resources, Quezon City
Philippines
Coastal zone policy formulation and planning
Mrs. Evangeline Miclat
WWF Philippines, Quezon City
Philippines
Coastal ecology and sustainable development
Dr. Le Quang Minh
Can Tho University
Vietnam
Coastal ecology and sustainable development
Dr. Jacobus Mosse
James Cook University of North Queensland
Australia
Fisheries and tropical natural resources management
Dr. Peter Mous
The Nature Conservancy Coastal and Marine Program Indonesia, Denpasar, Bali
Indonesia
Tropical marine resources management and protected areas
Assoc. Prof. Cleto Nanola Jnr. University of the Philippines, Mindanao
Philippines
Coral reef ecosystems research and management
Dr. Praneet Ngamsanay
Faculty of Agriculture, Ubon Ratchathani
Thailand
Tropical coastal resource management
Dr. Sirimati
Pollution Control Department, Bangkok
Thailand
Coastal pollution assessment and control
Nimmanheminda
South East Asia Center for Marine Protected Areas (SEACMPA) The Nature Conservancy
Dr. Jos Pet
Indonesia
Tropical natural resources management, fisheries and protected areas
Indonesia, Sanur, Bali
Shell Research Fellow, Institute of Biodiversity and Environmental Conservation, University
Coral reef ecosystems research and management, especially sea turtle
Dr. Nicolas Pilcher
Malaysia
Malaysia Sarawak
conservation
Dr. Srihartiningsih (Ning)
Coastal and Marine Environmental Management Policy, The State Ministry for Environment,
Indonesia
Coastal and marine environmental policy, socio-economics
Purnomohadi
Jakarta
Mr. Ketut Sarjana Putra
WWF Indonesia-Wallacea Bioregion Program, Denpasar
Indonesia
Coastal and marine environmental management
Dr. Suvaluck Satumanatpan
Faculty of Environment and Resource Studies, Mahidol University, Salaya Campus
Thailand
Coral reef and seagrass ecosystems analysis and policy formulation
Ms. Heidi Schuttenberg
UNEP EAS/RCU, Bangkok
Thailand
Tropical natural resources management, coral reefs and global change
Dr. Wijarn Simachaya
Pollution Control Department, Bangkok
Thailand
Coastal pollution assessment and control
Coastal and marine environmental management especially GIS
Dr. Anond Snidvongs
SE Asia START Regional Center, Chulalongkorn University, Bangkok
Thailand
methodology
Dr. Thavivongse Sriburi
Environmental Research Institute, Chulalongkorn University, Bangkok
Thailand
Tropical coastal resource management
Dr. Suraphol Sudara
Marine Science Department, Faculty of Science, Chulalongkorn University, Bangkok
Thailand
Coral reef and seagrass ecosystems analysis and policy formulation
Dr. Sudariyono
Marine and Coastal Ecosystem Affairs, Ministry of Environment
Indonesia
Tropical coastal resource management
Dr. Teng Seng Keh
Coastal Management Center, Manila
Philippines
Tropical coastal resource coordination and management
Dr. Nguyen Hong Thao
Vietnam Government, Hanoi
Vietnam
Tropical coastal resource assessment and management
Dr. Pham Van Thom
Institute of Oceanography, Nha Trang
Vietnam
Tropical coastal resource assessment and management
Dr. Romeo Trono
WWF-Philippines, Quezon City
Philippines
Tropical coastal resource management
Dr. Vo Si Tuan
Institute of Oceanography, Nha Trang,
Vietnam
Coral reef and seagrass ecosystems analysis and policy formulation
Mrs. Nuning S Wirjoatmodjo
UNESCO, Jakarta
Indonesia
Coastal and marine environmental management and planning
66
GIWA REGIONAL ASSESSMENT 54 SOUTH CHINA SEA
Annex II
Detailed scoring tables
I: Freshwater shortage
II: Pollution
Weight
Weight
Environmental
Environmental
Environmental issues
Score
Weight
averaged
Environmental issues
Score
Weight
averaged
concern
concern
score
score
1. Modification of stream flow
2
N/a
Freshwater shortage
2
4. Microbiological
2
N/a
Pollution
2
2. Pollution of existing supplies
1
N/a
5. Eutrophication
1
N/a
3. Changes in the water table
2
N/a
6. Chemical
2
N/a
7. Suspended solids
3
N/a
Criteria for Economics impacts
Raw score
Score
Weight %
8. Solid wastes
2
N/a
Very small
Very large
Size of economic or public sectors affected
2
N/a
0 1 2 3
9. Thermal
1
N/a
Minimum
Severe
Degree of impact (cost, output changes etc.)
2
N/a
0 1 2 3
10. Radionuclides
0
N/a
Occasion/Short
Continuous
Frequency/Duration
2
N/a
11. Spills
2
N/a
0 1 2 3
Weight average score for Economic impacts
2
Criteria for Economics impacts
Raw score
Score
Weight %
Criteria for Health impacts
Raw score
Score
Weight %
Very small
Very large
Very small
Very large
Size of economic or public sectors affected
2
N/a
Number of people affected
1
N/a
0 1 2 3
0 1 2 3
Minimum
Severe
Minimum
Severe
Degree of impact (cost, output changes etc.)
2
N/a
Degree of severity
1
N/a
0 1 2 3
0 1 2 3
Occasion/Short
Continuous
Occasion/Short
Continuous
Frequency/Duration
2
N/a
Frequency/Duration
1
N/a
0 1 2 3
0 1 2 3
Weight average score for Economic impacts
2
Weight average score for Health impacts
1
Criteria for Other social and
Criteria for Health impacts
Raw score
Score
Weight %
Raw score
Score
Weight %
community impacts
Very small
Very large
Very small
Very large
Number of people affected
2
N/a
Number and/or size of community affected
1
N/a
0 1 2 3
0 1 2 3
Minimum
Severe
Minimum
Severe
Degree of severity
2
N/a
Degree of severity
1
N/a
0 1 2 3
0 1 2 3
Occasion/Short
Continuous
Occasion/Short
Continuous
Frequency/Duration
2
N/a
Frequency/Duration
1
N/a
0 1 2 3
0 1 2 3
Weight average score for Health impacts
2
Weight average score for Other social and community impacts
1
Criteria for Other social and
Note: N/a = Not applied
Raw score
Score
Weight %
community impacts
Very small
Very large
Number and/or size of community affected
2
N/a
0 1 2 3
Minimum
Severe
Degree of severity
2
N/a
0 1 2 3
Occasion/Short
Continuous
Frequency/Duration
2
N/a
0 1 2 3
Weight average score for Other social and community impacts
2
Note: N/a = Not applied
ANNEXES
67
III: Habitat and community modification
IV: Unsustainable exploitation of fish
Weight
and other living resources
Environmental
Environmental issues
Score
Weight
averaged
concern
score
Weight
Environmental
Environmental issues
Score
Weight %
averaged
Habitat and community
concern
12. Loss of ecosystems
3
N/a
3
score
modification
13. Modification of ecosystems or
Unsustainable
14. Overexploitation
3
N/a
3
ecotones, including community
3
N/a
exploitation of fish
structure and/or species composition
15. Excessive by-catch and
3
N/a
discards
16. Destructive fishing practices
3
N/a
Criteria for Economics impacts
Raw score
Score
Weight %
Very small
Very large
17. Decreased viability of stock
Size of economic or public sectors affected
3
N/a
0
N/a
0 1 2 3
through pollution and disease
Minimum
Severe
18. Impact on biological and
Degree of impact (cost, output changes etc.)
3
N/a
2
N/a
0 1 2 3
genetic diversity
Occasion/Short
Continuous
Frequency/Duration
3
N/a
0 1 2 3
Criteria for Economics impacts
Raw score
Score
Weight %
Weight average score for Economic impacts
3
Very small
Very large
Size of economic or public sectors affected
3
N/a
Criteria for Health impacts
Raw score
Score
Weight %
0 1 2 3
Minimum
Severe
Very small
Very large
Degree of impact (cost, output changes etc.)
3
N/a
Number of people affected
1
N/a
0 1 2 3
0 1 2 3
Occasion/Short
Continuous
Minimum
Severe
Frequency/Duration
3
N/a
Degree of severity
1
N/a
0 1 2 3
0 1 2 3
Occasion/Short
Continuous
Weight average score for Economic impacts
3
Frequency/Duration
1
N/a
0 1 2 3
Criteria for Health impacts
Raw score
Score
Weight %
Weight average score for Health impacts
1
Very small
Very large
Criteria for Other social and
Number of people affected
2
N/a
Raw score
Score
Weight %
0 1 2 3
community impacts
Minimum
Severe
Very small
Very large
Degree of severity
2
N/a
Number and/or size of community affected
3
N/a
0 1 2 3
0 1 2 3
Occasion/Short
Continuous
Minimum
Severe
Frequency/Duration
2
N/a
Degree of severity
3
N/a
0 1 2 3
0 1 2 3
Occasion/Short
Continuous
Weight average score for Health impacts
2
Frequency/Duration
3
N/a
0 1 2 3
Criteria for Other social and
Raw score
Score
Weight %
Weight average score for Other social and community impacts
3
community impacts
Very small
Very large
Note: N/a = Not applied
Number and/or size of community affected
3
N/a
0 1 2 3
Minimum
Severe
Degree of severity
3
N/a
0 1 2 3
Occasion/Short
Continuous
Frequency/Duration
3
N/a
0 1 2 3
Weight average score for Other social and community impacts
3
Note: N/a = Not applied
68
GIWA REGIONAL ASSESSMENT 54 SOUTH CHINA SEA
V: Global change
Weight
Environmental
Environmental issues
Score
Weight
averaged
concern
score
19. Changes in the hydrological cycle
1
N/a
Global change
1
20. Sea level change
0
N/a
21. Increased UV-B radiation as a
0
N/a
result of ozone depletion
22. Changes in ocean CO2
0
N/a
source/sink function
23. Changes in sea surface
1
N/a
temperature
Criteria for Economics impacts
Raw score
Score
Weight %
Very small
Very large
Size of economic or public sectors affected
1
N/a
0 1 2 3
Minimum
Severe
Degree of impact (cost, output changes etc.)
1
N/a
0 1 2 3
Occasion/Short
Continuous
Frequency/Duration
1
N/a
0 1 2 3
Weight average score for Economic impacts
1
Criteria for Health impacts
Raw score
Score
Weight %
Very small
Very large
Number of people affected
1
N/a
0 1 2 3
Minimum
Severe
Degree of severity
1
N/a
0 1 2 3
Occasion/Short
Continuous
Frequency/Duration
1
N/a
0 1 2 3
Weight average score for Health impacts
1
Criteria for Other social and
Raw score
Score
Weight %
community impacts
Very small
Very large
Number and/or size of community affected
1
N/a
0 1 2 3
Minimum
Severe
Degree of severity
1
N/a
0 1 2 3
Occasion/Short
Continuous
Frequency/Duration
1
N/a
0 1 2 3
Weight average score for Other social and community impacts
1
Note: N/a = Not applied
Comparative environmental and socio-economic impacts of each GIWA concern
Types of impacts
Environmental score
Economic score
Human health score
Social and community score
Concern
Overall score
Rank
Present (a)
Future (b)
Present (a)
Future (b)
Present (a)
Future (b)
Present (a)
Future (b)
Freshwater shortage
2
2
2
3
1
1
1
2
1.8
4
Pollution
2
2
2
3
2
1
2
2
2.0
3
Habitat and community
3
3
3
3
1
1
3
3
2.5
2
modification
Unsustainable exploitation of fish
3
3
3
3
2
2
3
3
2.8
1
and other living resources
Global change
1
1
1
2
1
1
1
1
1.1
5
ANNEXES
69
Annex III
environmental policy to regional priorities and needs. It acts as a catalyst,
List of important water-related coordinator, facilitater and mobiliser of resources. It puts particular
programmes and assessments
emphasis on building partnerships with regional and sub-regional
inter-governmental fora, other UN agencies, national governments,
NGOs, the private sector, academic and research institutions, and civil
Major inter-governmental agreements and
society, and the media.
actors
UN Economic and Social Commission for Asia and the Pacifi c, ESCAP
East Asian Seas Regional Coordinating Unit
Within the Water Resources Programme under its Environment and
Information on the UNEP East Asian Seas Programme can be found
Natural Resources Development Division, the UN ESCAP organises
on the web site of the Coordinating Unit, which is located with ROAP.
seminars and workshops on various issues relating to water resources,
The Unit is the coordinating body for the East Asian Seas Action Plan
including: water resources assessment; integrated water resources
(see below).
development and management; protection of water resources,
water quality and aquatic ecosystems; river basin development
Financial institutions
and management; promotion of infrastructure development and
Asian Development Bank (ADB)
investment for drinking water supply and sanitation; water pricing and
The Asian Development Bank, a multilateral development fi nance
promotion of private investment in the water sector; water demand
institution, was founded in 1966 by 31 member governments to
management, water saving and economic use of water; and mitigation
promote the social and economic progress of the Asia-Pacifi c region. It
of water-related natural disasters, particularly fl ood loss reduction.
now has 58 member countries - 42 from within the region and 16 non-
regional. ADB gives special attention to the needs of the smaller or less-
Association of Southeast Asian Nations (ASEAN)
developed countries, and to regional, subregional, and national projects
ASEAN was established in 1967 and has 10 member countries: Brunei,
and programs. Promoting sustainable development and environmental
Cambodia, Indonesia, Laos, Malaysia, Myanmar, Philippines, Singapore,
protection is a key strategic development objective of the Bank. To
Thailand and Vietnam. The ASEAN Declaration states that the aims and
fulfi ll this objective, the Bank: (i) reviews the environmental impacts of
purposes of the Association are: to accelerate the economic growth,
its projects, programs, and policies; (ii) encourages DMC governments
social progress and cultural development in the region through
and executing agencies to incorporate environmental protection
joint endeavours in the spirit of equality and partnership in order to
measures in their project design and implementation procedures, and
strengthen the foundation for a prosperous and peaceful community
provides technical assistance for this purpose; (iii) promotes projects and
of Southeast Asian nations, and to promote regional peace and stability
programs that will protect, rehabilitate, and enhance the environment
through abiding respect for justice and the rule of law in the relationship
and the quality of life; and (iv) trains Bank and DMC staff in, and provides
among countries in the region and adherence to the principles of
documentation on, environmental aspects of economic development.
the United Nations Charter. In 1995, the ASEAN Heads of States and
The Asian Development Fund (ADF) is the concessional lending window
Government re-affi
rmed that "Cooperative peace and shared prosperity
of the Bank.
shall be the fundamental goals of ASEAN."
ASEAN work on water conservation (inclusive ANWRA) and seas and
Action programmes, strategies and research
marine environment;
Strategic Action Programme for the South China Sea
ASEAN Network of Water Resources Agencies (ANWRA);
The Strategic Action plan is based on the fi ndings of the Transboundary
the Strategic Plan of Action for the Environment (see below),
Diagnostic Analysis for the South China Sea (see below). The actions
adopted by the ASEAN Ministers of Environment;
proposed are wide-ranging in both context and areas of action.
ASEAN 1997 Jakarta Declaration on Environment and Targets for environmental quality are proposed with regard to habitats
Development.
(mangroves, coral reefs, seagrass, estuaries and wetlands), fi sheries
management, and land-based pollution.
UNEP Regional Offi
ce for Asia and the Pacifi c (ROAP)
Working closely with the Division of Regional Co-operation
ASEAN Strategic Plan of Action on the Environment
and Representation in UNEP's Nairobi-based headquarters, the
The Strategic Plan of Action on the Environment for 1994-1998 has the
Regional Offi
ce for Asia and the Pacifi c (ROAP) looks to adopt global
following fi ve objectives:
70
GIWA REGIONAL ASSESSMENT 54 SOUTH CHINA SEA
To respond to specifi c recommendations of Agenda 21 requiring
Catalogue; a Directory of Research and Management Institutions in
priority action in ASEAN;
Southeast Asia; and a database of Good Practices. See also the PEMSEA
To introduce policy measures and promote institutional
Updates, a free online newsletter.
development that encourage the integration of environmental
factors in all developmental processes both at the national and
UNEP Regional Seas Programme
regional levels;
The Regional Seas Programme was initiated in 1974 as a global
To establish long-term goals on environmental quality and work
programme implemented through regional components. The Regional
towards harmonised environmental quality standards for the
Seas Programme is UNEP's main framework in the fi eld of the coastal
ASEAN region;
and marine environment. It includes 14 regions and three partner seas,
To harmonise policy directions and enhance operational and
involves more than 140 coastal states, and focuses on sustainable
technical cooperation on environmental matters, and undertake
development of coastal and marine areas. Each regional action plan
joint actions to address common environmental problems; and
is formulated according to the needs and priorities of the region as
To study the implications of AFTA on the environment and take
perceived by the Governments concerned. Regional conventions are
steps to integrate sound trade policies with sound environmental
in place for several areas. See a map of all regional seas, and go to
policies.
more information on the Black Sea, Wider Caribbean, Mediterranean,
East Asian Seas, South Asian Seas, Eastern Africa, Kuwait Region, North
Despite the impacts of the recent economic crisis on the natural
West Pacifi c, Red Sea And Gulf of Aden, South East Pacifi c, North East
resources and environmental conditions, the ASEAN Environment
Pacifi c, South Pacifi c, Upper South West Atlantic, and West and Central
Ministers at their Fifth Informal Meeting in April 2000 discussed the
Africa. The UNEP Regional Seas web site also contains information on
importance of keeping their commitment to environmental protection
What's at stake, Major threats, and Actions.
and sustainable development. Hence, to move forward towards the
future goals and directions that the ASEAN leaders expressed in
East Asian Seas Action Plan
ASEAN Vision 2020 and the Hanoi Plan of Action (adopted in 1997
On the initiative of the fi ve States of the East Asian region - Indonesia,
and 1998 respectively) the Ministers adopted the ASEAN Strategic
Malaysia, Philippines, Singapore and Thailand - the Governing Council
Plan of Action on the Environment (SPAE) for 1999-2004. It consists
of UNEP in 1977 decided that "steps are urgently needed to formulate
of the key activities to be implemented by ASOEN (ASEAN Senior
and establish a scientifi c programme involving research, prevention
Offi
cials on the Environment) and its subsidiary bodies over the next
and control of marine pollution and monitoring " for a regional action
fi ve years, including the areas of coastal and marine environment,
plan in East Asia. An Action Plan for the Protection and Sustainable
nature conservation and biodiversity, multilateral environmental
Development of the Marine Environment and Coastal Areas of the East
agreements, management of land and forest fi res and haze, and other
Asian Region was adopted in 1981, with a decision making body, the
environmental activities.
Coordinating Body on the Seas of East Asia (COBSEA). A revised Action
Plan and a Long-term Strategy for the COBSEA for the 1994-2000
Partnership in Environmental Management for for the Seas of
period were developed in 1994 and Australia, Cambodia, China, Korea
East Asia (PEMSEA)
and Vietnam joined the Action Plan. A new East Asian Seas Action Plan
A GEF project, focusing on "building partnerships within and among
(Leading the EAS Action Plan to the 21st Century) has been elaborated
governments of the region, as well as across public and private sectors
for the period 2000-2009.
of the economy. The goal is to reduce or remove barriers to eff ective
environmental management, including inadequate or inappropriate
State of the regional environment
policies, disparate institutional and technical capabilities and limited
Transboundary Diagnostic Analysis for the South China Sea
investment in environmental facilities and services". PEMSEA is "based
The TDA for the South China Sea and its associated catchment areas
on two management frameworks developed and tested in an earlier
was a process that focused on identifying water-related problems
GEF Project: Integrated coastal management, addressing land-water
and concerns, their socio-economic root causes, and the sectoral
interactions and the impacts of human activity in coastal areas; and risk
implications of actions needed to mitigate them. The chapter on State
assessment/risk management, applying to subregional sea areas and
of the Environment covers modifi cation of habitats, overexploitation of
the impacts of human activities on marine ecosystems." PEMSEA web
living aquatic resources, and pollution of aquatic environments.
resources include: Virtual ICM; a Legal Information Database Reference
ANNEXES
71
GEO 2000 State of the Environment: Asia and the Pacifi c
UNEP/GEF - International waters: Reversing Degradation Trends
Global Environment Outlook 2000. GEO is:
in the South China Sea
A global environmental assessment process, the GEO Process, that is
Major outcomes will include an approved Strategic Action Programme
cross-sectoral and participatory. It incorporates regional views and
that will include: a targeted and costed programme of action and a
perceptions, and builds consensus on priority issues and actions
recommended legal framework for improved regional cooperation in
through dialogue among policy-makers and scientists at regional
the management of the environment of the South China Sea; a series of
and global levels.
national and regional management plans for specifi c habitats and issues;
GEO outputs, in printed and electronic formats, including the
nine demonstration management activities at priority transboundary
GEO Report series. This series makes periodic reviews of the state
sites; a regional management plan for maintenance of transboundary
of the world's environment, and provides guidance for decision-
fi sh stocks; and pilot activities relating to alternative remedial actions
making processes such as the formulation of environmental
to address priority pollutants and adopted water quality objectives and
policies, action planning and resource allocation. Other outputs
standards. Activities include national level analyses and reviews and
include technical reports, a web site and a publication for young
management of demonstration activities and regional harmonisation
people.
and coordination of national level actions.
GEF Projects in the region
World Bank - GEF - Biodiversity: Hon Mun Marine Protected Area
Projects under implementation
Pilot Project, Vietnam
UNDP/GEF - International waters: Building Partnerships for the
This project will support the conservation of critical marine biodiversity
Environmental Protection and Management of the East Asian Seas
values at Hon Mun Island and its surrounding waters, located off Nha
The objective of the project is to assist the riparian countries
Trang in Khanh Hoa Province, south-central Vietnam. This will be
of the East Asian Seas to collectively protect and manage their
achieved through the development of a zoned, multiple-use marine
heavily stressed coastal and marine environments through inter-
protected area (MPA) that protects globally important examples of
governmental and inter-sectoral partnerships. These countries
Vietnam's best remaining coral reef, mangrove and seagrass ecosystems.
include the Republic of Korea which for the first time is a GEF
This project will establish Hon Mun as an MPA pilot site, developing
recipient. Building upon the methodologies, approaches, methodologies for MPA establishment and management that can be
typologies, networks and lessons learned from the pilot phase, the
replicated in other areas as part of a national MPA system.
project would enhance and complement national and international
efforts by removing or lowering critical barriers regarding policy,
Project concepts in the pipeline
investment, capacity, which are having negative effects on the
UNEP/GEF - International waters: Formulation of a
management of the coastal/marine environment in the region.
Transboundary Diagnostic Analysis and Preliminary Framework
Together with several water body-based projects in the area, these
of a Strategic Action Programme for the South China Sea
projects constitute GEF's programmatic approach to these coastal
The primary objective of this project is to undertake an extensive
and marine waters with globally significant ecosystems that are
transboundary diagnostic analysis for the South China Sea and the
experiencing severe degradation.
watershed draining into it. The transboundary diagnostic analysis will
form the basis for formulating a framework for a SAP.
UNDP/GEF - International waters: Prevention and Management
of Marine Pollution in the East Asian Seas
UNDP - GEF - Biodiversity/International waters: Biodiversity
Development of policies and plans to control marine pollution
Management in the Coastal Area of China's South Sea
from land-based and sea-based sources, upgrading of national
The project aims at protecting globally signifi cant marine and coastal
and regional infrastructures and technical skills, and establishment
biodiversity along China's sub-tropical and tropical southeast.
of fi nancing instruments for project sustainability. Project will
include selection of demonstration sites, establishment of regional
Other actors, initiatives and resources
monitoring and information network, and involvement of regional
WorldFish Center (formerly ICLARM)
association of marine legal experts to improve capacity to implement
An international research organisation "devoted to improving the
relevant conventions.
productivity, management and conservation of aquatic resources
for the benefi t of users and consumers in developing countries".
72
GIWA REGIONAL ASSESSMENT 54 SOUTH CHINA SEA
ICLARM is one of the research centres of CGIAR, Consultative Group
on International Agricultural Research. ICLARM, in collaboration with
the the Food and Agriculture Organization of the United Nations (FAO)
and other partners, and with support from the European Commission,
has developed FishBase, a global information system on fi shes for
research scientists, fi sheries managers, zoologists and many more.
FishBase contains full information on 23 500 species. ICLARM has also
developed similar systems on coral reefs and their resources (ReefBase)
and management of fi sh stocks in Asia (TrawlBase).
International Coral Reef Initiative (ICRI)
An environmental partnership that brings stakeholders together
with the objective of sustainable use and conservation of coral reefs
for future generations. ICRI is an informal mechanism that allows
representatives of over 80 developing countries with coral reefs to
sit in equal partnership with major donor countries and development
banks, international environmental and development agencies,
scientifi c associations, the private sector and NGOs to decide on the
best strategies to conserve the world's coral reef resources.
Coral Health and Monitoring Programme (NOAA)
The mission of the NOAA Coral Health and Monitoring Program is
to provide services to help improve and sustain coral reef health
throughout the world. Long term goals: Establish an international
network of coral reef researchers for the purpose of sharing knowledge
and information on coral health and monitoring. Provide near real-time
data products derived from satellite images and monitoring stations at
coral reef areas. Provide a data repository for historical data collected
from coral reef areas. Add to the general fund of coral reef knowledge.
See also Global Coral Reef Monitoring Network, GCRMN.
The International Coral Reef Initiative (ICRI) launched the GCRMN in
1996 to improve management and sustainable conservation of coral
reefs for people by assessing the status and trends in the reefs and
how people use and value the resources. The GCRMN links existing
organisations such as Reef Check, CORDIO, CARICOMP, AGRRA and
ReefBase to promote ecological and social, cultural and economic
monitoring of coral reefs. The GCRMN produces the `Status of Coral
Reefs of the World' reports every 2 years and activities in the South
China Sea are coordinated from the WorldFish Center in Penang
Malaysia (www.gcrmn.org & www.reefbase.org).
ANNEXES
73
Annex IV
national plans, policies, objectives and strategies for water resources
List of institutions that affect
management and development which are used as guidelines by the
water use
provinces. It also prepares prioritised lists of investment projects for
consideration by the state planning committees.
Institutional Environment Water Sector
The Offi
ce of Irrigation and Drainage Management oversees the
China
management of irrigation and drainage structures, develops policy
The main institutions involved in water resources management are:
guidance, produces operations and maintenance guidelines and
Ministry of Water Resources (MWR), responsible for water resources
collects data. It operates one national irrigation scheme in Dau Tieng,
survey and assessment, rural water planning and development,
and interacts with other schemes through provincial or regional
and management and protection of water resources. The Ministry
Irrigation and Drainage Management Committees and Provincial
of Water Resources directly supervises the Water Resources and
Peoples Committees.
Hydroelectric Power Construction Corporation, and administers
13 higher education institutions and 7 regional basin commissions.
The Vietnamese Hydraulic Investigation and Design Company is the
Local Water Resources Management Department, responsible
technical design arm of the MWR. The Construction Management
for water administration at provincial level. Each province has a
Department, fi nancially autonomous since 1994, develops procurement
Water Resource Bureau responsible for planning, survey, design,
and construction management policies and guidelines for the water
construction, operation and management of irrigation, drainage,
resources sector and monitors the activities of construction enterprises
fl ood control works, and rural hydroelectricity. Water resources
building MWR schemes. Other institutions involved with irrigation
bureaux at the prefecture and county levels are directly responsible
planning and management include the Ministry of Science, Technology
for the construction and maintenance of main and secondary canals,
and Environment, which formulates environmental policies, which may
associated irrigation and fl ood control structures, and medium-
include water related issues. The General Department for Meteorology
sized reservoirs. Townships and villages share responsibility for
and Hydrology undertakes surveying and hydrographic data collection
constructing and maintaining branch canals, ancillary works, and
and monitoring. The Ministry of Energy manages electricity generation,
small reservoirs.
transmission, and distribution for uses including irrigation pumping.
Ministry of Geology and Mineral Resources cooperates with the
MWR in the management of groundwater resources.
The World Bank irrigation rehabilitation project, being implemented
State Environmental Protection Bureau deals with the protection of
since 1995, is funding the rehabilitation and completion of seven
water resources.
irrigation schemes comprising a total area of 130 000 ha, at a total
Ministry of Agriculture is responsible for state farm water
investment cost estimated at 40 million USD. The Red Delta water
conservation, construction and management.
resources sector project provided 75 million USD, fi nanced by the Asian
Ministry of Construction is responsible for urban water conservancy
Development Bank, to rehabilitate or upgrade 20-30 small to medium-
including groundwater exploitation and protection.
scale irrigation schemes in the Red Delta. The project was implemented
by the MARD and was completed recently.
China's water law was enacted in 1988 and establishes principles,
general guidelines, and technical standards for water resources
Thailand
management.
Some 38 ministerial departments under 10 ministries, one independent
agency and six national committees are involved in water resources
Vietnam
development, with responsibilities for water policy, irrigation, domestic
The Ministry of Water Resources (MWR) is the main body charged with
and/or industrial water supply, fi sheries, fl ood alleviation, hydropower
setting policy, and responsible for the planning, management and
generation, navigation or water quality. The National Water Resources
allocation of water resources at the central level. The MWR is responsible
Committee (NWRC), under the Offi
ce of the Prime Minister, is responsible
for constructing headworks and canals for schemes larger than 150 ha,
for setting a policy to develop water resources throughout the country.
while the provinces are responsible for developing smaller schemes.
The National Economic and Social Development Board is responsible
Several divisions of the MWR are particularly important for agricultural
for economic planning. The Department of Mineral Resources, under
water control. The Institute of Water Resources Planning prepares
the Ministry of Industry, monitors groundwater resources, while surface
74
GIWA REGIONAL ASSESSMENT 54 SOUTH CHINA SEA
water monitoring is mainly carried out by the Department of Energy
gathering and maintenance of information on rainfall and
Development and Promotion under the Ministry of Science, Technology
evaporation.
and Environment, and the RID, which has its own network.
Bureau of Research and Standards (BRS) of the DPWH, which is
engaged in monitoring and studies of water resources as well as
Many departments or agencies are involved in water supply for
water research and quality standards. The DPWH is also responsible
domestic or industrial purposes. The main one is the Metropolitan
for fl ood control.
(or Provincial, outside Bangkok) Waterworks Authority. Wastewater
NPC, which conducts water resources monitoring, research and
treatment and water quality are mainly the responsibility of the
hydropower generation.
Ministry of Science, Technology and Environment. Large dams are
operated either by the RID or by the EGAT, while small dams have
(iii) In irrigation:
been developed by the Land Development Department or the Offi
ce
NIA of the Department of Agriculture, which was created in 1974
of Accelerated Rural Development (under the Ministry of Interior). The
with the mandate to initiate an `irrigation age'. Its tasks include the
Harbour Department is in charge of protecting inland waterways, and
development, operation and maintenance of irrigation systems
of issuing licenses for navigation. Irrigation is managed by the RID for
throughout the country. In particular, it has been responsible for
public schemes, or by the Department of Energy Development and
the construction of NIS schemes, and is now responsible for the
Promotion for the electric pumped schemes. The RID is the supervising
recovery of irrigation fees.
agency for private irrigation.
Bureau of Soils and Water Management (BSWM) of the Department
of Agriculture, which handles, through its Project Management Offi
ce
A groundwater act adopted in 1987 defi nes the responsibilities, rights
(PMO), the construction and maintenance of SWIM projects.
and duties of each of the various parties involved. In May 1998, a national
water resources act was awaiting cabinet approval. This act should
The SWIM projects have been implemented by the Government to
establish the NWRC as the coordinating agency for water resources
mitigate damage brought about by insuffi
cient water supply during
development. Although work began some years ago on a national water
the dry season and the frequent fl oods during the rainy season. The
resources mater plan for water resources development in the 25 river
objectives might diff er from one project to another, and the following
basins, this work has come to a standstill due to lack of funds.
agencies are involved:
DPWH, for water supply, inland fi shing and mini-hydropower;
Philippines
NIA,
for
irrigation;
The NWRB coordinates the activities of the diff erent agencies involved
Forest Management Bureau (FMB), for watershed management
in the water sector (irrigation, hydropower, fl ood control, navigation,
with an incidental purpose of fl ood control;
pollution, water supply, waste disposal, watershed management, etc.).
National
Electrifi
cation
Administration
(NEA),
for
mini-hydropower
The others main agencies involved in water resources management are:
generation.
(i) In water supply and wastewater:
Metropolitan Waterworks and Sewerage System (MWSS) of the
The 1976 Water Code of the Philippines revised and consolidated the
Department of Public Works and Highways (DPWH), which is
laws governing the ownership, appropriation, utilisation, exploitation,
responsible for water supply, storage, treatment, research, design,
development, conservation and protection of water resources which
construction and maintenance of water supply and sewage
are subject to government control and regulation through the
systems in the national capital region and outlying service areas in
NWRB.
nearby provinces.
Local Water Utilities Administration (LWUA) of the Department of
Malaysia
Public Works and Highways (DPWH), which is responsible for the
The responsibility for water resources planning and development is
development and improvement of water and sewerage systems in
shared by various government agencies. Malaysia has no single water
areas not covered by the MWSS.
resources authority for an overall coordinated planning and integrated
river management approach.
(ii) In water resources monitoring and development:
Philippine Atmospheric, Geophysical and Astronomical Services
The Department of Irrigation and Drainage (DID), under the Ministry
Administration (PAGASA), which conducts monitoring, data
of Agriculture, is responsible for the planning, implementing
ANNEXES
75
and operation of irrigation, drainage and fl ood control projects
Numerous institutions are presently involved in water resources
throughout the country. The Department of Agriculture (DOA)
management. Their tasks and responsibilities are clearly stated in
is responsible for providing advice and extension services to the
national legislation:
farmers. In the water supply sector, the Public Works Department
The Ministry of Public Works, with its Directorate General of Water
(PWD), under the Ministry of Public Works, is responsible for the
Resources Development, is responsible for planning, design,
planning, implementation and operation of urban water supply
construction, equipment, O&M, and guidance in water resources
projects. However, in line with the Government's privatisation policy,
development.
many water supply projects have already been taken over by water
The Ministry of Forestry is responsible for catchment area
supply companies or privatised.
development.
The Ministry of Environment is responsible for environmental
The Ministry of Health (MOH) provides untreated but drinkable water to
quality development and management.
rural communities not served by the local water authorities. The MOH
The Environmental Impact Management Agency is responsible for
also monitors water quality at water treatment plant intakes as well as
environmental impact control.
the quality of water within the distribution system for compliance with
national drinking water standards.
Cambodia
The public institutions involved in the water sector are:
The control of water pollution is the responsibility of the Department
General Directorate of Irrigation, Meteorology and Hydrology of the
of Environment (DOE), which is empowered to enforce compliance
Ministry of Agriculture, Forestry and Fisheries, with:
with effl
uent standards for point sources of pollution. The Ministry
Department of Water Management, which is responsible for the
of Housing and Local Government is responsible for compliance
O&M of all irrigation infrastructure in Cambodia, including the
with regulations and standards on sewerage works which have been
operation and repair of pumps. The offi
ce also undertakes rural
privatised to a national sewerage company. Although either directly
water supply, including well drilling;
or indirectly much legislation touches on water resources, most of
Department of Engineering, which is responsible for the design and
the existing laws are considered outdated. The Water Act of 1920 is
construction of hydraulic structures;
inadequate for dealing with the current complex issues related to water
Department of Hydrology, which carries out the installation and
abstraction, pollution and river basin management.
maintenance of a network of hydrological stations, and collects
and processes data;
Indonesia
Department of Meteorology, which is in charge of meteorological
The 1945 constitution declared national water and land resources
data collection and forecasting;
to be controlled by the State and that they should be utilised in an
Department of Research, Training and Extension;
equitable manner for the benefi t of the people. The responsibilities for
The
Mekong
Secretariat.
the development and management of water resources and irrigation
schemes are specifi ed in laws, presidential instructions and government
An informal `water resources law task force' has been established
regulations. The most important are:
through the Irrigation Sector Meeting of the interested parties. As part
Presidential Instruction No. 1 (1969), on the management of
of this process, an adviser to the Ministry of Agriculture, Forestry and
irrigation water and maintenance of irrigation networks;
Fisheries (MAFF) has compiled a draft law on the water resources of
Law on water resources development No. 11 (1974);
Cambodia, which was due to be submitted in 1996. Domestic water
Government regulations on:
supply is the responsibility of several institutions: the Department
- Benefi ciaries contribution for maintenance cost of water
of Hydrology, the Ministry of Public Works and the Ministry of Rural
resources facilities No. 6 (1981),
Development.
- Water management No. 6 (1982),
- Irrigation, No. 23 (1982),
- Rivers (1991) and swamps (1991);
- Decree of the Minister of Mining and Energy concerning
underground water resources management (1983).
76
GIWA REGIONAL ASSESSMENT 54 SOUTH CHINA SEA
Annex V
Criteria for scoring environmental impacts
Issue 23: Changes in ocean surface temperature
This refers to the impact on populations, species, and communities from changes in Sea Surface Temperature as a result of global change.
Score 0 = No known impact
No measurable or assessed effects of SST increase.
Slight impact is determined when one or more of the following criteria are met or exceeded:
Score 1 = Slight
Measured assessed effects of SST are causing a behavioral change in some species without affecting the viability of the population
Moderate impact is determined when one or more of the following criteria are met or exceeded:
Score 2 = Moderate
Community structure is measurably altered as a consequence of changes in SST.
Populations are declining.
Severe impact is determined when one or more of the following criteria are met or exceeded:
Score 3 = Severe
Measured/assessed effects of changed SST are leading to massive loss of communities or a change in biological diversity.
ANNEXES
77
Annex VI
on catches of demersal fi sh is sparse. In deep oceanic waters (200 to
The South China Sea Large
4 000 m), fi sheries are limited to large pelagic fi shes, mainly tuna (Pauly
Marine Ecosystem
& Christensen 1993). Other species harvested are billfi sh, swordfi sh,
shark, porpoise, mackerel, fl ying fi sh, anglerfi sh and shrimp. The total
fi sh harvest is approximately 5 million tonnes per year. This is about 13%
(Excerpted from LME 2004)
of the area's total fi sh production, the rest being eaten by predators. Five
of the countries are among the top 8 shrimp producers of the world.
Brief description
Fishermen sometimes use small-meshed nets and practice destructive
The South China Sea Large Marine Ecosystem is bounded by the coasts
fi shing methods, such as cyanide and dynamite fi shing. While 2/3 of
of Vietnam, China, Taiwan, the Philippines, Malaysia, Thailand, Indonesia
the major fi sh species are overexploited, carefully constructed fi shing
and Cambodia. It is separated from the Gulf of Thailand, to the West,
regimes could result in increased catches (Pauly & Christensen 1993).
by a shallow sill (Piyakarnchana 1989, Eiamsa-Ard & Amornchairojkul
The Vietnam/China area was lightly exploited from the mid-1970s to the
1997). The South China Sea contains many biological sub-systems and
mid-1980s. By now much of this potential has probably been realised.
a variety of habitats. These include mangrove forests, seagrass beds,
The deeper coralline areas and those situated in the central portion
coral reefs and soft-bottom communities. The 50 m depth contour
of the LME are only slightly exploited, leaving room for an increase in
largely follows the coast, with the widest shelves occurring along the
production there (Alcala 1981, White 1989). The potential areas for an
eastern edge of the LME. Much of the South China Sea is below 200 m.
increase lie in the deeper areas of the LME, but these are areas diffi
cult
Small coralline areas can be found south of Cambodia, between Borneo
to fi sh. The University of British Columbia Fisheries Center has detailed
(Malaysia) and Sumatra (Indonesia), and off Palawan Island (Philippines)
fi sh statistics for this LME.
in waters deeper than 200 m (Pauly & Christensen 1993).
Pollution and ecosystem health
Productivity
The health of the South China Sea Large Marine Ecosystem is in serious
The South China Sea is a biologically diverse marine ecosystem. It is
decline due mainly to coastal development. Presently, 270 million
considered a Class II, moderately high productivity (150-300 gC/m2/year)
people (5% of the world's population) live in the coastal areas of the
ecosystem based on SeaWiFS global primary productivity estimates.
South China Sea LME, and this population is expected to double in
High productivity levels are found in gulfs, along the coast, and in reef
the next three decades. This population explosion is driven by world
and seagrass areas, common in the Philippines portion of the LME
trade, tourism, industrialisation, fi sheries, and oil exploration and
(Pauly & Christensen 1993). Production decreases with depth. For a
exploitation. The area's rapid economic development and population
study of productivity in the Southwestern South China Sea (eastern
growth are the cause of signifi cant ecological damage in coastal and
peninsula of Malaysia and southeastern Sumatra), see FAO (1981).
marine areas. The primary environmental threats by humans in the
Oceanic waters ranging in depth from 200 to 4 000 m cover nearly
South China Sea are the destruction of mangrove forests, sewage
one-half of the South China Sea. Pauly and Christensen (1993) have
pollution, exploitative fi shing practices and overfi shing, coral reef
developed a static, stratifi ed model of the South China Sea ecosystem
degradation, and damage to seagrasses and wetlands. Only a third of
that accounts for consumption, exportation by fi shing and migration,
the region's mangrove forests remain. 65% of mangrove forests have
predation, and other mortality.
been lost or converted into shrimp farms, industrial areas or tourist
resorts. The mangroves are chopped up for wood chips or fi rewood.
Fish and fisheries
Their disappearance on such a large-scale has led to sediment erosion,
The Pauly and Christensen (1993) fi sheries model incorporates data from
water pollution, loss of biodiversity and a critical loss of nursery habitat
several regions. The coastal and estuarine areas off of Vietnam, China and
for young fi sh. Sewage-laden water causes disease downstream.
Cambodia are very productive. In the past, a substantial fraction of the
Sewage pollution aff ects biodiversity and fi sheries. 2/3 of major fi sh
Vietnamese catch was taken by artisanal, non-mechanised boats. South
species are overfi shed. 80% of the coral reefs are at risk from pollution,
Vietnam's demersal resources were exploited primarily by Taiwanese
overexploitation and cyanide and dynamite fi shing for reef fi sh. Other
vessels. The Northwestern coast of the Philippines is a soft-bottom area
pollution problems are increased river sedimentation and the eff ects
fi shed intensively by trawlers (Silvestre et al. 1989). The deep shelf area of
of climate change, which aff ect the corals. 125 major rivers fl ow into the
South China Sea is predominantly fi shed by Taiwanese vessels (Yeh 1981).
South China Sea. The eff ects of increased sedimentation and nutrients,
There are no catch or biomass data for shrimp or crabs, and information
plus destructive fi shing practices, are being felt in the region's other
78
GIWA REGIONAL ASSESSMENT 54 SOUTH CHINA SEA
major habitat, seagrass communities, of which 20 to 50% were found to
on a 32 million USD plan to protect the marine environment. The Global
be degraded. Many fi sh nursery areas and breeding grounds are being
Environment Facility (GEF) is contributing 16 million USD to this plan.
degraded. UNEP has undertaken the COMEMIS project (Coastal Marine
As knowledge of environmental hazard is spread through the region,
Environment Management Information System), to help improve the
the impetus for confl ict resolution will grow. GEF funding will secure
region's capacity to make sound environmental assessments through
a comprehensive package of marine environmental research and
GIS.
projects that will build human and institutional capacity. Through
their concern for the environment the countries of the South China
Socio-economics
Sea can be brought closer together as they discover their common
The South China Sea LME contributes to the livelihood of millions of
heritage and the importance of the Sea as a source of protein for the
people engaged in world trade, tourism, industry, fi sheries and oil
growing coastal populations. For a map of the area and information on
exploitation. However, the ongoing depletion of the sea's marine
managing potential confl icts in the South China Sea LME, on the status
resources is likely to adversely aff ect the region's economy. The South
of conventions, and for a transboundary diagnostic analysis for this LME,
China Sea is the world's second busiest international sea lane.
go to the University of Oslo web site (http://sum.uio.no/southchinasea/
links/recommend.html).
Governance
Seven nations are involved in the governance of the South China
References
Sea LME. The countries are Cambodia, China, Indonesia, Malaysia,
Alcala, A.C. (1981). Fish yields of coral reefs of Sumilon Island, Central
Philippines, Thailand and Vietnam. The region, in experiencing a phase
Philippines, Nat. Resource Counc. Philipp. Res. Bull. 36(1):1-7.
of rapid economic development and population growth, did not
Blackburn, M. (1981). Low latitutde gyral regions. p 3-29 In: Longhurst,
account for the environmental consequences: the degradation of its
A.R. (ed.) Analysis of marine ecosystems. Academic Press. San
resources and water quality. Until now, narrow state interests and power
Diego.
politics have characterised the interaction between countries, and the
Dokken, K. (2001). Environment, Security and Regionalism in the
infl uence of environmental groups has remained inconsequential.
Asia Pacifi c: Is Environmental Security a Useful Concept" Paper
Rapid economic growth has also sharpened confl icts between the
presented under Panel 1: The Environment, Energy and Maritime
various sectors within governments. This was especially true of China
Aff airs at the conference Human and Regional Security around the
in the past decade. Governments of the South China Sea region are
South China Sea, Oslo 2-4 June 2000.
now coming to see that the marine environment in the region is under
Eiamsa-Ard, M. and Amornchairojkul, S. (1997). The marine fi sheries of
threat. Environmental ministries are now in place, and environmental
Thailand, with emphasis on the Gulf of Thailand trawl fi shery. p 85-
laws and regulations are being formulated. The Chinese government
95 In: Silvestre, G. and Pauly, D. (eds.). Status and Management of
has asked for help from UNDP to implement integrated coastal
tropical coastal fi sheries in Asia. ICLARM Conf. Proc. 53.
management through the establishment of demonstration zones. This
Food and Agriculture Organization (FAO) (1981). Atlas of the living
project was initiated in 1997, with an investment of 1.1 million USD from
resources of the seas FAO Fisheries Series. Rome.
UNDP, and 18 million yuan (2.2 million USD) from China. The United
Liew, H.C. and Chan, E.H. (1987). ECOPATH model of a tropical
Nations Environment Program (UNEP) has unveiled a regional plan
shallow-water community in Malayasia. Manuscript submitted to
to try to reverse the degradation of the South China Sea by starting
International Development Research Center (IDRC)/Singapore.
9 pilot projects for sustainable development at priority transboundary
NŠss, T. (1999). Epistemic Communities and Environmental Co-operation
sites in the region. UNEP's Strategic Action Plan for the South China Sea
in the South China Sea. In: Snildal, K. (Comp.): Perspectives on the
has been endorsed by all ASEAN members as well as by the People's
Confl ict in the South China Sea, SUM Workshop Proceedings,
Republic of China. This is the fi rst time the seven countries have agreed
August 1999.
to collaborate around the marine biology of the region. Several of the
NŠss, T. (2000). Environment and Security in the South China Sea Region:
countries have contending claims to large areas of the South China
The Role of Experts, Non-Governmental Actors and Governments
Sea, leading to political tensions among them. The claims are about
in Regime Building Processes. A thesis for the Cand. Polit. degree at
the status of the Paracel Islands and the Spratly Islands, which are said
the Department of Political Science, University of Oslo, December
to contain minerals, oil and gas resources. In 2001, these Asian nations
1999. SUM Dissertations & Thesis series No. 1/2000.
agreed to set aside their quarrels in order to save the South China Sea,
and signed a joint agreement to the UNEP project. They will cooperate
ANNEXES
79
NŠss, T. 2000. Environmental co-operation around the South China Sea?
Wyrtki, K. (1961). Dynamics of the demersal fi sh resources in the
The experience of the South China Sea Workshops and the United
Sunda Shelf area of the South China Sea. Ph.D. diss., University of
Nations Environment Programme's Strategic Action Programme.
Washington, Seattle.
Paper presented under panel 1: The Environment, Energy and
Yeh, S.A. (1981). Dynamics of the demersal fi sh resources in the
Maritime Aff airs at the conference Human and Regional Security
Sunda Shelf area of the South China sea. Ph.D. diss., University of
around the South China Sea, Oslo 2-4 June 2000
Washington, Seattle.
Nguyen, T.A. (1989). Energy balance of the major tropical marine shelf
ecosystem of Vietnam. Biologiya Morya (Sov. J. Mar. Biol.)15(2):78-
83.
Pauly, D. (1979). Theory and management of tropical multispecies
stocks: A review, with emphasis on the Southeast Asian demersal
fi sheries. ICLARM Studies and Reviews No. l.
Pauly, D. and Christensen, V. (1993). Stratifi ed Models of Large Marine
Ecosystems: A General Approach and an Application to the South
China Sea. p 148-174 In: Sherman, K. et al. (eds.) Large Marine
Ecosystems: Stress, Mitigation, and Sustainability. Washington, D.C.:
American Association for the Advancement of Science.
Piyakarnachana, T. (1989). Yield dynamics as an index of biomass shifts
in the Gulf of Thailand. In: Biomass Yields and Geography of Large
Marine Ecosystems. p 95-142 In: Sherman, K. and Alexander, L.M.
(eds.) AAAS Symposium 111, Westview Press, Inc., Boulder, CO.
Rowe, G.T. (1981.) The deep-sea ecosystem. In: Analysis of marine
ecosystems. p 235-267 In. Longhurst A.R. (ed.) Academic Press.
San Diego
Sherman, K. et al. (eds.) (1993). Large Marine Ecosystems: Stress,
Mitigation, and Sustainability (Washington, D.C.: American
Association for the Advancement of Science).
Shindo, S. (1973). General review of the trawl fi shery and the demersal
fi sh stocks of the South China Sea. FAO Fish Tech. Pap. 120. FAO,
Rome.
Silvestre, G. et al. (1989). Towards sustainable development of the
coastal resource of Lingayen Gulf, Philippines. ICLARM Conference
Proceedings 17.
Silvestre, G, et al. (1990). Preliminary trophic model of the coastal fi shery
resources of Brunei Darussalam, South China Sea. ICES CM 1990/L:
41 Sess. Q.
South China Sea Programme (1978). Report of the workshop on
management of resources in the Sunda Shelf, Malacca Strait and
related areas.
South China Seas Fisheries Development and Coordinating Programme.
SCS/GEN/78/18, Manila.
White, A.T. (1989). Two community-based marine reserves: Lessons
for coastal management. p 85-96 In: Chua, T.E. and Pauly, D. (eds.)
Coastal area management in Southeast Asia: Policies, management
strategies and case studies. ICLARM Conference Proceedings 19.
80
GIWA REGIONAL ASSESSMENT 54 SOUTH CHINA SEA
Annex VII
was 1.5 km3 in 1980, rising to 5.3 km3 in 1990. It is expected to reach
Irrigation, water withdrawal,
16.0 km3 in 2000. In 1980, agriculture used 35.0 km3 of water. In 1990,
and drainage development
agricultural water withdrawal was estimated at 47.0 km3, or 86.5%
of the total water demand, of which some 6.5 million m3 were for
livestock. The estimated water demand for agricultural purposes for
(Excerpted from FAO Aquastat 2004)
2000 is 60.5 km3. Approximately 1.46% of Vietnam's water demand is
met by groundwater. The balance comes from surface water sources
China
such as rivers, lakes and reservoirs. Groundwater is mainly used for
Since the founding of the People's Republic of China in 1949, irrigation
domestic water supply in urban areas. With rehabilitation of existing
and drainage have experienced a period of vigorous development.
infrastructures in the Red and Mekong deltas, there is the potential to
From 1958 to 1985, about 64 368 million yuan were spent on irrigation
expand irrigation to some 700 000 ha. The overall irrigation potential
and drainage projects. The irrigated area for farmland increased from
in Vietnam is estimated at 6 million ha. In 1994, the actual irrigation
16 million ha in 1949 to 51 million ha in 1996. After 1949, in order
capacity was just 70% of the three million ha of equipped area. Two-
to promote agricultural production, pump irrigation and drainage
thirds of this area were in the two large deltas (37% in the Red Delta, and
were developed rapidly. The total area equipped for irrigation,
27% in the Mekong Delta). In 1994, about 49% of the cultivated area was
including farmland, orchards and pastures, was 52 943 200 ha in
irrigated. In 1990, there were 5 071 irrigation schemes in operation. The
1996, representing 55% of the total cultivated area. Surface irrigation
drainage system covers over 1 million ha, mostly in the northern and
is the method practised (mainly for rice, wheat, millet, vegetables,
central parts of the country, particularly the Red Delta.
corn and cotton) on about 99% of the total equipped irrigated area.
The remaining 1% is under sprinkler and localised irrigation. The total
Thailand
water withdrawal was 525.5 km│ in 1993, of which 385 km│ for irrigation,
In modern times, canal construction for irrigation started at the
22.66 km│ for rural domestic uses and livestock, 25.17 km│ for urban
beginning of the 20th century. The aim was to maintain water in canals
domestic and public uses, and 92.55 km│ for industrial water use. The
for irrigation and navigation, and to drain paddy fi elds during periods
total water demand for 2000 was estimated at 593 km│, with 7% for
of fl ooding. Irrigation has traditionally been supplementary irrigation
domestic and municipal use, 21% for industry, and 72% for irrigation.
for the wet season. It is only recently that schemes have been designed
In 1995, the total amount of wastewater produced was 37.29 km│, of
for dry season irrigation. The area equipped for wet season irrigation
which 23.33 km│ was treated. The re-used treated volume was 13.39 km│.
was estimated at 5 003 724 ha in 1995. Thailand develops 120 000 ha of
The Ministry of Water Resources estimates the maximum possible
irrigation each year (2% of the equipped area). In 1988, the area actually
area which might be brought under irrigation in the fi rst half of the
irrigated was estimated at 91% of the equipped area. All schemes are
21st century at 64 million ha. Nevertheless, as much of the land proposed
irrigated by surface irrigation: sprinkler and drip irrigation are at an
for irrigation is located in arid and semi-arid zones, a long-term viable
experimental stage only on fruit trees. The irrigation potential for the
strategy has to be formulated as to how to provide additional water
wet season can be roughly estimated at 12 million ha, considering
resources to irrigate these lands.
both soil and water availability but excluding basin transfers. The total
area suitable for irrigation is estimated at 16 million ha. The total water
Vietnam
withdrawal in 1990 was estimated at 33.13 km3, of which 91% was for
Modern irrigation development stagnated until the reunifi cation
agricultural purposes. Domestic and industrial water withdrawals are
of the country in 1975. Early post-1975 growth was in small and
increasing substantially every year.
medium irrigation schemes, while in the period 1985-1990, growth
was concentrated in large irrigation and multipurpose schemes. The
Philippines
total irrigated area expanded at a rate of 2.9%/year in the period 1980-
The major irrigation investment periods have been the 1920s, the
1987, while between 1988 and 1994 it was 4.58%/year. The total annual
post-second world war period and the 1970s and early 1980s when
water withdrawal for agriculture, industries and domestic purposes
public involvement in the irrigation subsector was at its maximum.
was estimated at 54.3 km3 in 1990. The total domestic demand in 1990
In this respect, the creation of the National Irrigation Agency (NIA)
was estimated at 2.0 km3/year for both urban and rural consumers.
in 1964 has been decisive. The irrigation potential was estimated
This volume for domestic water use was estimated at 1.3 km3 in 1980
at 3.1 million ha in 1990. It corresponds to the area where irrigation
and is expected to reach 2.9 km3 by 2000. National industrial demand
facilities can easily be provided by the Department of Agriculture
ANNEXES
81
or the NIA. A World Bank survey has proposed the reassessment of
off as no further expansion in irrigated paddy cultivation is envisaged.
irrigation potential as the fi gure of 3.1 million ha was obtained without
The potential irrigable area is approximately 413 700 ha.
considering new settlement on agricultural lands, water resources
availability, water resources development cost, need of fl ood control
Indonesia
and drainage facilities, etc. In 1992, the area of land equipped for full/
Modern irrigation systems were introduced in the middle of the
partial control irrigation was estimated at 1 532 751 ha. Irrigation water
19th century. In 1969, with the launching of the fi ve year development
is generally supplied by river diversion. The total water withdrawal
plan (Repelita), the Government started a major program in irrigation
was estimated on the basis of the water rights issued by the National
development which included:
Water Resources Board (NWRB) to 55 422 million m3 in 1995, of which
Rehabilitation of existing irrigation works;
88% is for agricultural purposes, 8% for domestic and 4% for industry.
Expansion of service areas in existing schemes;
Other water withdrawal (non-consumptive use of water) included
Construction of new irrigation systems;
hydropower (89 000 million m3), fi sheries (498 million m3) and recreation
Upgrading of semi-technical irrigation systems to technical level;
(93 million m3). Production of wastewater in the national capital region
Introduction of special maintenance to upgrade the physical
and nearby provinces is estimated at 74 million m3, while the volume
infrastructure;
of treated wastewater reached 10 million m3 in 1994 at the Ayala and
Implementation
of
effi
cient operation and maintenance procedures
Dagat-Dagatan pond. Disposal of wastewater is expected to increase
for launching sustainable Operation and Maintenance (O&M)
as new sewer lines are being built every year.
programmes;
A credit programme;
Malaysia
Among
other
initiatives.
Since the formation of the Department of Irrigation and Drainage in
1932, irrigated areas for paddy cultivation have progressively increased.
In the fi rst 25 years of development, spanning fi ve Repelitas (1969-1993),
By 1960, about 200 000 ha had been developed, the emphasis then
water resources policies were directed to support the development of
being on supplementing rainfall for single crop cultivation. During
diff erent sectors with the primary emphasis being on agriculture. The
the 1960s and early 1970s, the introduction of double cropping of rice
success of this development is demonstrated by the country having
cultivation required the development of adequate water resources
achieved food self-suffi
ciency, particularly in rice, since 1984. Another
for the second cropping season. During the 1980s, the priority for
result of Indonesia's development was the reduction of poverty from
irrigation took on a new dimension with the need to rationalise rice
44% of the population (54 million people) in 1969 to 13% (26 million
cultivation and increase its productivity. Malaysia has over 932 irrigation
people) in 1993. Indonesia has now embarked on the second 25-
schemes covering an area of 340 633 ha. In addition, there are 21 967 ha
year development period (1994-2019), with emphasis on sustainable
which are inundation and control drainage schemes (1994 estimates).
development and management of water resources. Water resources
The current irrigation effi
ciency is around 35-45%. In 1994, the total
have now been elevated to a full sector level and policies are directed
drained area was 940 633 ha. About 600 000 ha were drained for oil
to promoting a more eff ective and effi
cient management of water
palm cultivation, using public funding for smallholders. The issues of
resources in an integrated manner. Greater emphasis is placed on
salinity, waterlogging and water-borne diseases are not reported as
sustaining self-suffi
ciency in rice and on the O&M of water resources
being signifi cant. The annual internal renewable water resources are
infrastructure. In addition, the Government is implementing a crash
estimated at 630 km│. As surface water is readily available throughout
programme in Repelita VI to improve 1 million ha of village irrigation
the year, it is abstracted mainly for irrigation and domestic uses. The
systems and to develop a 600 000 ha rice estate by swamp reclamation
groundwater potential is limited to some pockets of the coastal region
in central Kalimantan. In 1990, water withdrawals were 69.24 km│ for
and is generally exploited by rural people to supplement their piped
agriculture, 4.73 km│ for domestic and municipal water supply and
water supply. Surface water represents 97% of the total water use, while
0.38 km│ for industrial use.
groundwater represents 3%. About 60-65% of groundwater utilisation is
for domestic and/or municipal purposes, 5% for irrigation and 30-35%
Cambodia
for industry. The total water demand increased from 8.7 km│ in 1980 to
Modern irrigation systems were fi rst developed in the period 1950-
12.7 km│ in 1995, and was projected to increase to 15.2 km│ by 2000.
1953. Many of the structures built during that period functioned until
Irrigation currently accounts for about 9.7 km│ or about 76% of the total
1975. Most of these structures, such as the `colmatage' canals, have
water consumption. However, irrigation demand is expected to taper
become non-functional as a result of the network of irrigation/drainage
82
GIWA REGIONAL ASSESSMENT 54 SOUTH CHINA SEA
systems built during the period 1975-1979. Since then, most attempts
On average, the Government of Thailand spends 45 USD/ha/year for
to rehabilitate these newer schemes have failed. Irrigation potential has
O&M. In the northeast, 10% of the irrigated land is aff ected by salt
never been estimated in terms of physical area which could be irrigated
(FAO 1999). The salt bearing nature of the soil parent material has been
considering water and land resources. A recent FAO survey indicates
identifi ed as the primary cause for this. Other activities such as irrigation
that a number of areas appear suitable for groundwater exploitation,
could be classed as secondary causes for accelerating this locally. Many
though there are still uncertainties about water quantity and quality.
programmes have been launched in order to correctly manage cash
The lack of data, particularly on water quality, is a cause for concern
crops and paddy on saline soils. Salinisation is now reported to be
as there are reports on iron toxicity from Svay Rieng province, close
aff ecting large areas in the coastal parts of Thailand's central plain.
to the border with Vietnam, as well as increased tidal saline incursion
from the Mekong River in May-June. Water withdrawal was estimated at
In China, most irrigation projects constructed in the 1950s and 1960s
520 million m3 in 1987, of which 94% is used for agricultural purposes.
can no longer be operated eff ectively. The development of sprinkler
irrigation, initiated since the early 1950s, increased until 1980, when large
Brunei
areas were abandoned due to the poor quality of equipment and poor
Urban water supply is entirely from surface water. The major use of water
management. This has resulted in a continuous decline in irrigation
in industrial processes is for the liquefi ed natural gas industry which
benefi ts and has had a direct impact on the stability of agricultural
abstracts and treats its own water from the Sungai Belait River. Other
development and on the economy. In principle, all water users must pay
industrial uses are on a smaller scale for timber/sawmills, dairy farms, soft-
water charges. FAO (1999) report that since 1985, the water charge has
drink manufacture and workshops which account for an estimated 25% of
been calculated on the basis of the cost of the water supply. The water
overall water demand. In 1994, the total water withdrawal was estimated
charge for agriculture is usually lower than that for industry. Where
at 91.59 million m│. Initially, groundwater abstraction was undertaken in
shortages occur, a rational water allocation system is practised and
the 1950s for use by the oil and gas industries. This has been replaced by
dissuasive charges are applied to extra volumes of water. On average,
surface water sources. Groundwater abstraction, which accounts for 0.5%
water charges for irrigation varied between 150 and 300 yuan/ha (17.96
of the total water supply, is currently limited to the local bottled water
and 35.92 USD/ha) in 1995.
industry. All irrigation facilities were equipped in 1980. There are only
minor irrigation schemes (up to 0.9 ha). Irrigated agriculture represents
In Cambodia by comparison, a recent FAO survey has estimated that
1 000 ha, and all irrigation is surface irrigation. The existing infrastructure
the development of 1 ha irrigated by pumping would require an
and facilities are being upgraded in rural areas, but the irrigated area
investment cost of 2 800 USD, and 85 USD/year for operation and
has remained unchanged since 1980. The major irrigated crops are rice,
maintenance (O&M), placing considerable strain on the economy. In
vegetables and fruits. The fi gures for rice show that the country is able to
Indonesia in 1992, the average cost of developing a surface irrigation
meet only 3.6% of the total demand of 27 500 tonnes/year. Lack of labour
scheme was 3 645 USD/ha while the average O&M cost of a surface
is the main constraint on agricultural development in the country.
irrigation system was 8.4 USD/ha/year. In Vietnam, irrigation fees were
fi rst established in 1984 in some provinces (e.g. Vinh Long). The fee
Socio-economic costs
for irrigation and drainage services represents from four to 8% of the
In Thailand, early irrigation systems were designed to operate at full
total crop output.
capacity only in the wet season. The canal capacities and control
regulators are inadequate for the increasing demand for dry season
In the Philippines, under the National Irrigation System (NIS) schemes,
irrigation. Furthermore, irrigation water demand has to compete with
the average cost of irrigation development is estimated at 3 800-
demand from other sectors. This becomes a sensitive issue during the
7 600 USD/ha for new schemes, while the cost for the rehabilitation
dry season. A certain fl ow of water must be maintained for navigation,
of existing schemes varies from 1 000-1 600 USD/ha. On all National
to prevent saltwater intrusion, and to supply water for domestic and
Irrigation System schemes in the Philippines, the fees collected by
industrial purposes in the Bangkok area. In the dry season, water
the National Irrigation Agency should cover the costs for operation,
resources can no longer meet the increasing water demand from all
maintenance and even the investment cost within a reasonable period
sectors, and particularly for the irrigation subsector which needs to
of time to an extent consistent with government policy. However, in
withdraw more and more water because of the development of dry
practice, capital cost recovery is confi ned to the communal sector and
season irrigation (FAO 1999). This water competition has led to poor
the fees collected covered only 80% of O&M expenditure in 1989.
agricultural performance in recent dry seasons.
ANNEXES
83
In Malaysia, water supply is undertaken by government agencies and
through increased production of high value crops; and conserve the
privatised water companies. The coverage for water supply is 99% for
natural resource base, particularly land and water.
urban areas but 77% in the rural areas. Farmers pay nominal irrigation
charges which vary from 3-15 USD/ha/year. It is estimated that fees
For 2010, the main targets are to:
collected from farmers cover only 10-12% of the actual operational
Raise GDP per capita in the rural areas to 1 000 USD;
cost. The Government does not seek full cost recovery because the
Irrigate 80% of all cultivated land;
farming community is considered a low income group. About 32% of
Increase
forested
areas;
the water produced is lost in the distribution system due to several
Raise food production to 40-45 million tonnes.
factors such as pipe leakage, under-metering, and other unaccounted
water losses.
Thailand
A lot of sites for dams have been identifi ed in order to supply more
Trends in water resources management
water to the Chao Phraya River. However, nearly all the suitable sites
China
for large-scale projects have been already exploited. The remaining
The whole country is facing increasing water shortages. The policy of
undeveloped potential sites are either in heavily populated areas
low water fees and free water delivery services practised in irrigation
or in national park reserves. The resettlement of population and
and drainage projects in the past has led to a situation where the
environmental issues are so sensitive that no decision has been taken
funds needed for their regular maintenance and rehabilitation have
concerning such dams, even though detailed design studies have been
not been available. In order to achieve the goals stipulated by the
ready for more than 15 years in some cases. The Kaeng Sua Then and the
Government in the 9th Five Year Plan, irrigation should increase by
Nam Choan projects have been a cause of confl ict between developers
3.3 million ha and grain production capacity should increase by
and conservationists. It seems increasingly clear that there will be less
40-50 million tonnes in the period 1995-2000. To achieve these
scope for the development of such large-scale projects in the future.
objectives, the Government has decided to allocate part of the basic
national construction fund for agriculture to the rehabilitation of the
There is a great need for water in the central region for both irrigation
irrigation works. In 1985, the Government issued a new rule requiring
and urban water supply. Most of the water used in the central region
water charges to be collected according to the cost of water delivery.
comes from the northern region. This follows a set of rules established
At present, water charges are on average between a half to two-thirds
when the main needs were in the central region. In the last few years,
of the water delivery costs. It is expected that cost recovery will be
there has been an increasing demand for water, especially in the
accelerated in the near future, with regional variations to take account
irrigation sector, in the northern region. If the observed trend continues,
of farmers' ability to pay.
and if all projects are implemented, a point will be reached in the near
future where water released from the northern region, after satisfying
Vietnam
requirements there, will not be suffi
cient to meet the irrigation water
Government plans indicate an accelerated growth rate of 4.5-5% for the
demand in the central region. To address this problem, the Government
agriculture sector. Other targets include:
has launched many programmes to both reduce demand and increase
Reducing the number of very poor people by 50%;
the resources available. The ongoing national economic and social
Reducing malnutrition among children to less than 30%;
development stresses the need for a more effi
cient use of water, and in
Providing clean drinking water to all the urban population and 80%
particular the importance of collecting water fees in irrigated agriculture
of the rural population.
to avoid wastage. Agricultural water fees should cover only O&M costs,
while for the other sectors (domestic and industrial) the fees should
About 40% of the investment needed is projected to come from the
also take account of the construction and maintenance costs of water
Government, 15% from state enterprise and the rest from the private
distribution systems. To increase the available resources, inter-basins
sector. The main items in the public investment program are transport
transfer projects are being studied and implemented. One such project
and water supply (33%), and irrigation and agriculture (24%). The
already exists, diverting water from the Mae Klong River to the Chao
Ministry of Agriculture and Rural Development (MARD) has prepared a
Phraya central plain. Other projects, such as diversion of water from the
programme for rural development, which complements and builds on
Mekong, Mae Kok and Mae Ing rivers to the Yom and Nan rivers, are more
the strategy for the agriculture sector. The major objectives are to raise
politically sensitive. Desalination or re-use of treated wastewater have still
incomes and living standards in rural areas; diversify the rural economy
not been envisaged.
84
GIWA REGIONAL ASSESSMENT 54 SOUTH CHINA SEA
Philippines
towards activities which support the continued increase in rice
The majority of the population depends on agriculture for its
production to maintain self-suffi
ciency.
livelihood and irrigation is considered a crucial element in agricultural
Provision of water to meet increasing water supply demands. Rapid
production. With the potential irrigable area of 3.1 million ha,
industrialisation, increasing urbanisation and the need to supply
irrigation development is only at the halfway stage. Self-suffi
ciency
the nation's population with safe drinking water have necessitated
in food has been set as a target by the Government. Agricultural
the development and maintenance of adequate water sources and
development through irrigation, therefore, still remains a priority
supplies of proper quality water in many regions of the country.
on the Government's agenda. The Irrigation Crisis Act (Republic Act
Often, the water needs are at locations far away from good
No. 6978) signed into law in January 1991, mandated the National
quality water sources, so requiring large capital investments for
Irrigation Agency to develop the remaining 1.5 million ha of irrigable
conveyance infrastructures. The water sources are continuously
lands within ten years through the construction of irrigation projects
subjected to water quality degradation due to urban, industrial and
including other related project components. Irrigation, soil and
upper watershed pollution. The DGWRD directs its programming
water management have been set as a priority on the agenda
to develop sources of good quality water and supply to demand
of the Department of Agriculture. The Medium Term Philippine
centres to meet the needs for water supply.
Development Plan (1994-1998) also envisages a fast pace in irrigation
Flood alleviation and river management. Many of Indonesia's
development.
agricultural and urban areas are located in the lowlands. The
majority of rivers fl ood frequently due to the high intensity
Malaysia
rainfall in the watersheds and infl ux of sediment, particularly in
Agriculture will remain the main user of water in the future. However,
lowland areas. In addition, the river morphology and carrying
its importance was projected to decline from approximately 76%
capacities are continuously changing due to sediment problems,
to about 70% of total water consumption by 2000. In the irrigation
large variations in fl ow, and human encroachment. To protect
sector, future eff orts will focus on demand management through
investment and economic activity as well as to ensure the
improved water management rather than on supply management.
availability of surface water resources close to demand centres,
In the water resources sector, there is a need to review the planning
the DGWRD direct its programming to continuously improve
and development of dams. Most of the existing dams were generally
fl ood protection and drainage, through both structural and non-
designed for one single purpose by various government agencies
structural measures, and to manage water bodies such as ponds,
and privatised utility companies. Future dams will be designed with
lakes and reservoirs.
consideration for multipurpose usage through improved coordination
Water resources development, conservation and management.
and the optimisation of resources. There is also an urgent need to
The archipelago nature of the country, variations in rainfall, large
address the issue of water pollution, which could have a serious
fl uctuations in river fl ows and lack of proper storage sites have
economic impact if left unchecked. The Government is studying the
hindered the nation's ability to meet the increasing water demands.
feasibility of setting up a national body to manage the rivers as well
The gradual degradation of upper watersheds, poor groundwater
as the creation of a national water council to improve federal-state
resources, increasing water quality problems in the lower reaches
government cooperation in water resources management.
of the rivers, and the ineffi
cient use of water require a greater focus
on water resources, conservation and prevention. Thus, to ensure
Indonesia
the continued availability of water resources, the DGWRD direct its
The Ministry of Public Works through its Directorate General of Water
programming towards steps to improve water resources availability
Resources Development (DGWRD) identifi ed four main missions in water
through appropriate conservation and management measures.
resources sector programming as part of Repelita VI (1994-1999):
Maintenance of self-suffi
ciency in rice production to achieve long-
The four missions directed by the DGWRD are being implemented
term food security. Although Indonesia achieved self-suffi
ciency in
through a number of major and support programmes. The water
rice production in 1984, demographic growth, land use changes,
resources sector now has two major subsectors:
variations in rainfall, climatic changes, drought, fl ooding, drainage
Water resources development, with three major programmes:
problems in low-lying areas and urbanisation have resulted in rice
- Water
resources
development
and
conservation,
shortages requiring the importing of rice and the building up of
- Supply and management of water,
costly rice buff er stocks. The DGWRD directs its programming
- Management of rivers, lakes and other water resources;
ANNEXES
85
irrigation with, two major programmes:
- Development and management of irrigation networks,
- Development and management of swamp areas.
Cambodia
Under the National Socio-Economic Development Plan, 1996-2000,
water supply and wastewater treatment have been set as priorities
by the Government. As new irrigation scheme development has a low
economic internal rate of return (1-6%), the rehabilitation of existing
schemes has been set as a priority by the Government. Priority is given
to small-scale schemes, as large-scale schemes have serious operation
and maintenance problems. The estimated potential of irrigated
agriculture production is high for small-scale irrigation schemes
with active community participation and in combination with other
agricultural technology packages, especially balanced fertiliser use.
Indeed, soil fertility is a major problem in Cambodia and production
increase with irrigation alone would remain relatively limited. Priorities
include:
The development of well-designed fl ood control devices in
conjunction with irrigation facilities to enable drainage in times of
fl ooding, and irrigation in the dry season;
Construction of several dams, mainly for hydropower purposes.
Brunei
The water demand for 2000 was estimated at 105 million m│, depending
on the growth of the population and expected increase in per capita
consumption as a result of increased urbanisation. Eff orts are being
made to diversify the economy away from a heavy dependence on
oil and gas towards a more independent agriculture sector. The fi rst
of the Government's four major objectives in agriculture is to enhance
domestic production of paddy, vegetables, poultry and livestock. The
Government is trying to stimulate greater interest in agriculture through
the establishment of model farms, and by providing training, advice
and support.
86
GIWA REGIONAL ASSESSMENT 54 SOUTH CHINA SEA
The Global International
Waters Assessment
This report presents the results of the Global International Waters
Adequately managing the world's aquatic resources for the benefi t of
Assessment (GIWA) of the transboundary waters of the South China
all is, for a variety of reasons, a very complex task. The liquid state of
Sea region. This and the subsequent chapter off er a background
the most of the world's water means that, without the construction
that describes the impetus behind the establishment of GIWA, its
of reservoirs, dams and canals it is free to fl ow wherever the laws of
objectives and how the GIWA was implemented.
nature dictate. Water is, therefore, a vector transporting not only a
wide variety of valuable resources but also problems from one area
to another. The effl
uents emanating from environmentally destructive
activities in upstream drainage areas are propagated downstream
The need for a global
and can aff ect other areas considerable distances away. In the case of
international waters
transboundary river basins, such as the Nile, Amazon and Niger, the
assessment
impacts are transported across national borders and can be observed
in the numerous countries situated within their catchments. In the case
of large oceanic currents, the impacts can even be propagated between
Globally, people are becoming increasingly aware of the degradation of
continents (AMAP 1998). Therefore, the inextricable linkages within
the world's water bodies. Disasters from fl oods and droughts, frequently
and between both freshwater and marine environments dictates that
reported in the media, are considered to be linked with ongoing global
management of aquatic resources ought to be implemented through
climate change (IPCC 2001), accidents involving large ships pollute public
a drainage basin approach.
beaches and threaten marine life and almost every commercial fi sh stock
is exploited beyond sustainable limits - it is estimated that the global
In addition, there is growing appreciation of the incongruence
stocks of large predatory fi sh have declined to less that 10% of pre-
between the transboundary nature of many aquatic resources and the
industrial fi shing levels (Myers & Worm 2003). Further, more than 1 billion
traditional introspective nationally focused approaches to managing
people worldwide lack access to safe drinking water and 2 billion people
those resources. Water, unlike laws and management plans, does not
lack proper sanitation which causes approximately 4 billion cases of
respect national borders and, as a consequence, if future management
diarrhoea each year and results in the death of 2.2 million people, mostly
of water and aquatic resources is to be successful, then a shift in focus
children younger than fi ve (WHO-UNICEF 2002). Moreover, freshwater
towards international cooperation and intergovernmental agreements
and marine habitats are destroyed by infrastructure developments,
is required (UN 1972). Furthermore, the complexity of managing the
dams, roads, ports and human settlements (Brinson & Malvßrez 2002,
world's water resources is exacerbated by the dependence of a great
Kennish 2002). As a consequence, there is growing public concern
variety of domestic and industrial activities on those resources. As a
regarding the declining quality and quantity of the world's aquatic
consequence, cross-sectoral multidisciplinary approaches that integrate
resources because of human activities, which has resulted in mounting
environmental, socio-economic and development aspects into
pressure on governments and decision makers to institute new and
management must be adopted. Unfortunately however, the scientifi c
innovative policies to manage those resources in a sustainable way
information or capacity within each discipline is often not available or
ensuring their availability for future generations.
is inadequately translated for use by managers, decision makers and
GLOBAL INTERNATIONAL WATERS ASSESSMENT
i
policy developers. These inadequacies constitute a serious impediment
The Global Environment Facility (GEF)
to the implementation of urgently needed innovative policies.
The Global Environment Facility forges international co-operation and fi nances actions to address
six critical threats to the global environment: biodiversity loss, climate change, degradation of
international waters, ozone depletion, land degradation, and persistent organic pollutants (POPs).
Continual assessment of the prevailing and future threats to aquatic
The overall strategic thrust of GEF-funded international waters activities is to meet the incremental
ecosystems and their implications for human populations is essential if
costs of: (a) assisting groups of countries to better understand the environmental concerns of
their international waters and work collaboratively to address them; (b) building the capacity
governments and decision makers are going to be able to make strategic
of existing institutions to utilise a more comprehensive approach for addressing transboundary
policy and management decisions that promote the sustainable use of
water-related environmental concerns; and (c) implementing measures that address the priority
transboundary environmental concerns. The goal is to assist countries to utilise the full range of
those resources and respond to the growing concerns of the general
technical, economic, fi nancial, regulatory, and institutional measures needed to operationalise
public. Although many assessments of aquatic resources are being
sustainable development strategies for international waters.
conducted by local, national, regional and international bodies, past
United Nations Environment Programme (UNEP)
assessments have often concentrated on specifi c themes, such as
United Nations Environment Programme, established in 1972, is the voice for the environment
biodiversity or persistent toxic substances, or have focused only on
within the United Nations system. The mission of UNEP is to provide leadership and encourage
partnership in caring for the environment by inspiring, informing, and enabling nations and
marine or freshwaters. A globally coherent, drainage basin based
peoples to improve their quality of life without compromising that of future generations.
assessment that embraces the inextricable links between transboundary
UNEP work encompasses:
freshwater and marine systems, and between environmental and
Assessing global, regional and national environmental conditions and trends;
Developing international and national environmental instruments;
societal issues, has never been conducted previously.
Strengthening institutions for the wise management of the environment;
Facilitating the transfer of knowledge and technology for sustainable development;
Encouraging new partnerships and mind-sets within civil society and the private sector.
International call for action
University of Kalmar
University of Kalmar hosts the GIWA Co-ordination Offi ce and provides scientifi c advice and
administrative and technical assistance to GIWA. University of Kalmar is situated on the coast of
The need for a holistic assessment of transboundary waters in order to
the Baltic Sea. The city has a long tradition of higher education; teachers and marine offi cers have
been educated in Kalmar since the middle of the 19th century. Today, natural science is a priority
respond to growing public concerns and provide advice to governments
area which gives Kalmar a unique educational and research profi le compared with other smaller
universities in Sweden. Of particular relevance for GIWA is the established research in aquatic and
and decision makers regarding the management of aquatic resources
environmental science. Issues linked to the concept of sustainable development are implemented
was recognised by several international bodies focusing on the global
by the research programme Natural Resources Management and Agenda 21 Research School.
environment. In particular, the Global Environment Facility (GEF)
Since its establishment GIWA has grown to become an integral part of University activities.
The GIWA Co-ordination offi ce and GIWA Core team are located at the Kalmarsund Laboratory, the
observed that the International Waters (IW) component of the GEF
university centre for water-related research. Senior scientists appointed by the University are actively
suff ered from the lack of a global assessment which made it diffi
cult
involved in the GIWA peer-review and steering groups. As a result of the cooperation the University
can offer courses and seminars related to GIWA objectives and international water issues.
to prioritise international water projects, particularly considering
the inadequate understanding of the nature and root causes of
environmental problems. In 1996, at its fourth meeting in Nairobi, the
causes of degradation of the transboundary aquatic environment and
GEF Scientifi c and Technical Advisory Panel (STAP), noted that: "Lack of
options for addressing them. These pro cesses led to the development
an International Waters Assessment comparable with that of the IPCC, the
of the Global International Waters Assessment (GIWA) that would be
Global Biodiversity Assessment, and the Stratospheric Ozone Assessment,
implemented by the United Nations Environment Programme (UNEP) in
was a unique and serious impediment to the implementation of the
conjunction with the University of Kalmar, Sweden, on behalf of the GEF.
International Waters Component of the GEF".
The GIWA was inaugurated in Kalmar in October 1999 by the Executive
Director of UNEP, Dr. Klaus T÷pfer, and the late Swedish Minister of the
The urgent need for an assessment of the causes of environmental
Environment, Kjell Larsson. On this occasion Dr. T÷pfer stated: "GIWA
degradation was also highlighted at the UN Special Session on
is the framework of UNEP┤s global water assessment strategy and will
the Environment (UNGASS) in 1997, where commitments were
enable us to record and report on critical water resources for the planet for
made regarding the work of the UN Commission on Sustainable
consideration of sustainable development management practices as part of
Development (UNCSD) on freshwater in 1998 and seas in 1999. Also in
our responsibilities under Agenda 21 agreements of the Rio conference".
1997, two international Declarations, the Potomac Declaration: Towards
enhanced ocean security into the third millennium, and the Stockholm
The importance of the GIWA has been further underpinned by the UN
Statement on inter action of land activities, freshwater and enclosed
Millennium Development Goals adopted by the UN General Assembly
seas, specifi cally emphasised the need for an investigation of the root
in 2000 and the Declaration from the World Summit on Sustainable
ii
REGIONAL ASSESSMENTS
Development in 2002. The development goals aimed to halve the
International waters and transboundary issues
proportion of people without access to safe drinking water and basic
The term "international waters", as used for the purposes of the GEF Operational Strategy,
sanitation by the year 2015 (United Nations Millennium Declaration
includes the oceans, large marine ecosystems, enclosed or semi-enclosed seas and estuaries, as
well as rivers, lakes, groundwater systems, and wetlands with transboundary drainage basins
2000). The WSSD also calls for integrated management of land, water and
or common borders. The water-related ecosystems associated with these waters are considered
living resources (WSSD 2002) and, by 2010, the Reykjavik Declaration on
integral parts of the systems.
The term "transboundary issues" is used to describe the threats to the aquatic environment
Responsible Fisheries in the Marine Ecosystem should be implemented
linked to globalisation, international trade, demographic changes and technological advancement,
by all countries that are party to the declaration (FAO 2001).
threats that are additional to those created through transboundary movement of water. Single
country policies and actions are inadequate in order to cope with these challenges and this makes
them transboundary in nature.
The international waters area includes numerous international conventions, treaties, and
agreements. The architecture of marine agreements is especially complex, and a large number
The conceptual framework
of bilateral and multilateral agreements exist for transboundary freshwater basins. Related
conventions and agreements in other areas increase the complexity. These initiatives provide
and objectives
a new opportunity for cooperating nations to link many different programmes and instruments
into regional comprehensive approaches to address international waters.
Considering the general decline in the condition of the world's aquatic
the large-scale deforestation of mangroves for ponds (Primavera 1997).
resources and the internationally recognised need for a globally
Within the GIWA, these "non-hydrological" factors constitute as large
coherent assessment of transboundary waters, the primary objectives
a transboundary infl uence as more traditionally recognised problems,
of the GIWA are:
such as the construction of dams that regulate the fl ow of water into
To provide a prioritising mechanism that allows the GEF to focus
a neighbouring country, and are considered equally important. In
their resources so that they are used in the most cost eff ective
addition, the GIWA recognises the importance of hydrological units that
manner to achieve signifi cant environmental benefi ts, at national,
would not normally be considered transboundary but exert a signifi cant
regional and global levels; and
infl uence on transboundary waters, such as the Yangtze River in China
To highlight areas in which governments can develop and
which discharges into the East China Sea (Daoji & Daler 2004) and the
implement strategic policies to reduce environmental degradation
Volga River in Russia which is largely responsible for the condition of
and improve the management of aquatic resources.
the Caspian Sea (Barannik et al. 2004). Furthermore, the GIWA is a truly
regional assessment that has incorporated data from a wide range of
In order to meet these objectives and address some of the current
sources and included expert knowledge and information from a wide
inadequacies in international aquatic resources management, the GIWA
range of sectors and from each country in the region. Therefore, the
has incorporated four essential elements into its design:
transboundary concept adopted by the GIWA extends to include
A broad transboundary approach that generates a truly regional
impacts caused by globalisation, international trade, demographic
perspective through the incorporation of expertise and existing
changes and technological advances and recognises the need for
information from all nations in the region and the assessment of
international cooperation to address them.
all factors that infl uence the aquatic resources of the region;
A drainage basin approach integrating freshwater and marine
systems;
A multidisciplinary approach integrating environmental and socio-
The organisational structure and
economic information and expertise; and
implementation of the GIWA
A coherent assessment that enables global comparison of the
results.
The scale of the assessment
Initially, the scope of the GIWA was confi ned to transboundary waters
The GIWA builds on previous assessments implemented within the GEF
in areas that included countries eligible to receive funds from the GEF.
International Waters portfolio but has developed and adopted a broader
However, it was recognised that a truly global perspective would only
defi nition of transboundary waters to include factors that infl uence the
be achieved if industrialised, GEF-ineligible regions of the world were
quality and quantity of global aquatic resources. For example, due to
also assessed. Financial resources to assess the GEF-eligible countries
globalisation and international trade, the market for penaeid shrimps
were obtained primarily from the GEF (68%), the Swedish International
has widened and the prices soared. This, in turn, has encouraged
Development Cooperation Agency (Sida) (18%), and the Finnish
entrepreneurs in South East Asia to expand aquaculture resulting in
Department for International Development Cooperation (FINNIDA)
GLOBAL INTERNATIONAL WATERS ASSESSMENT
iii
1
15
11
16
14
12
28
10
13
17
25
29
9
18
30
19
23
22
8
7
31
6
20
24
26
35
33
2
34
27
5
21
50
32
51
36
37
41
52
4
49
53
43
65
55
48
54
3
42
56
46
62
47
40b
40a
57
62
45b
39
59
45a
58
60
64
44
61
38
63
66
1 Arctic
12
Norwegian Sea (LME)
24 Aral
Sea
36 East-China
Sea
(LME)
46
Somali Coastal Current (LME)
58 North
Australian
Shelf
(LME)
2
Gulf of Mexico (LME)
13 Faroe
plateau
25
Gulf of Alaska (LME)
37
Hawaiian Archipelago (LME)
47
East African Rift Valley Lakes
59 Coral
Sea
Basin
3
Caribbean Sea (LME)
14
Iceland Shelf (LME)
26
California Current (LME)
38
Patagonian Shelf (LME)
48
Gulf of Aden
60 Great
Barrier
Reef
(LME)
4 Caribbean
Islands
15
East Greenland Shelf (LME)
27
Gulf of California (LME)
39
Brazil Current (LME)
49
Red Sea (LME)
61 Great
Australian
Bight
5
Southeast Shelf (LME)
16
West Greenland Shelf (LME)
28
East Bering Sea (LME)
40a Brazilian
Northeast
(LME)
50 The
Gulf
62
Small Island States
6
Northeast Shelf (LME)
17
Baltic Sea (LME)
29
West Bering Sea (LME)
40b Amazon
51 Jordan
63 Tasman
Sea
7
Scotian Shelf (LME)
18 North
Sea
(LME)
30
Sea of Okhotsk (LME)
41
Canary Current (LME)
52
Arabian Sea (LME)
64 Humboldt
Current
(LME)
8
Gulf of St Lawrence
19
Celtic-Biscay Shelf (LME)
31
Oyashio Current (LME)
42
Guinea Current (LME)
53
Bay of Bengal S.E.
65 Eastern
Equatorial
Pacific
9
Newfoundland Shelf (LME)
20 Iberian
Coastal
(LME)
32 Kuroshio
Current
(LME)
43 Lake
Chad
54 South
China
Sea
(LME)
66 Antarctic
(LME)
10
Baffin Bay, Labrador Sea,
21 Mediterranean
Sea
(LME)
33
Sea of Japan/East Sea (LME)
44 Benguela
Current
(LME)
55 Mekong
River
Canadian Archipelago
22 Black
Sea
(LME)
34
Yellow Sea (LME)
45a Agulhas Current (LME)
56
Sulu-Celebes Sea (LME)
11
Barents Sea (LME)
23 Caspian
Sea
35 Bohai
Sea
45b Indian Ocean Islands
57 Indonesian
Seas
(LME)
Figure 1
The 66 transboundary regions assessed within the GIWA project.
(10%). Other contributions were made by Kalmar Municipality, the
Considering the objectives of the GIWA and the elements incorporated
University of Kalmar and the Norwegian Government. The assessment of
into its design, a new methodology for the implementation of the
regions ineligible for GEF funds was conducted by various international
assessment was developed during the initial phase of the project. The
and national organisations as in-kind contributions to the GIWA.
methodology focuses on fi ve major environmental concerns which
constitute the foundation of the GIWA assessment; Freshwater shortage,
In order to be consistent with the transboundary nature of many of the
Pollution, Habitat and community modifi cation, Overexploitation of fi sh
world's aquatic resources and the focus of the GIWA, the geographical
and other living resources, and Global change. The GIWA methodology
units being assessed have been designed according to the watersheds
is outlined in the following chapter.
of discrete hydrographic systems rather than political borders (Figure 1).
The geographic units of the assessment were determined during the
The global network
preparatory phase of the project and resulted in the division of the
In each of the 66 regions, the assessment is conducted by a team of
world into 66 regions defi ned by the entire area of one or more
local experts that is headed by a Focal Point (Figure 2). The Focal Point
catchments areas that drains into a single designated marine system.
can be an individual, institution or organisation that has been selected
These marine systems often correspond to Large Marine Ecosystems
on the basis of their scientifi c reputation and experience implementing
(LMEs) (Sherman 1994, IOC 2002).
international assessment projects. The Focal Point is responsible
for assembling members of the team and ensuring that it has the
Large Marine Ecocsystems (LMEs)
necessary expertise and experience in a variety of environmental
Large Marine Ecosystems (LMEs) are regions of ocean space encompassing coastal areas from river
and socio-economic disciplines to successfully conduct the regional
basins and estuaries to the seaward boundaries of continental shelves and the outer margin of the
major current systems. They are relatively large regions on the order of 200 000 km2 or greater,
assessment. The selection of team members is one of the most critical
characterised by distinct: (1) bathymetry, (2) hydrography, (3) productivity, and (4) trophically
elements for the success of GIWA and, in order to ensure that the
dependent populations.
most relevant information is incorporated into the assessment, team
The Large Marine Ecosystems strategy is a global effort for the assessment and management
of international coastal waters. It developed in direct response to a declaration at the 1992
members were selected from a wide variety of institutions such as
Rio Summit. As part of the strategy, the World Conservation Union (IUCN) and National Oceanic
and Atmospheric Administration (NOAA) have joined in an action program to assist developing
universities, research institutes, government agencies, and the private
countries in planning and implementing an ecosystem-based strategy that is focused on LMEs as
sector. In addition, in order to ensure that the assessment produces a
the principal assessment and management units for coastal ocean resources. The LME concept is
also adopted by GEF that recommends the use of LMEs and their contributing freshwater basins
truly regional perspective, the teams should include representatives
as the geographic area for integrating changes in sectoral economic activities.
from each country that shares the region.
iv
REGIONAL ASSESSMENTS
The GIWA is comprised of a logical sequence of four integrated
components. The fi rst stage of the GIWA is called Scaling and is a
Steering Group
process by which the geographic area examined in the assessment is
defi ned and all the transboundary waters within that area are identifi ed.
GIWA Partners
IGOs, NGOs,
Core
Thematic
Once the geographic scale of the assessment has been defi ned, the
Scientific institutions,
Team
Task Teams
private sector, etc
assessment teams conduct a process known as Scoping in which the
66 Regional
magnitude of environmental and associated socio-economic impacts
Focal Points
of Freshwater shortage, Pollution, Habitat and community modifi cation,
and Teams
Unsustainable exploitation of fi sh and other living resources, and Global
Figure 2
The organisation of the GIWA project.
change is assessed in order to identify and prioritise the concerns
that require the most urgent intervention. The assessment of these
predefi ned concerns incorporates the best available information and
In total, more than 1 000 experts have contributed to the implementation
the knowledge and experience of the multidisciplinary, multi-national
of the GIWA illustrating that the GIWA is a participatory exercise that
assessment teams formed in each region. Once the priority concerns
relies on regional expertise. This participatory approach is essential
have been identifi ed, the root causes of these concerns are identifi ed
because it instils a sense of local ownership of the project, which
during the third component of the GIWA, Causal chain analysis. The root
ensures the credibility of the fi ndings and moreover, it has created a
causes are determined through a sequential process that identifi es, in
global network of experts and institutions that can collaborate and
turn, the most signifi cant immediate causes followed by the economic
exchange experiences and expertise to help mitigate the continued
sectors that are primarily responsible for the immediate causes and
degradation of the world's aquatic resources.
fi nally, the societal root causes. At each stage in the Causal chain
analysis, the most signifi cant contributors are identifi ed through an
analysis of the best available information which is augmented by the
expertise of the assessment team. The fi nal component of the GIWA is
GIWA Regional reports
the development of Policy options that focus on mitigating the impacts
of the root causes identifi ed by the Causal chain analysis.
The GIWA was established in response to growing concern among the
general public regarding the quality of the world's aquatic resources
The results of the GIWA assessment in each region are reported in
and the recognition of governments and the international community
regional reports that are published by UNEP. These reports are designed
concerning the absence of a globally coherent international waters
to provide a brief physical and socio-economic description of the
assessment. However, because a holistic, region-by-region, assessment
most important features of the region against which the results of the
of the condition of the world's transboundary water resources had never
assessment can be cast. The remaining sections of the report present
been undertaken, a methodology guiding the implementation of such
the results of each stage of the assessment in an easily digestible form.
an assessment did not exist. Therefore, in order to implement the GIWA,
Each regional report is reviewed by at least two independent external
a new methodology that adopted a multidisciplinary, multi-sectoral,
reviewers in order to ensure the scientifi c validity and applicability of
multi-national approach was developed and is now available for the
each report. The 66 regional assessments of the GIWA will serve UNEP
implementation of future international assessments of aquatic resources.
as an essential complement to the UNEP Water Policy and Strategy and
UNEP's activities in the hydrosphere.
UNEP Water Policy and Strategy
The primary goals of the UNEP water policy and strategy are:
(a) Achieving greater global understanding of freshwater, coastal and marine environments by
Global International Waters Assessment
conducting environmental assessments in priority areas;
(b) Raising awareness of the importance and consequences of unsustainable water use;
(c) Supporting the efforts of Governments in the preparation and implementation of integrated
management of freshwater systems and their related coastal and marine environments;
(d) Providing support for the preparation of integrated management plans and programmes for
aquatic environmental hot spots, based on the assessment results;
(e) Promoting the application by stakeholders of precautionary, preventive and anticipatory
approaches.
GLOBAL INTERNATIONAL WATERS ASSESSMENT
v
References:
AMAP (1998). Assessment Report: Arctic Pollution Issues. Arctic
Monitoring and Assessment Programme (AMAP), Oslo, Norway.
Barannik, V., Borysova, O. and Stolberg, F. (2004). The Caspian Sea Region:
Environmental Change. Ambio, 33:45-51.
Brinson, M.M. and Malvßrez, A.I. (2002). Temperate freshwater wetlands:
types, status, and threats. Environmental Conservation, 29:115-133.
Daoji, L. and Daler, D. (2004). Ocean Pollution from Land-based Sources:
East China Sea, China. Ambio, 33:98-106.
FAO (2001). Reykjavik conference on responsible fi sheries in the marine
ecosystem. Iceland, 1-4 October 2001.
IOC (2002). IOC-IUCN-NOAA Consultative Meeting on Large Marine
Ecosystems (LMEs). Fourth Session, 8-9 January 2002, Paris,
France.
IPCC (2001). Climate Change 2001: The Scientifi c Basis. Contribution
of Working Group I to the Third Assessment Report of the
Intergovernmental Panel on Climate Change. In: Houghton,
J.T., Ding, Y., Griggs, D.J., Noguer, M., van der Linden, P.J., Dai, X.,
Maskell, K. and Johnson, C.A. (eds). Cambridge University Press,
Cambridge, United Kingdom and New York, NY, USA.
Kennish, M.J. (2002). Environmental threats and environmental future of
estuaries. Environmental Conservation, 29:78-107.
Myers, R.A. and Worm, B. (2003). Rapid worldwide depletion of predatory
fi sh communities. Nature, 423:280-283.
Primavera, J.H. (1997) Socio-economic impacts of shrimp culture.
Aquaculture Research, 28:815-827.
Sherman, K. (1994). Sustainability, biomass yields, and health of coastal
ecosystems: an ecological perspective. Marine Ecology Progress
Series, 112:277-301.
United Nations conference on the human environment (1972). Report
available on-line at http://www.unep.org
United Nations Millennium Declaration (2000). The Millennium
Assembly of the United Nations, New York.
WHO-UNICEF (2002). Global Water Supply and Sanitation Assessment:
2000 Report.
WSSD (2002). World Summit on Sustainable Development.
Johannesburg Summit 2002. Key Outcomes of the Summit,
UN Department of Public Information, New York.
vi
REGIONAL ASSESSMENTS
The GIWA methodology
The specifi c objectives of the GIWA were to conduct a holistic and globally
The assessment integrates environmental and socio-economic data
comparable assessment of the world's transboundary aquatic resources
from each country in the region to determine the severity of the
that incorporated both environmental and socio-economic factors
impacts of each of the fi ve concerns and their constituent issues on
and recognised the inextricable links between freshwater and marine
the entire region. The integration of this information was facilitated by
environments, in order to enable the GEF to focus their resources and to
implementing the assessment during two participatory workshops
provide guidance and advice to governments and decision makers. The
that typically involved 10 to 15 environmental and socio-economic
coalition of all these elements into a single coherent methodology that
experts from each country in the region. During these workshops, the
produces an assessment that achieves each of these objectives had not
regional teams performed preliminary analyses based on the collective
previously been done and posed a signifi cant challenge.
knowledge and experience of these local experts. The results of these
analyses were substantiated with the best available information to be
The integration of each of these elements into the GIWA methodology
presented in a regional report.
was achieved through an iterative process guided by a specially
Table 1 Pre-defi ned GIWA concerns and their constituent issues
convened Methods task team that was comprised of a number of
addressed within the assessment.
international assessment and water experts. Before the fi nal version
of the methodology was adopted, preliminary versions underwent
Environmental issues
Major concerns
an extensive external peer review and were subjected to preliminary
1. Modification of stream flow
testing in selected regions. Advice obtained from the Methods task
2. Pollution of existing supplies
I Freshwater shortage
3. Changes in the water table
team and other international experts and the lessons learnt from
preliminary testing were incorporated into the fi nal version that was
4. Microbiological
5. Eutrophication
used to conduct each of the GIWA regional assessments.
6. Chemical
7. Suspended
solids
II Pollution
8. Solid
wastes
Considering the enormous diff erences between regions in terms of the
9. Thermal
10. Radionuclide
quality, quantity and availability of data, socio-economic setting and
11. Spills
environmental conditions, the achievement of global comparability
12. Loss of ecosystems
required an innovative approach. This was facilitated by focusing
III Habitat and community
13. Modification of ecosystems or ecotones, including community
modification
structure and/or species composition
the assessment on the impacts of fi ve pre-defi ned concerns namely;
Freshwater shortage, Pollution, Habitat and community modifi cation,
14. Overexploitation
15. Excessive by-catch and discards
IV Unsustainable
Unsustainable exploitation of fi sh and other living resources and Global
16. Destructive fishing practices
exploitation of fish and
change, in transboundary waters. Considering the diverse range of
17. Decreased viability of stock through pollution and disease
other living resources
18. Impact on biological and genetic diversity
elements encompassed by each concern, assessing the magnitude of
19. Changes in hydrological cycle
the impacts caused by these concerns was facilitated by evaluating the
20. Sea level change
V Global change
impacts of 22 specifi c issues that were grouped within these concerns
21. Increased uv-b radiation as a result of ozone depletion
22. Changes in ocean CO source/sink function
(see Table 1).
2
THE GIWA METHODOLOGY
vii

political boundaries but were instead, generally defi ned by a large but
T
r
ansboundar
The GIWA approach
discrete drainage basin that also included the coastal marine waters into
which the basin discharges. In many cases, the marine areas examined
1
Scaling
st
W
orkshop
Detailed
during the assessment coincided with the Large Marine Ecosystems
y
D
(LMEs) defi ned by the US National Atmospheric and Oceanographic
iagnostic
A
ssessment
Scoping
Administration (NOAA). As a consequence, scaling should be a
relatively straight-forward task that involves the inspection of the
Analy
boundaries that were proposed for the region during the preparatory
Causal Chain
2
sis
nd
Analysis
phase of GIWA to ensure that they are appropriate and that there are
W
orkshop
no important overlaps or gaps with neighbouring regions. When the
Policy Option
proposed boundaries were found to be inadequate, the boundaries of
Analysis
the region were revised according to the recommendations of experts
from both within the region and from adjacent regions so as to ensure
that any changes did not result in the exclusion of areas from the GIWA.
Once the regional boundary was defi ned, regional teams identifi ed all
SAP
the transboundary elements of the aquatic environment within the
SAP
region and determined if these elements could be assessed as a single
Figure 1
Illustration of the relationship between the GIWA
coherent aquatic system or if there were two or more independent
approach and other projects implemented within the
systems that should be assessed separately.
GEF International Waters (IW) portfolio.
The GIWA is a logical contiguous process that defi nes the geographic
Scoping ş Assessing the GIWA concerns
region to be assessed, identifi es and prioritises particularly problems
Scoping is an assessment of the severity of environmental and socio-
based on the magnitude of their impacts on the environment and
economic impacts caused by each of the fi ve pre-defi ned GIWA concerns
human societies in the region, determines the root causes of those
and their constituent issues (Table 1). It is not designed to provide an
problems and, fi nally, assesses various policy options that addresses
exhaustive review of water-related problems that exist within each region,
those root causes in order to reverse negative trends in the condition
but rather it is a mechanism to identify the most urgent problems in the
of the aquatic environment. These four steps, referred to as Scaling,
region and prioritise those for remedial actions. The priorities determined
Scoping, Causal chain analysis and Policy options analysis, are
by Scoping are therefore one of the main outputs of the GIWA project.
summarised below and are described in their entirety in two volumes:
GIWA Methodology Stage 1: Scaling and Scoping; and GIWA Methodology:
Focusing the assessment on pre-defi ned concerns and issues ensured
Detailed Assessment, Causal Chain Analysis and Policy Options Analysis.
the comparability of the results between diff erent regions. In addition, to
Generally, the components of the GIWA methodology are aligned
ensure the long-term applicability of the options that are developed to
with the framework adopted by the GEF for Transboundary Diagnostic
mitigate these problems, Scoping not only assesses the current impacts
Analyses (TDAs) and Strategic Action Programmes (SAPs) (Figure 1) and
of these concerns and issues but also the probable future impacts
assume a broad spectrum of transboundary infl uences in addition to
according to the "most likely scenario" which considered demographic,
those associated with the physical movement of water across national
economic, technological and other relevant changes that will potentially
borders.
infl uence the aquatic environment within the region by 2020.
Scaling ş Defining the geographic extent
The magnitude of the impacts caused by each issue on the
of the region
environment and socio-economic indicators was assessed over the
Scaling is the fi rst stage of the assessment and is the process by which
entire region using the best available information from a wide range of
the geographic scale of the assessment is defi ned. In order to facilitate
sources and the knowledge and experience of the each of the experts
the implementation of the GIWA, the globe was divided during the
comprising the regional team. In order to enhance the comparability
design phase of the project into 66 contiguous regions. Considering the
of the assessment between diff erent regions and remove biases
transboundary nature of many aquatic resources and the transboundary
in the assessment caused by diff erent perceptions of and ways to
focus of the GIWA, the boundaries of the regions did not comply with
communicate the severity of impacts caused by particular issues, the
viii
REGIONAL ASSESSMENTS
results were distilled and reported as standardised scores according to
Table 2
Example of environmental impact assessment of
Freshwater shortage.
the following four point scale:
Weight
0 = no known impact
Environmental
Environmental issues
Score
Weight %
averaged
concerns
1 = slight impact
score
2
=
moderate
impact
1. Modification of stream flow
1
20
Freshwater shortage
1.50
3 = severe impact
2. Pollution of existing supplies
2
50
The attributes of each score for each issue were described by a detailed
3. Changes in the water table
1
30
set of pre-defi ned criteria that were used to guide experts in reporting
Table 3
Example of Health impacts assessment linked to one of
the results of the assessment. For example, the criterion for assigning
the GIWA concerns.
a score of 3 to the issue Loss of ecosystems or ecotones is: "Permanent
Criteria for Health impacts
Raw score
Score
Weight %
destruction of at least one habitat is occurring such as to have reduced their
Very small
Very large
surface area by >30% during the last 2-3 decades". The full list of criteria is
Number of people affected
2
50
0 1 2 3
presented at the end of the chapter, Table 5a-e. Although the scoring
Minimum
Severe
Degree of severity
2
30
0 1 2 3
inevitably includes an arbitrary component, the use of predefi ned
Occasion/Short
Continuous
Frequency/Duration
2
20
0 1 2 3
criteria facilitates comparison of impacts on a global scale and also
Weight average score for Health impacts
2
encouraged consensus of opinion among experts.
The trade-off associated with assessing the impacts of each concern
After all 22 issues and associated socio-economic impacts have
and their constituent issues at the scale of the entire region is that spatial
been scored, weighted and averaged, the magnitude of likely future
resolution was sometimes low. Although the assessment provides a
changes in the environmental and socio-economic impacts of each
score indicating the severity of impacts of a particular issue or concern
of the fi ve concerns on the entire region is assessed according to the
on the entire region, it does not mean that the entire region suff ers
most likely scenario which describes the demographic, economic,
the impacts of that problem. For example, eutrophication could be
technological and other relevant changes that might infl uence the
identifi ed as a severe problem in a region, but this does not imply that all
aquatic environment within the region by 2020.
waters in the region suff er from severe eutrophication. It simply means
that when the degree of eutrophication, the size of the area aff ected,
In order to prioritise among GIWA concerns within the region and
the socio-economic impacts and the number of people aff ected is
identify those that will be subjected to causal chain and policy options
considered, the magnitude of the overall impacts meets the criteria
analysis in the subsequent stages of the GIWA, the present and future
defi ning a severe problem and that a regional action should be initiated
scores of the environmental and socio-economic impacts of each
in order to mitigate the impacts of the problem.
concern are tabulated and an overall score calculated. In the example
presented in Table 4, the scoping assessment indicated that concern III,
When each issue has been scored, it was weighted according to the relative
Habitat and community modifi cation, was the priority concern in this
contribution it made to the overall environmental impacts of the concern
region. The outcome of this mathematic process was reconciled against
and a weighted average score for each of the fi ve concerns was calculated
the knowledge of experts and the best available information in order
(Table 2). Of course, if each issue was deemed to make equal contributions,
to ensure the validity of the conclusion.
then the score describing the overall impacts of the concern was simply the
arithmetic mean of the scores allocated to each issue within the concern.
In some cases however, this process and the subsequent participatory
In addition, the socio-economic impacts of each of the fi ve major
discussion did not yield consensus among the regional experts
concerns were assessed for the entire region. The socio-economic
regarding the ranking of priorities. As a consequence, further analysis
impacts were grouped into three categories; Economic impacts,
was required. In such cases, expert teams continued by assessing the
Health impacts and Other social and community impacts (Table 3). For
relative importance of present and potential future impacts and assign
each category, an evaluation of the size, degree and frequency of the
weights to each. Afterwards, the teams assign weights indicating the
impact was performed and, once completed, a weighted average score
relative contribution made by environmental and socio-economic
describing the overall socio-economic impacts of each concern was
factors to the overall impacts of the concern. The weighted average
calculated in the same manner as the overall environmental score.
score for each concern is then recalculated taking into account
THE GIWA METHODOLOGY
ix
Table 4
Example of comparative environmental and socio-economic impacts of each major concern, presently and likely in year 2020.
Types of impacts
Environmental score
Economic score
Human health score
Social and community score
Concern
Overall score
Present (a)
Future (b)
Present (c)
Future (d)
Present (e)
Future (f)
Present (g)
Future (h)
Freshwater shortage
1.3
2.3
2.7
2.8
2.6
3.0
1.8
2.2
2.3
Pollution
1.5
2.0
2.0
2.3
1.8
2.3
2.0
2.3
2.0
Habitat and community
2.0
3.0
2.4
3.0
2.4
2.8
2.3
2.7
2.6
modification
Unsustainable exploitation of fish
1.8
2.2
2.0
2.1
2.0
2.1
2.4
2.5
2.1
and other living resources
Global change
0.8
1.0
1.5
1.7
1.5
1.5
1.0
1.0
1.2
the relative contributions of both present and future impacts and
should be regarded as a framework to guide the analysis, rather than
environmental and socio-economic factors. The outcome of these
as a set of detailed instructions. Secondly, in an ideal setting, a causal
additional analyses was subjected to further discussion to identify
chain would be produced by a multidisciplinary group of specialists
overall priorities for the region.
that would statistically examine each successive cause and study its
links to the problem and to other causes. However, this approach (even
Finally, the assessment recognises that each of the fi ve GIWA concerns
if feasible) would use far more resources and time than those available
are not discrete but often interact. For example, pollution can destroy
to GIWA1. For this reason, it has been necessary to develop a relatively
aquatic habitats that are essential for fi sh reproduction which, in turn,
simple and practical analytical model for gathering information to
can cause declines in fi sh stocks and subsequent overexploitation. Once
assemble meaningful causal chains.
teams have ranked each of the concerns and determined the priorities
for the region, the links between the concerns are highlighted in order
Conceptual model
to identify places where strategic interventions could be applied to
A causal chain is a series of statements that link the causes of a problem
yield the greatest benefi ts for the environment and human societies
with its eff ects. Recognising the great diversity of local settings and the
in the region.
resulting diffi
culty in developing broadly applicable policy strategies,
the GIWA CCA focuses on a particular system and then only on those
Causal chain analysis
issues that were prioritised during the scoping assessment. The
Causal Chain Analysis (CCA) traces the cause-eff ect pathways from the
starting point of a particular causal chain is one of the issues selected
socio-economic and environmental impacts back to their root causes.
during the Scaling and Scoping stages and its related environmental
The GIWA CCA aims to identify the most important causes of each
and socio-economic impacts. The next element in the GIWA chain is
concern prioritised during the scoping assessment in order to direct
the immediate cause; defi ned as the physical, biological or chemical
policy measures at the most appropriate target in order to prevent
variable that produces the GIWA issue. For example, for the issue of
further degradation of the regional aquatic environment.
eutrophication the immediate causes may be, inter alia:
Enhanced nutrient inputs;
Root causes are not always easy to identify because they are often
Increased
recycling/mobilisation;
spatially or temporally separated from the actual problems they
Trapping of nutrients (e.g. in river impoundments);
cause. The GIWA CCA was developed to help identify and understand
Run-off and stormwaters
the root causes of environmental and socio-economic problems
in international waters and is conducted by identifying the human
Once the relevant immediate cause(s) for the particular system has
activities that cause the problem and then the factors that determine
(have) been identifi ed, the sectors of human activity that contribute
the ways in which these activities are undertaken. However, because
most signifi cantly to the immediate cause have to be determined.
there is no universal theory describing how root causes interact to
Assuming that the most important immediate cause in our example
create natural resource management problems and due to the great
had been increased nutrient concentrations, then it is logical that the
variation of local circumstances under which the methodology will
most likely sources of those nutrients would be the agricultural, urban
be applied, the GIWA CCA is not a rigidly structured assessment but
or industrial sectors. After identifying the sectors that are primarily
1 This does not mean that the methodology ignores statistical or quantitative studies; as has already been pointed out, the available evidence that justifies the assumption of causal links should
be provided in the assessment.
x
REGIONAL ASSESSMENTS
responsible for the immediate causes, the root causes acting on those
The policy options recommended by the GIWA are only contributions
sectors must be determined. For example, if agriculture was found to
to the larger policy process and, as such, the GIWA methodology
be primarily responsible for the increased nutrient concentrations, the
developed to test the performance of various options under the
root causes could potentially be:
diff erent circumstances has been kept simple and broadly applicable.
Economic (e.g. subsidies to fertilisers and agricultural products);
Legal (e.g. inadequate regulation);
Global International Waters Assessment
Failures in governance (e.g. poor enforcement); or
Technology or knowledge related (e.g. lack of aff ordable substitutes
for fertilisers or lack of knowledge as to their application).
Once the most relevant root causes have been identifi ed, an
explanation, which includes available data and information, of how
they are responsible for the primary environmental and socio-economic
problems in the region should be provided.
Policy option analysis
Despite considerable eff ort of many Governments and other
organisations to address transboundary water problems, the evidence
indicates that there is still much to be done in this endeavour. An
important characteristic of GIWA's Policy Option Analysis (POA) is that
its recommendations are fi rmly based on a better understanding of
the root causes of the problems. Freshwater scarcity, water pollution,
overexploitation of living resources and habitat destruction are very
complex phenomena. Policy options that are grounded on a better
understanding of these phenomena will contribute to create more
eff ective societal responses to the extremely complex water related
transboundary problems. The core of POA in the assessment consists
of two tasks:
Construct policy options
Policy options are simply diff erent courses of action, which are not
always mutually exclusive, to solve or mitigate environmental and
socio-economic problems in the region. Although a multitude of
diff erent policy options could be constructed to address each root
cause identifi ed in the CCA, only those few policy options that have
the greatest likelihood of success were analysed in the GIWA.
Select and apply the criteria on which the policy options will be
evaluated
Although there are many criteria that could be used to evaluate any
policy option, GIWA focuses on:
Eff ectiveness (certainty of result)
Effi
ciency (maximisation of net benefi ts)
Equity (fairness of distributional impacts)
Practical
criteria
(political
acceptability,
implementation
feasibility).
THE GIWA METHODOLOGY
xi
Table 5a: Scoring criteria for environmental impacts of Freshwater shortage
Issue
Score 0 = no known impact
Score 1 = slight impact
Score 2 = moderate impact
Score 3 = severe impact
Issue 1: Modification
No evidence of modification of stream
There is a measurably changing trend in
Significant downward or upward trend
Annual discharge of a river altered by more
of stream flow
flow.
annual river discharge at gauging stations
(more than 20% of the long term mean) in
than 50% of long term mean; or
"An increase or decrease
in a major river or tributary (basin >
annual discharges in a major river or tributary Loss of >50% of riparian or deltaic
in the discharge of
40 000 km2); or
draining a basin of >250 000 km2; or
wetlands over a period of not less than
streams and rivers
There is a measurable decrease in the area
Loss of >20% of flood plain or deltaic
40 years (through causes other than
as a result of human
of wetlands (other than as a consequence
wetlands through causes other than
conversion or artificial embankment); or
interventions on a local/
of conversion or embankment
conversion or artificial embankments; or
Significant increased siltation or erosion
regional scale (see Issue
construction); or
Significant loss of riparian vegetation (e.g.
due to changing in flow regime (other than
19 for flow alterations
There is a measurable change in the
trees, flood plain vegetation); or
normal fluctuations in flood plain rivers);
resulting from global
interannual mean salinity of estuaries or
Significant saline intrusion into previously
or
change) over the last 3-4
coastal lagoons and/or change in the mean
freshwater rivers or lagoons.
Loss of one or more anadromous or
decades."
position of estuarine salt wedge or mixing
catadromous fish species for reasons
zone; or
other than physical barriers to migration,
Change in the occurrence of exceptional
pollution or overfishing.
discharges (e.g. due to upstream
damming.
Issue 2: Pollution of
No evidence of pollution of surface and
Any monitored water in the region does
Water supplies does not meet WHO or
River draining more than 10% of the basin
existing supplies
ground waters.
not meet WHO or national drinking water
national drinking water standards in more
have suffered polysaprobic conditions, no
"Pollution of surface
criteria, other than for natural reasons; or
than 30% of the region; or
longer support fish, or have suffered severe
and ground fresh waters
There have been reports of one or more
There are one or more reports of fish kills
oxygen depletion
supplies as a result of
fish kills in the system due to pollution
due to pollution in any river draining a
Severe pollution of other sources of
point or diffuse sources"
within the past five years.
basin of >250 000 km2 .
freshwater (e.g. groundwater)
Issue 3: Changes in
No evidence that abstraction of water from Several wells have been deepened because Clear evidence of declining base flow in
Aquifers are suffering salinisation over
the water table
aquifers exceeds natural replenishment.
of excessive aquifer draw-down; or
rivers in semi-arid areas; or
regional scale; or
"Changes in aquifers
Several springs have dried up; or
Loss of plant species in the past decade,
Perennial springs have dried up over
as a direct or indirect
Several wells show some salinisation.
that depend on the presence of ground
regionally significant areas; or
consequence of human
water; or
Some aquifers have become exhausted
activity"
Wells have been deepened over areas of
hundreds of km2;or
Salinisation over significant areas of the
region.
Table 5b: Scoring criteria for environmental impacts of Pollution
Issue
Score 0 = no known impact
Score 1 = slight impact
Score 2 = moderate impact
Score 3 = severe impact
Issue 4:
Normal incidence of bacterial related
There is minor increase in incidence of
Public health authorities aware of marked
There are large closure areas or very
Microbiological
gastroenteric disorders in fisheries product
bacterial related gastroenteric disorders
increase in the incidence of bacterial
restrictive advisories affecting the
pollution
consumers and no fisheries closures or
in fisheries product consumers but no
related gastroenteric disorders in fisheries
marketability of fisheries products; or
"The adverse effects of
advisories.
fisheries closures or advisories.
product consumers; or
There exists widespread public or tourist
microbial constituents of
There are limited area closures or
awareness of hazards resulting in
human sewage released
advisories reducing the exploitation or
major reductions in the exploitation or
to water bodies."
marketability of fisheries products.
marketability of fisheries products.
Issue 5:
No visible effects on the abundance and
Increased abundance of epiphytic algae; or
Increased filamentous algal production
High frequency (>1 event per year), or
Eutrophication
distributions of natural living resource
A statistically significant trend in
resulting in algal mats; or
intensity, or large areas of periodic hypoxic
"Artificially enhanced
distributions in the area; and
decreased water transparency associated
Medium frequency (up to once per year)
conditions, or high frequencies of fish and
primary productivity in
No increased frequency of hypoxia1 or
with algal production as compared with
of large-scale hypoxia and/or fish and
zoobenthos mortality events or harmful
receiving water basins
fish mortality events or harmful algal
long-term (>20 year) data sets; or
zoobenthos mortality events and/or
algal blooms; or
related to the increased
blooms associated with enhanced primary
Measurable shallowing of the depth range
harmful algal blooms.
Significant changes in the littoral
availability or supply
production; and
of macrophytes.
community; or
of nutrients, including
No evidence of periodically reduced
Presence of hydrogen sulphide in
cultural eutrophication
dissolved oxygen or fish and zoobenthos
historically well oxygenated areas.
in lakes."
mortality; and
No evident abnormality in the frequency of
algal blooms.
xii
REGIONAL ASSESSMENTS
Issue 6: Chemical
No known or historical levels of chemical
Some chemical contaminants are
Some chemical contaminants are above
Chemical contaminants are above
pollution
contaminants except background levels of
detectable but below threshold limits
threshold limits defined for the country or
threshold limits defined for the country or
"The adverse effects of
naturally occurring substances; and
defined for the country or region; or
region; or
region; and
chemical contaminants
No fisheries closures or advisories due to
Restricted area advisories regarding
Large area advisories by public health
Public health and public awareness of
released to standing or
chemical pollution; and
chemical contamination of fisheries
authorities concerning fisheries product
fisheries contamination problems with
marine water bodies
No incidence of fisheries product tainting;
products.
contamination but without associated
associated reductions in the marketability
as a result of human
and
catch restrictions or closures; or
of such products either through the
activities. Chemical
No unusual fish mortality events.
If there is no available data use the following
High mortalities of aquatic species near
imposition of limited advisories or by area
contaminants are
criteria:
outfalls.
closures of fisheries; or
here defined as
If there is no available data use the following
Some use of pesticides in small areas; or
Large-scale mortalities of aquatic species.
compounds that are
criteria:
Presence of small sources of dioxins or
If there is no available data use the following
toxic or persistent or
No use of pesticides; and
furans (e.g., small incineration plants or
criteria:
If there is no available data use the following
bioaccumulating."
No sources of dioxins and furans; and
bleached kraft/pulp mills using chlorine);
Large-scale use of pesticides in agriculture
criteria:
No regional use of PCBs; and
or
and forestry; or
Indications of health effects resulting
No bleached kraft pulp mills using chlorine Some previous and existing use of PCBs
Presence of major sources of dioxins or
from use of pesticides; or
bleaching; and
and limited amounts of PCB-containing
furans such as large municipal or industrial Known emissions of dioxins or furans from
No use or sources of other contaminants.
wastes but not in amounts invoking local
incinerators or large bleached kraft pulp
incinerators or chlorine bleaching of pulp;
concerns; or
mills; or
or
Presence of other contaminants.
Considerable quantities of waste PCBs in
Known contamination of the environment
the area with inadequate regulation or has
or foodstuffs by PCBs; or
invoked some public concerns; or
Known contamination of the environment
Presence of considerable quantities of
or foodstuffs by other contaminants.
other contaminants.
Issue 7: Suspended
No visible reduction in water transparency; Evidently increased or reduced turbidity
Markedly increased or reduced turbidity
Major changes in turbidity over wide or
solids
and
in streams and/or receiving riverine and
in small areas of streams and/or receiving
ecologically significant areas resulting
"The adverse effects of
No evidence of turbidity plumes or
marine environments but without major
riverine and marine environments; or
in markedly changed biodiversity or
modified rates of release
increased siltation; and
changes in associated sedimentation or
Extensive evidence of changes in
mortality in benthic species due to
of suspended particulate No evidence of progressive riverbank,
erosion rates, mortality or diversity of flora
sedimentation or erosion rates; or
excessive sedimentation with or without
matter to water bodies
beach, other coastal or deltaic erosion.
and fauna; or
Changes in benthic or pelagic biodiversity
concomitant changes in the nature of
resulting from human
Some evidence of changes in benthic or
in areas due to sediment blanketing or
deposited sediments (i.e., grain-size
activities"
pelagic biodiversity in some areas due
increased turbidity.
composition/redox); or
to sediment blanketing or increased
Major change in pelagic biodiversity or
turbidity.
mortality due to excessive turbidity.
Issue 8: Solid wastes
No noticeable interference with trawling
Some evidence of marine-derived litter on
Widespread litter on beaches giving rise to
Incidence of litter on beaches sufficient
"Adverse effects
activities; and
beaches; or
public concerns regarding the recreational
to deter the public from recreational
associated with the
No noticeable interference with the
Occasional recovery of solid wastes
use of beaches; or
activities; or
introduction of solid
recreational use of beaches due to litter;
through trawling activities; but
High frequencies of benthic litter recovery
Trawling activities untenable because of
waste materials into
and
Without noticeable interference with
and interference with trawling activities;
benthic litter and gear entanglement; or
water bodies or their
No reported entanglement of aquatic
trawling and recreational activities in
or
Widespread entanglement and/or
environs."
organisms with debris.
coastal areas.
Frequent reports of entanglement/
suffocation of aquatic species by litter.
suffocation of species by litter.
Issue 9: Thermal
No thermal discharges or evidence of
Presence of thermal discharges but
Presence of thermal discharges with large
Presence of thermal discharges with large
"The adverse effects
thermal effluent effects.
without noticeable effects beyond
mixing zones having reduced productivity
mixing zones with associated mortalities,
of the release of
the mixing zone and no significant
or altered biodiversity; or
substantially reduced productivity or
aqueous effluents at
interference with migration of species.
Evidence of reduced migration of species
noticeable changes in biodiversity; or
temperatures exceeding
due to thermal plume.
Marked reduction in the migration of
ambient temperature
species due to thermal plumes.
in the receiving water
body."
Issue 10: Radionuclide No radionuclide discharges or nuclear
Minor releases or fallout of radionuclides
Minor releases or fallout of radionuclides
Substantial releases or fallout of
"The adverse effects of
activities in the region.
but with well regulated or well-managed
under poorly regulated conditions that do
radionuclides resulting in excessive
the release of radioactive
conditions complying with the Basic Safety
not provide an adequate basis for public
exposures to humans or animals in relation
contaminants and
Standards.
health assurance or the protection of
to those recommended under the Basic
wastes into the aquatic
aquatic organisms but without situations
Safety Standards; or
environment from
or levels likely to warrant large scale
Some indication of situations or exposures
human activities."
intervention by a national or international
warranting intervention by a national or
authority.
international authority.
Issue 11: Spills
No evidence of present or previous spills of
Some evidence of minor spills of hazardous Evidence of widespread contamination
Widespread contamination by hazardous
"The adverse effects
hazardous material; or
materials in small areas with insignificant
by hazardous or aesthetically displeasing
or aesthetically displeasing materials
of accidental episodic
No evidence of increased aquatic or avian
small-scale adverse effects one aquatic or
materials assumed to be from spillage
from frequent spills resulting in major
releases of contaminants
species mortality due to spills.
avian species.
(e.g. oil slicks) but with limited evidence of
interference with aquatic resource
and materials to the
widespread adverse effects on resources or
exploitation or coastal recreational
aquatic environment
amenities; or
amenities; or
as a result of human
Some evidence of aquatic or avian species
Significant mortality of aquatic or avian
activities."
mortality through increased presence of
species as evidenced by large numbers of
contaminated or poisoned carcasses on
contaminated carcasses on beaches.
beaches.
THE GIWA METHODOLOGY
xiii
Table 5c: Scoring criteria for environmental impacts of Habitat and community modification
Issue
Score 0 = no known impact
Score 1 = slight impact
Score 2 = moderate impact
Score 3 = severe impact
Issue 12: Loss of ecosystems or
There is no evidence of loss of
There are indications of fragmentation Permanent destruction of at least one
Permanent destruction of at least one
ecotones
ecosystems or habitats.
of at least one of the habitats.
habitat is occurring such as to have
habitat is occurring such as to have
"The complete destruction of aquatic
reduced their surface area by up to 30
reduced their surface area by >30%
habitats. For the purpose of GIWA
% during the last 2-3 decades.
during the last 2-3 decades.
methodology, recent loss will be
measured as a loss of pre-defined
habitats over the last 2-3 decades."
Issue 13: Modification of
No evidence of change in species
Evidence of change in species
Evidence of change in species
Evidence of change in species
ecosystems or ecotones, including
complement due to species extinction
complement due to species extinction
complement due to species extinction
complement due to species extinction
community structure and/or species
or introduction; and
or introduction
or introduction; and
or introduction; and
composition
No changing in ecosystem function
Evidence of change in population
Evidence of change in population
"Modification of pre-defined habitats
and services.
structure or change in functional group
structure or change in functional group
in terms of extinction of native species,
composition or structure
composition or structure; and
occurrence of introduced species and
Evidence of change in ecosystem
changing in ecosystem function and
services2.
services over the last 2-3 decades."
2 Constanza, R. et al. (1997). The value of the world ecosystem services and natural capital, Nature 387:253-260.
Table 5d: Scoring criteria for environmental impacts of Unsustainable exploitation of fish and other
living resources
Issue
Score 0 = no known impact
Score 1 = slight impact
Score 2 = moderate impact
Score 3 = severe impact
Issue 14: Overexploitation
No harvesting exists catching fish
Commercial harvesting exists but there One stock is exploited beyond MSY
More than one stock is exploited
"The capture of fish, shellfish or marine
(with commercial gear for sale or
is no evidence of over-exploitation.
(maximum sustainable yield) or is
beyond MSY or is outside safe
invertebrates at a level that exceeds the
subsistence).
outside safe biological limits.
biological limits.
maximum sustainable yield of the stock."
Issue 15: Excessive by-catch and
Current harvesting practices show no
Up to 30% of the fisheries yield (by
30-60% of the fisheries yield consists
Over 60% of the fisheries yield is
discards
evidence of excessive by-catch and/or
weight) consists of by-catch and/or
of by-catch and/or discards.
by-catch and/or discards; or
"By-catch refers to the incidental capture
discards.
discards.
Noticeable incidence of capture of
of fish or other animals that are not the
endangered species.
target of the fisheries. Discards refers
to dead fish or other animals that are
returned to the sea."
Issue 16: Destructive fishing
No evidence of habitat destruction due Habitat destruction resulting in
Habitat destruction resulting in
Habitat destruction resulting in
practices
to fisheries practices.
changes in distribution of fish or
moderate reduction of stocks or
complete collapse of a stock or far
"Fishing practices that are deemed to
shellfish stocks; or
moderate changes of the environment;
reaching changes in the environment;
produce significant harm to marine,
Trawling of any one area of the seabed
or
or
lacustrine or coastal habitats and
is occurring less than once per year.
Trawling of any one area of the seabed
Trawling of any one area of the seabed
communities."
is occurring 1-10 times per year; or
is occurring more than 10 times per
Incidental use of explosives or poisons
year; or
for fishing.
Widespread use of explosives or
poisons for fishing.
Issue 17: Decreased viability of
No evidence of increased incidence of
Increased reports of diseases without
Declining populations of one or more
Collapse of stocks as a result of
stocks through contamination and
fish or shellfish diseases.
major impacts on the stock.
species as a result of diseases or
diseases or contamination.
disease
contamination.
"Contamination or diseases of feral (wild)
stocks of fish or invertebrates that are a
direct or indirect consequence of human
action."
Issue 18: Impact on biological and
No evidence of deliberate or accidental Alien species introduced intentionally
Measurable decline in the population
Extinction of native species or local
genetic diversity
introductions of alien species; and
or accidentally without major changes
of native species or local stocks as a
stocks as a result of introductions
"Changes in genetic and species diversity No evidence of deliberate or accidental
in the community structure; or
result of introductions (intentional or
(intentional or accidental); or
of aquatic environments resulting from
introductions of alien stocks; and
Alien stocks introduced intentionally
accidental); or
Major changes (>20%) in the genetic
the introduction of alien or genetically
No evidence of deliberate or accidental
or accidentally without major changes
Some changes in the genetic
composition of stocks (e.g. as a result
modified species as an intentional or
introductions of genetically modified
in the community structure; or
composition of stocks (e.g. as a result
of escapes from aquaculture replacing
unintentional result of human activities
species.
Genetically modified species
of escapes from aquaculture replacing
the wild stock).
including aquaculture and restocking."
introduced intentionally or
the wild stock).
accidentally without major changes in
the community structure.
xiv
REGIONAL ASSESSMENTS
Table 5e: Scoring criteria for environmental impacts of Global change
Issue
Score 0 = no known impact
Score 1 = slight impact
Score 2 = moderate impact
Score 3 = severe impact
Issue 19: Changes in hydrological
No evidence of changes in hydrological Change in hydrological cycles due
Significant trend in changing
Loss of an entire habitat through
cycle and ocean circulation
cycle and ocean/coastal current due to
to global change causing changes
terrestrial or sea ice cover (by
desiccation or submergence as a result
"Changes in the local/regional water
global change.
in the distribution and density of
comparison with a long-term time
of global change; or
balance and changes in ocean and coastal
riparian terrestrial or aquatic plants
series) without major downstream
Change in the tree or lichen lines; or
circulation or current regime over the
without influencing overall levels of
effects on river/ocean circulation or
Major impacts on habitats or
last 2-3 decades arising from the wider
productivity; or
biological diversity; or
biodiversity as the result of increasing
problem of global change including
Some evidence of changes in ocean
Extreme events such as flood and
frequency of extreme events; or
ENSO."
or coastal currents due to global
drought are increasing; or
Changing in ocean or coastal currents
change but without a strong effect on
Aquatic productivity has been altered
or upwelling regimes such that plant
ecosystem diversity or productivity.
as a result of global phenomena such
or animal populations are unable to
as ENSO events.
recover to their historical or stable
levels; or
Significant changes in thermohaline
circulation.
Issue 20: Sea level change
No evidence of sea level change.
Some evidences of sea level change
Changed pattern of coastal erosion due Major loss of coastal land areas due to
"Changes in the last 2-3 decades in the
without major loss of populations of
to sea level rise has became evident; or
sea-level change or sea-level induced
annual/seasonal mean sea level as a
organisms.
Increase in coastal flooding events
erosion; or
result of global change."
partly attributed to sea-level rise
Major loss of coastal or intertidal
or changing prevailing atmospheric
populations due to sea-level change or
forcing such as atmospheric pressure
sea level induced erosion.
or wind field (other than storm
surges).
Issue 21: Increased UV-B radiation as No evidence of increasing effects
Some measurable effects of UV/B
Aquatic community structure is
Measured/assessed effects of UV/B
a result of ozone depletion
of UV/B radiation on marine or
radiation on behavior or appearance of
measurably altered as a consequence
irradiation are leading to massive loss
"Increased UV-B flux as a result polar
freshwater organisms.
some aquatic species without affecting
of UV/B radiation; or
of aquatic communities or a significant
ozone depletion over the last 2-3
the viability of the population.
One or more aquatic populations are
change in biological diversity.
decades."
declining.
Issue 22: Changes in ocean CO
No measurable or assessed changes
Some reasonable suspicions that
Some evidences that the impacts
Evidences that the changes in
2
source/sink function
in CO source/sink function of aquatic
current global change is impacting the
of global change have altered the
source/sink function of the aquatic
2
"Changes in the capacity of aquatic
system.
aquatic system sufficiently to alter its
source/sink function for CO of aquatic
systems in the region are sufficient to
2
systems, ocean as well as freshwater, to
source/sink function for CO .
systems in the region by at least 10%.
cause measurable change in global CO
2
2
generate or absorb atmospheric CO as a
balance.
2
direct or indirect consequence of global
change over the last 2-3 decades."
THE GIWA METHODOLOGY
xv