

Global International
Waters Assessment
Regional assessments
Other reports in this series:
Russian Arctic ş GIWA Regional assessment 1a
Caribbean Sea/Small Islands ş GIWA Regional assessment 3a
Caribbean Islands ş GIWA Regional assessment 4
Barents Sea ş GIWA Regional assessment 11
Baltic Sea ş GIWA Regional assessment 17
Caspian Sea ş GIWA Regional assessment 23
Gulf of California/Colorado River Basin ş GIWA Regional assessment 27
Yellow Sea ş GIWA Regional assessment 34
East China Sea ş GIWA Regional assessment 36
Patagonian Shelf ş GIWA Regional assessment 38
Brazil Current ş GIWA Regional assessment 39
Amazon Basin ş GIWA Regional assessment 40b
Canary Current ş GIWA Regional assessment 41
Guinea Current ş GIWA Regional assessment 42
Lake Chad Basin ş GIWA Regional assessment 43
Indian Ocean Islands ş GIWA Regional assessment 45b
East African Rift Valley Lakes ş GIWA Regional assessment 47
South China Sea ş GIWA Regional assessment 54
Sulu-Celebes (Sulawesi) Sea ş GIWA Regional assessment 56
Indonesian Seas ş GIWA Regional assessment 57
Pacifi c Islands ş GIWA Regional assessment 62
Global International
Waters Assessment
Regional assessment 44
Benguela Current
GIWA report production
Series editor: Ulla Li Zweifel
Editorial assistance: Johanna Egerup, Malin Karlsson
Maps & GIS: Rasmus G÷ransson
Design & graphics: Joakim Palmqvist
Global International Waters Assessment
Benguela Current, GIWA Regional assessment 44
Published by the University of Kalmar on behalf of
United Nations Environment Programme
ę 2005 United Nations Environment Programme
ISSN 1651-940X
University of Kalmar
SE-391 82 Kalmar
Sweden
United Nations Environment Programme
PO Box 30552,
Nairobi, Kenya
This publication may be reproduced in whole or in part and
in any form for educational or non-profi t purposes without
special permission from the copyright holder, provided
acknowledgement of the source is made. No use of this
publication may be made for resale or for any other commercial
purpose whatsoever without prior permission in writing from the
United Nations Environment Programme.
CITATIONS
When citing this report, please use:
UNEP, 2005. Prochazka, K., Davies, B., Griffi
ths, C., Hara, M.,
Luyeye, N., O'Toole, M., Bodenstein, J., Probyn, T., Clark, B., Earle,
A., Tapscott, C. and R. Hasler. Benguela Current, GIWA Regional
assessment 44. University of Kalmar, Kalmar, Sweden.
DISCLAIMER
The views expressed in this publication are those of the authors
and do not necessarily refl ect those of UNEP. The designations
employed and the presentations do not imply the expressions
of any opinion whatsoever on the part of UNEP or cooperating
agencies concerning the legal status of any country, territory,
city or areas or its authority, or concerning the delimitation of its
frontiers or boundaries.
This publication has been peer-reviewed and the information
herein is believed to be reliable, but the publisher does not
warrant its completeness or accuracy.
Contents
Executive summary
9
Abbreviations and acronyms
11
Regional defi nition
13
Boundaries of the region
13
Physical characteristics
15
Socio-economic characteristics
16
Assessment 19
Freshwater shortage
20
Pollution
25
Habitat and community modifi cation
30
Unsustainable exploitation of fi sh and other living resources
35
Global change
40
Priority concerns for further analysis
43
Causal chain analysis
45
Freshwater shortage in the Orange-Vaal River Basin
45
Unsustainable exploitation of inshore fi nfi sh in the Benguela Current
48
Policy options
54
Addressing modifi cation of stream fl ow
54
Addressing unsustainable exploitation of inshore fi nfi sh resources
56
Conclusions and recommendations
58
References 60
Annexes 67
Annex I List of contributing authors and organisations
67
Annex II Detailed scoring tables
68
Annex III List of conventions and specifi c laws that aff ect water use in the region
73
Annex IV List of national policy and legislation
74
The Global International Waters Assessment
i
The GIWA methodology
vii
CONTENTS
Executive summary
The Benguela Current region (GIWA region 44) includes the entire
be the major contributor to Freshwater shortage in the region. Pollution
extent of the Benguela Current system and the freshwaters that drain
of freshwater resources through a number of avenues is also considered
into it. The region spans fi ve countries, including Angola, Namibia,
to be severe in the region, as are the impacts of changes in the water
Botswana, South Africa and Lesotho. The total coastline of the region
table due to overabstraction of aquifers with long replenishment times.
extends some 4 590 km from the Angolan enclave of Cabinda in the
Although some measures are in place to address the problems of
north to Cape Agulhas at the southern tip of the African continent. The
freshwater shortage in the region, the outlook for 2020 remains poor.
combined Exclusive Economic Zones of the three coastal states covers
some 1.9 million km2, with an estimated 1.4 million km2 falling within
Almost all forms of pollution of freshwater systems are assessed as
the Benguela Current region.
being severe, resulting in the overall assessment that the GIWA concern
Pollution is severe in the freshwater systems of the Benguela Current
The cold, northwards-fl owing Benguela Current system to a large extent
region. The primary issue of concern related to pollution of the marine
controls the climate of the region, which is for the most part arid or
environment is that of oil spills, which have profound environmental
semi-arid. The climate in turn infl uences the human dimensions of the
and economic impacts. Microbiological pollution, and pollution by solid
region, with the drier western areas being more sparsely populated than
waste are considered to be moderate, although highly localised, while
the wetter eastern parts. The region is characterised by high variability,
pollution by suspended solids as a result of marine mining activities is
both in natural processes such as rainfall and upwelling, and also in
also considered moderate but more diff use. The prognosis for 2020 is of
socio-economic processes, with the highly industrialised Gauteng
further deterioration of all types of pollution across the region.
Province of South Africa contrasting dramatically with subsistence-
based activities in Angola. The variability in the human dimensions
The modifi cation and loss of freshwater habitats and communities
translates into diff ering anthropogenic activities in diff erent parts of
of the Benguela Current region is assessed as severe. All major
the region, and hence into diff ering environmental impacts across the
freshwater habitats are considered to have undergone some form
region. A major diff erence in the environmental impacts is evident
of transformation, and much loss of habitats and ecosystems was
between the freshwater and marine systems of the region, and these
also evident. In the marine environment, modifi cation and loss of
systems were therefore assessed separately.
ecosystems and habitats is assessed as moderate. Of particular concern
are coastal lagoons, estuaries and mangroves. The projection for the
Environmental impacts surrounding the unsustainable use of
future is that habitats and communities within the Benguela Current
freshwater resources are severe in the region, while the impacts of this
region will continue to be transformed, and that further losses of
environmental degradation on the social and economic dimensions
habitats and ecosystems will occur.
are considered moderate to severe. This, together with the backdrop
of the natural aridity of the area, resulted in the GIWA concern of
Due to a low level of activity related to freshwater fi sheries in the
Freshwater shortage being highlighted as a priority for further analysis.
Benguela Current region, and the overwhelming importance of
Modifi cation of stream fl ow through the construction of dams and the
marine fi sheries, the GIWA concern of Unsustainable exploitation
overabstraction of water for agriculture and industry was considered to
of fi sh and other living resources was assessed only in the marine
EXECUTIVE SUMMARY
9
environment. Overall the impacts of the concern are assessed as
through dam construction and overabstraction of water as immediate
being moderate in the region. Overexploitation was by far the most
causes of the environmental impacts. Root causes of this issue include
important contributing issue, with stocks of many marine resources
political decisions such as prioritisation of industrial water use, lack
being considered overexploited at present, and with resultant declines
of coordination among departments, demographic considerations,
in catches having been documented. As a general overview, it would
economic policies, and improvements in technology, particularly
appear as if the larger commercial fi sheries are more sustainably
irrigation technology. A suite of policy options for addressing these
managed at present, than are the smaller, and particularly the artisanal,
root causes was developed. This revolved around the three thematic
fi sheries. The future outlook is of sustainable commercial fi sheries, but
areas of changing the way water is perceived and used, eff ecting holistic
of a worsening of the current unsustainable exploitation in the smaller
planning, and improving existing management of water resources.
and less valuable fi sheries by 2020.
The case study of Unsustainable exploitation of inshore fi nfi sh in the
The impacts of the GIWA concern of Global change are assessed as
Benguela Current transboundary system highlighted overexploitation
moderate in freshwater systems and slight in marine systems. The
due to excessive fi shing eff ort and degradation of critical habitats
assessment of global change should be treated with some caution,
such as estuaries and mangroves as immediate causes of the
as this is an area where data are not readily available. Thus, in several
environmental impacts. The root causes of these were identifi ed as
cases, although impacts may currently exist, no direct evidence could
political encouragement of small-scale fi sheries, governance failures
be found for these, and it is thus likely that the assessment may have
and diffi
culty of regulation of inshore fi nfi sh fi sheries, a number of
underestimated the impacts. The environmental and socio-economic
economic considerations, improved capture technology, and poor
impacts of all issues related to Global change are expected to worsen
voluntary compliance. A suite of policy options was developed to
by 2020.
address the root causes of overexploitation around the two major
themes of reducing access to the fi sheries and improving voluntary
Two case studies were selected for more in-depth analysis of the root
compliance with existing regulations. A suite of three thematic options
causes of environmental degradation, and for analysis of policy options
was developed to address the root causes of degradation of critical
to address these. The two case studies were selected so as to represent
habitats, including introduction of holistic management of these
both the freshwater and marine environments of the Benguela Current
habitats, creation of alternative economic activities in coastal areas,
region. The case study of Freshwater shortage in the Orange-Vaal
and improved voluntary compliance with existing regulations.
transboundary river system highlighted modifi cation of stream fl ow
10
GIWA REGIONAL ASSESSMENT 44 BENGUELA CURRENT
Abbreviations and acronyms
BCLME
Benguela Current Large Marine Ecosystem Programme
CFCs Chlorofl
uorocarbons
CIA
Central Intelligence Agency (USA)
CPUE Catch
Per
Unit
Eff ort
CSIR
Council for Scientifi c and Industrial Research (South Africa)
DDT Dichlorodiphenyltrichloroethane
DWAF
Department of Water Aff airs and Forestry (South Africa)
EEZ Exclusive
Economic
Zone
EIA
Environmental Impact Assessment
FAO
Food and Agriculture Organization (United Nations)
GCM
Global Climate Model
GDP Gross
Domestic
Product
GEO Global
Environment
Outlook
GGP
Gross Geographic Product
GIWA
Global International Waters Assessment
GPS
Global Positioning System
IPCC
Intergovernmental Panel on Climate Change
IUCN The
World
Conservation
Union
LORMS
Lower Orange River Management Study
MARPOL
International Convention for the Prevention of Pollution from Ships
NCAR
National Centre for Atmospheric Research (USA)
ORASECOM Orange Senqu River Commission
PBMR Pebble
Bed
Modular
Reactor
Ramsar
Convention on Wetlands of International Importance
SADC Southern
African
Development
Community
SEAFO
South East Atlantic Fisheries Organization
SST Sea
Surface
Temperature
TAC Total
Allowable
Catch
UN United
Nations
UNEP
United Nations Environment Programme
USEPA
United States Environmental Protection Agency
ABBREVIATIONS AND ACRONYMS
11
List of figures
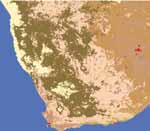
Figure 1
Boundaries of the Benguela Current region. . . . . . . . . . . . . . . . . . . . . . . . . . . . . . . . . . . . . . . . . . . . . . . . . . . . . . . . . . . . . . . . . . . . . . . . . . . . . . . . . . . . . . . . . . . . . . . . . . . . . . . . . . . . . . . . . . . . . 14
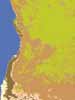
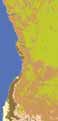
Figure 2
Land cover in the Benguela Current. . . . . . . . . . . . . . . . . . . . . . . . . . . . . . . . . . . . . . . . . . . . . . . . . . . . . . . . . . . . . . . . . . . . . . . . . . . . . . . . . . . . . . . . . . . . . . . . . . . . . . . . . . . . . . . . . . . . . . . . . . . . . 15
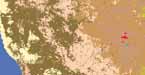
Figure 3
Humidity in the Benguela Current.. . . . . . . . . . . . . . . . . . . . . . . . . . . . . . . . . . . . . . . . . . . . . . . . . . . . . . . . . . . . . . . . . . . . . . . . . . . . . . . . . . . . . . . . . . . . . . . . . . . . . . . . . . . . . . . . . . . . . . . . . . . . . 16
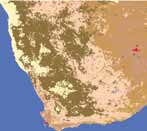
Figure 4
Population density in the Benguela Current region.. . . . . . . . . . . . . . . . . . . . . . . . . . . . . . . . . . . . . . . . . . . . . . . . . . . . . . . . . . . . . . . . . . . . . . . . . . . . . . . . . . . . . . . . . . . . . . . . . . . . . . . . . . . . 16
Figure 5
Alien aquatic vegetation spreads rapidly and choke waterways, Western Cape, South Africa. . . . . . . . . . . . . . . . . . . . . . . . . . . . . . . . . . . . . . . . . . . . . . . . . . . . . . . . . . . . . . . . . . 26
Figure 6
African penguins at Boulder's Beach, Simontown, South Africa. . . . . . . . . . . . . . . . . . . . . . . . . . . . . . . . . . . . . . . . . . . . . . . . . . . . . . . . . . . . . . . . . . . . . . . . . . . . . . . . . . . . . . . . . . . . . . . . 28
Figure 7
Dry river beds are a common feature in the arid Benguela Current region. . . . . . . . . . . . . . . . . . . . . . . . . . . . . . . . . . . . . . . . . . . . . . . . . . . . . . . . . . . . . . . . . . . . . . . . . . . . . . . . . . . . . . 32
Figure 8
Women collecting water. . . . . . . . . . . . . . . . . . . . . . . . . . . . . . . . . . . . . . . . . . . . . . . . . . . . . . . . . . . . . . . . . . . . . . . . . . . . . . . . . . . . . . . . . . . . . . . . . . . . . . . . . . . . . . . . . . . . . . . . . . . . . . . . . . . . . . . 34
Figure 9
Fishing vessels in Hout Bay, South Africa. . . . . . . . . . . . . . . . . . . . . . . . . . . . . . . . . . . . . . . . . . . . . . . . . . . . . . . . . . . . . . . . . . . . . . . . . . . . . . . . . . . . . . . . . . . . . . . . . . . . . . . . . . . . . . . . . . . . . . . 39
Figure 10
Drakensberg mountains at the border between South Africa and Lesotho. . . . . . . . . . . . . . . . . . . . . . . . . . . . . . . . . . . . . . . . . . . . . . . . . . . . . . . . . . . . . . . . . . . . . . . . . . . . . . . . . . . . . 46
Figure 11
Causal chain diagram illustrating the causal links for freshwater shortage in the Orange-Vaal River Basin. . . . . . . . . . . . . . . . . . . . . . . . . . . . . . . . . . . . . . . . . . . . . . . . . . . . . 47
Figure 12
Beach seines used by traditional fishermen, False Bay, South Africa. . . . . . . . . . . . . . . . . . . . . . . . . . . . . . . . . . . . . . . . . . . . . . . . . . . . . . . . . . . . . . . . . . . . . . . . . . . . . . . . . . . . . . . . . . . . 48
Figure 13
Causal chain diagram illustrating the causal links for unsustainable exploitation of inshore finfish in the Benguela Current. . . . . . . . . . . . . . . . . . . . . . . . . . . . . . . . . . . 49
Figure 14
Trawling in the Benguela Current. . . . . . . . . . . . . . . . . . . . . . . . . . . . . . . . . . . . . . . . . . . . . . . . . . . . . . . . . . . . . . . . . . . . . . . . . . . . . . . . . . . . . . . . . . . . . . . . . . . . . . . . . . . . . . . . . . . . . . . . . . . . . . 52
List of tables
Table 1
Geographical characteristics of the coastal countries in the Benguela Current region. . . . . . . . . . . . . . . . . . . . . . . . . . . . . . . . . . . . . . . . . . . . . . . . . . . . . . . . . . . . . . . . . . . . . . . . . . 16
Table 2
Socio-economic characteristics for the Benguela Current region. . . . . . . . . . . . . . . . . . . . . . . . . . . . . . . . . . . . . . . . . . . . . . . . . . . . . . . . . . . . . . . . . . . . . . . . . . . . . . . . . . . . . . . . . . . . . . . . 17
Table 3
GDP by sectors in Angola 2001. . . . . . . . . . . . . . . . . . . . . . . . . . . . . . . . . . . . . . . . . . . . . . . . . . . . . . . . . . . . . . . . . . . . . . . . . . . . . . . . . . . . . . . . . . . . . . . . . . . . . . . . . . . . . . . . . . . . . . . . . . . . . . . . . . 17
Table 4
GDP by sectors in Namibia 2003. . . . . . . . . . . . . . . . . . . . . . . . . . . . . . . . . . . . . . . . . . . . . . . . . . . . . . . . . . . . . . . . . . . . . . . . . . . . . . . . . . . . . . . . . . . . . . . . . . . . . . . . . . . . . . . . . . . . . . . . . . . . . . . . 17
Table 5
GDP by sectors in South Africa 2003. . . . . . . . . . . . . . . . . . . . . . . . . . . . . . . . . . . . . . . . . . . . . . . . . . . . . . . . . . . . . . . . . . . . . . . . . . . . . . . . . . . . . . . . . . . . . . . . . . . . . . . . . . . . . . . . . . . . . . . . . . . . 18
Table 6
GDP by sector in Lesotho 2003. . . . . . . . . . . . . . . . . . . . . . . . . . . . . . . . . . . . . . . . . . . . . . . . . . . . . . . . . . . . . . . . . . . . . . . . . . . . . . . . . . . . . . . . . . . . . . . . . . . . . . . . . . . . . . . . . . . . . . . . . . . . . . . . . 18
Table 7
Scoring tables for the Benguela Current region.. . . . . . . . . . . . . . . . . . . . . . . . . . . . . . . . . . . . . . . . . . . . . . . . . . . . . . . . . . . . . . . . . . . . . . . . . . . . . . . . . . . . . . . . . . . . . . . . . . . . . . . . . . . . . . . . . 19
Table 8
Rainfall and evaporation in the Benguela Current region. . . . . . . . . . . . . . . . . . . . . . . . . . . . . . . . . . . . . . . . . . . . . . . . . . . . . . . . . . . . . . . . . . . . . . . . . . . . . . . . . . . . . . . . . . . . . . . . . . . . . . 20
Table 9
Water availability and consumption in the southern African countries. . . . . . . . . . . . . . . . . . . . . . . . . . . . . . . . . . . . . . . . . . . . . . . . . . . . . . . . . . . . . . . . . . . . . . . . . . . . . . . . . . . . . . . . . 20
Table 10
Water use by sector in Namibia. . . . . . . . . . . . . . . . . . . . . . . . . . . . . . . . . . . . . . . . . . . . . . . . . . . . . . . . . . . . . . . . . . . . . . . . . . . . . . . . . . . . . . . . . . . . . . . . . . . . . . . . . . . . . . . . . . . . . . . . . . . . . . . . 21
Table 11
Organic water pollution in the Benguela Current region. . . . . . . . . . . . . . . . . . . . . . . . . . . . . . . . . . . . . . . . . . . . . . . . . . . . . . . . . . . . . . . . . . . . . . . . . . . . . . . . . . . . . . . . . . . . . . . . . . . . . . . 25
Table 12
The 20 largest tanker oil spills in the world. . . . . . . . . . . . . . . . . . . . . . . . . . . . . . . . . . . . . . . . . . . . . . . . . . . . . . . . . . . . . . . . . . . . . . . . . . . . . . . . . . . . . . . . . . . . . . . . . . . . . . . . . . . . . . . . . . . . . 28
Table 13
Condition of estuaries in South Africa's cool temperate biogeographic province. . . . . . . . . . . . . . . . . . . . . . . . . . . . . . . . . . . . . . . . . . . . . . . . . . . . . . . . . . . . . . . . . . . . . . . . . . . . . . . 33
Table 14
Overall score for the five GIWA concerns in the Benguela Current region. . . . . . . . . . . . . . . . . . . . . . . . . . . . . . . . . . . . . . . . . . . . . . . . . . . . . . . . . . . . . . . . . . . . . . . . . . . . . . . . . . . . . . . 43
Table 15
Water demand from the Orange River by sectors. . . . . . . . . . . . . . . . . . . . . . . . . . . . . . . . . . . . . . . . . . . . . . . . . . . . . . . . . . . . . . . . . . . . . . . . . . . . . . . . . . . . . . . . . . . . . . . . . . . . . . . . . . . . . . 46
List of boxes
Box 1
Climate models. . . . . . . . . . . . . . . . . . . . . . . . . . . . . . . . . . . . . . . . . . . . . . . . . . . . . . . . . . . . . . . . . . . . . . . . . . . . . . . . . . . . . . . . . . . . . . . . . . . . . . . . . . . . . . . . . . . . . . . . . . . . . . . . . . . . . . . . . . . . . . . . 43
12
GIWA REGIONAL ASSESSMENT 44 BENGUELA CURRENT
Regional defi nition
This section describes the boundaries and the main physical and
water from this catchment, and for this reason is considered as part of
socio-economic characteristics of the region in order to defi ne the
the region. The country of Lesotho is also included within the region as
area considered in the regional GIWA Assessment and to provide
it falls entirely within the Orange-Vaal drainage basin. The region does
suffi
cient background information to establish the context within
not include the rivers draining off the eastern escarpment of South
which the assessment was conducted.
Africa, nor the rivers draining onto the south coast of the country, as
these are included in the Agulhas Current region. The easternmost
boundary on the landward side is at Cape Agulhas.
Boundaries of the region
For the purposes of this assessment, the oceanic boundary of the
region is taken as the limit of the 200 nautical mile Exclusive Economic
The Benguela Current region (GIWA region 44) includes the entire
Zone (EEZ). Use of the 200 nautical mile EEZ as a boundary delimiter is
extent of the Benguela Current system and the freshwaters that drain
partially as a matter of convenience, but also to ensure that all economic
into it. The northern boundary extends to include Cabinda, a province
activity associated with the transboundary waters of the Benguela
of Angola which is entirely enclosed within the Democratic Republic of
Current region are included in the assessment. For the convenience
the Congo, and which represents the most northerly infl uence of the
of this assessment, the northern boundary is considered as a line
Benguela Current system on the marine environment and the socio-
drawn from the northernmost landward point (the northern tip of
economic climate (Figure 1).
Cabinda Province) and extending out to the 200 nautical mile limit. In
the southeast the region includes the entire Agulhas Bank as there is
Further landward, the region includes most of the western parts
signifi cant biological interaction between the Agulhas Bank and the
of Angola. The rivers draining into the Congo Basin are specifi cally
Benguela Current, and this area is thus of transboundary signifi cance
excluded from this region, as they are being dealt with as part of
within the Benguela Current region.
the Congo Basin in the Guinea Current region (GIWA region 42). Also
included in the region is most of Namibia, with the exception of the
A number of aquatic systems within the region are regarded as
rivers that drain into the Okavango system, as the Okavango is being
international waters due to their transboundary linkages, and their
considered as a discrete system within the Agulhas Current region
locations are marked on the map (Figure 1). The Benguela Current
(GIWA region 45a). The boundary of the region extends east to include
system itself forms part of the South Atlantic gyre system, and fl ows
the hyper-arid southwestern parts of Botswana. Since this includes
northwards along the west coast of southern Africa, from South Africa
such a small area of the country, Botswana will not be discussed in any
to Namibia and Angola. This system is transboundary by its very
detail in this report. Within South Africa the region includes the entire
nature, and a large proportion of the associated living resources are
catchment of the Orange-Vaal drainage basin, and thus includes the
shared across the entire system, and hence between the three coastal
large and industrialised urban centres of Johannesburg and Pretoria.
countries. To the south of the region, the Agulhas Bank, which falls
Although not strictly falling within the boundaries of the Orange-Vaal
entirely within the South African portion of the region, nevertheless has
Basin, the Gauteng Province is nevertheless an important recipient of
transboundary signifi cance, as there are strong biological interactions
REGIONAL DEFINITION
13
Elevation/
Depth (m)
4 000
2 000
Luanda Lagoon
1 000
Luanda
500
Cuanza
100
0
Cua
nza
-50
Angola
-200
-1 000
-2 000
C
u
n
e
ne
Baia dos Tigres
Cunene
Walvis Bay
Sandwich Harbour
Botswana
Namibia
Pretoria
Johannesburg
Vaal
South Africa
Orange
O
O
lif
ra
Lesotho
a
n
n
g
t
e
s
Groot-Berg
Langebaan Lagoon
Cape Town
0
500 Kilometres
ę GIWA 2005
Figure 1
Boundaries of the Benguela Current region.
with transboundary implications between the Agulhas Bank and the
currently runs along the northern (Namibian) bank of the river, a
Benguela Current.
situation which results in constant confl ict between the two countries
regarding "ownership" and use of the River. In a region where water is
Two major transboundary river systems are identifi ed within the
scarce, the transboundary implications of these shared watercourses
region. These include the Cunene River, which runs along the national
are profound.
border between Namibia and Angola, and the Orange-Vaal drainage
system. The Orange-Vaal system contains several transboundary
Five estuaries in the region are considered to be of transboundary
features. Lesotho, entirely enclosed within South Africa, falls entirely
signifi cance. These include the Berg River Estuary (South Africa), the
within the drainage basin of this system, and is the source of several
Olifants River Estuary (South Africa), the Orange River Mouth (South
of the tributaries of this system. This system has further transboundary
Africa and Namibia), the Cunene River Mouth (Namibia and Angola),
signifi cance in that the Orange River runs in part along the national
and the Cuanza River Mouth (Angola). These estuaries provide nursery
border between South Africa and Namibia. The geo-political boundary
areas for a number of fi sh stocks which are shared between the coastal
14
GIWA REGIONAL ASSESSMENT 44 BENGUELA CURRENT


countries of the region, and are thus of transboundary signifi cance
is even lower, reaching only less than 50 mm annually. The Namib
within the region. The transboundary signifi cance of these estuaries is,
Desert extends into southern Angola, and rainfall in this country ranges
however, even more geographically far-reaching, as they provide critical
from less than 50 mm in the south to approximately 300 mm/year in
feeding grounds for migratory palearctic wading birds.
the wetter northern coastal areas around the capital of Luanda (Encarta
2004). Rainfall on the coastal plain is characterised by high inter-annual
In addition to the estuaries, fi ve coastal lagoons in the region are
variability. This low rainfall results in desert and semi-desert conditions
considered of transboundary importance. These include Langebaan
on the coastal plains. Vegetation is generally sparse and low, and
Lagoon (South Africa), Sandwich Harbour and Walvis Bay Lagoon
adapted to xeric conditions (Figure 2). There is almost no natural
(Namibia), and Baia dos Tigres and the Luanda Lagoon (Angola). The
standing water on the coastal plains. Few permanent rivers traverse
primary justifi cation for including these as transboundary waters is
the coastal plains to enter the Benguela Current, and those that do have
that they support large numbers of palearctic migratory birds which
their origins in the wetter escarpment and/or plateau regions.
use these as feeding grounds during their non-breeding seasons.
Five ephemeral pans were also considered to be of transboundary
Landcover type
importance, as they provide important feeding areas for both Greater
Barren
Cropland
Luanda
and Lesser Flamingos, which are inter-African migrants. These include
Forest
Cuanza
Developed
Rocher Pan, Wadrif and Brandvlei pans in South Africa, and Sossusvlei
Grassland
z
a
na
Tundra
and Etosha pans in Namibia.
Angola
u
C
K
Wetland
unen
Savanna
e
Shrubland
Unclassified
Kunene
Water
Physical characteristics
Namibia
Botswana
The Benguela Current region is characterised by the presence of fl at
Pretoria
Johannesburg
coastal plains ranging in width from approximately 50 to 150 km. Further
Vaal
Oran
O
O
inland, the coastal plains rise abruptly up a mountainous escarpment
ge
lif
ra
a
n
n
Lesotho
g
South Afritsca
e
to an inland plateau with an average elevation of between 1 000 and
Groot-Berg
1 500 m (Encarta 2004).
Cape Town
ę GIWA 2005
The Benguela Current is one of the world's four major coastal upwelling
Figure 2
Land cover in the Benguela Current.
systems (BCLME 1999). This highly productive, cold-water system is
(Source: based on USGS 2002)
bounded at both its northern and southern extremities by warm-water
systems (BCLME 1999). To the south the Benguela interacts with the warm
A mountainous escarpment rises from the coastal plain to the plateau.
Agulhas Current, and to the north with the Angola Current at the Angola/
On the plateau, average annual rainfall is in the region of 200 to 600 mm,
Benguela Front which typically migrates between 14░ and 17░ S on a
decreasing dramatically along an east-west gradient (Encarta 2004).
seasonal basis. The northern extremity of this interaction is approximately
Much of the plateau area falling within the Benguela Current region is
at the northern border of Angola (Hampton et al. 1998). Upwelling in the
arid and/or desert, including the Karoo basins of South Africa, and the
Benguela reaches its greatest intensity near LŘderitz in southern Namibia,
Kalahari Basin which spans South Africa, Botswana and Namibia (none
but a number of smaller upwelling cells are also recognised.
of the plateau areas of Angola are represented in the Benguela Current
region). The major permanent and transboundary rivers of the region,
The climate of the region is infl uenced primarily by the cold, northwards-
including the Cuanza River, Cunene River, Orange River and Vaal River,
fl owing Benguela Current, and the geo-morphology. Onshore air fl ow
arise in the wetter easterly areas of the plateau (Figure 3).
accumulates little moisture from the cold Benguela Current. The coastal
plains consequently receive very little rainfall and are arid or semi-arid.
The coastline of the region is highly exposed to wave action from
South Africa's western coastal plains, which constitute approximately
the prevailing southwesterly, wind-driven swells of the Benguela
21% of the country's land area, receive less than 200 mm of rainfall
Current, and few natural sheltered bays exist. Where these are present
annually (Encarta 2004). In Namibia, rainfall in the coastal Namib Desert
(including, but not exclusively, False Bay, Table Bay and Saldanha Bay in
REGIONAL DEFINITION
15
Socio-economic characteristics
Humidity
Humid
Dry sub-humid
The Benguela Current region contains four countries, including Angola,
Hyper-arid
Luanda
Namibia, South Africa and Lesotho. Each of these countries has distinct
Arid
Cuanza
Semi-arid
socio-economic characteristics, and the countries are thus presented
Lobito
Benguela
e
Baia Farta
individually. The population density in the region is shown in Figure 4.
nen
u
C
Angola
Cunene
Luanda
Namibia
Cuanza
Botswana
Swakopmund
Windhoek
z
a
n
Angola
a
uC
Pretoria
Cun
LŘderitz
e
Johannesburg
ne
l
Vaa
Orange
O
Cunene
ran
Lesotho
g
South Africa
e
GrootOli-fBeantrgs
Cape Town
A g u l h a s
B a n k
Namibia
BotswanaPretoria
ę GIWA 2005
Johannesburg
Figure 3
Humidity in the Benguela Current.
Vaal
Population density
(Source: Deichmann & Eklundh 1991)
Orang
O
e
O
l
(persons/km2)
if
ra
a
n
n
Lesotho
g
<1
South Afritsca
e
1-2
South Africa, LŘderitz and Walvis Bay in Namibia, and Namibe in Angola)
Gro
3-5
ot-Berg
6-10
they act as nodes for urban development. The south is characterised
11-100
Cape Town
>100
by alternating rocky shore and sandy beaches, giving way to almost
Ř GIWA 2005
entirely sandy shore in Namibia and along the Angolan coast. Along the
Figure 4
Population density in the Benguela Current region.
(Source: ORNL 2003)
coast of the Namib Desert, the combination of wave and wind-action
results in migrating sand-spits which form unstable sheltered bays or
lagoons, of which Walvis Bay in Namibia is an example.
Angola
The socio-economic climate of Angola has for the past 30 years been
The three coastal countries of the Benguela Current region have an
heavily infl uenced by continual civil war since its independence from
estimated total coastline of some 6 030 km, and EEZ of 1.9 million km2.
Portugal in 1975. The long-standing civil war had profound negative
Assuming that approximately half of the coastline and EEZ of South
eff ects on all aspects of human life in Angola, and this legacy continues.
Africa fall within the region results in the estimated total coastline of
Approximately 6 million people live in the coastal area (UNEP 2005).
the region being 4 590 km, and the EEZ being 1.4 million km2 in extent
Populations of the three cities of Lobito, Benguela and Baia Farta, situated
(Table 1).
on the coast, trebled in the 20 years between 1970 and 1990, while the
population in Namibe in the south more than doubled in just six years
between 1984 and 1990 (UNEP 2005). The capital city of Luanda, situated
Table 1
Geographical characteristics of the coastal countries in
on the coast, is home to some 20% of the estimated total population
the Benguela Current region.
of 13.7 million people (SADC 2003). The portion of the country that lies
Coastline
Continental shelf
EEZ
Country
(km)
(km2)
(km2)
within the Benguela Current region houses approximately 48% of the
Angola
1 650
51 000
330 000
total population (Table 2). Population density is 11 people/km2. Of the
Namibia
1 500
111 000
504 000
four countries in the region, Angola has the highest population growth
South Africa
2 880
143 400
1 050 000
rate at 1.97%, and the lowest literacy rate, estimated at only 40%. The
Total for the countries
6 030
305 400
1 884 000
population consists primarily of Africans (75%), with small portions of
Total for the Benguela Current region *
4 590
233 700
1 359 000
the population being made up of Europeans (1%), people of mixed
Note: * The estimated total for the Benguela Current region includes the entire coastline,
African and European background (2%), and others (22%) (CIA 2003). In
continental shelf and EEZs of Angola and Namibia, and half of each of these for South Africa.
(Source: SADC 2002)
addition to the indigenous population, Angola also provides a haven
16
GIWA REGIONAL ASSESSMENT 44 BENGUELA CURRENT
Table 2
Socio-economic characteristics for the Benguela Current region.
Population in the Population in the
Population of
Population
Population
Country area
Urbanisation
Literacy rate
GDP per capita
Country
country
region
the country in
growth
density
(km2)
(%)
(%)
(USD)
(million)
(million)
the region (%)
(%)
(people/km2)
Angola
13.7
6.6
48
2.0
1 247 000
11
ND
40
656
Namibia
1.9
0.6
32
1.5
842 269
2
27
76
1 667
South Africa
44.9
15.5
34
0
1 221 000
37
30
82.2
3 714
Lesotho
2.2
1.8
80
0.2
30 355
72
17
78
368
Note: ND=No Data.
(Source: SADC 2003, CIA 2003, Landscan 2001)
Table 3
GDP by sectors in
to refugees from its neighbouring
Being largely a desert country,
Table 4
GDP by sectors in
Angola 2001.
country, the Democratic Republic
water is an important resource
Namibia 2003.
Sector
GDP (%)
of the Congo. At the same time,
for Namibia. Namibia has no
Sector
GDP (%)
Oil and gas
54
many Angolans live as refugees
permanent rivers entirely
Government services
21
Trade and commerce
15
in neighbouring states.
her own - all are shared with
Taxes less subsidies
13
Non-tradable services
10
neighbouring countries (UNEP
Manufacturing
11
Agriculture, forestry and fishing
8
The economy of Angola has been
2005). Not surprisingly, there
Wholesale and retail trade
10
Diamonds
6
severely disrupted by 30 years of
are currently several water-
Real estate and business services
9
Manufacturing
4
civil war, and GDP per capita is
related disputes between
Transport and communications
8
estimated at 656 USD (Table 2).
Namibia and her neighbours.
Construction
3
Mining and quarrying
7
(Source: SADC 2005)
By far the largest contributor to
There is currently some
Agriculture and forestry
5
the economy is the production
dispute between Namibia
Fishing and fish processing on board
4
of oil and gas off the coast, contributing 54% of the total GDP in 2001
and Botswana over the
Construction
3
(Table 3). Agriculture, forestry and fi shing contributed 8% in 2001, and of
construction of the Okavango
Financial intermediation
3
total agricultural production, fi sheries accounts for only a few percent,
hydroelectric scheme at Popa
Electricity and water
2
and is thus not an important component of the Angolan economy
Falls, with Angola over the
Other
2
(SADC 2003, 2005).
construction of an additional
Hotels and restaurants
2
dam on the Cunene River
Private and community services
<1
Namibia
which forms a boundary
(Source: SADC 2005)
Namibia is primarily a desert country, and has the lowest population
between these countries,
density (2 people/km2) of the four countries within the Benguela
and with South Africa regarding the exact location of the boundary
Current region (Table 2). An estimated 27% of the total population
between the two countries in the Orange River. There are also ongoing
of 1.9 million people live in urban centres, with some 10% of the
discussions between Namibia and South Africa regarding the exact
population residing within the capital city of Windhoek (SADC 2003). An
location of the boundary between their maritime zones.
estimated 32% of the total population resides within the area defi ned by
the Benguela Current region. The literacy rate is estimated at 76%. The
South Africa
population consists primarily of Africans (87.5%), with small portions of
South Africa has an interesting socio-economic history, having recently
the population being made up of Europeans (6%), and people of mixed
become free of the apartheid regime which eff ectively excluded the
African and European background (6.5%) (CIA 2003). Namibia gained
majority of the population from being active, participating citizens.
independence from South Africa in 1990.
Since the change to democracy in 1994, many reforms have taken place
in attempts to normalise the country. These reforms are still taking place
Namibia has a relatively diverse economy that does not rely heavily
and South Africa can still be considered a country in transition.
on only one sector as does that of Angola. Fishing and fi sh processing
contribute a total of 4% to the GDP (Table 4). GDP per capita is estimated
Of the four countries in the region, South Africa has the largest
at 1 667 USD (Table 2).
population, estimated at 44.9 million people of which 15.5 million
in the region (Table 2). The population is spread over an area of
REGIONAL DEFINITION
17
1.2 million km2, resulting in a population density of 37 people/km2.
region, 72 people/km2 (Table
2). Table 6
GDP by sector in
Lesotho 2003.
Urbanisation is estimated at 30%. Of the urbanised population,
Almost the entire population
Sector
GDP (%)
approximately half reside in the two major coastal cities of Cape Town
lives within the catchment of
Government and services
33
and Durban, while the other half reside in the two major cities of Pretoria
the Orange-Vaal drainage basin.
and Johannesburg, located within the catchment of the Orange-Vaal
Urbanisation is estimated at
Manufacturing 18
drainage basin (SADC 2003). Population growth is low, at only 0.01%.
17%, with only 7% of the total
Agriculture
17
This fi gure includes an adjustment made for the eff ects of early deaths
population (or 150
000
people)
Building and construction
17
caused by the severe HIV/AIDS situation in the country. The literacy rate
living in the capital and major city
Wholesale and retail trade
8
is relatively high, at 82.2%. The population consists primarily of Africans
of Maseru (SADC 2003). The literacy
Electricity and water
6
(75.2%), with smaller proportions of the population being made up of
rate is relatively high, at 78%. The
Mining and quarrying
<1
(Source: SADC 2005)
Europeans (13.6%), people of mixed African and European background
population consists almost entirely
(8.6%), and Asians (2.6%) (CIA 2003).
of Africans of the Sotho nation
(99.7%), with the remaining 0.3% being made up by Europeans, Asians
South Africa has the strongest and most diverse economy of the four
and others (CIA 2003).
countries in the Benguela Current region. GDP per capita is estimated
at 3 714 USD (Table 2), and a number of sectors contribute to the GDP
The economy of Lesotho has experienced some setbacks in the last
(Table 5). Agriculture, forestry and fi shing contribute a total of 4% to
decade due to civil unrest since its return to democracy in 1993. The
the GDP. Fisheries are largely marine, producing an estimated 600 000
situation does, however, appear to have stabilised over the last few
tonnes of fi sh each year, and
years, and the nation is working to rebuild its economy and to reduce
Table 5
GDP by sectors in
South Africa 2003.
employing some 27
000 poverty. GDP per capita is the lowest of the four countries in the
Sector
GDP (%)
people (SADC 2003, 2005).
Benguela Current region, estimated at 368 USD (Table 2). One of the
Manufacturing
20
largest contributors to the GDP in 2003, and previous years, was the
Much of South Africa is arid
building and construction sector (Table 6), much of which is related to
Finance, real estate, business activities
20
and semi-arid, and water is
the Lesotho Highlands Water Project (SADC 2005).
Trade, hotels and restaurants
14
thus an important natural
General government
13
resource. Not surprisingly,
International agreements, national policy and
Transport and communications
12
there are several water-
legal frameworks
Mining and quarrying
5
related disputes between
A number of international agreements relating to the environment
Agriculture, forestry and fishing
4
South Africa and its and its protection are in place in countries within the Benguela Current
Electricity, gas and water
3
neighbours as mentioned
region (Annex III). There are also substantial national policies and legal
Construction
3
above. There are also disputes
frameworks aimed at protection of the natural environment in place
Imputed financial service charges
3
within the country over water
in these countries (Annex IV). This national legislation covers broad
Other producers
3
(Source: SADC 2005)
resources.
issues surrounding healthy and unpolluted natural environments,
water and sanitation, but also covers more specifi c issues such as
Lesotho
the exploitation and management of fi sh and other living resources,
Lesotho is the smallest country within the Benguela Current region,
mandatory environmental impact assessment, and protection of the
and is totally surrounded by South Africa. The total estimated
environment from pollution, oil and gas exploration and exploitation,
population of 2.2 million people live within and area of 30 355 km2,
and mining activities.
resulting in the highest population density of the four countries in the
18
GIWA REGIONAL ASSESSMENT 44 BENGUELA CURRENT
Assessment
This section presents the results of the assessment of the impacts of each of the fi ve predefi ned GIWA concerns i.e. Freshwater shortage,
Pollution, Habitat and community modifi cation, Unsustainable exploitation of fi sh and other living resources, Global change, and
their constituent issues and the priorities identifi ed during this process. The evaluation of severity of each issue adheres to a set of
predefi ned criteria as provided in the chapter describing the GIWA methodology. In this section, the scoring of GIWA concerns and
issues is presented in Table 7.
Table 7
Scoring tables for the Benguela Current region.
T
T
C
C
Increased impact
A 0 No
known
impact
A
2 Moderate
impact
Assessment of GIWA concerns and issues according
The arrow indicates the likely
IMP
IMP
T
T
No changes
C
C
to scoring criteria (see Methodology chapter).
direction of future changes.
A 1 Slight
impact
A
3 Severe
impact
IMP
IMP
Decreased impact
a
c
t
s
i
t
y
i
t
y
n
a
c
t
s
n
Benguela Current
t
a
l
p
*
*
p
*
*
a
c
t
s
u
t
a
l
a
c
t
s
u
e
n
p
m
Benguela Current
e
n
p
m
m
i
c
i
m
m
m
o
Score
m
i
c
i
m
o
Score
Freshwater component
n
i
m
y
*
*
*
n
i
m
y
*
*
*
c
t
s
m
m
o
c
t
s
Marine component
c
t
s
o
c
t
s
v
i
r
o
n
e
r c
n
e
r c
o
a
l
t
h
a
l
t
h
t
h
erall
v
i
r
o
o
t
h
erall
En
impa
Ec
He
O
impa
Ov
Priorit
En
impa
Ec
He
O
impa
Ov
Priorit
Freshwater shortage
3*
3
2
2
2.5
1
Pollution
2*
3
2
1
2.3
2
Modification of stream flow
3
Microbiological pollution
2
Pollution of existing supplies
3
Eutrophication
1
Changes in the water table
3
Chemical
1
Pollution
3*
3
2
1
2.5
2
Suspended solids
2
Solid waste
2
Microbiological pollution
3
Thermal 1
Eutrophication
3
Radionuclides
1
Chemical
3
Spills
3
Suspended solids
2
Solid waste
3
Habitat and community modification
2*
2
2
2
2.3
2
Thermal 1
Loss of ecosystems
1
Radionuclides
3
Modification of ecosystems
2
Spills
3
Unsustainable exploitation of fish
2*
2
2
2
2.1
1
Habitat and community modification
3*
2
2
2
2.4
2
Overexploitation
3
Loss of ecosystems
3
Excessive by-catch and discards
1
Modification of ecosystems
3
Destructive fishing practices
2
Global change
2*
0
1
0
1.4
2
Decreased viability of stock
0
Impact on biological and genetic diversity
2
Changes in hydrological cycle
2
Sea level change
-
Global change
1*
0
1
0
1.3
2
Increased UV-B radiation
2
Changes in hydrological cycle
2
Changes in ocean CO source/sink function
-
Sea level change
1
2
Increased UV-B radiation
0
*
This value represents an average weighted score of the environmental issues associated
to the concern.
Changes in ocean CO source/sink function
1
2
** This value represents the overall score including environmental, socio-economic and
likely future impacts.
*** Priority refers to the ranking of GIWA concerns.
ASSESSMENT
19
The enormous diversity of the Benguela Current region adds an
Table 8
Rainfall and evaporation in the Benguela Current region.
additional level of complexity to an assessment which attempts to
Rainfall
Deficit/Gain
Country
(mm/year)
Evaporation
provide a general view for the region as a whole. No justifi cation
(mm/year)
(mm/year)
Average
Range
could be found for treating any of the transboundary aquatic systems
Angola
800
25-1 600
1 300-2 600
-1 275 to -1 000
identifi ed as systems entirely discrete from the other transboundary
Lesotho
700
500-2 000
1 800-2 100
-1 300 to -100
aquatic systems of the region. The assessment for the Benguela
Namibia
250
10-700
2 600-3 700
-3 000 to -2 590
Current region was thus conducted on the entire region. This did
South Africa
500
50-3 000
1 100-3 000
-1 050 to 0
serve to create some confusion within the assessment process, and
Note: Deficit/Gain indicates the discrepancy between rainfall and evaporation. Please note that
these figures are for entire countries, not only for the portions of these countries falling within the
the impacts of an issue would often be entirely opposite within the
Benguela Current region.
two diff erent aquatic components (freshwater and marine systems) of
(Source: Snaddon et al. 1999)
the region, or would vary enormously from place to place. The GIWA
guidance of presenting the worst case scenario for an issue was used
basin transfers. This has caused dramatic changes to the fl ow and
throughout the assessment. In many cases, of course, the worst case
fl ood regimes of many rivers in the region and their related estuaries.
scenario does not necessarily hold true for the entire region. Under
The coast is also strongly infl uenced by the rivers that bring water,
these circumstances, justifi cation has been provided for the worst
sediments, nutrients and pollutants to the coast. One of the most
case scenario without necessarily indicating every example in which
important threats to estuaries is the reduction of freshwater infl ow as
this does not hold true. In order to illustrate this, an assessment of
the result of the construction of dams and direct abstraction of water.
severe pollution from spills into the marine environment, for example,
does not indicate that the entire marine environment of the region is
Total water available in South Africa equates to about 50 km3/year,
permanently covered in oil pollution. It does, however, indicate that the
approximately 10% of the water reserves of the southern African
environmental, economic, health and social impacts of spills, which may
region. Currently, about 84% of total available water is in use (Table 9)
vary temporally and spatially within the region, are severe.
(Snaddon et al. 1999, Conley 1995). The annual water defi cit may
reach an estimated 1 050 mm/year (Heyns et al. 1994, Snaddon et al.
The large diff erences in the environmental and socio-economic issues
1999). There is a high inter-annual variability in rainfall (Davies & Day
occurring in marine and freshwater environments in the Benguela
1998). In Namibia, total water available equates to about 9 km3/year,
Current region lead to the concerns of Pollution, Habitat modifi cation
approximately 2% of the southern African total (Snaddon et al. 1999,
and Global change being assessed separately for these environments.
Since freshwater fi sheries are not highly signifi cant in the region, these
Table 9
Water availability and consumption in the southern
were omitted, and the assessments are thus only concerned with
African countries.
Total water
Share of total
unsustainable exploitation of marine living resources.
Share of southern
Total water use
Country
available
available water
African water (%)
(million m3/year)
(million m3)
used (%)
Angola *
158 000
32
480
2
Zambia
96 000
19
360
2
Freshwater shortage
Tanzania
76 000
15
480
2
Mozambique
58 000
11
760
3
T
C
A
South Africa *
50 000
10
19 040
84
IMP
Freshwater component
Zimbabwe
23 000
5
1 220
5
The climate over much of southern Africa ranges from semi-arid to
Namibia *
9 000
2
ND
ND
hyper-arid with only a few relatively humid parts where rainfall greatly
Botswana
9 000
2
90
<1
exceeds 500 mm annually (Davies & Day 1998). Over the Benguela
Malawi
9 000
2
160
1
Current region evaporation is high, exceeding the limited and highly
Swaziland
7 000
1
ND
ND
variable rainfall (Table 8). The naturally low and variable rainfall, together
Lesotho *
4 000
1
50
<1
with the water demand of an increasing population and the related
Total
499 000
100
22 640
100
demand for freshwater caused by industrialisation, agriculture and
Notes: ND = No Data.
urbanisation has led to radical modifi cations of available surface and
* Countries within the Benguela Current region. Please note that these figures are for entire
countries, not only for those portions falling within the Benguela Current region.
groundwater in the form of impoundments, abstraction and inter-
(Source: Snaddon et al. 1999)
20
GIWA REGIONAL ASSESSMENT 44 BENGUELA CURRENT
Conley 1995). Evaporation is high and Namibia's Eastern National
Orange-Vaal system
Water Carrier, for example, which is an open canal (Omatako Canal
The Orange-Vaal drainage basin is 1 million km2 (Department of Water
Inter-basin Transfer) evaporates 70% of water in transit (Petitjean &
Aff airs and Forestry 2005) and by far the largest catchment in the region.
Davies 1988). The resultant water defi cit due to evaporative losses
A clear trend of decreasing fl ow has been shown in the Orange River
for this country is in the region of 2 590 to 3 000 mm/year (Heyns et
between 1935 and 1997 such that annual fl ow gaugings towards the
al. 1994, Snaddon et al. 1999). The only permanent rivers of Namibia
end of this period are less than 50% of those at the beginning of this
which fall within the Benguela Current region are the Cunene River
time series (Department of Environmental Aff airs and Tourism 2000).
(north) and the Orange River (south), both of which are transnational
In the Orange-Vaal drainage system fl ows are modifi ed by turbines
boundaries. The remaining of Van Der Kloof Dam (originally PK Le Roux Dam) to the extent that
Table 10
Water use by
rivers are all ephemeral. There
seasonal diff erences of fl ow entering Gariep Reservoir (originally HF
sector in Namibia.
is thus a strong reliance on
Verwoerd Dam) upstream are nullifi ed (54% in summer, 46% in winter)
Sector
Water use (%)
groundwater and inter-basin (Cambray et al. 1986, Davies & Bergh 1999). The Vaal River has 16
transfers. Reservoirs suff er
major dams, while inter-basin transfer schemes from the Orange River
Irrigation
49
vast evaporative losses (Agula
(Senqu, Senquenyane and Malibamatso in Lesotho), Tugela, Usutu and
Urban (all inclusive)
24
2002). Namibia's water supply
Komati augment the supply to this river. Water is also exported from
Livestock
15
can thus be considered critical.
the Vaal River through inter-basin transfers to the Limpopo, Olifants
Major damage has been done
and Komati rivers. Together with the Orange River the Vaal River is the
Mining
7
to ephemeral rivers of Namibia
most modifi ed river in the Southern African Development Community
Rural domestic
5
(Heyns et al. 1988, Jacobsen et al.
(SADC) region (Braune & Rogers 1987).
Wildlife and tourism
<1
1995). The largest sectoral water
(Source: International Rivers Network 2004)
user in Namibia is irrigation
In the Vaal system in the late 1980s, the return fl ows from the urban/
(Table 10).
industrial sector were already 55% of supply, thereby exceeding the
natural mean annual run-off of 300 million m3/year (Braune & Rogers
Total water available in Angola is about 158 km3/year, approximately
1987). Drought in the early 1980s led to construction of pump/barrages
32% of the total water available in southern Africa. The proportion of
reversing the fl ow of the Vaal River. These barrages washed away during
total available water in use is about 2% (Conley 1995, Snaddon et al.
later fl oods. This scheme was known as the Grootdraai Emergency
1999). Water defi cit due to evaporative losses is in the region of 1 000
Augmentation Scheme (1983). Completed in 20 weeks, it involved seven
to 1 275 mm/year (Heyns et al. 1994, Snaddon et al. 1999). Total water
earth compacted weirs and pumps, and covered 208 km of reversed
available in Lesotho is estimated at 4 km3/year, roughly 1% of southern
fl ow to Grootdraai Dam. In 1987 an additional pipeline was constructed
Africa's available water. Total annual water usage is approximately 0.2%
for emergency supplies of coolant water to coal-fi red power stations in
of the total available (Conley 1995, Snaddon et al. 1999). Evaporation
Gauteng (Department of Water Aff airs and Forestry 1991).
exceeds rainfall, leading to a water defi cit of between 100 and 1 300
mm/year (Heyns et al. 1994, Snaddon et al. 1999).
Inter-basin transfers from the headwaters of the Orange River in Lesotho
to the Vaal River will reduce the yield of the Orange River Project (inter-
Environmental impacts
basin transfer from Lake Gariep to the Fish and Sundays rivers in the
Modifi cation of stream fl ow
Eastern Cape) by more than 1.5 km3/year, whilst doubling the yield of
The environmental impacts of modifi cation of stream fl ow are assessed
the Vaal River (Davies et al. 1993). Completion of the Lesotho Highlands
as severe in the region. Many rivers in the region are modifi ed by
Water Project will result in 75% of the water in the Vaal River being
impoundments and many are overabstracted, resulting in a signifi cant
derived from other catchments (Snaddon et al. 1999). The Orange-
decrease in river fl ow. Up to a 75% reduction in stream fl ow has been
Vaal system contributes 22% of South Africa's water resources, but
recorded, this being in the Berg River, one of the few permanently
has no overarching basin authority (Cambray et al. 1986, Davies &
open estuaries in the region (Berg 1993). The key river systems of
Bergh 1999).
transboundary signifi cance in the region include the Orange-Vaal
system, Berg River, Olifants River, Cunene River and Cuanza River. A
Berg River
brief description of the extent to which each has been modifi ed (with
Historical fl ow fi gures for the Berg River for 1928 to 1988 show periods
the exception of the Cuanza River) is provided below.
of reductions in stream fl ow return of >75% due to human abstractions.
ASSESSMENT
21
The Berg River had a mean annual run-off to the estuary of 903 million
been highlighted as a hotspot of freshwater fi sh diversity in South Africa
m3/year compared to the present day fi gure of 693 million m3/year,
(Skelton 1993). It supports 10 indigenous fi sh species of which eight
which represents a 23% mean annual reduction. Flows in all months
are endemic to the system. Intensifi cation of agricultural activity in the
are aff ected, but summer losses are particularly signifi cant for the
catchment has precipitated alteration to the fl ow regime of the river
biota (Berg 1993, Ninham Shand Inc. 1992). The previously mobile
though, and to some geomorphological degradation. These eff ects,
Berg River Estuary Mouth was moved and hardened in 1966, changing
as well as those caused by populations of alien fi sh being introduced
tidal amplitude and resulting in higher seawater intrusion onto the
into the catchment in the 1930s and 1940s, have been implicated in
fl oodplain. Impoundments prolong river low fl ows, increasing salinity
the serious decline evident amongst indigenous fi sh species in the
intrusion and reducing sediment dynamics. The planned Skuifraam
Olifants River. The spread of alien fi sh is assisted by dams that have
Dam will reduce fl ushing and scouring, and lead to possible closure
been constructed in the mainstream of the river (Impson 1997). The
of the mouth (Huizinga et al. 1993, Morant et al. 1997). Berg River
dams represent impassable barriers to the migration of fi sh, and have
fl oodplain vegetation includes 10 diff erent communities, including
substantially increased the proportion of lentic and lotic conditions in
fi ve marsh types, two distinct pan communities, and three fl oodplain
the river, and altered the fl ow regime of the downstream reaches.
communities. It represents a unique system between southern Angola
and St Lucia in KwaZulu-Natal on the east coast of South Africa.
Cunene River
Impoundment and mouth entrainment are considered to be the most
The Cunene River is about 1 000 km long and has a drainage basin
serious threats to the community structure (McDowell 1993).
of about 106 500 km2. The surrounding environment of the river is
characterised by a dry climate, low rainfall, low annual run-off and low
Berg River Estuary benthic invertebrate communities have decreased over
sediment production. The river itself is already highly regulated through
the past 40 years. Major contributing factors and threats include reduced
various dams and weirs including the Gove Dam (completed in 1973),
fl ows, increased desiccation, increased salinities due to impoundment
the Matala weir (completed in 1954), the Calueque weir (completed in
and mouth entrainment, and possibly pollution (Hockey 1993). The Berg
1977) and the Ruacana hydropower station (completed in 1979). The
River estuarine fi sh communities contain 77% of total coastal species
Gove Dam was built with the purpose of downstream river regulation
(compared to 49-52% for other coastal areas). The Berg River has a higher
but has long since been in-operational because of war damages. The
percentage of residents (23% versus 4-18%), dependent species (27%
daily fl ow regime of the river has been substantially modifi ed as a
versus 9-25%) and partially dependent species (30% versus 18-27%) than
result of the Ruacana diversion weir and water abstraction, causing
other estuaries in the region. Flow reduction in this system will have more
daily water level fl uctuations of 30 to 40 cm at Epupa. Another scheme
impact on coastal fi sheries than anywhere else in South Africa. The Berg
has been proposed for the lower portion of the river, the Lower Cunene
River is one of only two permanently open estuarine nursery areas in the
Hydropower Scheme, and in spite of strong environmental opposition
Namaqua Marine Biogeographical Province (Bennett 1993). An important
may still come into being (Members of the GIWA Task team pers.
sports fi shery is developing on the estuary, but the commercial fi shery
comm.). Very little development exists in the Cunene catchment, and
is overexploited. This, together with increased salinity through reduced
the water is thus of exceptionally good quality.
fl ows, makes the industry no longer viable (Schrauwen 1993). 127 species
of birds have been recorded in the Berg River wetlands since 1975. In
The Cunene River has a diverse freshwater fi sh fauna consisting of
terms of regional importance, the Berg River fl oodplain rates second, only
64 species, seven of which are endemic to this system. The Ruacana
slightly lower than Walvis Bay, but above Langebaan Lagoon and St Lucia
and Epupa Falls form large physical obstructions but do not restrict
(KwaZulu-Natal, South Africa). In 1992, bird populations on the estuary
the distribution of species. Despite the alterations to the fl ow regime,
were estimated to number 46 000 individuals, including individuals from
sensitive fi sh species are still maintained, and the natural fl ow-related
fi ve IUCN Red Data species.
processes are still regarded as intact (NAMANG Consortium 1998). A
total of 379 bird species are recorded in the Lower Cunene, of which 62
Olifants River
are listed as IUCN Red Data species. The majority of these are breeding
The Olifants River drains a catchment of about 45 600 km2 making it
residents (62%).
the second largest river on the South African west coast. It is one of
the few perennial rivers in the arid western parts of South Africa. The
Pollution of existing supplies
Olifants River and estuary seldom dry up and therefore form one of
Of the three countries which make up the bulk of the region, South
the few perennial, calm waters areas in the region. The river itself has
Africa is by far the largest contributor to overall organic water pollution.
22
GIWA REGIONAL ASSESSMENT 44 BENGUELA CURRENT
However, when this fi gure is converted to kilograms of emissions per
scheme), where the water table has dropped from between 0 and 5 m
worker per day, the highest fi gure is attributed to Namibia (World Bank
to between 10 and 11 m below river bed level (Petitjean & Davies 1988,
2001). Other pollution problems in the region's freshwater systems
Snaddon et al. 1999). Of further concern is the fact that ephemeral
include chemical pollution, solid waste, radionuclide pollution and
rivers and groundwater support 50% of Namibia's population across
spills. In the region as a whole, pollution of existing freshwater resources
80% of the country, placing enormous stress on water tables (Heyns
is considered severe.
et al. 1988).
The Vaal River in South Africa has severe pollution and eutropication
South Africa had an estimated 197 810 existing boreholes in 1999
problems. The problems stem from agricultural (155 000 ha under
(Department of Environmental Aff airs and Tourism 2000). An additional
irrigation in 1975 which equates to 42% of South African total agricultural
50 000 are estimated to be drilled annually, although the majority of
production), urban (sewage effl
uent; 42% of population in 1975) and
these yield little or no water (Department of Environmental Aff airs
mining (79% of mining production in 1975) return fl ows (Braune &
and Tourism 2000). Extraction of groundwater has increased from
Rogers 1987). Of the return fl ows to the Vaal Barrage (37 000 m3/day in
an estimated 1.8 to 2.0 km3/year in the past 20 years, with irrigation
the 1980s), about 75% is sewage effl
uent, 11% from industry, and 14%
agriculture accounting for approximately 78% of this usage (Department
mining effl
uent (Oliveira 1986).
of Environmental Aff airs and Tourism 2000). The cumulative impacts
of the extraction of groundwater can only be guessed at, although
In the early 1980s mine discharges to the Vaal River amounted to an
groundwater failure has been known to occur in some areas (Basson
average of 60 000 m3/day (Oliveira 1986). Intense mining in the Vaal
et al. 1997)
catchment has lead to salinities of 75 to 500 mS/m (Van Vliet 1986,
Viljoen & Van der Merwe 1986). Northern tributaries of the Vaal River
Socio-economic impacts
have elevated total dissolved solids (>500 mg/l) predominantly from
Economic impacts
Sulphate (SO ), Sodium (Na) and Chlorine (Cl) (Van Vliet 1986). Sulphuric
Most sectors are aff ected by freshwater shortages, including agriculture,
4
acid pollution is also evident in the Vaal drainage basin from acid mine
mining, fi shing, and tourism, in an area which is already water-stressed.
run-off (Harrison 1958, Davies et al. 1993).
The economic impacts of this concern are therefore considered severe
by the GIWA experts. The costs of building dams, inter-basin transfer
Impoundment of the Vaal River, eutrophication and injection of
schemes, alternative water sources (especially desalination plants), and
reservoir plankton has led to signifi cant increases in pest blackfl y
water treatment are high. There is a mismatch between the geography
species (Simuliidae) to epidemic proportions (Chutter 1963, 1967, 1968,
of supply and demand, which creates additional costs. In addition, in
De Moor 1982, 1986). Blindness in sheep (Chlamydia sp., protoctistan
the more arid parts of the region there is a mismatch between peak
parasite) and Rift Valley Fever (viral) are diseases commonly spread by
demand and supply (e.g. the major tourist season coincides with the
blackfl ies (De Moor 1986). DDT used in the Vaal River to control epidemic
driest time of year).
outbreaks during the 1960s led to eradication of the indigenous insect
fauna and rapid recolonisation by blackfl y larvae after use (Howell &
The major economic impacts of modifi cation of stream fl ow are
Holmes 1969).
the costs associated with the construction of dams and inter-basin
transfer schemes to supply water. The costs of alternative sources of
Changes in the water table
water (especially by desalination) are also high. Pollution results in
Impacts related to changes in the water table are considered severe
economic impacts related to the costs of treatment of polluted or
in the Benguela Current region. The problem revolves primarily
contaminated water, and the costs of alternative water supplies. The
around the use of fossil waters, which have long replenishment times.
economic impacts of changes in the water table revolve primarily
Overabstraction of aquifers, together with decreased base-fl ow of
around salination of the water. These include the expense of alternative
rivers to replenish supplies has resulted in exhaustion of aquifers and
supplies, loss of agricultural income and potential, increased costs to
subsequent salinisation.
industry of water treatment, costs of recycling, and in extreme cases
(e.g. fi sh processing plants in Namibia) loss of industrial production
Overabstraction of aquifers is particularly concerning in Namibia.
due to water unavailability. These impacts are very diffi
cult to quantify,
A good example can be found in the Karstveld Borehole Scheme
and the Benguela Current Task team is unaware of these having been
(associated with the Eastern National Water Carrier inter-basin transfer
documented in the literature.
ASSESSMENT
23
Health impacts
Conclusions and future outlook
Modifi cation of stream fl ow promotes the spread of water-borne
The three issues relating to Freshwater shortage; modifi cation of stream
diseases and their vectors, including malaria, hepatitis, cholera,
fl ow, pollution of existing supplies and changes in the water table, are
typhoid, bilharzia and dysentery, in a number of ways, e.g lack of
all assessed as having severe environmental impact. Modifi cation of
proper sanitation and limited access to safe potable water, and inter-
stream fl ow was considered the most important of these three issues,
basin transfer schemes. While data are certainly available which may
as it has knock-on eff ects for other systems, including estuaries and the
document an increase in the spread of water-borne diseases and their
marine environment, and because virtually all the rivers in the region
vectors, the links between these and the modifi cation of stream fl ow is
suff er from fl ow modifi cation, some to the extent that they have dried
a very diffi
cult one to make. The Benguela Current Task team is unaware
up entirely. This not only aff ects the aquatic environment, but also has
of any documented cases in which these links have been established.
huge socio-economic implications.
Where modifi
cation of fl
ow leads to salination, health impacts
include a range of physiological problems. Reduction of stream fl ow
The future outlook is also poor. There is an increasing demand for water
compromises the ability of running waters to dilute pollutants, resulting
in the region, combined with a decrease in supply due to alteration of
in many people being forced to drink poor-quality or contaminated
rainfall patterns. Attempts to bring good-quality water to people will
water. The health impacts of pollution of freshwater supplies include
result in more river regulation through dams for storage and inter-basin
a lack of proper sanitation and limited access to safe potable water,
transfers for redistribution of water. The situation as regards freshwater
resulting in the spread of water-borne diseases.
shortage will thus deteriorate further by 2020.
The health impacts of changes in the water table are diffi
cult to evaluate
Contrasted with this is the fact that there is a growing awareness of water
as there are no statistics available linking water table changes/salination
scarcity and the need to conserve water resources in the region, and
to human health issues. In addition, salination may be important to
several measures are in place to conserve water supplies. In South Africa,
human health over long time periods, and thus be ignored in the
these include the new Water Law, which removes private ownership
short-term. In areas where there is total dependence by communities
of water rights, and allows for an ecological reserve of water to fl ow in
on water bodies which are formed where the water table meets the
all rivers, and the Working for Water Programme of the Department of
surface, lowering of the water table may have disastrous implications
Water Aff airs, the aim of which is to clear water-hungry alien vegetation
for human health. The problems are of greatest threat to the rural poor
from catchments, and to educate the public in water conservation
in Namibia and Angola, and to the urban poor in South Africa and the
issues. There is also a trend toward stricter water management by local
impacts are considered moderate for the region as a whole.
authorities, and investigations into the feasibility of desalination and
recycling are currently underway. Namibia is in the process of building
Other social and community impacts
its fi rst desalination plant at Walvis Bay, and is ahead of the rest of the
The problem relating to shortages of freshwater is so severe that
region in recycling of water. The legacy of the civil war in Angola results
there are already confl icts over water usage both between and within
in these issues not having been addressed in this country.
countries in the region (see Socio-economic characteristics), frequently
causing community disruption.These impacts are assessed as moderate
The economic impacts of freshwater shortage are also likely to become
by the GIWA Experts. Many people have been displaced from their
worse in the future. As more people gain access to water, and as less
traditional lands by dam construction in the past. There has also been
water becomes available due to decreases in rainfall, so the problem
movement of people away from traditional lands due to shortages of
will become worse. In the case of health impacts, there is a likelihood of
freshwater, and in many cases these movements result in breakdown
improving water supplies in some parts of the region. This is a relatively
of family and community lifestyles. By way of example, the lifestyle of
high priority at present, particularly in South Africa. On the other hand,
the Himba people is closely linked with the Cunene River. It is estimated
freshwater shortages in the future are likely to result in more resettlement
that a new hydroeclectric dam on the River will fl ood 250 square miles
of people from sites of dam construction, desertion of cultural lands due
(400 km2) of land inhabited by the Himba people. In addition to fl ooding
to increasing desertifi cation, and the possible loss of complete cultures.
culturally important sites, the dam will also fl ood essential grazing lands
and is likely to destroy the livelihoods and culture of these people
The region is generally arid, and has a limited and declining water supply.
(International Rivers Network 2004).
The fl ow of almost all river systems in the region is already modifi ed.
The demands for water are continually increasing, exacerbating the
24
GIWA REGIONAL ASSESSMENT 44 BENGUELA CURRENT
problem. Poverty, poor education and knowledge, scarcity of resources,
Africa, the Vaal River as well as its tributaries are organically polluted,
inadequate sanitation, urbanisation, institutional weakness, and the loss
impacts of which have been noted on invertebrate communities
of assimilative capacity due to the reduced fl ow of riverine systems all
(Chutter 1971). Sewage effl
uents discharged to the Vaal River daily in
combine to result in a worsening of the situation by 2020. At present,
the early 1980s amounted to 37 000 m3 (Oliveira 1986). Gross organic
the use of water is already greater than the supply, and many supplies
contamination (sewage effl
uent and sewage spills) has also been
of fossil water are already exhausted. Exacerbating the problem are
reported in the Little Lotus and Black rivers of Cape Town (Davies et al.
increasing populations and aspirations to a higher standard of living
1993). The Black River is in fact considered the most organically polluted
(which usually implies greater usage of water).
river in the Western Cape Province. Reported faecal coliforms during the
1980s ran at 25 million to 2 billion cells/ml (Davies & Day 1998).
In marine systems the impacts of microbiological pollution are related
Pollution
primarily to coastal organisms, and are generally localised in space
and time and therefore considered of moderate nature. More than
T
T
C
C
A
A
60 pipelines discharge effl
uent into the coastal zone of South Africa.
IMP
Freshwater component IMP
Marine component
Of these, 33% discharge domestic sewage, amounting to a total
Virtually the entire coastline of the Benguela Current region is exposed
input of approximately 66 million litres per day (Pick `n Pay 2003). In
to the open ocean and can thus be considered to experience a high
Angola, untreated industrial waste pumped into the Bay of Luanda
degree of wave exposure on global standards. Strong wave action
results in bacterial contamination (UNEP 2000). Stormwater run-off is
and currents tend to dissipate any pollution reaching the marine
also responsible for microbiological pollution of coastal urban areas.
environment very rapidly. Pollution of the marine environment is
Microbiological pollution from stormwater can contribute signifi cantly
therefore not of great concern and is mostly evident in localised areas
to microbiological pollution of coastal zones, especially when carrying
or hotspots such as ports and enclosed lagoons. Pollution in freshwater
run-off from informal settlements which lack adequate sanitation
systems is more of a concern as freshwater is a very limited resource
(South African Coastal Information Centre 2003).
in the region. Much of the pollution generated in the interior of the
country ultimately fi nds its way into one of the river courses draining
Eutrophication
the subcontinent. Because of these diff erences, pollution of freshwater
Eutrophication of freshwater systems is considered severe because of
and marine environments was assessed separately. A brief summary of
major eutrophication in all groups of standing water, as well as in some
the severity of each of the pollution issues is provided below.
running waters. In marine waters, however, eutrophication is considered
slight since it is generally highly localised around point discharges.
Environmental impacts
Total inputs of organic pollutants to freshwaters in the three countries
Microbiological
which make up the bulk of the Benguela Current region are presented
The problem of microbiological pollution is generalised in freshwater
in Table 11. Of these three countries, South Africa is the greatest
systems, although the worst impacts are centred around urban areas.
contributor to organic water pollutants, with emissions of 241 922 kg/
The environmental impacts of this issue are assessed as severe in the
day in 1998 as opposed to 7 350 kg/day for Namibia and 1 472 kg/day
freshwater component. The massive growth of coastal urban centres
for Angola. These emissions arise from a variety of sectoral sources,
in Angola has left existing infrastructure unable to cope, with resultant
with the food and beverage industry being the greatest contributor in
increases in human waste pollution around towns (UNEP 2005). In South
all three countries (World Bank 2001).
Table 11
Organic water pollution in the Benguela Current region.
Emissions of organic water pollutants
Country
By industrial sector (%)
(kg/day)
(kg/day/worker)
Food and
Stone, ceramics
Primary metals
Paper and pulp
Chemicals
Textiles
Wood
Other
beverages
and glass
Angola
1 472
0.20
8
3
9
66
<1
6
4
4
Namibia
7 350
0.35
0
5
2
90
<1
1
1
1
South Africa
241 922
0.17
12
16
9
42
<1
11
3
7
(Source: World Bank 2001)
ASSESSMENT
25
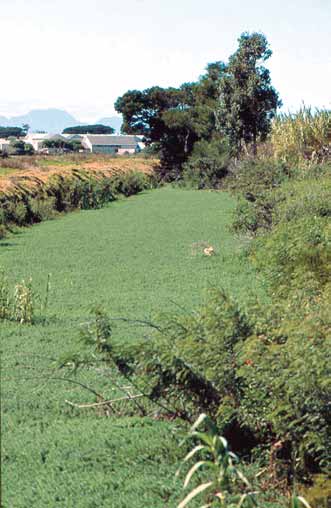
Eutrophication in the Vaal River is occasionally so severe as to cause
Chemical
permanent algal blooms that interfere with water supply and treatment,
In freshwater systems mining leachates, slimes dams and pesticides
and become health hazards. Spring algal blooms are normally associated
(including banned pesticides) result in many hotspots where the
with increases in run-off , total dissolved solids and nitrate (NO -N) and
impacts are regarded as severe, and some large areas of the region
3
nitrite (NO -N) loads. Scum formation at water intakes and fi lter-blocking
are also considered to be experiencing moderate impacts of chemical
2
are common water supply problems (Pieterse 1986). Spread of alien
pollution. Overall the impacts of chemical pollution in the region's
invasive species such as Water Hyacinth (Eichhornia crassipes), Parrot
freshwater systems are considered to be severe.
Feather (Myriophyllum aquaticum) and Kariba Weed and Water Ferns
(Salvinia sp. and Azolla sp.) have been recorded in the Vaal system in
The Vaal Dam and Barrage system supplies drinking water to 40% of
response to pollution and increased nutrient input (Bruwer 1978, 1979).
the human population of South Africa and its condition is thus of great
Bloemhof Dam is infested with Water hyacinth due to eutrophication, as
importance in the region. Organic pollution analyses have revealed
is most of the lower Vaal River (Grobler et al. 1986, Bruwer 1986).
dibutyl phthalate and phenols (including 2.4 dichlorophenol) at all
sampling points in the reservoir. Average phenol concentrations in raw
Eutrophication has also been reported for the mid-reaches of the
water for the town of Parys was 10 mg/l, rendering water unsuitable.
Berg River with eff ects on benthic invertebrates (Figure 5). Agriculture,
Average concentration in Parys water of (predominantly) chloroform was
distilleries, storm waters, faecal contamination and canning factories
165 mg/l, well exceeding the 100 mg/l limit set by US Environmental
have been implicated as the main contributors (Harrison 1958). Fish kills
Protection Agency for drinking water (Van Steenderen et al. 1986).
have been associated with eutrophication in Zandvlei, a coastal lake (ex-
estuary) on the Cape Peninsula (Bruwer 1979).
Vaal River salinity (Total Dissolved Solids) between 1934 and 1985 rose at
an alarming rate of 2.5 mg/l per year and is still rising due to agricultural
return fl ows from land irrigated under conditions of high evaporative
losses and acid rain on the South African highveld, with a mean pH
of 4.15. Salinity in the Vaal Barrage increased from <200 mg/l in the
1930s to >550 mg/l in the early 1980s (Davies et al. 1993). The problem
of salinisation of the Vaal River and associated systems is considered
intractable, the only solutions to the problem being dilution and reverse
osmosis (O'Keefe et al. 1992)
Chemical pollution of marine environments is most frequent around
major coastal cities. Many industries discharge untreated wastes into
rivers, with this ultimately fi nding its way into the oceans (UNEP 2000). In
the marine environment of the Benguela Current region, contaminants
are derived from a number of sources, and include sewage and fi sh
factory effl
uents, stormwater run-off and hydrocarbons. While some
localised hotspots are considered to display moderate impacts (such
as harbours, urban centres, etc.), the impacts are considered slight over
most of the region. The environmental impacts of chemical pollution
on the marine environment of the Benguela Current region are thus
assessed as slight.
Suspended solids
The impacts of suspended solids are considered to be moderate in the
region, both for freshwater and marine environments. For freshwater
systems, this is caused mainly by poor agricultural practices resulting
Figure 5
Alien aquatic vegetation spreads rapidly and choke
in excessive sediment loads to rivers. In some areas (for example the
waterways, Western Cape, South Africa.
(Photo: B. Davies)
upper catchment of the Orange River) the situation is very serious,
26
GIWA REGIONAL ASSESSMENT 44 BENGUELA CURRENT
but the problem is generally contained within a few basins. In marine
warm water species or reduction in species diversity of benthic marine
systems, the primary cause on the western coasts is marine diamond
communities in the area (PBMR EIA Consortium 2001, Eskom 2003).
mining, while poor agricultural practices throughout the region result
in addition of suspended solids via rivers to estuaries, lagoons and
Radionuclides
sheltered bays.
In freshwater systems the impacts are thought to be of a suffi
cient
magnitude to be considered severe by the GIWA Experts. The major
Solid waste
problems are associated with uranium mining on the East Rand, in South
In freshwater systems, the impacts of solid waste pollution are
Africa, and various mining activities in Namibia and Namaqualand. No
considered severe, with widespread dumping of rubbish into rivers.
publically accessible literature could be found which quantifi es the
Despite this being a recognised problem, no data are available with
extent of such pollution in freshwater systems of the region, possibly
which to quantify the impacts of solid waste on these freshwater
because of the sensitive nature of such information.
systems (Department of Environmental Aff airs and Tourism 2000).
In marine systems the impacts are considered slight. What impact may
Solid waste pollution in marine systems in the region is regarded as
exist would be most likely to emanate from one nuclear power station
moderate. Solid waste pollution in marine systems is primarily in the
(Koeberg, on the southwestern coast of South Africa), and would thus
form of plastic pollution and discarded fi shing gear. More than 80% of
be very localised. No data could, however, be obtained either to support
marine litter is made up by plastics. A survey conducted in the coastal
or to deny the existence of such possible pollution in the surrounding
waters of South Africa collected approximately 3 500 particles of plastic
marine environment.
per km2 (Ryan 1996). Scientifi c surveys of some of South Africa's beaches
in 1984, 1989 and 1994 revealed a signifi cant increase of macroplastics
Spills
and fi shery-related products, indicating a trend of increasing solid
Spills cause severe impacts in both marine and freshwaters in the
waste pollution in the coastal waters of the region. Two of the major
region. In the case of freshwaters these includes spills of petrol,
biological impacts of solid waste in marine systems are entanglement
chromium, and other contaminants into water supplies (both from
in, and ingestion of, plastics. Off the South African coast, entanglement
factory and road accident sources), while in the case of the marine
has been recorded to have aff ected fi ve species of mammals, 13 species
environment this is mostly associated with oil in the form of fuel and
of seabirds, two species of marine turtle and six species of fi sh (Ryan
cargo oil. Of the world's 20 largest oil spills listed by Intertanko, three
1996). These lead to death of the individuals concerned, although it is
of these (15%) have occurred in or near the Benguela Current region
deemed unlikely that this is a major threat to healthy populations of
(Table 12). According to UNEP (2005), oil pollution has caused negative
these species. Ingestion of plastic has been reported in seven species
impacts on the living marine resources off Angola, although there are
of mammals, 36 species of seabirds, two species of turtles and seven
no known studies which quantify the extent of the problem. Spills on
species of fi sh off South Africa. Ingestion by some pelagic seabirds
this coast are attributed predominantly to shipping, but oil and gas
is particularly high even by global standards, with almost all Great
exploration, production and transport are also regarded as posing a
Shearwaters (Puffi
nus gravis) and Blue Petrels (Halobaena caerulea)
risk (UNEP 2005).
containing plastic in their stomachs (Ryan 1996).
Two oil spills into the coastal zone near Cape Town within the last
Thermal
decade can be used as examples of the impacts of such spills on the
Thermal pollution is considered slight in both freshwater and marine
marine environment. The Apollo Sea, a Chinese ore carrier, sank close
systems in the region, as it comprises only very few point source
to the coast on 20 June 1994, and leaked some 2 500 tonnes of heavy
discharges from desalination plants and nuclear and coal power
fuel oil. Impacts included the oiling of endemic coastal and seabirds,
stations. By way of example, the coastal area surrounding the nuclear
and of coastal amenities. In the four-month long clean-up operation, a
power generation plant at Koeberg on the South African west coast is
total of 6 500 tonnes of oil and oil debris were removed from beaches
characterised by an average sea temperature of 13░C, with a minimum
in the vicinity of Cape Town, and an additional 15 tonnes were removed
of approximately 10░C and a maximum approaching 20░C. Annual
from the shallow seabed with a vacuum (Moldan 1994). The eff ect on
surveys by researchers at the University of Cape Town have found no
the nearshore environment was relatively small, as the heavy fuel oil was
detrimental eff ects on marine life resulting from the warm water plume
of a relatively low toxicity (Moldan 1994). There was, however, a large
surrounding the power station, nor any settlement of opportunistic
impact on the African Penguins (Spheniscus demersus), endemic to the
ASSESSMENT
27
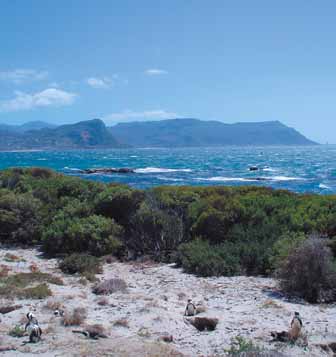
Table 12
The 20 largest tanker oil spills in the world.
Oil lost
Ship name
Year
Location
(tonnes)
Atlantic Empress
1979
Off Tobago, West Indies
287 000
ABT Summer *
1991
700 nautical miles off Angola
260 000
Castillo de Bellver *
1983
Off Saldanha Bay, South Africa
252 000
Amoco Cadiz
1978
Off Brittany, France
223 000
Haven
1991
Genoa, Italy
144 000
Odyssey
1988
700 nautical miles off Nova Scotia, Canada
132 000
Tory Canyon
1967
Scilly Isles, UK
119 000
Urquiola
1976
La Coruna, Spain
100 000
Hawaiian Patriot
1977
300 nautical miles off Honolulu
95 000
Independenta
1979
Bosphorus, Turkey
95 000
Jakob Maersk
1975
Oporto, Portugal
88 000
Braer
1993
Shetland Islands, UK
85 000
Khark 5
1989
120 nautical miles off the Atlantic coast of Morocco
80 000
Prestige
2002
La Coruna, Spain
77 000
Aegean Sea
1992
La Coruna, Spain
74 000
Katina P.
1992
Off Maputo, Mozambique
72 000
Sea Empress
1996
Milford Haven, UK
72 000
Figure 6
African penguins at Boulder's Beach, Simontown,
South Africa.
Assimi
1983
55 nautical miles off Muscat, Oman
53 000
(Photo: M. Karlsson)
Metula
1974
Magellan Straits, Chile
50 000
Wafra *
1971
Off Cape Agulhas, South Africa
40 000
of Kelp Gull and Swift Tern, which occur here are globally unique. These
Note: * Spills in or near the Benguela Current region.
birds were collected and rehabilitated in far smaller numbers than the
(Source: Intertanko 2005)
penguins (Members of the GIWA Task team pers. comm.).
upwelling waters of the Benguela Current in South Africa and Namibia
(Figure 6). The total world population of African penguins stands at
Socio-economic impacts
approximately 180 000 birds. Of these, approximately 10 000 were oiled
Economic impacts
during this event (Underhill et al. 2000). Approximately 7 500 penguins
The economic impacts of pollution in the Benguela Current region are
were collected, cleaned and released, with a 63% survival rate (Moldan
considered to be severe, particularly as they are widespread and the
1994). At the time this was the biggest seabird oiling event on the
costs of treatment are high. The costs include those of water treatment
southern African coast (Crawford et al. 2000).
for both household and industrial use, ensuring alternative supplies,
management of water, clean-ups, emergency services, control of
On 23 June 2000 the Treasure, a bulk ore carrier, sank with 140 000 tonnes
eutrophication, sewage treatment, dam maintenance and aesthetic
of iron ore and 1 300 tonnes of fuel oil on board (Trevenen-Jones 2000).
or tourism costs. Although some pollution issues are sporadic or
In excess of 19 000 African penguins were oiled, double the number
temporary, most (and especially those which result in the largest
oiled during the Apollo Sea spill in 1994. In this case, total mortality was
impacts) are continuous in nature.
about 2 000 adults and immatures, and 4 350 chicks, and survival rates
were better than those achieved during the Apollo Sea spill (Crawford et
Costs incurred as a result of microbiological pollution and eutrophication
al. 2000). In addition to the African Penguins, a number of other coastal
are enormous in freshwaters due to the costs of water treatment, both
birds were also aff ected by the spill. These included Bank Cormorant
for household and industrial use, and alternative supplies. The spread of
(Phalacrocorax neglectus), Cape Cormorant (P. capensis), Crowned
invasive alien plant species as a result of eutrophication leads to greater
cormorant (P. coronatus), Great Cormorant (P. carbo), Kelp Gull (Larus
evaporation from standing water bodies, thus further exacerbating the
dominicanus), Hartlaub's Gull (L. hartlaubii) and Swift Tern (Sterna bergii).
problem of a natural shortage of freshwater. In the marine environment,
Of these, Bank Cormorant, Cape cormorant, Crowned Cormorant and
however, the costs related to eutrophication are not important in the
Hartlaub's Gull are species endemic to southern Africa, while the races
region.
28
GIWA REGIONAL ASSESSMENT 44 BENGUELA CURRENT
The major economic impacts of chemical pollution are the increased
The major problems are chronic problems related to microbiological
costs of mining processing techniques to address the problem, the
(especially water-borne diseases) and chemical pollution.
treatment of contaminated water, and the costs of supplying water
from alternative sources. The economic impacts of chemical and
Microbiological pollution of waters in the region causes high levels of
oil spills are enormous, considering both clean-up operations and
dysentery, particularly in areas where the population does not have
rehabilitation of fauna, fl ora and functional ecosystems. These costs can
ready access to treated water. Although it has not happened as yet, the
be extremely large, running into millions of UDS. The costs associated
potential for outbreaks of toxic algal blooms as a result of eutrophication
with the Apollo Sea spill near Cape Town in 1994 were originally
are massive, and their potential impact on human health could be
estimated at approximately 2 million USD. The fi nal cost, however,
profound. The major health impacts related to chemical pollution
was approximately 3.5 million USD (Kleinschmidt 2000). The cost of
include illness caused by acid drainage (although this is diffi
cult to
the cleaning and rehabilitation of the endemic African Penguins alone
quantify and to link to the cause) and illness related to the use of
was approximately 64 000 USD (Department of Transport 1994), and
alternative water supplies which may also be contaminated in some
that with an army of unpaid volunteer workers. The costs of the clean-
way. Pollution by suspended solids raises a major concern regarding the
up from the Treasure oil spill in 2000 were estimated at 17 million USD
resuspension of accumulations of heavy metals by dredging operations
(Trevenen-Jones 2000).
both in highly silted dams, and in harbour areas. There is, however, no
direct evidence of a link between such heavy metal resuspension
Economic impacts related to suspended solids are primarily felt in
through dredging and human health in the region.
freshwater systems. These include the costs of dam maintenance (i.e.
dredging, etc.), the costs of dam losses through extreme sedimentation
The health impacts of solid wastes are generally fairly small, and include
during fl ood events, and the costs of treatment of freshwater for human
cuts from sharp objects, and suff ocation by plastic bags. There are no
use. In the marine environment, costs include dredging of accumulated
known human health impacts associated with thermal pollution of
silt in estuaries and harbours. Solid waste pollution results primarily in
aquatic environments in the region at present. According to the GIWA
costs associated with clean-ups and in costs to fi sheries due to gear
Experts there is evidence of increasing numbers of cases of leukemia
damage and fouling. The costs of beach cleaning in South Africa
and other illnesses in areas aff ected by radionuclide pollution. However,
during one year (1995) amounted to some 1.2 million USD (Ryan 1996).
there is a problem of denial, and no data are available to support this
The more than 55 000 km of beach cleaned annually in South Africa
at present. There are no known cases of death from spills in the region.
amounts to more than 30 times the length of sandy beaches in the
However, there are certainly other health impacts of spills. These include
country (Ryan 1996). There is also an aesthetic cost which may aff ect
breathing of toxic fumes that may be harmful to human health, and the
tourism potential and lead to further economic losses in the region.
eating of contaminated fi sh.
These costs are diffi
cult to quantify, although a survey of beach-goers
near Cape Town indicated that beach cleanliness was an important
Other social and community impacts
criterion in the selection of holiday destinations among tourists
The GIWA Experts considered that there were no major social and
(Ryan 1996).
community impacts arising from pollution which had not been dealt with
under issues of Freshwater shortage, but that those that exist are slight.
The costs of preventing thermal pollution are related to the cooling of
effl
uent for the protection of the surrounding environment. Although
Conclusions and future outlook
costs exist, they are relatively low at present. There is currently very little
Marine pollution is not a priority concern in the Benguela Current region
information available regarding the impacts of radionuclide pollution in
at present. Polluted areas that do exist are mostly highly localised. In
the region, and little is being done to address the associated problems
Namibia, the highest concentrations of pollution in the marine
(there is a substantial attitude of denial of the problem). There are thus
environment occur in the ports of Walvis Bay and LŘderitz, and off the
very few known related costs at present.
town of Swakopmund. Most of the pollution in the ports originates
Health impacts
from fi sh factory effl
uent, accidental oil spills, dredging and hazardous
The issues surrounding human health and water pollution are considered
substances used in the repair and maintenance of fi shing vessels and
moderate by the GIWA Experts, and are primarily related to a shortage
other ships. Most of the rest of the Namibian coastline is free of pollution
of potable water. Although pollution of freshwater supplies may result
from land-based sources as it lies within the Skeleton Coast Park or the
in death, this usually only occurs under exceptional circumstances.
Namib/Naukluft Park. Although it has not happened yet, the risk of a
ASSESSMENT
29
major pollution event arising from oil tankers that travel along the coast
Habitat and community
is, however, always present.
modification
T
T
On a global scale, South Africa's coastal waters are considered to have
C
C
A
A
IMP
Freshwater component IMP
Marine component
low levels of marine pollution, which do not pose a serious threat to
the environment or human health (Brown 1987). However, with an
Data relating to modifi cation and/or loss of specifi c ecosystem types
increasing population, industrialisation and pressure on the coastal
are not always readily available. In order to compensate for the lack
environment, regular assessment and monitoring of coastal water
of hard evidence, the Benguela Current Task team has attempted to
pollution levels are essential. By the mid-1980s there were as many as
provide information on the perceived extent of modifi cation and/or
61 waste disposal pipelines located around the coastline of South Africa
loss of ecosystems in the region. Estimated percentages are thus given
pumping sewage and effl
uent into the sea (Lusher 1984). This number
in the descriptions below. They are provided merely as a guide to how
has increased with the rapid increase in population and industrialisation
severe loss and modifi cation of each habitat is in the region, and are
of South Africa. With the associated increased discharge from both
not necessarily substantiated by hard data, nor should they be cited
industrial and domestic effl
uents into the marine environment, it is
as being quantitative substantiation of ecosystem modifi cation and/or
important to monitor pollution levels against defi ned water quality
loss. Please also note that, due to a paucity of habitat-specifi c data in
criteria. In the early 1980s, a select group of specialist scientists and
the region, the assessments of the future of these habitats are based to
conservationists established a unique and simple guide to water
a large extent on the professional opinions of the Benguela Current Task
quality criteria, providing monitoring strategies for measuring water
team, and are not necessarily substantiated by hard data. For detailed
quality in South African waters. This document provides a guideline
scores for the individual habitats, please see Annex II.
for tolerance levels (safety levels) of organic and inorganic pollutants
in marine waters and continues to be used as a reference guide.
Environmental impacts
Legislation preventing marine pollution in South Africa is considered to
Freshwater habitats
be comprehensive, although responsibility for implementation thereof
The overall environmental impact in freshwater habitats was assessed
is currently fragmented, being distributed among several organisations
as severe. In the absence of ecosystem-specifi c information, data
(Marine and Coastal Management, Department of Water Aff airs and
regarding the percentage of threatened species can be used as an
Forestry, South African Maritime Safety Authority and Department
approximation of the modifi cation and/or loss of ecosystems in general.
of Transport). Intentions have been expressed to amalgamate the
Data for amphibians and freshwater fi shes in South Africa indicate that
responsibility of monitoring and preventing marine pollution to
17 and 36% of these species respectively are listed as threatened
become the responsibility of one organisation, but this has yet to be
(Department of Environmental Aff airs and Tourism 2000). If these fi gures
implemented. Marine pollution in South Africa is specifi cally governed
are extrapolated as indicators for loss and/or modifi cation of freshwater
by the Prevention and Combating of Pollution of the Sea by Oil Act, 6
ecosystems, this would suggest that this country has suff ered loss and/
of 1981, the National Water Act, 3 of 1998, the Water Services Act, 108 of
or modifi cation of up to 36% of its freshwater ecosystems.
1997, and the South African Public Health Act, 36 of 1919.
Wetlands
The outlook for the future is that the environmental impact of all types
Wetlands, are in South Africa, as well as in other parts of the Benguela
of pollution will become worse by the year 2020. As more people
Current region, regarded as among the most threatened of all aquatic
in the region are given better access to water, one would expect
habitats (Walmsley 1991). Pressures are placed on wetlands through
improvements in health. However, increased access usually equates
a number of human activities, including modifi
cation of fl
ows,
with increased usage, which in turn applies greater pressure to the
water abstraction, pollution, agricultural practices, development,
freshwater systems, and reduces their capacity for resisting pollution.
etc. Although little data are available regarding the loss of natural
The status quo concerning the health situation is expected to remain
wetlands, it is estimated that there have been substantial reductions
until 2020. It is also foreseen that, as environmental pollution issues
in the natural extent of these in South Africa (Kotze et al. 1995).
deteriorate in the region, so will other social and community impacts.
This is most marked within the westerly arid areas of the country
However, there is low confi dence in this prediction, as there are many
where reductions in natural wetland extent of over 50% have been
unpredictable factors that could play a role in the future (e.g. the
postulated (Kotze et al. 1995, Department of Environmental Aff airs
stabilisation of the Angolan political situation).
and Tourism 2000).
30
GIWA REGIONAL ASSESSMENT 44 BENGUELA CURRENT
Soligenous bogs
Endorheic pans
Soligenous bogs only occur in the upper headwaters of the major
Endorheic pans are habitats with periodically standing waters with
tributaries of the Orange River system. They control the rate of
large amplitude fl uctuations. These periodic standing waters are
seepage release to the headwaters, thus driving the entire Orange
almost vegetation-less. They allow water in, but not out, and remain
River Basin. The soligenous bogs are also highly important in fi ltering
dry during the dry season. In southern Africa, they are a dominant
and maintaining water quality. The GIWA Experts estimate that more
feature of the landscape between southern Angola and the western
than 30% of this habitat type has been lost in the region primarily due
Cape. In the highly arid regions, they are the only form of standing
to inappropriate development and cattle grazing. The impacts of both
water. Although species richness in these pans is low, endemism is
modifi cation and loss of this habitat are thus considered severe. It is
high, and they contain unique faunas. Overall, modifi cation and loss of
likely that this habitat type will continue to be modifi ed, degraded
this habitat is considered severe in the region. Major problems include;
and lost by 2020 due to inappropriate development, poor agricultural
infi lling, overgrazing by cattle and associated faecal contamination,
practices and back-fl ooding by the construction of reservoirs.
and reduction in stream fl ow into these systems by upstream river
regulation. The GIWA Experts consider that the intensity of the problem
Marshes
does, however, vary with an aridity gradient in the region according to
Marshes, or vleis as they are commonly known in the region, are
the following. In the hyper-arid areas (<50 mm rainfall) where population
regionally important as they are the most common form of wetland
density is low, approximately 5 to 10% of this habitat has been lost. In
found in the wetter parts of the region). The GIWA Experts estimate
arid areas (<200 mm rainfall) approximately 30% has been lost. In semi-
that at least 75% of marshes in the region have been destroyed through
arid areas (<400 mm rainfall) where population density is far higher,
landfi ll and development. Of those that have not been destroyed, the
there is a 100% loss of this habitat type. It is envisaged that modifi cation
remainder are all modifi ed. The impacts of modifi cation and loss of
and loss of this habitat type will continue by 2020, although there is
marshes are thus rated as severe in the region. An increased awareness
uncertainty about the rate at which this will happen.
of the importance and sensitivity of this habitat, together with improved
technology to restore, rehabilitate, and even recreate, these habitats is
Floodplains
likely to stem the loss and lead to some reduction in their modifi cation
The area is naturally poor in fl oodplain habitat and there is only one
and degradation in the future.
fl oodplain in the entire region ş that of the Berg River in South Africa.
Among other things, this fl oodplain serves a very important function
Riparian belts
as a feeding ground for a huge density of palearctic migrant waders.
Very few intact riparian belts remain in the region and the GIWA Experts
According to the GIWA Experts the fl oodplain has experienced a loss
estimate that almost 80% of this habitat has been lost. Reasons for this
of >30%, due to overabstraction of water upstream leading to reduced
loss include; aforestation, deforestation, agricultural encroachment
fl ooding, reduction of peak fl ows, grazing pressure and crop farming
onto the river banks, overgrazing in riparian zones, river regulation
on the fl oodplain, pollution from agricultural and industrial sources, and
and overabstraction of water leading to reduced water supply for
stabilisation of the estuary mouth which reduces vital back-fl ooding
riparian vegetation, plantation encroachment, invasive alien plants,
into the fl oodplain. Because the Berg River fl oodplain is the only one of
canalisation, and inappropriate development. The exception is in
its kind in the region, its long-term survival is vital and modifi cation or
the northern Angolan part of the region, where the ongoing war has
loss is considered a severe impact. Its future deterioration is predicted
reduced these types of activities. The impacts of modifi cation and loss
for two reasons. Firstly, the surrounding area is a growth point of
of riparian belts are collectively considered as severe in the region. Of
development, and is unlikely to remain in its current state without
those riparian belts that remain, the majority are within conservation
intervention. Secondly, a proposed new dam upstream will reduce
areas. However, the continuous nature of riverine systems results in the
stream fl ow even further, also reducing the frequency and intensity of
spread of invasive alien vegetation even into these areas, causing further
fl ood events. It is envisaged that the fl oodplain will no longer operate
loss of this habitat by 2020. However, growing public awareness and
with current capacity, and this system will thus be entirely lost, and this
campaigns such as the Working for Water project are moving in the
habitat type will cease to exist in the region.
right direction to reduce and reverse the modifi cation of these habitats.
The results of such initiatives are, however, not likely to be felt within
Rivers
a near future.
The majority of rivers in the region are intermittent rivers (>65%) and
fl ow only periodically (Figure 7). Some of these rivers fl ow annually,
ASSESSMENT
31
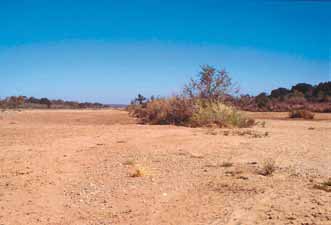
while others fl ow less frequently or predictably. All intermittent rivers
Marine habitats
in the region are dammed (all have multiple impoundments along their
The overall environmental impacts in marine habitats are considered
length, mostly in the form of farm dams) and suff er from overabstraction
moderate in the region.
of water. This has resulted in massive changes in the temporal fl ow
regimes of these systems. In extreme cases, these rivers have ceased
Sandy foreshores
to fl ow, as all the water is captured in impoundments. This has lead
Sandy foreshores cover more than 50% of the coastal length of the
to loss of species, and modifi cation and loss of these ecosystems are
region. The impacts of modifi cation and loss of sandy foreshores
thus considered severe in the region. Increased regulation of fl ow and
in the region is considered moderate due to land reclamation, port
abstraction of water for agricultural purposes (which may lead to 100%
development, coastal diamond mining in South Africa and Namibia
reduction in fl ow) are likely to result in further modifi cation and loss
which has lead to both erosion and accretion of sandy foreshores, and
of these river systems by 2020. New laws regarding ecological fl ow
some sand mining in Angola. Possibly the largest contributor is beach
requirements of rivers in South Africa may slow down the process in
accretion related to diamond mining activities on the Namibian coast.
this country, but it is unlikely that they will have any eff ect in the near
Since the coastline is highly dynamic and exposed, the few suitable
future.
sites have already been reclaimed, and thus no future deterioration is
envisaged by 2020. This carries only medium confi dence as it is possible
that engineering technology may fi nd a way to reclaim sites which were
previously regarded as unsuitable. As diamonds become depleted,
mining is moving further off shore, thus lessening the pressure on this
habitat type, and leaving these areas to revert back to their natural state.
However, it is likely that sand mining will increase in Angola, although
there is a lot of uncertainty as to the extent of this.
Lagoons
There are only a few lagoons in the region and most of these are
nature conservation areas, and all are important feeding grounds
for birds, including palearctic migrant waders. Local deterioration
of these sites may thus have far-reaching implications for bird
Figure 7
Dry river beds are a common feature in the arid
populations. Several of these lagoons have been designated as
Benguela Current region.
Ramsar sites. The impacts of modifi cation and loss of this ecosystem
(Source: B. Davies)
type are considered moderate. The Luanda Lagoon is of particular
concern. The ecological functioning of this system has become
The permanent rivers are limited to the less arid parts of the region.
entirely lost due to blocking of the connection between the lagoon
Although they suff er from a range of problems, the most important
and the sea. The lagoon is silting up rapidly, and is highly polluted.
are changes in river fl ow, impoundments and overabstraction. In South
Lagoons on the Namibian coast are naturally relatively short-lived
Africa and Namibia many rivers have ceased to fl ow permanently and
systems and are characterised by natural siltation processes. The
have become intermittent, resulting in temporal rather than spatial
process of siltation, however, is being exacerbated and accelerated
fragmentation of the habitat (Department of Environmental Aff airs
by human activities. It is likely that lagoons will experience further
and Tourism 2000). This has lead to loss of biodiversity and ecosystem
modifi cation and loss by 2020 as increasing population densities result
functioning. Salinisation, pollution, riparian destruction, sedimentation
in increasing development around lagoons, and a resultant increase in
and invasion by alien vegetation exacerbate the problems. In Angola,
exploitation and disturbance. Luanda Lagoon is already almost lost. Of
the major problems are siltation and impoundments. Modifi cation and
the Namibian lagoons, Sandwich Harbour is silting up naturally, while
loss of this ecosystem type is severe in the whole region. Increased
Walvis Bay is experiencing siltation exacerbated by human activities. It
regulation of fl ow and abstraction of water for agricultural, industrial
is unlikely, however, that Walvis Bay Lagoon will be lost entirely within
and domestic purposes are likely to result in continued modifi cation
the near future. In South Africa, Langebaan Lagoon is protected as
and loss of these river systems.
part of a national park, and thus unlikely to be lost in the future.
32
GIWA REGIONAL ASSESSMENT 44 BENGUELA CURRENT
Estuaries
Table 13
Condition of estuaries in South Africa's cool temperate
biogeographic province.
Because of the arid nature of large parts of the region, there are
relatively few estuaries. These become more numerous, however
Condition
Comment
Number of estuaries
in the wetter northern parts, with Angola having approximately
Excellent
Estuary in a near pristine state
1
20 estuaries formed by perennial rivers (UNEP 2005). The Benguela
No major negative anthropogenic influences on either
Good
2
coastline is highly exposed to wave action, and is dominated by high
the estuary or the catchment
Noticeable degree of ecological degradation in the
wave conditions and strong winds for most of the year. There few
Fair
2
catchment and/or estuary
sheltered embayments and estuaries that do exist represent much of
Major ecological degradation arising from a
Poor
5
combination of anthropogenic influences
the only sheltered marine habitat along this coastline, with the result
(Source: Whitfield 1995)
that they are important both for biodiversity and the focus of coastal
development. They represent important feeding areas for birds
(including palearctic and intra-African migrants) and are nursery areas
the region by the alien Mediterranean Mussel (Mytilus galloprovincialis).
for many exploited fi sh species. Many estuaries also contain species
This invasion has drastically altered community structure and functional
that are endemic to only one or two estuarine systems within the
group composition on the shore. In addition, pipeline discharges of
region. Almost all of the estuaries in the region have been altered from
sewage, industrial waste and stormwater run-off at urban nodes has
their original state. Reduced freshwater infl ow due to water extraction
resulted in changes to community structure and functioning. Complete
for human usage is a major factor that has caused this change. Most of
loss of rocky foreshores is a result of inappropriate coastal development.
the larger estuaries have some degree of built environment along the
It is likely that this will continue by 2020. Rocky foreshores will also
shoreline, e.g. marina developments that contribute to the alteration
continue to be modifi ed through exploitation of certain species,
of some estuaries (CSIR 1999).
invasion by alien species, and through point source pollution from
pipeline discharges around urban nodes.
The ecological functioning of many estuaries in the region has been
destroyed by alteration and reduction of fl ow in the catchments,
Mangroves
aff ecting the frequency, intensity and timing of fl ood events which
Mangroves are confi ned to the more northerly, tropical areas of the
perform a number of vital functions, including scouring, ensuring
region between Lobito and Luanda in Angola, where they cover some
natural mouth opening and the provision of vital environmental cues
700 to 1 250 km2 (UNEP 2005). Exploitation of the mangrove fauna
to recruits of marine fi sh and other organisms. Modifi cation of estuary
occurs, but of greater concern is the exploitation of the mangroves
mouths and their functions by closure and inappropriate timing of
themselves for building materials. Exploitation of the mangroves and
artifi cial mouth breaching, inappropriate development, pollution
their associated fauna has lead to changes in community structure. No
from a number of sources, and overexploitation all contribute and will
data exist on the extent of the damage to mangroves in this area, but
continue to contribute to the modifi cation of these systems. In the
the GIWA Experts suggest that not more than 30% of the mangroves
cool temperate region of South Africa which falls within the Benguela
in this area have been destroyed to date. The impacts of modifi cation
Current region, 50% of estuaries are considered to be in a poor
and loss of mangroves is therefore considered moderate in the region.
condition (Table 13) (Whitfi eld 1995). The impacts of modifi cation and/
As coastal populations in Angola increase (through immigration and
or loss of estuarine systems are considered to be severe in the region. It
growth), so exploitation of the mangrove fauna and fl ora will escalate,
is likely that the degradation will continue by 2020 due to, among other
resulting in further modifi cation and loss of this habitat by 2020.
things, a growing desire for waterfront property particularly within the
southern part of the region.
Kelps
Exploitation of kelp systems does occur within the region. This is
Rocky foreshores
primarily related to the harvesting of kelp for feed in abalone (Haliotis
There is some loss of rocky foreshores in the region due to port
spp.) farms. There is, however, no evidence that kelp systems are
construction, seawalls and resort development, and the impacts of
suff ering fragmentation or loss in the region with the current levels
modifi cation and loss of rocky foreshore is considered moderate in
of exploitation of this resource. Severe exploitation of particular
the region. Major contributing factors to modifi cation of this habitat
species associated with kelp beds has, however, lead to changes
type include overexploitation, which has altered community structure
in community structure within these systems. The major species
on the shore, and the invasion of a signifi cant stretch of coastline of
exploited include rock lobster, abalone, and linefi sh. The impacts
ASSESSMENT
33
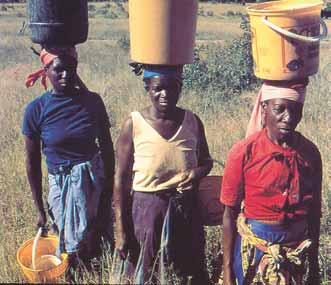
of exploitation of these species are dealt with under the concern
Socio-economic impacts
Unsustainable exploitation of living resources, and will not be
Economic impacts
repeated here. Because of the contribution of the exploitation of
The economic costs associated with loss and modifi cation of
these species to the modifi cation of kelp systems, the impacts of
ecosystems and habitats are moderate and include; agricultural losses,
modifi cation and loss of this ecosystem type are slight in the region.
costs of water supplies, losses associated with tourism, lowered fi shery
It is likely that harvesting of kelp for alginates will increase in the future
yields (particularly with regard to estuaries), and coastal erosion.
both in Namibia and South Africa. The exact eff ects of this cannot be
predicted at this stage, and it is uncertain what the long-term impacts
Health impacts
of kelp harvesting will be. A project is currently underway through the
There is no strong link between habitat modifi cation and human health.
Benguela Large Marine Ecosystem Project to assess the eff ects of kelp
The major problems revolve around modifi cation of freshwater habitats,
harvesting (Project BEHP/CEA/03/04).
including decreased dilution potential for contaminants, increase in
water-borne diseases by creation of impoundments, salination, and
Mud bottoms
respiratory problems associated with desertifi cation and the creation
Mud bottoms are important off both South Africa and Namibia as they
of high-dust environments. The overall assessment of health impacts
constitute a large proportion of the sea bottom. Many mud bottoms
associated with modifi cation and loss of ecosystems and habitats is
in this area are anoxic, but have a rich surface layer which helps to
considered to be moderate.
support a healthy pelagic system. There is no evidence of long-term
fragmentation or loss of mud bottom habitat in the region due to human
Other social and community impacts
activities. Trawling does, however take place over muddy ground, and
Habitat and community modifi cation has lead to loss of sustainable
the extensive diamond-mining in the region moves and remobilises
livelihoods, particularly related to the collection or use of natural
sediments, resulting in changes to species composition. These mud
resources such as fi sh, wood, water, thatch, etc. and is considered
bottoms are, however, generally anoxic and naturally poor in species,
moderate in the region. Women are the worst aff ected, as it is usually
and the communities recolonise quickly. Modifi cation and loss of muddy
they who are involved in these activities (Figure 8). This means that
substrata is therefore considered slight in the region. It is unlikely that
more eff ort must be expended on these activities, which reduces
there will be any change in the status of mud bottoms by 2020.
opportunities for other activities such as education.
Sand and gravel bottoms
Conclusions and future outlook
The GIWA Experts considered there being no evidence of fragmentation
Habitats and communities will continue to become transformed and
or loss of sand and gravel bottom habitats in the region. Although
lost as a result of urbanisation, pollution, etc. Of particular concern are
trawling creates some physical disturbance to the substratum, probably
the greatest contributor to community change is through removal of
the abundant fi sh predators inhabiting the above water mass. For this
reason, modifi cation and loss of this habitat type is considered slight
in the region. It is unlikely that there will be any change in the status of
sand/gravel bottoms by 2020.
Rocky bottoms
There is no evidence of fragmentation or loss of rocky bottom in the region,
but the exploitation of rock lobster, abalone and large fi sh has changed
the community structure of this habitat. The impacts of exploitation of
these species are discussed in detail under the concern Unsustainable
exploitation of living resources and will not be repeated here. Because of
the impact of the ecosystem eff ects of the heavy exploitation of these
species, modifi cation and loss of rocky bottom habitats is considered
slight in the region. It is envisaged that this exploitation will continue,
Figure 8
Women collecting water.
resulting in further modifi cation of this habitat type by 2020.
(Photo: B. Davies)
34
GIWA REGIONAL ASSESSMENT 44 BENGUELA CURRENT
the cumulative eff ects of such habitat modifi cation and loss. As more
The linefi shery in the Benguela Current region includes an enormous
habitats and/or communities are lost, what is left behind becomes
array of species, from highly resident and range-restricted reef
more important. The environmental impacts of the concern Habitat
associated fi shes to large, highly-migratory species such as tunas and
and community modifi cation will thus increase by 2020, and become
billfi shes. The linefi shery contains a number of "sectors", ranging from
more severe than at present. Since the environmental problem is
subsistence and artisanal fi sheries to recreational and fully commercial
increasing, so the costs must necessarily increase, with the cumulative
fi sheries (Members of the GIWA Task team pers. comm.).
eff ects of this resulting in the impact becoming severe. In fi sheries, for
example, as stocks decrease, so eff ort must increase to compensate,
Total fi sh catches in the Southeast Atlantic over the last 30 to 40 years
and costs increase as a result. Similarly, it is predicted that there will be
have declined from a peak of more than 3 million tonnes in 1968 to
further deterioration in health by 2020. It is also likely that, as habitats
around 1 million tonnes per year in the 1990s (Hampton et al. 1998).
are increasingly modifi ed and resources become correspondingly more
Much of this is associated with overexploitation of key resources in the
scarce, so the social and community impacts will increase.
region. Some of the most pronounced features associated with the
decline in catches include a major decline in catches of South African
and Namibian Sardine in the mid- and late 1960s, a major decline in
the West Coast Rock Lobster resource (particularly off Namibia), a
Unsustainable exploitation of
major reduction in hake catches off Namibia in the 1990s, and a sharp
fish and other living resources
reduction in industrial catches of all the most important species (e.g.
Sardinellas, Horse Mackerels and prawns) in Angola (Hampton et al.
T
C
A
1998). The latter two trends are not purely a function of overexploitation,
IMP
Marine component
and are due, at least in part, to the major reduction in foreign fi shing
The high productivity of the Benguela Current supports abundant
eff ort from 1985 onwards.
fi sh stocks. Pelagic fi sheries in the region target Anchovy (Engraulis
capensis), Sardine or Pilchard (Sardinops sagax), Cape and Cunene
The socio-economic value, national importance, and the balance
Horse Mackerels (Trachurus trachurus capensis and T. trecae), Round
between the various sectors (industrial, artisanal, recreational etc.) varies
Herring (Etrumeus whiteheadi), while Angolan fi sheries additionally
considerably between the coastal countries in the region. In Angola
target Sardinellas (Sardinella aurita and S. maderensis). The demersal
and Namibia fi sheries are nationally important, making a substantial
fi sheries of Namibia and South Africa are largely based on Cape and
contribution to employment in these countries. Fisheries provide a
Deep-water Hakes (Merluccius capensis and M. paradoxus). A number of
valuable source of local food production in Angola, while in Namibia
by-catch species are also important components of the hake fi sheries,
the value of exports of fi shery products contributes substantially to the
including adult Horse Mackerel, Monkfi sh (Lophius vomerinus and L.
national economy, at approximately 225 million USD per year (Hampton
vaillanti), Kingklip (Genypterus capensis), West Coast Sole (Austroglossus
et al. 1998). The South African fi shing industry is not as important on a
microlepis) and Snoek (Thyrsites atun). On occasion, some of these by-
national scale, although earnings are similar to those of the Namibian
catch species, notably Monk and Kingklip are also targeted. There is
fi shery. The fi shing industry, however, remains an important source of
also an important demersal fi shery in Namibia for Orange Roughy
food, income and employment for many coastal people.
(Hoplostethus atlanticus). Angolan demersal fi sheries are largely based
Because of the relative scarcity of permanent surface freshwater in the
on Cape and Benguela Hakes (M. capensis and M. polli), Dentex spp.
region, marine fi sheries far outweigh inland fi sheries in importance. As
and Red Pandora (Pagellus belloti). Many of these species are shared
a consequence, the GIWA concern of Unsustainable exploitation of fi sh
between two or all three of the coastal countries in the Benguela
and other living resources is assessed only for marine fi sheries.
Current region (Members of the GIWA Task team pers. comm.).
Red Crab (Chacean maritae), Deep-water Rose Prawn (Parapenaeus
Environmental impacts
longirostris) and Striped Red Prawn (Aristeus varidens) are important
Overexploitation
components of the Angolan crustacean fi shery. Red crab is also taken
Overexploitation of fi sh and other living resources is considered severe
in Namibian waters. A large fi shery exists for West Coast Rock Lobster
in the region, as many fi shery resources are overexploited. The Southern
(Jasus lalandii) in Namibia and South Africa (Members of the GIWA
African Development Community (SADC) recognises overexploitation
Task team pers. comm.).
of fi sheries resources as a concern for the southern African region as
a whole (SADC 2002). Historical catch records indicate a past drastic
ASSESSMENT
35
decline in catches of Sardine (Sardinops sagax) in South African
trawl fi sheries is considered to be overexploited (Punt & Japp 1994).
waters. In the early 1950s catches were approximately 100 000 tonnes
per year. With increased fi shing eff ort, these rose to a maximum of
Catches of West Coast Rock Lobster (Jasus lalandii) have declined in
400 000 tonnes in the early 1960s before a steady decline to below
both Namibia and South Africa. South African catches were stable
100 000 tonnes per year from the late 1960s until the mid-1990s.
at around 9 000 tonnes per year during the 1940s and 1950s, but
Acoustic surveys conducted since 1984 indicate a steady increase in
declined to around 1 500 tonnes per year from the 1960s to the mid-
spawner biomass (Hampton et al. 1998), suggesting an increase in the
1990s, with sharp catch declines having been noted in the late 1960s,
Sardine stock in South African waters. Namibian Sardine catches show
and early 1980s and 1990s (Hampton et al. 1998).The Namibian catch
a similar pattern, with catches increasing from around 200 000 tonnes
records show the same pattern of decline, with only a few hundred
per year in the early 1950s to a high of almost 1.4 million tonnes in the
tonnes being landed per year in the mid-1990s. The Namibian stock is
late 1960s. A dramatic decline followed this peak, with a subsequent
estimated at a total of approximately 3 000 tonnes, while South African
slight increase in catches again until the stock collapsed dramatically to
stocks are estimated to be at approximately only 35% of their pristine
below 50 000 tonnes in the late 1970s (Hampton et al. 1998). There are
levels (Hampton et al. 1998). Over the last 15 years, a decrease in the
no signs of recovery in catches. It is considered that the stock collapse
abundance of an important food source of rock lobsters, unfavourable
was primarily due to overfi shing of the resource (Hampton et al. 1998).
environmental conditions (i.e. El Ni˝o) and a recent increase in the
occurrence of red tide events, have caused a decrease in the growth
Historical catch fi gures for Anchovy (Engraulis capensis) indicate a strong
rates of the West coast rock lobster (Cockroft & Payne 1999, Pollock et al.
stock decline in the Namibian fi shery. Since its beginnings in 1966, the
1997). These low growth rates have resulted in decreased recruitment
fi shery landed approximately 200 000 tonnes per year. In 1987 the total
into the harvestable component of the population and decreased
catch in Namibian waters was approximately double the previous
spawning biomass (Cockroft & Payne 1999). This reduced recruitment
annual average, and this has been attributed to an anomalous infl ux
to the fi shery, coupled with unsustainable fi shing pressure (SADC 2002),
of recruits from the South African stocks (Hampton et al. 1998). During
has resulted in the rock lobster resource being considered heavily
the 1990s, however, catches declined to below 50 000 tonnes per year,
depleted (Cockroft & Payne 1999).
with almost no catches being recorded in 1996 and 1997. Acoustic
survey estimates of Anchovy in Namibian waters indicate a decline
Many of the region's linefi sh stocks are rated as overexploited or
in the stock from approximately 200 000 tonnes in the early 1990s to
collapsed (Griffi
ths 1999, Griffi
ths et al. 1999, Mann 2000, SADC 2002). The
less than 100 000 tonnes since, and the stock is considered to be in a
overexploited or collapsed stocks include, among others, the Geelbek
depleted state (Hampton et al. 1998).
(Atractoscion aequidens), Silver Kob (Argyrosomus inodorus), Roman
(Chrysoblephus laticeps), Seventy-four (Polysteganus undulosus) and Red
Catches of Horse Mackerels (Trachurus spp.) in South African waters
Stumpnose (Chrysoblephus gibbiceps) (Griffi
ths 1999, Griffi
ths et al. 1999,
have also shown marked declines. After reaching a maximum catch of
Mann 2000) in South Africa, and Silver Kob (Holtzhausen et al. 2001) and
118 000 tonnes in 1954, catches declined steadily until the 1970s when
Orange Roughy (Hoplostethus atlanticus) (Boyer et al. 2001, McAllister &
they became negligible, never reaching more than 10 000 tonnes per
Kirchner 2001) stocks in Namibia. The principle target species of the
year (Hampton et al. 1998). The results of acoustic biomass surveys of
South African gill and beach seine fi sheries, Harders or Mullet (Liza and
Horse mackerels in South African waters are currently unreliable due
Mugil spp.), also appear to be overexploited in the most heavily fi shed
to spatial and temporal discrepancies in the availability of the stock to
areas (Hutchings et al. 2000, Hutchings & Lamberth 2002).
sampling (Hampton et al. 1998).
The Abalone (Haliotis spp.) stock has been declining since 1996 and is
Although past declines in catches of Hakes (Merluccius spp.) have been
considered to be on the brink of collapse as a result of illegal fi shing
documented in the Benguela, the introduction of strict controls on
linked with an ecological shift in species abundances (Tarr 1998, 2000,
these species appear to be working and the stocks appear to be stable
Tarr et al. 1996, 2000).
(Hampton et al. 1998). Biomass survey estimates support the catch
data in suggesting that the stocks are stable, and even indicate that
Excessive by-catch and discards
there may be an increase in the biomass of Hakes in the Benguela in
By-catch is a feature mostly of the large fi sheries, especially the pelagic
more recent years (Hampton et al. 1998). Stocks of Kingklip (Genypterus
and demersal fi sheries. By-catch is controlled by strict laws, including
capensis), a by-catch species and sometimes target of the demersal
observers in some fi sheries and self-policing where the by-catch is used
36
GIWA REGIONAL ASSESSMENT 44 BENGUELA CURRENT
as a luxury product. South Africa initiated observer programmes for the
Indeed, although the catches of certain linefi sh in the region, such as
trawling industry in 1955 (Hart et al. 1998). In the demersal trawl fi shery
Yellowtails (Seriola spp.) and Snoek (Thyrsites atun) have increased over
of South Africa, 10% of the total catch by mass is composed of discarded
the past decade, current catch rates are less than 60% of historical rates
fi sh (Walmsley-Hart et al. 2000). Both the South African and Angolan
(Griffi
ths 1999). For other linefi sh species, catch rates have declined far
purse seine fi sheries yield a by-catch of between 10% and 20% of the
more dramatically, with catch rates of under 5% of historical catch rates
total catch by mass (calculated from Tables III and VII of Crawford et
for over half of the 25 stocks investigated (Griffi
ths 1999), and nearly all
al. 1987). Overall, the impacts associated with by-catch are considered
under 25%.
slight in the region.
Despite such heavily depleted stocks and declining CPUE, the number
Destructive fi shing practices
of participants in the linefi sheries remains high, and applicants
The impacts of destructive fi shing practices are assessed as moderate
by potential new entrants continue unabated. This does however
in the region. Destructive fi shing practices include primarily trawling,
not mean that there has been no signifi cant economic impact of
but there is also some dynamite fi shing (artisanal fi sheries) in Angola. No
overexploitation on these fi sheries. The reason for this phenomenon
documented quantifi cation of either the extent of damage caused by
can largely be explained by the concept of "eff ort subsidisation", which
destructive fi shing practices or the impacts on fi sh stocks is available.
can happen in three ways, as follows (Griffi
ths 1999):
Part-time commercials: Fishers who have commercial access to
Decreased viability through pollution and disease
the fi shery but generate income elsewhere. These are eff ectively
There are no known impacts of decreased viability through pollution
recreational fi shers who cover the costs of their sport by selling part
and disease in the region. There is no evidence, and there are no data
of their catch. In fact, less than 20% of boats catch more than 80%
directed at this issue. It is however suggested that the introduction of
of the reported catch.
alien parasites (e.g. sabellid worms which bore into mollusc shells)
Multiple access: Participants who have access to more lucrative
through aquaculture operations may have some eff ect on local stocks,
resources (e.g. tuna and rock lobster), and only focus on linefi sh
but there is no evidence to support this.
when they are abundant or when other target species are
unavailable.
Impact on biological and genetic diversity
New entrants: Permit holders that are unable to make a profi t sell
A few introduced species are known from the Benguela Current region.
within a couple of years to optimistic new entrants, who follow a
The major impacts stem from the Mediterranean Mussel (Mytilus
similar cycle. It is estimated that as many as one third of commercial
galloprovincialis) and are considered moderate. M. galloprovincialis
linefi sh permits change hands each year.
has largely displaced the indigenous Intertidal Mussel, Aulacomya
ater, (Griffi
ths et al. 1992), but since both mussel species grow in
Thus, the economic impacts of overexploitation in the linefi sh sector
multi-layered and structurally heterogeneous matrices, they support
are subtle, but would probably be measurable in terms of decreased
similar interstitial communities (Hockey & Van Erkom Schurink 1992).
incomes to individual participants. This is also supported by the
M. galloprovincialis has competitively excluded the large individuals of
continuing reduction in the number of active commercial vessels
the limpets, Scutellastra granularis (Griffi
ths et al. 1992) and Scutellastra
since 1989 (Griffi
ths 1999).
argenvillei (Steff ani 2001), from the primary rock space. The Mytilus
Net fi sheries, while concentrating on Harders or Mullet, generally have
beds have, however, provided a large smooth substratum for juvenile
relied on a small permissible by-catch of linefi sh species to turn a
Scutellastra granularis, which has prevented the build-up of epiphytic
good profi t. With the overexploitation of these species, it is becoming
macroalgae such as Gigartina and Pterosiphonia spp., thus aff ecting the
evident that this fi shery is also in economic decline. As is the case
algal communities (Hockey & Van Erkom Schurink 1992).
with the linefi sheries, the small-scale net fi sheries appear to support a
considerable number of participants despite declining catches. Again,
Socio-economic impacts
the explanation lies largely in the three types of "eff ort subsidisation"
Economic impacts
outlined above. An economic analysis of the fi shery reveals that very few
The economic impacts of the concern Unsustainable exploitation of
participants generate their main income from the fi shery, and very few
fi sh and other living resources is assessed as moderate in the region. In
make any signifi cant profi t (Hutchings et al. 2000). In eff ect, as stocks in
the case of fi sheries, a decrease in Catch Per Unit Eff ort (CPUE) translates
the line and net fi sheries have declined, and eff ort has continued at a
into increased costs, or decreased profi ts, for commercial fi shers.
high rate, the profi ts, or rents of the fi sheries have been dissipated by an
ASSESSMENT
37
increasingly high proportion of revenues being spent on fi shing eff ort.
spite of this, recreational angling has been one of the fastest growing
Thus, even in the case of linefi sh where overall catches and landed
sports in the last decade. Although recreational anglers may redistribute
values may not have changed dramatically, the profi tability of these
themselves to some degree in response to local changes in catch rate
fi sheries has been signifi cantly undermined by the escalating costs of
due to depletion, the demand for fi shing is not greatly aff ected by overall
the eff ort per unit of fi sh caught.
average stock condition. Recreational anglers quickly adapt to the level
of eff ort required to catch fi sh, and the value of this fi shery is probably
In some of the commercial invertebrate fi sheries, on the other hand,
the least sensitive to overexploitation of any fi shery. The eff ort, mostly
overexploitation has reached the level that total landed catches have
comprising leisure time, carries very little cost to recreational anglers,
begun to decline. Stocks of several invertebrate species, especially
and thus expenditures cannot be expected to change signifi cantly until
rock lobster and abalone, have been subject to dramatic local
catch rates virtually fall to zero.
overexploitation, and overall catches have declined markedly in the past
10 years. In the case of the rock lobster, stocks have been "mined" down
Health impacts
to a level where they are now sensitive to growth rate changes. When
Overexploitation of fi sh resources may thus have implications for the
stocks are overexploited to the extent that catches decline, or quotas
diet and consequently the health of subsistence fi shers. There are no
are reduced, this means that the gross income of the fi shery is aff ected.
substantial health issues associated with overexploitation in the region,
Prices may increase in response to greater scarcity, ameliorating this
as there is not a great reliance on fi sh or other aquatic resources as a
eff ect to some degree. Thus, it is principally the changes in eff ort that
protein source. Subsistence fi sheries may form an important protein
have an economic impact, and secondarily, a reduction in catches.
source in those households which rely on them, even though these
fi sheries do not form a major component of the fi sheries of the Benguela
Overexploitation has quite diff erent types of impacts on subsistence
Current region as a whole. Although there are no known cases of direct
users. Instead of translating to profi ts and income generated, the costs
starvation, overexploitation leads to increasing poverty levels of those
to subsistence users can be considered in terms of time and nutrition.
that depend on the resources. There are also numerous indirect impacts
Subsistence fi shers generally live close to where they harvest, and
on human health (related to poverty caused by overexploitation). These
harvest over relatively short sections of coast (<20 km) (Clark 1999). Local
include alcoholism, family violence, and many others. Health impacts
overexploitation of stocks results in harvesters having to travel further
are therefore assessed as moderate in the region (Members of the GIWA
to search for food, a factor that may have serious time costs for women
Task team pers. comm.).
who also have to devote time to cultivation, fuel and water collection
and other household chores. Subsistence fi shers do not constitute a
Other social and community impacts
major component of fi shery users in the southern parts of the Benguela
Other social and community impacts of the concern Unsustainable
Current region, but form a greater component in the more northerly
exploitation of fi sh and other living resources are assessed as moderate
areas, particularly on the Angolan coast. Subsistence fi sheries provide
in the region. Overexploitation leads to a decrease in commercial
an important source of protein to those households which rely on them,
viability of fi shing operations, and results in unemployment and
and their depletion may adversely aff ect the diet and consequently
increasing poverty. Intermittent employment also results in family
the health of household members. All of these factors contribute to
disruptions. In addition, overexploitation leading to decreased resource
the productivity, and thus the well-being, of rural households, but are
availability results in confl icts between user groups. Existing resource
diffi
cult to measure in conventional economic terms.
use patterns, although they may be unsustainable, especially in the
light of increasing population pressure, are diffi
cult to change as they
Recreational fi sheries are more important in South Africa than the
are seen as a traditional right.
other two countries, but interest in this recreational outlet in Namibia is
increasing rapidly. Recreational fi sheries generate more income in South
Marine resources form an important protein supplement in a wider
Africa than all the other fi sheries combined. While the recreational catch
southern African context, with land-locked countries depending on
is substantial, it is far lower than the commercial catch, although more
the export of marine resources from maritime states, including those
comparable to the small-scale commercial catches. Recreational anglers
in the Benguela Current region in order to supplement their food supply
target many species in common with the commercial linefi sheries, and
(Hara 2001). The overexploitation of the resources in the Benguela
the recreational CPUE has also undergone a marked decline over the
Current region would result in the cessation of this export trade. This
past two decades (Van der Elst 1989, Bennett 1991, Griffi
ths 1999). In
would cause an economic loss for the countries within the Benguela
38
GIWA REGIONAL ASSESSMENT 44 BENGUELA CURRENT
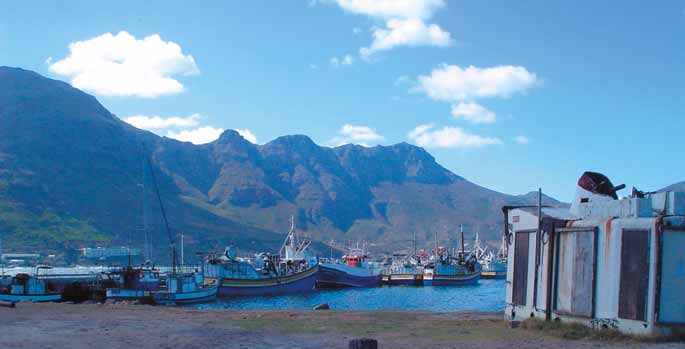
Current region, a loss of employment opportunity for people within
In December 2000, Mr Vali Moosa, the Minister of Environmental Aff airs
the region, and may have adverse eff ects on health in other southern
and Tourism in South Africa, banned the commercial linefi shing of 40
African countries.
fi sh species that were known to be overexploited. This resulted in the
loss of up to 300 jobs. In 2001, it was announced that the application
The abalone resource, which is overexploited, has become a lucrative
fees for commercial fi shing rights would be increased from 13 to
resource. As a result, crime syndicates have become established, illegally
800 USD. This amount would be non-refundable, putting a strain on the
fi shing already greatly depleted stocks (Hauck & Sweijd 1999). This has
applicants (Members of the GIWA Task team pers. comm.). In July 2003,
led to the oppression of the people in the relevant coastal areas,
it was announced that the number of fi shing licences for the linefi shery
who live in fear of the syndicates, making cooperation with fi sheries
would be decreased as a result of potential stock collapse due to
management authorities diffi
cult. The collection of abalone became
overexploitation. It was decided that 450 vessels would be allocated
even more lucrative than other employment options (Hauck & Sweijd
rights, maintaining 3 450 crew. There were a total of 742 applications
1999). In addition, the overexploitation of abalone has led to major
for fi shing licenses, and approximately 300 applications were denied.
confl icts between user groups. This is an extreme case, but shows the
Eight out of 40 vessels in one small harbour (Kalk Bay) and two out
indirect socio-economic eff ects of overexploitation.
of 100 ski-boats in another (Hout Bay) were allocated rights (Figure 9)
In South Africa, the fi shing industry is valued at approximately
(Members of the GIWA Task team pers. comm.). This has led to protest
400 million USD, and employs approximately 26 000 people. The
meetings by the fi shermen who are left without a means to provide an
Western Cape Fishing Industry is responsible for 90% of the total value
income for their families and has led to illegal fi shing by those who were
(Western Cape Fishing Industry 2005). The industry is currently being
denied fi shing rights (Members of the GIWA Task team pers. comm.).
restructured to increase access for previously disadvantaged fi shermen
Overexploitation of stocks can therefore result in unemployment and
and to boost smaller players through the reallocation of fi shing quotas.
increased criminal activity, which in turn has economic implications in
Overexploitation of the South African West coast rock lobster has resulted
terms of increased policing eff ort.
in fi sheries managers adopting a cautious management policy (Cockroft
& Payne 1999). As a result the quota system and Total Allowable Catch
Conclusions and future outlook
(TAC) has not yet stabilised and user groups are operating on short-term
The large-scale commercial demersal and pelagic fi sheries were
contracts. This has resulted in instability in the industry.
probably the fi rst to encounter the impacts of overexploitation in the
Benguela Current region. These fi sheries have experienced dramatic
Figure 9
Fishing vessels in Hout Bay, South Africa.
(Photo: M. Karlsson)
ASSESSMENT
39
declines in stocks and CPUE, and have experienced years of TACs well
trend has also been noted in Sea Surface Temperature (SST) data for
below the maximum or optimal sustainable yields that could have been
the southeast Atlantic, corresponding to an increase of about 1░C in
maintained in a well managed fi shery. With greatly improved means of
the period 1920 to 1988 (Taunton-Clark & Shannon 1998). No large-
stock assessment and quota setting, as well as stricter enforcement,
scale systematic linear trends are evident in rainfall patterns during
the fi sheries are now considered to be well managed, though some are
the 20th century (Tyson et al. 1975, Tyson 1986), but some evidence
still in a state of recovery and have not returned to their full potential.
is available to suggest that variability and extremes are increasing in
The catches in these fi sheries have been relatively stable over the past
the drier western parts of the Benguela Current region (Tyson 1986,
10 years, and these fi sheries can be considered to have adapted to, or
Nicholson 1993, Nicholson 1986, Mason et al. 1999).
recovered from the impacts of past overexploitation. Furthermore, it is
unlikely that these stocks will be as badly overexploited in the future
A trend of increasing upwelling intensity has been observed in the
as some of them have been in the past. The same cannot be said for
Benguela Current over the last four decades (Shannon et al. 1992),
the smaller, lower value fi sheries in the region. Most of these fi sheries
mirrored by similar trends in most of the other major coastal ocean
are not well managed, and continue to operate outside of sustainable
upwelling centres in the world (Bakun 1990). Bakun (1990) believes
limits. This is particularly evident in fi sheries with a large number of
that these changes are a function of the build-up of CO and other
2
participants and/or where entry into the fi shery does not require a
greenhouse gasses in the atmosphere. He argues that the CO build-up
2
large capital investment. These fi sheries require urgent management
has enhanced daytime heating and reduced night-time cooling, and
intervention in order to reduce eff ort and allow stocks to recover such
has lead to an intensifi cation of continental lows adjacent to upwelling
that maximum benefi t can be realised.
regions. This in turn, he argues, has increased on-off shore pressure
gradients, intensifi ed alongshore winds and hence has accelerated coastal
South Africa and Namibia have adopted the "user pays" principle
upwelling. With intensifi ed upwelling one would expect an increase in
but management and enforcement requirements for most of these
primary productivity, but data from the Benguela Current indicate that, if
small fi sheries far exceed the tax revenue that can be extracted
anything, chlorophyll a concentrations have declined in recent decades
from the participants. An alarming proportion of inshore species are
(Brown & Cochrane 1991). Abundance of zooplankton, on the other hand,
overexploited, several having collapsed to below 10% of their pristine
has increased over a similar period (Verheye et al. 1998).
spawner biomass. Interestingly, however, overall catches of linefi sh have
remained relatively stable over the past 10 years. Catch fi gures, however,
Environmental impacts
do not refl ect changes in CPUE, which generally declines with a decline
Changes in the hydrological cycle
in stock size. Unless small-scale commercial fi shing eff ort is drastically
Rainfall at four locations in South Africa during the 1990s was not
curtailed, these fi sheries may be expected to have virtually no value
shown to diff er from the average for the period from 1960 to 1989
within the next 10 years. Indeed, it is estimated that an eff ort reduction
(Department of Environmental Aff airs and Tourism 2000). However, all
of 60% is required to achieve maximum economic yield from the net
models predict that rainfall in the region, which already suff ers from
fi shery for example (Hutchings et al. 2000).
aridity, will decline. By the 2050s Namibia is expecting a decrease in
rainfall of between 2.5 and 7.5%, an increase in evaporation of between
4 and 16%, and an increase in rainfall variability of between 5 and 15%
(Ministry of Environment and Tourism 2002). Extreme events such as
Global change
droughts and fl oods appear to be increasing in frequency, intensity and
magnitude (Ministry of Environment and Tourism 2002) and the impacts
T
T
C
C
A
A
of this issue in both fresh and marine waters are considered moderate.
IMP
Freshwater component IMP
Marine component
There is a lack of data regarding cause and eff ect in freshwater systems.
The Intergovernmental Panel on Climate Change (IPCC) have stated
However, models indicate severe reductions in mean annual run-off
unequivocally that the Earth's climate is changing. Recent temperature
and mean annual precipitation in southern Africa, suggesting that an
trends over the southern hemisphere (1950-1985) indicate a warming
assessment of the impacts as severe may be more appropriate.
trend of 0.1 to 0.5░C per decade in the lower trophosphere, rising to 0.2
to 0.8░C in the latter part of this period (1966-1985) (Tyson 1990, Karoly
Sea level change
1988). Warming in the Benguela Current region (i.e. west coast of South
There is some evidence of sea level change in the region. Long-term
Africa) in this period was about 0.6░C (Tyson 1990). A slight warming
tide gauge records from a number of locations in Namibia and South
40
GIWA REGIONAL ASSESSMENT 44 BENGUELA CURRENT
Africa indicate that sea levels have risen by approximately 1.2 mm per
phenomena. These include injury and death, as well as infrastructure
year over the last three decades (Hughes et al. 1991, Brundrit 1995),
collapse leading to increases in water-borne diseases. Health impacts
a rate consistent with global sea level rise related to global warming
are thus considered slight in the region at present.
(Department of Environmental Aff airs and Tourism 2000). No known
loss of marine populations of organisms has occurred, however, and
Other social and community impacts
the known impacts are thus considered slight in the region. The current
There is some social disruption caused by extreme events but, at
trend of rising sea level is thus expected to accelerate in the future, with
present, this is considered to be having a very slight impact.
recent estimates indicating a 12.3 cm rise by 2020, 24.5 cm rise by 2050
and a 40.7 cm rise by 2080 (Nicholls et al. 1999).
Conclusions and future outlook
Relationships between biological and physical environmental
Increased UV-B radiation
processes are not well understood for the Benguela Current. Even
Measurements of UV-B radiation at Pretoria and Cape Town in South
greater uncertainty must thus be attached to projections regarding
Africa indicate no change between 1994 and 1998 (Department of
eff ects of climate change on marine biota, than to the changes
Environmental Aff airs and Tourism 2000). This data set is, however,
themselves. Most scientists are of the opinion, however, that change
unlikely to be of suffi
cient length to indicate any long-term trends in
in wind stress in the Benguela Current region is likely to have more
UV-B radiation. However, UV-B, measured as Minimum Erythema Dose
pronounced consequences for marine biota than other eff ects such
(MED), in both cities is suffi
ciently high to be classifi ed as "dangerous"
as increasing temperature, sea level rise, changing rainfall and river
and "very dangerous" for almost half of the year (Department of
run-off to the coastal zone, because of its infl uence on large-scale
Environmental Aff airs and Tourism 2000). For these reasons, a moderate
oceanographic processes (Siegfried et al. 1990, Brown & Cochrane 1991,
impact is assessed for freshwater systems for this issue, while marine
Clark et al. 2000, Lutjeharms et al. 2001). Increases in wind stress over the
systems are assessed as having no known impact.
Benguela Current region (considered to be the most likely outcome of
climate change) is expected to result in an intensifi cation of upwelling,
Changes in ocean CO source/sink function
increased nutrient availability, enhanced primary production, increased
2
Scientists in the region suspect that alteration of the ocean CO source/
advection of cold upwelled water off shore, reduced rainfall over the
2
sink function has occurred, but have no direct evidence to support this.
adjacent subcontinent, all of which could aff ect pelagic and demersal
The issue is thus assessed as having slight impacts in the region.
food webs and fi sh production. Pelagic fi sh recruitment is dependent
on a balance between food supply and losses across the open ocean
Socio-economic impacts
boundary, both of which are a function of wind stress. Best recruitment
Economic impacts
appears to occur under intermediate conditions and hence may be
Costs associated with global change include the costs of managing
negatively aff ected if upwelling intensifi es or diminishes.
fi sheries to ensure their long-term sustainability, and the costs of
damage to infrastructure caused by extreme events. There is a
Another phenomenon of the Benguela Current system that will be
large concern, however, about the links between global change
aff ected by changes in wind dynamics is the irregular occurrence of
and certain climatological phenomena. This lack of evidence leads
Benguela Ni˝os (Shannon et al. 1986, Crawford et al. 1990, Siegfried et
to great uncertainty about the economic impacts of global change
al. 1990, Lutjeharms et al. 2001). These events generally coincide with
because, although we may know that these exist at present, we may
periods of low or sharply reduced zonal wind stress in the Western
not necessarily be able to link these directly to global change. The
Equatorial Atlantic, and are characterised by the sudden collapse of
GIWA Experts therefore consider that there is too much uncertainty
the Angola-Benguela Front and a polewards fl ow of warm water along
surrounding the economic impacts of global change to be able to rate
the coast from Angola into Namibia. They are usually accompanied by
the impact as more than unknown.
a southward penetration of tropical species such as Sardinella aurita and
certain copepod species normally only found from Angola northwards,
Health impacts
a decrease in primary production off Namibia, southwards displacement
The number of people currently aff ected by global change was not
of local (Namibian) fi sh stocks, an infl ux of low oxygen water from the
deemed to be large. The major health problems associated with global
north and associated mortalities of fi sh and other organisms. It is
change are skin cancers related to increased UV-B radiation as a result
believed that changes in the equator-pole temperature gradient and
of ozone depletion, and events related to extreme climatological
poleward shifts in oceanic and atmospheric systems (considered to be
ASSESSMENT
41
a likely consequence of climate change) may lead to an increase in the
frequency or intensity of fl ooding, has several major consequences
frequency and intensity of these events with immediate consequences
for estuaries (Reddering & Rust 1990). These include changes in the
for the upwelling system, SSTs in the region and biota of the coastal
erosional capacity and other sedimentary processes, depth profi les,
zone (Siegfried et al. 1990, Lutjeharms et al. 2001).
mouth confi guration, duration of the open phases and tidal prism
within an estuary. Sand shoals situated in the mouths and lower reaches
Changes in the infl uence of the Agulhas Current on the Benguela system,
of estuaries will grow larger, constricting the channel and reducing tidal
brought on by changes in wind stress, may also be important in the
exchange with the sea. Ultimately this will have the eff ect of increasing
future. The Agulhas Current fl ows down the east coast of South Africa
the frequency and length of time for which the mouths will close. A
and terminates in a tight loop south of the African sub-continent, the
change in fl ow may also be accompanied by changes in nutrient levels,
Agulhas retrofl ection. The current normally follows an extremely stable
suspended particulate matter, temperature, conductivity, dissolved
trajectory but is periodically (4-6 times per year) interrupted by a solitary
oxygen and turbidity (Drinkwater & Frank 1994), all of which play a
meander, the Natal Pulse, that causes the current to shed a ring of warm
role in structuring biological communities in estuaries. Many estuaries
water when it reaches the retrofl ection area. These rings then drift off into
will simply remain closed for much of the year or for several years at
the South Atlantic or up the west coast (Lutjeharms & Van Ballegooyen
a time thereby excluding many marine species. Many marine fi sh in
1988, Lutjeharms & Gordon 1987, Gordon & Haxby 1990). These rings have
southern Africa make use of estuaries as nursery and breeding grounds
been observed to interact with upwelling plumes and can contribute to
(Wallace et al. 1984), estuaries on the west coast of South Africa being
the failure of Anchovy (Engraulis capensis) recruitment in the southern
disproportionately more important than in the rest of the country due
Benguela and to a tendency for winter depressions moving past the
to the paucity of sheltered embayments along this coast (Bennett 1994).
southwestern Cape to intensify (Duncombe Rae et al. 1992, Brundrit &
These fi sh have adapted their breeding habits to take advantage of the
Shannon 1989). Increases in wind stress over the south Indian Ocean (also
seasonal opening and closure of river mouths. Seasonal changes in river
a projected consequence of climate change) may lead to an increase in
fl ow are likely to alter the timing of the open and closed phases and
frequency of the Natal Pulse and consequently to an increased fl ux of
will impact negatively on recruitment into these systems. A reduction
Agulhas rings into the south Atlantic, with concomitant eff ects on the
in freshwater run-off is also likely to result in a reduction in the extent
biota (Lutjeharms & de Ruiter 1996, Lutjeharms et al. 2001).
to which wastewater discharges are diluted before reaching estuaries.
The concentration of pollutants in estuarine waters will increase while
Temperature is generally considered to be one of the most important
levels of dissolved oxygen will decrease, reducing the capacity of these
physical variables controlling the life of all aquatic organisms. Changing
environments to support biological communities.
global temperatures could thus also have far reaching consequences
for marine organisms in the Benguela Current region. The most
The potential impacts of sea level rise on the coastal environment
obvious changes that can be expected with increasing SSTs around
of the Benguela Current region include increased coastal erosion,
the country, is that individual species or species assemblages will
inundation, increased saltwater intrusion and raised groundwater
shift their distribution patterns in response to changing temperature
tables and increased vulnerability to extreme storm events (Klein &
regimes. This is likely to be most pronounced in those species that are
Nicholls 1999). Several major cities such as Cape Town, Walvis Bay and
most temperature sensitive or whose distribution patterns are strictly
Swakopmund, are situated at sea level and are thus at risk from some or
governed by temperature. Cold-tolerant species typically found only
all of these sources. Lutjeharms et al. (2001) are of the opinion that the
on the cool temperate west coast are likely to become more restricted
impact of sea level rise on the ecological functioning of the Benguela
in their distribution in the face of increasing temperatures. They may
system is likely to be insignifi cant, except in shallow coastal lagoons
retreat to greater depths or become restricted to the immediate vicinity
and estuaries where much of the marine production is linked to salt
of the stronger upwelling cells. Some of the warm-tolerant species from
marsh ecosystems. In areas where sea levels are rising and a strong
the east and south coasts may expand their ranges southwards and
supply of sediment is absent, marshes rapidly become water logged or
westwards, possibly even extending around Cape Agulhas onto the
completely inundated and species unable to tolerate these conditions
west coast (Members of the GIWA Task team pers. comm.).
or the increased salinity from marine waters, die back and expose the
underlying sediments to further erosion (Beeftink 1979).
Projected changes in stream fl ow (a function of changing rainfall
patterns) are likely to have serious consequences for estuaries of the
Certain minor responses can be expected of marine plants and algae
Benguela Current region. Any reduction in fl ow, particularly in the
as a result of elevated CO levels in the atmosphere. Some plants (e.g.
2
42
GIWA REGIONAL ASSESSMENT 44 BENGUELA CURRENT
seagrasses) are expected to show enhanced photosynthetic rates and
Box 1
Climate models.
growth, while others (e.g. intertidal macroalgae) are already CO saturated
Numerical models generally referred to as Global Climate Models (GCMs), provide
2
the only quantitative estimates of future climate change. A large number of GCM
and may not show any response (Beardall et al. 1998). Some response
experiments have been completed recently, employing a variety of different
models. It must be acknowledged, however, that the ability of these models to
can also be expected from increases in ultraviolet radiation reaching the
provide accurate predictions is still questionable, particularly with respect to
Earth's surface, related to losses in ozone from the upper atmosphere
regional level prediction (Michell & Hulme 1999).
Ragab & Prudhomme (2002) provide predictions of changes in land surface
due to human production of chlorofl uorocarbons (CFCs). Eff ects of
temperature and precipitation for southern Africa including the countries
bordering the Benguela Current region (Angola, Namibia and South Africa)
increasing UV-B radiation are likely to be minor in comparison to other
generated by the UK Hadley Centre╠s global climate model using the IS92a forcing
scenario (this assumes an increase in atmospheric CO2 of 1% per year). They predict
eff ects of climate change, though. Enhanced UV-B fl uxes are likely to
that by 2050 annual average temperatures will have increased by between 1.0 and
favour species with UV-B tolerance or repair mechanisms (Beardall et
2.75░C. Winter increases (1.0-3.0░C) are projected to be slightly greater than summer
increases (1.0-2.75░C). Predicted changes in average annual rainfall in 2050 over the
al. 1998). Intertidal species, for example, generally show less inhibition
Benguela Current region varies widely, ranging from ˝25 to + 25%. Average rainfall
over the South African west coast is expected to decrease by 0 to 15% (slightly
of photosynthesis by UV-B radiation than their subtidal counterparts.
worse in summer than winter), to increase on average by 5 to 25% in the southern,
central and extreme northern parts of Namibia (summer and winter being similar),
Increases in UV-B fl uxes may thus exert some sort of control over species'
to decrease on average (0-10%) in the lower northern parts of Namibia (summer
distribution patterns (Larkum & Wood 1993, Beardall et al. 1998). UV-
worse than winter), and to increase in southern Angola during winter (5-10%) and
decrease in summer (0-20%).
B radiation can also cause damage to early developmental stages of
Schulze et al. (2001) provide predictions of changes in annual rainfall and river
run-off over southern and eastern Africa for 2050 from the UKTR95 GCM and ACRU
fi sh, shrimp, crab and other species (Hńder et al. 1995), and may thus
agrohydrological modelling system. They predict that both rainfall and annual
disproportionately aff ect those species with planktonic larval stages.
run-off will decrease by 0 to 30% across the entire Namibian and South African
west coast, the hardest hit areas being the extreme northern and southern parts of
Namibia and the northern half of South Africa. Arnell (1999) also used data from the
UK Hadley Centre╠s global climate model (HadCM2 and HadCM3) together with a
If the current predictions regarding global change (and in particular
macro-scale hydrological model to simulate river flow across the globe at a spatial
resolution of 0.5 x 0.5. On this basis he predicts that average annual run-off to the
changes in the hydrological cycle and associated rainfall patterns)
Benguela Current would decrease by 0 to 50 mm per year (from an average of 0-200
mm/year), making the percentage run-off change in southern Africa amongst the
materialise, then the environmental impacts of the concern are likely
highest in the world. These projections correspond closely with those reported
to become a lot worse in the future. Confi dence in these predictions is
by Clark et al. (2000) who estimated that reduction in run-off from four rivers on
the South African west coast to be in the region of 35 to 84% if CO2 levels doubled
not very high, however, especially in terms of the timescale over which
(using the HADCM2 GCM coupled to the ACRU modelling system).
Clark et al. (2000) also provide projections of changes in pressure systems and wind
these eff ects will become apparent. One climate model, for example,
fields over southern Africa for spring and summer under a double CO2 scenario, using
predicts a 60% reduction in freshwater fl ow in the Western Cape alone
data from the National Centre for Atmospheric Research╠s (NCAR) Climate System.
This period was chosen as it corresponds to the period of most intense upwelling and
over the next 20 years (for more information regarding climate models
spawning period for pelagic fish in the Benguela system. The results of this analysis
suggest that the South Atlantic High Pressure system will intensify, especially in the
see Box 1). Another factor considered here was that of thresholds, and
late summer months, and will ridge further south and east of the subcontinent than
it does at present. Southerly and easterly winds are expected to increase over the
there was a grave concern that the problem may worsen quickly. A
Benguela Current region as a result, and upwelling is expected to intensify.
decrease in water availability is also likely to cause major social changes
and disruptions in the future, including movements of people, and loss
marine environments, the impacts of Pollution, Habitat and community
of cultural heritage. Communities who move to wells or taps will give
modifi cation, and Unsustainable exploitation of fi sh and other living
up a nomadic lifestyle and become settled. There will also be important
resources are assessed as moderate, and the impacts of Global change
eff ects on fi sheries and agriculture, and by association, with grazing
as slight (Table 14).
patterns. There is large uncertainty in these predictions, however, due
to the large uncertainty of what global change is likely to bring. Baseline
On the basis of the severity of the impacts, two priority concerns were
data and monitoring are going to be important tools in tracking change
chosen for more in-depth analyses. In choosing priority concerns,
and in making forecasts for the future.
consideration was given to choosing one concern which represented
Table 14
Overall score for the fi ve GIWA concerns in the
Benguela Current region.
Score
Priority concerns for further
Concern
Freshwater
Marine
analysis
component
component
Freshwater shortage
Severe
Not assessed
Pollution
Severe
Moderate
In the region's freshwater the combined environmental and socio-
Habitat and community modification
Moderate
Moderate
economic impacts of the concerns of Freshwater shortage and Pollution
Unsustainable exploitation of fish and other living resources
Not assessed
Moderate
are assessed as severe, while Habitat and community modifi cation is
Global change
Slight
Slight
assessed as moderate, and the impacts of Global change as slight. In
ASSESSMENT
43
freshwater environments, and one which represented marine
transboundary implications. For these reasons, Freshwater shortage was
environments. The two concerns chosen were Freshwater shortage
highlighted as a priority concern, and within this, modifi cation of stream
and Unsustainable exploitation of fi sh and other living resources.
fl ow was deemed the most important contributing issue.
Further justifi cation for the selection of these two GIWA concerns for
further analysis follows.
Unsustainable exploitation of fi sh and other living resources was
selected as a priority on the basis of the justifi cations given in the
Freshwater shortage was selected as a priority concern on the basis of
Assessment and for the reasons outlined here. Overexploitation is
the justifi cations given in the Assessment and for the reasons outlined
a widespread problem in the region, and aff ects a large number of
here. The region is arid in nature, and already suff ers from problems
living resources, including several on which local people rely for their
of increasing demand and decreasing supply of freshwater. Huge
livelihoods. The problems are primarily related to marine systems, and
decreases in river fl ow have already been evidenced in the region,
have important biological and socio-economic impacts. Despite eff orts
with the result that a number of permanent rivers have become
at management, declines in catches have been documented for many
intermittent in nature, while some intermittent rivers have ceased to
fi sh and invertebrate stocks. In many cases, and particularly in inshore
fl ow. Microbiological pollution from urban point sources and informal
fi sheries, these are exacerbated by illegal fi shing. Besides the obvious
settlements, and overabstraction of aquifers with long regeneration
biological impacts of such overexploitation, there are also profound
times further reduce the available water supply and compromise
impacts on the socio-economic environment, including among
the long-term sustainable use of freshwaters in the region. These
others, direct economic losses, job losses, and losses of livelihoods for
environmental impacts lead to very serious socio-economic impacts,
subsistence fi shers. While it seems feasible that overexploitation in the
including the high costs of alternative water sources, increases in water-
large commercial fi sheries, which are relatively easily regulated, will
borne diseases, confl icts over water, relocation of people for dam
improve by 2020, grave concerns remain regarding the future of the
construction, and loss of nomadism and traditional customs. In addition,
smaller fi sheries which are not as easily regulated, and it is likely that
impacts on freshwaters often result in downstream impacts on other
these will continue to be overexploited.
ecosystems, including estuaries and coasts, and often have signifi cant
44
GIWA REGIONAL ASSESSMENT 44 BENGUELA CURRENT
Causal chain analysis
This section aims to identify the root causes of the environmental
half of the population of the Benguela Current region. The scarcity
and socio-economic impacts resulting from those issues and
and unequal distribution of freshwater resources is considered one
concerns that were prioritised during the assessment, so that
of the fundamental factors posing a threat to the economic and
appropriate policy interventions can be developed and focused
social development of the southern African region. The situation is
where they will yield the greatest benefi ts for the region. In order
particularly acute in the Orange-Senqu River Basin as it supplies water
to achieve this aim, the analysis involves a step-by-step process
to the industrial heartland of South Africa, while having to provide
that identifi es the most important causal links between the
livelihoods for people downstream in the arid western part of the
environmental and socio-economic impacts, their immediate
drainage basin.
causes, the human activities and economic sectors responsible
and, fi nally, the root causes that determine the behaviour of those
The headwaters of this system arise in the Drakensberg Mountain
sectors. The GIWA Causal chain analysis also recognises that,
range in the east of South Africa and in Lesotho (Figure 10). In these
within each region, there is often enormous variation in capacity
eastern parts of the region, rainfall is high (2 000 mm), and exceeds the
and great social, cultural, political and environmental diversity.
annual evaporation (1 200 mm). The drainage basin is highly populated
In order to ensure that the fi nal outcomes of the GIWA are viable
and urbanised, with 48% of the population of South Africa living in
options for future remediation, the Causal chain analyses of the
the catchment and relying on its water. Most of South Africa's heavy
GIWA adopt relatively simple and practical analytical models and
industry and mining activities are also situated within the catchment,
focus on specifi c sites within the region. For further details on the
with more than half of South Africa's wealth being supported by water
methodology, please refer to the GIWA methodology chapter.
supplied from the Vaal River (Department of Water Aff airs and Forestry
2005). Much of the catchment is heavily modifi ed by impoundments
and water transfer schemes both removing and augmenting the natural
water supply (see Assessment, Freshwater shortage).
Freshwater shortage in the
Orange-Vaal River Basin
By contrast, at its western extreme, the Orange River fl ows through
hyper-arid areas where the annual evaporation of 3 000 mm greatly
The Orange-Vaal is the largest transboundary river system in the
exceeds the limited rainfall of 50 mm (Davies & Day 1998). This leads
Benguela Current region. Its catchment covers some 1 million km2
to a mean annual precipitation and to mean annual run-off conversion
(Department of Water Aff airs and Forestry 2005), almost 10 times as
rate of less than 10% for the drainage basin as a whole and a rate
large as the second-largest system in the region, the Cunene River,
approaching 1% in some of the drier lower reaches. Population density
which covers an area of 106 500 km2 (Pallett 1997). The Orange-
in these areas is correspondingly far lower than in the upper reaches.
Vaal system stretches over four countries within the region, namely
Agriculture is the major economic activity, with livestock being kept in
South Africa, Lesotho, Botswana and Namibia, with the Orange River
the drier areas, and grapes and vegetables being farmed in a narrow
itself forming part of the political border between South Africa and
riparian strip supported by intensive irrigation drawn from the River. The
Namibia. Water from this system is the primary supply for more than
river estuary is a Ramsar site.
CAUSAL CHAIN ANALYSIS
45

usable mean annual run-
Table 15
Water demand from the
Orange River by sectors.
off in 1990 (Department
of Environmental Aff airs
Sector
Demand (%)
and Tourism 2000).
Irrigation
54
Overabstraction of River losses
32
water is connected to
Environmental demands
10
inappropriate agriculture
Urban/industrial
2
practices, wasteful use of
Consumptive canal losses
2
water, and inappropriate
(Source: Department of Water Affairs and Forestry 2005)
water rights.
Root causes
Political
Political decisions that promoted development by prioritising industrial
use of water, inappropriate irrigated agriculture, and also a low level
of political will to implement existing legislation have contributed to
problems of freshwater shortage in the region. Decisions to maintain
the trend of development, particularly surrounding the highly
industrialised Gauteng Province in the catchment of the Orange-Vaal
system, made necessary the construction of dams to supply water not
only to the industries, but also to the ever-increasing population in the
catchment (Department of Environmental Aff airs and Tourism 2000).
Mining and industry in the catchment of the Orange-Vaal system were
encouraged in order to generate employment, bring about economic
Figure 10 Drakensberg mountains at the border between South
growth and generate foreign earnings. Water was supplied to industry
Africa and Lesotho.
(Photo: M. Karlsson)
and mining preferentially (Department of Environmental Aff airs and
Tourism 2000), with these sectors being favoured as users of water
above the environment or even the local inhabitants.
Immediate causes
Modifi cation of stream fl ow is the key issue surrounding the concern of
Some political decisions, including schemes to protect the northern
Freshwater shortage in the transboundary Orange-Vaal system within the
borders of South Africa by actively encouraging settlement and
Benguela Current region. Annual fl ow data indicate a reduction in fl ow of
farming in these marginal areas, and promoting inappropriate
at least 50% since 1935 (Department of Environmental Aff airs and Tourism
irrigated agriculture, also contributed to cause freshwater problems.
2000). The two principal immediate causes of modifi cation of stream fl ow
Political causes also include the development of irrigation schemes
are the construction of dams and impoundments, and the overabstraction
for the thinly-disguised purpose of vote-gaining, and the creation of
of water from this system (Figure 11). These two causes are so closely
sheltered employment.
linked, and have such similar root causes that they are treated together
for the purposes of the root cause and policy options analyses.
Governance
Failures in governance are primarily related to a lack of coordination
Sectors
between diff erent interests and to confl icts between government
Dams have been constructed primarily to supply water to developing
departments at the policy level. This has frequently left the South
urban areas, to mining and industry, and to agriculture (Department of
African Department of Water Aff airs and Forestry in the position of
Environmental Aff airs and Tourism 2000). Irrigation is by far the largest
having to supply "extra" water to new industrial, mining or agricultural
sectoral user of water from the Orange River, using 54% (Table 15).
developments in the drainage basin, without due consideration of
Data indicate, that in South Africa as a whole, the storage capacity of
the water resource available in the area. Water management in
large and small dams together had already exceeded the maximum
the Orange-Vaal drainage system is highly fragmented, and there
46
GIWA REGIONAL ASSESSMENT 44 BENGUELA CURRENT
Issues
Immediate causes
Sectors/Activities
Root causes
Modification of
Dam construction
Industry/Mining
Political
streamflow
Overabstraction of water
Agriculture
Governance
Domestic
Demographic
Economical
Technological
Legal
Figure 11 Causal chain diagram illustrating the causal links for freshwater shortage in the Orange-Vaal River Basin.
is no basin-wide planning to support an effi
cient management of
immigrants from rural areas seeking jobs. This, together with
water supplies. South Africa's National Water Act (36 of 1998) does,
population growth, has resulted in the catchment of the Orange-
however, attempt to address several of these problems, although
Vaal becoming heavily populated, with a concomitant enormous
poor implementation and enforcement remain serious constraints
demand for freshwater. The response to this has been attempts to
to the eff ectiveness of this legislation. Additionally, in 2000 the four
capture as much water as possible, hence the construction of dams
basin states of the Orange River formed the Orange Senqu River
and impoundments.
Commission (ORASECOM), tasked to serve as a technical advisor to the
countries on the use, development and conservation of the River. As
Economic
an organisation, ORASECOM has a legal personality and is founded on
The dependency of a large and growing urban population on food
the principles of the Revised SADC Protocol on Shared Watercourses
from rural areas has made the economic incentives associated with
as well as the UN Convention on the Non-navigational Uses of
water-thirsty commercial agriculture highly attractive. The enormous
International Watercourses. These principles commit signatories
economic incentives associated with export agriculture, which is
to manage shared waters in a "fair and equitable" way and "not to
often highly inappropriate in relation to local water supplies, have led
cause signifi cant harm" to downstream riparian states. Although the
to a high demand for water for agriculture. Economic causes are also
Commission is newly-formed it is starting to make progress towards
connected to the preferential tariff s given to agriculture, industry and
its goal to promote the equitable and sustainable development of the
mining (Department of Environmental Aff airs and Tourism 2000), to
resources of the Orange River.
try to achieve the self-suffi
ciency desired by South Africa. In the past,
water has not been considered as an economic good in South Africa,
Many of the decisions to supply water preferentially to mining and
and was available free to agriculture while other users paid only low
industry are historical, born from the political and economic desire for
tariff s (Department of Environmental Aff airs and Tourism 2000). This
South Africa to achieve self-suffi
ciency at almost any cost during the
has resulted in a low value being placed on water.
economic sanctions of the Apartheid era. In a region where the water
supply is generally low and highly variable, until recently surprisingly
Technological
little eff ort has been put into managing the demand for water, rather
Improved technology, and in particular irrigation technology, has
than managing the supply thereof. This is not true only in South Africa,
played an immense part in the development of commercial farming,
but also in Namibia (International Rivers Network 2004).
and in particular in the expansion of inappropriate agriculture,
and hence the high demand for water for agricultural purposes.
Demographic
Agriculture is considered to be an ineffi
cient user of water in this
The political decisions to promote development have resulted in
system (Department of Environmental Aff airs and Tourism 2000). There
an infl ux of people to the highly industrialised areas of Pretoria and
is the potential for an increase in irrigated agriculture demand, with
Johannesburg in the form of both migrant labourers and hopeful
studies such as the Lower Orange River Management Study (LORMS)
CAUSAL CHAIN ANALYSIS
47
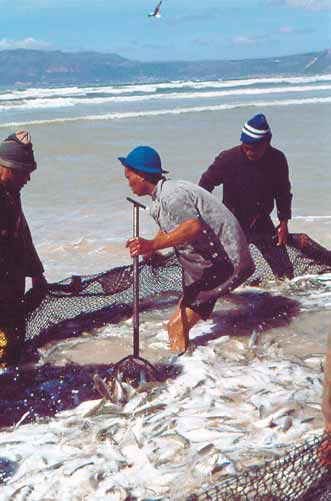
projecting an increase in irrigated water use in the common border
Unsustainable exploitation
area of the Orange River between South Africa and Namibia of over
of inshore finfish in the
100% by 2025 (Department of Water Aff airs and Forestry 2004). Much
Benguela Current
of these lower reaches of the River have to contend with low quality
water, with a high salt content, a problem compounded by the high
rates of evaporation in the area.
The inshore fi nfi sh fi shery in the Benguela Current region is a multi-
species transboundary fi shery which is active in all three coastal
Defi ciencies in the maintenance and upgrading of water supply
countries. It is a multi-user and multi-stakeholder fi shery, with
equipment result in much water being wasted due to avoidable
participation ranging from full-time commercial to part-time semi-
leakages from water reticulation systems such as irrigation canals,
commercial, recreational (including tourism) and subsistence users.
storage dams and pipelines, making it a wasteful and ineffi
cient use
Stocks of individual species are shared between the three countries,
of water.
and between the diff erent user groups. In the South African and
Namibian portions of the Benguela Current region the commercial,
Legal
semi-commercial and recreational sectors form the majority of users
The prevailing water rights in the Orange-Vaal system stem from South
with the subsistence sector being very small, while in Angola the
Africa's colonial history, with landowners also holding ownership over
subsistence sector is a signifi cant user. A variety of capture methods are
water on their property. This riparian-rights system of almost private
employed, including boat-based angling and handlining, shore-based
ownership of water resources has allowed the wholesale building of
angling, beach seine and gill netting, and spearfi shing, as well as illegal
farm dams and concomitant overabstraction of water for agricultural
methods such as the use of explosives (Figure 12).
purposes. Until the shift to democracy in 1994, this system of water
rights was defended by the South African government in order to
protect a limited number of individuals. Under the South African
National Water Act all prior rights to water are to be revoked, with
water being brought under the curatorship of the state to manage in a
sustainable and equitable fashion. However, this shift towards a system
which takes into account the needs of the riverine ecosystem will need
to be consolidated with the need for regional economic development
of the catchment as a whole.
The fragmentation of water policy leads to a fragmentation of water
management, which ultimately results in the wasteful or ineffi
cient use of
water in the region. The traditional approach of managing water supply
rather than water demand has also resulted in wasteful or ineffi
cient
use of water by providing as much water as users request, rather than
attempting to encourage an increase in the value added to each unit
of water consumed. Such an approach gives users the impression that
there is an inexhaustible supply of water, and consequently no need
for water demand management measures. Placing inappropriately low
tariff s on water results in a lack of understanding on the part of users
of the value of the resource. Water is thus perceived by users to be a
cheap and abundant resource and is consequently used inappropriately
and wastefully.
Figure 12 Beach seines used by traditional fi shermen, False Bay,
South Africa.
(Photo: C. Griffiths)
48
GIWA REGIONAL ASSESSMENT 44 BENGUELA CURRENT
Issues
Immediate causes
Sectors/Activities
Root causes
Modification of
Commercial recreational
Dam construction
Overexploitation
Excessive fishing effort
Industry/Mining
Political
streamflow
subsistence fisheries
Overabstraction of water
Degradation of habitats
Agriculture
Governance
Urban
Impact on biodiversity/
decreased viability of stock
Domestic
Agriculture
Demographic
Economic
Economical
Technological
Technological
Demographic
Legal
Socio-culture/Knowledge
Figure 13 Causal chain diagram illustrating the causal links for unsustainable exploitation of inshore fi nfi sh in the Benguela Current.
The majority of the species involved are endemic to southern Africa,
Overexploitation
and occur only in association with particular habitat types in relatively
Overexploitation has been implicated as the key factor in the reduction
shallow water close inshore. Some species are long-distance migrants
and collapse of many inshore fi sh stocks in the southern African region
while others may be highly range-restricted and remain resident within
(Griffi
ths 1999, Griffi
ths et al. 1999, Mann 2000). Most species targeted
a few kilometres of shore for their entire lives. Most are slow-growing
by the linefi sheries in this region are rated as overexploited or collapsed
species which mature fairly late so that only very large individuals are
(Griffi
ths 1999, Griffi
ths et al. 1999, Mann 2000, Holtzhausen et al. 2001,
reproductively mature, and many undergo sex changes as they mature.
Sauer et al. 2003), as are the principal target species of inshore net
A host of management measures are currently in place in attempts to
fi sheries (Hutchings et al. 2000, Hutchings & Lamberth 2002). CPUE
manage the fi sh stocks in a sustainable manner. Nevertheless, there
for pelagic nomads targeted by the South African linefi shery has
is overwhelming evidence of major catch declines to the extent that
declined to less than 60% of historical catches (Griffi
ths 1999), while
numerous stocks are considered to be in a critical condition. This,
CPUE of over half of the 25 more vulnerable linefi sh species for which
together with the complex, multi-faceted nature of this fi shery makes
data are available has declined to less than 5% of the historical CPUE
it an ideal case study for further analysis. Root cause analysis for four
(Griffi
ths 1999). In Namibian waters, commercial linefi shing reached
other Benguela fi shery resources (Hakes, Horse mackerels, Sardine and
its peak in the 1980s, but has suff ered from declining catches since
Anchovy, and Deep-sea red crab) are provided in Hampton et al. (1998).
(O'Toole & Boyer 1998). The GIWA Experts estimate that 80 to 90% of
the overexploitation problem can be attributed to an excess of fi shing
This case study was chosen in preference to other fi sheries in the region
eff ort, with the remaining 10 to 20% being attributed to a deterioration
because of its highly complex multi-species nature, with many participants
in environmental quality.
falling into a number of "sectors", and with an attendant complex array
of causes behind the unsustainable exploitation of these marine living
Degradation of habitats
resources. It was also chosen as a case study in preference to some of the
Degradation of habitats in the region, notably estuaries and mangroves,
more commercially important pelagic, demersal or crustacean fi sheries
has a negative impact on inshore fi nfi sh in the Benguela Current
in the region as the majority of the latter fi sheries are already receiving
region. Estuaries and mangroves are important habitats for many
much attention in the region through the Benguela Current Large Marine
of the species targeted by inshore fi nfi sh fi sheries. These habitats
Ecosystem Programme (BCLME) and its attendant projects, and from the
provide productive feeding grounds, safe refuge from predators and
governments of the three coastal countries concerned.
sheltered environments on an otherwise highly exposed coastline.
Many species are either partially or fully dependent on these habitats
Issues
for the successful completion of their life cycles, either as spawning
Unsustainable exploitation of inshore fi nfi sh in the region was
grounds, nursery areas for juveniles, or feeding grounds. Many human
connected mainly to the issues of overexploitation and degradation
infl uences have negative eff ects on the integrity of the functioning
of habitats (Figure 13).
of these habitats, including alteration of fl ow, siltation, development,
CAUSAL CHAIN ANALYSIS
49
removal of mangroves, pollution, etc. Such degradation may result
alternative activities such as agriculture and commerce (Delgado
in direct destruction of the habitat, as in the case of the removal of
& Kingombo 1998), and are therefore not solely reliant on income
mangroves, or may manifest itself in more subtle ways such as through
generated through the fi shery.
reduction of the environmental signal which guides juvenile fi sh
spawned at sea or returning breeding individuals into these essential
Many fi shers participate in a number of diff erent fi sheries and only target
habitats. While the dependence of particular species on these habitat
inshore fi nfi sh opportunistically, taking advantage of occasions when
types is relatively well known, very little is known of the impacts of
CPUE for these species is elevated due to the presence of spawning
degradation of these habitats on populations of these species (with
aggregations, etc. Such fi shing results in relatively large catches with
the obvious exception of species which are entirely dependent on
a high CPUE, creating a false perception that the fi sh stocks are in a
estuaries for their survival, and whose distribution is restricted to only
good condition, and further incentive for fi shers to continue with this
one or two estuaries). The high degree of dependence of inshore fi nfi sh
practice.
species on estuaries and mangroves, together with the relative scarcity
of these habitat types in the region and evidence of their destruction
New entrants enter the fi shery annually hoping to make a profi t. These
and/or degradation suggest that the degradation of these habitats is
participants are prepared to utilise maximal eff ort in order to try to
likely to be an important contributing factor to the decline, or the lack
recoup their investment in the fi shery and make a living. Most entrants
of renewal, of these fi shes.
soon realise, however, that they will not be able to do so, and sell their
permits, boats and gear, to the next batch of hopefuls. This results
Immediate causes
in a constant turnover of enthusiastic new entrants, all of whom are
Overexploitation
hoping to recoup their investments in the fi shery, and who are therefore
One of the primary causes of overexploitation of inshore fi nfi sh in the
prepared to fi sh at very low levels of CPUE. In South Africa, one third
region is excessive fi shing eff ort. Commercial fi shing eff ort on stocks
of all commercial linefi sh permits changed hands during each of the
of these resources is considered to have reached "dangerous" levels
10 years between 1996 and 1997 (Sauer et al. 2003).
(Griffi
ths 1999). Eff ort in the recreational shore fi shery on the South
African coast was estimated recently at 3.2 million angler days per year,
The lack of a strong profi t incentive makes these fi sheries particularly
resulting in a total catch of 4.5 million fi sh per year or almost 3 million kg
vulnerable to excessive eff ort, and allows fi shing to continue at very low
per year (Brouwer et al. 1997). The total number of shore anglers was
levels of CPUE which would be unprofi table in full-scale commercial
estimated at 412 000 in 1995 (McGrath et al. 1997). Estimates of the
fi sheries. Despite the obvious evidence of declining stocks of inshore
numbers of gill nets used in coastal areas indicate that in some parts of
fi nfi sh and decreasing CPUE, the numbers of participants in these
the Benguela Current region, the density of nets is up to 20 per km of
fi sheries not only remains high, but increases continuously.
coastline (Lamberth et al. 1997). Recreational fi sheries, including both
ski-boat fi shing and shore angling, attract large numbers of participants
Degradation of habitats
on the coasts of both Namibia and South Africa. During the summer
Many factors, including pollution, siltation, development, alteration
months, for example, several thousand fi shers partake in recreational
of fl ow regimes, and removal of mangroves, among others, result in
angling on the coast of Namibia (O'Toole & Boyer 1998). During the
degradation of marine habitats, and of estuarine and mangrove habitats
1996/1997 season, 65% of the total catch of Kob (Argyrosomus spp.) were
in particular (see Assessment, Habitat and community modifi cation).
taken by recreational shore anglers, and catch statistics indicate heavy
Agriculture is an important contributor to the degradation of estuarine
fi shing pressure on some species (O'Toole & Boyer 1998). For these
areas. Quite apart from the obvious eff ects that damming and water
participants, however, catch is not the sole incentive for participating,
abstraction for irrigation have on fl ow and fl ooding in the estuaries
and a good days outing can be had even if very few fi sh are caught.
downstream, agriculture adversely aff ects estuarine health in a number
Recreational participants are therefore still prepared to fi sh even at
of other ways. Run-off of fertilisers and animal wastes lead to increased
extremely low levels of CPUE.
nutrient loads, thus decreasing water quality. The planting of crops right
up to the edge of the river bank removes stabilising riparian vegetation,
Fishers who rely only in part on the linefi shery for their income may
encourages erosion and leads to increased siltation of the estuary (this
include both part-time commercials, and artisanal or subsistence
is further exacerbated if fl ooding intensity is reduced to a level which is
fi shers. Such participants are also willing to fi sh at low levels of CPUE.
no longer suffi
cient to remove the excess sediment).
Artisanal fi shers on the Angolan coast subsidise their income through
50
GIWA REGIONAL ASSESSMENT 44 BENGUELA CURRENT
Estuaries provide relatively safe, sheltered harbours on a coastline which
instead on rowing and sail power (Delgado & Kingombo 1998), thus
is otherwise highly exposed, and are obvious nodes for development.
restricting fi shing operations to the inshore zone. In 1992 the Ministry
Development which encroaches on the estuary or associated
of Fisheries created the Fund for Development of Fisheries (FADEPA) to
fl oodplains directly destroys previously productive environment.
allow fi shermen access to cheap credit for the purchase of motorised
Furthermore, alteration of the dynamics of the estuary mouth through
boats. Between 1991 and 1995, the total number of subsistence fi shers
stabilisation and hardening in order to support mouth developments
on the Angolan coast increased by 55% from 15 114 to 23 364 fi shers
alters the environmental cues used by adult and juvenile fi sh seeking to
(Delgado & Kingombo 1998). The FADEPA also off ers low-interest
enter the estuary to complete their life cycles, and alters the physical and
loans to encourage and assist potential subsistence fi shers to enter
chemical nature of the estuary. In some extreme cases, development
the fi shery and to purchase fi shing gear (Delgado & Kingombo 1998).
below the natural fl ood-line of an estuary leads to artifi cial breaching of
While nobly aimed at assisting to alleviate poverty in coastal areas, such
the estuary mouth to prevent fl ooding. In temporarily closed estuaries
programmes are not necessarily consistent with sustainability of the
this alters the natural regime of the opening of the estuary mouth,
resources on which they are based. The vast numbers of participants
creating a mismatch in timing between the opening of the mouth and
in these fi sheries (412 000 participants in South Africa) (McGrath
time when juvenile fi sh are seeking to enter the estuary.
et al. 1997) results in a reluctance on the part of governments to
introduce further restrictions on catches and to tighten regulation of
Destructive fi shing methods such as the use of small-mesh nets and
these fi sheries, both of which may be perceived as controversial and
explosives, which occurs on the Angolan coast, are also important
discriminatory by the fi shers.
contributors to deterioration in environmental quality which aff ects the
biodiversity and viability of the stocks. The use of explosives is not only
Governance
devastating to the fi sh in the area surrounding their deployment, but
The vast number of participants, which span a number of diff erent
also causes physical damage to the habitat. Vast tracts of underwater
"sectors" from subsistence to recreational to commercial, and target a
habitat such as reefs which support the food organisms of inshore
wide range of species with very diff erent life histories, make the inshore
fi nfi sh are easily destroyed forever. Although there is an awareness that
fi nfi sh fi shery highly complex to regulate. It is not surprising, therefore,
this practice is ongoing in Angolan waters, there have been no studies
that diffi
culties are experienced in trying to create good and sustainable
to date which quantify the extent of use of explosives or the magnitude
governance within these fi sheries. For the most part, regulations aimed
of damage already caused by this practice.
at sustainable harvests are in place in each of the countries concerned.
However, poor enforcement, an active illegal "sector", and a lack of
The use of small-mesh nets has a more subtle eff ect on the quality
voluntary compliance are all stumbling blocks to creation of good and
of the habitat. Such small-mesh nets are non-selective with regard to
sustainable governance of these resources.
species. The removal of large quantities of small fi shes from the system
undoubtedly has an impact on populations of these species, and on the
In a survey of shore anglers on the South African coast, enforcement
ecosystem as a whole. These ecosystem eff ects of fi shing are, however,
of regulations was shown to be poor in that part of the coast which
extremely diffi
cult to identify and quantify, and no such characterisation
falls within the Benguela Current region, with anglers being subjected
has been performed in the region as yet.
to inspection of their catches on only slightly more than 1% (1.39%)
of fi shing occasions (Brouwer et al. 1997). The perception that the
Root causes
probability of being caught and prosecuted for illegal activities is
Political
very low (Lamberth et al. 1997) encourages illegal and unsustainable
Political encouragement of subsistence and small-scale commercial
activities. Such a lack of enforcement arises primarily from a lack of
fi sheries leads directly to an increase in the number of participants
fi nancial resources to implement eff ective enforcement of existing
in the fi shery. In addition to the "natural" increase in the numbers of
regulations. On the South African and Namibian coasts, shore anglers
participants in the inshore fi nfi sh fi sheries, government policies aimed
are required to purchase a fi shing license, but this requirement is not
at poverty alleviation in coastal areas have encouraged the proliferation
in place in Angola.
of subsistence and small-scale commercial fi sheries in the region. The
artisanal fi shery in Angola, for example, is essentially an inshore fi shery,
Governance failures can also be found at the root of degradation of
with fi shers making use of both rudimentary wooden canoes, and more
habitats. Governance failures which allow the continuation of the use
sophisticated boats. The majority of the fl eet is not motorised, relying
of destructive fi shing methods include a lack of regulation in some
CAUSAL CHAIN ANALYSIS
51
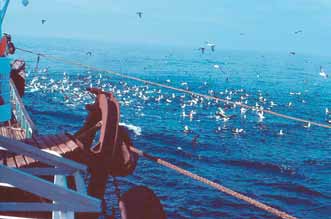
fi shery. Such increases may be temporally and spatially sporadic rather
than continuous. They are nevertheless signifi cant to the fi shery as this
greatly increases fi shing pressure at times when CPUE is high, thus
adding substantial fi shing pressure and increasing the total catch.
Technological improvements of fi shing equipment are also connected
to economics. The increased value of the resource makes fi shers more
prepared to invest in technology which they perceive will increase
their catch and hence their ultimate economic yield. In addition,
as technology becomes relatively less expensive, more people can
aff ord to utilise it. Many of the participants in the recreational fi shery
are wealthy individuals who are both willing and able to purchase the
Figure 14 Trawling in the Benguela Current.
latest available technology, including boats, 4-wheel drive vehicles, fi sh
(Photo: P. Hockey)
fi nders, etc. if they perceive these will improve their catches. A detailed
analysis of the infl uence of technology on overexploitation is given
instances and poor enforcement. The relatively ease with which
below.
members of the general public have access to explosives, and poor
control over the use of these explosives, represents a further failure in
The impact on biodiversity also has root causes related to economics.
governance resulting in destructive fi shing methods and deterioration
In the quest for the most cost- and time-eff ective method of capturing
of environmental quality. A lack of awareness of the implications of
fi shes, individuals resort to the use of destructive fi shing methods.
these actions exacerbates the problem.
In some cases this is driven by profi t incentives, while in others it is
driven merely by the desire to generate a livelihood in areas where few
Economic
alternatives exist. Such paucity of economic opportunities in coastal
Inshore fi nfi sh fi sheries can be important to local economies. The direct
areas also results in destruction of mangroves for use as building
economic value of the fi shery products creates an incentive for greater
material and fi rewood as local communities are faced with a lack of
participation in the fi shery and for larger catches. An increased demand
fi nancial resources with which to purchase alternative materials.
and value generates greater incentive to catch. On the Angolan coast,
for example, the high demand for species such as Soles, Croakers and
Technological
White Groupers on the international market (Delgado & Kingombo
Improvements in technology are a further contributor to
1998) make these species particularly attractive targets for fi shers. Sauer
overexploitation. Improvements in fi shing gear, such as the availability
et al. (2003) provide evidence that the value of six linefi sh species on
of off -road vehicles, geared fi shing reels, nylon line, fi breglass fi shing
the east coast of South Africa increased by an average of 173% between
rods and the advent of the prawn pump which allowed easy collection
1990 and 2001. Such increased value and demand is an interesting
of prime bait organisms have previously been pointed to as underlying
contributor to an excess of eff ort in the inshore fi nfi sh fi shery in the
an increase in harvest potential and overfi shing of inshore fi nfi sh by
Benguela Current region.
recreational anglers in the region (Bennett 1991, Griffi
ths 1999). The
proliferation of privately-owned small motor boats fi tted with modern
The indirect values of the recreational shore fi sheries in Namibia and
devices such as echo sounders and GPS has undoubtedly made inshore
South Africa are substantial (Holtzhausen 1996, McGrath et al. 1997).
fi shermen far more effi
cient by allowing them not only to locate the fi sh
The South African recreational shore fi shery is estimated to contribute
themselves more easily, but also to accurately and repeatedly locate
1.3% to the Gross Geographic Product (GGP) of the coastal provinces
reefs and other seabed features where fi sh aggregate, and to target
and employs approximately 131 500 people (McGrath et al. 1997). This
spawning aggregations, etc.
contribution to the economies of the coastal provinces leads to a
reluctance to place restrictions on the fi shery.
Not only has the technology to locate and capture fi sh become more
advanced over the years, but it has also become more aff ordable and
The ability of fi shers to "cross-subsidise" between fi sheries allows
hence more available to a wider range of participants. In addition to
opportunistic fi shing, thus increasing the number of participants in the
this, an increase in scientifi c knowledge of the species involved in these
52
GIWA REGIONAL ASSESSMENT 44 BENGUELA CURRENT
fi sheries, accumulated in attempts to better manage them, has also
reported (Lamberth et al. 1997). In those parts of the South African coast
allowed more effi
cient location and capture of target species, resulting
which fall within the Benguela Current region, an estimated 23% of the
in a form of "arms-race" between fi shers and managers.
gill nets in operation are being used illegally (Lamberth et al. 1997). To
some degree the low level of voluntary compliance may arise from a lack
Demographic
of awareness regarding management regulations. In their studies on the
The need for water at growing urban centres results in damming of
South African coast Sauer et al. (1997) and Brouwer et al. (1997) found
rivers and abstraction of water, altering fl ow regimes and reducing
that participants in the fi shery generally had a very poor knowledge
the intensity, frequency and timing of critical fl ood events in estuaries.
of existing regulations. Much of the lack of compliance, however, also
Population growth also demands an increase of food supply, which
stems from poor attitudes associated with common goods, and the
implies an increase in agriculture activity which in turn imposes
perception that the sea holds an inexhaustible supply of fi sh on which
negative impacts on coastal habitats. The civil war in Angola resulted
individuals cannot make a substantial impact, with little thought to
in large-scale migration of people to coastal areas. Faced with limited
or understanding of the cumulative eff ects of the large number of
fi nancial resources and natural alternatives, mangroves became
participants. A lack of visible and eff ective enforcement certainly also
an important source of building materials, with a resultant severe
encourages poor voluntary compliance and illegal activity.
destruction of mangrove forests.
As resources in a commons become increasingly scarce, so competition
Socio-cultural
increases between individuals each wanting their share. The heightened
Poor voluntary compliance by participants in the fi shery exacerbates
competition both within and among user groups targeting inshore
the problems of inadequate enforcement of regulations to avoid
fi nfi sh leads to the use of more extreme measures by fi shers, and
overfi shing. Voluntary compliance with management regulations in
the development and purchase of technologically more advanced
the South African inshore fi nfi sh fi shery was found to be poor (Sauer et
equipment. This phenomenon is not only created by economic
al. 1997, Brouwer et al. 1997). In the part of the South African coast which
incentives, but is a result of prevailing attitudes to common resources
falls within the Benguela Current region, between 39 and 44% of 983
which are becoming increasingly scarce. Each fi sher perceives that
anglers interviewed admitted to disobeying the prevailing regulations
his/her right to capture fi sh is being impinged on by others, resulting
with regard to size and bag limits and closed seasons (Brouwer et al.
in a selfi sh attitude. Participants in the fi shery feel that most other
1997). The commercial linefi shery in South Africa was found to regularly
participants are "cheating" and that the only means of ensuring his/her
under-report catches by a factor of three (Sauer et al. 1997), while only
own rightful share is to do likewise.
a mere 3.6% of catches in the gill net and beach seine fi sheries are
CAUSAL CHAIN ANALYSIS
53
Policy options
This section aims to identify feasible policy options that target
Addressing modification of
key components identifi ed in the Causal chain analysis in order
stream flow
to minimise future impacts on the transboundary aquatic
environment. Recommended policy options were identifi ed
A suite of three thematic policy options are suggested for arresting
through a pragmatic process that evaluated a wide range of
the modifi cation of stream fl ow in the Orange-Vaal river system. These
potential policy options proposed by regional experts and
include changing the way water is perceived and used, eff ecting holistic
key political actors according to a number of criteria that were
planning, and improving existing management.
appropriate for the institutional context, such as political
and social acceptability, costs and benefi ts and capacity for
Changing the way water is perceived and used
implementation. The policy options presented in the report
Most of the Benguela Current region and the drainage basin of the
require additional detailed analysis that is beyond the scope
Orange-Vaal system is characterised by naturally highly variable rainfall,
of the GIWA and, as a consequence, they are not formal
and in most parts rainfall is also extremely low. Attitudes of both the
recommendations to governments but rather contributions to
general public and managers towards water in the region are, however,
broader policy processes in the region.
not consistent with the reality of this stochastic supply. Domestic,
industrial and agricultural users, for the most part, do not take due
The suites of policy options presented below were generated by the
cognisance of the limited and variable supply of this resource. Where
Benguela Current Task team as a set of responses to the root causes
realisation of the natural variability of rainfall has been recognised, it
identifi ed during the Causal chain analyses. By their nature, each
has been met with something of a sense of panic, resulting in a fever
policy option usually addresses more than one of the root causes
of dam-building in the region in order to ensure that as much water as
identifi ed. Attempting to link the policy options directly to each root
possible is retained for human use. Water which fl ows down a river and
cause identifi ed in the Causal chain analyses was not always possible,
enters the sea has traditionally been regarded as water wasted (for an
and would have resulted in much repetition within the policy options,
example, consider the category "River losses" in data published on the
thereby creating unnecessary confusion. The policy options have thus
offi
cial South African Department of Water Aff airs and Forestry website,
been presented in a more thematic manner.
reproduced in Table 15 in the Causal chain analysis section). These
attitudes towards water and its management have resulted in major
An attempt was made to devise sets of policy options which are
negative environmental and socio-economic impacts in the region.
practical and realistic, and which together will make a substantial
contribution towards improving the situations outlined in the
A further factor infl uencing how water is perceived and used is related
Assessment and Causal chain analysis for the two chosen systems.
to the low value that is placed on it at all levels, from government to
The policy options should thus preferably not be viewed as individual
individual users. The perceived low value has been entrenched in
interventions, but as sets of interlinked interventions which together
users through inappropriately low tariff s, and through government
present an holistic approach.
subsidy schemes which have supplied cheap water to farmers.
Changing attitudes towards water and encouraging more effi
cient
54
GIWA REGIONAL ASSESSMENT 44 BENGUELA CURRENT
use of water will require careful consideration of the economics of
Effecting holistic planning
the resource.
Eff ective integrated water resources management in the Orange-Vaal
system requires holistic planning, from implementation of good town
Water management in the Orange-Vaal system has largely been based
and city planning to basin-wide management. Town and city planning
on managing the supply of water, and little attention has been given
must take into account the low and highly variable natural water
to managing water demands. The emphasis on water management
supply and plan accordingly. The unchecked growth of urban centres
has resulted in eff orts to retain as much water as possible through
which is occurring in much of the region leads to enormous pressure
the building of dams and impoundments, and to move this water to
on available water resources. Town and city planning thus needs to
where the users are through inter-basin transfer schemes. A critical step
take into account the available water supplies in plans for further
in changing the way water is used is by shifting the emphasis from
development and expansion of urban centres. Water conservation
managing the highly variable supply towards managing the demand
measures such as making provision for the re-use of grey water from
for water. Such water demand management requires a multi-faceted
households, or treated sewage effl
uents, for example, need to be
approach, including education and awareness surrounding the limited
incorporated into town and city development at the planning stage.
supply of water, introduction of water conservation measures and
Likewise, agricultural developments need to take into consideration
appropriate technology, adjustment of water tariff s, and the inclusion
the climatic realities of the drainage basin as well as the economic
of water considerations in town and city planning. For integrated water
realities of the local and international food markets. Prices of staple
resources management of an international transboundary river such
foods have, in real terms, been decreasing since the end of the Second
as the Orange River to be eff ective, there has to be a "common vision"
World War. Overproduction in the developed world and the opening
adopted between the various stakeholders impacted by and impacting
up of most markets in developing countries has resulted in a drop in
on the water resource. This includes inter-governmental organisations
average staple food prices in countries of the Orange River Basin. Yet
such as ORASECOM as well as community and other non-governmental
the cost of irrigation schemes has not dropped, with energy costs and
groups in the river system. As the four basin states require an increased
other operation and maintenance costs all experiencing real increases
amount of water from the river and more pressure is placed on its
over the past half century. These factors have combined as a call by
resources over the coming decades, planning and management
commercial farmers for water charges to be kept low, leading to
system need to be in place to promote science-based decision-making,
ineffi
cient and wasteful use of water in the drainage basin.
incorporating as wide a range of involved stakeholders as possible.
The Orange-Vaal system is vast and complex, and by the continuous
For users to change their perceptions of water and how it relates to
nature of rivers, impacts on parts of the system are translated into
the natural environment requires recognition of the importance of
cumulative impacts downstream. It is therefore not practical to plan
water and the legitimacy of the environment as a user of water at
for only one part of the system, but planning must thus be done for
the government policy level. The South African National Water Act of
the system as a whole. Such planning should not only include the
1998 is to be commended on doing exactly this, by making provision
water resources themselves, but should also include land use planning
for the implementation of minimum in-stream fl ow requirements,
in the entire catchment, including revision and adjustment of current
referred to as the "ecological reserve", with the intention of giving due
land use policies and practices. Attention should also be paid to the
recognition to the environment as a user of water and promoting the
current system of water rights which are closely tied to land tenure and
environmentally sustainable use of water resources. Additionally, it
eff ectively allow private ownership of water.
makes provision for the assurance of a "fair and equitable" share of the
water for downstream users. However, it is the implementation of the
Improving existing management
provisions of such legislation which presents problems. Management
Many measures are already in place to manage water in the Orange-
and development of the resources of the drainage basin has been on
Vaal system, and water management could be greatly enhanced merely
an ad-hoc basis with little coordination between geographic areas or
by strengthening and improving these. A highly practical intervention
between government departments. This is the case both within the
would be through upgrading and improved maintenance of existing
largest of the basin states, South Africa, as well as between the individual
urban reticulation systems to minimise wastage of high-quality water.
states. Thus far collaborative planning has only been around specifi c
The same goes for water used in irrigation systems, where much of the
projects, such as the Lesotho Highlands Water Transfer project.
infrastructure needs to be converted to incorporate improvements in
the effi
ciency of water application to the root zone.
POLICY OPTIONS
55
Much legislation pertaining to the management of water in this, and
both new and existing regulations, and achieving improved voluntary
other, systems is already in existence. There are, however, shortfalls
compliance on the part of fi shers.
between the existence of legislation and regulations and the
implementation of these. If these instruments are to be as eff ective as
Reducing access
they are intended, it is necessary that such legislation is implemented
It is abundantly evident that the current high level of eff ort expended
by management, that there is a high level of voluntary compliance
in the inshore fi nfi sh fi shery is not sustainable, and there is an urgent
with regulations, and that adequate enforcement is in place to act
necessity to restrict this eff ort further than is provided for by existing
as a disincentive to a lack of compliance. In accordance with the
legislation and regulations. Although a contentious and emotional
integrated water resources management approach there needs to be
issue, the possibility of restricting access to this fi shery may need to
a basin-wide management system. However the day to day practical
be considered. Certainly one intervention that requires consideration
running of the basin resources, taking place according to the principle
is a restriction on access by individual participants to multiple fi shery
of subsidiarity, will result in resources being managed at the lowest
resources in order to reduce opportunistic fi shing on inshore fi nfi sh at
practical level.
times when CPUE is elevated (e.g. during aggregated spawning events).
De-commercialising the fi shery entirely is another available option. As
Fragmentation at both policy and implementation levels is one of the
we have learned with land mammals, however, this option should be
major challenges facing sustainable water management in the Orange-
treated with great caution as it may lead to the establishment of an even
Vaal system. Once basin-wide planning is in place, it is also essential to
more lucrative black-market, resulting in even greater illegal activity
introduce basin-wide management so that the system is managed in
and fi shing pressure.
its entirety in a coordinated way.
Decreasing accessibility to these resources (by whatever means) to
Both good planning and good management require the input of reliable
fi shers will result in shrinkage of livelihood and economic opportunities
information for decision-making. Both planning and management of the
in coastal areas. A key allied intervention will thus be to simultaneously
water resources of the Orange-Vaal system could be greatly enhanced
generate attractive alternative livelihood and economic opportunities
by improvement in the supply of such information for decision-support.
for those who have previously relied on fi shing. Aquaculture off ers an
Improved reliability of long-range forecasting and rainfall predictions
obvious opportunity for generation of livelihoods which are not reliant
are highlighted as critically important for supporting eff ective planning
on the capture of wild populations.
and management in this system which is characterised by a high degree
of stochasticity. Once a reliable information set has been established
Modern technology has improved the effi
ciency of fi shers to access,
it needs to be legitimised by the parties involved. The process of
locate and capture fi sh. While legislation already exist regarding the use
contestation surrounding information can be a vital step in generating
of fi shing gear to capture inshore fi nfi sh, it may be necessary to impose
a shared vision and understanding between stakeholders of each others
further gear restrictions, or at least to discourage the use of certain gear
problems, challenges, pressures and possible solutions.
by imposing licenses for their possession.
Improving voluntary compliance
The usefulness of legislation and regulations aimed at sustainable
Addressing unsustainable
management of fi sheries is highly dependent on eff ective enforcement
exploitation of inshore finfish
of these. It is clear that current enforcement of the existing regulations
resources
is inadequate and requires strong intervention. Given the vastness of
the coastline, the number of participants in the fi shery and the diff erent
user groups involved, this becomes extremely expensive. The economic
Overexploitation
considerations are undoubtedly the major factor responsible for the
The inshore fi nfi sh fi shery in the Benguela Current region is a complex
current weaknesses in enforcement of regulations pertaining to these
multi-user, multi-species fi shery, for which there is no "one size fi ts all"
fi sheries in the region, and it may be naive to imagine that anything
solution. To eff ectively address the severe overexploitation problems
will change in this regard. More creative means of enforcement may
will require a multi-faceted approach aimed at the key outcome of
thus need to be sought, such as community-policing, and improving
reducing eff ort through restriction of eff ort, eff ective enforcement of
voluntary compliance.
56
GIWA REGIONAL ASSESSMENT 44 BENGUELA CURRENT
Improving voluntary compliance with existing regulations and
programmes, and in the establishment and management of protected
management measures is critical in addressing the current
mangrove areas.
overexploitation in the inshore fi nfi sh fi sheries in the Benguela Current
region. Improving voluntary compliance revolves around changing
Creation of alternative economic activities
attitudes of fi shers towards the resources they utilise. Such shifts in
Much of the destruction of mangroves is brought about by a lack of
attitude can only be brought about through generating understanding
alternatives for building materials and fi rewood, and a number of policy
and a sense of stewardship. Understanding can be enhanced through
options can be considered in addressing this. Government provision of
education and awareness programmes which highlight the nature of
building material and fi rewood is likely to be an impractical option as
the resources and the impacts of exploitation on these. Involvement of
it is extremely expensive and unsustainable. Aforestation programme
a knowledgeable fi shing community in management decision-making
may alleviate the situation somewhat, but bring with them their own
provides an important basis for the building of a sense of stewardship
negative impacts on the terrestrial environment. The provision of
on the part of these individuals.
cheap electricity to these coastal communities would not alleviate the
problem as it relates to building materials, but would go a long way to
Although such changes in attitude are often perceived to be diffi
cult
alleviating the necessity for using mangrove wood for cooking fi res. The
to eff ect, this is not necessarily the case. One case in particular, on
only truly sustainable long-term option for alleviating the pressure on
the KwaZulu-Natal coast of South Africa, serves to illustrate just how
mangroves for building materials lies in creating suffi
cient economic
well interventions to improve understanding and generate a sense
opportunities in these coastal areas so that communities are better able
of stewardship can work to improve voluntary compliance and self-
to aff ord to utilise alternative building materials.
policing in relation to exploitation of marine living resources (Harris et
al. 2003, Sowman et al. 2003).
Destructive fi shing methods are utilised by fi shers because they are time-
and cost-eff ective. Once again, reducing the reliance of coastal people on
Degradation of habitats
inshore fi nfi sh resources by creating alternative livelihoods and economic
As has been highlighted in the Causal chain analysis, there are several
opportunities in coastal areas is the one truly sustainable option.
root causes of degradation of habitats of inshore fi nfi sh resources in the
In the interim, increasing voluntary compliance through increasing
Benguela Current region. To address these varied causes will require a
understanding of the resources and the impact that destructive fi shing
relatively broad approach aimed at a range of levels of intervention.
practices have on these, and creating a sense of stewardship will go some
way to alleviating the problem, but only in cases in which there is no
Holistic management
economic or livelihood reliance on these resources.
While the necessity for provision of water at urban centres cannot be
denied, the impacts of this on estuaries downstream can be mitigated
Improving voluntary compliance
through adoption of "white water to blue water" or "hilltop to oceans"
Deterioration of environmental quality leading to a reduction in
approaches to the management of freshwater basins. Improving
inshore fi nfi sh and their habitats in the Benguela Current region, can
agricultural practices in catchments, and regulating minimum fl ow
be attributed primarily to the degradation of critical estuarine and
requirements for freshwater systems, as has been done in South
mangrove habitats and to destructive fi shing practices. Much legislation
Africa's Water Law of 1998 are highlighted as important interventions
already exists in the countries involved to protect environmental quality
in the protection of estuarine health. For the estuary itself, it is critical to
(Annex IV). There are, however, failures in the implementation of this
prepare management and development plans which incorporate good
legislation, and environmental degradation continues, in some cases
ecological practice, and which are subject to rigorous environmental
despite the best eff orts of enforcement agencies. The option of
impact assessments before implementation.
stepping-up enforcement is an expensive one, and not necessarily
sustainable, nor does it address the root causes of the problem. In
The establishment of protected mangrove areas may assist as an interim
most instances, the problems exist because local communities have no
solution to retarding the destruction of mangroves. Strict compliance
alternatives to utilising coastal resources, and are unaware of the larger
by the communities will be required for protected mangrove areas to
impacts that their activities may be creating. Public awareness of the
be at all eff ective. Ensuring strict compliance can be achieved through
impacts of particular activities and public involvement in management
costly enforcement, or through generating community stewardship
will be the key to addressing these problems, as will the generation of
of these areas by involving communities in education and awareness
alternative sustainable livelihood opportunities in coastal areas.
POLICY OPTIONS
57
Conclusions and recommendations
Probably the truest generality that can be made about the Benguela
variable supply of freshwater in the region, including political decisions
Current region is that it is characterised by high variability. This variability
such as prioritisation of industrial water use, lack of coordination among
is evidenced in environmental processes such as rainfall and upwelling,
departments, demographic considerations, economic policies, and
but also in its highly variable socio-economic processes, with the highly
improvements in technology, particularly irrigation technology. Three
industrialised Gauteng Province of South Africa contrasting dramatically
major thematic interventions are suggested to alleviate the problems
with subsistence-based activities in Angola. This variability presents
of freshwater shortage in the region:
some challenges in attempts to assess the region as a whole, and
Changing the way water is perceived and used. This revolves
where information has permitted these fi ner-scale diff erences have
primarily around perceptions of the value of water as a life-
been enunciated in the body of this report. Despite the inherent
sustaining resource at all levels of society.
variability, this report contributes a valuable synthesis of the major
Eff ecting holistic water planning. Holistic, basin-wide planning is
environmental issues within the region, and attempts to provide some
essential to eff ectively manage the limited supplies of water in the
insights into the impacts of these environmental perturbations on the
region.
socio-economic environment. It further attempts to elucidate the root
Improving existing management of water resources. Water
causes of environmental issues and suggests possible policy options
management in the region could be greatly enhanced by
for addressing these.
strengthening and improving existing management at all levels,
from policy to implementation to upgrading of supply equipment
Both the natural and human environments of the Benguela Current
and introduction of water-conservation measures.
region are strongly infl uenced by the cold, northwards-fl owing
Benguela Current. This current and its attendant upwelling are not
The Benguela Current is one of the most important upwelling systems
only responsible for the highly productive fi sheries of the marine
on Earth. The high nutrient concentration of the upwelled water forms
environment, but to a large extent controls the climate of the region. For
the basis of complex food chains which support highly productive
the most part the region is arid or semi-arid, with low and highly variable
fi sheries. The continuous nature of the marine environment ensures
rainfall. The growth of populations, coastal urban centres, irrigation
that stocks of marine living resources are transboundary in nature,
agriculture and industry place increasing demands on limited supplies
and are shared between the three coastal countries. Despite the high
of water, to the extent that most parts of the region are currently
productivity of the Benguela Current, overfi shing and the degradation
considered to be suff ering a water crisis. Sources of water for the most
of important habitats have lead to declines in fi sh stocks in the system.
important permanent river basins in the region are shared between
In the case of inshore fi nfi sh, most stocks in this multi-species fi shery
a number of countries, and in two cases (Orange River and Cunene
are rated as overexploited or collapsed. Excessive fi shing eff ort is a key
River) the rivers themselves form national boundaries. The potential
contributor towards the decline in these stocks. Degradation of critical
for confl ict over water resources in the region is consequently high.
habitats such as estuaries and mangroves further compromises the
For these reasons, Freshwater shortage was highlighted as a priority
resilience of these stocks to fi shing pressure. Anthropogenic factors
environmental and socio-economic concern. Many anthropogenic root
are at the root of the declines in stocks of inshore fi nfi sh, including
causes combine to exacerbate the problems of the naturally low and
those of political encouragement of small-scale fi sheries, governance
58
GIWA REGIONAL ASSESSMENT 44 BENGUELA CURRENT
failures and diffi
culty of regulation of inshore fi nfi sh fi sheries, a number
A number of issues within these themes are currently being addressed
of economic considerations, improved capture technology, and poor
by the Benguela Current Large Marine Ecosystem Project (BCLME), and
voluntary compliance. Interventions around two major themes are
will be the responsibility of the proposed Benguela Current Commission.
off ered as suggestions for alleviating the overexploitation of inshore
The objectives of the BCLME are to improve the management of shared
fi nfi sh resources in the region:
resources, and to implement an ecosystem approach to fi sheries in the
Reducing access. Although a contentious issue in the region,
three coastal countries bordering the Benguela Current.
limitations on access to inshore fi nfi sh fi sheries could be an
important step in reducing overexploitation of these fi sheries.
Refl ecting the natural systems of the region, much variability also exists
Improved voluntary compliance. In this multi-user, open-access
in the data, information and expertise available. Strong gradients are
fi shery spread over thousands of kilometres of coast, stringent
present in the distribution of data, information and capacity within the
enforcement of existing management measures is not practical.
region, these generally decreasing from the south to the north. The text
Long-term sustainable utilisation of these resources will require
of this report refl ects this, with much information available regarding
large improvements in voluntary compliance.
the South African portion of the region, somewhat less concerning the
Namibian portion and, not surprisingly after 30 years of civil war, far less
Interventions around three themes are suggested for reducing the
regarding the Angolan component.
degradation of critical inshore fi nfi sh habitats:
Holistic management. Estuaries and mangroves are key habitats
The quantity and quality of environmental data and information was
for inshore fi nfi sh. Recognition of their role as such, and the
not evenly spread across the concerns and issues. Data and information
introduction of holistic ecosystem-wide management will assist in
relating to specifi c pollution issues, specifi c habitats and ecosystems,
reducing degradation of these habitats.
and to global change issues were either not available, or very little was
Creation of alternative economic activities. The use of destructive
available. Surprisingly, environmental information was far more readily
fi shing practices and much of the destruction of critical habitats,
available than that relating to social and economic processes. The
such as mangroves, are the result of a lack of alternatives. The
apparent paucity of socio-economic information and expertise does
generation of alternative economic opportunities in coastal areas
not, however, apply to the fi elds of social science and economics in
will reduce economic or livelihood reliance, and hence pressure, on
their entirety, but rather as they relate to the natural environment. An
coastal resources.
important consideration in the pursuit of sustainable development
Improving voluntary compliance. Existing legislation for the
will be the fostering of capacity in cross-cutting environmental social
protection of environmental quality is often ineff ective due to poor
sciences and environmental economics.
enforcement and a low level of voluntary compliance. Improved
enforcement is not necessarily practical for a number of reasons,
and long-term sustainability will be reliant on improvements in
voluntary compliance.
CONCLUSIONS AND RECOMMENDATIONS
59
References
Agula, C. (2002). Scarcity of water is a limiting factor for development.
Berg, R.R. (1993). Hydrology of the Berg River Estuary. Berg Estuary and
The Namibian, Windhoek, May 24 2002, in discussion of Social
Floodplain Ecological Water Requirements, Working Documents.
Impactsessment and Policy Analysis Corporation Vision 2030
Berg River Estuary Work Session 15-18 March, 1993. Department of
Report.
Water Aff airs and Forestry, South Africa.
Arnell, N.W. (1999). Climate change and global water resources. Global
Boyer, D.C., Kirchner, C.H., McAllister, M.K., Staby, A. and Staalesen, B.I.
Environmental Change 9:31-49.
(2001). The orange roughy fi shery of Namibia: lessons to be learned
Bakun, A. (1990). Global climate change and intensifi cation of coastal
about managing a developing fi shery. South African Journal of
ocean upwelling. Science 247:189-201.
Marine Science 23:205-221.
Basson, M.S., Van Niekerk, P.H. and Van Rooyen, J.A. (1997). Overview
Braune, E and Rogers, K.H. (1987). The Vaal River Catchment: Problems
of water resources availability and utilization in South Africa.
and Research Needs. South African National Scientifi c Programmes
Department of Water Aff airs and Forestry Report, South Africa.
Report No. 143. CSIR, Pretoria.
BCLME (1999). Transboundary Diagnostic Analysis for the Benguela
Brouwer, S.L., Mann, B.Q., Lamberth, S.J., Sauer, W.H.H. and Erasmus, C.
Current Large Marine Ecosystem. UNDP, Windhoek.
(1997). A survey of the South African shore-angling fi shery. South
Beardall, J., Beer, S. and Raven, J.A. (1998). Biodiversity of marine plants in
African Journal of Marine Science, 18: 165-177.
an era of climate change: some predictions based on physiological
Brown, A.C. (1987). Marine pollution and health in South Africa. South
performance. Botanica Marina 41:113-123.
African Medical Journal, 71: 244-248.
Beeftink, W.G. (1979). The structure of salt marsh communities in relation
Brown, P.C. and Cochrane, K.L. (1991). Chlorophyll a distribution in
to environmental disturbances. p. 77-93 In: Jeff eries, R.L. and Davy,
the southern Benguela, possible eff ects of global warming on
A.J. (eds.) Ecological Processes in Coastal Environments. Blackwell,
phytoplankton and its implication for pelagic fi sh. South African
Oxford, UK.
Journal of Science 87:233-242.
Bennett, B.A. (1991). Long-term trends in the catches by shore anglers in
Brundrit, G.B. (1995). Trends of southern African sea level: statistical
False Bay. Transactions of the Royal Society of South Africa 47(4&5):
analysis and interpretation. South African Journal of Marine Science
683-690.
16:9-17.
Bennett, B.A. (1993). An assessment of the potential eff ects of reduced
Brundrit, G.B. and Shannon, L.V. (1989). Cape storms and the Agulhas
freshwater inputs to the fi sh community of the Berg River Estuary.
Current: a glimpse of the future? South African Journal of Science
In: Berg Estuary and Floodplain Ecological Water Requirements,
85:619-620.
Working Documents. Berg River Estuary Work Session 15-18 March,
Bruwer, C.A. (1978). The Rehabilitation of a small Eutrophic Urban Lake.
1993. Department of Water Aff airs and Forestry, South Africa.
MSc thesis, University of Stellenbosch, South Africa.
Bennett, B.A. (1994). The fi sh community of the Berg River estuary with
Bruwer, C.A. (1979). The Economic Impact of Eutrophication in South
an assessment of the likely eff ects of reduced freshwater infl ows.
Africa. Technical Report No. 94. Department of Water Aff airs, South
South African Journal of Zoology 29:118-125.
Africa.
60
GIWA REGIONAL ASSESSMENT 44 BENGUELA CURRENT
Bruwer, C.A. (1986). Macrophytes in the Vaal River. p 150-157 In: The
Crawford, R.J.M., Siegfried, W.R., Shannon, L.V., Villacstin-Herrero, C.A.
Vaal River Ecosystem: Status and problems. Proceedings of a
and Underhill, L.G. (1990). Environmental infl uences on marine biota
Joint Symposium Convened by the Foundation for Research
off southern Africa. South African Journal of Science 86:330-339.
Development and the Vaal River Catchment Association. FRD
Crawford, R.J.M., Davis, S.A., Harding, R., Jackxon, L.F., Leshoro, T.M.,
Occasional Report No. 5.
Me er, M.A., Randall, R.M., Underhill. L.G., Upfold, L., Van Dalsen, A.P.,
Cambray, J.A., Davies, B.R. and Ashton, P.J. (1986). The Orange-Vaal
Van der Merwe, E., Whittington, P.A., Williams, A.J. and Wolfaardt,
River System. p 89-122 In: Davies, B.R. and Walker, K.F. (eds.) The
A.C. (2000). Initial impacts of the Treasure oil spill on seabirds off
Ecology of River Systems. Monographiae Biologicae 60, Dr W Junk,
western South Africa. South African Journal of Marine Science 22:
Dordrecht.
157-176.
Chutter, F.M. (1963). Hydrobiological studies on the Vaal River in
CSIR (1999). National State of the Environment Report. Marine and
the Vereeniging area. Part 1. Introduction, water chemistry and
Coastal Systems and Resources. Retrieved October 2004, from http:
biological studies on the fauna of habitats other than muddy
//www.environment.gov.za/soer/nsoer/issues/coast/.
bottom sediments. Hydrobiologia 21:1-65.
Davies, B.R. and Bergh, N. (1999). In: World Commission on Dams, Pilot
Chutter, F.M. (1967). Hydrobiological studies on the Vaal River and
Study, Orange River Development Project. Final Report, WCD, Cape
some of its Tributaries, including an Introduction to the Ecology
Town, South Africa.
of Simulium in its Lower Reaches. Unpublished PhD thesis, Rhodes
Davies, B.R. and Day, J.A. (1998). Vanishing Waters. University of Cape
University, South Africa.
Town Press and Juta Press, Cape Town.
Chutter, F.M. (1968). On the ecology of fauna of stones-in-the-current
Davies, B.R., O'Keeff e, J.H. and Snaddon, C.D. (1993). A Synthesis of
supporting a very large Simulium (Diptera) population. Journal of
the Ecological Functioning, Conservation and Management of
applied Ecology 5:531-561.
South African River Systems. Special Report to the Water Research
Chutter, F.M. (1971). Hydrobiological studies in the catchment of the Vaal
Commission, Report No. TT62/93. Pretoria, South Africa.
Dam, South Africa. Part 2. The eff ects of stream contamination on
De Moor, F.C. (1982). A Community of Simulium species in the Vaal
the fauna of stones-in-current and marginal biotopes. Internationale
River near Warrenton. Unpublished PhD thesis, University of the
Revue der gesamten Hydrobiologie 56:227-240.
Witwatersrand, South Africa.
CIA (2003). CIA World Factbook. Retrieved January, 2003 from http://
De Moor, F.C. (1986). Invertebrates of the Lower Vaal River, with emphasis
www.odci.gov/publications/factbook/.
on the Simuliidae. p 135-142 In: Davies, B.R. and Walker, K.F. (eds.)
Clark, B.M. (1999). Scoping study and initial environmental assessment
The Ecology of River Systems. Monographiae Biologicae 60, Dr W
for the proposed extension of the Zandvleit or Macassar waste
Junk, Dordrecht.
water treatment works and associated infrastructure: Impacts
Deichmann, U. and Eklundh, L. (1991). Global digital data sets for land
on aquatic fauna of the Eerste Estuary. Anchor Environmental
degradation studies: a GIS approach, GRID Case Study Series No. 4.
Consultants, South Africa. Unpublished report.
UNEP/GEMS and GRID, Nairobi, Kenya.
Clark, B.M., Steff ani, N.C., Young, S., Richardson, A.J. and Lombard, A.T.
Delgado, F. and Kingombo, P.A. (1998). Coastal development and marine
(2000). The eff ects of climate change on marine biodiversity in
environment on artisanal fi sheries. First Regional Workshop of the
South Africa. Report prepared for the Foundation for Research
Benguela Current Large Marine Ecosystem, July 22-24, 1998, Cape
Development, South African Country Study on Climate Change, .
Town, South Africa.
Cockroft, A.C. and Payne, A.I.L. (1999). A cautious fi sheries management
Department of Environmental Aff airs and Tourism (2000). National
policy in South Africa: the fi sheries for rock lobster. Marine Policy
State of the Environment Report, South Africa. Retrieved March
23(6):587-600.
2003, from http://www.ngo.grida.no/soesa
Conley, A.H. (1995). A Synoptic view of Water Resources in Southern
Department of Transport (1994). Questions by Senator E.K. Moorcroft to
Africa. Paper to South African department of Water Aff airs and
the Minister of Transport. Department of Transport: Parliamentary
Forestry, Pretoria, South Africa.
Questions ş Senate 1994. Retrieved February 2002, from http:
Crawford, R.J.M., Shannon, L.V. and Pollock, D.E. (1987). The Benguela
//w w w.transpor t.gov. za/comm-centre/qanda/questions/
Ecosystem. Part VI. The major fi sh and invertebrate resources.
94senate.html
Oceanography and Marine Biology 25:353-505.
Department of Water Aff airs and Forestry (1991). Water Supply to the
Eastern Transvaal Highveld. Information Booklet produced by DWAF
Liaison Offi
ce, Pretoria, South Africa.
REFERENCES
61
Department of Water Aff airs and Forestry (2004). Internal Strategic
Hampton, I., Boyer, D.C., Penney, A.J., Pereira, A.F. and Sardinha, M. (1998).
Perspective: Lower Orange Water Management Area. Prepared by
Integrated overview of fi sheries of the Benguela current region: a
PDNA, WRP Consulting Engineers (Pty) Ltd, WMB and Kwezi-V3 on
synthesis commissioned by the United Nations Development
behalf of the Directorate: National Water Resource Planning. DWAF
Programme (UNDP) as an information source for the Benguela
Report No. PWMA 14/000/00/0304.
Current Large Marine Ecosystem (BCLME) Programme.
Department of Water Aff airs and Forestry (2005). Orange River Project.
Hara, M.M. (2001). Could marine resources provide a short-term solution
Retrieved January 2004, from http://www.dwaf.gov.za/orange
to declining fi sh supply in SADC inland countries? The case of horse
Drinkwater, K.F. and Frank, K.T. (1994). Eff ects of river regulation and
mackerel. Food Policy 26:11-34.
diversion on marine fi sh and invertebrates. Aquatic Conservation
Harris, J., Branch, G.M., Sibiya, C. and Bill, C. (2003). The Sokhulu
of Marine and Freshwater Ecosystems 34:135-151.
subsistence mussel-harvesting project: co-management in action.
Duncombe Rae, C.M., Boyd, A.J., and Crawford, R.J.M. (1992). "Predation"
p 61-98 In: Hauck, M. and Sowman, M. (eds.) Waves of Change.
of anchovy by an Agulhas ring: a possible cause of the very poor
University of Cape Town Press, Cape Town, South Africa.
year class of 1989. South African Journal of Marine Science 12:167-
Harrison, A.D. (1958). The eff ects of sulphuric acid pollution on the
173.
biology of streams in the Transvaal, South Africa. Verhandlungen
Encarta (2004). Encarta Encyclopaedia, Microsoft Corporation. Retrieved
Internationale Vereinigung fŘr Theoretische und Angewandte
January 2004, from http://encarta.msn.com
Limnologie 13:603-610.
Eskom (2003). Retrieved February 2003, from http://www.eskom.co.za.
Hart, S.A., Sauer, W.H. and Leslie, R. (1998). Preliminary estimates of by-
Gordon, A.L. and Haxby, W.F. (1990). Agulhas eddies invade the
catch in the South African trawling industry: commercial species.
south Atlantic ş evidence from GEOSAT altimeter and shipboard
International Conference for the Paradi Association and The
conductivity-temperature-depth survey. Journal of Geophysical
Fisheries Society of South Africa.
Research 95(C3):3117-3125.
Hauck, M. and Sweijd, N.A. (1999). A case study of abalone poaching in
Griffi
ths, C.L., Hockey, P.A.R., Van Erkom Schurink, C. and Le Roux, P.J.
South Africa and its impact on fi sheries management. ICES Journal
(1992). Marine invasive aliens on South African shores: implications
of Marine Science 56:1024-1032.
for community structure and trophic functioning. South African
Heyns, P., Montgomery, S., Pallett, J. and Seely, M.K. (1988). Namibia's
Journal of Marine Science 12:713-722.
Water; A Decision Maker's Guide. Department of Water Aff airs,
Griffi
ths, M.H. (1999). Development of the Cape linefi shery during the
Ministry of Agriculture, Water and Rural Development and The
20th century: evidence for overexploitation. pp 6-17 In: Mann, B.Q.
Desert Research Foundation of Namibia.
(ed.) Proceedings of the Third Southern African Marine Linefi sh
Heyns, P., Masundire, H. and Sekwale, M. (1994). Freshwater Resources.
Symposium, Arniston, 28 April-1 May 1999. Occasional Report
p 181-206 In: Chenje, M. and Johnson, P. (eds.) State of the
of the South African Network for Coastal and Oceanographic
Environment in Southern Africa. Southern African Research and
Research, No. 5.
Documentation Centre, International Union for the Conservation
Griffi
ths, M.H., Attwood, C. and Thompson, R. (1999). Towards a
of Nature and Southern African Development Community. Penrose
new management protocol for the South African linefi shery.
Press, Johannesburg, South Africa.
p 145-156 In: Mann, B.Q. (ed.) Proceedings of the Third Southern
Hockey, P.A.R. (1993). Potential Impacts of Water Abstraction on the
African Marine Linefi sh Symposium, Arniston, 28 April-1 May 1999.
Birds of the Lower Berg River Wetlands. Berg Estuary and Floodplain
Occasional Report of the South African Network for Coastal and
Ecological Water Requirements, Working Documents. Berg River
Oceanographic Research, No. 5.
Estuary Work Session 15-18 March, 1993, Department of Water
Grobler, D.C., Toerien, D.F. and Rossouw, J.N. (1986). p 116-148 In:
Aff airs and Forestry.
The Vaal River Ecosystem: Status and problems. Proceedings of
Hockey, P.A.R. and Van Erkom Schurink, C. (1992). The invasive biology of
a Joint Symposium Convened by the Foundation for Research
the mussel Mytilus galloprovincialis on the southern African coast.
Development and the Vaal River Catchment Association. FRD
Transactions of the Royal Society of South Africa 48:123-139.
Occasional Report, No. 5.
Holtzhausen, H. (1996). Angling in Namibia. Namibia Environment 1:
Hńder, K.J.M., Worrest, R.C., Kumar, H.D. and Smith, R.C. (1995). Eff ects
112-115.
of increased solar UV-B radiation on coastal marine ecosystems.
Ambio 24:174-180
62
GIWA REGIONAL ASSESSMENT 44 BENGUELA CURRENT
Hotltzhausen, J.A., Kirchner, C.H. and Voges, S.F. (2001). Observations on
Kotze, D.C., Breen, C.M. and Quinn, N. (1995). Wetland losses in South
the linefi sh resources of Namibia, 1990-2000, with special reference
Africa. p 263-272 In: Cowan, G.I. (ed.) Wetlands of South Africa.
to west coast steenbras and silver kob. South African Journal of
Department of Environmental Aff airs and Tourism, Pretoria, South
Marine Science 23:135-144.
Africa.
Howell, C.J. and Holmes, G.W. (1969). The control of Simuliidae in
Lamberth, S.J., Sauer, W.H.H., Mann, B.Q., Brouwer, S.L., Clark, B.M. and
the Vaal-Hartz irrigation complex. Journal of the South African
Erasmus, C. 1997. The status of the South African beach-seine and
Veterinarian and Medical Association 40:59-67.
gill-net fi sheries. South African Journal of Marine Science 18:195-
Hughes, P., Brundrit, G.B. and Shillington, F.A. (1991). African sea-level
202.
measurements in the global context of sea-level rise. South African
Landscan (2001). Oak Ridge National Laboratory (ORNL). Retrieved
Journal of Science 87(9):447-452.
January, 2001 from http://www.oml.gov/gist/landscan/index.html.
Huizinga, P., Slinger, J.H. and Boroto, J. (1993). The Hydrodynamics of
Larkum, A.W.D. and Wood, W.F. (1993). The eff ects of UV-B radiation
the Berg River Estuary - A Preliminary Evaluation with respect
on photosynthesis and respiration of phytoplankton, benthic
to Mouth Entrainment and Future Impoundments. Berg River
macroalgae and seagrasses. Photosynthetic Research 36:17-23.
Estuary Work Session, Berg Estuary and Floodplain Ecological
Lusher, J.A. (1984). Water quality criteria for the South African coastal
Water Requirements, Working Documents. Berg River Estuary
zone. South African National Scientifi c Programmes Report No. 94.
Work Session 15-18 March, 1993, Department of Water Aff airs and
Lutjeharms, J.R.E. and de Ruiter, W.P.M. (1996). The infl uence of Agulhas
Forestry.
Current on the adjacent coastal ocean: possible impacts of climate
Hutchings, K. and Lamberth, S.J. (2002). Catch-and-eff ort estimates or
change. Journal of Marine Systems 7:321-336.
the gillnet and beach-seine fi sheries in the Western Cape, South
Lutjeharms, J.R.E. and Gordon, A.L. (1987). Shedding of an Agulhas ring
Africa. South African Journal of Marine Science 24:205-225.
observed at sea. Nature 325:138-140.
Hutchings, K., Lamberth, S.J. and Griffi
ths, C.L. (2000). Management
Lutjeharms, J.R.E. and Van Ballegooyen, R.C. (1988). Topographic control
and socio-economic considerations for the gill and beach seine
in the Agulhas Current system. Deep Sea Research 31:1321-1337.
net fi sheries on the west and southwestern coasts of South Africa.
Lutjeharms, J.R.E., Monteiro, P.M.S., Tyson, P.D. and Obura, D. (2001).
Final Report to Directorate: Marine and Coastal Management,
The oceans around southern Africa and regional eff ects of climate
Department of Environmental aff airs and Tourism, Cape Town,
change. South African Journal of Science 97:119-130.
South Africa.
Mann, B.Q. (2000). Southern African marine linefi sh status reports.
Impson, N.D. (1997). Conservation and sustainable use of indigenous
Durban Oceanographic Research Institute, South Africa.
Western Cape "yellow fi shes". The Federation of Southern Africa
Mason, S.J., Waylen, P.R., Mimmack, G.M., Rajaratnam, B. and Harrison,
Flyfi shers, Yellowfi sh Workshop.
M.J. (1999). Changes in extreme rainfall events in South Africa.
International Rivers Network (2004). Meeting Namibia's needs while
Climate Change 41:249-257.
sparing the Okavango. Retrieved January 2004, from http://
McAllister, M.K. and Kirchner, C.H. (2001). Development of Bayesian stock
www.irn.org/programs/okavango.
assessment methods for Namibian orange roughy Haplostethus
Intertanko (2005). Sources of oil pollution. Retrieved January 2005, from
atlanticus. South African Journal of Marine Science 23:241-264.
http://www.intertanko.com/communications/issue.asp?topic_
McDowell, C.R. (1993). Vegetation assessment of the Berg River Estuary
id=291.n
and fl oodplain with evaluation of likely impacts arising from
Karoly, D.J. (1988). Evidence of recent temperature trends in the southern
proposed upstream water impoundments. Berg Estuary and
hemisphere. p 52-59 In: Pearman, G.I. (ed.) Greenhouse: Planning for
Floodplain Ecological Water Requirements, Working Documents.
Climate Change. CSIRO Australia, Melbourne.
Berg River Estuary Work Session 15-18 March, 1993, Department of
Klein, R.J.T. and Nicholls, R.J. (1999). Assessment of coastal vulnerability
Water Aff airs and Forestry.
to climate change. Ambio 28:182-187.
McGrath, M.D., Horner, C.C.M., Brouwer, S.L., Lamberth, S.J., Mann, B.Q.,
Kleinschmidt, H. (2000). Funding options for oil spill response in South
Sauer, W.H.H. and Erasmus, C. (1997). An economic valuation of the
Africa. Cape Nature Conservation. Retrieved March 2002, from http:
South African Linefi shery. South African Journal of Marine Science
//www.capenature.org.za/what_is_new/treasure/horst.html
18:203-211.
Michell, T.D. and Hulme, M. (1999). Predicting regional climate change:
living with uncertainty. Progress in Regional Geography 23:57-78.
REFERENCES
63
Ministry of Environment and Tourism (2002). Directorate of
Petitjean, M.O.G. and Davies, B.R. (1988). Ecological impacts of inter-
Environmental Aff
airs. Retrieved March 2003, from http://
basin water transfers: Some case studies, research requirements
www.dea.met.gov.na/env_issues/env_issues.htm
and assessment procedures. South African Journal of Science 84:
Moldan, A. (1994). Impact of a Major Oil Spill. Article of the Department
819-828.
of Environmental Aff airs and Tourism. Retrieved March 2003,
Pick `n Pay (2003). Marine Pollution. Enviro Facts 14. Retrieved
from http://sacoast.uwc.ac.za/education/resources/envirofacts/
February 2002, from http://sacoast.uwc.ac.za/education/
oilspillimpact.htm
resources/envirofacts/marinepollution.htm
Morant, P.D., Heydorn, H.J. and Grindley, J.R. (1997). Groot Berg (CW15),
Pieterse, A.J.H. (1986). Aspects of the Ecology of Algal Populations in
Part II, Synopses of available information on individual systems,
the Vaal River. p 175-199 In: Proceedings of a Joint Symposium
Report No. 41. Council for Scientifi c and Industrial Research, South
Convened by the Foundation for Research Development and the
Africa.
Vaal River Catchment Association, FRD Occasional Report No. 5,
NAMANG Consortium (1998). Feasibility Study Report on the
Pretoria, South Africa.
proposed Lower Cunene Hydropower Scheme. Report prepared
Pollock, D.E., Crockroft, A.C. and Goosen, P.C. (1997). A note on reduced
by Norconsult (Norway), SwedPower (Sweden), Burmeister and
rock lobster growth rates and related environmental anomalies in
Partners (Namibia) and SOAPRO (Angola) for the Permanent Joint
the southern Benguela, 1988-1995. South African Journal of Marine
Technical Commission (PJTC).
Science 18:287-293.
Nicholls, R.J., Hoozemans, F.M.J, and Marchand, M. (1999). Increasing
Punt, A.E. and Japp, D.W. (1994). Stock assessment of the kingklip
fl ood risk and wetland losses due to global sea-level rise: regional
Genypterus capensis off South Africa. South African Journal of
and global analyses. Global Environmental Change 9:69-87.
Marine Science 14:133-149.
Nicholson, S.E. (1986). The nature of rainfall variability in Africa south of
Ragab, R. and Prudhomme, C. (2002). Climate and water resources
the equator. Journal of Climatology 6:515-530.
management in arid and semi-arid regions: prospective and
Nicholson, S.E. (1993). An overview of African rainfall fl uctuations of the
challenges for the 21st century. Biosystems Engineering 81:3-4.
last decade. Journal of Climatology 6:1463-1466.
Reddering, J.S.V. and Rust, I.C. (1990). Historical changes and sedimentary
Ninham Shand Inc. (1992). Hydrology of the Berg River Basin; Western
characteristics of southern African estuaries. South African Journal
Cape Systems Analysis. Prepared by R.R. Berg for Department of
of Science 86:425-428.
Water Aff airs and Forestry, Ninham Shand Inc., Report No. PG000/
Ryan, P. (1996). Plastic litter in marine systems: Impact, sources and
00/2491.
solutions. Plastics Southern Africa 20(6):20-28.
O'Toole, M.J. and Boyer, D. (1998). An overview of fi sheries and some
SADC (2002). Directorate Annual Reports 2001-2002. Directorate of
marine environmental issues in Namibian waters. First Regional
Food, Agriculture and Natural Resources, Fisheries:7. Retrieved
Workshop of the Benguela Current Large Marine Ecosystem, July
January 2002, from http://www.sadc.int/index.php?action=a100
22-24, 1998, Cape Town, South Africa.
1&page_id=reports_directorate_2001_fanr9
Oliveira, M.P. (1986). Sources of Pollution in the Vaal River. p 32-45 In:
SADC (2003). Offi
cial SADC Trade Industry and Investment Review 2003.
The Vaal River Ecosystem: Status and problems. Proceedings of
Retrieved April 2003, from http://www.sadcreview.com
a Joint Symposium Convened by the Foundation for Research
SADC (2005). Offi
cial SADC Trade Industry and Investment Review 2005.
Development and the Vaal River Catchment Association. FRD
Retrieved March 2005, from http://www.sadcreview.com
Occasional Report No. 5.
Sauer, W.H.H., Penney, A.J., Erasmus, C., Mann, B.Q., Brouwer, S.L.,
ORNL (2003). Landscan 2002. Oak Ridge National Laboratory. Retrieved
Lamberth, S.J. and Stewart, T.J. (1997). An evaluation of the attitudes
Nov. 2003 from http://www.ornl.gov/gist
and responses to monitoring and management measures for the
Pallett, J., (ed) (1997). Sharing water in South Africa. Desert Research
South African boat-based linefi shery. South African Journal of
Foundation of Namibia, Windhoek.
Marine Science 18:147-163.
PBMR EIA Consortium (2001). Scoping report for the proposed
Sauer, W.H.H., Hecht, T., Britz, P.J. and Mather, D. (2003). An Economic
demonstration module for a pebble bed modular reactor. PBMR
and Sectoral Study of the South African Fishing Industry. Volume
Report No. 00-0053.01-003. Retrieved March 2002, from http://
2: Fishery profi les. Report prepared for Marine and Coastal
www.pebble-bed.co.za.
Management by Rhodes University. Retrieved August 2004, from
http://www.envirofi shafrica.co.za/projects/ess.html
64
GIWA REGIONAL ASSESSMENT 44 BENGUELA CURRENT
Schrauwen, Y. (1993). Socio-economics for the estuary directly
Tarr, R.J.Q., Williams, P.V.G. and Mackenzie, A.J. (1996). Abalone, sea
associated with the natural environment. Berg Estuary and
urchins and rock lobster: a possible ecological shift may aff ect
Floodplain Ecological Water Requirements, Working Documents.
traditional fi sheries. South African Journal of Marine Science 17:
Berg River Estuary Work Session 15-18 March, 1993, Department of
319-324.
Water Aff airs and Forestry, South Africa.
Tarr, R.J.Q., Williams, P.V.G., Mackenzie, A.J., Plaganyi, E. and Moloney, C.
Schulze, R., Meigh, J. and Horan, M. (2001). Present and potential future
(2000). South African fi shery independent abalone surveys. Journal
vulnerability of eastern and southern Africa's hydrology and water
of Shellfi sh Research 19(1):537.
resources. South African Journal of Science 97:150-160.
Taunton-Clark, J. and Shannon, L.V. (1998). Annual and interannual
Shannon, L.V., Boyd, A.J., Brundrit, G.B. and Taunton-Clark, J. (1986). On
variability in the south-east Atlantic during the 20th century. South
the existence of an El Ni˝o-type phenomenon in the Benguela
African Journal of Marine Science 6:97-106.
system. Journal of Marine Research 44:495-520.
Trevenen-Jones, A. (2000). Treasure oil spill poses challenge for South
Shannon, L.V., Crawford, R.J.M., Pollock, D.E., Hutchings, L., Boyd, A.J.,
African environmental policy. 1 Ecomeme 2000. Retrieved February
Taunton-Clark, K.L., Badenhorst, A., Melville-Smith, R., Augustyn, C.J.,
2004, from http://www.law.berkeley.edu/journals/elq/ecomeme/
Cochrane, K.L., Hampton, I., Nelson, G., Japp, D.W. and Tarr, R.J.Q.
jones.html
(1992). The 1980s ş A decade of change in the Benguela ecosystem.
Tyson, P.D. (1986). Climate Change and Variability in Southern Africa.
In: Payne, A.I.L., Brinkman, K.H., Mann, K.H. and Hilborne, R. (eds),
Oxford University Press, Cape Town, South Africa.
Benguela Trophic Functioning. South African Journal of Marine
Tyson, P.D. (1990). Modeling climatic change in southern Africa: a review
Science 12:271-296.
of available methods. South African Journal of Science 86:318-330.
Siegfried, W.R., Crawford, R.J.M., Shannon, L.V., Pollock, D.E., Payne,
Tyson, P.D., Dyer, T.G.J. and Mametse, M.N. (1975). Secular changes in
A.I.L. and Krohn, R.G. 1990. Scenarios for global warming induced
South African rainfall: 1880-1972. Quarterly Journal of the Royal
change in the open ocean environment and selected fi sheries of
Meteorological Society 101:817-833.
the west coast of southern Africa. South African Journal of Science
Underhill, L.G., Whittington, P.A., Crawford, R.J.M. and Wolfaardt, A.C.
86:356-373.
(2000). Five years of monitoring African penguins (Spheniscus
Skelton, P.H. (1993). A Complete Guide to the Freshwater Fishes of
demersus) after the "Apollo Sea" oil spill: a success story identifi ed
Southern Africa. Southern Book Publishers, Halfway House.
by fl ipper bands. Vogelwarte 40(4):215-218. Retrieved March 2004,
Snaddon, C.D., Davies, B.R. and Wishart, M. (1999). A Global overview
from http://www.biosis.org.uk/sotw/021127/021120-zr-c.html
of Inter-basin Water Transfer Schemes, with an Appraisal of their
UNEP (2000). Global Environmental Outlook 2000. Chapter 2: The state
Ecological, Socio-economic and Socio-political Implications
of the environment ş Africa. Retrieved February 2002, from http:
and Recommendations for their Management, TT120/00. Water
//www.unep.org/geo2000/english/0057.htm
Research Commission, Pretoria
UNEP (2005). Angola Environmental Profi le. Retrieved January 2004,
Sowman, M., Hauck, M. and Branch, G. (2003). Lessons learned from nine
from http://www.unep.net/profi le/index.cfm
coastal and fi sheries co-management case studies. p 299-340 In:
USGS (2002). Global GIS Database: Global Land Cover Charactersitics.
Hauck, M. and Sowman, M., Waves of Change. University of Cape
CD-rom. US Department of the Interior, US Geological Survey,
Town Press, Cape Town, South Africa.
Flagstaff , USA.
Steff ani, C.N. (2001). Interactions between an indigenous limpet,
Van der Elst, R.P. (1989). Marine recreational angling in South Africa. p
Scutellastra argenvillei, and an alien invasive mussel, Mytilus
164-176 In: Payne, A.I.L. and Crawford, R.J.M. (eds.) Oceans of Life off
galloprovincialis: moderation by wave action. MSc thesis. University
Southern Africa. Vlaeberg Publishers, Cape Town, South Africa.
of Cape Town, South Africa.
Van Steenderen, R.A., Theron, S.J. and Hassett, A.J. (1986). Organic
Tarr, R.J.Q. (1998). Abalone (Perlemoen) resource about to collapse.
micropollutants in the Vaal River. p 58-78 In: The Vaal River
SANCOR Newsletter 4:8-11.
Ecosystem: Status and problems. Proceedings of a Joint Symposium
Tarr, R.J.Q. (2000). The South African abalone (Haliotis midae) fi shery:
Convened by the Foundation for Research Development and the
a decade of challenges and change. Journal of Shellfi sh Research
Vaal River Catchment Association. FRD Occasional Report No. 5.
19(1):537.
REFERENCES
65
Van Vliet, H.R. (1986). General chemical quality of the Vaal River. p 47-
Walmsley, R.D. (1991). Stream environments and catchment processes
57 In: The Vaal River Ecosystem: Status and problems. Proceedings
ş a South African perspective. p 45-57 In: Pigram, J.J. and Hooper,
of a Joint Symposium Convened by the Foundation for Research
B.P. (eds.) Water Allocation to the Environment. Proceedings of an
Development and the Vaal River Catchment Association. FRD
International Seminar and Workshop. The Centre for Water Policy
Occasional Report No. 5.
Research, University of New England, Armidale.
Verheye, H.M., Richardson, A.J., Hutchings, L., Marska, G. and Gianokouras,
Walmsley-Hart, S.A., Sauer, W.H.H. and Leslie, R.W. (2000). The
D. (1998). Long-term trends in the abundance and community
quantifi cation of by-catch and discards in the South African
structure of coastal zooplankton in the southern Benguela system,
demersal trawling industry. 10th Southern African Marine Science
1951-1996. In: Pillar, S.C., Maloney, C.L., Payne, A.I.L. and Shillington,
Symposium (SAMSS 2000): Land, Sea and People in the new
F.A. (eds). Benguela Dynamics. South African Journal of Marine
Millennium.
Science 19:317-332.
Western Cape Fishing Industry (2005). Retrieved January 2005, from
Viljoen, F.C. and Van der Merwe. (1986). Problems and Economics of
http://www.wesgro.org.za.
Bulk Water Supply. p 79-97 In: The Vaal River Ecosystem: Status
Whitfi eld, A.K. (1995). Available scientifi c information on individual
and problems. Proceedings of a Joint Symposium Convened by
South African estuarine systems. Report to the Water Research
the Foundation for Research Development and the Vaal River
Commission by the Consortium for Estuarine Research and
Catchment Association. FRD Occasional Report No. 5.
Management, Report No. 557/1/95. Water Research Commission,
Wallace, J.H., Kok, H.M., Beckley, L.E., Bennett, B., Blaber, S.J.M. and
Pretoria.
Whitfi eld, A.K. (1984). South African estuaries and their importance
World Bank (2001). World Development Indicators 2001. Retrieved
to fi shes. South African Journal of Marine Science 80:203-207.
April 2003, from http://www.worlbank.org/data/wdi2001/pdfs/
tab3_6.pdf
66
GIWA REGIONAL ASSESSMENT 44 BENGUELA CURRENT
Annexes
Annex I
List of contributing authors and organisations
Name
Institutional affiliation
Country
Field of work
Dr Kim Prochazka
International Ocean Institute Southern Africa, Department of Biodiversity and Conservation Biology,
South Africa
Marine biology and ecology
(Regional Focal point) University of the Western Cape
Prof. Bryan Davies
Freshwater Research Unit, Zoology Department, University of Cape Town
South Africa
Freshwater biology , ecology and policy
Prof. Charles Griffiths
Marine Biology Research Institute, Zoology Department, University of Cape Town
South Africa
Marine biology and ecology, Benguela fisheries
Dr Mafa Hara
Programme for Land and Agrarian Studies, School of Government, University of the Western Cape
South Africa
Fisheries policy, Fisheries socio-economics
Mr Nkosi Luyeye
BCLME Country Coordinator (Angola), Ministry of Fisheries
Angola
Marine biology and ecology, Benguela fisheries, Benguela dynamics
Dr Mick O'Toole
Chief Technical Advisor, Benguela Current Large Marine Ecosystem Programme
Namibia
Marine biology and ecology, Benguela fisheries, Benguela dynamics
Enivronmental Evaluation Unit, Department of Environmental and Geographical Sciences, University
Ms Janet Bodenstein
South Africa
Socio-economics, Coastal communities
of Cape Town
Dr Trevor Probyn
Marine and Coastal Management, Department of Environmental Affairs and Tourism
South Africa
Marine ecology, Oceanography & Benguela dynamics, Marine pollution
Dr Barry Clark
Anchor Environmental Consultants
South Africa
Marine biology and ecology, Benguela fisheries, Climate change
Mr Anton Earle
African Water Issues Research Unit, University of Pretoria
South Africa
Freshwater policy
Prof. Chris Tapscott
School of Government, University of the Western Cape
South Africa
Economics of Benguela coast and fisheries
Mr Richard Hasler
Private consultant
South Africa
Social aspects of freshwater use
ANNEXES
67
Annex II
Detailed scoring tables: Freshwater component
I: Freshwater shortage
II: Pollution
Weight
Weight
Environmental
Environmental
Environmental issues
Score
Weight
averaged
Environmental issues
Score
Weight
averaged
concern
concern
score
score
1. Modification of stream flow
3
50
Freshwater shortage
3
4. Microbiological
3
20
Pollution
3
2. Pollution of existing supplies
3
25
5. Eutrophication
3
20
3. Changes in the water table
3
50
6. Chemical
3
20
7. Suspended solids
2
10
Criteria for Economics impacts
Raw score
Score
Weight %
8. Solid wastes
3
10
Very small
Very large
Size of economic or public sectors affected
3
33
0 1 2 3
9. Thermal
1
5
Minimum
Severe
Degree of impact (cost, output changes etc.)
3
33
10. Radionuclides
3
5
0 1 2 3
Occasion/Short
Continuous
Frequency/Duration
3
33
11. Spills
3
10
0 1 2 3
Weight average score for Economic impacts
3
Criteria for Economics impacts
Raw score
Score
Weight %
Criteria for Health impacts
Raw score
Score
Weight %
Very small
Very large
Very small
Very large
Size of economic or public sectors affected
3
33
Number of people affected
2
40
0 1 2 3
0 1 2 3
Minimum
Severe
Minimum
Severe
Degree of impact (cost, output changes etc.)
3
33
Degree of severity
2
30
0 1 2 3
0 1 2 3
Occasion/Short
Continuous
Occasion/Short
Continuous
Frequency/Duration
3
33
Frequency/Duration
3
30
0 1 2 3
0 1 2 3
Weight average score for Economic impacts
3
Weight average score for Health impacts
2
Criteria for Health impacts
Raw score
Score
Weight %
Criteria for Other social and
Raw score
Score
Weight %
community impacts
Very small
Very large
Number of people affected
1
33
Very small
Very large
0 1 2 3
Number and/or size of community affected
1
25
0 1 2 3
Minimum
Severe
Degree of severity
2
33
Minimum
Severe
0 1 2 3
Degree of severity
2
50
0 1 2 3
Occasion/Short
Continuous
Frequency/Duration
3
33
Occasion/Short
Continuous
0 1 2 3
Frequency/Duration
3
25
0 1 2 3
Weight average score for Health impacts
2
Weight average score for Other social and community impacts
2
Criteria for Other social and
Raw score
Score
Weight %
community impacts
Very small
Very large
Number and/or size of community affected
0
33
0 1 2 3
Minimum
Severe
Degree of severity
0
33
0 1 2 3
Occasion/Short
Continuous
Frequency/Duration
3
33
0 1 2 3
Weight average score for Other social and community impacts
1
68
GIWA REGIONAL ASSESSMENT 44 BENGUELA CURRENT
III: Habitat and community modification
V: Global change
Environmental
Weight averaged
Weight
Environmental issues
Score
Weight
Environmental
concern
score
Environmental issues
Score
Weight
averaged
concern
Habitat and
score
12. Loss of ecosystems
3
50
community
3
19. Changes in the hydrological cycle
2
50
Global change
2
modification
Soligenous bogs
3
20. Sea level change
Not assessed
Marshes (vleis)
3
21. Increased UV-B radiation as a
2
50
Riparian belts
3
result of ozone depletion
Endorheic pans
2
22. Changes in ocean CO2
Not assessed
Floodplains
3
source/sink function
Intermittent rivers
3
Permanent rivers
2
Criteria for Economics impacts
Raw score
Score
Weight %
13. Modification of ecosystems or
ecotones, including community
3
50
Very small
Very large
Size of economic or public sectors affected
0
50
structure and/or species composition
0 1 2 3
Soligenous bogs
3
Minimum
Severe
Degree of impact (cost, output changes etc.)
0
50
0 1 2 3
Marshes (vleis)
3
Occasion/Short
Continuous
Riparian belts
3
Frequency/Duration
3
0
0 1 2 3
Endorheic pans
3
Weight average score for Economic impacts
0
Floodplains
3
Intermittent rivers
3
Criteria for Health impacts
Raw score
Score
Weight %
Permanent rivers
3
Very small
Very large
Number of people affected
2
33
0 1 2 3
Minimum
Severe
Criteria for Economics impacts
Raw score
Score
Weight %
Degree of severity
1
33
0 1 2 3
Very small
Very large
Size of economic or public sectors affected
2
33
Occasion/Short
Continuous
0 1 2 3
Frequency/Duration
1
33
0 1 2 3
Minimum
Severe
Degree of impact (cost, output changes etc.)
2
33
0 1 2 3
Weight average score for Health impacts
1
Occasion/Short
Continuous
Frequency/Duration
3
33
Criteria for Other social and
0 1 2 3
Raw score
Score
Weight %
community impacts
Weight average score for Economic impacts
2
Very small
Very large
Number and/or size of community affected
0
33
0 1 2 3
Criteria for Health impacts
Raw score
Score
Weight %
Minimum
Severe
Degree of severity
0
33
0 1 2 3
Very small
Very large
Number of people affected
2
33
Occasion/Short
Continuous
0 1 2 3
Frequency/Duration
0
33
0 1 2 3
Minimum
Severe
Degree of severity
1
33
0 1 2 3
Weight average score for Other social and community impacts
0
Occasion/Short
Continuous
Frequency/Duration
3
33
0 1 2 3
Weight average score for Health impacts
2
Criteria for Other social and
Raw score
Score
Weight %
community impacts
Very small
Very large
Number and/or size of community affected
1
33
0 1 2 3
Minimum
Severe
Degree of severity
2
33
0 1 2 3
Occasion/Short
Continuous
Frequency/Duration
3
33
0 1 2 3
Weight average score for Other social and community impacts
2
ANNEXES
69
Annex II
Detailed scoring tables: Marine component
II: Pollution
III: Habitat and community modification
Weight
Environmental
Weight averaged
Environmental
Environmental issues
Score
Weight
Environmental issues
Score
Weight
averaged
concern
score
concern
score
Habitat and
4. Microbiological
2
20
Pollution
2
12. Loss of ecosystems
1
50
community
2
modification
5. Eutrophication
1
20
Sandy foreshores
1
Lagoons
2
6. Chemical
1
20
Estuaries
3
7. Suspended solids
2
10
Rocky foreshores
1
Mangroves
2
8. Solid wastes
2
10
Kelp systems
0
9. Thermal
1
5
Mud bottom
0
Sand and gravel bottom
0
10. Radionuclides
1
5
Rocky bottom
0
13. Modification of ecosystems or
11. Spills
3
10
ecotones, including community
2
50
structure and/or species composition
Sandy foreshores
2
Criteria for Economics impacts
Raw score
Score
Weight %
Lagoons
2
Very small
Very large
Size of economic or public sectors affected
3
33
Estuaries
3
0 1 2 3
Rocky foreshores
2
Minimum
Severe
Degree of impact (cost, output changes etc.)
3
33
Mangroves
1
0 1 2 3
Occasion/Short
Continuous
Kelp systems
2
Frequency/Duration
3
33
0 1 2 3
Mud bottom
2
Sand and gravel bottom
2
Weight average score for Economic impacts
3
Rocky bottom
2
Criteria for Health impacts
Raw score
Score
Weight %
Very small
Very large
Number of people affected
1
33
Criteria for Economics impacts
Raw score
Score
Weight %
0 1 2 3
Minimum
Severe
Very small
Very large
Degree of severity
2
33
Size of economic or public sectors affected
2
33
0 1 2 3
0 1 2 3
Occasion/Short
Continuous
Minimum
Severe
Frequency/Duration
3
33
Degree of impact (cost, output changes etc.)
2
33
0 1 2 3
0 1 2 3
Occasion/Short
Continuous
Weight average score for Health impacts
2
Frequency/Duration
3
33
0 1 2 3
Criteria for Other social and
Raw score
Score
Weight %
Weight average score for Economic impacts
2
community impacts
Very small
Very large
Number and/or size of community affected
0
33
Criteria for Health impacts
Raw score
Score
Weight %
0 1 2 3
Minimum
Severe
Very small
Very large
Degree of severity
0
33
Number of people affected
2
33
0 1 2 3
0 1 2 3
Occasion/Short
Continuous
Minimum
Severe
Frequency/Duration
3
33
Degree of severity
1
33
0 1 2 3
0 1 2 3
Occasion/Short
Continuous
Weight average score for Other social and community impacts
1
Frequency/Duration
3
33
0 1 2 3
Weight average score for Health impacts
2
Criteria for Other social and
Raw score
Score
Weight %
community impacts
Very small
Very large
Number and/or size of community affected
1
33
0 1 2 3
Minimum
Severe
Degree of severity
2
33
0 1 2 3
Occasion/Short
Continuous
Frequency/Duration
3
33
0 1 2 3
Weight average score for Other social and community impacts
2
70
GIWA REGIONAL ASSESSMENT 44 BENGUELA CURRENT
IV: Unsustainable exploitation of fish
V: Global change
and other living resources
Weight
Environmental
Environmental issues
Score
Weight
averaged
Weight
concern
Environmental
score
Environmental issues
Score
Weight %
averaged
concern
score
19. Changes in the hydrological cycle
2
50
Global change
1
Unsustainable
14. Overexploitation
3
60
2
20. Sea level change
1
20
exploitation of fish
15. Excessive by-catch and
21. Increased UV-B radiation as a
1
20
0
20
discards
result of ozone depletion
22. Changes in ocean CO2
1
10
16. Destructive fishing practices
2
10
source/sink function
17. Decreased viability of stock
0
5
through pollution and disease
Criteria for Economics impacts
Raw score
Score
Weight %
18. Impact on biological and
2
5
genetic diversity
Very small
Very large
Size of economic or public sectors affected
0
50
0 1 2 3
Minimum
Severe
Degree of impact (cost, output changes etc.)
0
50
Criteria for Economics impacts
Raw score
Score
Weight %
0 1 2 3
Occasion/Short
Continuous
Very small
Very large
Frequency/Duration
3
0
Size of economic or public sectors affected
2
33
0 1 2 3
0 1 2 3
Minimum
Severe
Weight average score for Economic impacts
0
Degree of impact (cost, output changes etc.)
2
33
0 1 2 3
Occasion/Short
Continuous
Criteria for Health impacts
Raw score
Score
Weight %
Frequency/Duration
3
33
0 1 2 3
Very small
Very large
Number of people affected
2
33
Weight average score for Economic impacts
2
0 1 2 3
Minimum
Severe
Degree of severity
1
33
Criteria for Health impacts
Raw score
Score
Weight %
0 1 2 3
Occasion/Short
Continuous
Very small
Very large
Frequency/Duration
1
33
Number of people affected
2
33
0 1 2 3
0 1 2 3
Minimum
Severe
Weight average score for Health impacts
1
Degree of severity
2
33
0 1 2 3
Criteria for Other social and
Occasion/Short
Continuous
Raw score
Score
Weight %
Frequency/Duration
2
33
community impacts
0 1 2 3
Very small
Very large
Number and/or size of community affected
0
33
Weight average score for Health impacts
2
0 1 2 3
Minimum
Severe
Criteria for Other social and
Degree of severity
0
33
Raw score
Score
Weight %
0 1 2 3
community impacts
Occasion/Short
Continuous
Very small
Very large
Frequency/Duration
0
33
Number and/or size of community affected
1
33
0 1 2 3
0 1 2 3
Minimum
Severe
Weight average score for Other social and community impacts
0
Degree of severity
2
33
0 1 2 3
Occasion/Short
Continuous
Frequency/Duration
2
33
0 1 2 3
Weight average score for Other social and community impacts
2
ANNEXES
71
Comparative environmental and socio-economic impacts of
each GIWA concern
Freshwater component
Types of impacts
Environmental score
Economic score
Human health score
Social and community score
Concern
Overall score
Rank
Present (a)
Future (b)
Present (a)
Future (b)
Present (a)
Future (b)
Present (a)
Future (b)
Freshwater shortage
3
3
3
3
2
2
2
2
2.5
1
Pollution
3
3
3
3
2
2
1
3
2.5
2
Habitat and community
3
3
2
3
2
2
2
2
2.4
2
modification
Global change
2
3
0
2
1
2
0
1
1.4
2
Marine component
Types of impacts
Environmental score
Economic score
Human health score
Social and community score
Concern
Overall score
Rank
Present (a)
Future (b)
Present (a)
Future (b)
Present (a)
Future (b)
Present (a)
Future (b)
Pollution
2
3
3
3
2
2
1
2
2.3
2
Habitat and community
2
3
2
3
2
2
2
2
2.3
2
modification
Unsustainable exploitation of fish
2
3
2
2
2
2
2
2
2.1
1
and other living resources
Global change
1
3
0
2
1
2
0
1
1.3
1
72
GIWA REGIONAL ASSESSMENT 44 BENGUELA CURRENT
Annex III
List of conventions and specific laws that affect water use in
the region
The following table lists a number of international agreements relating to the natural environment in general and aquatic systems in particular, and protection thereof in Angola, Namibia and
South Africa. Please note that much of Namibia's legislation is similar to that of South Africa as it has not been changed since gaining independence. Please also note that the table is not necessarily
comprehensive.
Agreement
Status
Basel Convention on the Control of Transboundary Movements of
Ratified by Namibia and South Africa
Harzardous Wastes and their Disposal, 1989
United Nations Convention on the Law of the Sea, 1994
Not ratified by any of the countries in the region, but many aspects are provided for in national laws of the countries
International Convention for the Prevention of Pollution from Ships, 1973
South Africa and Namibia have acceded and enacted domestic legislation
(MARPOL)
International Convention Relating to Intervention on the High Seas in Cases Legislated in South Africa as the International Convention relating to Intervention on the High Seas in Cases of Oil Pollution Casualties Act,
of Oil Pollution Casualties
64 of 1987
International Convention on Civil Liability for Oil Pollution Damage
Legislated in South Africa and Namibia as the Prevention and Combating of Pollution of the Sea by Oil Act of 1981
Convention of the International Maritime Organization, 1948
Angola, Namibia and South Africa are all parties to the Convention
International Convention on Oil Pollution Preparedness, Response and
South Africa is a party to this Convention, although Angola and Namibia are not
Cooperation, 1990
Convention on Biological Diversity, 1992
Angola, Namibia and South Africa have all ratified the Convention
Ramsar Convention on Wetlands of International Importance
Namibia and South Africa are parties to the Convention
Ratified by Namibia and South Africa, and legislated through the marine Living Resources Act of 1998 and the Marine Resources Act of 2000
International Convention on the Regulation of Whaling
in these countries respectively
Convention on the Ban of Import into Africa and the Control of
Transboundary Movement and Management of Hazardous Waste within
Neither Angola, Namibia nor South Africa have acceded to the Convention
Africa ş Bamako Convention, 1991
Convention for the Prevention of Marine Pollution from Land-based
Neither Angola, Namibia nor South Africa have acceded to the Convention
Sources, 1974
Angola, Namibia and South Africa all require environmental impact assessment. Namibia and South Africa both require monitoring of
Southern African Development Community (SADC) Environmental Policy
impacts throughout the lifespan of the mining operation, and South Africa requires provision for rehabilitation and/or ongoing management
and Regulatory Framework for Mining
of impacts
Southern African Development Community (SADC) Protocol on Fisheries
This protocol has not yet come into force
South East Atlantic Fisheries Organization (SEAFO)
Ratified by Namibia, signed but not yet ratified by Angola and South Africa
UN Agreement for the Conservation and Management of Straddling Fish
Signed by Namibia and South Africa, not yet signed by Angola
Stocks and Highly Migratory Fish Stocks
FAO Agreement to Promote Compliance with International Conservation
and Management Measures by Fishing Vessels on the High Seas
Southern African Development Community (SADC) Protocol on Shared
Watercourse Systems in the SADC Region
Convention on the Prevention of Marine Pollution by Dumping of Waste and Legislated in South Africa through the Dumping at Sea Control Act, 73 of 1980, not yet legislated for in Angola or Namibia
Other Matter (London Convention), 1972
ANNEXES
73
Annex IV
List of national policy and legislation
National policy and legal frameworks aimed at protection of the natural environment are in place in the countries falling within the Benguela Current region. The following table outlines some of the
legislation and policy pertinent to protection of domestic and transboundary waters within Angola, Namibia and South Africa. A brief explanation of the key elements of each, as relates to aquatic
environments, is given.
Legislation
Coverage
Key elements
Angola
Constitution of the Republic of Angola, 1992
Environmental protection in general
Provides the basis for environmental protection and conservation and the right to a healthy and unpolluted environment
Provides the framework for all environmental legislation and regulations
Environmental Framework Act, 1998
Environmental protection in general
Incorporates key international policies
Sustainable management
Vessel licensing
International and regional cooperation
Fisheries Act, 1992
EEZ, internal waters and all inland waters
Supply of fisheries data
Mariculture
Quality and export of fisheries products
Monitoring, control and surveillance of fishing activities
Use of natural resources
Interior and Marine Exclusive Economic Zone
EEZ, internal waters and all inland waters
Protection of the environment
Act, 1992
Promotion of scientific research
Exclusive rights to SOLANGOL for exploration, drilling and production of oil products
Petroleum Activities Act, 1978
Oil industry
Facilitation of international partnerships to increase local capacity
Sustainable development of the oil industry
Petroleum Activities Decree, 2000
Oil industry
Compulsory use of environmental impact assessment
Declares all mineral resources as state property
Mining Act, 1979
National
Regulates exploration and mining activities
Local Municipalities Act, 1999
National
Development, sanitation, environmental protection and land management responsibility of provincial and local government
Regulates foreign investments to ensure compliance with local policies on environmental protection, safety, health and
Foreign Investment Act, 1994
National
environment of workers
Access to, use and protection of water resources
Water Act (Draft)
National
Compulsory environmental impact assessment for all water projects
Environmental Impact Assessment Decree
National
Requirements and standards for environmental impact assessment
(Draft)
Namibia
Maintenance of ecosystems, processes, biodiversity
Constitution of the Republic of Namibia, 1990 Environmental protection in general
Sustainable utilization of natural resources
Dumping or recycling of foreign nuclear waste
Sustainable use of living and non-living natural resources
Environmental auditing and environmental impact assessment
Green Plan, 1992
Environmental protection in general
Pollutant treatment and disposal, including hazardous waste
Protection of representative landscapes and ecological diversity
Environmental Assessment Policy for
Sustainable development
Sustainable Development and Environmental National
Compulsory environmental impact assessment
Conservation, 1994
Requirements for environmental impact assessment
Management of the environment and natural resources
Environmental Management Bill (Draft)
National
Provide mechanisms for implementation of obligations under international conventions
Establish institutions for environmental management and protection
Inter-sectoral coordination
Need for realistic water pricing
White Paper on National Water Policy for
Protection from pollution, and polluter pays principle
Primarily freshwaters
Namibia, 2000
Water quality monitoring
Development of alternative water sources
Improvement of knowledge of critical wetlands and management thereof
Establishes water rights
Water Act, 1956
Freshwater and seawater
Regulates against pollution of water resources
Health Act, 1919
Sanitation, food and public water supplies
Regulation of pollution from a public health perspective
Regulation regarding import, export, manufacture, sale, use, disposal dumping of hazardous substances
The Hazardous Substances Ordinance, 1974
Hazardous substances
Makes provision for appointment of inspectors
Pollution Control and Waste Management
Air, water and land
To prevent discharge of pollutants and fulfill international obligations
Bill (Draft)
Stipulates liability caused by discharge from ships, tankers, offshore installations
Prevention and Combating of Pollution of the
Exceptions include emergencies and accidental leakage
Oil discharge
Sea by Oil, 1981
Includes provisions for inspection of vessels and land-based facilities
Legislates `polluter-pays' principle
74
GIWA REGIONAL ASSESSMENT 44 BENGUELA CURRENT
Legislation
Coverage
Key elements
Angola
Constitution of the Republic of Angola, 1992
Environmental protection in general
Provides the basis for environmental protection and conservation and the right to a healthy and unpolluted environment
Provides the framework for all environmental legislation and regulations
Environmental Framework Act, 1998
Environmental protection in general
Incorporates key international policies
Sustainable management
Vessel licensing
International and regional cooperation
Fisheries Act, 1992
EEZ, internal waters and all inland waters
Supply of fisheries data
Mariculture
Quality and export of fisheries products
Monitoring, control and surveillance of fishing activities
Use of natural resources
Interior and Marine Exclusive Economic Zone
EEZ, internal waters and all inland waters
Protection of the environment
Act, 1992
Promotion of scientific research
Exclusive rights to SOLANGOL for exploration, drilling and production of oil products
Petroleum Activities Act, 1978
Oil industry
Facilitation of international partnerships to increase local capacity
Sustainable development of the oil industry
Petroleum Activities Decree, 2000
Oil industry
Compulsory use of environmental impact assessment
Declares all mineral resources as state property
Mining Act, 1979
National
Regulates exploration and mining activities
Local Municipalities Act, 1999
National
Development, sanitation, environmental protection and land management responsibility of provincial and local government
Regulates foreign investments to ensure compliance with local policies on environmental protection, safety, health and
Foreign Investment Act, 1994
National
environment of workers
Access to, use and protection of water resources
Water Act (Draft)
National
Compulsory environmental impact assessment for all water projects
Environmental Impact Assessment Decree
National
Requirements and standards for environmental impact assessment
(Draft)
Namibia
Maintenance of ecosystems, processes, biodiversity
Constitution of the Republic of Namibia, 1990 Environmental protection in general
Sustainable utilization of natural resources
Dumping or recycling of foreign nuclear waste
Sustainable use of living and non-living natural resources
Environmental auditing and environmental impact assessment
Green Plan, 1992
Environmental protection in general
Pollutant treatment and disposal, including hazardous waste
Protection of representative landscapes and ecological diversity
Environmental Assessment Policy for
Sustainable development
Sustainable Development and Environmental National
Compulsory environmental impact assessment
Conservation, 1994
Requirements for environmental impact assessment
Management of the environment and natural resources
Environmental Management Bill (Draft)
National
Provide mechanisms for implementation of obligations under international conventions
Establish institutions for environmental management and protection
Inter-sectoral coordination
Need for realistic water pricing
White Paper on National Water Policy for
Protection from pollution, and polluter pays principle
Primarily freshwaters
Namibia, 2000
Water quality monitoring
Development of alternative water sources
Improvement of knowledge of critical wetlands and management thereof
Establishes water rights
Water Act, 1956
Freshwater and seawater
Regulates against pollution of water resources
Health Act, 1919
Sanitation, food and public water supplies
Regulation of pollution from a public health perspective
Regulation regarding import, export, manufacture, sale, use, disposal dumping of hazardous substances
The Hazardous Substances Ordinance, 1974
Hazardous substances
Makes provision for appointment of inspectors
Pollution Control and Waste Management
Air, water and land
To prevent discharge of pollutants and fulfill international obligations
Bill (Draft)
Stipulates liability caused by discharge from ships, tankers, offshore installations
Prevention and Combating of Pollution of the
Exceptions include emergencies and accidental leakage
Oil discharge
Sea by Oil, 1981
Includes provisions for inspection of vessels and land-based facilities
Legislates `polluter-pays' principle
National Oil Spill Contingency Plan (Draft)
Oil spills
Provides a framework for response in the event of a spill
Minerals Policy of Namibia
Mining sector
Ensuring environmentally sustainable exploration and mining activities
Mineral rights belong to the state
Minerals (Prospecting and Mining) Act, 1992
Mining sector
Environmental protection within mining operations
Rights for exploration, production and disposal belong to the state
Petroleum (Exploration and Production)
Petroleum industry
License holders may not interfere with fishing or navigation, must prevent pollution of any water
Act, 1991
License holders are required to minimize environmental effects and to undertake environmental rehabilitation if necessary
ANNEXES
75
76
GIWA REGIONAL ASSESSMENT 44 BENGUELA CURRENT
The Global International
Waters Assessment
This report presents the results of the Global International Waters
Adequately managing the world's aquatic resources for the benefi t of
Assessment (GIWA) of the transboundary waters of the Benguela
all is, for a variety of reasons, a very complex task. The liquid state of
Current region. This and the subsequent chapter off er a background
the most of the world's water means that, without the construction
that describes the impetus behind the establishment of GIWA, its
of reservoirs, dams and canals it is free to fl ow wherever the laws of
objectives and how the GIWA was implemented.
nature dictate. Water is, therefore, a vector transporting not only a
wide variety of valuable resources but also problems from one area
to another. The effl
uents emanating from environmentally destructive
activities in upstream drainage areas are propagated downstream
The need for a global
and can aff ect other areas considerable distances away. In the case of
international waters
transboundary river basins, such as the Nile, Amazon and Niger, the
assessment
impacts are transported across national borders and can be observed
in the numerous countries situated within their catchments. In the case
of large oceanic currents, the impacts can even be propagated between
Globally, people are becoming increasingly aware of the degradation of
continents (AMAP 1998). Therefore, the inextricable linkages within
the world's water bodies. Disasters from fl oods and droughts, frequently
and between both freshwater and marine environments dictates that
reported in the media, are considered to be linked with ongoing global
management of aquatic resources ought to be implemented through
climate change (IPCC 2001), accidents involving large ships pollute public
a drainage basin approach.
beaches and threaten marine life and almost every commercial fi sh stock
is exploited beyond sustainable limits - it is estimated that the global
In addition, there is growing appreciation of the incongruence
stocks of large predatory fi sh have declined to less that 10% of pre-
between the transboundary nature of many aquatic resources and the
industrial fi shing levels (Myers & Worm 2003). Further, more than 1 billion
traditional introspective nationally focused approaches to managing
people worldwide lack access to safe drinking water and 2 billion people
those resources. Water, unlike laws and management plans, does not
lack proper sanitation which causes approximately 4 billion cases of
respect national borders and, as a consequence, if future management
diarrhoea each year and results in the death of 2.2 million people, mostly
of water and aquatic resources is to be successful, then a shift in focus
children younger than fi ve (WHO-UNICEF 2002). Moreover, freshwater
towards international cooperation and intergovernmental agreements
and marine habitats are destroyed by infrastructure developments,
is required (UN 1972). Furthermore, the complexity of managing the
dams, roads, ports and human settlements (Brinson & Malvßrez 2002,
world's water resources is exacerbated by the dependence of a great
Kennish 2002). As a consequence, there is growing public concern
variety of domestic and industrial activities on those resources. As a
regarding the declining quality and quantity of the world's aquatic
consequence, cross-sectoral multidisciplinary approaches that integrate
resources because of human activities, which has resulted in mounting
environmental, socio-economic and development aspects into
pressure on governments and decision makers to institute new and
management must be adopted. Unfortunately however, the scientifi c
innovative policies to manage those resources in a sustainable way
information or capacity within each discipline is often not available or
ensuring their availability for future generations.
is inadequately translated for use by managers, decision makers and
GLOBAL INTERNATIONAL WATERS ASSESSMENT
i
policy developers. These inadequacies constitute a serious impediment
The Global Environment Facility (GEF)
to the implementation of urgently needed innovative policies.
The Global Environment Facility forges international co-operation and fi nances actions to address
six critical threats to the global environment: biodiversity loss, climate change, degradation of
international waters, ozone depletion, land degradation, and persistent organic pollutants (POPs).
Continual assessment of the prevailing and future threats to aquatic
The overall strategic thrust of GEF-funded international waters activities is to meet the incremental
ecosystems and their implications for human populations is essential if
costs of: (a) assisting groups of countries to better understand the environmental concerns of
their international waters and work collaboratively to address them; (b) building the capacity
governments and decision makers are going to be able to make strategic
of existing institutions to utilise a more comprehensive approach for addressing transboundary
policy and management decisions that promote the sustainable use of
water-related environmental concerns; and (c) implementing measures that address the priority
transboundary environmental concerns. The goal is to assist countries to utilise the full range of
those resources and respond to the growing concerns of the general
technical, economic, fi nancial, regulatory, and institutional measures needed to operationalise
public. Although many assessments of aquatic resources are being
sustainable development strategies for international waters.
conducted by local, national, regional and international bodies, past
United Nations Environment Programme (UNEP)
assessments have often concentrated on specifi c themes, such as
United Nations Environment Programme, established in 1972, is the voice for the environment
biodiversity or persistent toxic substances, or have focused only on
within the United Nations system. The mission of UNEP is to provide leadership and encourage
partnership in caring for the environment by inspiring, informing, and enabling nations and
marine or freshwaters. A globally coherent, drainage basin based
peoples to improve their quality of life without compromising that of future generations.
assessment that embraces the inextricable links between transboundary
UNEP work encompasses:
freshwater and marine systems, and between environmental and
Assessing global, regional and national environmental conditions and trends;
Developing international and national environmental instruments;
societal issues, has never been conducted previously.
Strengthening institutions for the wise management of the environment;
Facilitating the transfer of knowledge and technology for sustainable development;
Encouraging new partnerships and mind-sets within civil society and the private sector.
International call for action
University of Kalmar
University of Kalmar hosts the GIWA Co-ordination Offi ce and provides scientifi c advice and
administrative and technical assistance to GIWA. University of Kalmar is situated on the coast of
The need for a holistic assessment of transboundary waters in order to
the Baltic Sea. The city has a long tradition of higher education; teachers and marine offi cers have
been educated in Kalmar since the middle of the 19th century. Today, natural science is a priority
respond to growing public concerns and provide advice to governments
area which gives Kalmar a unique educational and research profi le compared with other smaller
universities in Sweden. Of particular relevance for GIWA is the established research in aquatic and
and decision makers regarding the management of aquatic resources
environmental science. Issues linked to the concept of sustainable development are implemented
was recognised by several international bodies focusing on the global
by the research programme Natural Resources Management and Agenda 21 Research School.
environment. In particular, the Global Environment Facility (GEF)
Since its establishment GIWA has grown to become an integral part of University activities.
The GIWA Co-ordination offi ce and GIWA Core team are located at the Kalmarsund Laboratory, the
observed that the International Waters (IW) component of the GEF
university centre for water-related research. Senior scientists appointed by the University are actively
suff ered from the lack of a global assessment which made it diffi
cult
involved in the GIWA peer-review and steering groups. As a result of the cooperation the University
can offer courses and seminars related to GIWA objectives and international water issues.
to prioritise international water projects, particularly considering
the inadequate understanding of the nature and root causes of
environmental problems. In 1996, at its fourth meeting in Nairobi, the
causes of degradation of the transboundary aquatic environment and
GEF Scientifi c and Technical Advisory Panel (STAP), noted that: "Lack of
options for addressing them. These pro cesses led to the development
an International Waters Assessment comparable with that of the IPCC, the
of the Global International Waters Assessment (GIWA) that would be
Global Biodiversity Assessment, and the Stratospheric Ozone Assessment,
implemented by the United Nations Environment Programme (UNEP) in
was a unique and serious impediment to the implementation of the
conjunction with the University of Kalmar, Sweden, on behalf of the GEF.
International Waters Component of the GEF".
The GIWA was inaugurated in Kalmar in October 1999 by the Executive
Director of UNEP, Dr. Klaus T÷pfer, and the late Swedish Minister of the
The urgent need for an assessment of the causes of environmental
Environment, Kjell Larsson. On this occasion Dr. T÷pfer stated: "GIWA
degradation was also highlighted at the UN Special Session on
is the framework of UNEP┤s global water assessment strategy and will
the Environment (UNGASS) in 1997, where commitments were
enable us to record and report on critical water resources for the planet for
made regarding the work of the UN Commission on Sustainable
consideration of sustainable development management practices as part of
Development (UNCSD) on freshwater in 1998 and seas in 1999. Also in
our responsibilities under Agenda 21 agreements of the Rio conference".
1997, two international Declarations, the Potomac Declaration: Towards
enhanced ocean security into the third millennium, and the Stockholm
The importance of the GIWA has been further underpinned by the UN
Statement on inter action of land activities, freshwater and enclosed
Millennium Development Goals adopted by the UN General Assembly
seas, specifi cally emphasised the need for an investigation of the root
in 2000 and the Declaration from the World Summit on Sustainable
ii
REGIONAL ASSESSMENTS
Development in 2002. The development goals aimed to halve the
International waters and transboundary issues
proportion of people without access to safe drinking water and basic
The term "international waters", as used for the purposes of the GEF Operational Strategy,
sanitation by the year 2015 (United Nations Millennium Declaration
includes the oceans, large marine ecosystems, enclosed or semi-enclosed seas and estuaries, as
well as rivers, lakes, groundwater systems, and wetlands with transboundary drainage basins
2000). The WSSD also calls for integrated management of land, water and
or common borders. The water-related ecosystems associated with these waters are considered
living resources (WSSD 2002) and, by 2010, the Reykjavik Declaration on
integral parts of the systems.
The term "transboundary issues" is used to describe the threats to the aquatic environment
Responsible Fisheries in the Marine Ecosystem should be implemented
linked to globalisation, international trade, demographic changes and technological advancement,
by all countries that are party to the declaration (FAO 2001).
threats that are additional to those created through transboundary movement of water. Single
country policies and actions are inadequate in order to cope with these challenges and this makes
them transboundary in nature.
The international waters area includes numerous international conventions, treaties, and
agreements. The architecture of marine agreements is especially complex, and a large number
The conceptual framework
of bilateral and multilateral agreements exist for transboundary freshwater basins. Related
conventions and agreements in other areas increase the complexity. These initiatives provide
and objectives
a new opportunity for cooperating nations to link many different programmes and instruments
into regional comprehensive approaches to address international waters.
Considering the general decline in the condition of the world's aquatic
the large-scale deforestation of mangroves for ponds (Primavera 1997).
resources and the internationally recognised need for a globally
Within the GIWA, these "non-hydrological" factors constitute as large
coherent assessment of transboundary waters, the primary objectives
a transboundary infl uence as more traditionally recognised problems,
of the GIWA are:
such as the construction of dams that regulate the fl ow of water into
To provide a prioritising mechanism that allows the GEF to focus
a neighbouring country, and are considered equally important. In
their resources so that they are used in the most cost eff ective
addition, the GIWA recognises the importance of hydrological units that
manner to achieve signifi cant environmental benefi ts, at national,
would not normally be considered transboundary but exert a signifi cant
regional and global levels; and
infl uence on transboundary waters, such as the Yangtze River in China
To highlight areas in which governments can develop and
which discharges into the East China Sea (Daoji & Daler 2004) and the
implement strategic policies to reduce environmental degradation
Volga River in Russia which is largely responsible for the condition of
and improve the management of aquatic resources.
the Caspian Sea (Barannik et al. 2004). Furthermore, the GIWA is a truly
regional assessment that has incorporated data from a wide range of
In order to meet these objectives and address some of the current
sources and included expert knowledge and information from a wide
inadequacies in international aquatic resources management, the GIWA
range of sectors and from each country in the region. Therefore, the
has incorporated four essential elements into its design:
transboundary concept adopted by the GIWA extends to include
A broad transboundary approach that generates a truly regional
impacts caused by globalisation, international trade, demographic
perspective through the incorporation of expertise and existing
changes and technological advances and recognises the need for
information from all nations in the region and the assessment of
international cooperation to address them.
all factors that infl uence the aquatic resources of the region;
A drainage basin approach integrating freshwater and marine
systems;
A multidisciplinary approach integrating environmental and socio-
The organisational structure and
economic information and expertise; and
implementation of the GIWA
A coherent assessment that enables global comparison of the
results.
The scale of the assessment
Initially, the scope of the GIWA was confi ned to transboundary waters
The GIWA builds on previous assessments implemented within the GEF
in areas that included countries eligible to receive funds from the GEF.
International Waters portfolio but has developed and adopted a broader
However, it was recognised that a truly global perspective would only
defi nition of transboundary waters to include factors that infl uence the
be achieved if industrialised, GEF-ineligible regions of the world were
quality and quantity of global aquatic resources. For example, due to
also assessed. Financial resources to assess the GEF-eligible countries
globalisation and international trade, the market for penaeid shrimps
were obtained primarily from the GEF (68%), the Swedish International
has widened and the prices soared. This, in turn, has encouraged
Development Cooperation Agency (Sida) (18%), and the Finnish
entrepreneurs in South East Asia to expand aquaculture resulting in
Department for International Development Cooperation (FINNIDA)
GLOBAL INTERNATIONAL WATERS ASSESSMENT
iii
1
15
11
16
14
12
28
10
13
17
25
29
9
18
30
19
23
22
8
7
31
6
20
24
26
35
33
2
34
27
5
21
50
32
51
36
37
41
52
4
49
53
43
65
55
48
54
3
42
56
46
62
47
40b
40a
57
62
45b
39
59
45a
58
60
64
44
61
38
63
66
1 Arctic
12 Norwegian
Sea
(LME)
24 Aral
Sea
36 East-China
Sea
(LME)
46
Somali Coastal Current (LME)
58
North Australian Shelf (LME)
2 Gulf
of
Mexico
(LME)
13 Faroe
plateau
25
Gulf of Alaska (LME)
37
Hawaiian Archipelago (LME)
47
East African Rift Valley Lakes
59 Coral
Sea
Basin
3
Caribbean Sea (LME)
14
Iceland Shelf (LME)
26 California
Current
(LME)
38
Patagonian Shelf (LME)
48
Gulf of Aden
60 Great
Barrier
Reef
(LME)
4 Caribbean
Islands
15
East Greenland Shelf (LME)
27
Gulf of California (LME)
39
Brazil Current (LME)
49 Red
Sea
(LME)
61 Great
Australian
Bight
5
Southeast Shelf (LME)
16
West Greenland Shelf (LME)
28
East Bering Sea (LME)
40a Brazilian Northeast (LME)
50 The
Gulf
62
Small Island States
6
Northeast Shelf (LME)
17 Baltic
Sea
(LME)
29
West Bering Sea (LME)
40b Amazon
51 Jordan
63 Tasman
Sea
7
Scotian Shelf (LME)
18 North
Sea
(LME)
30
Sea of Okhotsk (LME)
41
Canary Current (LME)
52 Arabian
Sea
(LME)
64 Humboldt
Current
(LME)
8
Gulf of St Lawrence
19
Celtic-Biscay Shelf (LME)
31
Oyashio Current (LME)
42
Guinea Current (LME)
53
Bay of Bengal S.E.
65
Eastern Equatorial Pacific
9
Newfoundland Shelf (LME)
20 Iberian
Coastal
(LME)
32
Kuroshio Current (LME)
43 Lake
Chad
54 South
China
Sea
(LME)
66 Antarctic
(LME)
10
Baffin Bay, Labrador Sea,
21 Mediterranean
Sea
(LME)
33
Sea of Japan/East Sea (LME)
44
Benguela Current (LME)
55 Mekong
River
Canadian Archipelago
22 Black
Sea
(LME)
34 Yellow
Sea
(LME)
45a Agulhas Current (LME)
56 Sulu-Celebes
Sea
(LME)
11 Barents
Sea
(LME)
23 Caspian
Sea
35 Bohai
Sea
45b Indian Ocean Islands
57 Indonesian
Seas
(LME)
Figure 1
The 66 transboundary regions assessed within the GIWA project.
(10%). Other contributions were made by Kalmar Municipality, the
Considering the objectives of the GIWA and the elements incorporated
University of Kalmar and the Norwegian Government. The assessment of
into its design, a new methodology for the implementation of the
regions ineligible for GEF funds was conducted by various international
assessment was developed during the initial phase of the project. The
and national organisations as in-kind contributions to the GIWA.
methodology focuses on fi ve major environmental concerns which
constitute the foundation of the GIWA assessment; Freshwater shortage,
In order to be consistent with the transboundary nature of many of the
Pollution, Habitat and community modifi cation, Overexploitation of fi sh
world's aquatic resources and the focus of the GIWA, the geographical
and other living resources, and Global change. The GIWA methodology
units being assessed have been designed according to the watersheds
is outlined in the following chapter.
of discrete hydrographic systems rather than political borders (Figure 1).
The geographic units of the assessment were determined during the
The global network
preparatory phase of the project and resulted in the division of the
In each of the 66 regions, the assessment is conducted by a team of
world into 66 regions defi ned by the entire area of one or more
local experts that is headed by a Focal Point (Figure 2). The Focal Point
catchments areas that drains into a single designated marine system.
can be an individual, institution or organisation that has been selected
These marine systems often correspond to Large Marine Ecosystems
on the basis of their scientifi c reputation and experience implementing
(LMEs) (Sherman 1994, IOC 2002).
international assessment projects. The Focal Point is responsible
for assembling members of the team and ensuring that it has the
Large Marine Ecocsystems (LMEs)
necessary expertise and experience in a variety of environmental
Large Marine Ecosystems (LMEs) are regions of ocean space encompassing coastal areas from river
and socio-economic disciplines to successfully conduct the regional
basins and estuaries to the seaward boundaries of continental shelves and the outer margin of the
major current systems. They are relatively large regions on the order of 200 000 km2 or greater,
assessment. The selection of team members is one of the most critical
characterised by distinct: (1) bathymetry, (2) hydrography, (3) productivity, and (4) trophically
elements for the success of GIWA and, in order to ensure that the
dependent populations.
most relevant information is incorporated into the assessment, team
The Large Marine Ecosystems strategy is a global effort for the assessment and management
of international coastal waters. It developed in direct response to a declaration at the 1992
members were selected from a wide variety of institutions such as
Rio Summit. As part of the strategy, the World Conservation Union (IUCN) and National Oceanic
and Atmospheric Administration (NOAA) have joined in an action program to assist developing
universities, research institutes, government agencies, and the private
countries in planning and implementing an ecosystem-based strategy that is focused on LMEs as
sector. In addition, in order to ensure that the assessment produces a
the principal assessment and management units for coastal ocean resources. The LME concept is
also adopted by GEF that recommends the use of LMEs and their contributing freshwater basins
truly regional perspective, the teams should include representatives
as the geographic area for integrating changes in sectoral economic activities.
from each country that shares the region.
iv
REGIONAL ASSESSMENTS
The GIWA is comprised of a logical sequence of four integrated
components. The fi rst stage of the GIWA is called Scaling and is a
Steering Group
process by which the geographic area examined in the assessment is
defi ned and all the transboundary waters within that area are identifi ed.
GIWA Partners
IGOs, NGOs,
Core
Thematic
Once the geographic scale of the assessment has been defi ned, the
Scientific institutions,
Team
Task Teams
private sector, etc
assessment teams conduct a process known as Scoping in which the
66 Regional
magnitude of environmental and associated socio-economic impacts
Focal Points
of Freshwater shortage, Pollution, Habitat and community modifi cation,
and Teams
Unsustainable exploitation of fi sh and other living resources, and Global
Figure 2
The organisation of the GIWA project.
change is assessed in order to identify and prioritise the concerns
that require the most urgent intervention. The assessment of these
predefi ned concerns incorporates the best available information and
In total, more than 1 000 experts have contributed to the implementation
the knowledge and experience of the multidisciplinary, multi-national
of the GIWA illustrating that the GIWA is a participatory exercise that
assessment teams formed in each region. Once the priority concerns
relies on regional expertise. This participatory approach is essential
have been identifi ed, the root causes of these concerns are identifi ed
because it instils a sense of local ownership of the project, which
during the third component of the GIWA, Causal chain analysis. The root
ensures the credibility of the fi ndings and moreover, it has created a
causes are determined through a sequential process that identifi es, in
global network of experts and institutions that can collaborate and
turn, the most signifi cant immediate causes followed by the economic
exchange experiences and expertise to help mitigate the continued
sectors that are primarily responsible for the immediate causes and
degradation of the world's aquatic resources.
fi nally, the societal root causes. At each stage in the Causal chain
analysis, the most signifi cant contributors are identifi ed through an
analysis of the best available information which is augmented by the
expertise of the assessment team. The fi nal component of the GIWA is
GIWA Regional reports
the development of Policy options that focus on mitigating the impacts
of the root causes identifi ed by the Causal chain analysis.
The GIWA was established in response to growing concern among the
general public regarding the quality of the world's aquatic resources
The results of the GIWA assessment in each region are reported in
and the recognition of governments and the international community
regional reports that are published by UNEP. These reports are designed
concerning the absence of a globally coherent international waters
to provide a brief physical and socio-economic description of the
assessment. However, because a holistic, region-by-region, assessment
most important features of the region against which the results of the
of the condition of the world's transboundary water resources had never
assessment can be cast. The remaining sections of the report present
been undertaken, a methodology guiding the implementation of such
the results of each stage of the assessment in an easily digestible form.
an assessment did not exist. Therefore, in order to implement the GIWA,
Each regional report is reviewed by at least two independent external
a new methodology that adopted a multidisciplinary, multi-sectoral,
reviewers in order to ensure the scientifi c validity and applicability of
multi-national approach was developed and is now available for the
each report. The 66 regional assessments of the GIWA will serve UNEP
implementation of future international assessments of aquatic resources.
as an essential complement to the UNEP Water Policy and Strategy and
UNEP's activities in the hydrosphere.
UNEP Water Policy and Strategy
The primary goals of the UNEP water policy and strategy are:
(a) Achieving greater global understanding of freshwater, coastal and marine environments by
Global International Waters Assessment
conducting environmental assessments in priority areas;
(b) Raising awareness of the importance and consequences of unsustainable water use;
(c) Supporting the efforts of Governments in the preparation and implementation of integrated
management of freshwater systems and their related coastal and marine environments;
(d) Providing support for the preparation of integrated management plans and programmes for
aquatic environmental hot spots, based on the assessment results;
(e) Promoting the application by stakeholders of precautionary, preventive and anticipatory
approaches.
GLOBAL INTERNATIONAL WATERS ASSESSMENT
v
References:
AMAP (1998). Assessment Report: Arctic Pollution Issues. Arctic
Monitoring and Assessment Programme (AMAP), Oslo, Norway.
Barannik, V., Borysova, O. and Stolberg, F. (2004). The Caspian Sea Region:
Environmental Change. Ambio, 33:45-51.
Brinson, M.M. and Malvßrez, A.I. (2002). Temperate freshwater wetlands:
types, status, and threats. Environmental Conservation, 29:115-133.
Daoji, L. and Daler, D. (2004). Ocean Pollution from Land-based Sources:
East China Sea, China. Ambio, 33:98-106.
FAO (2001). Reykjavik conference on responsible fi sheries in the marine
ecosystem. Iceland, 1-4 October 2001.
IOC (2002). IOC-IUCN-NOAA Consultative Meeting on Large Marine
Ecosystems (LMEs). Fourth Session, 8-9 January 2002, Paris,
France.
IPCC (2001). Climate Change 2001: The Scientifi c Basis. Contribution
of Working Group I to the Third Assessment Report of the
Intergovernmental Panel on Climate Change. In: Houghton,
J.T., Ding, Y., Griggs, D.J., Noguer, M., van der Linden, P.J., Dai, X.,
Maskell, K. and Johnson, C.A. (eds). Cambridge University Press,
Cambridge, United Kingdom and New York, NY, USA.
Kennish, M.J. (2002). Environmental threats and environmental future of
estuaries. Environmental Conservation, 29:78-107.
Myers, R.A. and Worm, B. (2003). Rapid worldwide depletion of predatory
fi sh communities. Nature, 423:280-283.
Primavera, J.H. (1997) Socio-economic impacts of shrimp culture.
Aquaculture Research, 28:815-827.
Sherman, K. (1994). Sustainability, biomass yields, and health of coastal
ecosystems: an ecological perspective. Marine Ecology Progress
Series, 112:277-301.
United Nations conference on the human environment (1972). Report
available on-line at http://www.unep.org
United Nations Millennium Declaration (2000). The Millennium
Assembly of the United Nations, New York.
WHO-UNICEF (2002). Global Water Supply and Sanitation Assessment:
2000 Report.
WSSD (2002). World Summit on Sustainable Development.
Johannesburg Summit 2002. Key Outcomes of the Summit,
UN Department of Public Information, New York.
vi
REGIONAL ASSESSMENTS
The GIWA methodology
The specifi c objectives of the GIWA were to conduct a holistic and globally
The assessment integrates environmental and socio-economic data
comparable assessment of the world's transboundary aquatic resources
from each country in the region to determine the severity of the
that incorporated both environmental and socio-economic factors
impacts of each of the fi ve concerns and their constituent issues on
and recognised the inextricable links between freshwater and marine
the entire region. The integration of this information was facilitated by
environments, in order to enable the GEF to focus their resources and to
implementing the assessment during two participatory workshops
provide guidance and advice to governments and decision makers. The
that typically involved 10 to 15 environmental and socio-economic
coalition of all these elements into a single coherent methodology that
experts from each country in the region. During these workshops, the
produces an assessment that achieves each of these objectives had not
regional teams performed preliminary analyses based on the collective
previously been done and posed a signifi cant challenge.
knowledge and experience of these local experts. The results of these
analyses were substantiated with the best available information to be
The integration of each of these elements into the GIWA methodology
presented in a regional report.
was achieved through an iterative process guided by a specially
Table 1 Pre-defi ned GIWA concerns and their constituent issues
convened Methods task team that was comprised of a number of
addressed within the assessment.
international assessment and water experts. Before the fi nal version
of the methodology was adopted, preliminary versions underwent
Environmental issues
Major concerns
an extensive external peer review and were subjected to preliminary
1. Modification of stream flow
testing in selected regions. Advice obtained from the Methods task
2. Pollution of existing supplies
I Freshwater shortage
3. Changes in the water table
team and other international experts and the lessons learnt from
preliminary testing were incorporated into the fi nal version that was
4. Microbiological
5. Eutrophication
used to conduct each of the GIWA regional assessments.
6. Chemical
7. Suspended
solids
II Pollution
8. Solid
wastes
Considering the enormous diff erences between regions in terms of the
9. Thermal
10. Radionuclide
quality, quantity and availability of data, socio-economic setting and
11. Spills
environmental conditions, the achievement of global comparability
12. Loss of ecosystems
required an innovative approach. This was facilitated by focusing
III Habitat and community
13. Modification of ecosystems or ecotones, including community
modification
structure and/or species composition
the assessment on the impacts of fi ve pre-defi ned concerns namely;
Freshwater shortage, Pollution, Habitat and community modifi cation,
14. Overexploitation
15. Excessive by-catch and discards
IV Unsustainable
Unsustainable exploitation of fi sh and other living resources and Global
16. Destructive fishing practices
exploitation of fish and
change, in transboundary waters. Considering the diverse range of
17. Decreased viability of stock through pollution and disease
other living resources
18. Impact on biological and genetic diversity
elements encompassed by each concern, assessing the magnitude of
19. Changes in hydrological cycle
the impacts caused by these concerns was facilitated by evaluating the
20. Sea level change
V Global change
impacts of 22 specifi c issues that were grouped within these concerns
21. Increased uv-b radiation as a result of ozone depletion
22. Changes in ocean CO source/sink function
(see Table 1).
2
THE GIWA METHODOLOGY
vii

political boundaries but were instead, generally defi ned by a large but
T
r
ansboundar
The GIWA approach
discrete drainage basin that also included the coastal marine waters into
which the basin discharges. In many cases, the marine areas examined
1
Scaling
st
W
orkshop
Detailed
during the assessment coincided with the Large Marine Ecosystems
y
D
(LMEs) defi ned by the US National Atmospheric and Oceanographic
iagnostic
A
ssessment
Scoping
Administration (NOAA). As a consequence, scaling should be a
relatively straight-forward task that involves the inspection of the
Analy
boundaries that were proposed for the region during the preparatory
Causal Chain
2
sis
nd
Analysis
phase of GIWA to ensure that they are appropriate and that there are
W
orkshop
no important overlaps or gaps with neighbouring regions. When the
Policy Option
proposed boundaries were found to be inadequate, the boundaries of
Analysis
the region were revised according to the recommendations of experts
from both within the region and from adjacent regions so as to ensure
that any changes did not result in the exclusion of areas from the GIWA.
Once the regional boundary was defi ned, regional teams identifi ed all
SAP
the transboundary elements of the aquatic environment within the
SAP
region and determined if these elements could be assessed as a single
Figure 1
Illustration of the relationship between the GIWA
coherent aquatic system or if there were two or more independent
approach and other projects implemented within the
systems that should be assessed separately.
GEF International Waters (IW) portfolio.
The GIWA is a logical contiguous process that defi nes the geographic
Scoping ş Assessing the GIWA concerns
region to be assessed, identifi es and prioritises particularly problems
Scoping is an assessment of the severity of environmental and socio-
based on the magnitude of their impacts on the environment and
economic impacts caused by each of the fi ve pre-defi ned GIWA concerns
human societies in the region, determines the root causes of those
and their constituent issues (Table 1). It is not designed to provide an
problems and, fi nally, assesses various policy options that addresses
exhaustive review of water-related problems that exist within each region,
those root causes in order to reverse negative trends in the condition
but rather it is a mechanism to identify the most urgent problems in the
of the aquatic environment. These four steps, referred to as Scaling,
region and prioritise those for remedial actions. The priorities determined
Scoping, Causal chain analysis and Policy options analysis, are
by Scoping are therefore one of the main outputs of the GIWA project.
summarised below and are described in their entirety in two volumes:
GIWA Methodology Stage 1: Scaling and Scoping; and GIWA Methodology:
Focusing the assessment on pre-defi ned concerns and issues ensured
Detailed Assessment, Causal Chain Analysis and Policy Options Analysis.
the comparability of the results between diff erent regions. In addition, to
Generally, the components of the GIWA methodology are aligned
ensure the long-term applicability of the options that are developed to
with the framework adopted by the GEF for Transboundary Diagnostic
mitigate these problems, Scoping not only assesses the current impacts
Analyses (TDAs) and Strategic Action Programmes (SAPs) (Figure 1) and
of these concerns and issues but also the probable future impacts
assume a broad spectrum of transboundary infl uences in addition to
according to the "most likely scenario" which considered demographic,
those associated with the physical movement of water across national
economic, technological and other relevant changes that will potentially
borders.
infl uence the aquatic environment within the region by 2020.
Scaling ş Defining the geographic extent
The magnitude of the impacts caused by each issue on the
of the region
environment and socio-economic indicators was assessed over the
Scaling is the fi rst stage of the assessment and is the process by which
entire region using the best available information from a wide range of
the geographic scale of the assessment is defi ned. In order to facilitate
sources and the knowledge and experience of the each of the experts
the implementation of the GIWA, the globe was divided during the
comprising the regional team. In order to enhance the comparability
design phase of the project into 66 contiguous regions. Considering the
of the assessment between diff erent regions and remove biases
transboundary nature of many aquatic resources and the transboundary
in the assessment caused by diff erent perceptions of and ways to
focus of the GIWA, the boundaries of the regions did not comply with
communicate the severity of impacts caused by particular issues, the
viii
REGIONAL ASSESSMENTS
results were distilled and reported as standardised scores according to
Table 2
Example of environmental impact assessment of
Freshwater shortage.
the following four point scale:
Weight
0 = no known impact
Environmental
Environmental issues
Score
Weight %
averaged
concerns
1 = slight impact
score
2
=
moderate
impact
1. Modification of stream flow
1
20
Freshwater shortage
1.50
3 = severe impact
2. Pollution of existing supplies
2
50
The attributes of each score for each issue were described by a detailed
3. Changes in the water table
1
30
set of pre-defi ned criteria that were used to guide experts in reporting
Table 3
Example of Health impacts assessment linked to one of
the results of the assessment. For example, the criterion for assigning
the GIWA concerns.
a score of 3 to the issue Loss of ecosystems or ecotones is: "Permanent
Criteria for Health impacts
Raw score
Score
Weight %
destruction of at least one habitat is occurring such as to have reduced their
Very small
Very large
surface area by >30% during the last 2-3 decades". The full list of criteria is
Number of people affected
2
50
0 1 2 3
presented at the end of the chapter, Table 5a-e. Although the scoring
Minimum
Severe
Degree of severity
2
30
0 1 2 3
inevitably includes an arbitrary component, the use of predefi ned
Occasion/Short
Continuous
Frequency/Duration
2
20
0 1 2 3
criteria facilitates comparison of impacts on a global scale and also
Weight average score for Health impacts
2
encouraged consensus of opinion among experts.
The trade-off associated with assessing the impacts of each concern
After all 22 issues and associated socio-economic impacts have
and their constituent issues at the scale of the entire region is that spatial
been scored, weighted and averaged, the magnitude of likely future
resolution was sometimes low. Although the assessment provides a
changes in the environmental and socio-economic impacts of each
score indicating the severity of impacts of a particular issue or concern
of the fi ve concerns on the entire region is assessed according to the
on the entire region, it does not mean that the entire region suff ers
most likely scenario which describes the demographic, economic,
the impacts of that problem. For example, eutrophication could be
technological and other relevant changes that might infl uence the
identifi ed as a severe problem in a region, but this does not imply that all
aquatic environment within the region by 2020.
waters in the region suff er from severe eutrophication. It simply means
that when the degree of eutrophication, the size of the area aff ected,
In order to prioritise among GIWA concerns within the region and
the socio-economic impacts and the number of people aff ected is
identify those that will be subjected to causal chain and policy options
considered, the magnitude of the overall impacts meets the criteria
analysis in the subsequent stages of the GIWA, the present and future
defi ning a severe problem and that a regional action should be initiated
scores of the environmental and socio-economic impacts of each
in order to mitigate the impacts of the problem.
concern are tabulated and an overall score calculated. In the example
presented in Table 4, the scoping assessment indicated that concern III,
When each issue has been scored, it was weighted according to the relative
Habitat and community modifi cation, was the priority concern in this
contribution it made to the overall environmental impacts of the concern
region. The outcome of this mathematic process was reconciled against
and a weighted average score for each of the fi ve concerns was calculated
the knowledge of experts and the best available information in order
(Table 2). Of course, if each issue was deemed to make equal contributions,
to ensure the validity of the conclusion.
then the score describing the overall impacts of the concern was simply the
arithmetic mean of the scores allocated to each issue within the concern.
In some cases however, this process and the subsequent participatory
In addition, the socio-economic impacts of each of the fi ve major
discussion did not yield consensus among the regional experts
concerns were assessed for the entire region. The socio-economic
regarding the ranking of priorities. As a consequence, further analysis
impacts were grouped into three categories; Economic impacts,
was required. In such cases, expert teams continued by assessing the
Health impacts and Other social and community impacts (Table 3). For
relative importance of present and potential future impacts and assign
each category, an evaluation of the size, degree and frequency of the
weights to each. Afterwards, the teams assign weights indicating the
impact was performed and, once completed, a weighted average score
relative contribution made by environmental and socio-economic
describing the overall socio-economic impacts of each concern was
factors to the overall impacts of the concern. The weighted average
calculated in the same manner as the overall environmental score.
score for each concern is then recalculated taking into account
THE GIWA METHODOLOGY
ix
Table 4
Example of comparative environmental and socio-economic impacts of each major concern, presently and likely in year 2020.
Types of impacts
Environmental score
Economic score
Human health score
Social and community score
Concern
Overall score
Present (a)
Future (b)
Present (c)
Future (d)
Present (e)
Future (f)
Present (g)
Future (h)
Freshwater shortage
1.3
2.3
2.7
2.8
2.6
3.0
1.8
2.2
2.3
Pollution
1.5
2.0
2.0
2.3
1.8
2.3
2.0
2.3
2.0
Habitat and community
2.0
3.0
2.4
3.0
2.4
2.8
2.3
2.7
2.6
modification
Unsustainable exploitation of fish
1.8
2.2
2.0
2.1
2.0
2.1
2.4
2.5
2.1
and other living resources
Global change
0.8
1.0
1.5
1.7
1.5
1.5
1.0
1.0
1.2
the relative contributions of both present and future impacts and
should be regarded as a framework to guide the analysis, rather than
environmental and socio-economic factors. The outcome of these
as a set of detailed instructions. Secondly, in an ideal setting, a causal
additional analyses was subjected to further discussion to identify
chain would be produced by a multidisciplinary group of specialists
overall priorities for the region.
that would statistically examine each successive cause and study its
links to the problem and to other causes. However, this approach (even
Finally, the assessment recognises that each of the fi ve GIWA concerns
if feasible) would use far more resources and time than those available
are not discrete but often interact. For example, pollution can destroy
to GIWA1. For this reason, it has been necessary to develop a relatively
aquatic habitats that are essential for fi sh reproduction which, in turn,
simple and practical analytical model for gathering information to
can cause declines in fi sh stocks and subsequent overexploitation. Once
assemble meaningful causal chains.
teams have ranked each of the concerns and determined the priorities
for the region, the links between the concerns are highlighted in order
Conceptual model
to identify places where strategic interventions could be applied to
A causal chain is a series of statements that link the causes of a problem
yield the greatest benefi ts for the environment and human societies
with its eff ects. Recognising the great diversity of local settings and the
in the region.
resulting diffi
culty in developing broadly applicable policy strategies,
the GIWA CCA focuses on a particular system and then only on those
Causal chain analysis
issues that were prioritised during the scoping assessment. The
Causal Chain Analysis (CCA) traces the cause-eff ect pathways from the
starting point of a particular causal chain is one of the issues selected
socio-economic and environmental impacts back to their root causes.
during the Scaling and Scoping stages and its related environmental
The GIWA CCA aims to identify the most important causes of each
and socio-economic impacts. The next element in the GIWA chain is
concern prioritised during the scoping assessment in order to direct
the immediate cause; defi ned as the physical, biological or chemical
policy measures at the most appropriate target in order to prevent
variable that produces the GIWA issue. For example, for the issue of
further degradation of the regional aquatic environment.
eutrophication the immediate causes may be, inter alia:
Enhanced nutrient inputs;
Root causes are not always easy to identify because they are often
Increased
recycling/mobilisation;
spatially or temporally separated from the actual problems they
Trapping of nutrients (e.g. in river impoundments);
cause. The GIWA CCA was developed to help identify and understand
Run-off and stormwaters
the root causes of environmental and socio-economic problems
in international waters and is conducted by identifying the human
Once the relevant immediate cause(s) for the particular system has
activities that cause the problem and then the factors that determine
(have) been identifi ed, the sectors of human activity that contribute
the ways in which these activities are undertaken. However, because
most signifi cantly to the immediate cause have to be determined.
there is no universal theory describing how root causes interact to
Assuming that the most important immediate cause in our example
create natural resource management problems and due to the great
had been increased nutrient concentrations, then it is logical that the
variation of local circumstances under which the methodology will
most likely sources of those nutrients would be the agricultural, urban
be applied, the GIWA CCA is not a rigidly structured assessment but
or industrial sectors. After identifying the sectors that are primarily
1 This does not mean that the methodology ignores statistical or quantitative studies; as has already been pointed out, the available evidence that justifies the assumption of causal links should
be provided in the assessment.
x
REGIONAL ASSESSMENTS
responsible for the immediate causes, the root causes acting on those
The policy options recommended by the GIWA are only contributions
sectors must be determined. For example, if agriculture was found to
to the larger policy process and, as such, the GIWA methodology
be primarily responsible for the increased nutrient concentrations, the
developed to test the performance of various options under the
root causes could potentially be:
diff erent circumstances has been kept simple and broadly applicable.
Economic (e.g. subsidies to fertilisers and agricultural products);
Legal (e.g. inadequate regulation);
Global International Waters Assessment
Failures in governance (e.g. poor enforcement); or
Technology or knowledge related (e.g. lack of aff ordable substitutes
for fertilisers or lack of knowledge as to their application).
Once the most relevant root causes have been identifi ed, an
explanation, which includes available data and information, of how
they are responsible for the primary environmental and socio-economic
problems in the region should be provided.
Policy option analysis
Despite considerable eff ort of many Governments and other
organisations to address transboundary water problems, the evidence
indicates that there is still much to be done in this endeavour. An
important characteristic of GIWA's Policy Option Analysis (POA) is that
its recommendations are fi rmly based on a better understanding of
the root causes of the problems. Freshwater scarcity, water pollution,
overexploitation of living resources and habitat destruction are very
complex phenomena. Policy options that are grounded on a better
understanding of these phenomena will contribute to create more
eff ective societal responses to the extremely complex water related
transboundary problems. The core of POA in the assessment consists
of two tasks:
Construct policy options
Policy options are simply diff erent courses of action, which are not
always mutually exclusive, to solve or mitigate environmental and
socio-economic problems in the region. Although a multitude of
diff erent policy options could be constructed to address each root
cause identifi ed in the CCA, only those few policy options that have
the greatest likelihood of success were analysed in the GIWA.
Select and apply the criteria on which the policy options will be
evaluated
Although there are many criteria that could be used to evaluate any
policy option, GIWA focuses on:
Eff ectiveness (certainty of result)
Effi
ciency (maximisation of net benefi ts)
Equity (fairness of distributional impacts)
Practical
criteria
(political
acceptability,
implementation
feasibility).
THE GIWA METHODOLOGY
xi
Table 5a: Scoring criteria for environmental impacts of Freshwater shortage
Issue
Score 0 = no known impact
Score 1 = slight impact
Score 2 = moderate impact
Score 3 = severe impact
Issue 1: Modification
No evidence of modification of stream
There is a measurably changing trend in
Significant downward or upward trend
Annual discharge of a river altered by more
of stream flow
flow.
annual river discharge at gauging stations
(more than 20% of the long term mean) in
than 50% of long term mean; or
"An increase or decrease
in a major river or tributary (basin >
annual discharges in a major river or tributary Loss of >50% of riparian or deltaic
in the discharge of
40 000 km2); or
draining a basin of >250 000 km2; or
wetlands over a period of not less than
streams and rivers
There is a measurable decrease in the area
Loss of >20% of flood plain or deltaic
40 years (through causes other than
as a result of human
of wetlands (other than as a consequence
wetlands through causes other than
conversion or artificial embankment); or
interventions on a local/
of conversion or embankment
conversion or artificial embankments; or
Significant increased siltation or erosion
regional scale (see Issue
construction); or
Significant loss of riparian vegetation (e.g.
due to changing in flow regime (other than
19 for flow alterations
There is a measurable change in the
trees, flood plain vegetation); or
normal fluctuations in flood plain rivers);
resulting from global
interannual mean salinity of estuaries or
Significant saline intrusion into previously
or
change) over the last 3-4
coastal lagoons and/or change in the mean
freshwater rivers or lagoons.
Loss of one or more anadromous or
decades."
position of estuarine salt wedge or mixing
catadromous fish species for reasons
zone; or
other than physical barriers to migration,
Change in the occurrence of exceptional
pollution or overfishing.
discharges (e.g. due to upstream
damming.
Issue 2: Pollution of
No evidence of pollution of surface and
Any monitored water in the region does
Water supplies does not meet WHO or
River draining more than 10% of the basin
existing supplies
ground waters.
not meet WHO or national drinking water
national drinking water standards in more
have suffered polysaprobic conditions, no
"Pollution of surface
criteria, other than for natural reasons; or
than 30% of the region; or
longer support fish, or have suffered severe
and ground fresh waters
There have been reports of one or more
There are one or more reports of fish kills
oxygen depletion
supplies as a result of
fish kills in the system due to pollution
due to pollution in any river draining a
Severe pollution of other sources of
point or diffuse sources"
within the past five years.
basin of >250 000 km2 .
freshwater (e.g. groundwater)
Issue 3: Changes in
No evidence that abstraction of water from Several wells have been deepened because Clear evidence of declining base flow in
Aquifers are suffering salinisation over
the water table
aquifers exceeds natural replenishment.
of excessive aquifer draw-down; or
rivers in semi-arid areas; or
regional scale; or
"Changes in aquifers
Several springs have dried up; or
Loss of plant species in the past decade,
Perennial springs have dried up over
as a direct or indirect
Several wells show some salinisation.
that depend on the presence of ground
regionally significant areas; or
consequence of human
water; or
Some aquifers have become exhausted
activity"
Wells have been deepened over areas of
hundreds of km2;or
Salinisation over significant areas of the
region.
Table 5b: Scoring criteria for environmental impacts of Pollution
Issue
Score 0 = no known impact
Score 1 = slight impact
Score 2 = moderate impact
Score 3 = severe impact
Issue 4:
Normal incidence of bacterial related
There is minor increase in incidence of
Public health authorities aware of marked
There are large closure areas or very
Microbiological
gastroenteric disorders in fisheries product
bacterial related gastroenteric disorders
increase in the incidence of bacterial
restrictive advisories affecting the
pollution
consumers and no fisheries closures or
in fisheries product consumers but no
related gastroenteric disorders in fisheries
marketability of fisheries products; or
"The adverse effects of
advisories.
fisheries closures or advisories.
product consumers; or
There exists widespread public or tourist
microbial constituents of
There are limited area closures or
awareness of hazards resulting in
human sewage released
advisories reducing the exploitation or
major reductions in the exploitation or
to water bodies."
marketability of fisheries products.
marketability of fisheries products.
Issue 5:
No visible effects on the abundance and
Increased abundance of epiphytic algae; or
Increased filamentous algal production
High frequency (>1 event per year), or
Eutrophication
distributions of natural living resource
A statistically significant trend in
resulting in algal mats; or
intensity, or large areas of periodic hypoxic
"Artificially enhanced
distributions in the area; and
decreased water transparency associated
Medium frequency (up to once per year)
conditions, or high frequencies of fish and
primary productivity in
No increased frequency of hypoxia1 or
with algal production as compared with
of large-scale hypoxia and/or fish and
zoobenthos mortality events or harmful
receiving water basins
fish mortality events or harmful algal
long-term (>20 year) data sets; or
zoobenthos mortality events and/or
algal blooms; or
related to the increased
blooms associated with enhanced primary
Measurable shallowing of the depth range
harmful algal blooms.
Significant changes in the littoral
availability or supply
production; and
of macrophytes.
community; or
of nutrients, including
No evidence of periodically reduced
Presence of hydrogen sulphide in
cultural eutrophication
dissolved oxygen or fish and zoobenthos
historically well oxygenated areas.
in lakes."
mortality; and
No evident abnormality in the frequency of
algal blooms.
xii
REGIONAL ASSESSMENTS
Issue 6: Chemical
No known or historical levels of chemical
Some chemical contaminants are
Some chemical contaminants are above
Chemical contaminants are above
pollution
contaminants except background levels of
detectable but below threshold limits
threshold limits defined for the country or
threshold limits defined for the country or
"The adverse effects of
naturally occurring substances; and
defined for the country or region; or
region; or
region; and
chemical contaminants
No fisheries closures or advisories due to
Restricted area advisories regarding
Large area advisories by public health
Public health and public awareness of
released to standing or
chemical pollution; and
chemical contamination of fisheries
authorities concerning fisheries product
fisheries contamination problems with
marine water bodies
No incidence of fisheries product tainting;
products.
contamination but without associated
associated reductions in the marketability
as a result of human
and
catch restrictions or closures; or
of such products either through the
activities. Chemical
No unusual fish mortality events.
If there is no available data use the following
High mortalities of aquatic species near
imposition of limited advisories or by area
contaminants are
criteria:
outfalls.
closures of fisheries; or
here defined as
If there is no available data use the following
Some use of pesticides in small areas; or
Large-scale mortalities of aquatic species.
compounds that are
criteria:
Presence of small sources of dioxins or
If there is no available data use the following
toxic or persistent or
No use of pesticides; and
furans (e.g., small incineration plants or
criteria:
If there is no available data use the following
bioaccumulating."
No sources of dioxins and furans; and
bleached kraft/pulp mills using chlorine);
Large-scale use of pesticides in agriculture
criteria:
No regional use of PCBs; and
or
and forestry; or
Indications of health effects resulting
No bleached kraft pulp mills using chlorine Some previous and existing use of PCBs
Presence of major sources of dioxins or
from use of pesticides; or
bleaching; and
and limited amounts of PCB-containing
furans such as large municipal or industrial Known emissions of dioxins or furans from
No use or sources of other contaminants.
wastes but not in amounts invoking local
incinerators or large bleached kraft pulp
incinerators or chlorine bleaching of pulp;
concerns; or
mills; or
or
Presence of other contaminants.
Considerable quantities of waste PCBs in
Known contamination of the environment
the area with inadequate regulation or has
or foodstuffs by PCBs; or
invoked some public concerns; or
Known contamination of the environment
Presence of considerable quantities of
or foodstuffs by other contaminants.
other contaminants.
Issue 7: Suspended
No visible reduction in water transparency; Evidently increased or reduced turbidity
Markedly increased or reduced turbidity
Major changes in turbidity over wide or
solids
and
in streams and/or receiving riverine and
in small areas of streams and/or receiving
ecologically significant areas resulting
"The adverse effects of
No evidence of turbidity plumes or
marine environments but without major
riverine and marine environments; or
in markedly changed biodiversity or
modified rates of release
increased siltation; and
changes in associated sedimentation or
Extensive evidence of changes in
mortality in benthic species due to
of suspended particulate No evidence of progressive riverbank,
erosion rates, mortality or diversity of flora
sedimentation or erosion rates; or
excessive sedimentation with or without
matter to water bodies
beach, other coastal or deltaic erosion.
and fauna; or
Changes in benthic or pelagic biodiversity
concomitant changes in the nature of
resulting from human
Some evidence of changes in benthic or
in areas due to sediment blanketing or
deposited sediments (i.e., grain-size
activities"
pelagic biodiversity in some areas due
increased turbidity.
composition/redox); or
to sediment blanketing or increased
Major change in pelagic biodiversity or
turbidity.
mortality due to excessive turbidity.
Issue 8: Solid wastes
No noticeable interference with trawling
Some evidence of marine-derived litter on
Widespread litter on beaches giving rise to
Incidence of litter on beaches sufficient
"Adverse effects
activities; and
beaches; or
public concerns regarding the recreational
to deter the public from recreational
associated with the
No noticeable interference with the
Occasional recovery of solid wastes
use of beaches; or
activities; or
introduction of solid
recreational use of beaches due to litter;
through trawling activities; but
High frequencies of benthic litter recovery
Trawling activities untenable because of
waste materials into
and
Without noticeable interference with
and interference with trawling activities;
benthic litter and gear entanglement; or
water bodies or their
No reported entanglement of aquatic
trawling and recreational activities in
or
Widespread entanglement and/or
environs."
organisms with debris.
coastal areas.
Frequent reports of entanglement/
suffocation of aquatic species by litter.
suffocation of species by litter.
Issue 9: Thermal
No thermal discharges or evidence of
Presence of thermal discharges but
Presence of thermal discharges with large
Presence of thermal discharges with large
"The adverse effects
thermal effluent effects.
without noticeable effects beyond
mixing zones having reduced productivity
mixing zones with associated mortalities,
of the release of
the mixing zone and no significant
or altered biodiversity; or
substantially reduced productivity or
aqueous effluents at
interference with migration of species.
Evidence of reduced migration of species
noticeable changes in biodiversity; or
temperatures exceeding
due to thermal plume.
Marked reduction in the migration of
ambient temperature
species due to thermal plumes.
in the receiving water
body."
Issue 10: Radionuclide No radionuclide discharges or nuclear
Minor releases or fallout of radionuclides
Minor releases or fallout of radionuclides
Substantial releases or fallout of
"The adverse effects of
activities in the region.
but with well regulated or well-managed
under poorly regulated conditions that do
radionuclides resulting in excessive
the release of radioactive
conditions complying with the Basic Safety
not provide an adequate basis for public
exposures to humans or animals in relation
contaminants and
Standards.
health assurance or the protection of
to those recommended under the Basic
wastes into the aquatic
aquatic organisms but without situations
Safety Standards; or
environment from
or levels likely to warrant large scale
Some indication of situations or exposures
human activities."
intervention by a national or international
warranting intervention by a national or
authority.
international authority.
Issue 11: Spills
No evidence of present or previous spills of
Some evidence of minor spills of hazardous Evidence of widespread contamination
Widespread contamination by hazardous
"The adverse effects
hazardous material; or
materials in small areas with insignificant
by hazardous or aesthetically displeasing
or aesthetically displeasing materials
of accidental episodic
No evidence of increased aquatic or avian
small-scale adverse effects one aquatic or
materials assumed to be from spillage
from frequent spills resulting in major
releases of contaminants
species mortality due to spills.
avian species.
(e.g. oil slicks) but with limited evidence of
interference with aquatic resource
and materials to the
widespread adverse effects on resources or
exploitation or coastal recreational
aquatic environment
amenities; or
amenities; or
as a result of human
Some evidence of aquatic or avian species
Significant mortality of aquatic or avian
activities."
mortality through increased presence of
species as evidenced by large numbers of
contaminated or poisoned carcasses on
contaminated carcasses on beaches.
beaches.
THE GIWA METHODOLOGY
xiii
Table 5c: Scoring criteria for environmental impacts of Habitat and community modification
Issue
Score 0 = no known impact
Score 1 = slight impact
Score 2 = moderate impact
Score 3 = severe impact
Issue 12: Loss of ecosystems or
There is no evidence of loss of
There are indications of fragmentation Permanent destruction of at least one
Permanent destruction of at least one
ecotones
ecosystems or habitats.
of at least one of the habitats.
habitat is occurring such as to have
habitat is occurring such as to have
"The complete destruction of aquatic
reduced their surface area by up to 30
reduced their surface area by >30%
habitats. For the purpose of GIWA
% during the last 2-3 decades.
during the last 2-3 decades.
methodology, recent loss will be
measured as a loss of pre-defined
habitats over the last 2-3 decades."
Issue 13: Modification of
No evidence of change in species
Evidence of change in species
Evidence of change in species
Evidence of change in species
ecosystems or ecotones, including
complement due to species extinction
complement due to species extinction
complement due to species extinction
complement due to species extinction
community structure and/or species
or introduction; and
or introduction
or introduction; and
or introduction; and
composition
No changing in ecosystem function
Evidence of change in population
Evidence of change in population
"Modification of pre-defined habitats
and services.
structure or change in functional group
structure or change in functional group
in terms of extinction of native species,
composition or structure
composition or structure; and
occurrence of introduced species and
Evidence of change in ecosystem
changing in ecosystem function and
services2.
services over the last 2-3 decades."
2 Constanza, R. et al. (1997). The value of the world ecosystem services and natural capital, Nature 387:253-260.
Table 5d: Scoring criteria for environmental impacts of Unsustainable exploitation of fish and other
living resources
Issue
Score 0 = no known impact
Score 1 = slight impact
Score 2 = moderate impact
Score 3 = severe impact
Issue 14: Overexploitation
No harvesting exists catching fish
Commercial harvesting exists but there One stock is exploited beyond MSY
More than one stock is exploited
"The capture of fish, shellfish or marine
(with commercial gear for sale or
is no evidence of over-exploitation.
(maximum sustainable yield) or is
beyond MSY or is outside safe
invertebrates at a level that exceeds the
subsistence).
outside safe biological limits.
biological limits.
maximum sustainable yield of the stock."
Issue 15: Excessive by-catch and
Current harvesting practices show no
Up to 30% of the fisheries yield (by
30-60% of the fisheries yield consists
Over 60% of the fisheries yield is
discards
evidence of excessive by-catch and/or
weight) consists of by-catch and/or
of by-catch and/or discards.
by-catch and/or discards; or
"By-catch refers to the incidental capture
discards.
discards.
Noticeable incidence of capture of
of fish or other animals that are not the
endangered species.
target of the fisheries. Discards refers
to dead fish or other animals that are
returned to the sea."
Issue 16: Destructive fishing
No evidence of habitat destruction due Habitat destruction resulting in
Habitat destruction resulting in
Habitat destruction resulting in
practices
to fisheries practices.
changes in distribution of fish or
moderate reduction of stocks or
complete collapse of a stock or far
"Fishing practices that are deemed to
shellfish stocks; or
moderate changes of the environment;
reaching changes in the environment;
produce significant harm to marine,
Trawling of any one area of the seabed
or
or
lacustrine or coastal habitats and
is occurring less than once per year.
Trawling of any one area of the seabed
Trawling of any one area of the seabed
communities."
is occurring 1-10 times per year; or
is occurring more than 10 times per
Incidental use of explosives or poisons
year; or
for fishing.
Widespread use of explosives or
poisons for fishing.
Issue 17: Decreased viability of
No evidence of increased incidence of
Increased reports of diseases without
Declining populations of one or more
Collapse of stocks as a result of
stocks through contamination and
fish or shellfish diseases.
major impacts on the stock.
species as a result of diseases or
diseases or contamination.
disease
contamination.
"Contamination or diseases of feral (wild)
stocks of fish or invertebrates that are a
direct or indirect consequence of human
action."
Issue 18: Impact on biological and
No evidence of deliberate or accidental Alien species introduced intentionally
Measurable decline in the population
Extinction of native species or local
genetic diversity
introductions of alien species; and
or accidentally without major changes
of native species or local stocks as a
stocks as a result of introductions
"Changes in genetic and species diversity No evidence of deliberate or accidental
in the community structure; or
result of introductions (intentional or
(intentional or accidental); or
of aquatic environments resulting from
introductions of alien stocks; and
Alien stocks introduced intentionally
accidental); or
Major changes (>20%) in the genetic
the introduction of alien or genetically
No evidence of deliberate or accidental
or accidentally without major changes
Some changes in the genetic
composition of stocks (e.g. as a result
modified species as an intentional or
introductions of genetically modified
in the community structure; or
composition of stocks (e.g. as a result
of escapes from aquaculture replacing
unintentional result of human activities
species.
Genetically modified species
of escapes from aquaculture replacing
the wild stock).
including aquaculture and restocking."
introduced intentionally or
the wild stock).
accidentally without major changes in
the community structure.
xiv
REGIONAL ASSESSMENTS
Table 5e: Scoring criteria for environmental impacts of Global change
Issue
Score 0 = no known impact
Score 1 = slight impact
Score 2 = moderate impact
Score 3 = severe impact
Issue 19: Changes in hydrological
No evidence of changes in hydrological Change in hydrological cycles due
Significant trend in changing
Loss of an entire habitat through
cycle and ocean circulation
cycle and ocean/coastal current due to
to global change causing changes
terrestrial or sea ice cover (by
desiccation or submergence as a result
"Changes in the local/regional water
global change.
in the distribution and density of
comparison with a long-term time
of global change; or
balance and changes in ocean and coastal
riparian terrestrial or aquatic plants
series) without major downstream
Change in the tree or lichen lines; or
circulation or current regime over the
without influencing overall levels of
effects on river/ocean circulation or
Major impacts on habitats or
last 2-3 decades arising from the wider
productivity; or
biological diversity; or
biodiversity as the result of increasing
problem of global change including
Some evidence of changes in ocean
Extreme events such as flood and
frequency of extreme events; or
ENSO."
or coastal currents due to global
drought are increasing; or
Changing in ocean or coastal currents
change but without a strong effect on
Aquatic productivity has been altered
or upwelling regimes such that plant
ecosystem diversity or productivity.
as a result of global phenomena such
or animal populations are unable to
as ENSO events.
recover to their historical or stable
levels; or
Significant changes in thermohaline
circulation.
Issue 20: Sea level change
No evidence of sea level change.
Some evidences of sea level change
Changed pattern of coastal erosion due Major loss of coastal land areas due to
"Changes in the last 2-3 decades in the
without major loss of populations of
to sea level rise has became evident; or
sea-level change or sea-level induced
annual/seasonal mean sea level as a
organisms.
Increase in coastal flooding events
erosion; or
result of global change."
partly attributed to sea-level rise
Major loss of coastal or intertidal
or changing prevailing atmospheric
populations due to sea-level change or
forcing such as atmospheric pressure
sea level induced erosion.
or wind field (other than storm
surges).
Issue 21: Increased UV-B radiation as No evidence of increasing effects
Some measurable effects of UV/B
Aquatic community structure is
Measured/assessed effects of UV/B
a result of ozone depletion
of UV/B radiation on marine or
radiation on behavior or appearance of
measurably altered as a consequence
irradiation are leading to massive loss
"Increased UV-B flux as a result polar
freshwater organisms.
some aquatic species without affecting
of UV/B radiation; or
of aquatic communities or a significant
ozone depletion over the last 2-3
the viability of the population.
One or more aquatic populations are
change in biological diversity.
decades."
declining.
Issue 22: Changes in ocean CO
No measurable or assessed changes
Some reasonable suspicions that
Some evidences that the impacts
Evidences that the changes in
2
source/sink function
in CO source/sink function of aquatic
current global change is impacting the
of global change have altered the
source/sink function of the aquatic
2
"Changes in the capacity of aquatic
system.
aquatic system sufficiently to alter its
source/sink function for CO of aquatic
systems in the region are sufficient to
2
systems, ocean as well as freshwater, to
source/sink function for CO .
systems in the region by at least 10%.
cause measurable change in global CO
2
2
generate or absorb atmospheric CO as a
balance.
2
direct or indirect consequence of global
change over the last 2-3 decades."
THE GIWA METHODOLOGY
xv