


(1,1) -1- Cover 43_only.indd 2004-04-06, 09:19:17
Global International
Waters Assessment
Lake Chad Basin
GIWA Regional assessment 43
Global International
Waters Assessment
Regional assessments

Global International
Waters Assessment
Regional assessment 43
Lake Chad Basin
GIWA report production
Series editor: Ulla Li Zweifel
Report editors: Matthew Fortnam, Johnson Oguntola
Editorial assistance: Johanna Egerup
Maps & GIS: Niklas Holmgren
Design & graphics: Joakim Palmqvist
Global International Waters Assessment
Lake Chad Basin, GIWA Regional assessment 43
Published by the University of Kalmar on behalf of
United Nations Environment Programme
© 2004 United Nations Environment Programme
ISSN 1651-9401
University of Kalmar
SE-391 82 Kalmar
Sweden
United Nations Environment Programme
PO Box 30552,
Nairobi, Kenya
This publication may be reproduced in whole or in part and
in any form for educational or non-profit purposes without
special permission from the copyright holder, provided
acknowledgement of the source is made. No use of this
publication may be made for resale or for any other commercial
purpose whatsoever without prior permission in writing from the
United Nations Environment Programme.
CITATIONS
When citing this report, please use:
UNEP, 2004. Fortnam, M.P. and Oguntola, J.A. (eds), Lake Chad
Basin, GIWA Regional assessment 43, University of Kalmar, Kalmar,
Sweden.
DISCLAIMER
The views expressed in this publication are those of the authors
and do not necessarily reflect those of UNEP. The designations
employed and the presentations do not imply the expressions
of any opinion whatsoever on the part of UNEP or cooperating
agencies concerning the legal status of any country, territory,
city or areas or its authority, or concerning the delimitation of its
frontiers or boundaries.
This publication has been peer-reviewed and the information
herein is believed to be reliable, but the publisher does not
warrant its completeness or accuracy.
Printed and bound in Sweden by Sunds Tryck Öland AB.
CONTENTS
vII
Contents
The Global International Waters Assessment
ix
The GIWA methodology
xv
Preface
1
Acknowledgements
2
Executive summary
4
Abbreviations and acronyms
9
Regional definition
13
Boundaries of the Lake Chad region
13
Physical characteristics
14
Socio-economic characteristics
28
Assessment
42
Freshwater shortage
42
Habitat and community modification
56
Unsustainable exploitation of fish and other living resources
66
Pollution
70
Priority concerns
74
Causal chain analysis
79
Chari-Logone and Lake Chad sub-system
80
Komadugu-Yobe sub-system
88
Conclusions
95
Policy options
96
Problem definition
96
Lake Chad Basin
98
Chari-Logone/Lake Chad sub-system
100
Komadugu-Yobe sub-system
102
Identification of the recommended options
106
Conclusions and recommendations
116
References
119
Annexes
126
Annex I GIWA workshop participants.
126
Annex II Detailed scoring tables.
127
CONTENTS
vII
The Global International
Waters Assessment
This report presents the results of the Global International Waters
Adequately managing the world's aquatic resources for the benefit of
Assessment (GIWA) of the transboundary waters of the Lake Chad
al is, for a variety of reasons, a very complex task. The liquid state of
Basin. This and the subsequent chapter offer a background that
the most of the world's water means that, without the construction
describes the impetus behind the establishment of GIWA, its
of reservoirs, dams and canals it is free to flow wherever the laws of
objectives and how the GIWA was implemented.
nature dictate. Water is, therefore, a vector transporting not only a
wide variety of valuable resources but also problems from one area
to another. The effluents emanating from environmental y destructive
activities in upstream drainage areas are propagated downstream
The need for a global
and can affect other areas considerable distances away. In the case of
international waters
transboundary river basins, such as the Nile, Amazon and Niger, the
assessment
impacts are transported across national borders and can be observed
in the numerous countries situated within their catchments. In the case
of large oceanic currents, the impacts can even be propagated between
Global y, people are becoming increasingly aware of the degradation of
continents (AMAP 1998). Therefore, the inextricable linkages within
the world's water bodies. Disasters from floods and droughts, frequently
and between both freshwater and marine environments dictates that
reported in the media, are considered to be linked with ongoing global
management of aquatic resources ought to be implemented through
climate change (IPCC 2001), accidents involving large ships pol ute public
a drainage basin approach.
beaches and threaten marine life and almost every commercial fish stock
is exploited beyond sustainable limits - it is estimated that the global
In addition, there is growing appreciation of the incongruence
stocks of large predatory fish have declined to less that 10% of pre-
between the transboundary nature of many aquatic resources and the
industrial fishing levels (Myers & Worm 2003). Further, more than 1 bil ion
traditional introspective national y focused approaches to managing
people worldwide lack access to safe drinking water and 2 bil ion people
those resources. Water, unlike laws and management plans, does not
lack proper sanitation which causes approximately 4 billion cases of
respect national borders and, as a consequence, if future management
diarrhoea each year and results in the death of 2.2 mil ion people, mostly
of water and aquatic resources is to be successful, then a shift in focus
children younger than five (WHO-UNICEF 2002). Moreover, freshwater
towards international cooperation and intergovernmental agreements
and marine habitats are destroyed by infrastructure developments,
is required (UN 1972). Furthermore, the complexity of managing the
dams, roads, ports and human settlements (Brinson & Malvárez 2002,
world's water resources is exacerbated by the dependence of a great
Kennish 2002). As a consequence, there is growing public concern
variety of domestic and industrial activities on those resources. As a
regarding the declining quality and quantity of the world's aquatic
consequence, cross-sectoral multidisciplinary approaches that integrate
resources because of human activities, which has resulted in mounting
environmental, socio-economic and development aspects into
pressure on governments and decision makers to institute new and
management must be adopted. Unfortunately however, the scientific
innovative policies to manage those resources in a sustainable way
information or capacity within each discipline is often not available or
ensuring their availability for future generations.
is inadequately translated for use by managers, decision makers and
GLOBAL INTERNATIONAL WATERS ASSESSMENT
iX
policy developers. These inadequacies constitute a serious impediment
The Global Environment Facility (GEF)
to the implementation of urgently needed innovative policies.
The Global Environment Facility forges international co-operation and finances actions to address
six critical threats to the global environment: biodiversity loss, climate change, degradation of
international waters, ozone depletion, land degradation, and persistent organic pol utants (POPs).
Continual assessment of the prevailing and future threats to aquatic
The overal strategic thrust of GEF-funded international waters activities is to meet the incremental
ecosystems and their implications for human populations is essential if
costs of: (a) assisting groups of countries to better understand the environmental concerns of
their international waters and work col aboratively to address them; (b) building the capacity
governments and decision makers are going to be able to make strategic
of existing institutions to utilise a more comprehensive approach for addressing transboundary
policy and management decisions that promote the sustainable use of
water-related environmental concerns; and (c) implementing measures that address the priority
transboundary environmental concerns. The goal is to assist countries to utilise the full range of
those resources and respond to the growing concerns of the general
technical, economic, financial, regulatory, and institutional measures needed to operationalise
public. Although many assessments of aquatic resources are being
sustainable development strategies for international waters.
conducted by local, national, regional and international bodies, past
United Nations Environment Programme (UNEP)
assessments have often concentrated on specific themes, such as
United Nations Environment Programme, established in 1972, is the voice for the environment
biodiversity or persistent toxic substances, or have focused only on
within the United Nations system. The mission of UNEP is to provide leadership and encourage
partnership in caring for the environment by inspiring, informing, and enabling nations and
marine or freshwaters. A globally coherent, drainage basin based
peoples to improve their quality of life without compromising that of future generations.
assessment that embraces the inextricable links between transboundary
UNEP work encompasses:
freshwater and marine systems, and between environmental and
Assessing global, regional and national environmental conditions and trends;
Developing international and national environmental instruments;
societal issues, has never been conducted previously.
Strengthening institutions for the wise management of the environment;
Facilitating the transfer of knowledge and technology for sustainable development;
Encouraging new partnerships and mind-sets within civil society and the private sector.
International call for action
University of Kalmar
University of Kalmar hosts the GIWA Co-ordination Office and provides scientific advice and
administrative and technical assistance to GIWA. University of Kalmar is situated on the coast of
The need for a holistic assessment of transboundary waters in order to
the Baltic Sea. The city has a long tradition of higher education; teachers and marine officers have
been educated in Kalmar since the middle of the 19th century. Today, natural science is a priority
respond to growing public concerns and provide advice to governments
area which gives Kalmar a unique educational and research profile compared with other smal er
and decision makers regarding the management of aquatic resources
universities in Sweden. Of particular relevance for GIWA is the established research in aquatic and
environmental science. Issues linked to the concept of sustainable development are implemented
was recognised by several international bodies focusing on the global
by the research programme Natural Resources Management and Agenda 21 Research School.
environment. In particular, the Global Environment Facility (GEF)
Since its establishment GIWA has grown to become an integral part of University activities.
The GIWA Co-ordination office and GIWA Core team are located at the Kalmarsund Laboratory, the
observed that the International Waters (IW) component of the GEF
university centre for water-related research. Senior scientists appointed by the University are actively
suffered from the lack of a global assessment which made it difficult
involved in the GIWA peer-review and steering groups. As a result of the cooperation the University
can offer courses and seminars related to GIWA objectives and international water issues.
to prioritise international water projects, particularly considering
the inadequate understanding of the nature and root causes of
environmental problems. In 1996, at its fourth meeting in Nairobi, the
causes of degradation of the transboundary aquatic environment and
GEF Scientific and Technical Advisory Panel (STAP), noted that: "Lack of
options for addressing them. These processes led to the development
an International Waters Assessment comparable with that of the IPCC, the
of the Global International Waters Assessment (GIWA) that would be
Global Biodiversity Assessment, and the Stratospheric Ozone Assessment,
implemented by the United Nations Environment Programme (UNEP) in
was a unique and serious impediment to the implementation of the
conjunction with the University of Kalmar, Sweden, on behalf of the GEF.
International Waters Component of the GEF".
The GIWA was inaugurated in Kalmar in October 1999 by the Executive
Director of UNEP, Dr. Klaus Töpfer, and the late Swedish Minister of the
The urgent need for an assessment of the causes of environmental
Environment, Kjel Larsson. On this occasion Dr. Töpfer stated: "GIWA
degradation was also highlighted at the UN Special Session on
is the framework of UNEP´s global water assessment strategy and will
the Environment (UNGASS) in 1997, where commitments were
enable us to record and report on critical water resources for the planet for
made regarding the work of the UN Commission on Sustainable
consideration of sustainable development management practices as part of
Development (UNCSD) on freshwater in 1998 and seas in 1999. Also in
our responsibilities under Agenda 21 agreements of the Rio conference".
1997, two international Declarations, the Potomac Declaration: Towards
enhanced ocean security into the third mil ennium, and the Stockholm
The importance of the GIWA has been further underpinned by the UN
Statement on interaction of land activities, freshwater and enclosed
Mil ennium Development Goals adopted by the UN General Assembly
seas, specifical y emphasised the need for an investigation of the root
in 2000 and the Declaration from the World Summit on Sustainable
x
REGIONAL ASSESSMENTS
GLOBAL INTERNATIONAL WATERS ASSESSMENT
x I
Development in 2002. The development goals aimed to halve the
International waters and transboundary issues
proportion of people without access to safe drinking water and basic
The term "international waters", as used for the purposes of the GEF Operational Strategy,
sanitation by the year 2015 (United Nations Millennium Declaration
includes the oceans, large marine ecosystems, enclosed or semi-enclosed seas and estuaries, as
wel as rivers, lakes, groundwater systems, and wetlands with transboundary drainage basins
2000). The WSSD also cal s for integrated management of land, water and
or common borders. The water-related ecosystems associated with these waters are considered
living resources (WSSD 2002) and, by 2010, the Reykjavik Declaration on
integral parts of the systems.
Responsible Fisheries in the Marine Ecosystem should be implemented
The term "transboundary issues" is used to describe the threats to the aquatic environment
linked to globalisation, international trade, demographic changes and technological advancement,
by al countries that are party to the declaration (FAO 2001).
threats that are additional to those created through transboundary movement of water. Single
country policies and actions are inadequate in order to cope with these chal enges and this makes
them transboundary in nature.
The international waters area includes numerous international conventions, treaties, and
agreements. The architecture of marine agreements is especial y complex, and a large number
The conceptual framework
of bilateral and multilateral agreements exist for transboundary freshwater basins. Related
conventions and agreements in other areas increase the complexity. These initiatives provide
and objectives
a new opportunity for cooperating nations to link many different programmes and instruments
into regional comprehensive approaches to address international waters.
Considering the general decline in the condition of the world's aquatic
the large-scale deforestation of mangroves for ponds (Primavera 1997).
resources and the international y recognised need for a global y
Within the GIWA, these "non-hydrological" factors constitute as large
coherent assessment of transboundary waters, the primary objectives
a transboundary influence as more traditional y recognised problems,
of the GIWA are:
such as the construction of dams that regulate the flow of water into
To provide a prioritising mechanism that al ows the GEF to focus
a neighbouring country, and are considered equal y important. In
their resources so that they are used in the most cost effective
addition, the GIWA recognises the importance of hydrological units that
manner to achieve significant environmental benefits, at national,
would not normal y be considered transboundary but exert a significant
regional and global levels; and
influence on transboundary waters, such as the Yangtze River in China
To highlight areas in which governments can develop and
which discharges into the East China Sea (Daoji & Daler 2004) and the
implement strategic policies to reduce environmental degradation
Volga River in Russia which is largely responsible for the condition of
and improve the management of aquatic resources.
the Caspian Sea (Barannik et al. 2004). Furthermore, the GIWA is a truly
regional assessment that has incorporated data from a wide range of
In order to meet these objectives and address some of the current
sources and included expert knowledge and information from a wide
inadequacies in international aquatic resources management, the GIWA
range of sectors and from each country in the region. Therefore, the
has incorporated four essential elements into its design:
transboundary concept adopted by the GIWA extends to include
A broad transboundary approach that generates a truly regional
impacts caused by globalisation, international trade, demographic
perspective through the incorporation of expertise and existing
changes and technological advances and recognises the need for
information from al nations in the region and the assessment of
international cooperation to address them.
all factors that influence the aquatic resources of the region;
A drainage basin approach integrating freshwater and marine
systems;
The organisational structure and
A multidisciplinary approach integrating environmental and socio-
economic information and expertise; and
implementation of the GIWA
A coherent assessment that enables global comparison of the
results.
The scale of the assessment
Initial y, the scope of the GIWA was confined to transboundary waters
The GIWA builds on previous assessments implemented within the GEF
in areas that included countries eligible to receive funds from the GEF.
International Waters portfolio but has developed and adopted a broader
However, it was recognised that a truly global perspective would only
definition of transboundary waters to include factors that influence the
be achieved if industrialised, GEF-ineligible regions of the world were
quality and quantity of global aquatic resources. For example, due to
also assessed. Financial resources to assess the GEF-eligible countries
globalisation and international trade, the market for penaeid shrimps
were obtained primarily from the GEF (68%), the Swedish International
has widened and the prices soared. This, in turn, has encouraged
Development Cooperation Agency (Sida) (18%), and the Finnish
entrepreneurs in South East Asia to expand aquaculture resulting in
Department for International Development Cooperation (FINNIDA)
x
REGIONAL ASSESSMENTS
GLOBAL INTERNATIONAL WATERS ASSESSMENT
x I
1
15
11
16
14
12
28
10
13
25
17
29
9
18
19
30
23
22
8 6 7
31
20
24
26
35
33
2
34
27
5
21
50
32
51
36
37
41
52
4
49
53
43
65
55
3
48
54
42
56
46
62
47
40b
40a
57
62
45b
39
59
45a
58
60
64
44
61
38
63
66
1
Arctic
12
Norwegian Sea (LME)
24 Aral Sea
36 East-China Sea (LME)
46 Somali Coastal Current (LME)
58 North Australian Shelf (LME)
2
Gulf of Mexico (LME)
13
Faroe plateau
25 Gulf of Alaska (LME)
37
Hawaiian Archipelago (LME)
47
East African Rift Valley Lakes
59 Coral Sea Basin
3
Caribbean Sea (LME)
14
Iceland Shelf (LME)
26 California Current (LME)
38 Patagonian Shelf (LME)
48 Gulf of Aden
60 Great Barrier Reef (LME)
4
Caribbean Islands
15
East Greenland Shelf (LME)
27 Gulf of California (LME)
39 Brazil Current (LME)
49 Red Sea (LME)
61
Great Australian Bight
5
Southeast Shelf (LME)
16
West Greenland Shelf (LME)
28 East Bering Sea (LME)
40a Brazilian Northeast (LME)
50 The Gulf
62 Small Island States
6
Northeast Shelf (LME)
17
Baltic Sea (LME)
29 West Bering Sea (LME)
40b Amazon
51
Jordan
63 Tasman Sea
7
Scotian Shelf (LME)
18
North Sea (LME)
30 Sea of Okhotsk (LME)
41
Canary Current (LME)
52 Arabian Sea (LME)
64 Humboldt Current (LME)
8
Gulf of St Lawrence
19
Celtic-Biscay Shelf (LME)
31
Oyashio Current (LME)
42 Guinea Current (LME)
53 Bay of Bengal S.E.
65 Eastern Equatorial Pacific
9
Newfoundland Shelf (LME)
20 Iberian Coastal (LME)
32 Kuroshio Current (LME)
43 Lake Chad
54 South China Sea (LME)
66 Antarctic (LME)
10
Baffin Bay, Labrador Sea,
21
Mediterranean Sea (LME)
33 Sea of Japan/East Sea (LME)
44 Benguela Current (LME)
55 Mekong River
Canadian Archipelago
22 Black Sea (LME)
34 Yellow Sea (LME)
45a Agulhas Current (LME)
56 Sulu-Celebes Sea (LME)
11
Barents Sea (LME)
23 Caspian Sea
35 Bohai Sea
45b Indian Ocean Islands
57 Indonesian Seas (LME)
Figure 1
The 66 transboundary regions assessed within the GIWA project.
(10%). Other contributions were made by Kalmar Municipality, the
Considering the objectives of the GIWA and the elements incorporated
University of Kalmar and the Norwegian Government. The assessment of
into its design, a new methodology for the implementation of the
regions ineligible for GEF funds was conducted by various international
assessment was developed during the initial phase of the project. The
and national organisations as in-kind contributions to the GIWA.
methodology focuses on five major environmental concerns which
constitute the foundation of the GIWA assessment; Freshwater shortage,
In order to be consistent with the transboundary nature of many of the
Pol ution, Habitat and community modification, Overexploitation of fish
world's aquatic resources and the focus of the GIWA, the geographical
and other living resources, and Global change. The GIWA methodology
units being assessed have been designed according to the watersheds
is outlined in the fol owing chapter.
of discrete hydrographic systems rather than political borders (Figure 1).
The geographic units of the assessment were determined during the
The global network
preparatory phase of the project and resulted in the division of the
In each of the 66 regions, the assessment is conducted by a team of
world into 66 regions defined by the entire area of one or more
local experts that is headed by a Focal Point (Figure 2). The Focal Point
catchments areas that drains into a single designated marine system.
can be an individual, institution or organisation that has been selected
These marine systems often correspond to Large Marine Ecosystems
on the basis of their scientific reputation and experience implementing
(LMEs) (Sherman 1994, IOC 2002).
international assessment projects. The Focal Point is responsible
for assembling members of the team and ensuring that it has the
Large Marine Ecocsystems (LMEs)
necessary expertise and experience in a variety of environmental
Large Marine Ecosystems (LMEs) are regions of ocean space encompassing coastal areas from river
and socio-economic disciplines to successful y conduct the regional
basins and estuaries to the seaward boundaries of continental shelves and the outer margin of the
major current systems. They are relatively large regions on the order of 200 000 km2 or greater,
assessment. The selection of team members is one of the most critical
characterised by distinct: (1) bathymetry, (2) hydrography, (3) productivity, and (4) trophical y
elements for the success of GIWA and, in order to ensure that the
dependent populations.
The Large Marine Ecosystems strategy is a global effort for the assessment and management
most relevant information is incorporated into the assessment, team
of international coastal waters. It developed in direct response to a declaration at the 1992
members were selected from a wide variety of institutions such as
Rio Summit. As part of the strategy, the World Conservation Union (IUCN) and National Oceanic
and Atmospheric Administration (NOAA) have joined in an action program to assist developing
universities, research institutes, government agencies, and the private
countries in planning and implementing an ecosystem-based strategy that is focused on LMEs as
sector. In addition, in order to ensure that the assessment produces a
the principal assessment and management units for coastal ocean resources. The LME concept is
also adopted by GEF that recommends the use of LMEs and their contributing freshwater basins
truly regional perspective, the teams should include representatives
as the geographic area for integrating changes in sectoral economic activities.
from each country that shares the region.
x II
REGIONAL ASSESSMENTS
GLOBAL INTERNATIONAL WATERS ASSESSMENT
x III
The GIWA is comprised of a logical sequence of four integrated
components. The first stage of the GIWA is cal ed Scaling and is a
process by which the geographic area examined in the assessment is
defined and al the transboundary waters within that area are identified.
Once the geographic scale of the assessment has been defined, the
assessment teams conduct a process known as Scoping in which the
magnitude of environmental and associated socio-economic impacts
of Freshwater shortage, Pol ution, Habitat and community modification,
Unsustainable exploitation of fish and other living resources, and Global
Figure 2
The organisation of the GIWA project.
change is assessed in order to identify and prioritise the concerns
that require the most urgent intervention. The assessment of these
predefined concerns incorporates the best available information and
In total, more than 1 000 experts have contributed to the implementation
the knowledge and experience of the multidisciplinary, multi-national
of the GIWA il ustrating that the GIWA is a participatory exercise that
assessment teams formed in each region. Once the priority concerns
relies on regional expertise. This participatory approach is essential
have been identified, the root causes of these concerns are identified
because it instils a sense of local ownership of the project, which
during the third component of the GIWA, Causal chain analysis. The root
ensures the credibility of the findings and moreover, it has created a
causes are determined through a sequential process that identifies, in
global network of experts and institutions that can col aborate and
turn, the most significant immediate causes fol owed by the economic
exchange experiences and expertise to help mitigate the continued
sectors that are primarily responsible for the immediate causes and
degradation of the world's aquatic resources.
final y, the societal root causes. At each stage in the Causal chain
analysis, the most significant contributors are identified through an
analysis of the best available information which is augmented by the
expertise of the assessment team. The final component of the GIWA is
GIWA Regional reports
the development of Policy options that focus on mitigating the impacts
of the root causes identified by the Causal chain analysis.
The GIWA was established in response to growing concern among the
general public regarding the quality of the world's aquatic resources
The results of the GIWA assessment in each region are reported in
and the recognition of governments and the international community
regional reports that are published by UNEP. These reports are designed
concerning the absence of a global y coherent international waters
to provide a brief physical and socio-economic description of the
assessment. However, because a holistic, region-by-region, assessment
most important features of the region against which the results of the
of the condition of the world's transboundary water resources had never
assessment can be cast. The remaining sections of the report present
been undertaken, a methodology guiding the implementation of such
the results of each stage of the assessment in an easily digestible form.
an assessment did not exist. Therefore, in order to implement the GIWA,
Each regional report is reviewed by at least two independent external
a new methodology that adopted a multidisciplinary, multi-sectoral,
reviewers in order to ensure the scientific validity and applicability of
multi-national approach was developed and is now available for the
each report. The 66 regional assessments of the GIWA will serve UNEP
implementation of future international assessments of aquatic resources.
as an essential complement to the UNEP Water Policy and Strategy and
UNEP's activities in the hydrosphere.
UNEP Water Policy and Strategy
The primary goals of the UNEP water policy and strategy are:
(a) Achieving greater global understanding of freshwater, coastal and marine environments by
conducting environmental assessments in priority areas;
Global International Waters Assessment
(b) Raising awareness of the importance and consequences of unsustainable water use;
(c) Supporting the efforts of Governments in the preparation and implementation of integrated
management of freshwater systems and their related coastal and marine environments;
(d) Providing support for the preparation of integrated management plans and programmes for
aquatic environmental hot spots, based on the assessment results;
(e) Promoting the application by stakeholders of precautionary, preventive and anticipatory
approaches.
x II
REGIONAL ASSESSMENTS
GLOBAL INTERNATIONAL WATERS ASSESSMENT
x III
References:
AMAP (1998). Assessment Report: Arctic Pol ution Issues. Arctic
Monitoring and Assessment Programme (AMAP), Oslo, Norway.
Barannik, V., Borysova, O. and Stolberg, F. (2004). The Caspian Sea Region:
Environmental Change. Ambio, 33:45-51.
Brinson, M.M. and Malvárez, A.I. (2002). Temperate freshwater wetlands:
types, status, and threats. Environmental Conservation, 29:115-133.
Daoji, L. and Daler, D. (2004). Ocean Pol ution from Land-based Sources:
East China Sea, China. Ambio, 33:98-106.
FAO (2001). Reykjavik conference on responsible fisheries in the marine
ecosystem. Iceland, 1-4 October 2001.
IOC (2002). IOC-IUCN-NOAA Consultative Meeting on Large Marine
Ecosystems (LMEs). Fourth Session, 8-9 January 2002, Paris,
France.
IPCC (2001). Climate Change 2001: The Scientific Basis. Contribution
of Working Group I to the Third Assessment Report of the
Intergovernmental Panel on Climate Change. In: Houghton,
J.T., Ding, Y., Griggs, D.J., Noguer, M., van der Linden, P.J., Dai, X.,
Maskel , K. and Johnson, C.A. (eds). Cambridge University Press,
Cambridge, United Kingdom and New York, NY, USA.
Kennish, M.J. (2002). Environmental threats and environmental future of
estuaries. Environmental Conservation, 29:78-107.
Myers, R.A. and Worm, B. (2003). Rapid worldwide depletion of predatory
fish communities. Nature, 423:280-283.
Primavera, J.H. (1997) Socio-economic impacts of shrimp culture.
Aquaculture Research, 28:815-827.
Sherman, K. (1994). Sustainability, biomass yields, and health of coastal
ecosystems: an ecological perspective. Marine Ecology Progress
Series, 112:277-301.
United Nations conference on the human environment (1972). Report
available on-line at http://www.unep.org
United Nations Mil ennium Declaration (2000). The Mil ennium
Assembly of the United Nations, New York.
WHO-UNICEF (2002). Global Water Supply and Sanitation Assessment:
2000 Report.
WSSD (2002). World Summit on Sustainable Development.
Johannesburg Summit 2002. Key Outcomes of the Summit,
UN Department of Public Information, New York.
x IV
REGIONAL ASSESSMENTS
The GIWA methodology
The specific objectives of the GIWA were to conduct a holistic and global y
The assessment integrates environmental and socio-economic data
comparable assessment of the world's transboundary aquatic resources
from each country in the region to determine the severity of the
that incorporated both environmental and socio-economic factors
impacts of each of the five concerns and their constituent issues on
and recognised the inextricable links between freshwater and marine
the entire region. The integration of this information was facilitated by
environments, in order to enable the GEF to focus their resources and to
implementing the assessment during two participatory workshops
provide guidance and advice to governments and decision makers. The
that typical y involved 10 to 15 environmental and socio-economic
coalition of al these elements into a single coherent methodology that
experts from each country in the region. During these workshops, the
produces an assessment that achieves each of these objectives had not
regional teams performed preliminary analyses based on the col ective
previously been done and posed a significant chal enge.
knowledge and experience of these local experts. The results of these
analyses were substantiated with the best available information to be
The integration of each of these elements into the GIWA methodology
presented in a regional report.
was achieved through an iterative process guided by a special y
Table 1
Pre-defined GIWA concerns and their constituent issues
convened Methods task team that was comprised of a number of
addressed within the assessment.
international assessment and water experts. Before the final version
of the methodology was adopted, preliminary versions underwent
Environmental issues
Major concerns
an extensive external peer review and were subjected to preliminary
1. Modification of stream flow
testing in selected regions. Advice obtained from the Methods task
2. Pol ution of existing supplies
I Freshwater shortage
team and other international experts and the lessons learnt from
3. Changes in the water table
preliminary testing were incorporated into the final version that was
4. Microbiological
5. Eutrophication
used to conduct each of the GIWA regional assessments.
6. Chemical
7. Suspended solids
II Pollution
8. Solid wastes
Considering the enormous differences between regions in terms of the
9. Thermal
10. Radionuclide
quality, quantity and availability of data, socio-economic setting and
11. Spil s
environmental conditions, the achievement of global comparability
12. Loss of ecosystems
required an innovative approach. This was facilitated by focusing
III Habitat and community
13. Modification of ecosystems or ecotones, including community
modification
the assessment on the impacts of five pre-defined concerns namely;
structure and/or species composition
Freshwater shortage, Pollution, Habitat and community modification,
14. Overexploitation
15. Excessive by-catch and discards
IV Unsustainable
Unsustainable exploitation of fish and other living resources and Global
16. Destructive fishing practices
exploitation of fish and
change, in transboundary waters. Considering the diverse range of
17. Decreased viability of stock through pol ution and disease
other living resources
18. Impact on biological and genetic diversity
elements encompassed by each concern, assessing the magnitude of
the impacts caused by these concerns was facilitated by evaluating the
19. Changes in hydrological cycle
20. Sea level change
V Global change
impacts of 22 specific issues that were grouped within these concerns
21. Increased uv-b radiation as a result of ozone depletion
22. Changes in ocean CO source/sink function
(see Table 1).
2
THE GIWA METHODOLOGY
vii


political boundaries but were instead, general y defi ned by a large but
discrete drainage basin that also included the coastal marine waters into
which the basin discharges. In many cases, the marine areas examined
during the assessment coincided with the Large Marine Ecosystems
(LMEs) defi ned by the US National Atmospheric and Oceanographic
Administration (NOAA). As a consequence, scaling should be a
relatively straight-forward task that involves the inspection of the
boundaries that were proposed for the region during the preparatory
phase of GIWA to ensure that they are appropriate and that there are
no important overlaps or gaps with neighbouring regions. When the
proposed boundaries were found to be inadequate, the boundaries of
the region were revised according to the recommendations of experts
from both within the region and from adjacent regions so as to ensure
that any changes did not result in the exclusion of areas from the GIWA.
Once the regional boundary was defi ned, regional teams identifi ed all
the transboundary elements of the aquatic environment within the
region and determined if these elements could be assessed as a single
Figure 1
Illustration of the relationship between the GIWA
coherent aquatic system or if there were two or more independent
approach and other projects implemented within the
GEF International Waters (IW) portfolio.
systems that should be assessed separately.
The GIWA is a logical contiguous process that defi nes the geographic
Scoping Assessing the GIWA concerns
region to be assessed, identifi es and prioritises particularly problems
Scoping is an assessment of the severity of environmental and socio-
based on the magnitude of their impacts on the environment and
economic impacts caused by each of the fi ve pre-defi ned GIWA concerns
human societies in the region, determines the root causes of those
and their constituent issues (Table 1). It is not designed to provide an
problems and, fi nal y, assesses various policy options that addresses
exhaustive review of water-related problems that exist within each region,
those root causes in order to reverse negative trends in the condition
but rather it is a mechanism to identify the most urgent problems in the
of the aquatic environment. These four steps, referred to as Scaling,
region and prioritise those for remedial actions. The priorities determined
Scoping, Causal chain analysis and Policy options analysis, are
by Scoping are therefore one of the main outputs of the GIWA project.
summarised below and are described in their entirety in two volumes:
GIWA Methodology Stage 1: Scaling and Scoping; and GIWA Methodology:
Focusing the assessment on pre-defi ned concerns and issues ensured
Detailed Assessment, Causal Chain Analysis and Policy Options Analysis.
the comparability of the results between diff erent regions. In addition, to
General y, the components of the GIWA methodology are aligned
ensure the long-term applicability of the options that are developed to
with the framework adopted by the GEF for Transboundary Diagnostic
mitigate these problems, Scoping not only assesses the current impacts
Analyses (TDAs) and Strategic Action Programmes (SAPs) (Figure 1) and
of these concerns and issues but also the probable future impacts
assume a broad spectrum of transboundary infl uences in addition to
according to the "most likely scenario" which considered demographic,
those associated with the physical movement of water across national
economic, technological and other relevant changes that wil potential y
borders.
infl uence the aquatic environment within the region by 2020.
Scaling Defining the geographic extent
The magnitude of the impacts caused by each issue on the
of the region
environment and socio-economic indicators was assessed over the
Scaling is the fi rst stage of the assessment and is the process by which
entire region using the best available information from a wide range of
the geographic scale of the assessment is defi ned. In order to facilitate
sources and the knowledge and experience of the each of the experts
the implementation of the GIWA, the globe was divided during the
comprising the regional team. In order to enhance the comparability
design phase of the project into 66 contiguous regions. Considering the
of the assessment between diff erent regions and remove biases
transboundary nature of many aquatic resources and the transboundary
in the assessment caused by diff erent perceptions of and ways to
focus of the GIWA, the boundaries of the regions did not comply with
communicate the severity of impacts caused by particular issues, the
viii
REGIONAL ASSESSMENTS
THE GIWA METHODOLOGY
ix
results were distil ed and reported as standardised scores according to
Table 2
Example of environmental impact assessment of
the fol owing four point scale:
Freshwater shortage.
Weight
0 = no known impact
Environmental
Environmental issues
Score
Weight %
averaged
concerns
1 = slight impact
score
2 = moderate impact
1. Modification of stream flow
1
20
Freshwater shortage
1.50
3 = severe impact
2. Pol ution of existing supplies
2
50
The attributes of each score for each issue were described by a detailed
3. Changes in the water table
1
30
set of pre-defined criteria that were used to guide experts in reporting
Table 3
Example of Health impacts assessment linked to one of
the results of the assessment. For example, the criterion for assigning
the GIWA concerns.
a score of 3 to the issue Loss of ecosystems or ecotones is: "Permanent
Criteria for Health impacts
Raw score
Score Weight %
destruction of at least one habitat is occurring such as to have reduced their
Very small
Very large
surface area by >30% during the last 2-3 decades". The full list of criteria is
Number of people affected
2
50
0
1
2
3
presented at the end of the chapter, Table 5a-e. Although the scoring
Minimum
Severe
Degree of severity
2
30
0
1
2
3
inevitably includes an arbitrary component, the use of predefined
Occasion/Short
Continuous
Frequency/Duration
2
20
criteria facilitates comparison of impacts on a global scale and also
0
1
2
3
Weight average score for Health impacts
2
encouraged consensus of opinion among experts.
The trade-off associated with assessing the impacts of each concern
After al 22 issues and associated socio-economic impacts have
and their constituent issues at the scale of the entire region is that spatial
been scored, weighted and averaged, the magnitude of likely future
resolution was sometimes low. Although the assessment provides a
changes in the environmental and socio-economic impacts of each
score indicating the severity of impacts of a particular issue or concern
of the five concerns on the entire region is assessed according to the
on the entire region, it does not mean that the entire region suffers
most likely scenario which describes the demographic, economic,
the impacts of that problem. For example, eutrophication could be
technological and other relevant changes that might influence the
identified as a severe problem in a region, but this does not imply that all
aquatic environment within the region by 2020.
waters in the region suffer from severe eutrophication. It simply means
that when the degree of eutrophication, the size of the area affected,
In order to prioritise among GIWA concerns within the region and
the socio-economic impacts and the number of people affected is
identify those that will be subjected to causal chain and policy options
considered, the magnitude of the overal impacts meets the criteria
analysis in the subsequent stages of the GIWA, the present and future
defining a severe problem and that a regional action should be initiated
scores of the environmental and socio-economic impacts of each
in order to mitigate the impacts of the problem.
concern are tabulated and an overall score calculated. In the example
presented in Table 4, the scoping assessment indicated that concern I I,
When each issue has been scored, it was weighted according to the relative
Habitat and community modification, was the priority concern in this
contribution it made to the overal environmental impacts of the concern
region. The outcome of this mathematic process was reconciled against
and a weighted average score for each of the five concerns was calculated
the knowledge of experts and the best available information in order
(Table 2). Of course, if each issue was deemed to make equal contributions,
to ensure the validity of the conclusion.
then the score describing the overal impacts of the concern was simply the
arithmetic mean of the scores al ocated to each issue within the concern.
In some cases however, this process and the subsequent participatory
In addition, the socio-economic impacts of each of the five major
discussion did not yield consensus among the regional experts
concerns were assessed for the entire region. The socio-economic
regarding the ranking of priorities. As a consequence, further analysis
impacts were grouped into three categories; Economic impacts,
was required. In such cases, expert teams continued by assessing the
Health impacts and Other social and community impacts (Table 3). For
relative importance of present and potential future impacts and assign
each category, an evaluation of the size, degree and frequency of the
weights to each. Afterwards, the teams assign weights indicating the
impact was performed and, once completed, a weighted average score
relative contribution made by environmental and socio-economic
describing the overal socio-economic impacts of each concern was
factors to the overal impacts of the concern. The weighted average
calculated in the same manner as the overall environmental score.
score for each concern is then recalculated taking into account
viii
REGIONAL ASSESSMENTS
THE GIWA METHODOLOGY
ix
Table 4
Example of comparative environmental and socio-economic impacts of each major concern, presently and likely in year 2020.
Types of impacts
Environmental score
Economic score
Human health score
Social and community score
Concern
Overall score
Present (a)
Future (b)
Present (c)
Future (d)
Present (e)
Future (f)
Present (g)
Future (h)
Freshwater shortage
1.3
2.3
2.7
2.8
2.6
3.0
1.8
2.2
2.3
Pol ution
1.5
2.0
2.0
2.3
1.8
2.3
2.0
2.3
2.0
Habitat and community
2.0
3.0
2.4
3.0
2.4
2.8
2.3
2.7
2.6
modification
Unsustainable exploitation of fish
1.8
2.2
2.0
2.1
2.0
2.1
2.4
2.5
2.1
and other living resources
Global change
0.8
1.0
1.5
1.7
1.5
1.5
1.0
1.0
1.2
the relative contributions of both present and future impacts and
should be regarded as a framework to guide the analysis, rather than
environmental and socio-economic factors. The outcome of these
as a set of detailed instructions. Secondly, in an ideal setting, a causal
additional analyses was subjected to further discussion to identify
chain would be produced by a multidisciplinary group of specialists
overall priorities for the region.
that would statistical y examine each successive cause and study its
links to the problem and to other causes. However, this approach (even
Final y, the assessment recognises that each of the five GIWA concerns
if feasible) would use far more resources and time than those available
are not discrete but often interact. For example, pollution can destroy
to GIWA1. For this reason, it has been necessary to develop a relatively
aquatic habitats that are essential for fish reproduction which, in turn,
simple and practical analytical model for gathering information to
can cause declines in fish stocks and subsequent overexploitation. Once
assemble meaningful causal chains.
teams have ranked each of the concerns and determined the priorities
for the region, the links between the concerns are highlighted in order
Conceptual model
to identify places where strategic interventions could be applied to
A causal chain is a series of statements that link the causes of a problem
yield the greatest benefits for the environment and human societies
with its effects. Recognising the great diversity of local settings and the
in the region.
resulting difficulty in developing broadly applicable policy strategies,
the GIWA CCA focuses on a particular system and then only on those
Causal chain analysis
issues that were prioritised during the scoping assessment. The
Causal Chain Analysis (CCA) traces the cause-effect pathways from the
starting point of a particular causal chain is one of the issues selected
socio-economic and environmental impacts back to their root causes.
during the Scaling and Scoping stages and its related environmental
The GIWA CCA aims to identify the most important causes of each
and socio-economic impacts. The next element in the GIWA chain is
concern prioritised during the scoping assessment in order to direct
the immediate cause; defined as the physical, biological or chemical
policy measures at the most appropriate target in order to prevent
variable that produces the GIWA issue. For example, for the issue of
further degradation of the regional aquatic environment.
eutrophication the immediate causes may be, inter alia:
Enhanced nutrient inputs;
Root causes are not always easy to identify because they are often
Increased recycling/mobilisation;
spatial y or temporal y separated from the actual problems they
Trapping of nutrients (e.g. in river impoundments);
cause. The GIWA CCA was developed to help identify and understand
Run-off and stormwaters
the root causes of environmental and socio-economic problems
in international waters and is conducted by identifying the human
Once the relevant immediate cause(s) for the particular system has
activities that cause the problem and then the factors that determine
(have) been identified, the sectors of human activity that contribute
the ways in which these activities are undertaken. However, because
most significantly to the immediate cause have to be determined.
there is no universal theory describing how root causes interact to
Assuming that the most important immediate cause in our example
create natural resource management problems and due to the great
had been increased nutrient concentrations, then it is logical that the
variation of local circumstances under which the methodology will
most likely sources of those nutrients would be the agricultural, urban
be applied, the GIWA CCA is not a rigidly structured assessment but
or industrial sectors. After identifying the sectors that are primarily
1 This does not mean that the methodology ignores statistical or quantitative studies; as has already been pointed out, the available evidence that justifies the assumption of causal links should
be provided in the assessment.
x
REGIONAL ASSESSMENTS
THE GIWA METHODOLOGY
xi
responsible for the immediate causes, the root causes acting on those
The policy options recommended by the GIWA are only contributions
sectors must be determined. For example, if agriculture was found to
to the larger policy process and, as such, the GIWA methodology
be primarily responsible for the increased nutrient concentrations, the
developed to test the performance of various options under the
root causes could potential y be:
different circumstances has been kept simple and broadly applicable.
Economic (e.g. subsidies to fertilisers and agricultural products);
Legal (e.g. inadequate regulation);
Global International Waters Assessment
Failures in governance (e.g. poor enforcement); or
Technology or knowledge related (e.g. lack of affordable substitutes
for fertilisers or lack of knowledge as to their application).
Once the most relevant root causes have been identified, an
explanation, which includes available data and information, of how
they are responsible for the primary environmental and socio-economic
problems in the region should be provided.
Policy option analysis
Despite considerable effort of many Governments and other
organisations to address transboundary water problems, the evidence
indicates that there is stil much to be done in this endeavour. An
important characteristic of GIWA's Policy Option Analysis (POA) is that
its recommendations are firmly based on a better understanding of
the root causes of the problems. Freshwater scarcity, water pol ution,
overexploitation of living resources and habitat destruction are very
complex phenomena. Policy options that are grounded on a better
understanding of these phenomena wil contribute to create more
effective societal responses to the extremely complex water related
transboundary problems. The core of POA in the assessment consists
of two tasks:
Construct policy options
Policy options are simply different courses of action, which are not
always mutual y exclusive, to solve or mitigate environmental and
socio-economic problems in the region. Although a multitude of
different policy options could be constructed to address each root
cause identified in the CCA, only those few policy options that have
the greatest likelihood of success were analysed in the GIWA.
Select and apply the criteria on which the policy options will be
evaluated
Although there are many criteria that could be used to evaluate any
policy option, GIWA focuses on:
Effectiveness (certainty of result)
Efficiency (maximisation of net benefits)
Equity (fairness of distributional impacts)
Practical criteria (political acceptability, implementation feasibility).
x
REGIONAL ASSESSMENTS
THE GIWA METHODOLOGY
xi
Table 5a: Scoring criteria for environmental impacts of Freshwater shortage
Issue
Score 0 = no known impact
Score 1 = slight impact
Score 2 = moderate impact
Score 3 = severe impact
Issue 1: Modification
No evidence of modification of stream
There is a measurably changing trend in
Significant downward or upward trend
Annual discharge of a river altered by more
of stream flow
flow.
annual river discharge at gauging stations
(more than 20% of the long term mean) in
than 50% of long term mean; or
"An increase or decrease
in a major river or tributary (basin >
annual discharges in a major river or tributary Loss of >50% of riparian or deltaic
in the discharge of
40 000 km2); or
draining a basin of >250 000 km2; or
wetlands over a period of not less than
streams and rivers
There is a measurable decrease in the area
Loss of >20% of flood plain or deltaic
40 years (through causes other than
as a result of human
of wetlands (other than as a consequence
wetlands through causes other than
conversion or artificial embankment); or
interventions on a local/
of conversion or embankment
conversion or artificial embankments; or
Significant increased siltation or erosion
regional scale (see Issue
construction); or
Significant loss of riparian vegetation (e.g.
due to changing in flow regime (other than
19 for flow alterations
There is a measurable change in the
trees, flood plain vegetation); or
normal fluctuations in flood plain rivers);
resulting from global
interannual mean salinity of estuaries or
Significant saline intrusion into previously
or
change) over the last 3-4
coastal lagoons and/or change in the mean
freshwater rivers or lagoons.
Loss of one or more anadromous or
decades."
position of estuarine salt wedge or mixing
catadromous fish species for reasons
zone; or
other than physical barriers to migration,
Change in the occurrence of exceptional
pol ution or overfishing.
discharges (e.g. due to upstream
damming.
Issue 2: Pollution of
No evidence of pol ution of surface and
Any monitored water in the region does
Water supplies does not meet WHO or
River draining more than 10% of the basin
existing supplies
ground waters.
not meet WHO or national drinking water
national drinking water standards in more
have suffered polysaprobic conditions, no
"Pol ution of surface
criteria, other than for natural reasons; or
than 30% of the region; or
longer support fish, or have suffered severe
and ground fresh waters
There have been reports of one or more
There are one or more reports of fish kil s
oxygen depletion
supplies as a result of
fish kil s in the system due to pol ution
due to pol ution in any river draining a
Severe pol ution of other sources of
point or diffuse sources"
within the past five years.
basin of >250 000 km2 .
freshwater (e.g. groundwater)
Issue 3: Changes in
No evidence that abstraction of water from Several wel s have been deepened because Clear evidence of declining base flow in
Aquifers are suffering salinisation over
the water table
aquifers exceeds natural replenishment.
of excessive aquifer draw-down; or
rivers in semi-arid areas; or
regional scale; or
"Changes in aquifers
Several springs have dried up; or
Loss of plant species in the past decade,
Perennial springs have dried up over
as a direct or indirect
Several wel s show some salinisation.
that depend on the presence of ground
regional y significant areas; or
consequence of human
water; or
Some aquifers have become exhausted
activity"
Wel s have been deepened over areas of
hundreds of km2;or
Salinisation over significant areas of the
region.
Table 5b: Scoring criteria for environmental impacts of Pollution
Issue
Score 0 = no known impact
Score 1 = slight impact
Score 2 = moderate impact
Score 3 = severe impact
Issue 4:
Normal incidence of bacterial related
There is minor increase in incidence of
Public health authorities aware of marked
There are large closure areas or very
Microbiological
gastroenteric disorders in fisheries product
bacterial related gastroenteric disorders
increase in the incidence of bacterial
restrictive advisories affecting the
pollution
consumers and no fisheries closures or
in fisheries product consumers but no
related gastroenteric disorders in fisheries
marketability of fisheries products; or
"The adverse effects of
advisories.
fisheries closures or advisories.
product consumers; or
There exists widespread public or tourist
microbial constituents of
There are limited area closures or
awareness of hazards resulting in
human sewage released
advisories reducing the exploitation or
major reductions in the exploitation or
to water bodies."
marketability of fisheries products.
marketability of fisheries products.
Issue 5:
No visible effects on the abundance and
Increased abundance of epiphytic algae; or
Increased filamentous algal production
High frequency (>1 event per year), or
Eutrophication
distributions of natural living resource
A statistical y significant trend in
resulting in algal mats; or
intensity, or large areas of periodic hypoxic
"Artificial y enhanced
distributions in the area; and
decreased water transparency associated
Medium frequency (up to once per year)
conditions, or high frequencies of fish and
primary productivity in
No increased frequency of hypoxia1 or
with algal production as compared with
of large-scale hypoxia and/or fish and
zoobenthos mortality events or harmful
receiving water basins
fish mortality events or harmful algal
long-term (>20 year) data sets; or
zoobenthos mortality events and/or
algal blooms; or
related to the increased
blooms associated with enhanced primary Measurable shal owing of the depth range
harmful algal blooms.
Significant changes in the littoral
availability or supply
production; and
of macrophytes.
community; or
of nutrients, including
No evidence of periodical y reduced
Presence of hydrogen sulphide in
cultural eutrophication
dissolved oxygen or fish and zoobenthos
historical y well oxygenated areas.
in lakes."
mortality; and
No evident abnormality in the frequency of
algal blooms.
xii
REGIONAL ASSESSMENTS
THE GIWA METHODOLOGY
xiii
Issue 6: Chemical
No known or historical levels of chemical
Some chemical contaminants are
Some chemical contaminants are above
Chemical contaminants are above
pollution
contaminants except background levels of
detectable but below threshold limits
threshold limits defined for the country or
threshold limits defined for the country or
"The adverse effects of
natural y occurring substances; and
defined for the country or region; or
region; or
region; and
chemical contaminants
No fisheries closures or advisories due to
Restricted area advisories regarding
Large area advisories by public health
Public health and public awareness of
released to standing or
chemical pol ution; and
chemical contamination of fisheries
authorities concerning fisheries product
fisheries contamination problems with
marine water bodies
No incidence of fisheries product tainting;
products.
contamination but without associated
associated reductions in the marketability
as a result of human
and
catch restrictions or closures; or
of such products either through the
activities. Chemical
No unusual fish mortality events.
If there is no available data use the fol owing High mortalities of aquatic species near
imposition of limited advisories or by area
contaminants are
criteria:
outfal s.
closures of fisheries; or
here defined as
If there is no available data use the fol owing Some use of pesticides in small areas; or
Large-scale mortalities of aquatic species.
compounds that are
criteria:
Presence of small sources of dioxins or
If there is no available data use the fol owing
toxic or persistent or
No use of pesticides; and
furans (e.g., small incineration plants or
criteria:
If there is no available data use the fol owing
bioaccumulating."
No sources of dioxins and furans; and
bleached kraft/pulp mil s using chlorine);
Large-scale use of pesticides in agriculture
criteria:
No regional use of PCBs; and
or
and forestry; or
Indications of health effects resulting
No bleached kraft pulp mil s using chlorine Some previous and existing use of PCBs
Presence of major sources of dioxins or
from use of pesticides; or
bleaching; and
and limited amounts of PCB-containing
furans such as large municipal or industrial Known emissions of dioxins or furans from
No use or sources of other contaminants.
wastes but not in amounts invoking local
incinerators or large bleached kraft pulp
incinerators or chlorine bleaching of pulp;
concerns; or
mil s; or
or
Presence of other contaminants.
Considerable quantities of waste PCBs in
Known contamination of the environment
the area with inadequate regulation or has
or foodstuffs by PCBs; or
invoked some public concerns; or
Known contamination of the environment
Presence of considerable quantities of
or foodstuffs by other contaminants.
other contaminants.
Issue 7: Suspended
No visible reduction in water transparency; Evidently increased or reduced turbidity
Markedly increased or reduced turbidity
Major changes in turbidity over wide or
solids
and
in streams and/or receiving riverine and
in small areas of streams and/or receiving
ecological y significant areas resulting
"The adverse effects of
No evidence of turbidity plumes or
marine environments but without major
riverine and marine environments; or
in markedly changed biodiversity or
modified rates of release
increased siltation; and
changes in associated sedimentation or
Extensive evidence of changes in
mortality in benthic species due to
of suspended particulate No evidence of progressive riverbank,
erosion rates, mortality or diversity of flora
sedimentation or erosion rates; or
excessive sedimentation with or without
matter to water bodies
beach, other coastal or deltaic erosion.
and fauna; or
Changes in benthic or pelagic biodiversity
concomitant changes in the nature of
resulting from human
Some evidence of changes in benthic or
in areas due to sediment blanketing or
deposited sediments (i.e., grain-size
activities"
pelagic biodiversity in some areas due
increased turbidity.
composition/redox); or
to sediment blanketing or increased
Major change in pelagic biodiversity or
turbidity.
mortality due to excessive turbidity.
Issue 8: Solid wastes
No noticeable interference with trawling
Some evidence of marine-derived litter on
Widespread litter on beaches giving rise to
Incidence of litter on beaches sufficient
"Adverse effects
activities; and
beaches; or
public concerns regarding the recreational
to deter the public from recreational
associated with the
No noticeable interference with the
Occasional recovery of solid wastes
use of beaches; or
activities; or
introduction of solid
recreational use of beaches due to litter;
through trawling activities; but
High frequencies of benthic litter recovery
Trawling activities untenable because of
waste materials into
and
Without noticeable interference with
and interference with trawling activities;
benthic litter and gear entanglement; or
water bodies or their
No reported entanglement of aquatic
trawling and recreational activities in
or
Widespread entanglement and/or
environs."
organisms with debris.
coastal areas.
Frequent reports of entanglement/
suffocation of aquatic species by litter.
suffocation of species by litter.
Issue 9: Thermal
No thermal discharges or evidence of
Presence of thermal discharges but
Presence of thermal discharges with large
Presence of thermal discharges with large
"The adverse effects
thermal effluent effects.
without noticeable effects beyond
mixing zones having reduced productivity
mixing zones with associated mortalities,
of the release of
the mixing zone and no significant
or altered biodiversity; or
substantial y reduced productivity or
aqueous effluents at
interference with migration of species.
Evidence of reduced migration of species
noticeable changes in biodiversity; or
temperatures exceeding
due to thermal plume.
Marked reduction in the migration of
ambient temperature
species due to thermal plumes.
in the receiving water
body."
Issue 10: Radionuclide No radionuclide discharges or nuclear
Minor releases or fal out of radionuclides
Minor releases or fal out of radionuclides
Substantial releases or fal out of
"The adverse effects of
activities in the region.
but with well regulated or wel -managed
under poorly regulated conditions that do
radionuclides resulting in excessive
the release of radioactive
conditions complying with the Basic Safety
not provide an adequate basis for public
exposures to humans or animals in relation
contaminants and
Standards.
health assurance or the protection of
to those recommended under the Basic
wastes into the aquatic
aquatic organisms but without situations
Safety Standards; or
environment from
or levels likely to warrant large scale
Some indication of situations or exposures
human activities."
intervention by a national or international
warranting intervention by a national or
authority.
international authority.
Issue 11: Spills
No evidence of present or previous spil s of
Some evidence of minor spil s of hazardous Evidence of widespread contamination
Widespread contamination by hazardous
"The adverse effects
hazardous material; or
materials in small areas with insignificant
by hazardous or aesthetical y displeasing
or aesthetical y displeasing materials
of accidental episodic
No evidence of increased aquatic or avian
smal -scale adverse effects one aquatic or
materials assumed to be from spil age
from frequent spil s resulting in major
releases of contaminants
species mortality due to spil s.
avian species.
(e.g. oil slicks) but with limited evidence of
interference with aquatic resource
and materials to the
widespread adverse effects on resources or
exploitation or coastal recreational
aquatic environment
amenities; or
amenities; or
as a result of human
Some evidence of aquatic or avian species
Significant mortality of aquatic or avian
activities."
mortality through increased presence of
species as evidenced by large numbers of
contaminated or poisoned carcasses on
contaminated carcasses on beaches.
beaches.
xii
REGIONAL ASSESSMENTS
THE GIWA METHODOLOGY
xiii
Table 5c: Scoring criteria for environmental impacts of Habitat and community modification
Issue
Score 0 = no known impact
Score 1 = slight impact
Score 2 = moderate impact
Score 3 = severe impact
Issue 12: Loss of ecosystems or
There is no evidence of loss of
There are indications of fragmentation Permanent destruction of at least one
Permanent destruction of at least one
ecotones
ecosystems or habitats.
of at least one of the habitats.
habitat is occurring such as to have
habitat is occurring such as to have
"The complete destruction of aquatic
reduced their surface area by up to 30
reduced their surface area by >30%
habitats. For the purpose of GIWA
% during the last 2-3 decades.
during the last 2-3 decades.
methodology, recent loss will be
measured as a loss of pre-defined
habitats over the last 2-3 decades."
Issue 13: Modification of
No evidence of change in species
Evidence of change in species
Evidence of change in species
Evidence of change in species
ecosystems or ecotones, including
complement due to species extinction
complement due to species extinction
complement due to species extinction
complement due to species extinction
community structure and/or species
or introduction; and
or introduction
or introduction; and
or introduction; and
composition
No changing in ecosystem function
Evidence of change in population
Evidence of change in population
"Modification of pre-defined habitats
and services.
structure or change in functional group
structure or change in functional group
in terms of extinction of native species,
composition or structure
composition or structure; and
occurrence of introduced species and
Evidence of change in ecosystem
changing in ecosystem function and
services2.
services over the last 2-3 decades."
2 Constanza, R. et al. (1997). The value of the world ecosystem services and natural capital, Nature 387:253-260.
Table 5d: Scoring criteria for environmental impacts of Unsustainable exploitation of fish and other
living resources
Issue
Score 0 = no known impact
Score 1 = slight impact
Score 2 = moderate impact
Score 3 = severe impact
Issue 14: Overexploitation
No harvesting exists catching fish
Commercial harvesting exists but there One stock is exploited beyond MSY
More than one stock is exploited
"The capture of fish, shel fish or marine
(with commercial gear for sale or
is no evidence of over-exploitation.
(maximum sustainable yield) or is
beyond MSY or is outside safe
invertebrates at a level that exceeds the
subsistence).
outside safe biological limits.
biological limits.
maximum sustainable yield of the stock."
Issue 15: Excessive by-catch and
Current harvesting practices show no
Up to 30% of the fisheries yield (by
30-60% of the fisheries yield consists
Over 60% of the fisheries yield is
discards
evidence of excessive by-catch and/or
weight) consists of by-catch and/or
of by-catch and/or discards.
by-catch and/or discards; or
"By-catch refers to the incidental capture
discards.
discards.
Noticeable incidence of capture of
of fish or other animals that are not the
endangered species.
target of the fisheries. Discards refers
to dead fish or other animals that are
returned to the sea."
Issue 16: Destructive fishing
No evidence of habitat destruction due Habitat destruction resulting in
Habitat destruction resulting in
Habitat destruction resulting in
practices
to fisheries practices.
changes in distribution of fish or
moderate reduction of stocks or
complete col apse of a stock or far
"Fishing practices that are deemed to
shel fish stocks; or
moderate changes of the environment;
reaching changes in the environment;
produce significant harm to marine,
Trawling of any one area of the seabed
or
or
lacustrine or coastal habitats and
is occurring less than once per year.
Trawling of any one area of the seabed
Trawling of any one area of the seabed
communities."
is occurring 1-10 times per year; or
is occurring more than 10 times per
Incidental use of explosives or poisons
year; or
for fishing.
Widespread use of explosives or
poisons for fishing.
Issue 17: Decreased viability of
No evidence of increased incidence of
Increased reports of diseases without
Declining populations of one or more
Col apse of stocks as a result of
stocks through contamination and
fish or shel fish diseases.
major impacts on the stock.
species as a result of diseases or
diseases or contamination.
disease
contamination.
"Contamination or diseases of feral (wild)
stocks of fish or invertebrates that are a
direct or indirect consequence of human
action."
Issue 18: Impact on biological and
No evidence of deliberate or accidental Alien species introduced intentional y
Measurable decline in the population
Extinction of native species or local
genetic diversity
introductions of alien species; and
or accidental y without major changes
of native species or local stocks as a
stocks as a result of introductions
"Changes in genetic and species diversity No evidence of deliberate or accidental
in the community structure; or
result of introductions (intentional or
(intentional or accidental); or
of aquatic environments resulting from
introductions of alien stocks; and
Alien stocks introduced intentional y
accidental); or
Major changes (>20%) in the genetic
the introduction of alien or genetical y
No evidence of deliberate or accidental
or accidental y without major changes Some changes in the genetic
composition of stocks (e.g. as a result
modified species as an intentional or
introductions of genetical y modified
in the community structure; or
composition of stocks (e.g. as a result
of escapes from aquaculture replacing
unintentional result of human activities
species.
Genetical y modified species
of escapes from aquaculture replacing
the wild stock).
including aquaculture and restocking."
introduced intentional y or
the wild stock).
accidental y without major changes in
the community structure.
xiv
REGIONAL ASSESSMENTS
THE GIWA METHODOLOGY
xv
Table 5e: Scoring criteria for environmental impacts of Global change
Issue
Score 0 = no known impact
Score 1 = slight impact
Score 2 = moderate impact
Score 3 = severe impact
Issue 19: Changes in hydrological
No evidence of changes in hydrological Change in hydrological cycles due
Significant trend in changing
Loss of an entire habitat through
cycle and ocean circulation
cycle and ocean/coastal current due to
to global change causing changes
terrestrial or sea ice cover (by
desiccation or submergence as a result
"Changes in the local/regional water
global change.
in the distribution and density of
comparison with a long-term time
of global change; or
balance and changes in ocean and coastal
riparian terrestrial or aquatic plants
series) without major downstream
Change in the tree or lichen lines; or
circulation or current regime over the
without influencing overall levels of
effects on river/ocean circulation or
Major impacts on habitats or
last 2-3 decades arising from the wider
productivity; or
biological diversity; or
biodiversity as the result of increasing
problem of global change including
Some evidence of changes in ocean
Extreme events such as flood and
frequency of extreme events; or
ENSO."
or coastal currents due to global
drought are increasing; or
Changing in ocean or coastal currents
change but without a strong effect on Aquatic productivity has been altered
or upwel ing regimes such that plant
ecosystem diversity or productivity.
as a result of global phenomena such
or animal populations are unable to
as ENSO events.
recover to their historical or stable
levels; or
Significant changes in thermohaline
circulation.
Issue 20: Sea level change
No evidence of sea level change.
Some evidences of sea level change
Changed pattern of coastal erosion due Major loss of coastal land areas due to
"Changes in the last 2-3 decades in the
without major loss of populations of
to sea level rise has became evident; or
sea-level change or sea-level induced
annual/seasonal mean sea level as a
organisms.
Increase in coastal flooding events
erosion; or
result of global change."
partly attributed to sea-level rise
Major loss of coastal or intertidal
or changing prevailing atmospheric
populations due to sea-level change or
forcing such as atmospheric pressure
sea level induced erosion.
or wind field (other than storm
surges).
Issue 21: Increased UV-B radiation as No evidence of increasing effects
Some measurable effects of UV/B
Aquatic community structure is
Measured/assessed effects of UV/B
a result of ozone depletion
of UV/B radiation on marine or
radiation on behavior or appearance of
measurably altered as a consequence
irradiation are leading to massive loss
"Increased UV-B flux as a result polar
freshwater organisms.
some aquatic species without affecting
of UV/B radiation; or
of aquatic communities or a significant
ozone depletion over the last 2-3
the viability of the population.
One or more aquatic populations are
change in biological diversity.
decades."
declining.
Issue 22: Changes in ocean CO
No measurable or assessed changes
Some reasonable suspicions that
Some evidences that the impacts
Evidences that the changes in
2
source/sink function
in CO source/sink function of aquatic
current global change is impacting the
of global change have altered the
source/sink function of the aquatic
2
"Changes in the capacity of aquatic
system.
aquatic system sufficiently to alter its
source/sink function for CO of aquatic
systems in the region are sufficient to
2
systems, ocean as well as freshwater, to
source/sink function for CO .
systems in the region by at least 10%.
cause measurable change in global CO
2
2
generate or absorb atmospheric CO as a
balance.
2
direct or indirect consequence of global
change over the last 2-3 decades."
xiv
REGIONAL ASSESSMENTS
THE GIWA METHODOLOGY
xv
Preface
The Lake Chad Basin Commission (LCBC) has been the Focal Point for
The final scores presented in this report resulted from a revision of the
the regional GIWA Assessment of the Lake Chad Basin. Established by
preliminary scores, based on further scientific justification col ected
the Fort Lamy (now N'Djamena) Convention signed on 22 May 1964
during a detailed assessment.
by the Heads of States of the four countries that share the Lake Chad,
LCBC now represents five member States, namely: Cameroon, Central
The GIWA region 43 Task team, consisted of experts from the
African Republic, Chad, Niger and Nigeria. Sudan was admitted in 2000
LCBC member states, such as from SODELAC in Chad, Chad Basin
but is yet to ratify the convention. LCBC has its executive secretariat
Development Authority in Nigeria, Government of Cameroon,
based in N'Djamena, Chad, and is governed by the Summit of Heads
Government of Niger, Government of the Republic of Chad, ONU-SIDA
of States that meets every two years, and the Council of Ministers
and IRAD, a research institute based in Cameroon. One of the two
(two Commissioners represent each member State) that meets at least
workshops was also attended by representatives of the GEF project and
once every year.
UNECA. The LCBC coordinator for the GIWA Assessment, Dr. Johnson
Oguntola and an external consultant, Matthew Fortnam, compiled the
The report presents the results of two workshops, desk research,
Detailed Assessment component of the GIWA Assessment.
information development and policy analysis. The GIWA Methodology
examines the environmental concerns of Freshwater shortage, Pol ution,
The assessment makes use of the work of others throughout the report,
Habitat and community modification, the Unsustainable exploitation
drawing on the expertise of regional and international organisations,
of fish and other living resources, and Global change. During the GIWA
and individuals with experience and interest in the region. The
workshops, hosted by the LCBC in N'Djamena, Chad, for the Scaling and
organisations included the LCBC, WWF International, WWF-US, the
Scoping (28 to 31 January 2002) and the Causal chain and Policy option
IUCN West Africa Bureau, EU-INCO Project, USGS and UNEP.
analyses (26 to 28 September 2003), the transboundary issues of these
concerns were ranked, the priority concerns were traced back to their
The information herein is believed to be reliable, but the assessors
root causes, and a policy analysis was performed.
and their institutions do not guarantee its completeness or accuracy.
Opinions and estimates are the judgements of the work team. The sole
The scoring procedure for the assessment, as wel as Causal chain
purpose of this work is to provide information to the many stakeholders
analysis and Policy options analysis was based on:
of the region regarding issues, strategic planning choices and their
(i) expert opinion obtained during the workshops, where experts from
possible consequences related to the sharing of international waters.
the Lake Chad Basin participated, with different specialist backgrounds
from several institutions and geographical regions of the Lake Chad Basin;
(i ) expert advice from individuals, and regional, national and
Muhammad Sani Adamu
international organisations; and (i i) information and data gathered
Executive Secretary of the Lake Chad Basin Commission
from different sources. The review of the preliminary scores (detailed
assessment) was based on information col ected from local, regional,
national and international documentation and scientific publications.
PREFACE
1
Acknowledgements
This report for the Global International Waters Assessment is the result
Special thanks go to Mr. Abdoul ahi Mahamat Yacoub for providing
of two workshops and background desk research. The Editors are deeply
materials from FEWS archives.
grateful to the Executive Secretary of the Lake Chad Basin Commission,
Engr. Muhammad Sani Adamu, for his very helpful consultations and
The fol owing regional experts and partcipants in the GIWA Task team
insight, as well as genuine concern for finding a lasting solution to the
are acknowledged for their wide range of advice, guidance, assistance
problem of water scarcity affecting the Lake Chad Basin.
and judgement during and outside of the two workshops:
The Editors have been assisted in background research, coordination
Dr. Johnson Oguntola (LCBC coordinator for the GIWA Assessment/
and the preparation and writing of this report by the Executive
Chief of Water Resources Unit, LCBC), Maman Moussa (Directeur
Secretariat of the Lake Chad Basin Commission, and in particular the
Régional de l'Hydraulique, Niger), Anza Zakara (Fisheries Officer, LCBC),
fol owing group:
Mahamat Mey (Livestock Officer, LCBC), Abdal ah Adam Mohamed
Mr. Lambert Tam, Assistant Executive Secretary, for all his organisation
(SODELAC), Alainaye Jogromel (Direction des Ressources en Eau et
efforts and approval for pre-financing of workshop arrangements; and
de la Météorologie, Chad), Dodo Garba (Deputy Regional Director
the fol owing for their coordination, assistance and encouragement:
of Environment, Niger), Usman K. Sandabe (Chad Basin Development
Mr. Martin Gbafolo, Director of the Department of Water Resources
Authority), Ndong Ebozo'o Daniel (Délégué Provincial des Mines,
and Environment; Mr. Emmanuel Yonkie, Director of the Department
de l'Eau et de l'Energie de l'Extręme Nord), Timothée Essang (IRAD),
of Documentation, Publication and Information; Mr. Mahamane Assane,
Dr. Belomal Yongar (Sécretaire Exécutif, ONU-SIDA), and Anada Tiega
Director of the Department of Planning, Monitoring and Evaluation
(LCBC-GEF Project).
of Projects; Mr. Jonathan Tochem, Director of the Department of
Administration and Finance.
The contributions and support made by the many individuals and
institutions in the preparation and publication of the GIWA Lake Chad
The invaluable contribution of the fol owing people towards the
Basin report are grateful y acknowledged. Special thanks are extended
organisation of workshops and the writing of this report is grateful y
to:
acknowledged:
Mrs. Asta Morombaye and Mr. Marcus Ediage Njumbe (Translators), for
AEO African Environment Outlook
facilitating translation of discussions from English to French and vice
CADRES Cabinet Africain Pour le Development et la Recherche sur
versa; Mr. Diakite Nour (Assistant Accountant), for keeping the project
l´Environment au Sahel
accounts; Mr. Alphazazi Abdou (Documentalist), for preparation of
Chad Basin Development Authority
the Conference Hall and facilities; Mr. Ramoni Yakubu (Technician), for
DEWA UNEP Division of Early Warning and Assessment
solving electrical problems; Mr. Mohammed Bila (Programme Analyst),
EU-INCO Project Sustainable development of Continental fisheries
for ensuring that computers work; Mr. Sédick Ahmed (Hydrologist) and
A regional study of policy options and policy formulation mechanisms
Mrs. Nana Ibrahim (Secretary).
for the Lake Chad Basin
FAO Food and Agriculture Organization of the United Nations
2
GIWA REGIONAL ASSESSMENT 43 LAKE CHAD BASIN
ACKNOWLEDGEMENT
3
GEF Global Environment Facility
Government of Cameroon
Government of Niger
ILEC International Lake Environment Committee
IRAD Institute of Agronomic Research
IUCN World Conservation Union
LCBC Lake Chad Basin Commission
ONU-SIDA Organisme des Nations Unies por la lutte contre le SIDA
The Ramsar Convention on Wetlands
Republic of Chad Meteorological Office
SODELAC Société de Development du Lac
UNECA United Nations Economic Commission for Africa
UNEP United Nations Environment Programme
UNESCO United Nations Educational, Scientific and Cultural Organization
University of Kalmar
USGS United States Geological Survey
WWF World Wide Fund For Nature (also known as World Wildlife Fund)
Acknowledgements are also extended to the individual contributions
and support from Dr. Arthur Neiland (IDDRA/EU-INCO), Dr. Michael Coe
(University of Wisconsin-Madison), Jamie Pittock (WWF - Living Waters
Programme), Neil Burgess (WWF Ecoregions), Dr. Madiodio Niasse
(IUCN), Mark Ernste, Zinta Zommers and Alfa Isaiku (UNEP GRID Sioux
Falls), Salif Diop, Pinya Sarasas and Patrick Mmayi (UNEP DEWA), Edith
Mussukuya (GIWA coordinator for the sub-Saharan Africa), David Smith
(UNEP DPDL), Laurent Granier (UNEP DEPI), Emmanuel Naah (UNESCO),
Anada Tiega (GEF Operations Manager), Stephen Maxwel Donkor
(UNECA), Elizabeth Migongo Bake and Elizabeth Maruma Mrema (DEPI),
and Ashbindu Singh (RONA).
Matthew Fortnam, GIWA consultant, has co-authored the report.
2
GIWA REGIONAL ASSESSMENT 43 LAKE CHAD BASIN
ACKNOWLEDGEMENT
3
Executive summary
The Lake Chad Basin (GIWA region 43) is located in central Africa
and flood recession cropping (FAO 1997). The Yedseram and Ngadda
covering 8% of the surface area of Africa, shared between the countries
sub-system and its tributaries rise in the Mandara Hil s and `loses' most
of Algeria, Cameroon, Central African Republic (CAR), Chad, Libya, Niger,
of its water while flowing northwards through a floodplain. From Sudan
Nigeria and Sudan. The Basin comprises a number of transboundary
in the east flow seasonal wadis (Wadi Kaya and Wadi Azum), whereas
waters that include three main aquifers and a network of catchment
from the north there is virtual y no surface flow.
rivers. The Lake Chad itself experiences a close interaction between
rainfal , evaporation, the generation of lateral inflow, groundwater
The Lake Chad Basin contains numerous ethnic groups, whose
leakage under the body of the Lake and human abstraction. Its water
language, legal and administrative systems are based upon traditional
supply is primarily from the Chari-Logone River, which provides
pre-colonial culture and the English and French colonial powers. The
approximately 95% of the total input and empties into the southern
population of the Lake Chad Basin has experienced rapid growth in the
pool, and the Komadugu-Yobe River, which contributes less than 2.5%
last decades (2.5 to 3 %) and is currently estimated to be over 37 million
and is the only river flowing into the northern pool. The water balance
(based on ORNL 2003). The people are involved in production activities
of the Lake is highly variable resulting in fluctuating open surface waters
dominated by the primary and tertiary sector with a predominance of
that have exhibited dramatic expansion and contraction over geologic
informal, low productivity activities such as agriculture, livestock rearing
and recent history (Servant & Servant 1983). In the last decades the
and fisheries. Industry, mining and manufacturing are less prominent
open water surface has reduced from approximately 25 000 km2 in
although oil abstraction has recently begun in Chad.
1973, to less than 2 000 km2 in the 1990s (Olivry et al. 1996, Grove 1996,
Coe & Foley 2001). The northern pool has not contained permanent
The countries are among the poorest in the world and are characterised
open waters for more than 25 years although recently there has been
by extremely slow and variable economic growth. For example Chad,
some flooding observed, associated with wet years in 1994 and 1999
was ranked 155th out of 162 countries in the United Nations 2001 Human
(Diouf 2000).
Development Index, with annual per capita income of only 200 USD and
GDP growing by barely 1.4% per year over 20 years (IMF 2003). Poverty
The Komadugu-Yobe River Basin is located in Nigeria and Niger and is
is widespread and is particularly acute in the countries in the south of
formed by various tributaries, in particular the Hadejia, Jama'are and
the Basin. This is reflected in the poor standard of health: excluding
Misau rivers that flow from the Jos Plateau (northern Nigeria). The
Algeria and Libya, the life expectancy of the Basin ranges from only
Chari-Logone River Basin is located in CAR, Cameroon and Chad and
43 years in CAR to 56 years in Sudan (World Bank 2002c). Illiteracy is a
contains various rivers that flow from the Mongos Hil s (CAR), as well
major hindrance to development in the region, with Niger having the
as the Adamawa Plateau and Mandara Mountains (Cameroon). The
lowest literacy rates in the world (World Bank 2002c).
major tributaries are the Pende, which become the Logone oriental
on entering Chad, and the Chari. There is seasonal flooding in both the
The bulk of water resources is used in agriculture fol owed by domestic
Chari-Logone and Komadugu-Yobe basins, which feeds the extensive
use. Access to safe drinking water in the Basin for domestic use is very
Waza-Logone floodplains and Hadejia-Nguru wetlands, respectively.
limited and water is mainly obtained using traditional methods. Sanitary
These are used extensively for pasture, fishing, flooded rice production
conditions for rural dwel ers are particularly poor with severely limited
4
GIWA REGIONAL ASSESSMENT 43 LAKE CHAD BASIN
EXECUTIVE SUMMARY
5
waste disposal facilities. Traditional agriculture in the Basin is general y
construction of water infrastructure, has been the immediate cause of
rain-fed, although farmers in the downstream regions rely on flood
anthropogenic stream flow modification. Water resources have been
farming and recessional farming. In the last 40 years there have been
used at an unsustainable level for the climatic scenario of the past
many large irrigation projects developed located predominantly in
40 years. The Maga Dam located in the Chari-Logone Basin and the
the Komadugu-Yobe Basin. There were also projects around the Lake
numerous dams located in the Komadugu-Yobe Basin have disrupted
Chad, but except for the farming of the polders, these projects are not
the timing and extent of the flooding of the Waza-Logone and Hadejia-
functioning.
Nguru wetlands, respectively. There are very prominent indicators of
freshwater shortage including the shrinkage of the Lake Chad by 90%
The Lake Chad Basin Commission (LCBC), an Inter Governmental
in the past four decades (Lemoal e 1991, USGS 2001) and reduced
Agency, has a responsibility to regulate and control the utilisation
river discharges, for example the mean discharge of the Chari-Logone
of water and other natural resources in the Basin. There are now five
River between 1970 and 1990 is 55% of the mean for 1950 to 1970
member countries: Chad, Niger, Nigeria, Cameroon, and CAR. Sudan
(Olivry et al. 1996). Freshwater shortage has impacted heavily on the
was admitted in 2000 but is yet to ratify the convention establishing the
Basin's economic activities including the fisheries, agriculture, animal
commission. Since 1989, in cooperation with the LCBC, there has been
husbandry, fuel wood provision and wetland economic services. There
a set of initiatives and studies aimed at improving the environmental
has been consequential food insecurity in the region and combined
situation in the region. These have included a Diagnostic study of
with a lack of potable water has had implications on the health status
environmental degradation in 1989, the formulation of a Master Plan
of the Basin's population. Social impacts of freshwater shortage have
and Action Programme in 1992 and a Strategic Action Plan in 1998.
included upstream/downstream conflict over who has the right to use
As a result a GEF project (UNDP/World Bank implemented) entitled
the diminishing water resources. Social tensions have also been further
"Reversal of Land and Water Degradation Trends in the Lake Chad Basin
provoked by the increased pressure on resources from the migration
Ecosystem" was initiated which entered its implementation stage in
of people from the drought stricken northern regions of the Basin into
September 2003.
areas surrounding the Lake and associated river basins.
The GIWA Assessment evaluated the relative importance of the different
Global change has influenced directly and indirectly al of the GIWA
impacts on the international aquatic system of the Lake Chad Basin. The
concerns (except for Pol ution) that affect the Lake Chad Basin.
environmental and socio-economic impacts were assessed for present
Climatic variability exerted throughout the history of the Basin is
and future conditions, and overal impacts and priorities were identified.
therefore considered as playing a key role in causing the fluctuations in
The GIWA Assessment ranked Freshwater shortage as severe and as
freshwater availability (Servant & Servant 1983). The GIWA Assessment
the priority concern, driving many of the other concerns. All the other
of global change refers to human induced changes. The role of
concerns except for Pollution have had a moderate impact. Although
anthropogenic climate change in the recent episode of freshwater
there has been significant modification of habitats and significant
shortage is undetermined. Several studies have demonstrated that
fluctuations in fish production, these are predominantly a function
rainfal events in particular have reduced and in turn led to drought
of freshwater shortage, rather than as a consequence of direct habitat
(Nicholson 1988, in Le Barbé & Lebel 1997). A comparison of isohyets of
modification or unsustainable exploitation of fish.
the 1950s, which is regarded as the wettest decade with the driest in
the 1980s showed considerable shift towards the south (LCBC 2000b).
The concerns for the Lake Chad Basin were ranked in descending
Changes in precipitation in the Sahel (that includes the Lake Chad Basin)
order:
have been linked with Sea Surface Temperature (SST) patterns. These
1. Freshwater shortage
patterns have been attributed to changes in the heat transfer between
2. Climate change
the southern and northern hemisphere that have been influenced by
3. Habitat and community modification
changes in deep ocean circulation, as well as the reduction in sea ice
4. Unsustainable exploitation of fish and other living resources
and an increase in sulphate aerosols (Evans 1996). Land anomalies are
5. Pollution
also believed to have played a role in the recent trend of climate change.
A combination of factors including vegetation cover, soil moisture,
Freshwater shortage has the highest severity of impact due to both
monsoon dynamics and SST is thought to best explain the reduction
climatic variability and anthropogenic freshwater shortage issues,
in rainfall in the Lake Chad Basin (Xue & Shukla 1997).
namely stream flow modification. Stream diversion, associated with the
4
GIWA REGIONAL ASSESSMENT 43 LAKE CHAD BASIN
EXECUTIVE SUMMARY
5
Habitat and community modification of the aquatic ecosystems has
The GIWA regional experts predict that al of the GIWA concerns wil
been experienced in both the Lake and river environments. Intensive
increase in severity by the year 2020. Consequently, the concerns
cultivation and large numbers of domestic animals have degraded the
of freshwater shortage, habitat and community modification,
wetland ecosystems. The primary reason for the reduction in the extent
unsustainable exploitation of living resources, and global change
of the wetlands has been attributed to the changes in the seasonal
are predicted to have severe impacts on the ecosystems and
timing and extent of flooding. Consequently since the 1960s wetland
population of the Lake Chad Basin. The threat of pol ution, which is
resources in the Basin, such as the Yaérés in Cameroon and Hadejia-
currently assessed as having a slight impact, is predicted to become
Nguru in Nigeria, have been reduced by almost 50% (Barbier et al. 1997).
increasingly significant in the future. The fol owing are predicted to
Furthermore, the fish habitat in the Lake has altered from being an open
be major factors in control ing the future severity of the concerns in
water environment to being a predominantly marshy environment. The
the region:
fish species composition has changed to reflect this (Benech et al. 1983,
Climate change;
Benech & Quensičre 1989, Neiland & Béné 2003). However, although
Further water development projects;
there has been significant habitat modification this has been largely a
Increased demographic pressure;
consequence of the freshwater shortage situation.
Increased demand of water;
Oil development;
The unsustainable exploitation of the fish and other living resources was
Increased use of agro-chemicals.
not considered as the primary reason for the fluctuations in fisheries
production experienced over the past four decades. It is difficult to
The Causal chain analysis determined the root causes of the prioritised
talk of fisheries in terms of sustainability in such a natural y fluctuating
freshwater shortage concern, that have resulted in the unsustainable
environment. Freshwater shortage and the consequential habitat
use of freshwater resources in the climatic scenario experienced in the
modification were regarded as the main influencing factors. Prior to
Lake Chad Basin over the past 40 years.
the drought years the fisheries had developed rapidly with fishing
effort increasing by 50 times between 1967-1972 (Durand 1973). The
Root causes for Chari-Logone and Lake Chad sub-system
contracting lake and wetlands caused fish to be concentrated and more
Demographic: Pressures from rapid population growth and
vulnerable to fishing gears and eventual y the fisheries col apsed in the
environmental refugees escaping drought in the northern regions
northern pool fol owed by the southern pool fisheries in 1982. The
of the Basin and from fishermen migrating fol owing the receding
fishing communities migrated eastwards fol owing the receding waters,
lake waters.
and they also changed their livelihood strategies to take advantage of
the fertile lake recessional floor for agriculture. Since 1982, the fisheries
Economic: Poverty in the sub-system is widespread and for their
have shown a good recovery, which demonstrates the Lake's ability
short-term survival communities employ practices which are
to regenerate the fish stocks during periods of greater freshwater
harmful to the environment.
availability (Neiland & Béné 2003). A major concern regarding the
fisheries is that of socio-economic differentiation, as the `poor' critical y
Knowledge: There are extreme deficiencies in information
do not have access to the fisheries resource (Béné et al. 2002).
availability and public awareness in the Chari-Logone/Lake Chad
sub-system and the countries have difficulties cooperating and
Pollution is presumed, due to the lack of industry and relatively limited
sharing information. There is also a lack of knowledge predicting
and localised application of agricultural fertilisers, to have the least
the future climate changes and the impact changes wil have on
impact out of al the GIWA concerns assessed. However, cotton and
the region.
rice industries are known to use large quantities of agro-chemicals and
therefore chemical pol ution is not out of the question. The distribution
Legal: There is no water al ocation agreement existing between
and quantity of these chemicals in the environment is not known. In
the riparian countries. There are no legal instruments to
general it is considered that pol ution is discharged in quantities that
enforce agreements and there are weaknesses in the Fort Lamy
do not exceed the ecosystem's assimilative capacity. However, further
Convention established in 1964. Not al member States of LCBC
studies are needed to scientifical y justify this presumption; there
have water laws in place that uphold the principles of sustainable
is currently a severe lack of monitoring and information networks
water management and where there are semblances of law, the
regarding pollution.
provisions are not administered and enforced. Governments of
6
GIWA REGIONAL ASSESSMENT 43 LAKE CHAD BASIN
EXECUTIVE SUMMARY
7
member States do not comply with the Fort Lamy Convention that
mechanism to harmonise the activities of the water users. Water
requires them to give prior notification on their proposed projects;
management institutions are only concerned with meeting their
they only notify LCBC of donor-funded projects.
water requirements, with minimal or no concern for the impacts of
their activities on other users (Bdilya et al. 1999). Management is also
Governance: There is no integrated management strategy in the
fragmented with il -defined and often conflicting responsibilities
sub-system; there are conflicting policies between government
between government agencies and stakeholders. The hydro-
departments; a short-term policy focus has resulted in unsustainable
agricultural schemes were planned with minimal stakeholder
management; there has been insufficient account of the impacts of
involvement and without consideration of the climatic variability of
stream flow modification from the Maga Dam and on downstream
the region and the impact reduced flows would have on downstream
humans and ecosystems; there was a lack of stakeholder
communities. Water use by these irrigation projects continues to be
involvement in the initial planning and implementation of and
inefficient due to poor water use management, which continues
management of the SEMRY project (a large-scale irrigation project);
to lack measures aimed at conserving water resources. There is no
and there is highly inefficient and poor water use management.
known system in place to monitor return flows from large irrigation
schemes in the basin if there are return flows.
Root causes for Komadugu-Yobe sub-system
Traditional management systems: The rural population is highly
Demographic: The sub-system's population has experienced rapid
differentiated and the poor, critical y, do not have access to fishing
growth and is the most densely populated river basin in the region.
and farming resources (Béné et al. 2002).
It is estimated to represent over 55% of the Lake Chad Basin's total
population. This has put increasing pressure on the water resources
Despite many of the root causes being identified by the Lake Chad Basin
in the region.
Commission Master Plan (LCBC 1992), and subsequent Strategic Action
Plan (SAP) (LCBC 1998), recommendations have not been developed
Economic: Endemic poverty in the region is a catalyst for
into projects for implementation. Downstream users are stil being
environmental degradation because for short-term survival natural
deprived of adequate water supplies to meet their water requirements.
resources are exploited at an unsustainable level. Upstream water
Attempts to mobilise domestic and external resources are not helped
diversion did not take into account the essential income and
by the absence of integrated land and water resources management
nutrition benefits for local populations from the Hadejia-Nguru
strategies, investment plans and effective coordination (LCBC 2000b).
wetlands (Barbier 1997). Large irrigation and water development
projects are thought to have provided more negative economic
Policy options
impacts than positive (IUCN 2002).
The policy option analysis aims to describe alternative courses of action
that may be taken by policy-makers in the region, and discusses the
Legal: There is no water al ocation law between Federal Nigerian
projected outcomes and trade-offs of each action. These actions should
States or between Nigeria and Niger. Customary rights established
address the root causes identified during the Causal chain analysis.
by traditional management systems remain highly influential. The
The GIWA Policy option analysis firstly discussed basin wide options
rules and regulations for the administration and enforcement of
fol owed by projects under discussion for the Chari-Logone and Lake
the Nigerian Water Resources Decree 101 of 1993 has not been
Chad sub-system and Komadugu-Yobe sub-system.
published (gazetted).
The fol owing options were discussed for the entire Lake Chad Basin:
Knowledge: There is poor information dissemination, particularly to
1. Implementation of the GEF project "Reversal of Land and Water
the traditional communities; weak information sharing networks;
Degradation Trends in the Lake Chad Basin Ecosystem".
and limited pollution monitoring and regulations. Currently, there
2. Water al ocation agreement.
is a lack of knowledge of future climate changes, which is hindering
3. Inter-basin water transfer.
sound water management planning.
The fol owing projects were discussed for the Chari-Logone and Lake
Governance: There is no overal water management strategy for
Chad sub-system:
the Komadugu-Yobe River Basin (Bdliya et al. 1999) and the most
4a. Reinundation of the Waza-Logone floodplains (Chari-Logone sub-
acute obstacle in achieving this is the absence of a coordinating
system).
6
GIWA REGIONAL ASSESSMENT 43 LAKE CHAD BASIN
EXECUTIVE SUMMARY
7
4b. Assessment of changing land use in the head waters of the Chari-
more efficiently and would be an effective tool for long-term water
Logone sub-system.
demand management as part of the wider al ocation of water in the
5. Chad-Niger Transboundary Project to Combat Sand Dunes and
basin.
Reverse Water Degradation Trends in Lake Chad (Lake Chad sub-
system).
The GIWA Assessment recommends the fol owing actions in priority
order:
The fol owing projects were discussed for the Komadugu-Yobe sub-
1. Continued development of recommendations made by the Master
system:
Plan and Strategic Action Plan.
6. Grant subsidies to irrigation farmers in northern Nigeria for
2. Implementation of the GEF project for the "Reversal of Land and
implementing water conservation measures (Komadugu-Yobe
Water Degradation Trends in the Lake Chad Basin Ecosystem".
sub-system).
3. A draft agreement on the equitable and reasonable al ocation of
7. Maintenance and improvements for the safety and improved
water resources should be negotiated, finalised and ratified by
efficiency of dams and stream flow in the Komadugu-Yobe Basin.
member States (Option 2).
4. The reinundation of the Waza-Logone and Hadejia-Nguru wetlands
Following an analysis of the above options it was concluded that the
(Option 4a), according to flow rates stipulated by Option 2.
recommendations made by the LCBC Master Plan and SAP (LCBC 1998)
5. Maintenance and improvements in safety and efficiency of dams
addressed many of the root causes identified during the Causal
and stream flow in both the Chari-Logone and Komadugu-Yobe
chain analysis. The GEF project entitled "Reversal of Land and Water
basins (Option 7), to ensure the effective implementation of the
Degradation Trends in the Lake Chad Basin Ecosystem" is beginning to
water al ocation agreement.
implement prioritised recommendations made by the Master Plan and
6. Feasibility study of water conservation techniques suitable for
SAP. Therefore, as a prerequisite, the GIWA Assessment recommends
selected project sites (related to Option 6).
that the GEF project be implemented "to build capacity within the Lake
Chad Basin Commission (LCBC) and its national committees so that it
can better achieve its mandate of managing land and water resources
in the greater conventional basin of Lake Chad" (World Bank 2002a).
As a subsidiary priority to the strengthening of capacity in the LCBC, a
water allocation agreement (Option 2) would be a key legal instrument in
addressing the inequitable al ocation of the water resources in the Lake
Chad Basin. A water al ocation agreement enforced and coordinated
by a strengthened LCBC is necessary if integrated management of
the Basin is to be achieved. The implementation of a water al ocation
agreement will address the root causes: i) lack of coordination; ii) legal -
no water al ocation law; and i i) lack of capacity to promote compliance.
The reinundation of the Waza-Logone floodplains (Option 4a) can be
incorporated within the flow rates stipulated by this legal framework, so
that increased flooding can restore floodplain economic activities. Dam
maintenance and enhancement, and the improvement of stream flow
(Option 7) will allow the effective implementation of Option 2 (water
al ocation agreement) and Option 4a by al owing greater control and
efficiency of water conveyance. The GIWA Assessment recommends
Option 6 (water conservation) as a possible means of increasing
freshwater availability and addressing the root causes of poor water
management and the lack of incentives to promote compliance. The
implementation of water conservation measures would al ow water
supplies that are available in the Komadugu-Yobe system to be used
8
GIWA REGIONAL ASSESSMENT 43 LAKE CHAD BASIN
Abbreviations and acronyms
AEO........................African Environment Outlook
HJRBDA...............Hadejia-Jama'are River Basin Development Authority
CACID...................Cellule d'Appui a la Conservation et aux Initiatives de
HNWCP ...............Hadejia-Nguru Wetlands Conservation Project
Développement Durable
ICB..........................International Competitive Bidding
CAR........................Central African Republic
ILEC. . . . . . . . . . . . .International Lake Environment Committee Foundation
CBD........................Convention on Biodiversity
IPCC.......................Intergovernmental Panel on Climate Change
CBDA ....................Chad Basin Development Authority
ITCZ .......................Inter-Tropical Convergence Zone
CCA........................Causal Chain Analysis
IUCN......................World Conservation Union
CICOS ...................Commission Internationale du Bassin du Congo-
IUCN-BRAO.......IUCN's Regional Office for West Africa
Ubangi-Sangha
KCWS....................Kano City Water Supply
CCNEDD. . . . . . . . .National Consultive Committee on the Environment and
JEWEL...................Jigawa Enhancement of Wetlands Livelihood project
Sustainable Development (Cameroon)
KRIP .......................Kano River Irrigation Project
CNEDD. . . . . . . . . . .National Council for the Environment and Sustainable
LCBC......................Lake Chad Basin Commission
Development (Niger)
NAP........................National Action Plan
CPUE.....................Catch per Unit Effort
NEAZDP..............North East Arid Zone Development Programme
DRC........................Democratic Republic of Congo
NRBDCC. . . . . . . .National River Basin Development Coordinating
DSS.........................Decision Support System Project
Committee
EIA ..........................Environmental Impact Assessment
ONG KARKARA. Association Nigérienne pour la Dynamisation des
EPP.........................Emergency Preparedness Plan
Initiatives locales
FAO........................Food and Agriculture Organization of the United
OP...........................Operational Policy
Nations
ORSTOM.............Institut Français de Recherche Scientifique pour le
FEPA ......................Federal Environmental Protection Agency
développement en Coopération
FEWS.....................Famine Early Warning System
PDRM ...................Programme du Développement dans la Région des
FCT.........................Federal Capital Territory
Monts Mandara
FME........................Federal Ministry of Environment
PDRN ....................Programme du Développement pour la Région du
FMWR...................Federal Ministry of Water Resources
Nord
GCM......................Global Climate Model
PIR...........................Project Implementation Review
GEF.........................Global Environment Facility
PMU.......................Project Management Unit
GEO .......................Global Environment Outlook
PTF.........................Project Task Force
GKWS ...................Greater Kano Water Supply
RBDA.....................River Basin Development Authority
GNI.........................Gross National Income
SAP.........................Strategic Action Plan
HCNE ....................National High Committee on the Environment (Chad)
SCIP .......................South Chad Irrigation Project
HDI.........................Human Development Index
SECADEV............Le projet de Secours Catholique pour le
HIA .........................Transboundary Health Impact Assessment
Développement
ABBREVIATIONS AND ACRONYMS
9
SEMRY..................Rice Development Authority (Société pour l'Expansion
et la Modernisation de la Riziculture dans la région de
Yagoua)
SODELAC............Lake Chad Development Society (Société pour le
Développment du Lac)
SST .........................Sea Surface Temperatures
STAP ......................Scientific and Technical Advisory Program
TDA........................Transboundary Diagnostic Analysis
UNAIDS ...............Joint United Nations Programme on HIV/AIDS
UNCCD................United Nations Convention to Combat Desertification
UNCED. . . . . . . . . . .United Nations Conference on Environment and
Development
UNDESA..............United Nations Department of Economic and Social
Affairs
UNDP....................United Nations Development Programme
UNECA.................United Nations Economic Commission for Africa
UNESCO..............United Nations Educational, Scientific and Cultural
Organization
UNEP.....................United Nations Environment Programme
UNPP ....................United Nations Population Division
USGS.....................United States Geological Survey
WEHAB ................Water, Energy, Health, Agriculture and Biodiversity
WFP .......................United Nations World Food Programme
WHO .....................World Health Organization
WIWO...................Foundation Working Group International Waterbird
and Wetland Research
WLP .......................Waza-Logone Project
WPI.........................Water Poverty Index
WRI.........................World Resources Institute
WSSD....................World Summit on Sustainable Development
10
GIWA REGIONAL ASSESSMENT 43 LAKE CHAD BASIN
ABBREVIATIONS AND ACRONYMS
11
List of figures
Figure 1
The Lake Chad Basin. . . . . . . . . . . . . . . . . . . . . . . . . . . . . . . . . . . . . . . . . . . . . . . . . . . . . . . . . . . . . . . . . . . . . . . . . . . . . . . . . . . . . . . . . . . . . . . . . . . . . . . . . . . . . . . . . . . . . . . . . . . . . . . . . . . . . . . . . . . . 13
Figure 2
Area coverage per country within the Lake Chad Basin (km2) . . . . . . . . . . . . . . . . . . . . . . . . . . . . . . . . . . . . . . . . . . . . . . . . . . . . . . . . . . . . . . . . . . . . . . . . . . . . . . . . . . . . . . . . . . . . . . . . . . . 14
Figure 3
Ahaggar Mountains, Algeria . . . . . . . . . . . . . . . . . . . . . . . . . . . . . . . . . . . . . . . . . . . . . . . . . . . . . . . . . . . . . . . . . . . . . . . . . . . . . . . . . . . . . . . . . . . . . . . . . . . . . . . . . . . . . . . . . . . . . . . . . . . . . . . . . . . 14
Figure 4
Schematic hydro-geological cross section . . . . . . . . . . . . . . . . . . . . . . . . . . . . . . . . . . . . . . . . . . . . . . . . . . . . . . . . . . . . . . . . . . . . . . . . . . . . . . . . . . . . . . . . . . . . . . . . . . . . . . . . . . . . . . . . . . . . . . 15
Figure 5
Rainfall distribution . . . . . . . . . . . . . . . . . . . . . . . . . . . . . . . . . . . . . . . . . . . . . . . . . . . . . . . . . . . . . . . . . . . . . . . . . . . . . . . . . . . . . . . . . . . . . . . . . . . . . . . . . . . . . . . . . . . . . . . . . . . . . . . . . . . . . . . . . . . 16
Figure 6
Annual distribution of rainfall in Chad. Readings from eleven meteorological stations (1932-1999).. . . . . . . . . . . . . . . . . . . . . . . . . . . . . . . . . . . . . . . . . . . . . . . . . . . . . . . . . . . . 16
Figure 7
Dust storms from the Sahara regularly whip through central Africa. . . . . . . . . . . . . . . . . . . . . . . . . . . . . . . . . . . . . . . . . . . . . . . . . . . . . . . . . . . . . . . . . . . . . . . . . . . . . . . . . . . . . . . . . . . . . 17
Figure 8
The five main climatic zones found in the Lake Chad region . . . . . . . . . . . . . . . . . . . . . . . . . . . . . . . . . . . . . . . . . . . . . . . . . . . . . . . . . . . . . . . . . . . . . . . . . . . . . . . . . . . . . . . . . . . . . . . . . . . . 17
Figure 9
Bathymetric map of Lake Chad 1983. . . . . . . . . . . . . . . . . . . . . . . . . . . . . . . . . . . . . . . . . . . . . . . . . . . . . . . . . . . . . . . . . . . . . . . . . . . . . . . . . . . . . . . . . . . . . . . . . . . . . . . . . . . . . . . . . . . . . . . . . . . 18
Figure 10 Evolution of Lake Chad in the last millennium . . . . . . . . . . . . . . . . . . . . . . . . . . . . . . . . . . . . . . . . . . . . . . . . . . . . . . . . . . . . . . . . . . . . . . . . . . . . . . . . . . . . . . . . . . . . . . . . . . . . . . . . . . . . . . . . . . 19
Figure 11 Evidence of sand dunes formed 20 000 to 13 000 years ago (red arrow) . . . . . . . . . . . . . . . . . . . . . . . . . . . . . . . . . . . . . . . . . . . . . . . . . . . . . . . . . . . . . . . . . . . . . . . . . . . . . . . . . . . . . . . . . 19
Figure 12 Open surface area of Lake Chad (1960-1999) . . . . . . . . . . . . . . . . . . . . . . . . . . . . . . . . . . . . . . . . . . . . . . . . . . . . . . . . . . . . . . . . . . . . . . . . . . . . . . . . . . . . . . . . . . . . . . . . . . . . . . . . . . . . . . . . . . 20
Figure 13 Measuring water levels at Kindjeria (centre of northern pool) in 1975 . . . . . . . . . . . . . . . . . . . . . . . . . . . . . . . . . . . . . . . . . . . . . . . . . . . . . . . . . . . . . . . . . . . . . . . . . . . . . . . . . . . . . . . . . . 20
Figure 14 Monthly average discharge from Chari-Logone River at N´Djamena (1933-1991) . . . . . . . . . . . . . . . . . . . . . . . . . . . . . . . . . . . . . . . . . . . . . . . . . . . . . . . . . . . . . . . . . . . . . . . . . . . . . . . 21
Figure 15 The main rivers in the Lake Chad Basin . . . . . . . . . . . . . . . . . . . . . . . . . . . . . . . . . . . . . . . . . . . . . . . . . . . . . . . . . . . . . . . . . . . . . . . . . . . . . . . . . . . . . . . . . . . . . . . . . . . . . . . . . . . . . . . . . . . . . . . . 22
Figure 16 Ecoregions of the Lake Chad Basin. . . . . . . . . . . . . . . . . . . . . . . . . . . . . . . . . . . . . . . . . . . . . . . . . . . . . . . . . . . . . . . . . . . . . . . . . . . . . . . . . . . . . . . . . . . . . . . . . . . . . . . . . . . . . . . . . . . . . . . . . . . . . 24
Figure 17 Sahara Desert in Libya. . . . . . . . . . . . . . . . . . . . . . . . . . . . . . . . . . . . . . . . . . . . . . . . . . . . . . . . . . . . . . . . . . . . . . . . . . . . . . . . . . . . . . . . . . . . . . . . . . . . . . . . . . . . . . . . . . . . . . . . . . . . . . . . . . . . . . . . . 24
Figure 18 Sparse and short wetland vegetation (e.g. Oryza longistaminata) growing in open water . . . . . . . . . . . . . . . . . . . . . . . . . . . . . . . . . . . . . . . . . . . . . . . . . . . . . . . . . . . . . . . . . . . . . 27
Figure 19 Estimated population in Lake Chad Basin (2002) . . . . . . . . . . . . . . . . . . . . . . . . . . . . . . . . . . . . . . . . . . . . . . . . . . . . . . . . . . . . . . . . . . . . . . . . . . . . . . . . . . . . . . . . . . . . . . . . . . . . . . . . . . . . . . 29
Figure 20 Population density . . . . . . . . . . . . . . . . . . . . . . . . . . . . . . . . . . . . . . . . . . . . . . . . . . . . . . . . . . . . . . . . . . . . . . . . . . . . . . . . . . . . . . . . . . . . . . . . . . . . . . . . . . . . . . . . . . . . . . . . . . . . . . . . . . . . . . . . . . . . 30
Figure 21 Population structure in the Lake Chad region. . . . . . . . . . . . . . . . . . . . . . . . . . . . . . . . . . . . . . . . . . . . . . . . . . . . . . . . . . . . . . . . . . . . . . . . . . . . . . . . . . . . . . . . . . . . . . . . . . . . . . . . . . . . . . . . . . 30
Figure 22 Doba oil field (Chad) and Cameroon pipeline. . . . . . . . . . . . . . . . . . . . . . . . . . . . . . . . . . . . . . . . . . . . . . . . . . . . . . . . . . . . . . . . . . . . . . . . . . . . . . . . . . . . . . . . . . . . . . . . . . . . . . . . . . . . . . . . . . . 31
Figure 23 Distribution of irrigated areas . . . . . . . . . . . . . . . . . . . . . . . . . . . . . . . . . . . . . . . . . . . . . . . . . . . . . . . . . . . . . . . . . . . . . . . . . . . . . . . . . . . . . . . . . . . . . . . . . . . . . . . . . . . . . . . . . . . . . . . . . . . . . . . . . 32
Figure 24 Typical Zebru cattle that have been sold to slaughter-house for production of dried meat . . . . . . . . . . . . . . . . . . . . . . . . . . . . . . . . . . . . . . . . . . . . . . . . . . . . . . . . . . . . . . . . . . . . . 32
Figure 25 Alestes baremoze (Silversides) . . . . . . . . . . . . . . . . . . . . . . . . . . . . . . . . . . . . . . . . . . . . . . . . . . . . . . . . . . . . . . . . . . . . . . . . . . . . . . . . . . . . . . . . . . . . . . . . . . . . . . . . . . . . . . . . . . . . . . . . . . . . . . . . . 33
Figure 26 Lates niloticus (Nile perch). . . . . . . . . . . . . . . . . . . . . . . . . . . . . . . . . . . . . . . . . . . . . . . . . . . . . . . . . . . . . . . . . . . . . . . . . . . . . . . . . . . . . . . . . . . . . . . . . . . . . . . . . . . . . . . . . . . . . . . . . . . . . . . . . . . . . 33
Figure 27 Gross National Income per capita of riparian countries . . . . . . . . . . . . . . . . . . . . . . . . . . . . . . . . . . . . . . . . . . . . . . . . . . . . . . . . . . . . . . . . . . . . . . . . . . . . . . . . . . . . . . . . . . . . . . . . . . . . . . . . 34
Figure 28 Population below international poverty line. . . . . . . . . . . . . . . . . . . . . . . . . . . . . . . . . . . . . . . . . . . . . . . . . . . . . . . . . . . . . . . . . . . . . . . . . . . . . . . . . . . . . . . . . . . . . . . . . . . . . . . . . . . . . . . . . . . 34
Figure 29 Freshwater withdrawal per person per day by economic sector . . . . . . . . . . . . . . . . . . . . . . . . . . . . . . . . . . . . . . . . . . . . . . . . . . . . . . . . . . . . . . . . . . . . . . . . . . . . . . . . . . . . . . . . . . . . . . . . 37
Figure 30 Protected wetland in Chad Basin National Park, Nigeria . . . . . . . . . . . . . . . . . . . . . . . . . . . . . . . . . . . . . . . . . . . . . . . . . . . . . . . . . . . . . . . . . . . . . . . . . . . . . . . . . . . . . . . . . . . . . . . . . . . . . . . 40
Figure 31 Annual rainfall at N'Djamena . . . . . . . . . . . . . . . . . . . . . . . . . . . . . . . . . . . . . . . . . . . . . . . . . . . . . . . . . . . . . . . . . . . . . . . . . . . . . . . . . . . . . . . . . . . . . . . . . . . . . . . . . . . . . . . . . . . . . . . . . . . . . . . . . 43
Figure 32 Interannual isohyets . . . . . . . . . . . . . . . . . . . . . . . . . . . . . . . . . . . . . . . . . . . . . . . . . . . . . . . . . . . . . . . . . . . . . . . . . . . . . . . . . . . . . . . . . . . . . . . . . . . . . . . . . . . . . . . . . . . . . . . . . . . . . . . . . . . . . . . . . . 44
Figure 33 Lake Chad level variation and yearly precipitation at Bol . . . . . . . . . . . . . . . . . . . . . . . . . . . . . . . . . . . . . . . . . . . . . . . . . . . . . . . . . . . . . . . . . . . . . . . . . . . . . . . . . . . . . . . . . . . . . . . . . . . . . . 44
Figure 34 Interannual variations in discharge for the Chari River at N'Djamena . . . . . . . . . . . . . . . . . . . . . . . . . . . . . . . . . . . . . . . . . . . . . . . . . . . . . . . . . . . . . . . . . . . . . . . . . . . . . . . . . . . . . . . . . 46
Figure 35 SEMRY project and Waza-Logone floodplain, north Cameroon. . . . . . . . . . . . . . . . . . . . . . . . . . . . . . . . . . . . . . . . . . . . . . . . . . . . . . . . . . . . . . . . . . . . . . . . . . . . . . . . . . . . . . . . . . . . . . . . 47
Figure 36 The Tiga Dam (Hadejia river system, north Nigeria). . . . . . . . . . . . . . . . . . . . . . . . . . . . . . . . . . . . . . . . . . . . . . . . . . . . . . . . . . . . . . . . . . . . . . . . . . . . . . . . . . . . . . . . . . . . . . . . . . . . . . . . . . . . 48
Figure 37 New town on the Cameroon shore, 1989. . . . . . . . . . . . . . . . . . . . . . . . . . . . . . . . . . . . . . . . . . . . . . . . . . . . . . . . . . . . . . . . . . . . . . . . . . . . . . . . . . . . . . . . . . . . . . . . . . . . . . . . . . . . . . . . . . . . . . . 49
Figure 38 Women fetching water from a well in southern Niger . . . . . . . . . . . . . . . . . . . . . . . . . . . . . . . . . . . . . . . . . . . . . . . . . . . . . . . . . . . . . . . . . . . . . . . . . . . . . . . . . . . . . . . . . . . . . . . . . . . . . . . . . . 50
Figure 39 Food security in Africa . . . . . . . . . . . . . . . . . . . . . . . . . . . . . . . . . . . . . . . . . . . . . . . . . . . . . . . . . . . . . . . . . . . . . . . . . . . . . . . . . . . . . . . . . . . . . . . . . . . . . . . . . . . . . . . . . . . . . . . . . . . . . . . . . . . . . . . . . 53
Figure 40 Risk of human-induced desertification in Africa . . . . . . . . . . . . . . . . . . . . . . . . . . . . . . . . . . . . . . . . . . . . . . . . . . . . . . . . . . . . . . . . . . . . . . . . . . . . . . . . . . . . . . . . . . . . . . . . . . . . . . . . . . . . . . . 60
Figure 41 Vulnerability to desertification . . . . . . . . . . . . . . . . . . . . . . . . . . . . . . . . . . . . . . . . . . . . . . . . . . . . . . . . . . . . . . . . . . . . . . . . . . . . . . . . . . . . . . . . . . . . . . . . . . . . . . . . . . . . . . . . . . . . . . . . . . . . . . . . 60
Figure 42 A millet field during the dry season, after the farmer has cleared it from remaining millet stalks . . . . . . . . . . . . . . . . . . . . . . . . . . . . . . . . . . . . . . . . . . . . . . . . . . . . . . . . . . . . . . . 62
Figure 43 Fish production from Lake Chad obtained from road traffic census of dried fish at entry to Maiduguri from Baga Kawa (Nigeria) and N'Djamena (Chad) . . . . . 66
Figure 44 Illustration of the driving influence of the GIWA freshwater shortage concern on the other assessed concerns and the
associated environmental and social impacts . . . . . . . . . . . . . . . . . . . . . . . . . . . . . . . . . . . . . . . . . . . . . . . . . . . . . . . . . . . . . . . . . . . . . . . . . . . . . . . . . . . . . . . . . . . . . . . . . . . . . . . . . . . . . . . . . 75
Figure 45 Model indicating the inter-linkage and synergies between the concerns of the Lake Chad Basin . . . . . . . . . . . . . . . . . . . . . . . . . . . . . . . . . . . . . . . . . . . . . . . . . . . . . . . . . . . . . . . 78
Figure 46 The Chari-Logone and Lake Chad sub-system . . . . . . . . . . . . . . . . . . . . . . . . . . . . . . . . . . . . . . . . . . . . . . . . . . . . . . . . . . . . . . . . . . . . . . . . . . . . . . . . . . . . . . . . . . . . . . . . . . . . . . . . . . . . . . . . . 80
Figure 47 Causal chain analysis model for Chari-Logone/Lake Chad sub-system . . . . . . . . . . . . . . . . . . . . . . . . . . . . . . . . . . . . . . . . . . . . . . . . . . . . . . . . . . . . . . . . . . . . . . . . . . . . . . . . . . . . . . . . 82
Figure 48 Chari River at N'Djamena in Chad . . . . . . . . . . . . . . . . . . . . . . . . . . . . . . . . . . . . . . . . . . . . . . . . . . . . . . . . . . . . . . . . . . . . . . . . . . . . . . . . . . . . . . . . . . . . . . . . . . . . . . . . . . . . . . . . . . . . . . . . . . . . . 85
Figure 49 Komadugu-Yobe sub-system . . . . . . . . . . . . . . . . . . . . . . . . . . . . . . . . . . . . . . . . . . . . . . . . . . . . . . . . . . . . . . . . . . . . . . . . . . . . . . . . . . . . . . . . . . . . . . . . . . . . . . . . . . . . . . . . . . . . . . . . . . . . . . . . . . 88
Figure 50 Causal chain analysis model for Komadugu-Yobe sub-system . . . . . . . . . . . . . . . . . . . . . . . . . . . . . . . . . . . . . . . . . . . . . . . . . . . . . . . . . . . . . . . . . . . . . . . . . . . . . . . . . . . . . . . . . . . . . . . . . 90
10
GIWA REGIONAL ASSESSMENT 43 LAKE CHAD BASIN
ABBREVIATIONS AND ACRONYMS
11
List of tables
Table 1
Tentative illustration of the theoretical water balance of Lake Chad under steady state assumptions for two climatic scenarios . . . . . . . . . . . . . . . . . . . . . . . . . . . . . . . . 19
Table 2
The region's household sources of income . . . . . . . . . . . . . . . . . . . . . . . . . . . . . . . . . . . . . . . . . . . . . . . . . . . . . . . . . . . . . . . . . . . . . . . . . . . . . . . . . . . . . . . . . . . . . . . . . . . . . . . . . . . . . . . . . . . . . 30
Table 3
Market characteristics of fish passing through the three main markets of Lake Chad Basin, June 2000 to May 2001 . . . . . . . . . . . . . . . . . . . . . . . . . . . . . . . . . . . . . . . . . . . . 33
Table 4
Health and education indicators . . . . . . . . . . . . . . . . . . . . . . . . . . . . . . . . . . . . . . . . . . . . . . . . . . . . . . . . . . . . . . . . . . . . . . . . . . . . . . . . . . . . . . . . . . . . . . . . . . . . . . . . . . . . . . . . . . . . . . . . . . . . . . 35
Table 5
Technical details on major dams in the Lake Chad Basin . . . . . . . . . . . . . . . . . . . . . . . . . . . . . . . . . . . . . . . . . . . . . . . . . . . . . . . . . . . . . . . . . . . . . . . . . . . . . . . . . . . . . . . . . . . . . . . . . . . . . . . 38
Table 6
Scoring table for Lake Chad Basin . . . . . . . . . . . . . . . . . . . . . . . . . . . . . . . . . . . . . . . . . . . . . . . . . . . . . . . . . . . . . . . . . . . . . . . . . . . . . . . . . . . . . . . . . . . . . . . . . . . . . . . . . . . . . . . . . . . . . . . . . . . . . 42
Table 7
Wood supply and demand in the Lake Chad Basin (Nigerian sector) for 1989 . . . . . . . . . . . . . . . . . . . . . . . . . . . . . . . . . . . . . . . . . . . . . . . . . . . . . . . . . . . . . . . . . . . . . . . . . . . . . . . . . . 63
Table 8
The overall rating and justification for the GIWA assessed concerns . . . . . . . . . . . . . . . . . . . . . . . . . . . . . . . . . . . . . . . . . . . . . . . . . . . . . . . . . . . . . . . . . . . . . . . . . . . . . . . . . . . . . . . . . . . . . 74
Table 9
The economic costs of flood loss in the Waza-Logone region . . . . . . . . . . . . . . . . . . . . . . . . . . . . . . . . . . . . . . . . . . . . . . . . . . . . . . . . . . . . . . . . . . . . . . . . . . . . . . . . . . . . . . . . . . . . . . . . . . 84
Table 10
Current requirements of water uses (domestic, irrigation, traditional flood and recessional farming, and livestock) that have already been developed . . . . . . . . 89
Table 11
Summary of root causes . . . . . . . . . . . . . . . . . . . . . . . . . . . . . . . . . . . . . . . . . . . . . . . . . . . . . . . . . . . . . . . . . . . . . . . . . . . . . . . . . . . . . . . . . . . . . . . . . . . . . . . . . . . . . . . . . . . . . . . . . . . . . . . . . . . . . . . 95
Table 12
The incremental benefit of reinundation over current situation. . . . . . . . . . . . . . . . . . . . . . . . . . . . . . . . . . . . . . . . . . . . . . . . . . . . . . . . . . . . . . . . . . . . . . . . . . . . . . . . . . . . . . . . . . . . . . . 101
Table 13
Relationship between water resources and both current and potential water requirements for the Hadejia, Jama'are and Yobe river systems . . . . . . . . . . . . . . . . 104
Table 14
Evaluation of priority recommended option, using criteria stipulated by GIWA regional experts . . . . . . . . . . . . . . . . . . . . . . . . . . . . . . . . . . . . . . . . . . . . . . . . . . . . . . . . . . . . . . 107
Table 15
Evaluation of recommended options to improve the allocation of freshwater, using criteria stipulated by GIWA regional experts . . . . . . . . . . . . . . . . . . . . . . . . . . . . . 110
Table 16
Evaluation of recommended option to increase freshwater availability using criteria stipulated by GIWA regional experts. . . . . . . . . . . . . . . . . . . . . . . . . . . . . . . . . . . . 115
List of boxes
Box 1
Chronology of Lake Chad variability: 1960s to present . . . . . . . . . . . . . . . . . . . . . . . . . . . . . . . . . . . . . . . . . . . . . . . . . . . . . . . . . . . . . . . . . . . . . . . . . . . . . . . . . . . . . . . . . . . . . . . . . . . . . . . . . . 21
Box 2
Resources available to the Lake Chad Basin's population . . . . . . . . . . . . . . . . . . . . . . . . . . . . . . . . . . . . . . . . . . . . . . . . . . . . . . . . . . . . . . . . . . . . . . . . . . . . . . . . . . . . . . . . . . . . . . . . . . . . . . . 31
Box 3
Typha australis and Quelea quelea pest infestation. . . . . . . . . . . . . . . . . . . . . . . . . . . . . . . . . . . . . . . . . . . . . . . . . . . . . . . . . . . . . . . . . . . . . . . . . . . . . . . . . . . . . . . . . . . . . . . . . . . . . . . . . . . . 52
Box 4
Potential greenhouse gas emission reductions . . . . . . . . . . . . . . . . . . . . . . . . . . . . . . . . . . . . . . . . . . . . . . . . . . . . . . . . . . . . . . . . . . . . . . . . . . . . . . . . . . . . . . . . . . . . . . . . . . . . . . . . . . . . . . . 100
Box 5
Water conservation techniques. . . . . . . . . . . . . . . . . . . . . . . . . . . . . . . . . . . . . . . . . . . . . . . . . . . . . . . . . . . . . . . . . . . . . . . . . . . . . . . . . . . . . . . . . . . . . . . . . . . . . . . . . . . . . . . . . . . . . . . . . . . . . . . 104
12
GIWA REGIONAL ASSESSMENT 43 LAKE CHAD BASIN


Regional defi nition
This section describes the boundaries and the main physical and
Boundaries of
socio-economic characteristics of the region in order to defi ne the
the Lake Chad region
area considered in the regional GIWA Assessment and to provide
suffi
cient background information to establish the context within
The Lake Chad Basin (GIWA region 43) is situated in Central Africa
which the assessment was conducted.
between 6° to 24° N and 8° to 24° E. It comprises a vast expanse of land
made up of several catchments that feed Lake Chad. Figure 1 shows a
general map of the Lake Chad Basin with the GIWA region 43 boundaries.
The entire geographical basin covers an area of 2 434 000 km2
Figure 1
The Lake Chad Basin.
REGIONAL DEFINITION
13

The Lake Chad Basin was formed by extensional tectonic forces during
the Cretaceous Period (Burke 1976 in Isiorho & Nkereuwem 1996) with
the geological and geomorphological development of the Basin being
conditioned by the slow and `cool' rifting of the West and Central
African Rift System. This has formed a regional hydrological sink (World
Bank 2002b) known as the Chad Artesian Basin that consists of the Lake
Chad (Chad Syneclise) and the Chari-Logone system (Chari-Logone
Artesian Basin) located southwest of the Basin. These sub-systems are
underlain by a basement complex in the upper source areas and by a
progressively thick sequence of sedimentary deposits towards the Lake
(World Bank 2002b).
The Chad Syneclise is part of the major meridional zone of depressions
Figure 2
Area coverage per country within the Lake Chad Basin (km2).
extending from the Gulf of Gabes in the North of Africa to the Karoo
(Source: Based on HYDRO 1K Elevation Derivative Database, EROS Data Center 2002)
aquifer in the south. It borders the Mali-Niger aquifer in the west, the
Benue Graben in the southwest, and is surrounded by the Aďr Plateau,
(based on EROS Data Center 2002), or 8% of the surface area of the African
the Ahaggar and Tibesti Highlands and the Dahomey-Nigeria and
continent, shared between the countries of Algeria, Cameroon, Central
Cameroon massifs. This basin is situated in the intersection of the
African Republic (CAR), Chad, Libya, Niger, Nigeria and Sudan (Figure 2).
northeastern and northwestern faults. The water supply of the Chad
Basin is drawn from the southern Ahaggar and Tibesti Highlands, the Aďr,
The region is bounded to the north by the Ahaggar Mountains in
Ennedi, Darfour and Ouaddai plateaux and other uplands. In the internal
Algeria. From this summit, the border descends southwards towards
recharge and storage area situated in the Chad Syneclise aquifer, water
the Tibesti Highlands that forms the border between Libya and Chad,
is present in Paleozoic "Continental Intercalaire", Upper Cretaceous,
and continues to about 19° N near the Djebel Mara volcanic mountains
"Continental Terminal" and Quaternary formations.
in Sudan. The southern border is defined by the Mongos Hil s in CAR
and the Adamawa Mountains at about 6° N and further west by the
Mandaras in northern Cameroon at approximately 10° N. The Jos Plateau
marks the western boundary in the Nigerian sector of the Basin and
further north the Aďr Plateau in Niger.
Physical characteristics
Geophysical and geological characteristics
The Tibesti and Ahaggar Highlands in Algeria (see Figure 3) form the
highest elevations within the Lake Chad Basin region. Their summits
rise to an elevation between 2 500 to 3 400 m above mean sea level.
They are built up of basalt and crowned with a series of craters. The
Djebel Mara volcanic mountains in western Sudan have an elevation of
3 088 m above mean sea level and these mountains gradual y decrease
to approximately 300 m above mean sea level towards the Lake Chad
tectonic depression. Most of the interior of the region is a depression
with heights not more than 500 m above mean sea level in altitude, the
lowest point being about 160 m in the Chad lowlands (UNDP/FAO 1972).
Figure 3
Ahaggar Mountains, Algeria.
Figure 1 shows these topographic features.
(Photo: Corbis)
14
GIWA REGIONAL ASSESSMENT 43 LAKE CHAD BASIN
REGIONAL DEFINITION
15
(0-50)
Kanem
Faya
Maiduguri
Gudumbali (400)
(Baga Sola)
(200)
Eguei Maji
Largeau
Figure 4
Schematic hydro-geological cross section.
(Source: Redrawn from Schneider 1991)
The Chari-Logone Artesian Basin is situated southeast of the Lake Chad.
of two units: the old al uvium and the young al uvium (Hammand &
It includes the extensive Chari-Logone plain, as an inner recharge area,
Abdou 1982 in Isiorho & Nkereuwem 1996). The old alluvium consists
and the Adamawa, Bongas, Ouaddai and other mountains surrounding
of deposits of old rivers, while the young al uvium contains recent
the plain, as an outer recharge area. Most significant reserves of
riverbeds and flood plains (Isiorho & Nkereuwem 1996).
groundwater in this basin are found in the "Continental Terminal"
sequence and in the al uvium of the Chari and Logone val eys. This
The upper aquifer consists of a quaternary phreatic aquifer that is
water is widely used for economic purposes. Much of the soil in the
made up of fine-grained sediments approximately 30 m thick, and
Chari Basin consists of clay particles which swel together when wet,
is hydrological y connected to Lake Chad (Isiorho & Matisoff 1990).
so that water runs off as rapid sheetwash rather than slow percolation
The phreatic aquifer is not continous al over the basin area, and
(USGS 2001).
recharge conditions are poor. Natural recharge occurs primarily by
influent seepage from seasonal streams and perennial rivers. The
Hydrostratigraphy
quality of this groundwater is suitable for domestic consumption of
There is limited knowledge regarding the sedimentary aquifers
the local population and livestock. This aquifer is separated from the
underlying the Lake, and the hydrodynamics of the groundwater
underlying middle aquifer by the lower pliocene aquifer found at
flow into the Lake Chad water body are therefore hypothetical (World
depths of between 150 and 400 m, and is approximately 200 m of
Bank 2002b). In the southwest portion of the Basin, the Chad Formation
clay-rich sediment (Kindler et al. 1990). In some parts of the Basin, this
is composed of three aquifers referred to as the upper, middle and lower
aquifer is artesian.
aquifers shared by the four countries bordering the Lake Chad (Niger,
Chad, Cameroon and Nigeria). The systematic hydro-geological cross
The middle aquifer is a continental terminal aquifer that essential y
section in Figure 4 shows the Chad formation, which these aquifers are
comprises an alternation of sandstone and clay encountered between
contained within and also demonstrates the hydrodynamic linkages
450 and 620 m from the surface, extends from Niger and Nigeria into
with the Lake Chad. The formation is overlain by aeolian sands, fluvial,
Cameroon and Chad (Kindler et al. 1990). The suitability of this water for
deltaic and lacustrine deposits approximately 1 to 6 m thick. Most of
irrigation is debatable because of the cost of abstraction, it is essential y
the fluvial deposits occur along stream val eys which are made up
used for domestic water supply to the local population and livestock.
14
GIWA REGIONAL ASSESSMENT 43 LAKE CHAD BASIN
REGIONAL DEFINITION
15
The Basin is predominantly located in the transition zone between
the Sahara desert and savannah grasslands cal ed the Sahel. Rainfall
is the single most important factor conditioning the hydrology and
the climate in this region. Lake Chad is under the influence of the Inter-
Tropical Convergence Zone (ITCZ), which oscillates seasonal y between
about 15° N and 15° S (Nieuwolf 1977 in Le Barbé & Lebel 1997). North
of the ITCZ, high pressure originating from the Sahara prevents rainfal ,
except during the Boreal winter when occasional y cold air descends
from the north. Rain therefore only occurs over the region after the ITCZ
has moved past this area towards the north (Le Barbé & Lebel 1997).
From April to October, rainfal occurs but is general y heaviest in August,
corresponding with the maximum northward extent of the ITCZ,
fol owed by July and then September. About 90% of the rain fal s from
June to September (Le Barbé & Lebel 1997). The movement of the ITCZ
Figure 5
Rainfall distribution.
northern edge is not regular which is often the cause of erratic starts of
(Source: ESRI 1996)
the rainy season. Even when the rainy season is wel established sudden
The lower aquifer is a continental hamadian aquifer that consists of
retreats southward of the ITCZ are not uncommon. Figure 6 shows the
sediments deposited in the cretaceous. There is very little information
average annual distribution of rainfall in Chad (1932-1999). Low-rainfall
on this aquifer in the Lake Chad Basin but it is however known to be an
regions are usual y also variable-rainfall regions. On the dry, northeast
important aquifer in the West African region.
side of Lake Chad, at the town of Bol, rainfall from 1954 to 1972 ranged
from 125 to 565 mm per year, averaging 315 mm (USGS 2001).
Climate
The climate of most parts of the region is hot and dry, with rainfall
Annual average rainfall varies from about 500 mm along the southern
varying between 1 500 mm per year in the southern parts of the region
margins of the actual lake to less than 200 mm near the northern end
to less than 100 mm in the northern parts of Chad, Libya and Algeria.
(Hughes & Hughes 1992). Although rainfal is greatest in July and August
Figure 5 shows the distribution of rainfal across the region. In the
the Lake suddenly rises in September. This can be attributed to the
absence of any specific orographic factors, the reduction in rainfal is
fact that rivers provide almost all water supplied to the Lake, so there
about 100 mm for each 100 km of distance (Beauvilain 1996).
is a time lag between rain fal ing in the watershed and reaching the
Lake (Holz et al. 1984). Highest lake levels are correspondingly found in
December, tapering off slowly for several months (USGS 2001).
The July +30°C isotherm runs across the region. Temperatures are as
high as 35-40°C particularly in the northern parts of the region. During
the dry season lasting from November to March the basin area is
dominated by the Saharan northeasterly winds cal ed the Harmattan.
Figure 7 shows dust storms from the Sahara in 2003.
The Lake Chad Basin has a history of drought episodes and in the
past 40 years there have been a series of severe drought events.
From the middle of the 1960s, rainfal started to drop intermittently
but relentlessly until the big drought of 1972-1974. There was then
a second occurrence of drought in 1983 and 1984. These droughts
have consequently compromised freshwater inputs to the region (see
Figure 6
Annual distribution of rainfall in Chad. Readings from
section on Freshwater shortage in Assessment).
eleven meteorological stations (1932-1999).
(Source: Based on Republic of Chad, Meteorological Office)
16
GIWA REGIONAL ASSESSMENT 43 LAKE CHAD BASIN
REGIONAL DEFINITION
17


Figure 7
Dust storms from the Sahara regularly whip through central Africa. This image shows Lake Chad (green).
(Photo: Schmaltz, MODIS Sensor Terra satellite, April 2003)
Major climatic zones
According to the UNEP/GRID and UEA/CRU Global Humidity Index
(Deichmann & Eklundh 1991) based on a ratio of annual precipitation
and potential evapotranspiration (P/PET), the climate of the Lake Chad
Basin can be divided broadly into fi ve zones:
Hyper-arid zone where P/PET < 0.05
Arid zone where 0.05 <= P/PET < 0.2
Semi-arid zone where 0.2 <= P/PET < 0.5
Dry sub-humid zone where 0.5 <= P/PET < 0.65
Humid zone where 0.65 <= P/PET
The geographic distribution of these climatic zones is il ustrated in
Figure 8.
The Lake Chad
Lake Chad is a terminal depression with the eight basin countries
grouped around it, of which four are in direct contact with the Lake:
Nigeria, Niger, Chad and Cameroon. The Lake occupies less than 1% of
the drainage basin (Coe & Foley 2001).
Figure 8
It is extremely shal ow, with a mean depth of 4 m (Carmouze & Lemoal e
The fi ve main climatic zones found in the
Lake Chad region.
1983). Therefore any increase in lake volume means a substantial
(Source: Deichmann & Eklund 1991)
16
GIWA REGIONAL ASSESSMENT 43 LAKE CHAD BASIN
REGIONAL DEFINITION
17
In a `Normal Chad', salinity varies between 40-50 mg/l in the Chari River,
60-120 mg/l in the open waters of the southern pool and 250-400 mg/l
in the open waters of the northern pool. Close to the Chari delta, the
waters are low in calcium and magnesium carbonates but there is
considerable seasonal variation (Carmouze et al. 1983a).
The Lake Chad water balance
There is a close interaction between rainfal , evaporation, the generation
of lateral inflow to the Lake, groundwater leakage under the body of the
Lake and human abstraction. These factors all influence the overall lake
water balance. A distinction has to be made between hydrological and
hydro-geological context of each influent tributary, and the aggregate
water balance of Lake Chad itself (World Bank 2002b).
Figure 9
Bathymetric map of Lake Chad 1983.
Note: Although these depths are not applicable for today, it does demonstrate the
By virtue of its location, the Lake Chad region has limited surface and
bathymetry of the Lake.
(Source: Carmouze & Lemoalle 1983)
groundwater resources. The water supply is primarily from rainfall
and the Chari-Logone and the Komadugu-Yobe rivers. Lake input is
increase in lake area and shoreline (see review: Burgess et al. In press);
seasonal, the majority originating as precipitation on the Adamawa
seasonal and interannual variations in water level are about 0.5 and 5 m,
Plateau brought to Lake Chad via the Chari-Logone River (see review:
respectively (Carmouze & Lemoal e 1983).
Burgess et al. In press), draining Central African Republic, Cameroon
and Chad. The Komadugu-Yobe River and tributaries drain Nigeria and
The bottoms of the northern pool range from 277.5 to 275.5 m above
Niger.
mean sea level and those of the southern pool from 280 to 278.5m
(Carmouze & Lemoal e 1983). There is also morphological evidence of
The Harmattan winds and dry season aridity contribute to high
a sand ridge between 320 and 330 m of a `Mega Chad' higher than and
evaporation that often equals or exceeds water influx and can reach
10 times the size of today's Lake Chad (Schneider 1991). Figure 9 is a
rates of 2 300 mm per year (see review: Thieme et al. In preparation).
bathymetry map showing the depths in 1983, demonstrating that the
The annual losses through evaporation from the floodplains (cal ed
northern pool is deeper than the southern pool.
the Yaéré in Cameroon) are estimated at over 5 billion m3 per year, or
about 30% of the annual run-off from the Logone (see review: Jauro
ORSTOM during the 1970s and early 1980s studied the physical and
1998). Despite the high rates of evaporation, Lake Chad has low levels
chemical characteristics of the Lake. The annual average temperature
of salinity because the more saline waters sink and leave the Lake
of the Lake Chad water varies between 25.5 and 27.5°C (1956-1975)
through subterranean conduits in the north (see review: Thieme et al.
and is closely related to the annual, seasonal and diurnal variation in
In preparation). This water percolates along the dry bed of the Bahr El
air temperature. The water chemistry of the Lake changes throughout
Gazal River to feed the oases of the Bodele depression about 40 km
the environment and varies seasonal y and annual y. Wind contributes
to the northeast (ILEC 1999). The surprisingly fresh water is also due to
to the mixing of the shal ow, polymictic lake, so that waters are always
the Chari River putting few dissolved solids into the Lake, as many of its
turbid. Transparency is subsequently low and fluctuates according
suspended solids settle as sediment onto its wide floodplain. Once in
to water level: in the southern pool transparency decreased from
the Lake dissolved solids either precipitate or are absorbed by plants
20 to 100 cm in 1964 when the water level was high, to 25 to 30 cm in
(USGS 2001).
1973 at the time of the Sahelian drought. It is clearest in the southern
open waters in December to January, being approximately 100 cm in a
Isiorho et al. (1996) showed that 18 to 32% of the total input to the
`Normal Chad'1 hydrological period, and most opaque in August, when
groundwater system is recharged by Lake Chad. Most of the water is
it is about 20 cm (Carmouze et al. 1983a). Both pH and salinity become
believed to be within the shal ow upper aquifer that underlies the Lake.
higher with increasing distance from the Chari delta. The pH levels in
There have been no studies that document the recharge of the deeper
the Chari are between 7 and 8, and subsequently in the southern pool
aquifers through the lake bed but attempts are being made to identify
of the Lake it does not exceed 8, but can reach 9 in the northern pool.
whether the Lake's water reaches this aquifer.
1 Normal Chad refers to when the Lake had a open water surface area of about 20 000 km2. See History of Lake Chad Variability.
18
GIWA REGIONAL ASSESSMENT 43 LAKE CHAD BASIN
REGIONAL DEFINITION
19

Table 1
Tentative illustration of the theoretical water balance of Lake Chad under steady state assumptions for two climatic scenarios.
Inflow
Outflow
Area of Lake
Type of persistent
(km3/year)
Direct rainfall
(km3/year)
and wetlands
inflows
climatic conditions
surface
El Beid and
(km3/year)
Evapotran-
Infiltration
Chari-Logone
Komadugu-Yobe
Total inflow
Total outflow
( km2)
others
spiration
(est.)
Long-term mean rainfal
37.8
1.0
1.2
40.0
6.0
43.0
3.0
46.0
18 000
Mean of period 1971-1990
21.8
0.4
0.2
22.4
2.1
23.1
1.4
24.5
9 400
(Sources: adapted from Olivry, Mott Mac Donald and Pdf-B projects in World Bank 2002b)
The water balance of Lake Chad is highly variable resulting in fluctuating
300 000-350 000 km2. Since at least 5 000 years ago, the sub-Sahara zone
open surface waters that have exhibited dramatic expansion and
of Africa known as the Sahel has been progressively desiccated. Paleo-
contraction over geologic and recent history. During the 20th century,
environmental evidence shows conclusively that the Lake completely
an irregular cycle of wet and dry periods occurred due to the climatic
disappeared several times in the past (Holz et al. 1984). Figure 10
regime and to a certain extent by regional hydrological persistence. It
demonstrates how Lake Chad has dried out around year 1450, 1550,
has been observed that in general, after five to ten years a new mean
1750, 1850 and 1900.
level equilibrium is established for each persistent period of "humid",
"normal" or "dry" conditions. In an inter-annual balance established in
There is geologic evidence from the Chad Basin of lake level
1984, Table 1 il ustrates under steady state assumptions (no change
oscil ations from the late Pleistocene to the present. From 40 000 to
between initial and final levels) the hydrological balance. This il ustrative
20 000 years ago, numerous isolated smal er lakes occupied the Chad
water balance applies to "intermediate conditions" at a level of 281.5 m
Basin. From 20 000 to 13 000 years ago, the Basin dried up, al owing
(surface maximum of 18 000 km2) and also for a smal water body at
the development of dunes on the basin floor, orientated north-
lower levels under much drier conditions (World Bank 2002b).
northwesterly, south-southeasterly (Nicholson & Flohn 1979 in Holz
et al. 1984, Servant & Servant 1983). Dune remnants are stil present
History of lake level variability2
causing an irregular relief in the Lake Basin, especial y along the eastern
Lake Chad is extremely dynamic. The norm is a variable state of
shore. Dunes are evident on the space imagery taken in 1982, shown in
constantly changing size, shape and depth, which occurs both annual y
Figure 11 (Holz et al. 1984).
and over decades and centuries. Modern Lake Chad is a brackish water
remnant of the Pleistocene Lake Mega Chad (10 000-5 000 years ago).
The Basin was occupied by small inter-dunal lakes from 13 000 to 10 000
Paleo-shoreline studies have shown that Mega Chad covered at least
years ago that also fluctuated in their extent through time (Servant &
Figure 10 Evolution of Lake Chad in the last millennium. The
graph demonstrates the fluctuations in the elevation
Figure 11 Evidence of sand dunes formed 20 000 to 13 000 years
(above sea level) of the Lake Chad's water level.
ago (red arrow).
(Source: Redrawn from Olivry et al. 1996)
(Photo: Lake Chad, 1982 STS-5 photograph, NASA1982)
2The following section is extracted from Holz et al. 1984.
18
GIWA REGIONAL ASSESSMENT 43 LAKE CHAD BASIN
REGIONAL DEFINITION
19
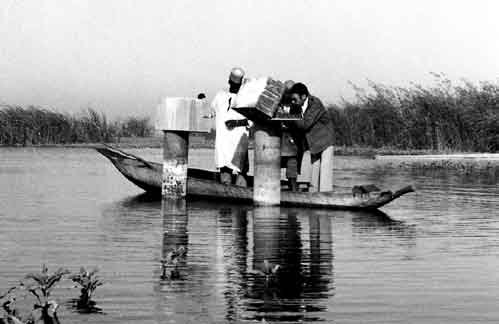
Servant 1983). The period from 10 000 to 5 000 years ago is known as
Lake Chad responds rapidly to precipitation and run-off changes, in
Mega Chad (lake area of 300 000-350 000 km2). At that time the Lake is
part due its shal owness. As a result, Lake Chad has been reduced
thought to have approached the area and volume of the Caspian Sea;
to a smal area covering 1 350 km2 today (Neiland & Béné 2003) a
presently the largest lake in the world. A strandline ridge that represents
very significant decrease of around 90% since the 1960s (Lemoal e
the old shoreline of Mega Chad can be traced through Borno, Nigeria,
1991, USGS 2001) making it now the 15th largest lake in Africa (World
and to the northeast of the present lake. The ridge also extends 130 km
Bank 2002a). Receding waters during the 1970s caused Lake Chad to
further southwest than the present shoreline. When Mega Chad stood
separate into two pools with the "Great Barrier" between them. Since
at its maximum, its waters over-flowed from the Basin into the Benue
the 1970s the northern pool has only held some temporary waters, and
river val ey reaching the Atlantic Ocean through Niger (Grove and
has consequently impeded access for Nigeria and Niger to the open
Pul am 1963).
waters of the Lake (Box 1).
In the 19th century, reports of early explorers suggest that the Lake may
Fol owing a wet year in 1999 there were some signs that water flows
have reached a higher water level than that during the present century
in the rivers entering Lake Chad were rising, and the floodplains were
(Tilho 1910). Other observations suggest water level of the Lake Chad in
increasing. The northern pool again began to experience some flooding
the 19th century varied significantly, decreasing up to 50% in depth and
(Diouf 2000). However the Lake still remains in its Lesser Chad state and
extent (Servant & Servant 1983). In the early 20th century, there was a
wet years are isolated, rather than a sustained upward trend (L'Hôte
continued decline of the Lake Chad water level until it eventual y turned
et al. 2002). It is therefore premature to state whether this most recent
into marshland, unfit for navigation (Servant & Servant 1983).
cycle is part of a larger climatic trend. Human-based factors in the Basin
could also be playing a role in surface water inflows and corresponding
Four hydrological periods that are characteristic of the trends in the
aggregate lake levels. Figure 13 shows scientists measuring lake water
fluctuating water levels of Lake Chad (first three defined by Tilho in 1910
levels at Kindjeria (centre of the northern pool).
and the fourth by Holz et al. 1984):
Greater Chad: open water area of 25 000 km2 or more.
Normal Chad: open water area of about 20 000 km2.
Lesser Chad: open water area between 6 000 and 15 000 km2.
Alimnetric Chad: period of no open water (lake has disappeared).
Recent Lake Chad variability
Up until 1960, Lake Chad was the sixth largest lake in the world. In 1973,
it covered an area of 23 000 km2 (Grove 1996) and occupied first place
among the endorheic lakes ahead of Lake Balkhash (18 400 km˛) in
Kazakhstan (Nami 2002). The volume and area of the Lake decreased
between the 1960s and 1990s. Figure 12 shows the decline in the
Figure 13
surface area of the Lake between 1960 and 1999.
Measuring water levels at Kindjeria (centre of northern
pool) in 1975. This gauge is presently not in operation.
(Photo: Chouret in USGS 2001)
Drainage basins of the region
The Chari-Logone sub-system
The Chari-Logone River has a basin area of approximately 650 000 km2
and the Chari River extends 1 400 km in length (Froese & Pauly 2003).
The Chari and Logone rivers have a tropical regime with a single flood
occurring at the end of the rainy season, which lasts from August
to November (FAO 1997) and feeds the extensive Waza-Logone
floodplains and Yaérés. Figure 14 shows the monthly average discharge
Figure 12 Open surface area of Lake Chad (1960-1999).
(Source: LCBC 2000b)
of the Chari-Logone at N'Djamena. The largest area of the Waza-Logone
20
GIWA REGIONAL ASSESSMENT 43 LAKE CHAD BASIN
REGIONAL DEFINITION
21
Box 1
Chronology of Lake Chad variability: 1960s to present.
A chronology of change - natural and anthropogenic factors affecting Lake Chad.
Note: Images are taken in January each year. (Source: UNEP GRID Arendal 2003)
The figure above shows a time-lapse
separated the northern pool from the
1987: The effect of both the 1972-1974
2001: The state of open water flooding
sequence of maps, sourced from
southern by exposure of the Basin's
and 1982 Sahelian droughts has
estimated to be 1 350 km2 with around
satellite imagery, illustrating the
inner ridge, the Great Barrier. During
resulted in open water being restricted
4 000 km2 of swampland (Neiland
evolution of the Lake 1963 to 2001
this period the northern pool suffered a
to the southern pool only.
& Béné 2003). The expansion in the
(Lemoalle 1991, USGS 2001).
general drying out period and a change
Lake is masked by the proliferation of
from an open water lake environment
1997: There was little variation over
floating vegetation.
1963: Open water is approximately
to one of an unstable marshy
the previous decade with open water
23 000 km2 and each basin is connected
appearance. The open water had totally
estimated to vary inter-annually in
by open water.
dried out by 1975 and during the same
area between 1 500 to 2 000 km2, plus
period the open water areas of the
a larger surrounding area of mixed
1973: The beginning of the effects
southern pool reduced by 90% (FAO
permanent and temporary swampland
of the 1972-1974 Sahelian droughts
1986 in Neiland & Béné 2003).
of between 2 000 to 4 000 km2.
floodplain covers about 8 000 km2 and is used for pasture, fishing,
flooded rice production and flood recession cropping (FAO 1997). The
rivers contribute 95% of all riverine inputs into the Lake, an average of
37.8 km3/year (discharges have been regularly measured at N'Djamena
since 1932) (World Bank 2002b).
Water from the Chari-Logone River flow into the Lake at its southern
extreme and flows northward and outwards encouraged by the Lake's
gradient and prevailing winds (Sarch 2001). These floodwaters take
between one and two months to reach the southwest shore. The flow
Figure 14 Monthly average discharge from Chari-Logone River at
is at its minimum in May/June at the beginning of next year's rainy
N´Djamena (1933-1991).
(Source: RIVDIS database 1991)
season.
20
GIWA REGIONAL ASSESSMENT 43 LAKE CHAD BASIN
REGIONAL DEFINITION
21


Various rivers fl ow in this region, in
particular the tributaries of the Chari
and the Pende, a tributary of the Logone,
which becomes the Logone oriental
(eastern branch of the Logone) on
entering Chad. Two rivers, the Vina and
Mbere, feed the western branch of the
Logone from Cameroon. Rainfall reaches
1 400 mm/year in the CAR and on the
Adamawa Plateau in Cameroon. The El
Beid comes from the Mandara Mountains
(northern Cameroon) and forms an
overfl ow for fl ooding in the Yaérés, which
in certain abundant years comes from the
Logone. The regime of the El Beid, which
forms the frontier between Cameroon
and Nigeria and then fl ows into Lake
Chad, depends to a great extent upon
the fl ood levels in the Yaérés when the
Logone overfl ows (LCBC 1998).
The area of the Waza-Logone fl oodplain
inundated in any year depends on over-
bank fl ow from the Logone River, fl ow
from seasonal streams cal ed "mayos"
fl owing out of adjacent upland areas,
direct rainfal onto the fl oodplain and
Figure 15
water released from the Maga Dam,
The main rivers in the Lake Chad Basin.
whose reservoir is fed by the same three
sources of water (LCBC 2002). However, in the last 40 years the mean
Yobe River is the border between Nigeria and Niger over the last 160 km
Chari discharge has decreased signifi cantly due to the persistent change
and is the only perennial river system fl owing into the northern pool
in rainfall patterns over the contributing catchment.
of Lake Chad. The Komadugu-Yobe is formed by various tributaries,
in particular the Jama'are River which fl ows from the Jos Plateau
The Yedseram and Ngadda sub-system
(Nigeria), and the Hadejia River which fl ows from the area around Kano
The Yedseram and Ngadda rivers and their tributaries rise in the
(Nigeria). The two rivers join to the southwest of Gashua (northeastern
Mandara Hil s (northern Cameroon) and they lose most of their waters
Nigeria). The Hadejia River for the fi rst 48 km of its course maintains a
while fl owing northwards through a 7 km wide fl ood plain (Figure 15).
gradient of approximately 1 m/km. As it descends the gradient reduces
Further downstream of the Ngadda River (Nigeria) a 80 km2 swamp
abruptly with the channel diverging forming numerous oxbow lakes.
is formed from where the river does not maintain a defi nable water
The Jama'are begins with a relatively high gradient from the Jos Plateau
course to the Lake (FAO 1997). The system contains the Alau Dam
before entering the Chad syncline northeast of Foggo (Nigeria). It is
(162 million m3 reservoir), which is located southeast of Maiduguri.
also supplied by the Misau, which comes from the north of Bauchi
(Nigeria) and joins the Komadugu-Yobe River 120 km from Lake Chad
The Komadugu-Yobe sub-system
(LCBC 1998). Most of the headwaters carry a high sediment load of silt
The Komadugu-Yobe River system has a basin area of 148 000 km2
and fi ne sands that are deposited downstream, and there are resulting
(World Bank 2002b) but contributes less than 2.5% of the total riverine
aggraded val eys of poorly defi ned channels with numerous small
infl ow to Lake Chad (see review: Burgess et al. In press). The Komadugu-
oxbow lakes (Oyebande 2001).
22
GIWA REGIONAL ASSESSMENT 43 LAKE CHAD BASIN
REGIONAL DEFINITION
23
Upstream of the confl uence of the Hadejia and Jama'are rivers the
Lake Fitri
Hadejia-Nguru wetlands (fadamas) in Nigeria start. Peak infl ow to the
Lake Fitri is located in Chad and has a surface area of 300 km2 and during
wetlands occurs in late August, resulting in extensive shal ow fl ooding
the dry season is part of a large biosphere reserve covering 1 950 km2. It
(see review: Burgess et al. In press). These wetlands cover a total area
is normal y a freshwater Sahelian lake, fed by seasonal rainfall and run-
of about 6 000 km2, with a water surface area of 2 000 km2 (FAO 1997).
off from the seasonal Batha River. Unlike Lake Chad, it is one of the few
Referred to as an inland delta, the fl oodplain has a maximum width of
Sahelian water bodies that has not experienced large-scale hydrological
65 km at the confl uence of the two rivers, but then diminishes to a 5 km
change, although it became desiccated during the 1984-1985 severe
span that continues for several hundred kilometres.
drought (World Bank 2002a).
Many patches of higher, unfl ooded ground are mixed within the
North of Lake Chad
fl oodplain (see review: Burgess et al. In press). Much of the Hadejia-
The north of Lake Chad is the largest drainage area of the Basin that
Nguru fl oodplain is dry for some or al of the year. It provides a wide
encompasses north Chad and the Algerian sector of the Lake Chad
range of resources including fertile agricultural soils, grazing, non-
Basin. Algeria possesses few renewable water resources and there are
timber forest products, fuel wood and fi sheries. In addition the wetlands
virtual y no surface fl ows from the north into the Lake and what little
are a unique migratory habitat for many wildfowl and wader species
drainage pattern there is fl ows away from the Lake.
(LCBC 2002).
East of Lake Chad
The River Hadejia is control ed by three large dams at Tiga
To the east is Sudan with Wadi Kaya and Wadi Azum, both seasonal
(1 400 million m3 reservoir), Chal awa Gorge (972 million m3 reservoir),
wadis with spate fl ows that originate on the western slopes of the
and Hadejia (1 200 mil ion m3 reservoir), and many smal dam
Djebel Mara. The Wadi Azum's waters fl ow onto the Salamat fl oodplain
structures. The upper basins contribute a total long-term natural
and fi l Lake Iro before fi nal y joining the Chari River. The al uvial aquifers
yield of approximately 7 km3/year, the bulk of which is impounded
of these wadis have the potential to provide about 0.08 km3/year of
at these reservoirs within the Kano province. More impoundment is
excel ent quality freshwater (FAO 1997).
anticipated on the Jama'are River, in Bauchi province if the Kafi n Zaki
Dam (2 700 million m3 reservoir) is constructed, although presently due
The Lake Chad Basin's ecological regions
to lack of funding and strong opposition it is unclear if, or when, the dam
The Lake Chad Basin contains a variety of habitats, including deserts,
wil be completed. Consequently, due to impoundment, siltation and
shrub steppes, savannahs, forests, lakes, wetlands and mountains.
blockage by invasive weeds, the major part of this sub-system has not
These terrestrial and aquatic habitats form a unique sanctuary for the
been able to establish a natural regime through the downstream Yobe
diverse fauna of the region that includes ostriches, cheetahs, hyraxes,
River in Nigeria and Niger for more than 20 years.
crocodiles, hippopotamus and elephants. These habitats also have a
good stock of water birds, migratory birds and waders that thrive in the
An analysis of four years of records before the construction of dams
river val eys depending primarily on the waters of the numerous small
(e.g. Tiga) between 1964 and 1967 in the Komadugu-Yobe river system
lakes that are formed during periods of receding fl oods. The humid
indicates that an average of more than 68% of measured run-off was
zones of the Basin and the Lake itself constitute a unique ecosystem
lost upstream of Gashua. Only 18% of total run-off reached Geidam
in this area of the Sahel, and a preserve of biodiversity of global
(Oyebande & Nwa 1980 in Oyebande 2001). A water balance model
importance. For example, 140 species of fi sh (Neiland & Béne 2003)
developed by Adams and Hol is (1988) showed that evaporation from
and 372 species of birds, of which one third are migratory species have
the inundated area and fl ooded soils represent 64% of the volume
been listed (see review: Nami 2002). The integrity of the ecosystems is
of the river infl ow to the Hadejia-Nguru wetlands. Along the Misau
an essential shield against desertifi cation.
River the average fl ow lost between Kari and Dapchi was 68% of
the fl ow at Kari. The river discharge at Gashua, represents only 24%
Figure 16 shows nine ecological zones in the Basin that have been
of the rivers original fl ow. Based upon this research it is estimated
classifi ed using the WWF Ecoregions (2001). The fol owing text has
that only 10% of the total surface run-off from the Komadugu-Yobe
also been extracted from WWF Ecoregions (Burgess et al. In press) and
system reached Lake Chad even before the construction of dams (see
references therein. The Lake Chad Flooded Savannah Ecoregion also
Assessment, Freshwater shortage, Modifi cation of Komadugu-Yobe
contains additional data extracted from other sources that are cited
River) (Oyebande 2001).
in text.
22
GIWA REGIONAL ASSESSMENT 43 LAKE CHAD BASIN
REGIONAL DEFINITION
23


Fauna: The fauna of the central Sahara is richer than earlier believed.
Arthropods are numerous, especial y ants. Among the Sahara-Sindian
biome avifauna are greater hoopoe-lark (Alaemon alaudipes) and desert
sparrow (Passer simplex).
South Saharan Steppe and Woodlands
Physical features: Rainfal is between 100 and 200 mm per year and in the
Sahelian portion of the ecoregion temperatures are between 26°C and
30°C. It serves as a transition from the Sahara to the Sahel.
Flora: The northern border of the ecoregion lies several hundred
kilometres north of the 100 mm rainfall isohyet, which is the northern
limit of summer grassland pasture composed of the grasses Eragrostis,
Aristida, and Stipagrostis spp. with the herbs Tribulus, Heliotropium,
and Pulicharia. Woody species include Acacia tortilis and Acacia
ehrenbergiana, which mainly grow along wadis. In the south, the
vegetation of the ecoregion grades into the Sahelian Acacia Savannah
ecoregion, and includes steppes of Panicum turgidum perennial tussock
grass.
Fauna: Notable animal species that once occurred throughout the
ecoregion, but have now been reduced to extremely smal and scattered
populations include the fol owing: addax (Addax nasomaculatus),
Figure 16 Ecoregions of the Lake Chad Basin.
slender-horned gazel e (Gazel a leptoceros), dama gazel e (Gazel a
(Source: WWF 2001)
dama), striped hyena (Hyaena hyaena), cheetah (Acinonyx jubatus),
wild dog (Lycaon pictus), and ostrich (Struthio camelus).
Sahara Desert
Physical features: The surface of the desert ranges from large areas of
Sahelian Acacia Savannah
sand dunes (Erg, Chech, Raoui), to stone plateaus (hamadas), gravel
Physical: This is the largest ecoregion in the Basin and encompasses
plains (reg), dry riverbeds (wadis), and salt fl ats. Vast underground
the Lake Chad savannah fl oodplains. Located in the Sahel south of
aquifers that underlie much of the region sometimes penetrate the
the South Saharan Steppe it represents the transition zone where
surface, forming oases. Mechanical and chemical weathering of rocks
over the past 50 mil ion years has produced the soils that include
yemosols (over hamadas and regs), regosols (sandy soils), fl uvisols
(within non-saline val eys) and solonchaks (within saline depressions).
The annual rainfall is below 25 mm and mean annual temperatures are
around 25°C. In the hottest months, temperatures can rise over 50°C,
and temperatures can fall below freezing in the winter. Figure 17 shows
the Sahara desert in Libya.
Flora: The fl ora of the central Sahara Desert is very poor and estimated
to include only 500 species. As many as 162 of the plant species are
endemic to the Sahara. The fl ora of the region shows strictly Sahara-
Arabian affi nities and exceptional adaptations to aridity. Perennial
vegetation is found in wadis, channels, runnels, depressions and hill
Figure 17 Sahara Desert in Libya.
slopes.
(Photo: R. Pelisson SaharaMet)
24
GIWA REGIONAL ASSESSMENT 43 LAKE CHAD BASIN
REGIONAL DEFINITION
25
savannah meets the Sahara Desert. The topography is mainly flat and
Flora: The vegetation is comprised of woodland with a understory of
the climate is tropical, hot, and strongly seasonal. The monthly mean
long grasses, shrubs, and herbs. The northern portion hosts mainly
maximum temperatures vary from 33 to 36°C and monthly mean
grasslands dominated by numerous short grasses. Shrubland is
minimum temperatures are between 18 to 21°C. The annual rainfall
scattered in patches throughout the ecoregion. Riparian forests occur
is around 600 mm in the south of the ecoregion, but declines rapidly
along many waterways and smal areas of adaphic vegetation such
to the north to around 200 mm. The soils of the ecoregion are mainly
as grassy floodplains, or fadamas are found in the Komadugu-Yobe
entisols, with some aridisols, and most are sandy and highly permeable,
Basin.
so that permanent surface water is rare.
Fauna: The West Sudanian Savannah supports a relatively rich fauna,
Flora: Wooded grassland is widespread on sandy soils in the southern
including a number of endemic species. Common large animals are
Sahel, with many thorny shrubs and smal trees including several
bushbuck (Tragelaphus scriptus), warthog (Phacochoerus africanus),
Ziziphus species. Grass cover is continuous but often dominated
vervet monkey (Chlorocebus aethiops), baboon (Papio hamadryas papio
by short annual species such as Aristida mutabil, Chloris prieuri , and
and P.h. anubis), and savannah monitor lizard (Varanus exanthematicus).
Cenchrus biflorus. In the northern Sahel, short grasslands grow on
Most large mammals have been heavily hunted and many species only
deep, sandy soils, with widely dispersed shrubs. Most plant species are
survive sparsely, mainly in protected areas. The pronounced dry season
widespread and fairly common. There are a number of endemic plants
signals a migration of fauna within the ecoregion. This includes the
such as the Indigofera sengalenisis and Panicum laetum.
annual passage of migrant birds on the Afrotropical-Palaearctic flyway.
Fauna: This ecoregion host several endemic animals, mainly small
East Sudanian Savannah
rodents adapted to arid conditions. Three bird species are considered
Physical features: This ecoregion lies south of the Sahel and is mainly
near-endemic: the rusty lark (Mirafra rufa), the masked shrike (Lanius
flat, with a climate that is tropical and highly seasonal. Average high
nubicus), and the sennar penduline-tit (Anthoscopus punctifrons). For
temperatures range from 30 to 33°C and lows fall between 18 to 21°C.
reptiles, endemism is more pronounced, with 10 species regarded as
Annual rainfal is as high as 1 000 mm in the south. During the rainy
strictly endemic. Prior to the 20th century vast herds of ungulates and
season, which lasts from April to October, large areas of southern Chad
other large animals, including elephant, giraffe and ostrich were found
and northern Central African Republic become total y flooded and
in this ecoregion. Most of the large populations have been reduced to
inaccessible. During the dry season, however, most of the trees lose
scattered remnants due to unregulated hunting with modern firearms.
their leaves, and the grasses dry up and may burn. The soils are mainly
The scimitar-horned oryx (Oryx dammah) is presumed to be extinct in
ultisols and alfisols in the south and entisols in the north.
the wild. Other species are only found in a handful of protected areas
e.g. the western giraffe (Giraffa camelopardus peralta). The pronounced
Flora: The vegetation is undifferentiated woodland with trees that are
dry season signals a significant migration of fauna within the ecoregion.
mainly deciduous in the dry season, with an understory of grasses,
This includes the annual passage of large numbers of migrant birds on
shrubs and herbs. Typical trees in the Lake Chad Basin sector of this
the Afrotropical-Palaearctic flyway.
ecoregion include Anogeissus leiocarpus, Kigelia aethiopica, Acacia seyal
and species of Combretum and Terminalia.
West Sudanian Savannah
Physical features: The ecoregion is mainly flat and the climate is tropical
Fauna: The East Sudanian Savannah ecoregion closely resembles
and strongly seasonal. The highest average daily temperatures vary from
the West Sudanian Savannah in habitat structure and species
35 to 40°C whilst the lowest average daily temperatures are between
composition. The two ecoregions differ somewhat in terms of their
15 and 20°C. Mean annual precipitation ranges up to 1 600 mm in the
species assemblages and the degree to which the habitat and
south, but declines to 600 mm per year on the northern border with
mammal assemblages are intact. The Eastern Sudanian Savannah has
the Sahelian Acacia Savannah. The rainfal in this northern region of
low rates of faunal endemism. For example there is only one endemic
the ecoregion is close to 600 mm. The Mandara Plateau, in northwest
mammal (a mouse, Mus goundae) and two strictly endemic reptiles
Nigeria and northern Cameroon, separates the West and East Sudanian
(Rhamphiophis maradiensis and Panaspis wilsoni). Threatened mammal
Savannahs. Soil fertility is relatively low in the heavily weathered lateritic
species include large herds of elephant (Loxodonta africana) in Chad and
soils.
Central African Republic and wild dog (Lycaon pictus), cheetah (Acinonyx
jubatus) and lion (Panthera leo).
24
GIWA REGIONAL ASSESSMENT 43 LAKE CHAD BASIN
REGIONAL DEFINITION
25
West Saharan Montane Xeric Woodlands
supporting tree species such as the doum palm (Hyphaene thebaica),
Physical: This mountain range is found within the Sahara Desert and is
Salvadora persica, Tamarix articulata, and Acacia albida, and other
predominantly of volcanic origin. The Aďr in northern Niger is included
tropical herbs in the genera Abutilon, Hibiscus, and Tephrosia. The
in this ecoregion. Climatical y, it is cold and dry in the winter and hot and
Saharomontane vegetation of the higher elevations supports the
dry in the summer. Rainfall is variable, but averages less than 150 mm
endemic Ficus teloukat, which grows on the south and southwestern
per year, with most fal ing at higher elevations. The mean maximum
slopes, Myrtus nivellei on the western slopes, and Tamarix gallica nilotica
temperature reaches 30°C at the lower elevations and 18 to 12°C at
on the wetter northern slopes. Remnant tropical and Mediterranean
the highest elevations, whereas the mean minimum temperatures
plant species are seen throughout this ecoregion, including palms,
are as low as 3°C at the highest elevations. Frosts are common, and
Hibiscus sp. and Rhynchosia sp.
snow can be found on the higher peaks in the winter. Throughout the
ecoregion permanent water holes, called gueltas, are protected from
Fauna: The ecoregion supports populations of several important
the sun in narrow gorges, which reduces evaporation and increases
Saharan large mammals including the dorcas gazel e (Gazel a dorcas),
the permanence of the pools; it is primarily these areas that give the
Barbary sheep (Ammotragus lervia) and cheetah (Acinonyx jubatus).
ecoregion its floral and faunal values.
Smal mammals and their predators are also abundant, including
hyrax (Procavia capensis), brown hare (Lepus capensis) and spiny mouse
Flora: Vegetation within this ecoregion varies according to elevation
(Acomys spp.). The reptile and amphibian fauna is poor in this area.
and landscape features. At lower elevations, the vegetation is mapped
as regs, hamadas and wadis, but at the highest altitudes there is a
Lake Chad Flooded Savannah
transition to saharomontane vegetation. This ecoregion supports an
(See review: Burgess et al. In press and references therein, Thieme et al.
interesting relict flora, with Mediterranean, Sudano-Deccan and Saharo-
In preparation, Verhoeye & De Wulf 2001, World Bank 2002b, Carmouze
Sindien affinities and contains a number of endemic and rare species.
et al. 1983b).
The most notable of these is Duprey cypress, or tarout (Cupressus
depreziana), wild olive (Olea lapperrini) and myrtle (Myrtus nivellei), all of
Physical: The physical features of the Lake are discussed in the section
which are relict Saharan-Mediterranean species.
on Lake Chad and drainage basins.
Fauna: The plateaus that comprise this ecoregion are biological y
Flora: The surface of the Lake is covered with a mixture of island
important, and function as one of the last refuges for some species.
archipelagoes, reed beds, and open water (Iltis & Lemoalle 1983, Dumont
These include populations of global y threatened antelope, such
1992 in Thieme et al. In preparation). Separating the Lake into the north
as dorcas gazel e (Gazel a dorcas) and dama gazel e (Gazel a dama).
and south pools is the Great Barrier, a ridge of land submerged when
Migratory birds use this ecoregion as a rest area because of the
the Lake is ful y inundated. Areas of open water persist in the southern
year round water and cooler temperatures. Many reptiles are also
pool, mostly near the Chari River inflow. Swamps are found to the west
present including the snakes Telescopus obtusus and Echis leucogaster.
of this open water. Vegetation in the southern pool consists of Cyperus
Amphibians include the European green toad (Bufo viridis).
papyrus, Phragmites mauritianus, Vossia cuspidata, and other wetland
plants. Phragmites australis and Typha australis grow in the more saline
Tibesti-Djebel Uweinat Montane Xeric Woodlands
north pool. Occasional y, the floating plant Nile lettuce (Pistia stratiotes)
Physical: Tibesti Mountains consist of seven inactive volcanoes where
covers large areas of open water (see review: Burgess et al. In press).
rainfall is more regular, although still probably under 600 mm per year.
Normal Chad was classified as a tropical lake rich in phytoplankton and
Lowland wadis areas receive their water from the mountains down
surveys have shown that algal biomass increased as the Lake reduced
storm channels. The mean maximum temperature is approximately
in size (Compčre & Iltis 1983). Over 1 000 species of algae have been
30°C in the lowlands and fal s to 20°C in the highest elevations. Mean
described from the Lake (Thieme et al. In preparation).
minimum temperatures are 12°C in the lowlands, but fal to 9°C over
most of the ecoregion and are as low as 0°C at the highest elevations
Seasonal Yaéré grasslands grow on the southern lake shore where
during winter months.
flooding is prolonged and water depth reaches 1 to 2 m. Vegetation
consists of Echinochloa pyramidalis, Vetiveria nigritana, Oryza
Flora: The Tibesti mountain vegetation varies according to elevation
longistaminata and Hyparrhenia rufa (see Figure 18). The Yaéré dries
and slope. Large wadis areas radiate from the southwestern slopes
up completely during the dry season. In areas with less prolonged
26
GIWA REGIONAL ASSESSMENT 43 LAKE CHAD BASIN
REGIONAL DEFINITION
27

occur in the transition zone between the floating "sudd" communities
and the seasonal herbaceous swamps. They are typical y dominated by
a single reed species, such as Phragmites, Typha or Cyperus (particularly
C. papyrus) (Verhoeye & De Wulf 2001).
The species composition of seasonal herbaceous swamps is very
variable, since it is determined by factors such as rainfal , soil type and
salinity, flooding depth and duration. Plant community borders are
often indistinct because flood regimes vary from year to year. The most
common sequence, from long and deep flooding to short and shal ow
Figure 18 Sparse and short wetland vegetation (e.g. Oryza
inundation, is Vossia, Oryza, Echinochloa and Hyparrhenia (Verhoeye &
longistaminata) growing in open water. This type of
vegetation can be found at the edges of the wetland.
De Wulf 2001).
(Photo: Verhoeye & De Wulf 2001)
flooding, `karal' or `firki' woodland vegetation is present. Acacia seyal
The natural dry land vegetation consists of woodland savannah, but
is the dominant species here, but is replaced by A. nilotica nilotica in
is now largely replaced by smal -scale agriculture and grassy areas
depressions. Below the trees, a layer of tal herbs and coarse grasses
with thorny shrubs. Dependent upon local conditions, this degraded
grows to 2 to 3 m in height, including Caperonia palustris, Echinochloa
vegetation may vary from sparse and short to dense and tal grasses.
colona, Hibiscus asper, Hygrophila auriculata, and Schoenfeldia gracilis (see
Woody vegetation may likewise vary from smal (less than 0.5 m)
review: Burgess et al. in press).
bushes to tall (more than 5 m) trees. Factors that appear to determine
the condition of the vegetation are agricultural practice (cultivation of
Historical y, the most pronounced feature of the Lake Chad Basin
dry season mil et), and distance from the nearest vil age (Verhoeye &
has been its wetlands. Lake Chad itself is the second largest wetland
De Wulf 2001).
in Africa, and with biodiversity of global significance (World Bank
2002b). There are extensive wetlands and floodplains along the Chari-
Fauna: This ecoregion has highest biological importance for the large
Logone and Komadugu-Yobe and also around the lake area. In total an
numbers of migrant birds, especial y ducks and waders that spend
estimated surface area of 2.5 mil ion ha of floodplains and wetlands
the Palearctic winter period in Africa. Seventeen species of waterfowl
of international significance have been recorded by the Ramsar
and 49 other wetland bird species have been recorded, with varying
Convention on Wetlands. The Hadejia-Nguru floodplain in northern
abundance from year to year. The most abundant bird is the wader ruff
Nigeria (Komadugu-Yobe River Basin) contains wetlands that cover
(Philomachus pugnax), with more than one mil ion seen on the Lake
a total area of about 6 000 km2 (see review: Burgess et al. In press).
at one time (Keith & Plowes 1997). In the Hadejia-Nguru wetlands the
Referred to as an inland delta, the floodplain has a maximum width of
most common waterbirds are white-faced whistling duck (Dendrocygna
65 km at the confluence of the two rivers, but then diminishes to a 5 km
viduata), garganey (Anas querquedula), northern pintail (Anas acuta), and
span that continues for several hundred kilometres. Many patches of
ruff (Philomachus pugnax) (see review: Burgess et al. In press).
higher, unflooded ground are mixed within the floodplain.
Lake Chad also supports two near-endemic bird species, the river
The major wetland plant communities present in the Lake Chad
prinia (Prinia fluviatilis) and the somewhat more widespread rusty lark
Basin can be assigned to three broad categories: 1) floating "sudd"
(Mirafra rufa). One other bird of note is the marbled teal (Marmaronetta
communities; 2) permanent reed swamps; and 3) seasonal herbaceous
angustirostris), which is occasional y seen on Lake Chad and in northern
swamps (edaphic grasslands) (Verhoeye & De Wulf 2001).
Chad; it is thought to be declining worldwide (see review: Burgess et al.
In press).
The term "sudd" is used to describe a floating vegetation mat along
the fringes of permanent swamps. The floating islands of Lake Chad
Two near-endemic rodent species are found, Mastomys verheyeni and
are typical y formed by Pycreus mundti , with several other plants
the Lake Chad gerbil (Tateril us lacustris). The wetlands of Lake Chad
of minor importance commonly encountered, such as Echinochloa
and the Hadejia-Nguru wetlands formerly supported herds of large
scabra, Ipomoea aquatica, Vossia cuspidata. Cyperus papyrus is usual y
mammals. Savannah species included red-fronted gazel e, dama
associated with this vegetation type. Permanent reed swamps usual y
gazelle, and dorcas gazelle (Gazel a rufifrons, G. dama, G. dorcas), patas
26
GIWA REGIONAL ASSESSMENT 43 LAKE CHAD BASIN
REGIONAL DEFINITION
27
monkey (Erythrocebus patas), striped hyena (Hyaena hyaena), cheetah
dry season mean daily minimum temperatures of 13 to 18°C. The Lake
(Acinonyx jubatus) and caracal (Felis caracal). Species more adapted to
Chad Basin proportion of this ecoregion consists of western CAR, which
the wetland habitats included African Elephant (Loxodonta africana)
is underlain by relatively new and unweathered entisols, and central
two species of otter (Lutra maculicollis, Aonyx capensis), hippopotamus
Cameroon, which consists of a mixture of oxisols and ultisols, highly
(Hippopotamus amphibius), sitatunga (Tragelaphus spekei) and kob (Kobus
weathered soils that often contain a fragipan.
kob). Most of the large animals have now been hunted and replaced by
large numbers of cattle. Nile crocodiles (Crocodylus niloticus) are now
Flora: Vegetation common either to the Sudanian or Congolian
extremely rare and may have been wiped out (see review: Burgess
provinces characterises much of the region. In the relatively arid corners
et al. In press).
in the northeast Cameroon and northwest portion of the ecoregion,
the transitional Isoberlinia spp. dominated Sudanian woodlands and
Large fish migrations correspond with seasonal inputs, the fish
wooded savannahs characterise the flora where cultivation has not
navigating to the rich floodplains to eat and to breed. Flooding brings
drastical y altered the system.
high periphyton and zooplankton productivity to the floodplains, as well
as increased macrophytic growth, creating ideal feeding and spawning
Fauna: The savannah sub-species of elephant (Loxodonta africana
habitat (Thieme et al. In preparation). An exceptionally rich fish fauna
africana) occupies the savannah woodlands where it denudes trees
comes to capitalise on these resources; the inland waters of the Lake
and suppresses sapling growth, effectively creating a more fire-prone
Chad Basin harbour a relatively high fish biodiversity and have at times
system. The ecoregion provides a unique set of habitats and resources
had abundant quantities of fish. There are reported to be 140 species
that supports moderate levels of diversity, including many species
of fish, which can be grouped into 21 major genera or family groups
with broad distributions in tropical Africa. The red-flanked duiker
(Neiland & Béné 2003). Migratory species that move to the floodplains
(Cephalophus rufilatis) inhabits forest patches within the savannah matrix
include Alestres baremose, A. dentex and Districhodus rostratus (Thieme et
across the Guineo-Congolian/Sudanian transition zone. Widespread
al. In preparation). Aquatic vertebrate groups other than fish include the
mammals in these savannah forest mosaics include the black rhinoceros
Batrachia, which are abundant in reed islands (Dejoux 1983).
(Diceros bicornis longipes) (now however restricted to a few individuals
remaining in Cameroon), giant eland (Taurotragus derbianus) and in the
The zooplankton community is particularly diverse, which may be
eastern sector, bongo (Tragelaphus eurycerus).
due to the large size of the Lake and abundance of food. In periods
of high water the Lake contained nine abundant species (Saint-Jean
1983). The majority of benthic fauna consists of three groups of
macroinvertebrates, namely worms e.g. Alluroides tanganykae, mol uscs
Socio-economic characteristics
e.g. Melania tuberculata and insects e.g. Chironomus formosipennis.
There are no endemic benthic fauna (Lévęque et al. 1983). The major
Over the centuries the people of this part of Central and West
invertebrate groups are found in areas of abundant aquatic vegetation
Africa have eked out a living through exploitation of land and its
e.g. Chironomidae, Hemiptera and Ostracods (Dejoux 1983).
viable resources. Water bodies in the region have not only provided
domestic services but have additional y provided access for the people
Northern Congolian Forest-Savannah Mosaic
to its aquatic resources such as fish. As droughts and expansion of the
Physical features: This ecoregion is a narrow transition zone marked
Sahel continued, so also has the southward migration mainly of people
by an abrupt habitat discontinuity between the extensive Congolian
searching for fundamentals of survival for themselves and for their
rainforests and Sudanian/Sahelian grasslands. It contains the
domesticated animals. The trend has not spared the natural resources
northernmost savannah woodlands in Africa. The forest savannah
from degradation through overexploitation. Drainage systems
mosaics with their characteristical y diverse habitat complexes,
have been the centres of refuge and at the same time the victim of
support a high proportion of ecotonal habitats, which have high species
degradation (Le Barbé & Lebel 1997). Aspects of this nature transcends
richness and are possible loci of tropical differentiation and speciation.
national borders and in themselves also promote inter ethnic, sectorial
This ecoregion lies in the tropical savannah climate zone. Mean annual
and national conflicts. Against this backdrop, it becomes clearer why
precipitation ranges local y from about 1 200 mm to 1 600 mm per year.
human settlements are concentrated in the southern parts of the region
This ecoregion experiences smal seasonal temperature fluctuations,
and not the northern. It also explains why economic developments are
with rainy season mean daily maximum temperatures of 31 to 34°C and
centred in these densely settled areas.
28
GIWA REGIONAL ASSESSMENT 43 LAKE CHAD BASIN
REGIONAL DEFINITION
29
The quality of socio-economic data is limited by the fact that data and
international conflict since 1960 when they gained their independence
socio-economic research is country specific rather than basin wide.
from the colonial regimes of the United Kingdom and France. Nigeria
Regional disparities within the countries must therefore be taken into
has had 11 changes of government, military coups and a civil war, Chad
account. For example Niamey, the capital of Niger, is outside of the Lake
has experienced almost continuous unrest and war, and only Cameroon
Chad Basin but clearly stands apart from other regions in Niger with a
has had a stable government (Neiland & Béné 2003). Outbreaks of armed
higher quality of living, where as Zinder (Niger) is located in the Lake
clashes and rebel activity on islands in the Lake have persisted since the
Chad Basin and has the greatest deficit in terms of its peoples poverty
1970s and are largely associated with the succession of civil wars in the
and vulnerability, according to infant mortality and child malnutrition
Republic of Chad and the migration of Nigerian fishermen fol owing
indicators (Government of Niger 2002).
the receding lake south eastwards. A multi-national `Joint Patrol' was
created in response to these outbreaks and has been monitoring the
Social and cultural aspects
Lake to prevent further violence (Sarch 2001).
According to Kindler et al. (1990), the Basin exhibits a socio-historical
unity based on a history shared by the established population groups
Population dynamics
some of which straddle national boundaries. Many trading circuits
Over the last two decades the annual population growth in the
remain control ed by the groups who have long considered them their
region has ranged between 2.5 and 3.0% (World Bank 2002c). The
specialty (e.g. the Hausa and Kanuri).
current population within the region is estimated to be approximately
37.2 mil ion people (based on ORNL 2003). The total population has
There are numerous ethnic groups present in the Lake Chad Basin, many
increased by about 11.7 mil ion since 1990 (population estimates for
of which are present in several countries; altogether, there are more
1990 was 25.5 mil ion people (UNEP 1999). Figure 19 shows how the
than 70 ethnic groups, each exploiting the natural environment by a
Basin's population is unevenly distributed between the countries.
range of activities. The majority of the populations speak several local
Nigeria, Africa's most populous country hosts an estimated 22 million
and an official language. The main languages used in the area reflect
people (about 59%) of the total population living in the region.
the political roles exercised during the pre-colonial period: Kanuri
Whereas the northern and eastern peripheral countries, Algeria, Libya
(Niger and Nigeria), Fulfulde (Niger, Nigeria, Cameroon), and Arabic
and Sudan, only have approximately 2.7 mil ion inhabitants in the
(Chad). These include a very diverse range of ethno-linguistic groups;
Basin (about 7%), as it only represents just over 6% of the land area of
in Nigeria alone there are 394 linguistic units (Otite 1990). The French
the Basin (EROS Data Center 2002). Population densities are greatest
and English colonial powers have also imposed their languages, and
in Nigeria and surrounding Lake Chad and decreases in the more arid
legal and administrative systems, upon the traditional ones; customary
northern provinces. For example in the Tibesti Highlands the people
laws, regulations, and structures stil determine land use systems in large
are primarily nomadic pastoralists, and population densities are as low
measure.
The old Islamicised states (Kanem, Borno, the Peul Empire of Sokoto,
Wadai and Baguirmi) are largely responsible for the present distribution
of populations in the Basin, including the small groups that took refuge
in the Mandara Mountains and the Mayo Kebbi regions. The Western
shore of Lake Chad, where the majority of the Basin's population resides,
is under the jurisdiction of Borno (one of the 36 states of Federal
Republic of Nigeria) and is dominated by the Kanuri ethnic group.
Migration during the latter part of the mil ennium has brought Shuwa
Arabs from the east and Fulani pastoralists from the west and recently
during the 1970s Hausa families from across northern Nigeria who were
attracted by fishing opportunities at the Lake (Neiland & Verinumbe
1990, Sarch 2001).
Most of the countries of the Lake Chad Basin have experienced
Figure 19 Estimated population in Lake Chad Basin (2002).
considerable political instability and a history of domestic and
(Source: Based on ORNL 2003)
28
GIWA REGIONAL ASSESSMENT 43 LAKE CHAD BASIN
REGIONAL DEFINITION
29
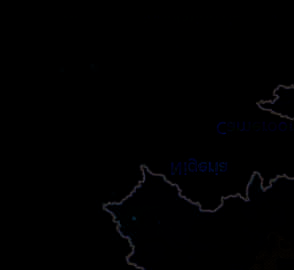


Figure 21 Population structure in the Lake Chad region.
(Source: ESRI 2000)
with a predominance of informal, low productivity activities. In Chad and
Niger those working in the primary sector head the poorest households
Figure 20 Population density.
because they make up 78% and 80% respectively of the population
(Source: Data from ORNL 2003)
but account for only 39% of the GDP (World Bank 2002c, IMF 2003).
as 0-1 people/km2. Figure 20 shows the population density distribution
The primary sector employs more than 80% of the population and
in the region. The region is also experiencing rapid urbanisation, as
comprises primarily of agriculture and livestock rearing (Government
destitute rural communities search for an improved standard of living in
of Niger 2002). Table 2 shows the regions sources of income.
the swelling southern cities such as Kano (Nigeria), Maiduguri (Nigeria)
Table 2
The region's household sources of income.
and N'Djamena (Chad). In Cameroon the population of the northern
city of Garoua has more than doubled from 122 600 to 287 000 between
Activity
million USD (billion CFA *)
1987 and 2003 (World Gazetteer 2003).
Fishing
45.1 (26.3)
Population structure
Rain-fed and flood recessional cropping
26.6 (15.5)
The Basin's population is characterised by a young age structure,
particularly in the southern riparian countries. In Niger for example
Animal husbandry
14.7 (8.6)
nearly 50% of the population is under 15 and only 2% is over 65 (World
Small irrigated areas
10.8 (6.3)
Bank 2002c). The riparian countries of Sudan, Libya and Algeria, located
on the periphery of the northern, northwest and northeast borders
Large irrigated areas
9.4 (5.5)
of the Basin have a larger proportion of over 65 year olds and their
* CFA=Franc de la Communauté financičre africaine.
(Source: Nami 2002)
population structure is less skewed towards the young. Figure 21 shows
the population age structures for the countries of the Basin.
The economic activities in the Basin include:
The Basin's population is also predominately rural. In Chad (46% of
Mining: e.g. Gold mining in Central African Republic.
the Basin's surface area) approximately 80% of the population is rural
Oil: Exploration and exploitation.
(IMF 2003).
Agriculture: Cotton, groundnuts, cassava, mil et, sorghum, rice,
onions. Mixed cropping is widely practiced.
Economic activities
Fisheries: In dams, rivers, fl oodplains and the Lake Chad.
In the Lake Chad Basin production activities are dominated by the
Manufacturing: Cotton ginning, brewing, leather industry,
primary sector and tertiary sectors in which technical progress is slow,
machinery, milling and food industry.
30
GIWA REGIONAL ASSESSMENT 43 LAKE CHAD BASIN
REGIONAL DEFINITION
31
General y, the Lake Chad region is relatively less industrialised, however
Box 2
Resources available to the Lake Chad Basin's population.
the commencement of oil exploitation in southern Chad may trigger
Lake Chad
The Lake is very important to the
Economic values of the Hadejia-Nguru
industrial development. The number and sizes of industries also differ
communities living in the region. It serves
wetlands, valued using market pricing.
per country, but general y, there are few industries compared for
as the political barrier between the
neighbouring countries of Cameroon, Chad,
Economic value per year
Wetland goods
example with the rest of West Africa. Agro-industries, textiles and
Niger and Nigeria. It is an important source
(converted to 2002
or services
of potable water (AEO 2002) in a drought
million USD)
tanneries dominate, whereas heavy industries are relatively few (World
prone region and is a source of employment
Agriculture
10.7
for a variety of professions. Its fisheries
Bank 2002b). The majority of industry is focused in the urban areas that
resource is particularly significant to the
Fishing
3.5
are disproportionately distributed with the highest concentrations in
rural populations. The seasonal fluctuations
provide excellent feeding grounds for fish
Fuel wood
1.6
northern Nigeria and Cameroon, whilst the lowest are in Chad, CAR
through the exposing and submerging of
the lake shore (Neiland & Béné 2003). Fish
Doum palm
0.1
and Niger.
is a major source of protein for the region
particularly for the land-locked countries of
Potash
<0.1
Chad and Niger. The recessional lake waters
Total economic
also provide very fertile agricultural and
15.9
Mining
value
pasture land which has been capitalised upon
(Source: Schuijt 2002)
Although the Basin contains many minerals they are poorly utilised.
during recent lake retreats. Fertility is then
restored during periods of lake expansion.
Mineral resources
Chad's minerals for example, have been relatively unexplored, although it
A significant amount of water is stored
The Lake Chad Basin is very rich in mineral
beneath Lake Chad and is very important
resources although mining activity is poorly
is believed to have many mineral deposits. The principal mineral resource
for the recharge of the groundwater system
developed. Mineral resources contained
(Isiorho et al. 1996), which may be available
is natron (a complex sodium carbonate), which is dug up in the Lake Chad
within the Lake Chad Basin include kaolin,
for future use (Isiorho et al. 2000). The Kanem
natron (soda ash), gravel, diamond, gold and
Lakes (northeast of Lake Chad) contain the
area and is used as salt and in the preparation of soap and medicines.
petroleum.
blue-green algae Arthrospira, which is sun-
Land and soil resources
Annual production is a few thousand tonnes. There is gold mining
dried by the local Kanembu tribe to make the
cake Dihé.
Tectonic activity and the fluctuating lake
development in the Logone River Basin in southern Chad and CAR.
levels over geological time have resulted in
Rivers and floodplains/wetlands
the Lake Chad Basin having exceptionally
The floodplains support a significant
diverse soils and landforms. There are three
proportion of the Basin's population. They
types of lakes and over 15 landforms ranging
Oil exploitation
provide essential income and nutrition
from fossil valleys and wadis to active and
benefits in the form of agriculture, grazing
relict wadis. There is a diverse range of soils
In Chad, oil extraction began in July 2003 and is expected to account
lands, non-timber products, fuel wood,
numbering over 20. Farmers utilise a variety
drought fall back security, tourism potential
of soils with different water capacity (dry,
for 45-50% of Chad's national budget. The project is exploiting the oil
and fishing. Ramsar estimated the economic
drought, wet, very wet) holding properties
value of the wetlands to be 34 to 51 USD
fields at Doba in southern Chad (at a cost of 1.5 bil ion USD) and has
that allow farmers to ensure some crop
per ha (Barbier et al. 1997), the total economic
production in all types of year. These soils
value of the Hadejia-Nguru wetlands (Nigeria)
constructed a 1 070 km pipeline to offshore oil-loading facilities on
can be found within 10 m of each other and
is estimated to be 15.9 million USD (Schuijt
act as a famine prevention technique (LCBC
Cameroon's Atlantic coast (at a cost of 2.2 billion USD). Figure 22 shows
2002). The table shows the economic values
1992). In general, soil water limits production
of wetland goods and services in the Hadejia-
throughout the Basin. In wet years or, in the
the Doba oil field in Chad and the pipeline in Cameroon. The sponsors
Nguru wetlands. Like the communities
southern basin regions, when water is more
surrounding the Lake Chad, fishing is also a
abundant, nitrogen becomes the limiting
are ExxonMobil of the U.S. (the operator, with 40% of the private equity),
fundamental activity of the floodplains and
factor.
is practised within a strongly seasonal and
Petronas of Malaysia (35%), and ChevronTexaco of the U.S. (25%). The
flexible matrix of various activities.
project could result in nearly 2 bil ion USD in revenues for Chad
(averaging 80 million USD per year) and 500 million USD for Cameroon
(averaging 20 million USD per year) over the 25-year production period
(World Bank 2003b).
Agriculture
Agriculture is the main activity in 60 % of the administrative units of
the Lake Chad Basin. The most commonly grown crops are cotton,
groundnuts, cassava, mil et, sorghum, rice and onions. Most farming
in the Basin is rain-fed, cultivated and harvested by hand, and grown
without the use of fertilisers and other agro-chemicals. Mixed cropping
is widely practiced and rice is grown by both traditional and modern
methods. Cotton is the most important cash crop in the region and
is grown in southern Chad, northern Cameroon and Nigeria. Flood
recession cropping is a major production system in the Lake Chad
Basin (Box 2). Sorghum and berbere are the principal crops produced
Figure 22 Doba oil field (Chad) and Cameroon pipeline.
under this system.
(Source: World Bank 2003b)
30
GIWA REGIONAL ASSESSMENT 43 LAKE CHAD BASIN
REGIONAL DEFINITION
31

Farmers are sedentary and the pressure that they put on the quality of
the soil grows as their numbers grow (Nami 2002). In Niger, recurrent
grain shortages (2 out of 3 years) despite increased overall agricultural
production in the last 10 years (1990-1999) and strong demographic
growth, has resulted in food production trailing behind actual
consumption needs. This has led to food dependence, especial y in
rural areas, and frequent appeals to foreign aid in emergencies or when
facing famine (Government of Niger 2002).
In the 1970s, the irrigated agriculture was seen as a solution to food
insecurity in the region and was given priority funding. But the
Figure 24
agricultural projects did not yield the results expected, at a time
Typical Zebru cattle that have been sold to slaughter-
house for production of dried meat.
when member States saw it as the appropriate solution to increase
(Photo: FAO R. Faidutti 1987)
agricultural production and improve food security for the people
(Nami 2002). However, in Chad irrigated rice accounts for only 4% of
of crops and livestock, primarily for domestic consumption. Only 25% of
national cereal production whereas traditional rice farming accounts for
Chad's land is cultivated, but about 50% is grazed (Stuart & Adams 1990
75%. Figure 23 shows the distribution of irrigation areas, that are mostly
in Keith & Plowes 1997). Borno state in Nigeria is the largest livestock
located in Nigeria. The reason for growing rice is that it constitutes a cash
centre in West Africa (Everything Nigeria 2002). Figure 24 shows typical
crop, whereas the market for sorghum is limited (King 1993). However,
Zebru cattle that have been sold to the slaughter house for production
there are high technical and financial inputs required for the irrigation
of dried meat. Cattle exports mainly to Nigeria are very important to the
schemes and net revenues are reported as being negative (King 1993).
Chad and Cameroonian economies (King 1993).
Furthermore, freshwater shortages have prevented the schemes from
functioning. In contrast, traditional flood-recession farming has low
Fisheries of the Lake Chad Basin
inputs, and the scale of outputs compared with other systems has
The inland fisheries of the Lake Chad Basin, and in particular Lake Chad
demonstrated the importance of this farming sector (King 1993).
are among the largest and most productive in the whole of Africa.
It is estimated that from 1969 to present, an estimated 1.7 mil ion
tonnes of fish have been landed, resulting almost entirely from skil ed,
native fishing operations using relatively unsophisticated techniques
(mainly gill nets or longlines from canoes) (Stauch 1977, Durand 1980,
Sagua 1986 in Neiland & Béné 2003).
The fishing activities within the Lake Chad Basin are a fundamental
element of the livelihoods of over 10 mil ion people living in and
around the basin area (Box 2). The system creates a new set of aquatic
environments each year, which dictate the local farming and herding
production systems. The sustainability of these systems is a key factor of
the economic and social stability of the region. Fish from the Lake Chad
Basin is traded within al riparian countries and makes an important
Figure 23 Distribution of irrigated areas.
contribution to the food security of urban centres (Neiland & Béné
(Source: FAO 1997)
2003).
Animal husbandry
This is an economic activity also very important in the region,
Current research suggests that fish demand is evidently attractive
particularly for the migrant cattle herders, who undertake large
enough to encourage large numbers of fishers (ful and part-time),
seasonal transhumant migrations. The meat from livestock makes a
estimated to be more than 170 000, and that the combined trade
major contribution to the dietary needs of the population (King 1993).
of riparian countries is worth upwards of 23.5 mil ion USD per year
In Chad, 83% of the working population is engaged in the production
(Neiland & Béné 2003).
32
GIWA REGIONAL ASSESSMENT 43 LAKE CHAD BASIN
REGIONAL DEFINITION
33


Eight different types of fishing grounds are exploited across the Lake
traps or goura), hook-lines, cane
Chad Basin. Seasonal ponds and receding channels are the most
trap (ndurutu), cast nets, and
common type of water bodies used, fol owed by rivers (Logone and
dip nets (sakama). The diversity
Chari), the open waters of the Lake and the permanent ponds and
and number of each fishing gear
Figure 25 Alestes baremoze (Silversides).
oxbows. A comparison between areas shows that the Yaéré floodplains
(Drawing: Robbie Cada)
used by households declines
offers the largest diversity of exploitable water bodies, fol owed by the
with poverty. Investments in fishing inputs
Chari delta and the western shores of the Lake (Neiland & Béné 2003).
such as new fishing gears can generate
instantaneous surplus, in contrast
The fisheries is largely dictated by the intra-annual flood regime of the
to farming activities where several
Chari-Logone and Komadugu-Yobe sub-systems. Flooding influences
months would have to pass
the extent of the Lake Chad and its fringing floodplains, as well as the
before eventual benefits might
Figure 26 Lates niloticus (Nile perch).
river floodplains. Fish move into the floodplains to feed and to breed,
(Drawing: Robbie Cada)
be returned from the investment
and then retreat with the floods to the main channels and open lake,
(Béné & Neiland 2003).
along wel -defined channels and outlets. The seasonal fluctuations in
Lake Chad's water level provides excel ent feeding grounds for fish
The inland waters of the Lake Chad Basin harbour a relatively high
through the exposing and submerging of the lake shore. The flooding
fish biodiversity and have at times had abundant quantities of fish.
regime represents an important natural asset, which most households at
Common fish market species include Alestes baremoze (Silversides),
Lake Chad exploit in one way or another. As the flood peaks and begins
Clarias (catfish), Tilapi ne cichlids, Petrochephalus and the Lates niloticus
to subside, fishers have the option to either fish the area of open water
(Nile perch) (Béné & Neiland 2003). Figure 25 and 26 show the Alestes
remaining at the centre of the Lake or to fish the pools and channels
baremoze and Lates niloticus respectively.
of residual flood water which remain around the vil ages (Sarch 2001).
Considerable intra- and inter-annual variation in the flooding of the
There have been 21 species of fish identified from Lake Chad that
lake shore means that the supply, i.e. the timing, location and amount
migrate 100 to 150 km up the El Beid and Chari-Logone rivers to the
of resources such as fishing grounds is important determinant of both
Logomatia marshes to spawn (Bénech & Quensičre 1989). Several
the productivity of these resources and which groups are able to access
species, such as Alestes baremoze, are known to migrate for breeding
them at a given point in time (Sarch 2001). The main fishing season is
over distances up to 650 km from the Lake Chad into the Chari-Logone
from October until March (i.e. from the end of the rainy season until
River as far as Cameroon (Durand 1978).
halfway into the dry season) while there is a secondary peak in fishing
activity at the very end of the dry season when the open water bodies
Fisheries production for the year 2001 in the Lake Chad Basin was
are at their smal est in size and fish are easily caught.
estimated at 68 784 tonnes (wet weight) (Jolley et al. 2002 in Neiland
& Béné 2003). Fish are an important part of the diet of most people
There are six key livelihood groups associated with the fisheries, namely:
in the Lake Chad Basin, providing an essential supply of protein. The
fishers, fish mongers/processors, fish wholesalers, fish retailers, fish gear
commercial trade of fish originating from the Lake Chad Basin is also
dealers and boat builders. A total of 20 different types of fishing gear
very important in the whole of West Africa (Neiland & Béné 2003).
are used in the Basin (Neiland & Béné 2003). Apart from the seine net
(taurow) which is owned almost exclusively by the richer families but
The largest fish market in the Lake Chad Basin is Baga-Kawa in Nigeria,
operate col ectively, al wealth groups, disregarding the area, use the
near the lake shore, followed by the much smaller markets of Kinassaram
same set of traditional fishing gears, i.e. essential y gill nets, traps (Mali
and N´Djamena in Chad and Maroua in Cameroon. The majority of all
Table 3
Market characteristics of fish passing through the three main markets of Lake Chad Basin, June 2000 to May 2001.
Total volume (tonnes/dry weight)
Total wholesale price
Country market
Unit price per kg of fish products (USD)
(wet weight conversion factor 4.5)
Local currency (million)
USD (million)
Nigeria (Baga Kawa)
10 876 (48 942)
2 487 (NGN)
20.8
0.52
Chad (Kinasserom)
343 (1 546)
551 (XAF)
0.8
0.45
Cameroon (Maroua)
1 518 (6 831)
1 402 (XAF)
1.9
0.79
Total
12 737 (57 319)
-
23.5
0.54
(Source: Neiland & Béné 2003)
32
GIWA REGIONAL ASSESSMENT 43 LAKE CHAD BASIN
REGIONAL DEFINITION
33
Lake Chad Basin fish regardless of country or origin is directed into
to domestic and external shocks. In Sudan and Chad economic progress
Nigeria, although some fish is retained and traded local y within the
has also been inhibited by the series of civil war and associated military
Lake Chad Basin. Table 3 shows the market characteristics of fish passing
expenditures, infrastructure deterioration and discouragement of
through the three main markets.
foreign aid and investment (World Bank 2001). The AIDS pandemic
has directly impaired economic growth because it mainly affects the
Economic growth
economical y active population. In Chad, 56% of detected cases are in
The countries within the region are among the poorest countries in
the 14-49 year old population (IMF 2003).
the world. Chad was ranked 155th out of 162 countries on the United
Nations' 2001 Human Development Index (HDI), with an annual per
Poverty
capita income of only 200 USD. The Gross National Incomes (GNI) of
The Lake Chad region is trying to cope with mass poverty. Figure 28
the countries are extremely low with the exception being Algeria (no
shows how an especial y high proportion of the Basin's country
data for Libya). Out of 206 countries ranked by the World Bank in terms
populations fal s below both the 1 USD and 2 USD international
of GNI per capita; Chad, Niger, CAR and Nigeria are amongst the 23
poverty line. The World Development Indicators (World Bank 2002c)
poorest countries in the world (World Bank 2002c). Figure 27 shows the
does not have data regarding the percentage of Chad's population
disparities in GNI between the riparian countries.
that is under the international poverty line, and data that is available
appears to underestimate the pervasiveness of the problem. The
percentage of poor households in the region is likely to be 60% or
more (IMF 2003). Nigeria's poverty has steadily grown worse since the
1980s and according to World Bank Development Indicators (World
Bank 2002c) in 1997, 90.8% of the population was below the 2 USD
per day international poverty line. Based on the poverty line set by
the Poverty Profile for Niger prepared in 1994, 63% of the population
is poor, and 34% is extremely poor. The extent of poverty in Algeria
is not as severe as in the southern region's of the Basin but in recent
decades due to economic stagnation the percentage of the population
under the poverty line has increased from around 8% to 14% (World
Bank 1999).
Figure 27 Gross National Income per capita of riparian countries.
Note: No data for Libya. Within parenthesis: GNI ranking by the World Bank.
(Source: World Bank 2002c)
The burden of poverty is spread unevenly across regional and socio-
economic groups.
Economic growth is very slow and variable in the region. Overall in the
1980s and 1990s, Chad and Niger's economies are characterised by a
practical y stagnant standard of living for the populations, with GDP
growing in Chad by barely 1.4% per year over 20 years (IMF 2003) and
in Niger by 1.9% per year over the decade 1990 to 2000 (Government of
Niger 2002). In CAR and Sudan growth rates have declined steadily since
1997. The low growth rates of the Basin's economies are considered
as being insufficient to sustain long-term reductions in poverty and
bring improvements in the standards of living in the region. In Nigeria,
despite vast oil reserves, GDP growth averaged 1.6% between 1980
and 1990, 2.4% between 1990 and 1998, but just 1% in 1999 (Narayan
& Petesch 2002).
The economies of the Basin's countries general y suffer from a very low
productivity, insufficient infrastructure, poor governance, a lack of a
Figure 28 Population below international poverty line.
Note: No data for Chad, Libya and Sudan.
dynamic private sector, an oversized informal sector and a vulnerability
(Source: World Bank 2002c)
34
GIWA REGIONAL ASSESSMENT 43 LAKE CHAD BASIN
REGIONAL DEFINITION
35
Regional inequalities within countries
Vulnerable groups
The severity of poverty in the actual basin is hidden by national figures,
Certain socio-economic groups that are at high risk are above al , women
as it is often severest in the sector of the country lying within the Lake
and children needing special protection, the disabled, demobilised military
Chad Basin boundaries. For example, a survey in 1996 estimated
personnel, senior citizens, and persons living with HIV (IMF 2003).
67 mil ion people in Nigeria to be affected by poverty of which the
northern region which lies in the Lake Chad Basin accounts for the
Health
largest share (40%) of the country's poor people (World Bank 2002c). In
Standards of health in the region are overal very poor. However there is
Cameroon the situation is similar; in northern and extreme provinces,
a great disparity between the northern countries of Algeria and Libya,
located in the Lake Chad Basin, there is a particularly significant number
which have far higher standards of health than the sub-Saharan nations.
of people living in extreme poverty as compared with the rest of the
Niger, Chad and CAR have the lowest standards of health. The health of
country (World Bank 1999). Surveys have indicated that the poorest
the rural populations is inferior to that of the urban populations and it
segment of the Yaéré floodplains (north Cameroon) is not food self-
is often the case that these areas of the country are located in the Lake
sufficient (Béné et al. 2000).
Chad Basin. For example in Niger, child malnutrition is most severe in
the regions of Diffa and Zinder contained in the Lake Chad Basin as
Rural-urban inequalities
wel as Maradi (Government of Niger 2002). Table 4 shows national
Poverty is general y more acute and widespread in rural areas. In Niger,
statistics for health.
86% of poor people (36% of whom are considered extremely poor)
live in the countryside (Government of Niger 2002). In Chad, in both
Life expectancy
percentage and absolute terms, the problem is also worse in rural
In Algeria and Libya life expectancy at birth is 71 years and is
areas, since the population of Chad is largely rural (approximately 80%)
comparable to the Europe EMU life expectancy of 74 years. However,
(IMF 2003). In Algeria 70% of the poor lived in rural areas in 1995 but the
the life expectancy of the rest and majority of the region reveals a
share of urban poor is increasing (World Bank 1999).
dismal situation, ranging from only 43 in CAR to 56 years in Sudan
(World Bank 2002c).
Gender
Single women and widows are identified as among the most vulnerable
Mortality
and impoverished groups and poverty is more severe in female-headed
Infant mortality is very common in the region. In particular infant
families than in male-headed families. For example, in Chad households
mortality in Chad, Niger and CAR is higher than the sub-Saharan
headed by a woman are more prone to poverty than those in which the
average with over 9% of children dying before the age of one. In Niger
head of household is a man (54% and 34% respectively). This is partly
one out of four children die before their fifth birthday and the country
explained by the fact that most women heads of household are widows
has one of the highest maternal death rates in the world (700 deaths
or divorcees with dependent children and scant resources (IMF 2003).
per 100 000 live births) (Government of Niger 2002).
Table 4
Health and education indicators.
sub-Saharan
Health and education indicators
Chad
CAR
Cameroon
Nigeria
Niger
Sudan
Libya
Algeria
Africa
Life expectancy (2000)
48
43
50
47
46
56
71
71
47
Infant mortality per 1 000 live births (2000)
101
96
76
84
114
81
26
33
91
Prevalence of under nourishment, % of pop (1996-1998 )
38
41
19
8
46
18
ND
5
33
Incidence of tuberculosis per 100 000 people
270
415
335
301
252
195
24
45
339
Physicians per 1 000 people (1990-1999)
<0.05
<0.05
0.1
0.2
<0.05
0.1
1.3
1.0
0.1
Health care expenditure, % of GDP
2.9
3
5
2.8
2.6
3.3
ND
3.6
4.9
Adult il iteracy, %
Male
48
40
18
28
76
31
9
24
30
ages 15 and over
(2000)
Female
66
65
31
44
92
54
32
43
47
Gross primary enrolment, % of school-age group (1998)
67
57
90
ND
31
56
153
109
78
Note: ND = No Data.
(Source: World Bank 2002c)
34
GIWA REGIONAL ASSESSMENT 43 LAKE CHAD BASIN
REGIONAL DEFINITION
35
Malnutrition
one physician for more than 20 000 people and only in Algeria and Libya
Excluding Algeria where undernourishment is minimal and Libya (no
is there one or more physicians per 1 000 people. Nigeria, despite rapid
data), in the rest of the countries of the region, 28% of the population
population growth, has doubled the number of physicians it has per
are undernourished. In Cameroon vulnerability to malnutrition is
20 000 people from two in 1980 to four in 2000 (World Bank 2002c). In
greatest in the northwest and northern provinces that are located in
Chad, very few (less than 5%) women from poor households give birth
the Lake Chad Basin. Acute malnutrition is experienced by 8% of the
at a health centre primarily due to a shortage of such facilities but also
people living in these predominantly rural provinces (Amin & Dubois
because of the cost of services (IMF 2003).
1999). In Niger, 43% of children under five suffer from malnutrition. The
nutritional status in Niger has also been deteriorating; the percentage
Education
of children exhibiting stunted growth has risen from 32% in 1992 to
Il iteracy is a hindrance to development in the region and remains
40% in 2000 and is most severe in the regions of Diffa and Zinder
particularly high in Chad, Niger, CAR and Sudan. Niger's primary school
located in the Lake Chad Basin (Government of Niger 2002). However,
enrolment rate is very low (31%) and the literacy rate is the lowest in
in Nigeria despite there being a low life expectancy (47 years), 92% of
the world (Table 4). There is a sharp disparity between girls and boys.
the population have sufficient nourishment (World Bank 2002c).
In Niger, less than one fifth of girls attend school and 92% of females
were il iterate in 2000. In CAR net enrolment of girls dropped from
Diseases
50% in 1995 to 37% in 1998 (Government of CAR 2000). The greatest
Diseases are widespread across the region. The high child mortality can
proportional inequality is found in Libya where only 9% of men are
in part be attributable to several diseases, including malaria, various
illiterate compared to 32% of women (World Bank 2002c). On a regional
forms of diarrhoea, acute respiratory infections, measles, tetanus,
scale the Sudan sector of the Lake Chad Basin consists primarily of the
yel ow fever, diphtheria and chicken pox (Government of Niger 2002).
region of West Darfur, where literacy in 1993 for the male population
Tuberculosis incidence in 1999 was greatest in CAR and Cameroon (415
stood at 68.4% but for women only 20.2% (World Bank 2003).
and 335 per 100 000 people). However, vaccination coverage is low
(15% in Niger). The highest infant mortality rates are in the region where
Factors that discourage enrolment are the long distances to school,
vaccination coverage is lowest, in Niger this is Zinder (on the fringes
low quality of education, and a low probability of being hired in the
of the Lake Chad Basin) and Maradi (Government of Niger 2002). The
modern sector. The children who do attend school have to cope with
prevalence rate of the AIDS pandemic continues to increase in the Lake
very little resources. In some of the countries, standards of education
Chad Basin countries. In Chad the number of confirmed cases of AIDS
are fal ing. In CAR for example from 1995 to 1998, the net primary
has grown from 10 in 1989 to 1 010 in 1993, to 1 343 in 1996 to over
enrolment rate fel from 60% to 44% (Government of CAR 2000).
12 000 cases in 2000 (IMF 2003) and the zero prevalence rate is now
However, despite continued economic hardship, in some countries
between 5 and 10% among adults. In Niger, this rate is over 5% among
improvements have been made. Nigeria for example has experienced
adults, whereas in Nigeria, Cameroon and CAR the epidemic is from
a decline in economic living standards yet il iteracy rates have fal en
5% to 14% of zero prevalence among adults (UNAIDS 2001). The AIDS
by almost 30% for both males and females between 1990 and 2000
pandemic is far less severe in Algeria, Libya and Sudan. Schistosomiasis
(World Bank 2002c).
(Bilharziasis) is endemic in the Basin and is particularly focused in the
Chari-Logone and Komadugu-Yobe river basins and tributaries. Malaria
Being poorly educated, many communities are therefore unable to liaise
transmission is very high in the region due to the intensity of African
or negotiate effectively with local administrations, central government,
mosquito vectors of malaria (ESSO 1999).
NGOs and donors. Another consequence is that farmer organisations,
cooperatives, and professional associations are very weak.
Healthcare facilities
The health facilities available to the Basin's population are very poor.
Water supply and use
The average percentage of GNP spent in the sub-Saharan region is
Water uses in the Lake Chad Basin include domestic, industrial,
4.9%; except for Cameroon, all of the Basin's countries spend a smal er
agricultural (flood cropping and smal -scale irrigation), large irrigation
percentage of their GNP than this average (World Bank 2002c). In Niger
projects (e.g. Kano River Irrigation Project), livestock, fisheries and
between 1994 and 2000, on average, the government earmarked only
ecological. The majority of freshwater consumed in the region is
6% of its budget for health, far below the 10% recommended by the
used for agriculture fol owed by domestic use. The unindustrialised
WHO (Government of Niger 2002). In Niger, Chad and CAR there is only
nature of the region results in very little water being used for industrial
36
GIWA REGIONAL ASSESSMENT 43 LAKE CHAD BASIN
REGIONAL DEFINITION
37
Sanitation
Sanitary conditions for rural dwel ers are particularly poor with severely
limited waste disposal facilities. For example in Niger, the rural sanitation
rate was barely 5% in 1996 and has been steadily declining, with the
development of disease vectors in swamps and irrigation facilities
and the deterioration of drinking water quality as a result of improper
transportation and conservation (Government of Niger 2002).
In Chad no town has a functioning wastewater treatment system and
col ection networks are dilapidated. Less than 2% of the inhabitants of
towns and cities have lavatories with running water while lavatories are
practical y nonexistent in rural areas. As a result, the poor are frequently
exposed to chronic diseases related to poor living conditions and lack
Figure 29 Freshwater withdrawal per person per day by economic
of access to water and sanitation. Moreover, water-related chores
sector.
(Source: World Bank 2002c)
(which take up to four to five hours a day in certain areas) may, among
other things, shorten the time spent on more productive and fulfilling
processes. In Africa, Nigeria is the sixth largest user of water by volume
activities (IMF 2003). In the Sudan sector of the Basin (West Darfur),
(4 bil ion m3 year) (Revenga & Cassar 2002). Figure 29 shows the
over 50% of the population do not have access to any type of toilet
percentage water consumption by sector.
facility, and 42% use a traditional pit. There are no sewage systems
(World Bank 2003).
Water for domestic use is mainly obtained using traditional methods.
In the Sudan sector of the Basin (West Darfur) over 50 % of water is
Infrastructure related to water
obtained from dug wells with bucket col ection (World Bank 2003a).
In the last 40 years there has been considerable development of dam
Women have to travel great distances in order to gather water for
infrastructure in the region which have impounded a large proportion
drinking, cooking and other everyday activities. The Tiga and Chal awa
of the Lake Chad Basin's water resources. In northern Cameroon, the
Gorge dams through the Kano City Water Supply (KCWS) supply the
30 km earthen Maga Dam was constructed on the upper part of
large Nigerian urban centre of Kano City for domestic and industrial
the Waza-Logone floodplain in 1979 to provide water for the SEMRY
purposes.
irrigated rice scheme and for fish farming (LCBC 1998). The Lake Chad
supplied freshwater to Nigeria's South Chad Irrigation Project (SCIP),
Access to safe drinking water in the Basin is very limited. The percentage
which had a goal of irrigating 67 000 ha of cultivated land, and Baga
of people living in rural areas with access to an improved source of
Polder Project, which had a goal of 20 000 ha. However, by 1996 only
water in 2000 ranges from 26% in Chad to 56 % in Niger, excluding
2 200 ha and 1 000 ha were under irrigation respectively and presently
Algeria Libya and Sudan (access is above 68%) (World Bank 2002c).
they are both not functioning. The Kano River Irrigation project (KRIP),
In the Niger sector of the Lake Chad Basin (Agadez, Diffa and Zinder
fed by the Tiga Dam (Komadugu-Yobe) was completed in 1974, water
Departments), modern water points only cover 53 % of the population's
is also released from the dam to supply Kano City (northern Nigeria).
needs. Water shortages are a regular occurrence in this sector of Niger,
The Chal awa Gorge Dam on the Chal awa River (Komadugu-Yobe
because of lack of available supplies and the condition of infrastructure
sub-system) was constructed in 1992 to supply water for the Hadejia
(Government of Niger 2002).
Val ey Irrigation Project and to provide water for Kano City. Work on the
Kafin Zaki Dam on the Jama'are River has been stopped and started
Traditional agriculture in the Basin is predominantly rain-fed. The
many times, and its future is presently unclear. Table 5 shows technical
rivers in the Chari-Logone and Komadugu-Yobe sub-systems support
details of the major dams in the Lake Chad Basin. Figure 46 shows a map
flood farming and recessional farming. Farmers in downstream areas
depicting Lake Maga in the Chari-Logone sub-system and Figure 49
therefore depend largely on river flow because rainfal is low and
shows those dams located in the Komadugu-Yobe sub-system. The Alau
variable. The many large irrigation projects are located predominantly
Dam (162 mil ion m3 reservoir) is located on the Ngadda River system
in the Komadugu-Yobe Basin.
and supplies the city of Maiduguri (Nigeria) to the southeast with
72 mil ion m3 of water. The irrigation component consisted of 22 km
36
GIWA REGIONAL ASSESSMENT 43 LAKE CHAD BASIN
REGIONAL DEFINITION
37
Table 5
Technical details on major dams in the Lake Chad Basin.
1964 to 1 035 000 km2 in 2000. This new definition of the conventional
Details of major dams and
Tiga Dam
Tiga Dam Challawa Gorge
Maga
Lake Chad Basin thus takes into account almost all the water resources
reservoirs
1974-1991
1992
Dam 1992
Dam
that supply the Lake, the floodplains and the aquifers in the lake area
Storage capacity (mil ion m3)
1 989
1 429
972
680
(World Bank 2002b).
Active capacity (mil ion m3)
1 843
1 283
904
ND
Dead storage (mil ion m3)
ND
146
68
280
The functional system boundary for water, land, forest and wildlife
Maximum release capacity (m3/s)
ND
251 / 602
86
50
comprise much smal er sub-sets of the Lake Chad Basin Commission's
Catchment area (km2)
ND
6 641
3 859
6 000
geographic limit. This is because the hydrological y active area of the
Average annual evaporation (m)
ND
2.14
2.31
ND
Basin is much smal er (966 955 km2) than the topographic limits of the
Average (1964-1985) annual inflow
ND
914
476
ND
Basin (2 434 000 km2) which cover a large part of desert areas in Niger
(mil ion m3)
At 100% storage
180
145
100
400
and Chad and are hydrological y de-coupled from the Lake (World Bank
At 75% storage
ND
117
80
ND
2002b).
Surface area (km2)
At 50% storage
ND
85
60
ND
The primary responsibilities of the LCBC are: to regulate and control the
At 25% storage
ND
52
35
ND
utilisation of water and other natural resources in the Basin; to initiate,
At 100% storage
385
310
231
ND
promote and coordinate natural resources development projects and
Annual evaporation
At 75% storage
ND
250
185
ND
losses (mil ion m3)
research within the basin area; to examine complaints; and to promote
At 50% storage
ND
182
139
ND
the settlement of disputes, thereby promoting regional cooperation
At 25% storage
ND
111
81
ND
and integration. The Fort Lamy Convention recognises the sovereign
Evaporation losses/
At 100% storage
42
34
49
ND
average inflow (%)
rights of the member States over the water resources in the Basin, but
At 75% storage
ND
27
39
ND
Note: ND=No data. 1Actual maximum capacity of the canal valve is 35 m3/s. 2Kano River release gate
forbids any unilateral exploitation of the lake water, especial y when
not provided with control valve and therefore blocked; two smaller release gates not included.
such use has a negative effect on the interests of the other states. It also
(Source: IUCN 1998, Attewill & Lawerence 2002)
recognises the right of the member States to plan projects, provided
of conveyance canal from Alau Dam to Jere Bowl for development of
that they consult the LCBC beforehand. The member States were
2 000 ha of rice cultivation. However this scheme was not completed.
also supposed to refrain from adopting any measures likely to alter
the Lake's water balance, its exploitation by other riparian states, the
Institutional arrangements - The Lake Chad
quality of its water and the biological characteristics of the fauna and
Basin Commission
flora in the Basin. Lastly, the member States must inform the LCBC of
The Lake Chad Basin Commission (LCBC), an Inter Governmental Agency
al projects planned within the Conventional Basin. National, sectoral
was established by the Fort Lamy (now N'Djamena) Convention and
and environmental plans exist in each country. National institutions
Statutes on May 22 1964 by the heads of four countries that share the
are official y in charge of coordinating the implementation of Action
Lake. This Old Conventional Basin did not include the Central African
Programme 21 in Chad, Cameroon, Niger and Nigeria.
Republic and excluded the large desert expanses of Algeria, northern
Niger, northern Chad and Sudan and, in particular, excluded the
At national level, the relevant environmental institutions are:
upstream part of the active basins of the Chari-Logone and Komadugu-
Cameroon: National Consultative Committee on the Environment
Yobe. In March 1994, Central African Republic was admitted as the fifth
and Sustainable Development (CCNEDD), which includes the Prime
member State during the 8th Summit of Heads of State (held in Abuja,
Minister, various ministers, professional associations and NGOs.
Nigeria) leading to the New Conventional Basin thus increasing the
Central African Republic: Ministry of Meterorology and Ministry of
conventional area to approximately 987 000 km2. This has enlarged the
Mines and Energy.
conventional basin to include the upper basins of the Chari-Logone
Chad: National High Committee on the Environment (HCNE) which
and Komadugu-Yobe systems. The New Conventional Basin includes
includes the Prime Minister and various ministers.
five countries; Chad, Nigeria, Cameroon, Central African Republic
Niger: National Council for the Environment and Sustainable
and Niger. Sudan was admitted into LCBC in June 2000, but is yet
Development (CNEDD) which includes the Cabinet leader,
to ratify the Convention establishing the Commission, a necessary
ministers, civil society, university and NGOs.
precondition for partaking in the activities of LCBC. The admission of
Nigeria: Federal Environmental Protection Agency (coordination of
Sudan has now increased the conventional area from 427 000 km2 in
ministries) backed by the National Advisory Council (governmental
38
GIWA REGIONAL ASSESSMENT 43 LAKE CHAD BASIN
REGIONAL DEFINITION
39
organisations, private sector, NGOs, community organisations,
Decision Support System Project
university) and by the National Council on the Environment (States).
The Decision Support System Project (DSS) funded by UNEP with
Almost all the States in the Federation have prepared a long-term
contributions from the LCBC in 1995 was intended to support the
Environmental Action Plan.
implementation of the Master Plan. Expected outputs were a DSS and
a donors' conference. The donor conference was not undertaken as
Chronology of recent projects executed in the
the Planning Committee decided on first preparing a Strategic Action
Lake Chad Basin
Plan (see below).
Diagnostic Study of Environmental Degradation in the Lake
Chad Conventional Basin 1989
Planning and Management of Water Resources of the Lake Chad
The study was undertaken by specialist consultants in cooperation
RAF/88/029, 1990-1993
with LCBC member States with funding and support from UNEP.
A project financed by UNDP. Objectives included the evaluation of water
The study gave a synopsis of environmental degradation in the
resources, strengthening of data collection and management, model
diagnostic basins of the Lake Chad Basin. The goals of the report
simulations, formulation and evaluation of development strategies. The
were to identify the symptoms, causes, and also to set priorities for
outcomes from this project were incorporated in the Master Plan and
strategic action. In November 1989, a report was submitted to the
eventual y the Strategic Action Plan (see below).
Environmental Ministers of the LCBC member States with a number
of recommendations (see Kindler et al. 1990). The diagnostic study
Monitoring and Management of Groundwater Resources in the
identified causes of environmental degradation and recognised
Lake Chad Basin 1992-1993
defining "type years" according to rainfal , channel flow, lake levels
Financed by the French Cooperation under convention No98/C88/ITE
and flooding as a necessity for a flexible development policy which
and executed by the consultancy firm BRGM. The objective of the project
can adjust rapidly to water supply changes. The study recommended:
was to provide the LCBC with a groundwater resource management
(i) integration of irrigated cropping with food storage and famine
model. Insufficient funds resulted in the development of only a pre-
prevention programmes; (i ) improving water and soil conservation
model. The project provided remarks and recommendations for the
through incorporation of tree regeneration, forage production and
groundwater resources in the Lake Chad Basin, and also identified gaps
other agro-forestry techniques in irrigated agriculture; (i i) imposing
in knowledge.
a moratorium on large-scale water projects; (iv) undertaking a review
of existing water projects; (v) correcting the environmental impact of
Lake Chad Basin PDF-B Strategic Action Plan 1998
specific projects to downstream and floodplain users; and (vi) according
Integrated and sustainable management of the international waters of
priorities to downstream users (fishery, recession agriculture, pasture,
the Lake Chad Basin: A Strategic Action Plan (SAP) was initiated in 1996
groundwater recharge) and to multiple use of wetlands (wildlife,
fol owing a request from the LCBC made to the GEF (LCBC 1998). The
tourism and economic production).
preparation of the SAP facilitated by the United Nations Department
responsible for Economic and Social Affairs (UNO-DESA) was supervised,
Master Plan for the Development and Environmentally Sound
corrected and validated by member States and by LCBC specialists. The
Management of the Natural Resources of the Lake Chad
objective of the SAP was to prepare a regional framework for protecting
Conventional Basin 1992
the environment and for the sustainable use of the various resources
The Master Plan, compiled in cooperation with UNEP, UNSO, National
throughout the Lake Chad Basin.
Experts, the LCBC Secretariat and Consultants, was drawn up on the
basis of the recommendations of the Diagnostic Study. The Master
UNESCO-BMZ Management of ground-water resources for
Plan supplemented by a programme of action for sustainable
sustainable development of the Lake Chad Basin
agricultural development was prepared with the assistance of the FAO.
Within the framework of UNESCO International Hydrological
A prioritised Master Plan was produced from these two documents,
Programme (IHP) particularly its project on "Humid Tropical Zones"
for the environmental y sound management and development of the
and the implementation of LCBC's Master Plan for the Development
conventional basin. The document consists of 36 projects relating to
and Environmental y Sound Management of the Conventional Lake
water resources, agriculture, forestry, biodiversity management, and
Chad Basin, implementation of the above project commenced in
livestock and fishery development within the Lake Chad Basin (see
1997. UNESCO implements the project which is funded by the German
LCBC 1992).
Ministry for Economic Co-operation and Development (BMZ). It has the
38
GIWA REGIONAL ASSESSMENT 43 LAKE CHAD BASIN
REGIONAL DEFINITION
39
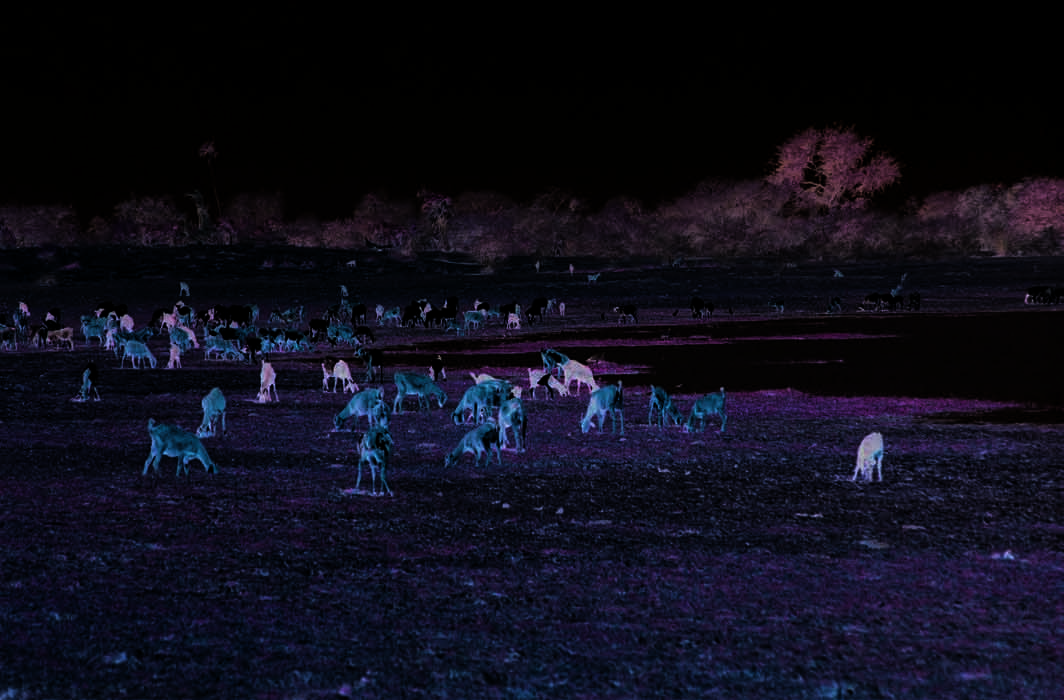
fol owing objectives (UNESCO 1997): (i) knowledge and quantification
and Strategic Action Programme are currently being initiated. See the
of the recharge and reserve of the underlying aquifers under
World Bank Project Appraisal Document (2002a).
three different climatic scenarios of humid, medium and dry years;
(i ) evaluation of aquifer recharge from floodplains and surface water;
Sustainable development of Continental fisheries - A regional
(i i) proposal of regulatory issues for aquifer protection; (iv) proposal
study of policy options and policy formulation mechanisms for
of management systems for the quaternary and continental terminal
the Lake Chad Basin EU-INCO Project 1999-2003
aquifers through the development of a flow simulation model for the
Funded by the European Union, the EU-INCO project is a col aboration
three different climatic scenarios; (v) improvement of the efficiency of
of both African and European research teams. The project was operated
national agencies for coordinating the development actions through
over three years and included a ful range of research, knowledge
purchased equipment, trained staff, data base and computer simulation;
dissemination and capacity-building activities (see Fisheries of the
and (vi) contribution to the implementation of the LCBC Master Plan.
Lake Chad Basin: Using Policy as a basis for future development action)
(Neiland & Béne 2003).
The project prepared a hydro-geological synthesis report at the end of
1997 that highlighted data gaps and information that would need to be
Promotion of the Use of Renewable Energy Resources and
updated during the project execution. The final hydro-geologic report
Conservation of Flora Species in the Drylands of Mega Chad of
incorporating all data and analysis done by the project, including the
the West African sub-Region, 2001-2004
groundwater model developed, is being awaited.
The community-based project covers four countries namely Chad,
Cameroon, Niger and Nigeria. The project focuses on measures to
GEF/UNDP and World Bank Project: Reversal of Land and Water
address loss of biodiversity due to habitat loss as a result of uncontrol ed
Degradation Trends in the Lake Chad Basin Ecosystem
exploitation of vegetal resources, with its negative implications on
GEF initiated a project brief, as well as the SAP. On the basis of the brief
climate change; and, increasing rate of land degradation, which
10 mil ion USD was designated for this project. "The development
exacerbates the poverty condition of the inhabitants. Pilot projects
objective is to build capacity within the Lake Chad Basin Commission
include: training and implementation of renewable energy and water
(LCBC) and its national committees so that it can better achieve
conservation technologies, establishment of woodlots of threatened
its mandate of managing land and water resources in the greater
species of community value, and youth and environmental clubs.
conventional basin of Lake Chad". A Transboundary Diagnostic Analysis
Figure 30 Protected wetland in Chad Basin National Park, Nigeria.
(Photo: WWF-2001, canon/Meg GAWLER)
40
GIWA REGIONAL ASSESSMENT 43 LAKE CHAD BASIN
REGIONAL DEFINITION
41
Protection status within the region
Current national protected areas include the Lake Chad Game Reserve
on the western shore of Lake Chad in Nigeria (Figure 30), the Manda
National Park on the west bank of the Chari in Chad, and the Mandelia
Faunal Reserve on the floodplain between the Chari and Logone in
Chad. The Hadejia-Nguru Wetlands Conservation Project was started in
1985, as a joint undertaking by the IUCN, BirdLife International and the
Nigerian Conservation Foundation (Thieme et al. In preparation). The Aďr
and Ténéré National Nature Reserve in Niger and the Ouadi Rimé-Ouadi
Achim Faunal Reserve in Chad are the two most important protected
areas in the Sahelian sub-desert zone of Africa. They contain many of
the last viable populations of many of the larger ungulates of the South
Saharan Steppe and Woodlands ecoregion (Burgess et al. In press).
Lake Chad poses a unique chal enge for fishing regulations because
it lies within four different countries. Systems of regulating access to
fishing were recently created. Taking Nigeria as an example, Sarch (2000)
shows that regulations are very complicated and haphazardly enforced,
with confusion among different administrative agencies over regulation
and taxation.
In July 2000, the Lake Chad Basin Commission (LCBC) declared al of
Lake Chad a transboundary Ramsar site of international importance.
However, only the national governments of Niger and Chad have
designated their sections so far, although both Nigeria and Cameroon
have promised that they too wil designate their sections as Ramsar
sites. Currently there are the fol owing Ramsar sites: Nguru Lake (and
Marma Channel) complex (Hadejia-Nguru Wetlands, Nigeria); Lake
Chad (Chad site); Lake Chad (Niger Site); and Lake Fitri (Chad) (Ramsar
2003). The GEF/World Bank Project has allocated substantial funding for
the improved management of the existing and planned Ramsar sites
(LCBC 2002). Al Lake Chad Basin riparian countries have ratified the
Convention on Biodiversity (CBD).
40
GIWA REGIONAL ASSESSMENT 43 LAKE CHAD BASIN
REGIONAL DEFINITION
41
Assessment
Table 6
Scoring table for Lake Chad Basin.
This section presents the results of the assessment of the impacts
Assessment of GIWA concerns and issues according
The arrow indicates the likely
of each of the five predefined GIWA concerns i.e. Freshwater
to scoring criteria (see Methodology chapter)
direction of future changes.
T
T
C
C
Increased impact
shortage, Pollution, Habitat and community modification,
P
A 0 No known impacts
P
A 2 Moderate impacts
I
M
I
M
T
T
No changes
C
C
P
A 1 Slight impacts
P
A 3 Severe impacts
Unsustainable exploitation of fish and other living resources,
I
M
I
M
Decreased impact
Global change, and their constituent issues and the priorities
p
a
c
t
s
u
n
i
t
y
identified during this process. The evaluation of severity of each
Lake Chad Basin
e
n
t
a
l
m
p
a
c
t
s
m
i
c i
m
c
o
r
e
*
*
o
m
issue adheres to a set of predefined criteria as provided in the
p
a
c
t
s
p
a
c
t
s
chapter describing the GIWA methodology. In this section, the
E
n
v
i
r
o
n
m
i
m
E
c
o
n
o
m
H
e
a
l
t
h i
O
t
h
e
r c
i
m
O
v
e
r
a
l
l S
P
r
i
o
r
i
t
y
*
*
*
scoring of GIWA concerns and issues is presented in Table 6.
Freshwater shortage
2.5*
3
2
2
2.8
1
Modification of stream flow
3
Pol ution of existing supplies
1
Changes in the water table
2
Pollution
1.0*
1.0
1.0
1.0
1.5
5
Microbiological pol ution
0
T
C
P
A
Eutrophication
1
Freshwater shortage
I
M
Chemical
1
Suspended solids
1
"The availability of freshwater is one of the most critical environmental
Solid waste
1
issues of our time and is particularly true in Africa where large portions of
Thermal
0
the continent are arid or semi-arid and the precipitation is highly variable.
Radionucleid
0
Spil s
0
The relatively large population and delicate ecosystems therefore, depend
Habitat and community modification
2.0*
2
2
2
2.4
3
on water resources that vary greatly due to climate fluctuations and human
Loss of ecosystems
2
induced changes. With increasing population and development we can
Modification of ecosystems
2
expect that the pressures on existing water supplies in Africa and the
Unsustainable exploitation of fish
2.0*
2
2
1
2.1
4
vulnerability of the populations dependent on these resources will continue
Overexploitation
2
Excessive by-catch and discards
2
to grow" (Coe 2001).
Destructive fishing practices
2
Decreased viability of stock
0
Freshwater shortage was considered by the GIWA Assessment to be
Impact on biological and genetic diversity
0
Global change
2.0*
3
2
2
the most important concern for the Lake Chad Basin. The considerable
2.4
2
Changes in hydrological cycle
2
decline witnessed recently in the Basin's potential y available water
Sea level change
0
resources, can be attributed to both natural and anthropogenic factors.
Increased UV-B radiation
0
The impact of freshwater shortage was ranked as severe, and it is predicted
Changes in ocean CO source/sink function
0
2
* This value represents an average weighted score of the environmental issues associated
that the impact of these factors on freshwater scarcity wil continue to
to the concern. For further details see Detailed scoring tables (Annex II).
increase in severity by the year 2020. The concern of freshwater shortage
** This value represents the overall score including environmental, socio-economic and
likely future impacts. For further details see Detailed scoring tables (Annex II).
was considered as being the driving force for many of the aquatic
*** Priority refers to the ranking of GIWA concerns.
environmental concerns and their associated socio-economic impacts.
42
GIWA REGIONAL ASSESSMENT 43 LAKE CHAD BASIN
ASSESSMENT
43
The World Resources Institute (WRI) estimated that in the Lake Chad
Global change
Basin the annual water supply per capita was 7 922 m3 in 1995. However,
The GIWA Assessment considers global changes from anthropogenic
water supply is unequal y distributed. The water supply in 1995 for the
sources. Overal climatic change has caused considerable changes in the
Lake Chad Basin excluding the Chari-Logone Basin was less than
hydrological cycle of the Basin and consequential changes in the level
500 m3/person/year (Revenga et al. 2000), which indicates that the
of Lake Chad, but this has been witnessed many times in the history
majority of the Basin is facing acute water stress. For example Chad
of the Lake as a result of natural processes (see Regional definition,
and Niger, according to the Water Poverty Index (WPI), are both in the 10
History of lake level variability). It is undetermined to what extent the
most water impoverished countries in the world, with Niger being rated
changes in the hydrological cycle are attributed to this natural variability
second lowest (UNEP 2003). However, the fourth and fifth countries with
or to human influences including the emission of greenhouse gases,
largest volume in annual renewable water resources in Africa are Nigeria
bush clearing and agriculture. However it is not believed that human
(286 km3/year) and Cameroon (285 km3/year) (Revenga & Cassar 2002).
activities are the primary cause of the climatic variability and therefore
the GIWA Assessment scored global change as moderate, not severe.
The GIWA methodology that usual y separates the concerns of
freshwater shortage and global change has been adapted to take
There has been no documentation investigating the GIWA issues of sea
into account the particularly close relationship of the two concerns in
level change, increased UV-B radiation as a result of ozone depletion
Lake Chad Basin. Presently, the roles and extent of influence of climate
and changes in ocean CO source/sink function on the Lake Chad Basin.
2
change and human induced stream flow modification in causing the
These issues have therefore not been assessed in this GIWA report.
freshwater shortage has not been determined. Both climate change and
stream flow modification are contributing to the freshwater shortage
Regional climate changes
situation in the region and the ecological and socio-economic impacts
Several studies have shown that the hydrological cycle of the Sahel
are therefore similar. Global and regional climate change has been
region which forms almost half of the Lake Chad region has changed
considered as an issue of freshwater shortage in the GIWA region 43
over the last half of the last century (Bryson 1973, Gregory 1982, Lamb
Lake Chad Basin report, due to the distinct synergies between these
1978a and b, Nicholson 1986 in Le Barbé & Lebel 1997). These studies
concerns.
and more recent scientific research by Coe and Foley's climatic data
analysis (2001) have demonstrated that rainfal events in particular
Lake Chad fluctuations - Natural versus human
have reduced and in turn led to drought and increasing desertification
influence
(Nicholson 1988 in Le Barbé & Lebel 1997). Figure 31 shows a wet period
The most obvious indicator of declining freshwater availability has been
prior to 1960 fol owed by a decreasing trend of annual rainfall recorded
the dramatic decrease in the surface area and volume of Lake Chad.
at N'Djamena (Chad) between 1960 and 1990. In the Sahel, the 1990s
This has been attributed to regional and global climate change as well
was less dry than the 1970s and 1980s and there have been recent wet
as water management practices. Rainfall over the Chad drainage basin
years in 1994 and 1999 (L'Hôte et al. 2002). However the 1990s were still
has decreased greatly since the 1960s, largely because of a decrease in
the third driest decade in the last century and the wet years remain very
the number of large rainfall events (Le Barbé & Lebel 1997). At the same
time, water diversion has increased due to the construction of many
dams in the hydrological y active sector of the Basin used to supply
water for mainly irrigated cultivation.
During the 1960s discharge losses due to irrigation were almost non-
existent, however after 1983, precipitation continued to be low, but
irrigation withdrawals increased. The FAO (1997) estimated the gross
irrigation water requirements for the Basin to be 16.5 km3/year. A change
in cropping strategy from low (e.g. wheat) to high (e.g. rice) water
intensive crops was a major factor causing the increase in water use,
particularly in Nigeria. Although the reduction in lake size is primarily
attributed to reduction in rainfal , in the climatic scenario of the past
Figure 31 Annual rainfall at N'Djamena.
four decades water use has been unsustainable.
(Source: Meteorological station at N'Djamena airport)
42
GIWA REGIONAL ASSESSMENT 43 LAKE CHAD BASIN
ASSESSMENT
43
Figure 32 Interannual isohyets.
(Source: Olivry et al. 1996)
isolated from each other. L'Hôte et al. (2002) concluded that the drought
types represented on maps of the same scale prior to 1973) vegetation
since 1970, had not finished by the end of the year 2000.
formations. The northern limit of the Sahel had moved 100 km to the
south (from latitude 15° 30' N to latitude 14° 30' N). The movement
A comparison of isohyets of the 1950s, which is regarded as the wettest
resulted from the significant downward shifts of isohyets widely
decade, with the driest in the 1980s showed considerable shift towards
observed in the Sahel and the progressive desertification ushered in
the south as shown in Figure 32 (Olivry et al. 1996). In particular, the
by the desiccation.
400 mm isohyet moved 200-250 km towards the south in the west of
Lake Chad, 100 km towards the south in the east but only few (10s) of
According to Le Barbé and Lebel (1997) the lasting drought that has
kilometres in Ouaddai (Chad). The 800 mm isohyets shifted by 300 km
affected the Sahel for more than 20 years is associated with a 30%
to the south at the longitude of Guera and by 200 km to the south east
reduction in the number of rainy events, rather than to a decrease of
of Guera, in Nigeria. The shifts were control ed by orographic effects
the mean event rainfall or length of rainy season, and that this decrease
while effects on the vegetation did not exactly paral el the shift of
is more pronounced for the core of the rainy season (July/August), with
the isohyets as the soil type also had major effect in maintaining the
a reduction of two-thirds in August. Almost 90% of the annual rainfall
status quo or in accelerating the rate of degradation as do the effects
of man and animals. The reduction in rainfal was about 100 mm for
each 100 km of distance apart from the annual and spatial variations
(LCBC 2000b). The shift showed that areas that had experienced a mean
rainfall of 320 mm (e.g. over the Lake itself) received less than 210 mm
(World Bank 2002b).
Gaston (1996) also studied the effects of the 1973 and the 1983-1984
droughts on the Sahelian pasture lands in the Kanem region of Chad.
According to the author, the effects of the 1973 drought seen on the
ground were spectacular. There were many dead trees and all woody
species had disappeared, as had the perennials of the field layer. In
many places, sand had been blown and heaped against the dead and
fal en trees. A revised 1:500 000 map based on special y flown aerial
Figure 33 Lake Chad level variation and yearly precipitation at Bol.
photographs taken in 1974 showed only eight (out of 20 vegetation
(Source: Tschierschke 2002)
44
GIWA REGIONAL ASSESSMENT 43 LAKE CHAD BASIN
ASSESSMENT
45
decrease between 1970-1989 is explained by the decrease of the mean
second part of the 1960s. This was marked by cooling of the oceans of
number of rainfal events during July and August, while both the
the northern hemisphere and simultaneous warming in the southern
length of the rainy season and mean event rainfal remained stable
hemisphere being observed. A reversal occurred around 1970, since
(Le Barbé & Lebel 1997). The fact that the length of the rainy season did
when temperatures in both hemispheres have increased. A time series
not change between the wet and dry periods supports the idea that
plot of SST differences between oceans of the southern hemisphere
the drought is not primarily linked to a shift in the average position of
and those of the northern hemisphere, and rainfal anomalies for the
the Inter-Tropical Convergence Zone (ITCZ). There is a need to identify
Sahel, shows a strong negative correlation. The correlation between
the factor responsible for the triggering of convection (which may
the July-September SST and Sahel rainfall for the period 1901 to 1984
be a consequence of the general atmospheric circulation or of local
was -0.62, which is significant at the 99.9% probability level. Numerical
conditions), which will provide a physical basis for understanding the
equilibrium Global Climate Model (GCM ) experiments with prescribed
diminution in the number of rainfall events.
sea temperatures were also undertaken by the UK Meteorological Office
which were able to replicate rainfall reductions in the Sahel for recent
Lake Chad's water level has consequently responded to the variations
drought years (Evans 1996).
in the number of rainfal events. In Figure 33, an extrapolation based
on the water level comes to a calculated rainfal of 800 mm/year for
The observed and unexpected warming of the southern oceans at a
Maiduguri (Nigeria) in the period 1870-1880 (Tschierschke 2002). This
faster rate was thought to be due to a reduction in the heat transfer
shows how the lake level at Bol (Chad) strongly correlates with the 2-3
from southern to northern hemispheres, although the detailed
years preceding rainfal .
mechanisms of the transfer are stil the subject of much research.
Alternative scenarios include increased deep water circulation from
Global climate change
1960 to 1970 in the Atlantic and the effect of sulphate aerosols which
Climate change is regarded as the most important global change
are dominant in the northern hemisphere. If, however, the reduction in
relevant to the Lake Chad Basin. In the past 30 years, the Sahel has
heat transfer is related to the north-south conveyor system combined
experienced the most substantial and sustained decline in rainfall
with a slowdown in formation of north Atlantic deep water at high
recorded anywhere in the world within the period of instrumental
latitudes, owing to a reduction in the extent of sea ice (Street-Perrot &
measurements (IPCC 2001). Linear regression of 1901-1990 rainfall
Perrot 1990 in Evans 1996), then the Sahelian drought may persist until
data from 24 stations in the West African Sahel yields a negative
the greater land mass in the northern hemisphere starts to dominate
slope amounting to a decline of 1.9 standard deviations in the period
the effects of a slowdown in ocean transfer and the attenuation effect
1950-1985 (Nicholson & Palao 1993 in IPCC 2001). Since 1971, the average
of sulphate aerosols. However, confirmation wil depend on further
of all stations fell below the 1989-year average and showed a persistent
research developments into detailed coupled transient GCM models,
downward trend since 1951 (IPCC 2001).
which can be calibrated against recent climate and sea temperatures.
It is likely that the results from the equilibrium GCMs wil be found
Lamb (1978) showed a relationship between variations in Sea Surface
wanting once more reliable coupled models have been developed
Temperature (SST) patterns and rainfal patterns. Several other
(Evans 1996).
observational and model ing studies have suggested that the global
SST anomalies have a substantial influence in producing rainfall
However, the relative importance of these external factors over more
anomalies over the Sahel and the neighbouring regions (Fol and et al.
local causes (such as vegetation degradation) in changing Sahelian
1986, Palmer 1986, Fol and et al. 1991, Palmer et al. 1992, Rowel et al.
rainfal remains to be determined and understood. A combination of
1995 in Xue & Shukla 1997). Fol and et al. (1991) found that relatively
factors including vegetation cover, soil moisture, and SST is thought to
minor variations in large-scale patterns of SST have played a significant
best explain the reduction in rainfall in the Sahel. Changes in albedo,
role in the variability of Sahelian rainfal . They also observed that
soil moisture, land surface roughness, and SST anomalies have been
tropical oceans have a greater influence than extratropical oceans, and
model ed and a rainfal deficit over the Sahel is calculated similar to
that Sahel droughts are associated with a warmer SST in the southern
observed patterns (IPCC 2001). It has been suggested that a meridional
hemisphere than the northern hemisphere (Xue & Shukla 1997).
distribution of boundary-layer entropy regulates the dynamics of
monsoon circulation over West Africa, explaining observed correlations
According to Demarée (1990), western Sahel underwent an abrupt
of SST to rainfal and the sensitivity of monsoon circulation to land-cover
hydroclimatic transition from a "wetter" to a "drier" rainfall state in the
changes (IPCC 2001). A coupled surface-atmosphere model indicates
44
GIWA REGIONAL ASSESSMENT 43 LAKE CHAD BASIN
ASSESSMENT
45
that, whether anthropogenic factors or natural variation in SST patterns
initiated the Sahel drought of 1968-1973, the persistence of drought
conditions could be attributed to the permanent loss of Sahel savannah
vegetation (IPCC 2001).
Zeng et al. (1999) compared actual rainfal data from the period
1950-1998 with the output of a coupled atmosphere-land-vegetation
model incorporating SST, soil moisture, and vegetative cover. Their
results indicate that actual rainfall anomalies are only weakly correlated
to SST by itself. Only when the model includes variations in vegetative
cover and soil moisture does it come close to matching actual rainfall
Figure 34 Interannual variations in discharge for the Chari River at
data. Model ing the importance of SST, sea ice, and vegetative cover
N'Djamena.
to the abrupt desertification of the Sahara 4 000 to 6 000 years ago,
(Source: Republic of Chad 2003)
Claussen et al. (1999 in IPCC 2001) show that changes in vegetative
Average annual discharge over 59 years covering the period 1932-1992
cover best explain changes in temperature and precipitation. Xue and
of the Chari-Logone river system was estimated at 33.3 billion m3 while
Shukla (1997) concluded that it is likely that both SST and land surface
the average discharge since 1972 has been estimated at 20.7 billion m3
anomalies play a role in simulation of Sahel rainfal .
in the period between 1972-1991.
Modification of stream flow
Figure 34 shows interannual variations in discharge for the Chari-
The GIWA Assessment considered anthropogenic stream flow
Logone River at N'Djamena. Birkett (2000) showed that there is a
modification as having a severe impact on freshwater availability.
strong correlation between the height of the Chari River during the
Although the Lake has already dried out several times in the past (Holz
1990s (upstream of the major irrigation extractions) and the level of the
et al. 1984) and therefore recent shrinkage is not a new phenomenon,
Lake Chad in one to two months.
the trend has been severely exacerbated by human stream flow
modification.
The reduction in stream flow of the Chari-Logone River is thought
to be due to both natural and anthropogenic causes. Fol owing the
The hydrological regimes of rivers of inter-tropical Africa are directly
Sahelian drought 1982-1984 the total run-off of the Chari River was only
influenced by rainfal . In areas of the Lake Chad Basin, despite the
an estimated 20% of the long-term mean (Evans 1996), in consequence
relative abundance of water at times, the flow of rivers has been
the level of the Lake fell to its lowest level this century. However, stream
constantly diminishing (Nami 2002) partly due to decreasing rainfall in
flow modification has occurred on the Chari-Logone River through
the hydrological y active upstream basins but also as a consequence
the construction of the Maga Dam, as part of the Company for the
of the increased abstraction for human consumption (World Bank
Expansion and Modernization of Rice in Yagoua (SEMRY) irrigation
2002b). This abstraction has dramatically modified stream flow through
project, aimed at utilising the water resources of the region.
the construction of dams upstream of the catchment, that have not
taken sufficient account of the people and ecosystems downstream
SEMRY irrigation project (northern Cameroon): For many years prior to
of the development (Second World Water Forum 2000, LCBC 1998).
the droughts, it was considered that water overflowing onto the Waza-
Stream flow modification has been focused on the two hydrological
Logone floodplains from the Chari River was not reaching the Lake Chad
sub-systems Chari-Logone and Komadugu-Yobe. Detailed maps are
and therefore offered no advantage to the people of the region. It was
provided in Figures 46 and 49.
decided that by constructing dams, this freshwater could be used for
agriculture and as a fisheries resource. Many development works were
Modification of the Chari-Logone River
carried out to open up large rice growing areas in northern Cameroon
The Chari-Logone Basin has a catchment area of 650 000 km2, and the
as part of the SEMRY irrigation project. The 30 km earthen Maga Dam
annual supply of the Chari River to Lake Chad between 1930 and 1960
was constructed on the upper part of the Waza-Logone floodplain in
represented 95% of the total annual inflow from al the basin rivers.
1979 to provide water for the irrigation scheme and for fish farming. At
However, the discharge of the Chari-Logone River at N'Djamena has
the same time, some 80 km of dykes were constructed along the bank of
decreased by almost 55% over the last 40 years (Olivry et al. 1996).
the Logone extending 20 km downstream from Maga Dam to prevent
46
GIWA REGIONAL ASSESSMENT 43 LAKE CHAD BASIN
ASSESSMENT
47
Flooded zones
downstream and on the Waza National Park, drying up an area some
Original flooded area
Niger
20 km wide and 75 km long i.e. a total of 1 500 km2 representing about
N'djamena
After SEMRY scheme
Chari
40% of the floodplain downstream of Maga and less than 20% of the
Chad
Rivers
Yaérés (LCBC 1998).
Nonperennial
Logone Birni
Perennial
Nigeria
The SEMRY irrigation scheme seriously modified the floodplain regime
Hinale
leading to an acceleration of the degradation of the environment caused
Waza
by drought. This included the disappearance of many botanical species
Waza National Park
Cameroon
and the progressive invasion of meadows and natural environments by
unwanted ligneous forming plants. These modifications are thought
Mora
to have eliminated the flooding of some 59 000 ha of floodplain and
Logone
Pete
seriously reduced another 150 000 ha which were important breeding
Maga
Pouss
grounds and nursery for fishes. The SEMRY project has been seen as
Lake Maga
a failure and an IUCN project is currently rehabilitating the region to
Maroua
restore at least part of the flooding (see review: IUCN 2003b).
0
50 Kilometres
© GIWA 2003
Studies and experience of both the Waza-Logone floodplains and the
Figure 35 SEMRY project and Waza-Logone floodplain, north
Hadejia-Nguru wetlands (Komadugu-Yobe Basin), as wel as studies
Cameroon. The map shows the Maga Lake (SEMRY
project) and the reduced flooding of the Waza-Logone
of fishing in the Lake Chad Basin, have led specialists to consider the
floodplains downstream.
relationships between the hydrosystem and ecosystem. Instead of
viewing overflows from the Logone as a loss of water for the Lake,
the irrigated rice fields from being flooded from over-bank flow from
flooding of the Yaérés is now known to play an important role for the
the Logone River (LCBC 1998, Neiland & Béné 2003). Figure 35 shows
local fauna and flora and for the entire equilibrium of the system. The
the project infrastructure and the reductions in flooding of the Waza-
re-flooding of the Yaérés by making openings in the embankment that
Logone floodplains fol owing the construction of the Maga Dam.
prevented water from overflowing into the plain has partly corrected
the effects of Maga Dam further downstream, in particular in the Waza
An IUCN hydrodynamic study of the floodplain reviewed the impacts
National Park (LCBC 1998).
of the dam for three scenarios; good years, average years and drought
years (Etude du Modele Hydrodynamique du Logone, Mott MacDonald/
Modification of the Komadugu-Yobe River
Project Waza-Logone 1999 in LCBC 2002). The "pre-dam average year"
The upstream basin of Komadugu-Yobe River contributes a total
flooded area was estimated at around 3 385 km2, and fol owing dam
long-term natural yield of approximately 7 km3/year. However the
construction around 2 420 km2, a decrease of around 30% (see review:
River has experienced significant changes in stream flow regime.
LCBC 2002).
The modification in stream flow is in part attributed to the human
stream diversion and in part due to drought, but it is undetermined
The establishment of embankments blocked breaches of the Logone
what role each of these factors has played. The droughts in both the
River and entrances of the tributaries of Mayo Aretékelé and Petit Goroma,
1970s and 1980s severely affected northern Nigeria, and in particular
and deprived the Logomatya River of its main supply (Wesseling et al.
the eastern half of the Komadugu-Yobe Basin. For example, annual
1994 in IUCN 2003b). The Maga Dam sealed up watercourses entering the
rainfal decreased by over 40% compared to the long-term mean
Pouss depression, stored water originating from the tributaries of Mayo
(1905-1982) in Kano in 1983 and 1984 (Oyebande 1997 in Oyebande
Boula and Logomatya, and caused the Mayo Gougoulay to dry up. In total
2001). The Ngadda, Yedseram and Komadugu Gana rivers did not flow
these construction works resulted in a 70% reduction of water supply to
and the Misau River, which obtains water from the Komadugu Gana was
the floodplain from the Mandara Mountains, and an almost complete
completely dry at Kari (Oyebande 2001).
curtailment of the water supply from the Logone (IUCN 2003b).
During the 1970s and early 1980s around 20 reservoir dams were built
The significantly reduced flows in the Mayo Vrick below the dam
on the Hadejia river system, which negatively affected the hydrology of
(World Bank 2002a) has had negative impacts on part of the Yaérés
the Yobe River, the only inflowing river into Lake Chad's northern pool.
46
GIWA REGIONAL ASSESSMENT 43 LAKE CHAD BASIN
ASSESSMENT
47
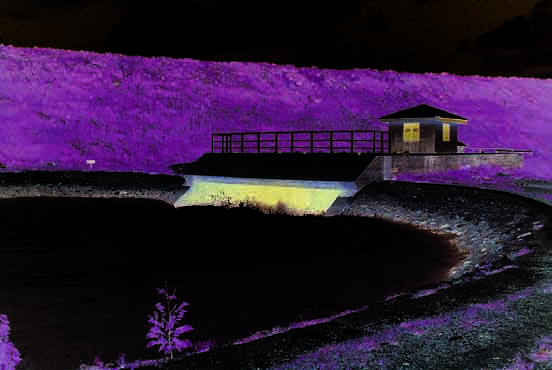
The dams control about 80% of the total run-off of the Hadejia River. The
flow at Gashua is 60 mil ion m3. If all the dams located in this sub-system
River used to supply large amounts of water to the Lake but has now
were operating at their designed capacity the total reduction would
been reduced to an insignificant flow of 1% since the construction of
be 76 mil ion m3. Since the mid-1970s, dry season flood releases from
the dams and pre-drought years (Neiland & Béné 2003). The Komadugu-
the Tiga Dam during the dry season modified stream flow from zero
Yobe River now only flows for six months of the year instead of nine,
flows during the season to a perennial regime (Oyebande & Uwa 1980
with a smal er discharge (annual modulus at Diffa: 558 million m3 from
in Oyebande 2001). However, these releases did not appear to benefit
1965 to 1973 and 379 million m3 from 1983 to 1996). Figure 49 provides
the ecological systems downstream of Gashua (Oyebande 2001).
a map with the location of major water constructions.
Consequently the major part of this water resource has not been able
to establish a natural regime through the downstream Yobe River in
The largest upstream irrigation scheme at present is the Kano River
Nigeria and Niger for almost 30 years. The absence of an integrated river
Irrigation Project (KRIP), fed by the Tiga Dam completed in 1974, which
basin management strategy in the basin has further given rise to a host
has an active storage capacity of 1 400 million m3 (Figure 36). Water is
of other problems, such as uncoordinated operation of dams, growth
also released from this dam to supply Kano City in Nigeria. Before the
of weeds and silt blockages in the Old Hadejia River preventing its con-
construction of the Tiga Dam, there was a relatively strong stream flow
tribution to the Komadugu-Yobe River, among others.
in the Hadejia River during June-October that accounted for 98-99% of
annual flow. After the dam was completed there was a 21-22% reduction
So far there has been little development on the Jama'are River with only
in stream flow. In 1992 the height of the Tiga Dam was lowered due to
one small dam across one of its tributaries. However, plans for a major
structural instability, which resulted in a 31% reduction in its storage
dam at Kafin Zaki have been in existence for many years to provide
capacity (Oyebande 2001).
water for irrigated area of around 84 000 ha. Work on the Kafin Zaki
Dam has been started and stopped a number of times, most recently in
The Chal awa Gorge Dam (972 mil ion m3 reservoir) on the Chal awa
1994, and its future is at present unclear (World Bank 2002b). The water
River is designed to release water into the Hadejia River for subsequent
demand in the sub-basin has been estimated to be about 2.6 times the
storage behind the Hadejia barrage to supply the Hadejia Val ey
available water resources (DIYAM Consultants 1996) and according to
Irrigation Project. The barrage and Chal awa Gorge Dam were finished
Oyebande (2001) if the development of the Jama'are and Hadejia basins
in 1992. Chal awa Gorge also provides water for Kano City (World Bank
goes ahead as planned there will be reduction in flow at Gashua of at
2002b).
least 1 275 mil ion m3 per year, or the equivalent total flow at Gashua
over an average year.
A decrease of flow upstream of Hadejia because of evaporation from
the Tiga Reservoir with a rate of 425 million m3 annually has caused a
In addition, the development of large irrigation areas has not fol owed
reduction of flow in Gashua of 56 million m3 annual y. When water used
construction of dams so far. If all the irrigation projects of the various
for irrigation and by urban centres is taken into account, the reduction in
agencies were to be implemented, more water would be used in the
upper basin, to the detriment of the downstream basin (LCBC 1998).
For example in the Nigerian part of the Basin at present, 20 dams have
been built or are under construction and nine more are contemplated
(with reservoirs of 1 076 million m3), whereas only 36 620 ha have in fact
been irrigated out of the intended 188 780 ha. Much water is therefore
unused or lost through evaporation in the reservoirs or silted up beds
on the plateau. The various dam and irrigation projects were planned
without any environmental impact study and in particular without
taking into account the effects on people downstream (LCBC 1998).
Reduced stream flows and the absence of large flood events have
reduced the ability of the system to clear river channels of silt blockages
and caused a proliferation of weeds. Flows have consequently been
diverted onto the floodplains and stopped the flow in the Old Hadejia
Figure 36 The Tiga Dam (Hadejia river system, north Nigeria).
(Photo: Oguntola 2003)
River, so that Marma Channel has received more water since the 1970s.
48
GIWA REGIONAL ASSESSMENT 43 LAKE CHAD BASIN
ASSESSMENT
49
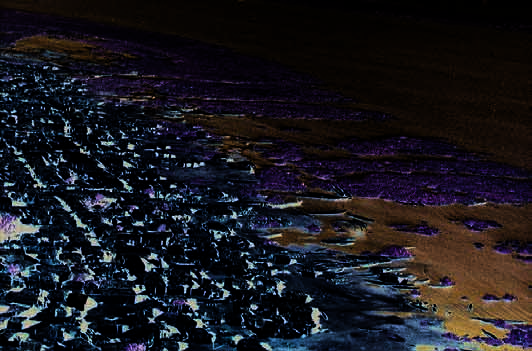
Due to these weed blockages the Hadejia and Burum Gana now only
regime for their migration and spawning patterns (Drijver & Van Wetten
have a limited contribution to the flow of the Komadugu-Yobe River
1992 in Oyebande 2001). The number of birds in the Hadejia-Nguru
(Oyebande 2001).
wetlands is highly correlated with the extent of the wetlands. The
abundance of birdlife has consequently been reduced.
Prior to impoundment, large volumes of floodwater nourished an
extensive sub-system of floodplains and wetlands (World Bank
Direct modification of Lake Chad
2002b). These upstream developments have diverted surface or
The South Chad Irrigation Project (SCIP) is an example of a Lake Chad
groundwater for irrigation and altered the timing and size of flood
development scheme that has failed due to poor management, civil
flows. Downstream, increasing demand for irrigated agriculture has
strife and by the Lake's rise and fal . SCIP is the largest irrigation project
led to the diversion of water past wetlands through bypass channels.
in Nigeria, with a goal of irrigating 67 000 ha with an average cropping
This sub-system presently provides 1.5 km3 water per year when exiting
intensity of 130% (200% would be two crops per year). The project
the upper basin at Gashua and only 0.45 km3 when arriving at Lake
aimed to resettle 55 000 farming families onto the irrigated land.
Chad. Below Gashua, flows maintain Hadejia-Nguru wetlands, where
Nigerians had already practised resettlement as a drought strategy
effluent flow from the watercourse recharges al uvial aquifers and
(Figure 37); the number of vil ages in the Nigerian portion of Lake Chad
pumping and diversions for smal irrigation schemes. Development
rose from 40 to 100 between 1975 and 1988 (USGS 2001).
of irrigation by pumping has exacerbated the existing water-stress
imposed by upstream impoundment. Irrigation developments coupled
SCIP planning started in 1962-1963 at the very peak of the wet years.
with decreases in precipitation have caused the maximum extent of
A successful 1966 pilot project irrigated 1 000 ha. The major project
flooding of the Hadejia-Nguru to decline from between 250 000 and
started in 1974, and was commissioned at 23 000 ha in 1979. A system
300 000 ha in the 1960s and 1970s, to 70 000 to 100 000 ha more recently
of pumps and canals was to carry water from the lake shore intake
(World Bank 2002b). The current contribution of the Komadugu-Yobe
point to farmers' inland fields. But the plans were dependent on the
River to the northern part of the Lake Chad wetlands is minor in terms
lake's level. When the Lake fel below 279.9 m (about 2 m above the
of the overall balance (World bank 2002b).
baseline) no irrigation could take place. The system operated only six
of the first 10 years, with a maximum of 7 000 ha irrigated. Few of the
The stream flow modification of the Komadugu-Yobe River has
farmers got water, few crops were produced, and water efficiency was
impacted on the ecology of the Basin. The decline in wetland extent has
low. The canals were unlined, so water seeped into the ground, and
proportionately decreased the fish abundance in the wetlands and in
only about half reached farmers. When water did come, many farmers
addition perhaps more than five species are no longer found in different
overcompensated by breaching or siphoning the canals to get more
parts of the floodplain (Oyebande 2001). The decline in fish species
water, thereby wasting water and waterlogging their fields. Some fields
diversity is blamed on the reduced flooding and changes in the timing,
were also poorly prepared for irrigation (USGS 2001).
depth and extent of flooding. Fish species that have been particularly
affected include Alestres sp. and Schilbe sp. that depend on the flood
The Baga Polder Project, had a goal of irrigating 20 000 ha to produce
26 000 tonnes of wheat, 28 000 tonnes of maize and 14 000 tonnes
of groundnuts annual y. However, by 1996 only 1 000 ha were under
irrigation and now the project concentrates on farming the receding
lake waters. The original polder that was constructed for irrigation
purposes is now several kilometres from the lake shore.
The farmers surrounding the Lake have adapted to the fluctuating lake
levels using both traditional and improved technologies. Farmers in
Lac Prefecture (Chad), to the north of the Lake, have planted in the
depressions between the sand dunes exposed by the receding waters
that are known as polders. The polders are fertile from alluvial deposits
and source water from rainfal , residual moisture and irrigation. Rice,
wheat, maize, and vegetables are grown. The Government of Chad
Figure 37 New town on the Cameroon shore, 1989.
(Photo: USGS 2001)
created the Lake Chad Development Company (SODELAC) in 1967
48
GIWA REGIONAL ASSESSMENT 43 LAKE CHAD BASIN
ASSESSMENT
49
to enhance the socio-economic development of the Lac Prefecture,
that require high doses of chemical sprays suggest that water supplies
which resulted in the establishment of the Lake Chad Polders Project.
are being contaminated. There is a lack of studies on the distribution of
This project promoted the development of the polders, and improved
these agro-chemicals in the environment.
the technologies used by the farmers. Farmers of traditional polders
produce one crop per year, using residual moisture as lake waters
Changes in the water table
recede each season. In the improved polders, farmers use small
The GIWA Assessment considered that there are moderate changes
dams and pumps which al ow them to produce as many as three
in the water table due to reductions in aquifer recharge and the
crops each year. SODELAC believe that the agricultural potential of
increased sinking of boreholes. There is little information concerning
the Lac Prefecture has not been utilised and with improved water
groundwater, but it is considered to be abundant, which does not
management, production could increase to meet national wheat and
necessarily mean that it is always easy to exploit. However, it may be
rice consumption needs (FEWS 1997).
stated that the cumulative rainfall shortages and virtual y generalised
decline in low flows has led to a reduction in groundwater reserves in
Pollution of existing supplies
the river basins, and in particular the phreatic aquifers. The reduced
The GIWA Assessment regarded the pol ution of existing water supplies
flooding of the plains has negatively impacted on the important role
as only having a slight effect on the freshwater shortage facing the
wetlands play in recharging the underground aquifers, in both the
region, although further scientific justification is needed. Water quantity
Yaérés in Cameroon and the Hadejia-Nguru plain in Nigeria (LCBC 1998).
and quality play a significant role in the determination of availability and
According to Hol is et al. (1993) groundwater storage beneath the
access to freshwater resources. In sub-Saharan Africa in general, water
Hadejia-Nguru floodplain was largely stable between 1964-1971 and
quality is a major problem (AEO 2002, GEO 3 2002). People may reside
1975-1982 but diminished by an estimated aggregate of 5 000 bil ion m3
in an area with plenty of water and yet still not have access to it freely
as a result of the drought years and reduced flooding in the early 1970s
because of its status of purity and suitability for human consumption.
and particularly in the 1980s. However, a study in southwest Niger by
Access to safe water however is an option most households in the Basin
Favreau et al. (2001) concluded that the clearing of native vegetation
do not have. For example, in the far north provinces of Cameroon in
increased the rate of groundwater recharge. Therefore, the decrease in
the Lake Chad Basin sector of Cameroon, only 5% of households have
vegetation cover experienced in the Lake Chad Basin may also influence
access to safe water (ECAM 1996 in Amin & Dubois 1999). According to
the rate of groundwater recharge. As shown by Gaston (1996) in Chad,
World Bank Development indicators for the countries of the Lake Chad
the northern limit of the Sahel moved 100 km to the south as a result of
Basin, access to an improved water resource has remained static or only
the 1973 drought. The dead and fal en trees were a result of inadequate
increased slightly between 1990 and 2000.
soil moisture to sustain the vegetation. A net decrease in groundwater
reserves would have potential impacts on the drinking water supply
Presently there is a lack of information regarding the pol ution of
of a large proportion of the Basin's population who dig wel s to obtain
existing water supplies in the Lake Chad Basin. There is relatively little
groundwater reserves (Figure 38).
industrial or mining activity in the region and the impact on water
supplies appears to be minimal. Effluent discharges in the upstream
parts of the Basin (particularly in Kano, Nigeria) from tanneries and
textile production have led to localised fish kil s. It is likely that untreated
domestic wastes are also being discharged into the rivers of the Basin,
with negative effects on water quality.
Water contamination and reduced stream flows has also caused the
proliferation of weeds, mainly Kachal a grass (Typha sp.) that have
encroached into reservoirs and clogged channels near Madachi,
Kirikasama and Nguru on the Hadejia River (IUCN 1998), and hampered
freshwater use. There have also been further reports expressing concern
for water quality in the Hadejia River, as salinity has been increasing
(World Bank 2002b). Although agriculture uses predominantly
Figure 38 Women fetching water from a well in southern Niger.
traditional methods, the production of crops such as cotton and rice
(Photo: FAO P. Cenini 1995)
50
GIWA REGIONAL ASSESSMENT 43 LAKE CHAD BASIN
ASSESSMENT
51
Although reserves are abundant in the region, due to the recent
been time consuming and a further financial burden in a poverty
declines in their recharge, aquifers are currently vulnerable to over-
stricken region. The decrease in volume and flow of the Komadugu-
extraction exceeding their safe yield. Surface water scarcity during
Yobe River has encouraged the growth of weeds in the main river
the drought as well as adaptation strategy increased the abstraction of
courses, causing flooding in the vil ages along the river banks as flow
groundwater for human, agricultural and pastoral purposes (Thieme
can no longer take place normal y towards the downstream part of the
et al. In preparation). It is known that there has been indiscriminate
River (LCBC 1998). The Lake's ever-fluctuating shores are preventing
sinking of boreholes that have led to a decrease in groundwater
the instal ation of permanent infrastructure and reduced river flows
reserves. Groundwater drawdowns of several tens of metres have been
are reducing the accessibility for inland transport. Freshwater shortage
reported in the Maiduguri area of Nigeria due to the over-pumping of
is therefore compromising significant development and contributing
water. Isiorho et al. (2000), estimated that 10-25% of water in the region
to economic destitution faced by the riparian countries.
is utilised inefficiently and attempts to improve the situation have
achieved little. The droughts of the 1980s triggered the mass dril ing
Freshwater shortage is directly impacting on the following
of 537 wash boreholes between 1985 and 1989 (CBDA 1990 in Isiorho
economic activities:
et al. 2000). This rapid development resulted in unsatisfactory logging
of wel s by several contractors who were not supervised and did not
Impacts on agriculture
use hydro-geological data when locating the wel s. Most of these deep
Agriculture in the drier downstream regions and around Lake Chad
boreholes are uncapped and freeflowing. Normal y the local authorities
is more dependent on water level as low precipitation limits rain-
cap artesian wel s, but local people uncap them and al ow the water
fed agriculture. Water level is strictly dependent on the hydrology
to flow out and cool so that their animals can use it. This free flow of
of the rivers and thus has suffered from water deficits. This bedrock
water is very inefficient and results in vast amounts of water being lost
economic activity is considered as being the most affected by
due to the high rates of evaporation in the region (Isiorho et al. 2000).
freshwater shortages. Large irrigation projects undertaken with a view
Water points at Ala near Marte (Nigeria) monitored on a routine basis by
to agricultural intensification on large areas along the Chari River in
the Lake Chad Basin Commission, have shown a sharp decline of about
Chad (SONASUT at Banda, 4 000 ha), the Logone River in Cameroon
4.5 m within a period of one year attributable to the general decline
(SEMRY projects in Yagoua, Maga and Kousseri), and in Chad (Casier
in the artesian pressure within the Basin. Most desert species have also
A, B, C at Billiam Oursi, Bongor, 7 120 ha, and Laď) the Komadugu-Yobe
disappeared due to the declining water table.
River (e.g. Kano River Irrigation Project and Hadejia Val ey Project),
and the SCIP project on the lake shore (northeast Nigeria), have not
Economic impacts
produced the expected results. Rather than stimulating increased
The GIWA Assessment considered freshwater shortage caused by
agricultural production, they have reduced the flooding of large
both anthropogenic and climatic changes as having severe economic
areas of farmland that was previously very productive for flood and
impacts. Over-abstraction of water by upstream users at unsustainable
recessional farming. The Maga Dam constructed as part of the SEMRY
levels in a period when there has been a substantial decrease in
project (north Cameroon) abstracted water from almost 700 km2 of
precipitation in the watershed, has led to a reduction of the supplies
the Yaéré floodplains that smal farmers cultivated during the dry
for downstream users. This has essential y, had a direct negative
season after a good humid year. The supply of water to the floodplains
impact on the economic activities of agricultural production (crops,
became increasingly deficient due to the persistent drought, and they
livestock), forestry, fisheries, agro-processing industries, tourism and
no longer reached al the Yaéré floodplains that are favourable to dry
wildlife. Declining freshwater availability also impacts on the general
season agriculture (Nami 2002). A reduction in floodplain surface area
downstream ecology thus reducing the environment's capacity to
has consequently led to a decline in agricultural production and has
support economic activities. The irrigation developments have taken
accentuated food insecurity in the region (Nami 2002).
place without consideration of impacts on the floodplain or the loss of
economic benefits previously provided by the floodplain (Barbier et al.
More than 95% of crops in the Basin are traditional and therefore do not
1991 in Schuijt 2002).
rely on the water from the irrigation project but are dependent on the
rains. The reduced rainfall has therefore impacted directly on yields of
Declining freshwater has impacted on water-related infrastructure. The
sorghum and mil et in the Sahel and the Sudanese zone (see review:
lower recharge rates of aquifers have facilitated the need to deepen
Nami 2002). For example, in Chad annual sorghum production
wells and increase pumping to reach the lower water table. This has
was less than 250 000 tonnes during the 1972-1974 droughts and
50
GIWA REGIONAL ASSESSMENT 43 LAKE CHAD BASIN
ASSESSMENT
51
180 000 tonnes during the 1982-1984 droughts, compared with mean
which affected the area's vegetation through the consumption of
annual production of 328 000 tonnes (1961-2002) (FAOSTAT 2003).
woody plants (USGS 2001).
There has been a proliferation of pests due to the droughts and water
Impacts on fisheries
management practices employed. In Chad between 1986 and 1988, the
(See also section on Unsustainable exploitation of fish).
farmers were plagued with desert locusts (Schistocerca gregaria) who
were already tackling an economic downturn caused by the succession
The Sahelian droughts of 1972-1974 and 1982-1984 combined with
of droughts, in addition to civil wars, that had depressed cotton prices in
anthropogenic stream flow modification caused a reduction in the
1985 (Keith & Plowes 1997). Box 3 describes how the failure of the South
extent of Lake Chad and the wetlands which consequently altered the
Chad Irrigation Project (SCIP) has resulted in an ecological imbalance
fish habitat. Fisheries production has experienced large fluctuations due
in the region.
to these environmental changes. Annual production escalated in the
early 1970s before fal ing significantly in the 1980s (Neiland & Verinumbe
Box 3
Typha australis and Quelea quelea pest infestation.
1990), and has since increased once again (Neiland & Béné 2003).
The Nigerian Government, worried about low agricultural production in the Lake
Chad Basin, took steps to intervene through the South Chad Irrigation Project (SCIP),
in order to stabilise agricultural production. With a goal of irrigating 67 000 ha, the
The decline in wetlands has caused a proportional decline in the yield
system depended on lake water levels. As these levels fell in the late 1980s, irrigation
could not take place.
of fish in the wetlands (Thomas 1996 in Oyebande 2001). In the Waza-
The irrigation channels, which were not lined, now provide suitable shallow water
and marshy habitat for emergent hydrophytes (plants that grow in wet conditions).
Logone floodplains there has been an estimated 90% reduction in fish
Plant biodiversity is lost in this way, as the complex variety of plants adapted to the
yields within flood-fed wetlands (Wesseling et al. 1994 in IUCN 2002b),
complex rhythm of rising - steady - falling water levels are disadvantaged in favour
of emergent rhyzomatous plants that can survive long dry spells. The SCIP channels
and a reduction in the capacity of wetlands to provide nursery grounds
are clogged with one of these plants, the bulrush Typha australis.
The Typha stand is a preferred nesting ground of the avian pest Quelea quelea. Quelea
for fish stocks in the wider river systems of the Logone and Chari. In the
infestation is an additional pressure on the already unstable livelihood systems of
Komadugu-Yobe River Basin it has been observed that in the last 20 years
the Lake Basin. The regular loss of rice and other grain crops to large flocks of feeding
quelea is a major concern. The Government has initiated a quelea control effort through
the quality of fish in the oxbow lakes has declined due to siltation, from
massive aerial spraying of toxic chemical control agents. While the effectiveness of
this control method is an ongoing debate, the long-term effect of these toxic chemical
reduced stream flows, making the lakes too shal ow (Oyebande 2001).
sprays on other life forms has not been determined.
Low flows in rivers also constrained the seasonal fish migrations.
(Source: http://www.panda.org)
Lacustrine species, that are often migratory and more selective in
spawning preference, suffered from high mortality and fewer accessible
Impacts on animal husbandry
spawning sites (Bénech 1992). Natural selection operating on the fish
Before the advent of persistent drought, animal production and export
communities during this dry period favoured marshy species adapted
was the third largest source of income for families in the Basin. Since
to freshwater shortage conditions (Benech et al. 1983) (see Habitat and
the droughts the amount of land suitable for grazing has decreased. For
community modification, Modification of fish habitats).
example, in the Hadejia-Nguru wetlands (Komadugu-Yobe River Basin)
the receding floods previously al owed fresh grass to grow using the
The fisheries of the Lake Chad Basin are very important economically
residual moisture. This al owed the wetlands to sustain large numbers
to the rural communities (see Regional definition, Fisheries of the Lake
of cattle during the dry season due to the high quality grazing land
Chad Basin) (Neiland & Béne 2003). The fluctuations in fish production
compared with the dry surrounding areas. However, wet season peak
therefore have had a significant impact and have contributed to the
flows are necessary to inundate these grazing lands. With reduced peak
regional poverty.
flows the extent of high grade grazing land has declined. The Yaéré
floodplain pastures (Chari-Logone River Basin) are also an important
Impacts on food security
dry season grazing resource. Prior to the loss of floods, it is estimated
Freshwater shortages in the Lake Chad Basin have compromised the
that some 20 000 to 50 000 sheep and goats spent the dry season on
performance of agriculture, the fishery and livestock. Consequently
the floodplain (Wesseling et al. 1994 in IUCN 2003b). Most of these
the people of the Basin have become vulnerable to food insecurity
formal y flooded pastures have now lost their perennial grass cover,
(AEO 2002).
leaving only degraded grasslands of inferior quality and decreased area
(IUCN 2003b). Reduced grazing land across the entire basin fol owing
FAO Statistics have shown that the food situation in Niger and particularly
the droughts of the 1970s, encouraged herders to shift from grazing
Chad are precarious as a result of rainfal deficits, but more so also as a
animals (cattle and camels) to browsing animals (sheep and goats),
result of regional imbalances of water distribution (FAO/GIEW 2001).
52
GIWA REGIONAL ASSESSMENT 43 LAKE CHAD BASIN
ASSESSMENT
53
Food shortages have increased significantly in Chad and Niger both
Republic being at the helm of severe impacts. As a consequence of the
of which are downstream of the Komadugu-Yobe and Chari-Logone
acute freshwater shortage experienced in 1973, drought kil ed 100 000
rivers. In 2000, Niger's food supplies were 25% short of the national
people in the Sahel, and even countries in the humid zone suffered
requirements leading to high food prices, particularly for mil et. In Chad,
lowered rainfall and reduced crop yields (see review: AEO 2002).
under normal conditions cereal production only covers 75% of national
food requirements and during 1999/2000 this situation was further
During the wet season, water filters very slowly through the very
exacerbated by erratic weather conditions resulting in food insecurity.
clayey Karl soil causing floods. Taking into account the low levels of
The World Food Programme in response to food insecurity in Chad
hygiene in riparian vil ages often without latrines, soiled pits overflow
distributed emergency food to 252 000 people in 2003 (WFP 2003).
and spill into watercourses during the floods, the contaminated water
causes various il nesses such as cholera and malaria to emerge. During
Figure 39 shows the extreme and high vulnerability zones in Africa. It
periods of drought and due to the absence of plant cover, violent winds
can be seen that in the last 30 years famine has been experienced in the
transport epidemics such as meningitis, which is permanently rife in the
north and Sudan sectors of the Basin and that all of the countries have
region (Nami 2002).
been subjected to either food shortages or acute malnutrition except
for Nigeria, Algeria and Libya.
According to the World Bank (1994), out of eight major diseases or
disease groups found in developing countries, four are linked to water
Health impacts
supply and sanitation or to vectors (organisms) that breed in water.
The GIWA Assessment considered the impact of freshwater shortage on
Furthermore, many water resource projects alter the environment so
the health of the Basin's population as being moderate in terms of the
as to either increase the number of vectors or increase the amount
number of people affected, the degree of severity, and the frequency
of contact with disease-causing organisms (Tiffen 1989a and b).
and duration. Lack or inadequate potable water supplies coupled with
In Northern Nigeria where irrigation projects have proliferated in
poor or lack of proper sanitation are two very significant problems
recent years, the number of vectors or disease-causing organisms
facing more than half of the population of the region. The problem
has more than doubled (Tiffen 1989a and b). Ofoezie (2002) classed
differs from country to country with Niger, Chad and Central African
Bauchi, Kano and Borno States as having hyperendemic prevalence
of schistosomiasis. In Kano, the prevalence of the disease rose from
0.8% before 1973 to 37.6 % after 1973 fol owing dam construction.
The communities surrounding Tiga Dam have a 46.7% prevalence of
schistosomiasis (Imevbore et al. 1988, Ndifon et al. 1988). The artificial
lakes, unlike other freshwater bodies such as rivers, lack currents and
seasonal ponding, and subsequently provide favourable conditions for
year round transmission of vector-borne diseases (Ofoezie 2002).
The reduced river flow caused by these irrigation projects can also
reduce the river's waste assimilative capacity resulting in decreases
in the level of sanitation. Poor sanitation is a major contributor to the
spread of diseases such as diarrhoea, cholera, typhoid, intestinal worms
and hepatitus (A and E). In N'Djamena 1 317 cases with 94 deaths were
reported in an outbreak of cholera in 1996 (WHO 1996).
Other social and community impacts
The GIWA Assessment evaluated the impact of freshwater shortage on
the social and community status as being moderate. Social pressures
caused by decreased freshwater availability have aggravated human
conflicts. Competition between user groups for shared resources
°
including space has been accentuated e.g. agriculture versus tourism
Figure 39 Food security in Africa.
(Source: Atlas du monde diplomatique 2003)
and conservation versus food production.
52
GIWA REGIONAL ASSESSMENT 43 LAKE CHAD BASIN
ASSESSMENT
53
The freshwater shortages have increased the potential for upstream/
receded. Although each of the vil age communities described how they
downstream conflict. In the Komadugu-Yobe Basin disputes between
had original y set up as fishing settlement during the 1970s and 1980s,
the downstream riparian states of Borno and Yobe (Nigeria) were fuelled
in 1993 the majority of the households relied on farming as their main
by the lack of adequate water for their needs. They blamed this on the
source of income (Sarch 1996 in Sarch & Al ison 2000). Many of the Hausa
upstream states that they accused of storing all the water from the Tiga
communities that had been attracted by the fishing opportunities of the
and Chal awa Gorge dams, and releasing too little for downstream users
1970s, switched to farming as the lake shore contracted and revealed
(Oyebande 2001). Recently there has been pro-active opposition from
the moist soils of the lake floor around their fishing settlements. Of the
the downsteam states of Yobe and Borno to the construction of the
80% of Hausa households who had fished Lake Chad in the past, the
Kafin Zaki Dam on the Jama'are River (IUCN 2003a).
majority (58%) now relied on farming for more than a quarter of their
annual income (Sarch 1999 in Sarch & Al ison 2000).
During the dry seasons, the nomadic pastoralists move their stocks
southwards in search of grazing areas. The continuing drought has led
The mobility and livelihood flexibility of the rural communities making
to further migration of pastoralists from the increasingly dry northern
their living on the shore of Lake Chad has enabled them to respond to
regions into the southern river basins. This has increased ecological
the extreme fluctuations observed. This ability to react and cope with
stress on river basin resources and the abandonment of traditional,
changing livelihood opportunities and constraints are characteristic of
effective resource management practices (World Bank 2002) and has
these communities whom have changed livelihood strategies many
put greater pressure on the water resources in the southern river basins
times in the past and who do not rely solely on fishing. It is not accurate
of the Komadugu-Yobe and Chari-Logone.
to talk of fish stocks as being sustainable in the context of this level
of natural fluctuation. Around Lake Chad people have adapted their
The contraction of the Lake is also a potential source of conflict due
livelihoods and are able to exploit the same areas of the Lake Basin in
to disagreements over whether the national borders also migrate
a range of environmental conditions through fishing during the flood
with the Lake. The political boundary is normal y shifted in favour
and farming after the flood has receded. It is argued that such strategies
of the dominant power in the region, and has led to some clashes
highlight the importance of enhancing or maintaining the flexibility
between neighbouring countries in the region (Isiorho et al. 2000).
of lake shore livelihoods rather than constraining it with fixed fisheries
Fishermen have migrated fol owing the receding lake and thus crossed
production quotas, seasons or areas (Sarch & Allison 2000).
political borders, notably fishers from Niger and Nigeria. There have
consequently been armed clashes with local fishermen from Chad over
Future outlook
who had the right to the declining fishing resource.
The GIWA Assessment predicts that the magnitude of freshwater
shortage is to become increasingly severe by the year 2020. The Basin
However, many fishermen in the Basin have tried to adapt their
is set to experience major alterations and developments in the next 20
livelihood strategies to compensate for declining fish production
years that need to be taken into consideration.
caused by the contracting lake. Sarch and Birkett (2000) have compared
the livelihood responses of fishermen on the southwestern shore with
Future climate change
the lake fluctuations recorded by ground gauges, satellite imagery and
The future variability of the climate is critical to future freshwater
radar altimetry. This shows that since 1972, the communities of the
availability. Future climate change in Central Africa has yet to be
western shore have made important responses to the contraction and
determined as there are presently no accurate models for predicting
recent expansion of the Lake. Two of these responses were resettlement
future precipitation rates over the region. During the 1990s there has
and switching livelihood strategies:
been evidence of increased precipitation and consequential increases
in discharge from the Chari-Logone River. However, the climate remains
As the lake levels dropped during the 1970s and 1980s, the maximum
drier than pre-1970s with only isolated wet years (L'Hôte et al. 2002), and
extent reached by the Lake each year receded eastwards towards the
it is too early to state whether this most recent cycle will persist. Some
centre of the Lake Basin. Communities fol owed the lake shore and in
forecasts predict that the scenario between 2003 and 2020, at best,
some cases moved eastwards more than once.
could be similar to the current status from 1973 until now (Republic
of Chad 2003). This is based on the scenario of future global warming
The second response to the contraction of the Lake was to diversify from
linked to a weakening in carbon sinks and radiation sinks in the polar
relying entirely on fishing to farming the lake floor as the floodwater
regions with reduced deep water formation due to reduced heat
54
GIWA REGIONAL ASSESSMENT 43 LAKE CHAD BASIN
ASSESSMENT
55
transfers from the southern hemisphere to the north. It is postulated
Petroleum exploitation
that reductions to the radiation and CO sinks could give rise to
The employment opportunities presented by the Chad oil exploitation
2
significant positive feedbacks leading to an increase in global warming
that began in July 2003, wil encourage migrant workers to the area
(Lewis 1989 in Evans 1996). However the future influence of these global
and thus increase and concentrate pressure on water resources. There
processes on the region's climate over local factors remains a subject of
is a possible risk of pol uting existing water supplies from run-off
study and debate. Local factors will undoubtedly also continue to play
from the oil fields and construction sites although a comprehensive
an important role in driving the future climate of the Sahel.
management plan has been implemented to mitigate al environmental
risks (ESSO 1999). The Chad-Cameroon pipeline crosses transboundary
Population growth
waters several times; there is always a possibility of an oil spill incident
Presently, the annual population growth (2000-2005) is estimated to be
even with stringent safety measures instal ed. There are six area-specific
2.6%3 (UN Population Division 2002) and the total population for the
Oil Spill Response Plans in place to react to any such emergency.
Basin in 2020 could be over 56 million (UN Population Division 2002).
This significantly enlarged population wil depend on the Basin's limited
Conclusions
water resources for their survival. If the current trends of urbanisation
The GIWA Assessment considered the major issues of freshwater
continue, particularly in Nigeria, there could be an increasing demand
shortage as climate change and stream flow modification, which
for water supply to municipalities.
consequently have decreased water table levels. Natural climatic
variability has been exerted throughout the history of the Basin and is
Increased water use
considered as playing an important role in fluctuations in stream flow
For the foreseeable future water demands in the Lake Chad drainage
and in the level of the Lake Chad (see Regional definition, History of Lake
basin are expected to increase, as the population becomes more
level variability). Recent climatic variability can be primarily attributed
dependent on irrigation agriculture (Hutchinson et al. 1992, FEWS 1997
to these long-term climatic cycles but may have been exacerbated by
and 1998 in Coe & Foley 2001). Therefore it is important to learn more
recent human induced Sea Surface Temperature (SST) and land surface
about the response of this very sensitive system (Coe & Foley 2001).
anomalies. The GIWA Assessment refers to anthropogenic global
The population trend of the conventional basin reveals that, from a
change and therefore it was considered as having a moderate impact.
standpoint of the Malthusian concept (as compared to other schools
The GIWA Assessment considered anthropogenic stream flow
of thought, such as Virtual water, structural inequality, environmental
modification as having a severe impact on freshwater availability.
or social scarcity, lateral pressure, etc.), the per capita renewable water
Although the Lake has already dried out several times in the past
availability which presently places the region in the class of "water
(Servant & Servant 1983), recent trends have been exacerbated by the
stress" (1 263 m3) could worsen to "acute water shortage" situation
diversion of water by dams for irrigation projects such as the SEMRY
(698 m3) by the year 2025 (LCBC 2000b).
(north Cameroon) and the KRIP (northeast Nigeria). The level of water
use has been unsustainable in the climatic scenario of the past 40 years.
Water development projects
Birkett (2000) concluded that the seasonal fluctuations of the lake
Planned water development projects, particularly those in the Komadugu-
level are stil primarily control ed by climate, not water management
Yobe Basin will increase water requirements and outstretch available
practices. Nevertheless, stream diversion is a key factor in the extent of
supplies. The water requirements in the Hadejia River Basin are already at
the freshwater shortage downstream of the large dam constructions
times exceeding the available water resources (Bdilaya et al. 1999) and are
and is a concern regarding the use of what water supplies that is
at a critical point where further expansion of requirements of one use wil
available in the region during periods of low precipitation.
deprive other users of water. An IUCN study estimated that the potential
water requirements are at least (not taking into account evaporation
The issue of the pol ution of existing water supplies is considered as
losses) 2.6 times greater than the mean surface water resources. In the
having a slight impact due to limited industrial activity in the Basin.
Jama'are and Yobe river basins available water resources presently meet
However with the onset of petroleum exploitation in Chad, pollution
requirements. If the construction of the Kafin Zaki Dam is completed
of water supplies either directly from the oil projects activities or by
for the proposed Jama'are Val ey Irrigation Projects and some smal er
the increased urbanisation in the region could increasingly become a
irrigation upstream of Katagum, potential water requirements for the
concern. There may also be contamination from agro-chemicals as the
Jama'are River Basin could be more than 1.8 times the available water
production of crops such as cotton requires chemical sprays. Pollution
resources in a mean year (Bdilaya et al. 1999).
studies will be required to monitor the impact and distribution of these
3The estimate of population growth is based on national figures from United Nations Population Division 2002, with the assumption that the population growth is evenly distributed within each country
within the Lake Chad Basin.
54
GIWA REGIONAL ASSESSMENT 43 LAKE CHAD BASIN
ASSESSMENT
55
T
C
in the environment, and to assist in the formulation of regulations
P
A
Habitat and community
I
M
regarding pol ution, which are lacking in the current legislative
modification
framework (see Pollution, Agricultural chemical pollution).
Aquatic habitat modification has primarily been a result of the
The issue of changes in water table was regarded as having a moderate
freshwater shortage concern in the region. For example, wetland habitat
impact due to the reduction in the wetlands and lake and therefore
modification can be mainly attributed to declining stream flows and the
their aquifer recharge function, and due to the indiscriminate sinking of
diversion of water away from the wetlands. However, the consequences
boreholes that are often uncapped and free flowing. There is however
of habitat modification have been severe in the Lake Chad Basin, but
a lack of information on groundwater reserves and the impacts of
although the impacts are being experienced across the region they are
abstraction are not known.
general y localised and terrestrial. The GIWA methodology addresses
transboundary water issues and therefore the concern was assessed as
Overal , the concern of freshwater shortage was considered as being
having only a moderate impact. However to ful y understand the wider
severe due to it driving almost al environmental concerns in the
context regarding habitat modification, terrestrial and non-transboundary
Lake Chad Basin. The ecological impacts on the wetlands and lake
issues have also been discussed, but not assessed under this concern.
environment have been severe. For example, since the 1960s wetland
resources within the Basin, such as the Yaérés in Cameroon and the
Modification of aquatic habitats
Hadijia-Nguru floodplains in northern Nigeria, have been reduced by
(assessed by GIWA)
almost 50% (Barbier et al. 1997) and the Lake Chad was reduced in the
The GIWA Assessment identified community modification and habitat
1990s to just 10% of its former extent prior to the 1960s. Freshwater
loss as having a moderate impact. The wetlands, lakes and rivers have
shortage has had severe economic impacts on the fisheries, flood-
all experienced habitat loss and modification to a certain degree. The
recessional agriculture, livestock rearing and other wetland industries.
most severe habitat modification has been caused by drought and
There has consequently been severe food insecurity in the region and
the construction of dams in the Chari-Logone and Komadugu-Yobe
a proliferation of diseases. Large dam developments in the upstream
river basins. These have altered the seasonal timing of flooding in the
catchments of the Chari-Logone and Komadugu-Yobe river basins
floodplains and have thus reduced the size of the wetlands. Stream
has caused conflicts due to downstream users receiving insufficient
flow modification has also significantly affected the lake environment
amounts of water to meet their requirements. There has also been
as the habitat has changed from predominantly open-water to a
significant migration from the north of the Basin as "environmental
marshy environment as the Lake contracted. Vegetation degradation
refugees" have fled drought, increasing the pressure on natural
has contributed to regional climate change and consequently the
resources and inciting social tensions.
decreased rainfal experienced in the region. The GIWA Assessment
predicts that the riparian countries are likely to face increasingly severe
Leading up to 2020 the Lake Chad Basin is set to experience some
problems with the possibility of greater aridity and increased pressure
major alterations, namely the large-scale oil developments in Chad
on ecosystems and ecotones to support rapidly increasing populations.
and water management projects that have the potential of changing
For example, Nigeria's population is projected to reach 338 million by
the freshwater shortage situation for better or for worse.
the year 2025. This figure is 123 million in excess of its carrying capacity
with intermediate inputs (Nana-Sinkam 1995).
Wetland modification
Wetlands play an important role in both biological and socio-economic
systems contained in the Lake Chad Basin. Wetlands are an important
source of water and nutrients necessary for biological productivity
(Thompson 1996 in Schuijt 2002). They provide people with fertile
soils for agriculture, fish, fuel wood and raw material for mats and roofs.
Wetlands also store water temporarily and recycle nutrients and human
waste to improve water quality. It is clear how valuable wetlands are to
a considerable portion of the population who survive by exploiting its
natural resources (Acreman & Holis 1996).
56
GIWA REGIONAL ASSESSMENT 43 LAKE CHAD BASIN
ASSESSMENT
57
The floodplains and wetlands have consequently been intensively
Reduced numbers of deep-rooted trees that recycle minerals
cultivated, and the wet areas are frequented by domestic animals
locked in soil.
especial y during the dry season when the pastoral groups migrate
southwards in search of grazing areas. The Hadejia-Nguru wetlands, in
The bird life has also been threatened by decreasing water levels.
northern Nigeria, host approximately 120 000 cattle in the wet season
Recently there have been concerns over the availability of nesting sites
and 320 000 cattle in the dry season, 370 000 goats and 375 000
for the endangered West African subspecies of black-crowned crane
sheep (RIMS 1992, using aerial reconnaissance). Although the North
(Balearica pavonina pavonina) and adequate wintering grounds for
East Arid Zone Development Programme (NEAZDP) estimated that
intercontinental migrants such as the ruff (Philomachus pugnax) (see
there could be twice as many. The wetlands have also experienced
review: Mockrin & Thieme 2001). The abundance of the 17 species of
intensified agricultural production. These human activities have had
waterfowl and 49 other wetland species recorded on Lake Chad, have
significant impacts on wetlands. Wetlands and other protected areas
correlated with the extent of the water surface of Lake Chad and with
continue to be exploited by the local communities with surveys in the
wetland conditions elsewhere in West Africa (Keith & Plowes 1997).
Yaérés (northern Cameroon) recording severe losses. The floodplains
Although little is known on the range, abundance or status of the listed
and wetlands, particularly in the Hadejia-Nguru and Yaérés have been
rare species river prinia (Prinia fluviatilis), the contraction of the wetlands
claimed for settlements, farms, cattle grazing and as bases for fishing
is likely to have been detrimental to their populations.
(see review: Mockrin & Thieme 2001).
The decreased inundated area of the Waza-Logone floodplain has been
The modification and loss of wetlands is however primarily due to
a major cause for the reduction in the number of kob, and the complete
the decreasing stream flows, resulting from persistent droughts and
disappearance of buffalo, waterbuck, bushbuck and common duiker in
upstream dam impoundment (see section on Stream flow modification).
the Waza National Park (Wesseling et al. 1994 in IUCN 2003b).
These floodplains were once the second largest wetland in Africa, highly
productive, and supporting a diversity of wildlife (USGS 2001). Since
Sedimentation has increased in the Hadejia river system due to the
the 1960s wetland resources within the Basin, such as the Yaérés in
reduced stream flows, but also because of the declining wetlands, as
Cameroon and the Hadejia-Nguru in Nigeria, have been reduced by
they play an important role in trapping sediment and in protecting river
almost 50%. The Hadejia-Nguru floodplains in northern Nigeria at one
banks from erosion in upland wetlands. The riverine wetlands such as
time covered nearly 300 000 ha, today, these wetlands have shrank to
the Yaérés also regulate the floods by storing excess water.
an estimated 70 000 to 90 000 ha (Barbier et al. 1997).
Modification of fish habitats
Before the Sahel droughts in the 1970s the southern pool was
Aquatic habitats have experienced extreme alterations due to the
characterised by Cyperus papyrus and the northern pool was dominated
decreasing stream flows and consequential lake shrinkage. As the
by Typha australis. As the Lake contracted in the early 1970s, the northern
Lake contracted, it changed from hosting a predominantly open
pool became even more saline and the permanent swamps virtual y
water ecosystem to marshes. The aquatic flora and faunal community
disappeared. In the southern pool in particular the Cyperus papyrus
structures were modified accordingly. The fisheries market species
communities were badly affected and replaced by Vossia cuspidata
composition has been a prominent indicator of these changes.
meadows (Verhoeye & De Wulf 2001).
Among the most important commercial fish species recorded in the
Kindler et al. (1990), revealed the relationship between freshwater
Nigerian sector of Lake Chad before the 1972-1974 Sahelian drought
shortage and floristic degradation. Fundamental y, the research showed
(recorded 1963-1967) were Lates, Hydrocunus, Labeo, Citharinus, and
that freshwater shortage led to:
Distichodus (Bukar & Gubio 1985 in Neiland & Béné 2003). Fol owing
Reduced canopy coverage that increases ground temperature, soil
the 1972-1974 drought these species general y disappeared and were
water evaporation, and opens up the soil surface to rain drop and
replaced by species such as Clarias; for example, in 1972 Clarias made up
wind erosion;
0% and Lates 52.7% of fish markets, whereas in 1976 they consisted 89.6%
Change of species from perennials to annuals;
and 0%, respectively. These changes were accelerated by intensive
Reduced biomass of forest products from lowered water tables or
opportunistic fishing effort in the northern pool in which open-water
overexploitation;
species such as Lates were easily caught. Benech et al. (1983) concluded
Loss of root volume that increases soil erosion;
that the natural selection operating on the fish communities during the
56
GIWA REGIONAL ASSESSMENT 43 LAKE CHAD BASIN
ASSESSMENT
57
drying up period (1972-1978) favoured the development of these marsh
vegetation leads to increased albedos and increased radiation losses,
adapted species endowed with adoptions of diet, reproduction and
surface cooling and greater atmospheric stability which reduces rainfall
respiration that al owed them to survive in an unstable environment,
and encourages persistence (Charney 1975 in Evans 1996).
at the expense of open-water species that are general y migratory with
strict preferences (Neiland & Béné 2003).
According to Coe and Foley (2001) overgrazing of the savannah is a
contributing factor in the shrinking of the Lake. As the climate became
Fol owing the total drying of the northern pool in 1975, fishermen
drier, the vegetation that supported grazing livestock began to
migrated south and began to target the southern pool more seriously
disappear. The vegetation has a significant influence, especially in semi-
(Sagua 1986 in Neiland & Béné 2003). This environment, containing both
arid regions, in determining weather patterns. The loss of vegetation
open water and marshes, may explain the slight reappearance of some
in itself contributed to a drier climate. Human and animal populations
lacustrine species such as Lates, Hydrocynus, Labeo and Distichodus and
came to rely more and more on water from the Lake. Massive irrigation
a decline in mudfish from 1980 onwards. However, current research
projects to combat the drier climate diverted water from both the Lake
suggests that the majority of fish moved through the Baga-Kawa market
and the main rivers that empty into it. Coe and Foley described this
since the Lake has evolved to its present lesser state, originate from the
situation as a domino effect; overgrazing reduces vegetation, which
swamp fisheries, which surround the Lake Chad and seasonal y extend
in turn reduces the ecosystem's ability to recycle moisture back into
northwards into the Nigerian sector (Neiland & Béné 2003).
the atmosphere, and thus contributes to the retreat of the monsoons.
The consequent drought conditions have triggered a huge increase
As would be expected, data for Kinnaserum market, Chad, indicates
in the use of lake water for irrigation, while the Sahara has gradual y
that the species, which disappeared from the Nigerian sector of the
edged southward. This is a hypothesis and the domino effect may not
Lake, are still found within markets serving the lacustrine environment
necessarily affect the source area, especial y in such flat lands widely
of the southern pool. Typical examples include Hydrocynus and Lates,
open to advection/free lateral air flows. Further studies are needed
but also swamp species such as Clarias (catfish), tilapi ne cichlids,
regarding the influence of regional habitat modification on regional
Synodontis, Gymnarchus, Mormyrus spp. and Mormyrops. One reason for
climate change.
survival of the purely open-water species is the connection between
the southern open water and the Chari-Logone river system, which can
Economic impacts
provide the refuge of deeper and wel -oxygenated water. Data from
The GIWA Assessment regarded the economic activities most affected
Maroua market, Cameroon, which services mostly the Yaéré floodplains
by habitat loss and modification as the fisheries, agriculture, livestock
and Maga Reservoir traded in species common to river and floodplain
and wetland industries. These activities were severely impacted but
environments, dominant species included Alestes, Clarias, Petrochephalus
primarily as a result of freshwater shortage. Wetlands provide essential
and tilapine cichlids. Although time series data is not available for the
income and nutrition benefits in the form of agriculture, grazing
Chadian and Cameroonian markets, composition of north Nigerian
resources, non-timber forest products, fuel wood and fishing for
market species for 2000-2001 was similar to that noted during the
local populations. The wetlands also serve wider regional economic
early 1980s mid-1990s suggesting a stabilisation in environment of
purposes, such as providing dry-season grazing for semi-nomadic
the lesser lake state and the associated species composition (Neiland
pastoralists, agricultural surpluses for neighbouring states, groundwater
& Béné 2003).
recharge of the Chad Formation aquifer and insurance resources in
times of drought (Barbier 1997).
The change in dominance between open-water and marshy species
is very rapid when there are changes in the lake environment, and as
Several economic activities are severely affected by wetland
no species are restricted only to the Lake, the reconstruction of stocks
destruction:
is possible from river fish communities if a normal lake state reoccurs
Agriculture: dryland farming of sorghum and mil et, seasonal y
(Benech et al. 1983 in Neiland & Béné 2002b).
flooded rice farming, flood retreat farming (mainly cowpeas)
and irrigated farming. Rice is the most important crop grown in
Regional climate change caused by habitat modification
seasonal y flooded areas.
The cyclic behaviour of the climate in the Sahel, where dry and wet
Fishing: is done at various times of the year with different gear.
periods persist, has been explained by biogeophysical short-term
The reduced flooding of the wetlands due to dams, diversions and
feedback processes named the `Joseph' and `Noah' effects; reduced
climatic change has caused poor fishing revenues.
58
GIWA REGIONAL ASSESSMENT 43 LAKE CHAD BASIN
ASSESSMENT
59
Dry season grazing: grazing of sheep, goat, cattle and a few camels.
water and sanitation is very limited, the habitats in the region provide
Pastoralists often move into the area as the dry season develops.
vital resources to sustain the population. As these resources have
Wild resources: provides materials for utensils and construction.
become scarcer, greater effort has been required to subsist, which will
Doum palm is a source of food, materials and income. Dried palm
ultimately impact on health.
is harvested throughout the year to make a variety of products like
mats, baskets and roofing materials. Potash is sold as an industrial
Other social and community impacts
raw material first to wholesalers and then to traders from other
The GIWA Assessment also identified moderate social and community
parts of the country. Households use potash as a food ingredient, a
impacts. The drying up of the northern pool resulted in fishing
stomach medicine and an appetite stimulant for livestock. Firewood
communities migrating eastwards several times to fol ow the
is col ected mostly for subsistence by both men and women, but is
contracting lake. They also changed their livelihood strategy to adapt to
also a very active trade commodity (Schuijt 2002).
the decreases in fish production by farming the Lake's fertile recessional
lands. This has caused social unrest with communities competing for
According to the Ramsar Convention on Wetlands, the Hadejia-Nguru
the diminishing aquatic resources (Sarch & Allison 2000).
wetlands present value of the aggregate stream of agricultural, fishing
and fuel wood benefits were estimated to be around 34 to 51 USD per ha
Future outlook
(1989/1990 prices based on the maximum flood inputs) (Barbier 1997).
The GIWA Assessment predicted that in a future scenario it is likely
The economic importance of the wetlands means that there will be an
that the impacts from habitat modification wil become severe. The
economic loss associated with any scheme that leads to degradation
fol owing factors are predicted to occur and wil thus facilitate the
of the floodplain system, e.g. by diverting water away from them
increased severity of habitat loss and modification.
(Barbier 1997). The Hadejia-Nguru wetlands have declined by 210 000
to 230 000 ha. It is therefore estimated that decline in this wetland has
Population increase
had an economic cost of between 7.1 million and 11.7 million USD.
Population increases wil place further pressure on wetland, river
and lake ecosystem resources and thus lead to increased habitat and
Moreover, this does not take into account perhaps the most important
community loss and modification. Desertification in the arid northern
environmental function of the Hadejia-Nguru wetlands as its role in
regions of the Basin wil continue to cause a southward migration
recharging the groundwater aquifers of the Chad Formation. Evidence
towards the Lake and the southern river basins, and consequently
presented by Hol is et al. (1993) shows that a reduction in floodplain
increase the pressure placed on these habitats.
inundation leads to a lower rate of groundwater recharge. Since 1983,
when the extent of flooding dropped appreciably, groundwater
Freshwater availability
recharge fell by an estimated aggregate amount of 5 000 km3. Continual
The rate of habitat loss and modification is largely dependent on future
loss of groundwater storage and recharge will have a significant impact
variations in freshwater availability, which in turn, is dependent on the
on the numerous small vil ages throughout the region that depend on
amount of human water abstraction and climatic variability. There are
well water from the aquifer for domestic use and agricultural activities
presently no accurate forecasts of future climate change (see Freshwater
(Barbier 1997).
shortage, Future outlook). Greater aridity could lead to further desiccation
of the wetlands and the persistence of a marshy lake environment. There
The wetlands and lake host an array of habitats for a wide range of
is also the concern of future water management plans that do not take
fauna and flora. Future tourist markets attracted by this wildlife might
sufficient account of their impacts on the Basin's habitats. Freshwater
establish if political stability increases in the region, this however could
shortages could be aggravated further by proposed developments that
be jeopardised by habitat loss and destruction. These ecosystems also
include the construction of more dams that wil further alter the wetland,
provide a unique and important educational resource for local, regional
lake, and fisheries habitats accordingly.
and international education institutes and the scientific community.
Livelihood strategies
Health impacts
The fishing communities of the Lake have changed their economic
The GIWA Assessment considered the impact from habitat loss and
profiles to adapt to the fluctuating lake levels in the past. This has included
modification as to have a moderate impact on the health of the Basin's
reducing fishing effort, in order to al ocate time and effort to farm the
population. In a region where poverty is widespread and access to safe
fertile recessional lake floor. The relationship between habitat resources
58
GIWA REGIONAL ASSESSMENT 43 LAKE CHAD BASIN
ASSESSMENT
59
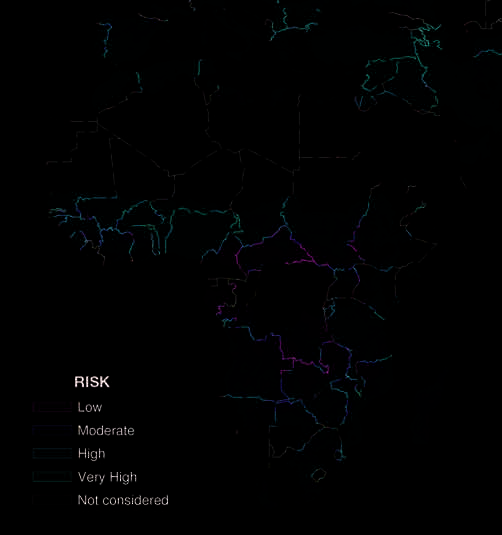
and livelihood strategy is twofold; changes in the community's profile of
economic activities is often caused by the changes in the availability of
the habitat's resources, but changes in livelihood strategy also alters the
distribution of pressure placed on these resources. For example if future
fish production declines once again, then more pressure wil be placed
on the wetlands for agricultural and grazing purposes.
Conclusions
The GIWA Assessment regarded the overal impacts of habitat and
community loss and modification as moderate, but it is predicted
that this could worsen to severe by the year 2020. The modification of
habitats has been primarily a function of freshwater shortage rather
than a result of direct habitat modification by humans. The wetlands
have been the aquatic ecosystem most affected by habitat modification
with a reduction by 50% in their surface area (Barbier et al. 1997). This
has been a result of stream flow modification, but high levels of
agriculture and livestock activity has also increased the pressure on
Figure 40 Risk of human-induced desertification in Africa.
wetland resources. Stream flow modification has also modified the
(Source: Reich et al. 2001)
open-water habitats to a predominantly marshy environment. This has
consequently changed the community structure of this region. The
including climatic variations and human activities. Land degradation is
economic impacts were regarded as moderate, as habitat modification
the deterioration in the quality and productive capacity of land and has
was primarily a result of freshwater shortage. Overgrazing may have
been identified as one of the major environmental chal enges facing
contributed to regional climate change by reducing the Basin's moisture
Central Africa (see review: AEO 2002). For example, Nigeria's 2002
recycling capacity and thus decreasing rainfall in the region.
Interim Strategy Update cites land degradation as the most serious
environmental problem facing Nigeria (World Bank 2002a). The desert
Modification of terrestrial habitats
is said to be moving at an annual rate of 5 km in these semi-arid areas
(not assessed by GIWA)
(Nana-Sinkam 1995). Human induced desertification has occurred as a
Terrestrial habitat modification has had a significant impact on a large
result of unsustainable land use practices arising from rapidly increasing
proportion of the Basin's population. Although terrestrial and non-
population and intensive economic activities. Figure 40 demonstrates
transboundary concerns are not included in the GIWA Assessment, to
the risk from human induced desertification in Africa; a large proportion
understand the wider context and linkages, it is necessary to discuss
of the Lake Chad Basin is at very high risk.
these issues.
Although the countries of the Lake Chad Basin al experience
In the past four decades there has been habitat and community loss
desertification to some degree, there are disparities between the
and modification due to a combination of anthropogenic and climatic
riparian countries. Figure 41 gives a breakdown of the total area of land
induced pressures. The persistent droughts have had a dramatic effect
on ecosystem structure and combined with land use practices such as
deforestation and unsustainable agricultural practices, have resulted
in the exacerbation of land degradation and desertification. The
intensification of land use has thus reduced diversity and the extent of
habitats for wildlife (Keith & Plowes 1997).
Desertification
A large proportion of the Lake Chad Basin has been identified as being
vulnerable to desertification, defined as land degradation in arid,
Figure 41 Vulnerability to desertification.
semi-arid, and dry sub-humid areas resulting from different factors,
(Source: Reich et al. 2001)
60
GIWA REGIONAL ASSESSMENT 43 LAKE CHAD BASIN
ASSESSMENT
61
in each country vulnerable to desertification and the level of risk it faces.
Chad Basin with the Nigerian Sector of the Basin supporting two thirds
Nigeria and Central African Republic have the largest percentage area
of this population (based on ORNL 2003).
of land vulnerable to desertification, but Chad, Niger and Sudan have
the largest percentage of areas at very high risk.
The increasing pressure on the limited natural resources of the
desertification prone zone, is exacerbated by the southward migration
Wind erosion is a normal phenomenon to the north and east of Lake
of people and livestock, results in overgrazing and continuous
Chad in Niger and Chad, but is intensified by poor land use practices.
overexploitation of the marginal lands (Federal Government of Nigeria
Overgrazing and cultivation have resulted in the loss of the vegetation
2002). In Nigeria this pressure is being absorbed by states such as
that held the dunes in place (LCBC 2002). The area north of Lake
Benue, Kaduna, Kwara, Niger, Plateau, Taraba and the Federal Capital
Chad has virtual y no surface flow and consists of moving sands and
Territory (FCT). This action leads to an intensive use of fragile lands
recent "ergs". The change in rainfal patterns has moved the limits of
and marginal ecosystems resulting in further degradation even during
wind erosion to the south. The changing rainfal patterns have also
years of normal rainfal . The steady deterioration in northern Nigeria
concentrated grazing pressure on the remaining rangeland, moving the
has continued largely ineffectively chal enged for several years (Federal
pattern of transhumance southwards (LCBC 2002). Consequently Chad
Government of Nigeria 2002).
is currently experiencing the greatest vulnerability to desertification,
with 58% of the area already classified as desert, and 30% classified as
The Central African Republic and northern Cameroon have also been
highly or extremely vulnerable (Reich et al. 2001). In Niger 250 000 ha are
experiencing desertification since the severe drought of 1972-1973
being lost each year through desertification (Eden Foundation 2000).
(see review: AEO 2002). In northern Cameroon the renewable resource
Degradation of natural resources such as water, farmland, pastureland
base is being rapidly degraded due to urbanisation, resettlement due to
and forests has gone a long way toward making populations more
population pressure, and the search for alternative income sources from
vulnerable. Al of these factors have led to the near pervasive
wood cutting, commercial grazing and fishing (LCBC 2002).
impoverishment of land capital, the dwindling or disappearance of
fal ow land, overexploitation of wood resources and overgrazing,
Several techniques have been developed to fight against desertification
which have accelerated the process of desertification (Government
or to minimise the impacts of factors that exacerbate the processes
of Niger 2002).
of desertification (Ahmed 2000) which can be adapted to the Basin.
These techniques include the plantation of shelter belts, replication of
In Nigeria, desertification (together with soil erosion) accounts for
sustainable agricultural practices and agro-forestry. There are also many
about 73% of the estimated total cost of 5.1 bil ion USD per year the
other ideas for local action in water management practised in other
country is losing from environmental degradation. In the northern
parts of the world. Within the Lake Chad Basin, some of these innovative
states, located in the Lake Chad Basin, it is considered as the "most
ideas are currently practiced by the UNEP-Belgium government Mega
pressing environmental problem" (Federal Government of Nigeria
Chad Project, as wel as NGOs including the North East Arid Zone
2002). Desertification has been indicated by the gradual shift in
Development Project (NEAZDP) and JEWEL in Nigeria, ONG KARKARA at
vegetation from grasses, bushes, and occasional trees, to grass and
Diffa in Niger, SECADEV in Chad, PDRM in Cameroon and PDRN in CAR.
bushes and in the final stages, expansive areas of desert-like sand.
These techniques if widely applied in the Basin are capable of reversing
It has been estimated that between 50% and 75% of Bauchi, Borno,
some of the presently observed degradation trends in future.
Jigawa, Kano and Yobe states in northern Nigeria are being affected by
desertification. The country is currently losing an estimated 351 000 ha
Overgrazing
of its landmass to desert-like conditions annual y, and such conditions
Overgrazing is considered as a major cause of desertification in the Lake
are estimated to be advancing southwards at the rate of 0.6 km per year
Chad Basin, as grazing animals remove vegetation cover and expose the
(Federal Government of Nigeria 2002).
soil to processes of wind and soil erosion. Large quantities of soil can be
moved by these processes and future productivity of the land limited
The situation is being aggravated by the increase in human population,
or rendered useless for future regenerations.
which appears to be stressing the natural support system. In many
areas, the sustainable yield threshold of the vegetation and soils is
Traditional animal husbandry is not very important economical y
being breached (Federal Government of Nigeria 2002). Over 37 million
but its impact on the environment constitutes a significant threat of
people depend for their livelihood on activities carried out in the Lake
desertification in times of drought as one third of the 300 000 km2
60
GIWA REGIONAL ASSESSMENT 43 LAKE CHAD BASIN
ASSESSMENT
61

available to man, livestock and fauna is dedicated to animal husbandry
Overcultivation
(Nami 2002). It was estimated in 1995 that there were more than
Overcultivation can lead to desertification due to the unsustainable
404 000 pastoralists in Chad (about 15% of the country's population),
consumption of nutrients from soil resources. Nutrients are not replaced
with pasture areas covering about 55% of the national territory (FEWS
as agricultural products are removed and the soil replanted without
1995 in AEO 2002).
sufficient fal ow time. This increasingly degrades the soil resulting in
lower crop yields, which consequently forces farmers to plant on larger
Nomadic pastoralists have been encouraged by the sinking of boreholes
areas of land to receive the same return on their agricultural investment.
to settle in locations that they previously only grazed for relatively short
Land degradation eventual y becomes so severe that the land turns to
periods of time. This has been detrimental to wildlife that was previously
desert like conditions (desertification).
al owed to regenerate (Newby 1980 in Keith & Plowes 1997).
The pressure exerted on the quality of soil increases with the number
Kindler et al. (1990) drew up a transhumance map which shows that
of farmers in an area (Nami 2002). The semi arid zone of Nigeria located
the migration routes of herds move towards the south and towards
in the Lake Chad Basin, constitutes the largest grain producing area
the Lake in the dry season, thus confirming the desert`s advance to
of the country and most of the livestock are concentrated here as
the south, and the decline of animal husbandry in the Lake Chad
wel . In years of abundant rainfal , the region provides high yields and
Basin (Nami 2002). The migration of livestock from the Sahelian zone
profitable livestock production. Conversely, in periods of poor rainfal ,
could trigger overgrazing and a shortage of pasture in the Sudanian
there is increasing pressure, which sometimes results in a food deficit
zone nearer to Lake Chad (FAO/GIEWS 2001). Population pressures on
and associated unfavourable consequences (Federal Government of
the land have also resulted in diminishing pastureland and, in some
Nigeria 2002).
cases, to the narrowing or even disappearance of transit corridors for
animals. This has led to a decrease in feed crop production, and at the
Agriculture has been forced to expand due to the climate constraints,
same time livestock population has increased and placed more of a
intense population pressures, reduced soil fertility, and difficult access to
burden on plant cover than can be normal y sustained (Government
inputs and farming equipment. In Niger the acreage under cultivation
of Niger 2002).
has doubled and farming has shifted towards "marginal" lands in the
north (Government of Niger 2002).
Figure 42 A millet field during the dry season, after the farmer has cleared it from remaining millet stalks. The picture is from Dalli, 1990
(north of Tanout, Niger).
(Photo: Eden Foundation Sweden 2000)
62
GIWA REGIONAL ASSESSMENT 43 LAKE CHAD BASIN
ASSESSMENT
63
Mil et, the staple food crop of Niger, is widely grown in the sandy
cleared for cultivation, while increased grazing and cutting for firewood
soil of val ey bottoms. After some years of mil et agriculture the land
wil accelerate destruction of wildlife habitat on the remaining non-
is left to fal ow and the natural vegetation is al owed to regenerate.
cultivated areas. This habitat modification can decrease the ecosystem
Fal ow periods of 6-10 years are typical but, as pressure on the land
functions and eliminate vegetation essential for specific animals
has increased, less land is being left to fal ow and rotation times are
(Keith & Plowes 1997). Expansion of agricultural production wil also put
reduced. Land used for mil et cultivation in east Niger and northeast
increasing pressure on the inadequately enforced parks and reserves as
Nigeria has consequently become barren sand dunes. Land that has
communities search for new land to harness for agriculture, firewood
been al owed to fal ow for four years or more, increases in value for
gathering, and grazing (Keith & Plowes 1997). Farming expansion has
wildlife, with improved biodiversity. Shorter fal ow cycles will result in
cleared large areas of greenbelt, such as north of Tanout (Niger), to
a decreased biodiversity and abundance on these fal ow lands (Keith &
make way for annual crops. Farmers have attempted to cultivate this
Plowes 1997). Figure 42 shows the vulnerability of fields to wind erosion
land, but later abandon the land, as it is unsuitable for sustainable crop
once the mil et crops have been removed.
production. By destroying areas of green belt the desert will be able to
advance more rapidly (Eden Foundation 2000).
The land in some areas is insufficient to support communities and
to supplement crop production particularly during periods of food
Firewood is the predominant source of fuel for the Lake Chad Basin
insecurity, herds of wildlife such as ostriches and bustards, and fish
population. In Niger for example, 95% of households use firewood
resources are further exploited. This is exacerbated by the ready supply
as the principal source of energy for cooking, regardless of region.
of ammunitions used in combat between rival forces in the succession
This high demand and scanty supplies has resulted in fuel wood
of civil wars in Chad that al ows harvesting of wildlife at a scale not
becoming a source of conflict. A number of forest reserves have been
previously possible (Newby 1980 in Keith & Plowes 1997). This has
developed in the area that are being heavily exploited by commercial
resulted in a decline in animal populations.
firewood harvesters for large urban centres (Barbier et al. 1991, Eaton &
Sarch 1997).
Vegetation removal and modification
Extensive removal of vegetation by humans combined with a
Deforestation in the Nigerian sector of the Lake Chad Basin
considerable fall in water level in Lake Chad and the associated aquifers
(Source: Neiland & Verinumbe 1990).
has resulted in a decline in perennial vegetation. This has resulted in
soil erosion and soil compacting leading to severe land degradation
In the Nigerian sector of the Lake Chad demand for wood probably
in the region. When vegetation is removed soil is exposed to heavy
exceeds the available supply as shown in Table 7. These figures show
rainfal , evaporation and wind action. The main reasons for vegetation
that an area of savannah woodland 10% greater than the total area of
removal are commercial logging and tree cutting to provide domestic
Nigerian sector of the Chad Basin cropped at the sustainable level of
fuel, clearance of forests for commercial, or subsistence cultivation, as
50 tonnes/km2/year. However the relationship between supply and
well as livestock browse and bush burning.
demand for wood is complicated by a number of factors.
Unsustainable forestry practices to meet increased demand for firewood
Table 7
Wood supply and demand in the Lake Chad Basin
(Nigerian sector) for 1989.
and lumber for local use, has resulted in the overharvesting of the Basin's
woodland resources (Keith & Plowes 1997). Deforestation exposes soil
Wood supply and demand in the Lake Chad Basin 1989 (Nigerian sector)
to high temperatures, which break down the organic matter, increase
evaporation and make the soils vulnerable to erosion (Nana-Sinkam
Total area of Chad Basin Nigerian section (km2)
136 000
1995). The removal of vegetation also alters drainage patterns and rates,
Human population
22 mil ion
increasing surface run-off, which again results in further soil erosion.
The rate of forest loss in the Basin is a cause for concern in terms of its
Annual domestic wood demand (tonnes)
7.5 mil ion
impacts on biodiversity, atmospheric change and hydrological cycles,
in addition to the concerns regarding soil erosion.
Annual sustainable wood extraction (savannah)(tonnes/km2)
50
Expanding agriculture to meet demand from the rapidly increasing
Area required to meet present demand (km2)
150 000
population of the Basin, has led to habitat modification as land is
Note: Figures based on best reliable estimates of wood supply and demand.
(Source: Neiland & Verinumbe 1990)
62
GIWA REGIONAL ASSESSMENT 43 LAKE CHAD BASIN
ASSESSMENT
63
There is an estimated population of almost 22 mil ion (based on ORNL
In Nigeria due to desertification entire vil ages and major access roads
2003) residing in the Nigerian Lake Chad Basin sector with a national
are being buried under sand dunes in the extreme northern parts
population growth rate of 2.9% (World Bank 2002c, estimated population
of Borno, Jigawa, and Yobe states in the Nigerian sector of the Lake
growth rate for Nigeria 1980-2000). This increasingly populous region
Chad Basin (Federal Government of Nigeria 2002) causing social and
uses fuel wood and other traditional fuels (charcoal, animal and
economic disruption. An agricultural survey of Niger, which constitutes
vegetable wastes) as their major fuel source, representing 67.8% (1997)
the basis for calculating changes in rural poverty, indicates that farming
of the total energy consumed by Nigeria (World Bank 2002c).
output has declined steadily since 1992. At the same time, livestock
production, which accounted for more than 35% of agricultural GDP, has
This extreme demand has to be supported by an area of woodland
been declining at nearly 2% per year (Government of Niger 2002).
available for exploitation as low as 50% of the total area (due to
overexploitation and agricultural clearance). The relatively slow growing
Economic impacts of deforestation
savannah woodland wil require time to recover from the drought
The shortfall in supplies of local wood to meet demand has had three
conditions, and it is expected that annual sustainable yield will remain
main economic effects in North Nigeria (Neiland & Vernumbe 1990):
below 50 tonnes/km2 for some years. This area of woodland also has to
The average price of a wood bundle is significantly higher
support the considerably large population of domestic animals (cattle,
compared with areas further south.
sheep, and goats) who depend almost entirely on fodder trees for their
The demand for wood stimulated a vigorous trade in wood
dry season food. Consequently, the FAO has identified northern Nigeria
bundles and logs. The market demand encouraged further heavy
in general as being an area where there are acute shortages of fuel
exploitation of wood resources.
wood. In Baga (north Nigeria), easily accessible supplies close to the
Due to common wood shortages the people have been forced
Lake have already been overexploited and large areas close to the Lake
into using readily available alternatives, other than the expensive
have been cleared for agriculture, both by local vil agers and as a result
paraffin and gas. These alternative fuels include dried woody
of government development intitiatives. The South Chad Irrigation
shrubs such as Calotropis procera, the papyrus sedges and
Project (SCIP) has also cleared an area of 670 km2. Disruptions during its
grasses of the Lake, and the stalks of crops such as sorghum.
construction led to large areas of land being devoid of vegetation and
Unfortunately both are of a much lighter density than acacia
left exposed to wind erosion (Neiland & Vernumbe 1990).
wood, for example, and burn very quickly, so that a large volume
is required to maintain a cooking fire. This is leading to further land
Neiland and Verinumbe (1990) stated that almost certainly demand for
degradation.
wood products and in particular fuel wood far exceeds the available
local sustainable supply. Productivity of the woodlands has also been
Health impacts
impaired by the water shortages and severe drought over the past four
Habitat and community modification has significantly contributed to
decades. The inevitable result of this imbalance is overexploitation
the poor standards of health found in the region. The declining fertility
beyond the sustainable yield, leading to the destruction of the resource
of land has effectively decreased crop yields in an area vulnerable to
base (deforestation).
food insecurity from climatic fluctuations. Scarcity of woodland is
forcing vil agers to have to travel further to obtain enough supplies
Economic impacts
to sustain their families, with implications on their health and also on
Economic impacts of desertification
food security for their family as their efforts are diverted away from
The consequences of land degradation, and of soil erosion and
productive activities.
compaction, are manifest as a result of the declining ability to support
natural or domesticated plant and animal production. Ultimately, this
Other social and community impacts
translates to reduced nutritional status of the population and to reduced
Desertification is creating "environmental refugees" in increasing
export revenues. In addition, communities that are dependent on wild
numbers, as people are forced to abandon their land because it can
produce (such as fruits, nuts, animals, mushrooms, and fuel wood) have to
no longer sustain them and migrate to other regions or to urban
search further and further a field to meet their needs, and may experience
slums (Darkoh 1993). The southward advance of the desert is causing a
food shortages or even famine during drought years. Extreme reductions
southward movement of the Basin's population and further increases
in productivity may result in people abandoning their farms and
the pressure on the resources of the receiving regions. Transboundary
migrating to urban centres, in search of improved security (AEO 2002).
migrations are a source of conflict causing ethnic tensions, social
64
GIWA REGIONAL ASSESSMENT 43 LAKE CHAD BASIN
ASSESSMENT
65
upheavals and changes in traditions in an already volatile region.
The habitat and faunal communities wil be further altered by increased
In addition, civil unrest or conflict can result in vast movements of
land use pressure by the large numbers of transboundary migrants
refugees, many of whom are settled in marginal or fragile areas.
attracted by employment opportunities presented directly and
Such social and environmental pressures were clearly demonstrated
indirectly by the oil project. These populations concentrated on the
in 1997, when Central African Republic (having to cope with internal
oil fields wil have severe impacts on wildlife and fishstocks through
disputes) received more than 50 000 refugees from Sudan and Chad
increased fishing and hunting activity. This transboundary migration
(AEO 2002).
could cause ethnic tensions, social upheaval, and disruption of rural
farmer's traditions. Environmental pressure groups have also expressed
Future outlook
concerns over whether Chad's current political situation after 30 years
Future climate change
of civil war is too unstable to accommodate such a large-scale oil
The influence of future climate change on the Central African region
project.
has yet to be determined as there are presently no accurate models for
predicting future precipitation rates over the region (see Freshwater
These potential environmental and social concerns have prompted
shortage, Future outlook). If there is greater aridity there could be a
the consortium to make adjustments and apply a comprehensive
greater vulnerability to land degradation, which may result in a food
set of mitigation measures to limit the impact of the project. To avoid
security crisis and even famine as food production is already at a critical
environmental y sensitive areas such as the Mbere Val ey numerous
level. The riparian countries cannot afford to lose further productive
adjustments have been made to the route of the pipeline. The pipeline
land to desertification.
wil run entirely underground (ESSO 2002) and techniques are being
employed to answer concerns over rehabilitation after construction due
Population growth
to the disturbance of top soil. To date, all local ethnic groups have been
Future population growth rates for the Basin are predicted to be high
compensated for land they lost to the pipeline project (ESSO 1999). The
(2.6%). A larger population will increase demand for land resources and
pipeline route has been sited to avoid/minimise impacts on the Bagyeli
fuel wood supplies. Further desertification wil result in a large influx
pygmies and a compensation mechanism is in place for those who may
of migrants from the rural communities into the swelling urban slums.
suffer any losses to crops or housing structures. The Indigenuous People
This wil result in social upheaval in the urban centres of the south of the
Plan, in addition, provides for a 25-year programme of support for the
Basin and other large urban areas in Central and West Africa.
Bakola, which should result in improving their living conditions and their
empowerment as full citizens of Cameroon.
Habitat and community modification from oil development
An oil project on the scale of the Chad-Cameroon Project wil ultimately
The threat of habitat modification from oil development could become
result in a degree of habitat and community modification. The pipeline
increasingly severe as the existing agreement between the consortium
is set to traverse areas of dense jungle inhabited by the Bagyeli ethnic
and Chad al ows for oil exploration not only in the Doba region, but in
group, or Pygmies, as they are popularly known (ESSO 2002). The
four other regions (Lake Chad, Salamat, Bongor and Doseo) covering
pipeline route, as original y proposed, transacted the core area of the
a surface area of 104 223 km2. The proposed pipeline, whose capacity
Mbere Rift Val ey, and there was concern that induced access rights
exceeds the oil flow that can be provided by the Doba fields, could be
would disturb sensitive habitats. Environmental assessments on
the first step of further oil development projects in the region.
Cameroon raised this concern, as the construction of the pipeline
route would have a negative impact on habitat and would have failed
Conclusions
to meet World Bank directives for the protection of natural habitats.
The Lake Chad Basin has experienced severe terrestrial habitat and
Biological field research has identified a need to protect some IUCN-
community loss and modification. The persistent drought has been
listed species that are known or have the potential to occur in some
the catalyst for land degradation but has been exacerbated by
areas of the Wooded Savannah in northern Cameroon. These species
unsustainable land use practices. Agriculture and livestock rearing are
include elephant, hippopotamus, bushback, kob, waterbuck, reedbuck,
the predominant economic activity; 60% of the administrative units of
red-flanked duiker and oribi. Faunal and floral species could also be
the Lake Chad Basin depend on agriculture as their main activity (Nami
threatened by the upgrading of existing seasonal roads that will
2002) and livestock covers extensive areas of the Basin (50% of Chad's
increase the accessibility for il egal poaching and logging of habitats
National territory). Unsustainable forestry practices to meet increased
previously protected by the area's remoteness (ESSO 2002).
demand for firewood and lumber for local use, has resulted in the
64
GIWA REGIONAL ASSESSMENT 43 LAKE CHAD BASIN
ASSESSMENT
65
overharvesting of the Basin's woodland resources (Keith & Plowes 1997).
for this region to be unreliable and incomplete (FAO 1995). Currently, it
These activities have encouraged deterioration in soil structure and
is extremely difficult to make any accurate and up-to-date assessment
quality, and thus enhanced the vulnerability to erosion. Desertification
of the economic status of the inland fisheries activities within the Basin
has consequently become a serious threat to the diversity and extent
(Neiland & Béné 2003) because there is very little time series data on
of habitats, and the livelihood and survival of many of the agricultural
fisheries (Jol ey 2001). Smal -scale fishermen in and around the wetlands
and pastoral dependent communities.
and floodplains do not document their catches thus making it difficult
to provide precise figures. In the past there has been comparatively few
Poverty and environmental degradation are closely correlated in the
international studies of the Lake Chad Basin, despite the fact that most
Lake Chad Basin with agriculture forced increasingly on marginal lands.
fisheries straddle international borders and their characteristics and
Measures to tackle the environmental issues are severely limited by this
dynamics are transboundary, determined by factors within the Basin
regional poverty (World Bank 2002a). Vil ages traditional y have values
as a whole (e.g. supply of water and movements of fish stocks).
and restrictions for the sharing of resources common to people within
a vil age and neighbouring vil ages. Civil strife, herder-vil ager conflicts
Faced with this lack of information, national policy makers and planners
as well as the endemic poverty have compromised the rules for use of
but also international development agencies are severely constrained
common resources and contributed to the overexploitation of these
in their ability to generate and implement rural development policies
resources (Keith & Plowes 1997).
appropriate and adapted to this area (Neiland & Béné 2003).
Habitat and community loss and modification could increase in severity
Overexploitation
in future years. Greater aridity and increased pressure on diminishing
The GIWA Assessment considered overexploitation of fish resources to
biotic and abiotic resources will further encourage desertification and
have a moderate impact, as the primary reason for the fluctuations in
the southward advance of the Sahara.
fish production witnessed in the Basin over the past 40 years has been
caused by fluctuations in water levels in the Lake Chad and in the timing
and extent of flooding, rather than due to unsustainable exploitation of
the fish resources. The term overexploitation is difficult to apply to the
T
C
P
A
Unsustainable exploitation of
I
M
Lake Chad Basin fisheries due to difficulties in defining a measurement
fish and other living resources
level in such a large dynamic system.
The GIWA Assessment identified Unsustainable exploitation of fish
Figure 43 shows how fisheries production has fluctuated between
and other living resources as having a moderate impact. Although
1969 and 2001. The increases in production from 1969 to 1972 was
fish production has fluctuated greatly over the past 50 years, this
attributable in part to the rapid development of the fishery pre-
has primarily been attributed to climatic variability and poor water
droughts years (1960-1972), from decreased competition from fish
governance, and the associated environmental changes, rather than
imports, increased fishing effort, and increased Catch per Unit Effort
unsustainable exploitation of fish. Present data does not suggest that
the viability of fish stocks is affected by pollution and disease, or that
biological or genetic diversity has been modified. Excessive by-catch
and discards is not thought to be a significant issue because, although
there has been increased juvenile catch due to use of smal er mesh, all
of the catch is used and not discarded.
Within the arid and difficult environment of the Sahelian region, the
Lake Chad has always played an extremely important role in the
livelihoods of the thousands of people living in its vicinities. However
due to the remoteness, poor continuity of information systems, recent
Figure 43 Fish production from Lake Chad obtained from road
political instability of the region and limited funding for research
traffic census of dried fish at entry to Maiduguri from
and management, the whole basin is now suffering an important
Baga Kawa (Nigeria) and N'Djamena (Chad).
(Source: 1969-1985: Sagua 1986, 1995-1996: Neiland & Bené 2003 (conversion
information deficit. FAO for instance considers the national statistics
factors to wet (fresh) weight x 4.5), 2000-2001: Neiland & Béné 2003)
66
GIWA REGIONAL ASSESSMENT 43 LAKE CHAD BASIN
ASSESSMENT
67
(CPUE) facilitated by the introduction of nylon gil nets and outboard
Destructive fishing practices
engines used on canoes (Sagua 1986, Neiland & Verinumbe 1990,
In general, traditional gears are used for fishing in the Basin, however
Neiland & Béné 2003). Durand (1973) estimated that fishing effort
increasingly modern materials such as nylon twine or rope for nets are
increased by 50 times in the northern pool between 1967-1972 and
being manufactured local y or imported from elsewhere (Neiland &
fisheries production by five times. Trade in Lake Chad fish was also
Béné 2003). According to Quensičre (1990), studies around N'Djamena,
encouraged significantly in the early 1970s with the extension of
on the Logone and around the Chari delta have al owed a comparison
tarmac roads practical y throughout Nigeria, and eventual y to the
of the fishing techniques used in 1989 with those being used during
lake shore at Baga. The dramatic improvements in communications
the 1970s. There was a marked reduction in the mesh size of nets during
significantly reduced the travel ing time between the Lake and large
the period and an increase in the use of cast-nets. Modern casting nets,
urban fish markets in the south of Nigeria, in particular Lagos, Enugu,
in particular, have many advantages over the heavy traditional nets.
Onitsha and Benin. The fish merchants were quick to take advantage
Fishermen are able to exploit new ecosystem niches, such as the deep
of the high demand for fish products from those markets, to which
parts of the Logone River, with these lighter more mobile nets. These
at times over 80% of the total Lake Chad Basin fish production was
new fishing grounds are not control ed by the traditional restrictions
exported (Stauch 1977 in Neiland & Verinumbe 1990). The total fishing
upheld by the Kotoko ethnic group in the Logone floodplain so fishers
effort during this period of rapid development accordingly escalated
have unlimited access (Van Est 1999).
to meet the demand (Neiland & Verinumbe 1990).
Among other new techniques is the increasing use of baits. In addition
The severe Sahelian droughts of 1972 and 1973 led to a drastic reduction
to baits placed in basket traps, bal s of bait comprising bran and mud
of open water in both the northern and southern pools resulting in
are used to lure fish to gather together. They are then easier to catch by
concentrations of fish with greater vulnerability to fishing gears. This
the use, for example, of a cast-net. The major development is however
explains the largest production estimate recorded of more than
the use of boats. Prior to the end of the 1970s, the traditional dug-out
200 000 tonnes in 1974. The fal in production noted during 1975 was
canoe was the only type of boat used by local fishermen. Currently, the
the result of the drying of the northern pool and very low water levels
traditional canoe has almost disappeared and been replaced by much
found within the southern pool during the same period. Reduced
more stable boats made from plywood. This innovation has al owed
water levels lead to scarcity of space for fishes, oxygen depletion and
much better exploitation of the whole lake area. The use of outboard
increased organic pollution. As the northern pool dried out, fishermen
engines has also developed very rapidly for both transport and fishing.
migrated with the receding waters and fish production stabilised
The intensified use of modern equipment has decreased the access
between 90 000 and 100 000 tonnes up until 1982 (Durand 1979 and
of the poorer fishers who are left with the remaining fish that have
1980, Sagua 1986). In 1982 the fisheries col apsed with production
escaped dragnets (Van Est 1999).
estimated at only 21 704 tonnes, there are believed to be two reasons
for this; firstly as a result of decreased inflow from the Chari-Logone
During the recession season in the Yaéré floodplains (north Cameroon
River Basin (see Freshwater shortage, Modification of the Chari-Logone
and south Chad), a large number of fishing fences are set up across
River) due to the Sahelian droughts of 1982 and 1984, which adversely
channels connecting the floodplain areas to the Logone River and its
affected fish recruitment due to reduced flooding of the floodplain,
tributaries (Logomatia or Petit Goroma in Cameroon, Salamat in Chad).
an important nursery ground and breeding ground for the Lake Chad;
These fences catch migratory fish leaving the floodplains especial y
and secondly because of reduced fishing activity due to the Chadian
Alestres spp. An example of this type of fishing technique is the "malan"
Civil War. Overal production has steadily recovered since then to an
fences used on the Bahr lli tributary of the Logone River in Chad. The
estimated 68 783 tonnes in 1996 (Neiland et al. 1997) and is presently
local fishermen from Kotoko ethnic group set up a dam made of
estimated to be over 60 000 tonnes.
wooden fences across a channel or shal ow part of the River. In front
of this fence, on its upstream side, many "kotoko" traps are attached
This would suggest that the Chad Basin fisheries have specific
to tall wooden sticks fixed in the riverbed. The traps have their mouth
characteristics, which makes them exceptional production systems
orientated downstream and catch fish as they turn back to try and
retaining a relatively large and important biomass of fish (Neiland &
escape the fences. Few fish are able to escape the traps and those that
Béné 2003). Therefore it can be concluded that overexploitation is
do are often caught downstream. The yield from this fishing method is
not the primary threat to the aquatic ecosystems and the fisheries
very high and can be several tonnes per day in the peak season.
industry.
66
GIWA REGIONAL ASSESSMENT 43 LAKE CHAD BASIN
ASSESSMENT
67
The contraction of the Lake has encouraged the "dumba" method of
production therefore have a significant impact on the rural community.
fishing to become increasingly popular, particularly along the western
The fisheries col apse fol owing the Sahelian droughts of the 1970s and
shore of Lake Chad, in Nigeria. A dumba is a row of Malian fish traps
1980s, occurred at a time when al economic activities were significantly
that are placed across a channel of receding lake water. The traps are
affected by the droughts. The situation was further exacerbated by
linked by small meshed netting, which forces the fish into the traps. The
the numerous people hoping to capitalise from fishing as well as by
dumba is especial y effective, as fish retreating the flood cannot escape
later arrivals from the outlying Sahel who were trying to escape from
them, and they do not need to be baited (Sarch 2001).
drought and famine. The poorest households of the Lake Chad Basin
felt the impact of the decreased fish production greatest. For example,
In 1992 the Federal Government of Nigeria promulgated the Inland
a survey by Béné et al. (2000) noted that dwindling fish stocks in the
Fisheries Decree, which charged the Commissioner for Agriculture in
Yaéré floodplains of northern Cameroon impacted most severely on the
each state with the responsibility for licensing and regulating inland
poorest households. In part, the survey stated, "the richest fishers are
fishing (Federal Government of Nigeria 1992). The aim of the decree was
those with ownership and access rights, whereas the poorest fishers are
to "give maximum protection to our precious inland fisheries resource
marginalized or excluded entirely from the most productive fisheries".
... [and] enhance the optimum productivity and utilisation of the inland
fisheries resources ..." (Ita 1993 in Sarch 2001). A key implication of the
However, given that such a high percentage of the community are
decree for fishing at Lake Chad was the ban on fishing techniques that
involved in fishing, the fluctuations did not have as severe effect as
obstructed the free movement of fish. In effect, this has prohibited the
would be expected. This can be explained by the long history of climatic
use of barrages of fish traps dumba set across channels of receding
variability forcing the local communities to adopt a diversification
lake water (Sarch & Al ison 2000). The Lake Chad Basin Commission's
strategy to minimise risks imposed by fluctuating environmental
Joint Regulations on Flora and Fauna also effectively ban dumbas
and economic conditions, with so cal ed fishing households earning
(Sarch 2001).
most of their income from a combination of fishing, farming and other
occupations (Neiland & Béné 2003).
Although both federal and local governments have tried to manage
fishing at Lake Chad, compliance with measures such as this is limited by
Health impacts
the inability of fisheries staff to reach the most productive fishing areas
The GIWA Assessment considered the impacts on health from the
on the Lake and enforce them. Although broadly benevolent and similar
Unsustainable exploitation of fish to be moderate regarding the
in their aims to sustain fish stocks, the efforts of the federal Fisheries
number of people affected but only having a slight impact in terms of
Department and local government have conflicted and resulted in
severity, duration and frequency. Fisheries production has fluctuated
failure. Il egal fishing persists and local government have little direct
dramatical y and at times contributed to food insecurity and caused
control over it (Krings 1998, Sarch 2000).
economic hardship, which has in turn contributed to the poor health
in the region.
Economics impacts
The GIWA Assessment rated impacts on the economic and public
Other social and community impacts
sectors as moderate as although the economic impacts of the decreased
The GIWA Assessment regarded social and community impacts of
fish production experienced at times during the last 40 years has had a
the Unsustainable exploitation of fish to be slight. The contracting
severe affect on the fisheries, fish production has increased once again
Lake Chad induced the fishing communities to migrate to fol ow the
more recently. These economic impacts have also been primarily a
receding waters and also to make a number of livelihood strategy
result of environmental changes caused by the freshwater concern in
changes to adapt to the changing environment (see Freshwater
the region rather than as a result of overexploitation of fish.
shortage, Other social and community impacts).
The fisheries of the Lake Chad Basin are very important economical y with
The col apse of the fisheries in the northern pool fol owed by the
current lands of about 60 000 to 100 000 tonnes per year contributing
southern in the end forced many fishermen to emigrate elsewhere
over 24 mil ion USD to national, regional riparian economies (Neiland &
in search of a living, mainly to the south, or to the larger towns and
Béné 2003). The industry provides employment for the majority of rural
cities of Nigeria, Chad and Cameroon (Neiland & Verinumbe 1990).
households on a seasonal and part-time basis for fishermen and also
This migration has contributed to the rapid urbanisation that has been
in associated fish processing and trading industries. Fluctuations in fish
experienced in the southern urban centres of the Lake Chad Basin.
68
GIWA REGIONAL ASSESSMENT 43 LAKE CHAD BASIN
ASSESSMENT
69
Future outlook
therefore inadequately control the quantity of fish extracted from the
The GIWA Assessment predicted that the Unsustainable exploitation of
fisheries resource. It is likely that the poor households will face further
fish and other living resources could be severe by the year 2020.
poverty as they are marginalised by their inability to afford access rights
to the fisheries resource.
Future climatic and environmental change
The future size and composition of fish stocks wil be integral y linked to
Development plans
the size, duration and timing of the annual floods in the Basin, thus future
Ongoing water management plans for the Basin such as the
fish production wil largely depend on the discharge rates of the Basin's
construction of more dams, continue to not take sufficient account of
rivers. In recent years rainfal has increased again, which could lead to
their impact on fish and other natural resources (Neiland & Béné 2003).
the rejuvenation of the floodplains and their standing stock of fish and
Further stream flow modification and associated habitat modification
increase the potential fish production. Overal production estimates have
could jeopardise the redevelopment of the fisheries. For example if
indicated that overal production is moving back towards levels noted
construction of the Kafin Zaki Dam (Jama'are River) in the Komadugu-
fol owing the col apse of the fishery in 1982. However the persistence of
Yobe River is completed it could lead to a reduction at Gashua of at least
this recovery wil be determined by future climate change, which is yet to
1 275 million m3 per year (Oyebande 2001) with consequential impacts
be determined for the region. Some forecasts predict higher aridity, which
on the fish stocks of the Hadejia-Nguru floodplains.
could again lead to a decline in the fisheries (see Freshwater shortage,
Future outlook). If current environmental conditions remain stable then
Fishing method developments
the dominance of smal -sized and hardy fish such as Clarias and tilapine
The increasing use of modern fishing methods such as more stable
cichlids is likely to continue as long as the flood levels remain restricted
boats, the use of outboard engines and new fishing gears, wil al ow
and fishing effort remains relatively high (Neiland & Béné 2003).
further fishing grounds to be exploited. These may be out of the
jurisdiction of the traditional management systems, and are therefore
Population growth
not subject to regulation.
The average population growth for the Basin is predicted to be 2.6%
(UN Population Division 2002). The fisheries resource wil consequently
Conclusions
be under increasing pressure as food demand increases and greater
The GIWA Assessment regarded the Unsustainable exploitation of fish
competition and possible conflict is provoked over rights to access
and other living resources as having a moderate impact. There have been
fishing grounds. The well-developed markets particularly in Nigeria
substantial changes in the taxonomic composition, distribution, diversity
continue to grow and trade in Lake Chad processed fish is expected to
and production of the fisheries over the past 40 years in the Lake Chad
expand as fishing redevelops. This market growth is associated with a
Basin. However, this can be primarily attributed to climatic variability
population growth rate of 2.9% (World Bank 2002c: 1980-2000 growth
and anthropogenic stream flow modification and the associated
rate), the high rate of urbanisation in southern Nigeria, and the increasing
environmental changes, rather than unsustainable exploitation of fish.
demand for protein foods such as fish. The urban population of Nigeria
The Sahelian droughts and human water diversion reduced stream flow,
has increased from 19.1 mil ion to 55.8 mil ion between 1980 and 2000
which changed the distribution of aquatic habitats of both the floodplains
(World Bank 2002c), it is to these large urban areas that an estimated 80%
and Lake Chad environment. Fisheries production fluctuated accordingly
of fish production from Lake Chad is sent (Neiland & Verinumbe 1990).
and fisheries species composition changed from predominantly open
This increase in demand wil have to be met by the Lake Chad fisheries,
water species to predominantly marshy species (see Modification of fish
as well as from the other sources of fish production that includes large
habitats). The fishing methods presently employed by the fishermen do
dam reservoirs, aquaculture and ocean/lagoon fisheries.
not pose a significant threat to the health of the aquatic ecosystems,
when compared with the large-scale habitat modifications caused by
Further desertification in the northern regions of the Basin will lead to
stream flow modification (climatic and human).
greater numbers of environmental refugees migrating to the south of
the Basin. Traditional management systems may not be sufficient in
Despite climatic and environmental fluctuations, a natural y high
managing the increased fishermen population. There are presently no
productivity of the lake system results from complex and diverse
restrictions on the number of fishers, as long as a designated fee is paid
mechanisms bound by particular environmental characteristics. In
to the vil age leaders. Migrant fishermen are therefore often welcomed
comparison to other continental fluvio-lake systems, the Lake Chad
as they pay higher fees than local fishermen. Traditional authorities may
displays exceptional performance in terms of productive capacity and
68
GIWA REGIONAL ASSESSMENT 43 LAKE CHAD BASIN
ASSESSMENT
69
T
C
resources available to fishermen (estimated 170 000 full and part time
P
A
Pollution
I
M
fishers) (Neiland & Béné 2003). Overal , there is no need to be over-
pessimistic about the level of exploitation in the Chad Basin. Recent
Pol ution was assessed by GIWA as having a slight impact under present
production estimates have indicated a significant recovery of the fishery
conditions but has a potential to escalate to moderate by the year 2020.
since the col apse of 1982, which demonstrates the Basin's natural ability
There is however an extreme lack of scientific data regarding pollution
to regenerate. The fish fauna of Lake Chad and its basin consists of about
and therefore ranking was primarily made using expert opinion. There is
140 species, with about 84 species in the Lake itself with only three
presently no evidence of impacts from radionuclide pol ution and spil s
species endemic to the Lake. The reconstruction of stocks is always
in the Basin. It is important to note that the Lake Chad Basin as an inland
possible from river fish communities if a "normal" lake state reoccurs.
drainage basin with no outlet to the sea, the Lake Chad itself is the final
receptacle of any pollution admitted into the Basin's hydrological sub-
The significant issue regarding the fisheries in the Lake Chad Basin is
systems (LCBC 2000b).
that of governance. Fisheries management cannot operate effectively
because there is confusion over which agencies have jurisdictions
Chemical pollution
over which areas, the formulation of regulations cannot keep up with
The Lake Chad Basin has very limited industrial development; however
dynamics of the Lake, and the organisations charged with enforcement
oil exploitation in Chad, which began in July 2003, may generate
are so poorly resourced that their staff are rarely in a position to enforce
opportunities encouraging industrial development (Republic of
a regulation (Sarch & Al ison 2000). There are weaknesses in al of the
Chad 2003). Chemical pol ution may therefore be an increasing concern
riparian states, as wel as in the Lake Chad Basin Commission (LCBC),
for the Basin.
in institutional capacity and enforcement of fisheries regulations.
Traditional management systems, enforced by vil age leaders are still
Industrial chemical pollution
the predominant fisheries regulators in the Basin, and analysis suggests
The Lake Chad Basin has a proliferation of textiles and tanneries in the
that these traditional authorities only tolerate central authorities, rather
upstream parts of the Basin (particularly in Kano and Maroua). These
than ful y integrate them in the process of fisheries management
industries contribute to pol ution of surface water supplies and in
(Neiland & Béné 2003). The present lack of fisheries governance can be
severe but rare cases cause localised fish kil s. Wastewater discharges
attributed, in part, to the attempt to centralise fisheries management
from settlements along the Chari-Logone and Komadugu-Yobe River
away from the local communities, and by central authorities trying to
courses particularly from abattoirs, hotels and hospitals are also thought
control, rather than cooperate with, traditional systems.
to contribute to microbial and chemical pollution.
Although the fisheries are very productive and generate significant
It is believed that industrial discharges are in low enough quantities
wealth, at least 40% of the rural population remain impoverished and the
to not severely affect water quality, although studies are needed to
poorest households face chronic food shortages. While the traditional
confirm this. For example, the refinement and processing of sugar cane
management systems function very effectively in regulating fishing
in Banda (Chad) discharges sodium carbonate and dissolved organic
activity, they create socio-economic differentiation in the communities.
matter in unknown quantities into the surrounding rivers. The sodium
Open access rights are seldom found and to the contrary access is usual y
carbonate, rejected by this factory and by a brewery at Moundou,
under regulation. The predominance of traditional management systems
is however dissipated in surrounding waters dissolving as it reacts
at a local level, and the absence of strong modern systems, has resulted
with CO , thus causing limited long-term consequences. The effects
2
in the majority of the benefits from the fisheries being retained by a
of these industries are therefore considered as minimal (Republic of
powerful elite minority, including local leaders, their extended families,
Chad 2003).
and other prominent people and their associates. It can therefore be
concluded that the poverty associated with the fisheries in the Basin,
Chemical pollution from mining
is more a result of limited access to fishing opportunities and to the
Mining activity, excluding oil production is still very limited in the Lake
benefits which might be realised from fisheries activities including
Chad Basin and is concentrated primarily in the CAR and southern
fishing, fish processing and fish trading, than a function of the catch level.
Chad. Diamonds are essential y the main mineral exploited in Chad,
The question has to be asked whether traditional management systems
with mining activity on the border with the CAR and gold mining in the
are a significant barrier to the future social and economic development
regions of Tandjile and Mayo Kebi (Republic of Chad 2003). Mining in
of the Lake Chad Basin (Benech et al. 1983 in Neiland & Béné 2003).
the CAR has the potential for chemical pollution, but the current levels
70
GIWA REGIONAL ASSESSMENT 43 LAKE CHAD BASIN
ASSESSMENT
71
of contamination are not known. There have however been reports of
organochlorine, lindane (Keith & Plowes 1997). Nearby lakes and streams
chemical pollution around the mining areas in the headwater regions
can be contaminated by agro-chemicals by the return flow of waters
of the Chari-Logone River Basin lying in the CAR.
and also run-off and percolation from the irrigated fields (Richards &
Baker 1992 in Keith & Plowes 1997). The SCIP project in northern Nigeria
Gold mining in Chad in the regions of Tandjile and Mayo-Kebbi uses
extracts water from Lake Chad, which is applied to the irrigated fields
mercury to agglomerate the dusts of gold. Mercury is highly toxic and
with agro-chemicals. Surface and ground flows carry these chemicals
when exposed to the atmosphere or water can form complexes with
directly into the Lake. There is an inadequate pol ution regulatory
organic matter (organic mercury). Although there is less polluting gold
framework in the Basin and the region is therefore vulnerable to
extraction techniques, mercury is still used in Tandjile and Mayo-Kebbi.
increases in agro-chemical contamination. For example in Chad, there
Assessments evaluating the effect of these mercury concentrations
is no legislation regarding pesticides in terms of their registration, food
are needed to determine the impact they have had on the local and
residue tolerances or pesticide safety. There also appears to be a lack of
downstream ecosystems (Republic of Chad 2003).
information available for pesticide application and recommendations
for pest control on crops other than cotton.
Agricultural chemical pollution
There is a lack of data on agricultural pollution in the Lake Chad Basin,
In southern Chad the rich al uvial soils by the rivers and lake provide
however, the LCBC Strategic Action Plan (LCBC 1998) recognised that
conditions suitable for vegetable gardens. The produce from these
there is a possible pol ution threat to water by pesticides used in
markets are sold in local markets and provide a relatively profitable
agriculture, especial y during periods of low flow and high temperatures.
source of income. They therefore justify investment in fertilisers and
In Chad, the quantities of pesticides used are between 500 to 1 000 m3
pesticides that consequently contaminate streams, rivers and lakes
per year. The cotton industry uses the largest amounts of insecticides,
(Keith & Plowes 1997).
in 1999 and 2000 4.5 m3 were used (Republic of Chad 2003). The type
of insecticides currently used in Chad are considered as highly toxic and
Chemical degradation also occurs, because of intensive cultivation of
if in high enough concentrations can lead to mortalities, thus reducing
marginal areas without sufficient fal owing and through salinisation
the abundance and diversity of vertebrate and invertebrate organisms
from irrigation with poor quality water (AEO 2002), these impacts are
as wel as the flora of wetlands. The organophosphate insecticide,
however again mainly localised. Lack of data makes it impossible to
monocrotophos, has been banned in other regions of the world due
determine the exact impact of agricultural chemical pol ution, but
to it killing birds, and although there are alternatives available, it is still
the predominance of cotton and rice crops that require high doses of
used extensively in the cotton industries of Chad (Keith & Plowes 1997).
chemical sprays on the irrigated farms, suggests that contamination of
Herbicides can kill non-intended plants after entering aquatic systems
water supplies could be occurring.
decreasing the diversity of wetland flora. Pesticides can be potential y
detrimental to migratory birds and there have been studies expressing
Eutrophication
concern for species in West Africa (Balk & Koeman 1984, Mul ie et al. 1991
Production of crops such as cotton and rice require high doses of
in Keith & Plowes 1997).
fertiliser, nutrient loading of water supplies is therefore not out of the
question. Environmental impacts of nutrient loading from upstream
In the upper parts of the Logone Basin upstream of Bongor, there are
developments (irrigated and urban discharges) directly impact on
also significant amounts of pesticides used in the cotton industries. The
downstream cities and populations. Eutrophication cases have been
quantities are unknown and there needs to be an assessment of their
identified in smal sections of the Hadejia-Jama'are-Komadugu-Yobe
possible impact on the environment (Lemoal e 1997). Lemoal e (1997)
River Basin (Madachi, Kirikasama and Nguru) as wel as the edges of
identified the transfer and degradation of pesticides in the Logone
Lake Chad. The numerous irrigation projects along the Komadugu-
upstream of Bongor (CAR) originating from the cotton industry as one
Yobe River have been identified as sources of nutrient loading with
of the main risks to the area. General y, there is a lack of studies in the
subsequent impacts on water quality.
Lake Chad Basin that analyse the distribution of pesticides in the aquatic
environment (Lemoal e 1997).
Industries within the Basin have been reported as discharging organic
wastes into the streams. The slaughterhouse of Farcha (Chad) ejects
Rice farmers use large quantities of fertilisers and apply il egal
about 4 m3 of organic matter per day resulting from the slaughtering of
insecticides including deltamethrine, malathion, fenitrothion and an
800 ruminants (cattle, goats and sheep) per day (Republic of Chad 2003).
70
GIWA REGIONAL ASSESSMENT 43 LAKE CHAD BASIN
ASSESSMENT
71
These activities can cause nutrient loading due to the high nitrogen
Suspended solids
content of wastes and should therefore be monitored. However, in
The northern sector of the region is natural y prone to wind erosion
order to limit this sedimentation processes are used to extract waste
that significantly leads to deposition of sand into the Lake and rivers.
solids before the wastewater is discharged and the nitrogen rich wastes
However declining productivity and soil structure in the Sahelian
are then utilised in agricultural activities (Republic of Chad 2003). There
zones of Chad and Cameroon combined with unpredictable rainfall
are reports of organic pollution in areas where recession agriculture is
and drought has resulted in extreme degradation and desertification.
practised around the Lake and other wetlands, where crops are left
Desertification has lead to sandstorms from increased wind erosion
after harvest; this however is not considered as posing a major threat
that deposits huge amounts of debris in the Lake and rivers causing
to water quality.
greater turbidity.
Water enrichment can support heavy growth of algae that during the
Land degradation in the Basin has been caused by many years
summer forms thick algal mats over extensive areas of open water.
of inappropriate agricultural practices, commercial logging, soil
Both algal mats and suspended sediments in water can restrict
compacting as a result of extensive removal of vegetation and bush
penetration of sunlight and the production of plants rooted to the
burning. These factors have exposed the soils to heavy rainfal ,
bottoms of marshes and lakes. Decay of algae reduces the dissolved
increased evaporation and wind erosion which has consequently
oxygen content of water and, over time, most fish species and other
increased the sediment load of rivers causing siltation on the lake
aquatic organisms that require high levels of dissolved oxygen can
bottom and has thus reduced the effective lake volume. This has
be eliminated. On Lake Chad, there is an abundance of macrophytes,
been exacerbated by the growth of rhyzomatous hydrophytes that
phytoplankton and also blue-green algae (cyanobacteria), known to
encourage soil accretion and increases water loss through increased
be a rich source of proteins. Arthrospira sp. (Spirulina) is blue-green
evapotranspiration (see review: Obot 2000). The problem of siltation has
algae, found on ponds surrounding the Lake Chad, which possesses
increased along river channels due to upstream reservoirs and reduced
practical y al the amino acids. It has been described as one of the only
peak flows downstream.
few environments worldwide where this type of blue-green algae
thrives due to the very narrow range of pH values that the species
Migratory fish spawning grounds such as those in the extensive
survives in.
Logomatia marshes reached through the El Beid and Chari-Logone
river systems could be altered and degraded with the intensification of
Fertilisers can increase the growth of emergent plants, and therefore
agriculture. This is occurring as a consequence of increased sediment
reduce areas of open water (Keith & Plowes 1997). Parts of the Lake
and agro-chemical pol ution carried by the rivers (Keith & Plowes
are reported to have emerging macrophytes (Phragmites australis
1997).
aubsp. Altissimus, Typha australis, Vossia cuspidata, Cyperus papyrus,
C. laevigtus, Leersia hexandra, Echinochloa sp.); floating macrophytes
In Chad and Central African Republic, the exploitation of diamonds
(Pistia stratiotes, Lemna perpusil a, Spirodela polyrhiza, Azol a africana,
and gold mining, in the regions of Tandjile and Mayo Kebbi and along
Nymphaea spp., Ipomoea aquatica, Neptunai Oleracea); submerged
the Aouak River in the upper Chari Basin, has increased the load of
macrophyte (Potamogeton spp. Val iseneria spp. Ceratophyl um
suspended solids in the surrounding rivers, with unknown impacts on
demersum, Utricularia spp.); and phytoplankton (Closterium aciculare,
river ecology and possibly disrupting the migration and reproduction
Pediastrum, Botryoccus, Microcystis, Anabaena, Melosira granulata and
cycles of fish in the seasonal rivers of southeast Chad (Lemoalle 1997,
Surirella muelleri). Proliferation of these water weeds may clearly signify
Republic of Chad 2003).
an increasing amount of nutrients in the lake waters. During periods
when there is insufficient flows from the Komadugu-Yobe River to
Microbiological pollution
support the northern pool eutrophication is exacerbated and all areas
There is no relevant documentation on the extent of microbiological
see the exposure of more paleo-dunes which are rapidly colonised by
pol ution; this issue was therefore unable to be ranked by the GIWA
vegetation (primary acacia and papyrus), and aquatic weeds. Navigation
Assessment. However, water-borne diseases are rampant in the region
is impeded if not made impossible by shal ow depths and floating
as a whole, indicating that there could be possible cause for concern.
islands of vegetation (Holz et al. 1984).
Waste management facilities are very poorly developed in the Basin. In
Niger for example, rural and urban sanitation is grossly inadequate, due
72
GIWA REGIONAL ASSESSMENT 43 LAKE CHAD BASIN
ASSESSMENT
73
to accelerating urban growth and the depletion of municipal resources.
(Keith & Plowes 1997). The Lake would be highly vulnerable to increases
Enormous quantities of waste are consequently produced and with
in pol ution as it is the final recipient of the Basin's rivers and in its current
most neighbourhoods having no sewerage system, the accumulated
`lesser' size has a limited dissimilative capacity (LCBC 2000b).
household waste represents a vector for many diseases. In Chad no town
(except the Doba oil wel site) has a functioning wastewater evacuation
Petroleum exploitation in the region has presented itself as a solution
system and col ection networks are dilapidated (IMF 2003).
to the poverty situation. The project has the potential to transform the
economic status and structure of the region. It is likely that industrial
Microbiological pol ution is suspected of being prominent around
activity wil become increasingly significant with the expected
settlements and on riverbanks of major waterways, where population
increased foreign capital injected into the economies of Chad and
densities are highest. The heavily concentrated numbers of settlements
Cameroon from oil revenues and associated industries. The actual
surrounding the Lake Chad are a particular focus of pol ution, where
oil project and the increased industrial activity wil subsequently
there are occurrences of direct discharges of industrial and domestic
pose a pollution threat. The World Bank project documents and non-
waste. Factories and other unhealthy instal ations in urban areas
governmental organisations have identified the fol owing possible
also constitute sources of pol ution of surface and groundwaters
pol ution impacts of the oil project and an action plan has been
(Government of Niger 2002). Lemoal e (1997) identified the increased
prepared and implemented to mitigate all of these risks (ESSO 1999):
discharge of sewage into the rivers upstream of Bongor in Logone River
Basin and the upper Chari River Basin in the Central African Republic and
Chemical pol ution: Recent oil development in Chad and Cameroon
from increased urbanisation as one of the major environmental risks in
could result in chemical pollution through the discharge of industrial
the region, especial y at times of low flow when effluent discharges are
and domestic effluents, and contamination from site run-off.
poorly diluted.
Environmental assessments for the Doba oil wel site identified that
Socio-economic impacts
there were possible risks from domestic and industrial effluents from
The economic, health and social impacts of pol ution were all
extraction site during and after construction (Republic of Chad 2003).
considered as slight. There is a lack of data outlining the impacts
The exploitation of the oil field of Sedigui, north of Kanem, wil also pose
of pol ution in the Basin and scores were assigned based on expert
a threat from extraction effluents. In Sedigui however, further caution
opinion. A significant number of people are at risk from water quality
is needed due to the relationship between groundwater and surface
problems but this is influenced not specifical y by pol ution but by a
waters in this region, which are particularly vulnerable to contamination
combination of other concerns including freshwater, global change and
(Republic of Chad 2003).
habitat modification. In the basin water-borne epidemics are resurgent,
particularly among young children. Several diseases are rampant in the
Oil in the Doba Basin will contain a significant percentage of water that
region including malaria, various forms of diarrhoea, acute respiratory
must be extracted from the crude oil before shipment. This water will
infections, measles, tetanus, yel ow fever, diphtheria and chicken pox.
need to be disposed of safely, so that there is no contamination of local
However, there are no studies identifying the role water pollution plays
water supplies (ESSO 1999).
in the proliferation of these diseases.
However, mitigation measures have been applied to minimise the risk of
Future outlook
possible pollution incidents to comply with World Bank specifications.
With the start of oil exploitation in the region and the increased
The exploitation of oil in the region has been presented by project
application of fertilisers and pesticides due to the expansion of
sponsors as having no effect on the aquatic environment (Republic of
large-scale irrigation, pol ution could become moderate by the year
Chad 2003).
2020. This scenario is likely in the current environmental legislative
framework, where there are limited constraints on industry. Although
Oil spil /leakage: Oil development in Chad has a potential risk of
presently pesticides are not extensively used, as irrigated and shoreline
pipeline leakage, groundwater contamination and freshwater pol ution.
agriculture increases, larger amounts of agro-chemicals will be utilised
Although mitigation measures have been installed, there is always a risk
as they become increasingly affordable and available. Insecticide use will
of an oil spill event (ESSO 1999), even if the best available technology
most likely be used primarily for high value crops and therefore its effect
is adopted. The pipeline traverses several major rivers contained in the
of toxicity to fish and wildlife will be localised rather than widespread
Lake Chad Basin including the Nya, Loule, Lim and Mba rivers and crosses
72
GIWA REGIONAL ASSESSMENT 43 LAKE CHAD BASIN
ASSESSMENT
73
the Mbere River twice. The Mbere River, forms part of the boundary
Priority concerns
between Cameroon and Chad, and Cameroon and the Central African
Republic and the area contains tributaries to Lake Chad. A spill incident
Freshwater shortage was ranked severe and was considered the
would have international implications (ESSO 1999) with even one leak
priority concern in the GIWA region 43, Lake Chad Basin. All of the other
endangering communities all along the pipeline as they rely on surface
concerns except for pollution have had a moderate impact. Although
water systems for most of their water needs. Leak prevention measures
there has been significant modification of habitats and significant
have included the pipe being buried at a safe depth and reinforced
fluctuations in fish production, these are a function of freshwater
pipe walls at river crossings. An emergency response plan has been
shortage, rather than a consequence of direct habitat modification or
formulated in compliance with World Bank specifications although
unsustainable exploitation of fish. Table 8 shows the overall rating and
it has been criticised for not going far enough in being site-specific.
justification for each concern.
Concerns raised during public consultations resulted in the oil pipeline
Table 8
The overall rating and justification for the GIWA
being constructed to pass around Lake Chad, to avoid risks of pollution
assessed concerns.
incidents (spil s) into the Lake (Republic of Chad 2003).
Overall
Justification/Indicators
Future
Concern
severity
for current severity
severity
Suspended solids: Environmental assessments at the Doba oil well
Freshwater
Severe
Lake Chad shrinkage: A 90% reduction in surface area.
Severe
shortage
Stream flow modification: the Chari-Logone River
identified that there could be possible risks of erosion resulting from
discharges 75% less water into the Lake Chad (Olivry
landscape modification during construction of the pipeline and
et al. 1996).
sediment could subsequently run-off into the surrounding streams.
Habitat and
Moderate Wetland modification: Wetlands resources have been
Severe
community
decreased by 50% (Barbier et al. 1997). Fisheries habitat
However, mitigation measures have been employed to minimise
modification
modification: Open-water species previously made up
approximately 52% of the fish market species composition,
the effect of particulate pol ution before it is able to reach the rivers
currently they make up less than 1% (Neiland &
(Republic of Chad 2003).
Béné 2003).
Unsustainable Moderate The terms overexploitation and unsutainable are difficult
Severe
Conclusions
exploitation
to apply to such a dynamic system. Large fluctations in fish
of living
production have been more a funcation of environmental
The GIWA Assessment considered pollution as having the least impact
resources
changes than overexploitation. Fisheries governance and
its relationship with socio-economic differentiation within
on the Lake Chad Basin. Although there is very little current scientific
the communities are the significant issues affecting the
fisheries sector.
data to confirm this assumption, it is presumed that due to the current
lack of industrial development and limited application of fertilisers in
Pollution
Slight
There is a lack of industrial and mining activity and there is Moderate
moderate application of agricultural fertilisers, although
agriculture because of financial constraints, that pollution is slight. The
there is an extreme lack of data to justify this presumption.
pol ution that is occurring is released in insignificant quantities that
Global change
Moderate Climate change has had a severe impact on freshwater
Severe
do not exceed the ecosystems' carrying capacity and the impacts
shortage. However the Basin has exhibited a history of
climatic variability (Holz et al. 1984). The impact of recent
are general y localised. Studies are needed to identify the status and
anthropogenical y induced climate change is unclear but is
considered as playing a role in freshwater shortage.
distribution of pollution in the environment. With the increasing use of
agro-chemicals and the exploitation of oil in the region and associated
industrial growth, mitigation measures need to be instal ed in an
The overall scores did not dictate a priority order for all of the concerns.
adequate environmental legislative framework.
The priorities were assigned on the basis of common judgement built
on intense discussion during the GIWA workshop, hosted by the LCBC,
and further assessment of the individual scores. The concerns for the
Lake Chad Basin were ranked in descending order:
1. Freshwater shortage
2. Global climate change
3. Habitat and community modification
4. Unsustainable exploitation of fish and other living resources
5. Pollution
Freshwater shortage was considered by the GIWA Assessment to have
the highest severity of impact. Climatic variability and anthropogenic
74
GIWA REGIONAL ASSESSMENT 43 LAKE CHAD BASIN
ASSESSMENT
75


freshwater shortage issues, namely stream flow modification, were
social tensions from the migration of people from the drought stricken
identified as the two immediate causes of the concern. Although
northern regions of the Basin into areas surrounding the Lake and
climate change has depleted the water resources in the region, it
associated river sub-systems (World Bank 2002a).
is believed that the level of stream diversion and abstraction has
been unsustainable in the climatic scenario of the past four decades.
Global change has influenced directly and indirectly all of the assessed
Figure 44 is an il ustration of the impacts of the freshwater shortage
concerns (except for pollution) that affect the Lake Chad Basin. Climatic
concern, in the Chari-Logone Basin and Lake Chad. It demonstrates how
variability exerted throughout the history of the Basin is therefore
freshwater availability drives the other GIWA assessed concerns and
considered as playing the most important role in the reduced rainfall
highlights some of the related ecological and socio-economic impacts.
in the region. Changes in precipitation in the Sahel (that includes the
There are very prominent indicators of freshwater shortage including
Lake Chad Basin) have been linked with Sea Surface Temperature
the shrinkage of the Lake Chad by 90% in the past four decades
(SST) patterns (Lamb 1978). These changes have been attributed
(Lemoal e 1991, USGS 2001) and reduced river discharges, for example
to changes in heat transfer between the Southern and Northern
the Chari-Logone River now discharges 55% less than in wet years prior
hemisphere (Evans 1996). Possible scenarios include increased deep
to the 1970s (Olivry 1996). Freshwater shortage has impacted heavily
water circulation in the Atlantic affected by the reduction in extent of
on the Basin's economic activities including the fisheries, agriculture,
sea ice, and the effect of sulphate aerosols which are dominant in the
animal husbandry, fuel wood provision, and wetland economic
Northern hemisphere. It is believed that local land surface anomalies
services. There has been consequential food insecurity in the region
(such as vegetation degradation) have also played a role in the rainfall
and combined with a lack of potable water has had implications on
variability (Evans 1996). A combination of factors including vegetation
the health status of the Basin's population. Social impacts are linked to
cover, soil moisture, and SST is thought to best explain the reduction
water supplies not meeting the population's requirements, and have
in rainfall in the Sahel (Xue & Shukla 1997). The role of anthropogenic
included upstream/downstream conflict over water al ocation, due to
climate change in the recent episode of freshwater shortage is therefore
the construction of dams upstream without sufficient provisions for
undetermined. Further research developments into detailed coupled
people and the ecosystems that support these people downstream of
transient GCM models may be able to confirm the roles of `natural' and
the development (Oyebande 2001). Freshwater shortage has caused
human influences.
SOCIO-ECONOMIC
IMPACTS:
HABITAT MODIFICATION
Figure 44 Illustration of the driving influence of the GIWA freshwater shortage concern on the other assessed concerns and the associated
environmental and social impacts.
Note: Please see the Causal chain analysis for the root causes of the freshwater shortage concern.
74
GIWA REGIONAL ASSESSMENT 43 LAKE CHAD BASIN
ASSESSMENT
75
Habitat and community modification of the aquatic ecosystems of
resources, and Global change are predicted to have severe impacts
the Basin has been primarily focused on the wetland ecosystem that
on the ecosystems and population of the Lake Chad Basin. The threat
have been intensively cultivated and frequented by large numbers of
of Pol ution, which is currently assessed as having a slight impact, is
domestic animals. The wetlands have primarily decreased in extent due to
predicted to become increasingly significant in the future.
changes in the seasonal timing and extent of flooding (Oyebande 2001).
Consequently, since the 1960s, wetland resources in the Basin, such as the
Future climate change wil directly and indirectly play an important
Yaérés in Cameroon and Hadejia-Nguru in Nigeria, have been reduced by
role in determining the future severity of freshwater shortage and
almost 50% (Barbier et al. 1997). The fish habitat has altered from being an
subsequently the other inter-connected concerns (see Inter-linkages
open water environment to being a predominantly marshy environment
and synergies). The number of rainfal events in the region wil be
and the fish species composition has changed to reflect this (Neiland &
influential in conditioning freshwater inputs and consequently, if water
Bene 2003). Although there has been significant habitat modification this
resources continue to be used at an unsustainable level in the Basin,
has been largely due to freshwater shortage.
freshwater shortage. However, the influence of future climate change
in the Central African region has yet to be determined as there are
Unsustainable exploitation of fish and other living resources was not
presently no accurate models for predicting future precipitation rates
considered as the primary reason for the fluctuations in fisheries production
over the region. There have been several indications that the drought
over the past four decades. The terms unsustainable exploitation and
is ending in the Sahel. There have been only three wet years (1975, 1994
overexploitation are inappropriate for the Lake Chad Basin fisheries due to
and 1999) in the last 30 years, but they were always separated from
difficulties defining a baseline level and due to the dynamic nature of the
each other by at least four non-wet years (L'Hôte et al. 2002). The 1990s
system. Freshwater shortage and the consequential habitat modification
were indeed less dry than the 1970s and 1980s, and in the wet year of
were regarded as the main influencing factors. Annual fish production fel
1999 increases in precipitation led to the flooding of the northern pool
from over 200 000 tonnes in the early 1970s to some 20 000 tonnes in 1987
once again. However the 1990s was still the third driest decade of the
(Neiland & Verinumbe 1990), and is presently estimated at over 60 000
20th century and the wet years were isolated events (L'Hôte et al. 2002).
tonnes (Neiland & Béné 2003). Prior to the drought years the fisheries
Consequently there appears to be no sustained upward trend since
had developed rapidly with fishing effort increasing by 50 times from
the 1970s and the Lake remains in its `lesser state'. According to L'Hôte
1967-1972 (Durand 1973). The contracting lake and wetlands caused fish
et al. (2002) the drought had not finished by the end of 2000 and it is
to be concentrated and more vulnerable to fishing gears, eventual y the
therefore premature to state whether recent increases in precipitation
fisheries collapsed in the northern pool followed by the southern pool
are part of a larger climatic trend.
fisheries by 1982. The fishing communities migrated eastwards fol owing
the receding waters; they also changed their livelihood strategies to take
Some predictions have envisaged greater aridity and a scenario
advantage of the fertile lake recessional floor for agriculture. Since 1982,
between 2001 and 2020 similar to the current status from 1973 until now
the fisheries have shown a good recovery, which demonstrates the Lake's
(Republic of Chad 2003). This is based on a future scenario of increased
ability to regenerate the fisheries as freshwater availability increases once
global warming linked to a weakening in carbon sinks and radiation
again (Neiland & Béné 2003).
sinks in the polar regions with reduced deep water formation due to
reduced heat transfers from the southern hemisphere to the north.
Pol ution is presumed due to the lack of industry and limited application
Positve feedbacks from reductions to the radiation and CO sinks could
2
of agricultural fertilisers to have the least impact out of all the concerns
lead to an increase in global warming (Lewis 1989 in Evans 1996).
assessed. It is considered that pollution is discharged in quantities that
do not exceed the ecosystem's assimilative capacity. However, further
Available water supplies will be further overexploited if planned water
studies are needed to scientifical y justify this presumption; there
development projects go ahead. An IUCN study estimated that in the
is currently a severe lack of monitoring and information networks
Hadejia river system the potential water requirements are at least (not
regarding pollution.
taking into account evaporation losses) 2.6 times greater than the
mean surface water resources (Bdilaya et al. 1999). Although currently
Future scenarios of priority concerns
the water requirements In the Jama'are and Yobe river basins are met
All of the concerns assessed are predicted to increase in severity by the
by available water resources, if the construction of the Kafin Zaki Dam
year 2020. Consequently, the concerns of Freshwater shortage, Habitat
is completed they could be outstretched. Water wil be used for the
and community modification, Unsustainable exploitation of living
proposed Jama'are Val ey Irrigation Project and some smal er irrigation
76
GIWA REGIONAL ASSESSMENT 43 LAKE CHAD BASIN
ASSESSMENT
77
schemes upstream of Katagum. Potential water requirements for the
well as human health, if mitigation measures are not instal ed. Pollution
Jama'are river system could consequently be more than 1.8 times the
is therefore expected to have a moderate impact (rather than its current
available water resources in a mean year (Bdilaya et al. 1999).
`slight'), before the year 2020.
The average population growth for the Basin is predicted to be 2.6%
Inter-linkages and synergies between the
which could lead to an estimated population of over 56 mil ion by
concerns of the Lake Chad Basin
2020 (UN Population Division 2002). This will increase the pressure on
Freshwater shortage linkages with Habitat modification
natural resources and therefore increase water use, habitat modification
Freshwater shortage has significantly modified the habitats and
and pressure on the fisheries. A larger population could inflict further
community structure of the Basin's ecosystems. Stream flow modification
economic stress on the countries of the Basin, which may lead to a
as a result of decreased rainfal events and upstream dam impoundments
greater employment of unsustainable practices by communities to
primarily in the Chari-Logone and Komadugu-Yobe river systems has
al ow them to subsist. The further southward advance of the Sahara
impacted on the habitats downstream. Wetlands have been the most
due to desertification will potential y lead to greater migration from the
affected as a result of changes in the timing and extent of seasonal
northern provinces to the south and exacerbate the major concerns
flooding. The reduction in the stream flow has also caused the Lake Chad
faced in the in-taking regions.
to shrink to less than 10% of its former surface area (Lemoal e 1991, USGS
2001). This has significantly altered the Lake from being an open water
The severity of the assessed concerns could increase due to greater
environment to being a predominantly marshy environment. The fish
demand and use of resources. For the foreseeable future water
species composition has correspondingly also been modified. A lowering
demands in the Lake Chad drainage basin are expected to increase,
of water tables has caused a reduction in perennial vegetation.
as the population becomes more dependent on irrigation agriculture
(Hutchinson et al. 1992, FEWS 1997 and 1998 in Coe & Foley 2001). In
Freshwater shortage linkages with the Unsustainable
the southern markets of Nigeria there is increasing demand for protein
exploitation of fish and other living resources
foods such as fish (Neiland & Verinumbe 1990), which wil result in
The size and composition of fish stocks is integrally linked to the size,
greater pressure on the Lake Chad fisheries as the majority of fish
duration and timing of the annual floods and the level of Lake Chad.
production from the Basin, is sold in these markets. Future technological
Changes in stream flows changed the distribution of aquatic habitats
improvements in the fisheries have also the potential to expand fisheries
of both the floodplains and Lake Chad environment and fisheries
production.
production fluctuated accordingly. Recent production estimates have
indicated a significant recovery of the fishery since the col apse of 1982,
The recent Chad-Cameroon oil development has the potential to
which demonstrates the Basin's capacity to regenerate its fish stocks
transform the economies of the two countries. It is expected to
when water levels increase (Neiland & Béné 2003).
account for 45 to 50% of Chad's national budget (World Bank 2003b).
This could influence the severity of the assessed concerns. Employment
Global change linkage to Freshwater shortage
opportunities wil encourage migration into the Chari-Logone Basin
Climate variability is considered as a key determining factor in
where the Doba oil field is located. This has a potential to enhance
freshwater availability in the Basin. In the past four decades there has
the pressure on natural resources due to increased use of water,
been a persistent reduction in rainfall over the Lake Chad Basin. Stream
habitat services and the fisheries resource. The boosted economy is
flows have consequently decreased and available water supplies have
expected to generate opportunities for industrial development that
been unable to meet the water requirements of the Basin.
may impact on the pol ution concern especial y under the current weak
environmental legislative framework. Although the project sponsors
Habitat modification linkages with the fisheries
have instal ed comprehensive mitigation measures there is always a
Aquatic habitats have been altered from being predominantly
risk of pipeline leakage, groundwater contamination and freshwater
open water to a marshy ecosystem. Fish species have also modified
pol ution (ESS0 1999). Pol ution from the agricultural sector should
accordingly from `open water' species to `marshy' species. `Open water'
also be closely monitored, with potential contamination of lakes and
species have therefore been more vulnerable to fishing gears. Wetland
rivers from agro-chemicals. The increase in irrigated rice and cotton
habitat modification has also contributed to considerable losses of both
production which both require large amounts of pesticides and
riverine and lake fisheries, as they provide habitats for fish in general and
herbicides could increasingly become a threat to ecological systems as
spawning in particular.
76
GIWA REGIONAL ASSESSMENT 43 LAKE CHAD BASIN
ASSESSMENT
77
Habitat modification linkages with global climate change
Climate change can partial y be attributed to regional habitat
modification. Vegetation in semi-arid regions such as the Lake Chad
Basin has a significant influence in determining weather patterns. As the
climate became drier over the past 40 years and overgrazing continued,
vegetation declined. The ability of the ecosystem to recycle moisture
back into the atmosphere was thus reduced, contributing to the retreat
of the monsoons (Coe & Foley 2001).
Pollution linkages with other assessed concerns
Although there is limited information regarding the influence of
pol ution in the Basin, it is presumed due to the lack of industrial
activities and limited application of agricultural fertiliser that pollution
has had a minimal effect on the four other concerns.
Figure 45 shows a model of the inter-linkages and synergies of the five
assessed concerns of the Lake Chad Basin. Thickness of line indicates
Figure 45 Model indicating the inter-linkage and synergies
extent of influence of a concern on another concern assessed.
between the concerns of the Lake Chad Basin.
78
GIWA REGIONAL ASSESSMENT 43 LAKE CHAD BASIN
Causal chain analysis
This section aims to identify the root causes of the environmental
The focus of the Causal Chain Analysis (CCA) is to determine the root
and socio-economic impacts resulting from those issues and
causes of freshwater shortage in the selected hotspots, so that the
concerns that were prioritised during the assessment, so that
driving forces of the issues can be addressed by policy makers rather
appropriate policy interventions can be developed and focused
than the more visible causes. Casual chain analysis traces the cause-
where they will yield the greatest benefits for the region. In order
effect pathways, associated with the freshwater shortage concern in the
to achieve this aim, the analysis involves a step-by-step process
Chari-Logone/Lake Chad and the Komadugu-Yobe hotspots, from the
that identifies the most important causal links between the
socio-economic and environmental impacts back to the root causes.
environmental and socio-economic impacts, their immediate
The root causes can then be targeted by appropriate policy measures.
causes, the human activities and economic sectors responsible
Separate analyses were carried out for these two systems.
and, finally, the root causes that determine the behaviour of those
sectors. The GIWA Causal chain analysis also recognises that,
within each region, there is often enormous variation in capacity
and great social, cultural, political and environmental diversity.
In order to ensure that the final outcomes of the GIWA are viable
options for future remediation, the Causal chain analyses of the
GIWA adopt relatively simple and practical analytical models and
focus on specific sites within the region. For further details on the
methodology, please refer to the GIWA methodology chapter.
Freshwater shortage was selected as GIWA region 43 Lake Chad
Basin's priority concern (see Assessment, Priority concerns). The Chari-
Logone sub-system and Lake Chad was identified as one hotspot and
the Komadugu-Yobe sub-system as another hotspot, and for both
the priority issue of stream flow modification was selected. They are
both highly transboundary in nature; the Komadugu-Yobe is found in
Nigeria and Niger; the Chari-Logone sub-system is located in Central
African Republic, Cameroon and Chad, where as the Lake Chad is
surrounded by the countries of Chad, Niger, Nigeria and Cameroon.
The Chari-Logone and Lake Chad systems will be analysed together as
the freshwater shortage in the Lake Chad is largely determined by the
discharge of the Chari-Logone River, which supplies 95% of the Lake's
total riverine inputs.
CAUSAL CHAIN ANALYSIS
79


Chari-Logone and Lake Chad sub-system
Figure 46 The Chari-Logone and Lake Chad sub-system.
The Chari-Logone sub-system has a basin area of approximately
The Logone River forms the border between Cameroon and Chad until
650 000 km2 and the Chari River extends 1 400 km in length (Froese
N'Djamena where it fl ows together with the Chari River northwards to
& Pauly 2003). The parts of the sub-system lying in Central African
the Lake Chad. The Chari and Logone rivers have a tropical regime with
Republic constitutes the headwater region. The Ouham in CAR,
a single fl ood occurring at the end of the rainy season, which lasts from
becoming the Bahr Sara in Chad, is the main tributary of the Chari
August to November (FAO 1997) and feeds the extensive Waza-Logone
River with its confl uence located at Manda, downstream of Sarh. Its
fl oodplains in northern Cameroon.
contribution was estimated to be twice that of the Bahr Aouk, despite
having a smal er catchment area. The Bahr Aouk drains the entire
The Waza-Logone fl oodplain is located in the extreme north of Cameroon
northeastern part of CAR and together with its tributaries, is a true
and is bordered by Nigeria to the west and Chad to the east (IUCN 2003b).
fl oodplain river. The Bamingui and Bangoran rivers drain the northern
It was previously a vast body of shal ow water that contained many
part of CAR and form the transition between the northeast and the
species of bird and was surrounded by rich grasslands that hosted a large
more populated northwestern areas. All rivers in the CAR parts of the
number of grazing animals. The fl oodplain contains the 1 700 km2 Waza
Basin have their main fl ow during and fol owing the rainy season from
National Park which is designated a Biosphere Reserve, and the 45 km2
July to September.
Kalamaoué National Park (Ngantou & Braund 1999).
80
GIWA REGIONAL ASSESSMENT 43 LAKE CHAD BASIN
CAUSAL CHAIN ANALYSIS
81
The high productivity of the Waza Logone region depends to a large
fisheries. The South Chad Irrigation Project (SCIP) extracts water from
extent on the overbank flooding of the Logone River and the seasonal
the Lake on the western shores in north Nigeria. For further physical
rivers Mayo Tsanaga, Mayo Boula and Mayo Vrick. The flooding cycle
and socio-economic information on Lake Chad see: Regional definition,
begins with the first important rainfall in May, which saturates the soil
Lake Chad and Box 2.
and starts to fil the deepest depressions (Mott MacDonald 1999 in
IUCN 2003b). The discharges of the Mayo Tsananga and Mayo Boula
Environmental and socio-economic impacts
reach the floodplain in August, and by September or October the area
Figure 47 provides a summary il ustrating the main causal links for
is inundated by overbank flow from the Logone River, lasting until
freshwater shortage in the Chari-Logone Basin and Lake Chad. Stream
November or December. The almost total lack of relief in the region
flow modification in the Chari-Logone sub-system as a result of human
means that the flood spreads over a large area: more than 3 000 km2
induced stream diversion and climatic variability has resulted in the
of the 8 000 km2 floodplain. By December, the residual floodwaters are
fol owing environmental and socio-economic impacts:
drained back in to the Logone through the Logomatya River, and north
to Lake Chad through the El Beid River.
Environmental impacts
The discharge of the Chari-Logone system at N'Djamena has
For further physical characteristics of the Chari-Logone sub-system see
decreased by almost 75% over the last 40 years as a result of drought
Regional definition, Chari-Logone sub-system. Figure 46 shows a map
and water management practices (Olivry et al. 1996).
of the Chari-Logone and Lake Chad sub-systems.
The Maga Dam (SEMRY) sealed up water courses entering the Pouss
depression, stored water originating from Mayo Boula and Logomatya,
The population of the Waza Logone region is estimated to be 220 000
and caused the Mayo Gougoulay to dry up (IUCN 2003b).
people, approximately 60% of whom rely on floodplain and wetland
In total these construction works resulted in a 70% reduction of water
resources for their basic income and subsistence (IUCN 2003b).
supply to the floodplain from the Mandara Mountains, and an almost
The Mousgoum and Kotoko are the dominant ethnic groups in the
complete curtailment of the water supply from the Logone River
region (Van Est 1999). The inundated plains are highly productive
(IUCN 2003b).
breeding grounds for fish and large numbers of livestock of nomadic,
The SEMRY project resulted in 30% decrease in the flooded area
transhumant and sedentary herders are supported during the dry
of the Waza-Logone floodplains (see review: LCBC 2002). Water
season (Ngantou & Braund 1999). A complex fishery exists in both
diversion for the project combined with drought has eliminated
the main river channels and permanent lakes, and in flood-fed and
the flooding of some 59 000 ha of floodplain and seriously reduced
seasonal creeks, ponds, depressions and wetlands. The SEMRY project
another 150 000 ha (LCBC 1998).
and Maga Dam are located to the south of the Waza-Logone floodplain.
Reduced flooding has resulted in the disappearance of many botanical
Irrigated agriculture is minimal now, with most of the project's farmers
species and the progressive invasion of meadows and natural
exploiting the fisheries opportunities in the region or reverting to
environments by unwanted ligneous forming plants (IUCN 2003b).
traditional agriculture.
The extent of important breeding and feeding grounds for fish
provided by the wetlands has been reduced (Neiland & Béné 2003).
Lake Chad is a terminal depression occupying less than 1% of the Basin
Lower recharge rates of aquifers (Barbier et al. 1997).
(Coe & Foley 2001) with four countries in direct contact with the Lake:
The Lake Chad has been reduced by 90% in surface area between
Nigeria, Niger, Chad and Cameroon. The Lake is extremely shal ow, with
the 1960s and 1990s (based on satel ite imagery, NASA).
a mean depth of 4 m (Carmouze & Lemoal e 1983), therefore any increase
There have been large fluctuations in fisheries production; annual
in lake volume means a substantial increase in lake area and shoreline (see
production escalated in the early 1970s, suffered a severe decline in
review: Thieme et al. In preparation). The Chari-Logone rivers contribute
the 1980s (Neiland & Verinumbe 1990) and is currently experiencing
the majority of al freshwater inputs into the Lake (World Bank 2002b) and
a recovery (Neiland & Béné 2003).
its level is therefore highly correlated with the river's discharge.
Socio-economic impacts
Lake Chad serves as the political border between the riparian countries
Over-abstraction of water by upstream users in the Chari-Logone
and provides an important source of potable water (AEO 2002) in an
sub-system, at unsustainable levels in a period when there has been
otherwise very dry region. Many economic activities are concentrated
a substantial decrease in precipitation in the watershed, has led to
around the shores of the Lake including recessional agriculture and
a reduction of the supplies for downstream users.
80
GIWA REGIONAL ASSESSMENT 43 LAKE CHAD BASIN
CAUSAL CHAIN ANALYSIS
81
Figure 47 Causal chain analysis model for Chari-Logone/Lake Chad sub-system.
Costly deepening of wel s, and increased use of pumping to reach
Lack or inadequate access to potable water supplies coupled with
the lower water table (LCBC 1998).
poor or lack of proper sanitation has encouraged the proliferation
A reduction in inundated flood plain surface area has led to a
and spread of diseases associated with water. Irrigation canals are
decline in agricultural production and has accentuated food
also a vector for these diseases such as cholera, schistosomiasis and
insecurity in the region (Nami 2002). Reduced flooding of Yaéré
goiter. Chad in the downstream section of the Chari-Logone and
floodplains reduced the extent of land favourable to dry season
surrounding the Lake Chad is particularly vulnerable to water-borne
agriculture (Nami 2002). In the Waza-Logone floodplains after the
diseases.
reduction in flooding, floating rice, floating sorghum, and flood
Upstream/downstream conflicts and migration from north of
recession sorghum were unable to be cultivated and the farmer's
basin into the case study site, have exacerbated pressure on water
fields no longer were provided with a natural supply of water (IUCN
resources.
2003b). There has been a proliferation of pests as consequence of
Fishing communities have migrated southeastwards fol owing
poor irrigation management.
receding lake waters.
There has been a dramatic reduction in the extent of dry season
grazing lands that previously supported large numbers of
Immediate causes
livestock. In the Yaérés perennial grass cover diminished, leaving
Decreased inputs
only degraded grasslands of inferior quality and decreased area
Over the last half century the hydrological regime of the Lake Chad
(IUCN 2003b).
region has changed. Rainfal events have been reduced which in
The contraction of the Lake Chad and reduced flooding of the
turn has led to decreased run-off and thus decreased stream flows
wetlands has caused fisheries production to decline, affecting the
in the Chari-Logone. At Doba, located on the Logone Pende, in 1955
majority of the rural population.
an annual mean rainfal of 1 475 mm was recorded, which fel to
There has been severe food insecurity in the downstream sections
740 mm during the 1984-1985 drought, but has increased recently
of the Chari-Logone river system and around the Lake. This has
to almost 1 130 mm (1999) (Doba weather stations, Republic of Chad
resulted from the decline in agriculture, livestock and fisheries
Meteorological Office). See Assessment, Freshwater shortage, Regional
productivity.
change, and Global climate change.
82
GIWA REGIONAL ASSESSMENT 43 LAKE CHAD BASIN
CAUSAL CHAIN ANALYSIS
83
Increased diversion
almost half as many inhabitants as the Komadugu-Yobe sub-system
The Maga Dam constructed on the Chari-Logone sub-system aimed
and larger water supplies, and the highest per capita water supply in
at utilising the water resources of the region more efficiently. The
the Lake Chad Basin. However, an increase in the Basin's population has
water has been used for agriculture. The SEMRY project carried out
led to greater pressure on the natural resources of the Chari-Logone
many development works to open up large rice growing areas in
sub-system including its water resources.
northern Cameroon. A 30 km earthen Maga Dam was constructed
on the upper part of the Waza-Logone floodplain in 1979 to provide
Migration: There has been a large influx of immigrants from the
water for the SEMRY irrigated rice scheme and for fish farming. At the
northern provinces into the Chari-Logone Basin and around the
same time, some 80 km of dykes were constructed along the edge
Lake Chad due to drought and desertification forcing communities
of the Logone extending 20 km downstream from Maga Dam to
to leave the increasingly arid northern environment. The migrants
prevent the irrigated rice fields from being flooded from over-bank
were predominantly pastoralists who in the past frequented the
flow from the Logone (LCBC 1998, Neiland & Béné 2003). The irrigation
Chari-Logone pasturelands and lake peripherial during seasonal
project aimed to reduce the dependency of local communities on the
transhumant migrations. For example, although population densities
unpredictable floods and rain patterns, which had occurred during the
are relatively low in the CAR sector of the Chari-Logone sub-system,
1970s (WIWO 2001). This was seen as a solution to the food insecurity
and have limited pressure on the environment, the Sahelian drought
in the region and a driving force for developing the economy of the
resulted in an important movement of cattle and stockbreeders from
Chari-Logone river system, and was given priority funding. Changes
the neighbouring countries, encouraged by the National Association
did at first reduce the dependence on natural conditions but at the
of Stockbreeding Development. No special infrastructure was created
expense of greater dependence on traders and moneylenders in order
to cater for the extra cattle and watering took place along the rivers
to purchase modern farming equipment to cultivate rice, as well as on
(Lemoal e 1997). The SEMRY project also encouraged migration into the
state officials running the SEMRY project (Van Est 1999). The agricultural
region as it promised employment opportunities. The population of the
projects did not produce the revenues that were anticipated due to
vil age of Maga grew from around 50 inhabitants to 20 000 inhabitants
the decreased water supplies and lower than expected exports to the
in less than five years (Nami 2002). The SEMRY project has been seen as
Nigerian markets. Since the construction of the Maga Dam and flood
a failure and many of the inhabitants of Maga vil age now fish instead.
embankments the natural hydrological regime of the Waza-Logone
Although water resources are more abundant in the Chari-Logone
floodplains was seriously affected. This diversion of water from the Chari
Basin, migrants have increased the stress on water resources and water
River for agricultural purposes has contributed to the decreasing stream
management systems. This has increased competition and aggravated
flows and the discharges into, and extent of, the Lake Chad.
conflicts between stockbreeders, who are moving southwards, and
farmers (LCBC 2000b).
Conclusion
The immediate causes of stream flow modification in the River Basin are
Economic
the decreased rainfal events and increased diversion of water resources.
Poverty: The River Basin suffers from mass poverty, and the people
Decreased rainfal events wil not be analysed further as the regional
are often forced to degrade the environment in order to survive in
and global climate change that has caused this decrease should be
the short-term. However more information is needed to verify this
addressed by policy at a global forum (IPCC 2001). According to expert
presumption in the Chari-Logone Basin.
opinion the most significant GIWA assessed immediate cause is the
increased diversion of rivers and the associated unsustainable use of
Inadequate valuation of environmental goods and services: The
water resources. The fol owing section will identify the root causes of
construction of dam and flood infrastructure as part of the SEMRY
freshwater shortage in the Chari-Logone Basin.
irrigation project did not take into account the values placed on the
freshwater resources and flooding regimes by fishing communities and
Root causes
pastoralist populations. The upstream diversion of the Logone River at
Demographic
the Maga Dam has had severe economic impacts on the Waza-Logone
Population growth: The population of the sub-system is currently
floodplain (IUCN 2003b). The severity of these economic impacts on
estimated to be 11.1 mil ion (based on ORNL 2003). The World Resources
the region has outweighed the economic benefits provided by the
Institute (Revenga et al. 2000) estimated water supply to be 7 900 m3/
project. A valuation study conducted by IUCN (2003b) showed that
person/year in 1995 for the Chari Basin. The Chari-Logone Basin has
before the construction of the SEMRY scheme, the value contributed
82
GIWA REGIONAL ASSESSMENT 43 LAKE CHAD BASIN
CAUSAL CHAIN ANALYSIS
83
by this flooding to the regional economy was over 10 million USD per
Identifying and quantifying water abstraction: There is no record of the
year, or more than 3 000 USD/km2 of flooded area. Since then, the
levels of water abstraction for irrigation, municipalities, traditional
inundated area of the Waza-Logone floodplain has been reduced by
activities etc. from the sources of the Chari-Logone to Lake Chad itself.
almost 30%, incurring annual economic costs to the local economy
Traditional management systems are dominant in the sub-system and
of more than 2 mil ion USD (Table 9). This study has highlighted the
regulate access to water. These systems general y do not monitor water
economic costs to the poor rural communities of the inadequate
use and abstraction quantities.
valuation of environmental goods and services during planning of the
SEMRY project (IUCN 2003b). However, planners did not have accurate
An insufficient knowledge of water resources and the functioning of aquatic
forecasts available to them, and did not foresee such a significant
ecosystem: There is not a comprehensive model that is able to predict
decrease in stream flow.
the hydrodynamic reactions of proposed water projects. At present
the institutions in Cameroon which are responsible for the monitoring
Table 9
The economic costs of flood loss in the Waza-Logone
of the hydrology and environment can not provide sufficient data,
region.
although the IUCN Waza-Logone Project (CACID) can provide data but
Total loss
Economic loss
(USD per year)
it is general y limited to the Waza-Logone stretch of the sub-system
Pasture losses
-1 310 000
(Lemoal e 1997). There is presently a lack of knowledge regarding
Fisheries losses
-470 000
future climate change and the impact possible changes may have on
the sub-system.
Agriculture losses
-320 000
Grass losses
-290 000
Scientific resources: Due to the financial difficulties in the region, scientific
Surface water supply losses
-20 000
and technical research does not receive sufficient funding (LCBC 2000b)
Net cost
-2 400 000
and has not been perceived as a priority by the Basin's countries. The
(Source: IUCN 2003b)
region contains inadequate professional human resources and there is
an absence of performance indicators for monitoring and evaluation.
Knowledge
This is not helped by weak logistic support (e.g. supervision, equipment,
Public awareness: There are extreme deficiencies in information
vehicles and spare parts) and lack of centralised or coordinated national
availability and public awareness in the Chari-Logone/Lake Chad
water resource databases (LCBC 2000b).
sub-system. There are difficulties in information dissemination and
communication with the local communities whom predominantly live
Legal
in rural areas. Given this lack of information availability, the people of
The current water laws of Chad, Cameroon and CAR, do not have the
the Waza-Logone floodplain lack the expertise they need to organise
necessary elements in order to ascertain integrated water management
themselves adequately in the management of the diminishing
of the Chari-Logone catchment rivers and tributaries. An important
resources (Ngantou & Braund 1999).
impediment to integrated water management is the absence of any
implemented water al ocation law between the Chari-Logone and
Information sharing: Countries have difficulties cooperating and
Lake Chad sub-system's riparian states, to enable the equitable use,
sharing information. There is no permanent interface between the
conservation and sustainable development of the water resources
neighbouring countries of Chad and Cameroon regarding al ocation
already contained within the Basin. There is no water al ocation rule
and management of the water resources of the Chari-Logone
contained in the Fort Lamy (now N'Djamena) Convention of 1964. The
catchment, with only a few meetings held sporadical y. The weak
FAO submitted a draft agreement at the LCBC's request to the member
information sharing network amongst the five countries contained
States at the 13th session of the LCBC, which was to be studied in detail
in the Chari-Logone/Lake Chad sub-system is also partly attributed
by the legal departments of the member States. However it is believed
to their different colonial experiences and political systems and partly
that due to a lack of experience in dealing with water law the ratification
due to the communication infrastructure in the region. The only data
of a water al ocation rule never materialised (LCBC 2000a). The equitable
exchange is through the Chad-Cameroon Joint Commission with no
use of groundwater supplies is also a further legal gap in national law
permanent secretariat and the Lake Chad Basin Commission (LCBC).
and the Fort Lamy Convention, and was also not stipulated in the FAO
There is not any information sharing networks such as through the
draft agreement.
Internet and the application of regional GIS databases.
84
GIWA REGIONAL ASSESSMENT 43 LAKE CHAD BASIN
CAUSAL CHAIN ANALYSIS
85
Figure 48 Chari River at N'Djamena in Chad.
(Photo: Corbis)
The bi-lateral Moundou Agreement between Chad and Cameroon in
Governance
1970, established fixed maximum abstraction rates on the Logone River.
Conflicting policies between ministries: The governments active in
The Chad-Cameroon Joint Commission was subsequently established.
the Chari-Logone sub-system, namely Cameroon and Chad, have
However the commission has no secretariat and there is no monitoring
two conflicting policies. The first is to reduce poverty, by increasing
or enforcement of the maximum abstraction rates. The commission
economic growth and also by improving food self-sufficiency through
is essential y inactive. The maximum abstraction rates have been
the utilisation of irrigated rice cultivation. The other policy is to conserve
criticised for not taking into account new low water flows and that
wildlife through the creation of national parks. The impact of this is
the minimum flow is not sufficient to protect fish, water table levels
clearly shown in the Waza-Logone floodplain where the SEMRY project
and river bank vegetation (Lemoal e 1997). Without an official water
has decimated the wildlife of the Waza National Park (Van Est 1999).
al ocation agreement there is confusion about who has the right to the
There is a need to recognise that some policies are compatible whereas
diminishing resource in the Chari-Logone sub-system. The decreased
some are conflicting and identify the trade-offs in order for informed
water availability in the region has led to competition and disputes over
decision making. For example, increased flooding conserves wildlife
access and use of water resources that became increasingly scarce.
and at the same time promotes tourism and improves fishing, flood
recessional agriculture, pasturelands and other wetland resources. The
Another legal weakness in the Fort-Lamey Convention is that member
incompatibility of the current two policies also cause legal confusion
States are only required to consult each other when altering international
regarding land management regarding which use agriculture or
watercourses. A nation does therefore not need prior agreement from
conservation the land should be used for.
al member States in order to proceed with a development i.e. there
is no veto power residing in the Commission or any of its organs
Lack of water resource environmental planning: A short-term policy
(LCBC 2000a).
focus resulted in unsustainable policy decisions. The planners of
84
GIWA REGIONAL ASSESSMENT 43 LAKE CHAD BASIN
CAUSAL CHAIN ANALYSIS
85
the SEMRY project did not take sufficient account of the impacts
downstream traditional farmers (King 1993). Original y it was intended to
of stream flow modification from the Maga Dam, on downstream
become self-sufficient in wheat production. The Government's failure to
humans and ecosystems. The project was undertaken with no
guarantee wheat prices among other factors led to farmers converting
environmental planning and little or no resource management
to using more water intensive crops such as rice and sugar cane. It
(Ngantou & Braund 1999). The vulnerability of the region to climatic
has to be questioned whether these water intensive crops, grown
variability was not considered during planning, and the impacts this
on the irrigated fields, are appropriate in a region prone to freshwater
would have on the freshwater availability and consequently the SEMRY
shortages. King (1993) identified that the rice extraction rates in Chad
project. The unilateral decision to construct the Maga Dam caused
and Cameroon are very low by modern standards. He attributed this in
conflict with downstream users of the water resource.
part to the drying techniques employed where frequently the paddy
was too dry and the mil ed product was of a poor quality resulting in
Lack of stakeholder participation: Stakeholders were not involved in
low market prices. In Nigeria par-boiling is adopted which increases
the initial planning and implementation of and management of the
the extraction rate and produces a more marketable product. This
SEMRY project. The project did not attempt to encourage stakeholders
effectively increases the yield per unit of water (King 1993).
to participate. Consultations occurred at a ministerial level, with a lack
of involvement of the private sector. The communities of the Waza-
The SEMRY project exposes large amounts of water to extreme
Logone floodplains were not consulted even though they were most
evaporative losses from the Maga reservoir surface and the remaining
liable to be affected due to their dependence of the intra-annual
irrigated fields. At 100% storage capacity the Maga Dam exposes
flooding for recessional agriculture, fishing etc. There has been a
a surface area of 400 km2 (IUCN 1998 in Attewil & Lawrence 2002).
realisation by states of the importance of traditional management
Reviews undertaken by an international dam safety expert for the World
systems that govern these communities since the failure of the SEMRY
Bank (within the GEF project "Reversal of Land and Water Degradation
project. The Republic of Chad's Code of Water (LOI No016/PR/99, 18th
Trends in the Lake Chad Basin Ecosystem") indicated that the dam
August 1999, Article 1, paragraph 3) states that local traditional laws
is threatened by erosion, wave action, overtopping and seepage. If
should be taken into account during water management.
the dam fails several thousand people are at risk to their lives, and
approximately 20 000 are at risk of being flooded (World Bank 2002a).
LCBC institutional weakness and lack of capacity to promote compliance
The flood release outlet is partial y blocked limiting the control of flood
and enforce agreements and policies: The LCBC has no power to enforce
flows making the flooding of the Waza-Logone floodplain difficult
the agreements made between the riparian countries, so they are often
during times of peak flow.
not complied with. The LCBC founding riparians gave the LCBC a broad
mandate relating to prior notification before undertaking projects
The SCIP project (Nigeria, western shore of Lake Chad) utilised the
which may have a transboundary influence on water resources. The
Lake's waters extremely inefficiently through a network of irrigation
Commission was also given the authority to examine complaints and to
channels. This leaves the water surface exposed to high evaporation
resolve disputes amongst member States. However the LCBC has often
rates resulting in large water losses (Isiorhoet al. 2000). The failure of the
been bypassed when undertaking developments despite these issues
large irrigation projects such as SCIP may have been averted if greater
falling in the Commissions mandate (World Bank 2002a).
efficiency of water had been implemented (Isiorho et al. 2000).
Poor water use efficiency: Water-demand management is ineffective
Slow progress in implementing environmental degradation mitigation
and little attention is paid to adapting production methods to
measures: The aforementioned root causes have long been realised
natural resource limitations. There is an absence of measures aimed at
by the governments and international assistance organisations as
conserving the precious water resources of the Basin, and opportunities
a result of the studies by GEF and UN organisations (see Regional
to increase the availability of potential productive freshwater are not
definition, Chronology of recent projects executed in the Lake
being seized (Isiorho et al. 2000).
Chad Basin). Many of these root causes were identified by the
"Diagnostic Study of Environmental Degradation in the Lake Chad
The irrigation schemes require large inputs of water and were planned
Conventional Basin" undertaken by UNEP as early as 1990 (Kindler
not taking into account the large fluctuations in water availability
et al. 1990), and recommendations made in the LCBC Master Plan
experienced in the Lake Chad Basin. The farmers receive a low return
(LCBC 1992), and subsequent SAP (LCBC 1998). Therefore the question
on the amount of water used in the irrigated fields, at the expense of
has to be asked: why has there not been more progress in tackling
86
GIWA REGIONAL ASSESSMENT 43 LAKE CHAD BASIN
CAUSAL CHAIN ANALYSIS
87
environmental degradation in the Lake Chad Basin and why have not
the recommendations made by the LCBC Master Plan (LCBC 1992) and
subsequent initiatives been developed and implemented sooner?
The slow progress has been partial y attributed to lack of external
funding and to the lack of funds riparian governments have available.
The recommendations in the Master Plan were not taken up after it
was decided by the Planning Committee Decision Support System
Project (DSS) to first develop a Strategic Action Plan (SAP) before
arranging a donor's conference. Attempts to mobilise domestic and
external resources are not helped by the absence of integrated land
and water resources management strategies, investment plans and
effective coordination (LCBC 2000b). The GEF/World Bank has taken
the initiative in establishing the project entitled "Reversal of Land and
Water Degradation Trends in the Lake Chad Basin Ecosystem". The
project is now beginning a Transboundary Diagnostic Analysis (TDA)
before implementing projects. The TDA is designed to identify and
evaluate the major environmental problems that face, or may face,
the region and to determine their root causes. Activities wil include
the strengthening of groundwater data management tools, surface-
groundwater interaction model ing, and risk analysis model ing in
the Lake Chad Basin in order to identify and quantify long-term
consequences of development alternatives.
Climate change
Changes in precipitation in the Lake Chad Basin have been linked with
a combination of factors including vegetation cover, soil moisture,
monsoon dynamics and SSTs (see Assessment, Freshwater shortage,
Global climate change).
86
GIWA REGIONAL ASSESSMENT 43 LAKE CHAD BASIN
CAUSAL CHAIN ANALYSIS
87


Komadugu-Yobe sub-system
Figure 49 Komadugu-Yobe sub-system.
The Komadugu-Yobe sub-system has a basin area of 148 000 km2
extensive shal ow fl ooding (see review: Thieme et al. In preparation).
(World Bank 2002b) but contributes less than 2.5% of the total riverine
The mean annual rainfal , which fal s from June to October, varies from
infl ow to Lake Chad (see review: Thieme et al. In preparation). The
over 1 000 mm in the upstream catchment areas to approximately
Komadugu-Yobe River is the border between Nigeria and Niger
500 mm in the Hadejia-Nguru wetlands to less than 300 mm near
over the last 160 km and is the only perennial river system fl owing
Lake Chad (Bdliya et al. 1999).
into the northern pool of Lake Chad. Figure 49 shows a map of the
Komadugu-Yobe sub-system. The Komadugu-Yobe River is formed by
Traditional farming of sorghum, mil et and cowpea in the Komadugu-
various tributaries, in particular the Jama'are River that fl ows from the
Yobe Basin is predominantly rain-fed. Flood farming (rice) and recession
Jos Plateau (Nigeria), and the Hadejia River which fl ows from the area
farming (e.g. cassava) is practiced in the Hadejia-Nguru wetlands and
around Kano (Nigeria). The two rivers join to the southwest of Gashua
along some parts of the Yobe River. Low rainfal in the downstream
(northeast Nigeria). It is also supplied by the Misau, which comes from
regions forces farmers to largely depend on the river fl ows for water
the north of Bauchi (Nigeria) and joins the Komadugu-Yobe 120 km
requirements. The two major dams in the region (Tiga and Chal awa
from Lake Chad (LCBC 1998). Upstream of the confl uence of the Hadejia
Gorge) feed large irrigation schemes near Kano and Hadejia and
and Jama'are rivers the Hadejia-Nguru wetlands (fadamas) in Nigeria
supply Kano City. There has been increase in the number of smal -
start. Peak infl ow to the wetlands occurs in late August, resulting in
scale irrigation schemes that pump water from the ground, river and
88
GIWA REGIONAL ASSESSMENT 43 LAKE CHAD BASIN
CAUSAL CHAIN ANALYSIS
89
Table 10 Current requirements of water uses (domestic, irrigation, traditional flood and recessional farming, and livestock) that have
already been developed.
Hadejia river system upstream
Hadejia river system
Jama'are River within Hadejia-
Jama'are River upstream of
Yobe River
Water use
of Hadejia Town
downstream of Hadejia Town
Nguru wetlands
Katagum
(million m3 per year)
(million m3 per year)
(million m3 per year)
(million m3 per year)
(million m3 per year)
Domestic
341 a
16.4
5.2
24.1
11.9
Irrigation
586
94.9
42.9
80 b
162.1
Flood & recessional farming
-
270.6
180.9 c
104.6 d
116.7
Livestock
9
1.49
0.5
1.53
13.2
Notes: a Domestic and industrial use: other hydrologic units do not have significant industrial water requirements. b If planned irrigation development takes place, future water requirements are expected
to be 80 million m3/ year-. c Water requirements in a reasonable flooding year. The larger the extent of inundation the larger the area under cultivation and the larger the water requirements. dWater i.e.
minimum water requirements for water use. (Source: Blidya et al. 1999 (updated))
floodplain since the 1980s. Dry season farming has consequently
The River before the construction of dams and pre-drought years
increased, for example in Hadejia River between Wudil and Hadejia,
used to supply large amounts of water to the Lake but has now
and Burum Gana River (Bdliya et al. 1999).
been reduced to an insignificant flow of 1% (Neiland & Béné 2003).
The Komadugu-Yobe now only flows for six months of the year
The Hadejia-Nguru wetlands support a wide range of economic
instead of nine.
activities, which provide essential income and nutritional benefits,
After the Tiga Dam was completed there was a 21 to 22% reduction
including agriculture, grazing resources, non-timber forest products,
in stream flow of the Hadejia River (Oyebande 2001).
fuel wood and fishing for local populations. The wetlands also serve
The Hadejia-Nguru floodplains in northern Nigeria at one time
wider regional economic purposes, such as providing dry-season
covered nearly 300 000 ha, today, these wetlands have shrank to
grazing for semi-nomadic pastoralists, agricultural surpluses for
an estimated 70 000 to 90 000 ha (Barbier et al.1997).
neighbouring states, groundwater recharge of the Chad Formation
Reduced stream flow has caused a proliferation of weeds and siltation.
aquifer and `insurance' resources in times of drought. The wetlands
This has consequently limited the contribution from the Hadejia and
contain exceptional biodiversity particularly as a habitat for migratory
Burum Gana rivers to the Komadugu-Yobe River (Oyebande 2001).
waterfowl, especial y wader species from Palaearctic regions, and
The decline in wetland extent has proportionately decreased the
contain a number of forestry reserves (Barbier et al. 1997).
fish abundance in the wetlands and in addition perhaps more than
five species are no longer found in different parts of the floodplain
Water is used for domestic, industrial, agricultural (flood cropping and
(Oyebande 2001).
smal -scale irrigation), large irrigation projects (e.g Kano River Irrigation
In the Komadugu-Yobe sub-system it has been observed that in
Project), livestock, fisheries and ecological purposes. Agriculture is the
the last 20 years the quality of fish in the oxbow lakes has declined
largest consumer of water in the Basin. Table 10 gives a breakdown of
due to siltation from reduced stream flows, making the lakes too
the gross water requirements for domestic, irrigation, traditional flood
shal ow (Oyebande 2001).
and recessional farming, and livestock water use.
The number of birds in the Hadejia-Nguru wetlands has decreased
in correlation to the extent of the wetlands (Oyebande 2001).
Environmental and socio-economic impacts
Recently there have been concerns over the availability of nesting
Figure 50 provides a summary il ustrating the main causal links for
sites for the endangered West African subspecies of black-crowned
freshwater shortage in the Komadugu-Yobe sub-system. Stream flow
crane (Balearica pavonina pavonina) and adequate wintering
modification from human stream diversion and climatic variability has
grounds for intercontinental migrants such as the ruff (Philomachus
resulted in the fol owing environmental and socio-economic impacts:
pugnax) (see review: Mockrin & Thieme 2001).
Environmental impacts
Socio-economic impacts
Fol owing the droughts of 1983 and 1984, the Ngadda, Yedseram
Over-abstraction of water by upstream users in the Komadugu-
and Komadugu Gana rivers did not flow and the Misau River, which
Yobe sub-system, at unsustainable levels in a period when there
obtains river water from the Komadugu Gana was completely dry
has been a substantial decrease in precipitation in the watershed,
at Kari (Oyebande 2001).
has led to a reduction of the supplies for downstream users.
88
GIWA REGIONAL ASSESSMENT 43 LAKE CHAD BASIN
CAUSAL CHAIN ANALYSIS
89
Issue
Immediate causes
Sector activities
Root causes
Figure 50 Causal chain analysis model for Komadugu-Yobe sub-system.
There has been costly deepening of wells and increased use of
There is an inadequate supply of potable water coupled with poor
pumping to reach the lower water table (LCBC 1998).
or lack of proper sanitation. Irrigation canals are a vector for water-
Reductions in the Hadejia-Nguru wetlands surface area has led to
borne diseases such as cholera, goiter and schistosomiasis.
loss of economic benefits previously provided by the floodplain. It
Upstream and downstream conflicts and disputes between the
is estimated that the decline in this wetland has had an economic
downstream riparian states of Borno and Yobe were fuel ed by the
cost of between 7.1 mil ion USD and 11.7 mil ion USD (based on
lack of adequate water for their needs.
Barbier et al. 1997).
Migration from the northern peripheral of the Lake Chad Basin into
Reduced flooding has led to a decline in flood recession cropping
the case study site has exacerbated pressure on water resources.
and the extent of land favourable to dry season agriculture. Food
insecurity has consequently been accentuated in the region
Immediate causes
(Nami 2002). There has been a proliferation of pests as consequence
Decreased inputs
of poor irrigation management.
Rainfall events have been reduced in the Komadugu-Yobe sub-system
There has been a dramatic reduction in the extent of dry season
which in turn has led to decreased run-off and thus decreased stream
grazing lands that previously supported large numbers of livestock. In
flows. For example, annual rainfal decreased by over 40% compared
the Hadejia-Nguru wetlands perennial grass cover diminished, leaving
to the long-term mean (1905-1982) in Kano (Nigeria) in 1983 and 1984
only degraded grasslands of inferior quality and decreased area.
(Oyebande 1997 in Oyebande 2001). See Assessment, Freshwater
The reduction of the Hadejia-Nguru wetlands has reduced the
shortage, Regional climate change.
productivity of the fisheries.
There has been greater vulnerability to food insecurity caused
Increased diversion
as result of the decline in agriculture, livestock and fisheries
There have been many dams constructed on the Komadugu-Yobe sub-
productivity.
system aimed at utilising the water resources of the region for agriculture
The role of the Hadejia-Nguru wetlands in recharging the
and domestic water supply. During the 1970s and early 1980s around 20
groundwater aquifer of the Chad Formation, has been diminished
reservoir dams were built on the Hadejia river system, which negatively
(Barbier et al. 1997).
affected the hydrology of the Yobe River, the only inflowing river into Lake
90
GIWA REGIONAL ASSESSMENT 43 LAKE CHAD BASIN
CAUSAL CHAIN ANALYSIS
91
Chad's northern pool. The largest upstream irrigation scheme at present
of freshwater shortage that has prevailed over the past 40 years. The
is the Kano River Irrigation Project, fed by the Tiga Dam completed in
prevalence of poverty in the sub-system requires special attention
1974. The Hadejia Val ey Project is the second major irrigation scheme
regarding water al ocation.
within the River Basin, and is supplied by the Challawa Gorge Dam
(capacity of 972 mil ion m3). It is estimated that in the Komadugu-Yobe
Inadequate valuation of environmental goods and services: Water diversion
Basin 16 312 ha are used as large irrigation areas (Kindler 1990) and that
as part of the Komadugu-Yobe irrigation projects e.g. the Kano River
a water requirement of 380 mil ion m3 would be needed for optimum
Irrigation Project supplied by the Tiga Dam, did not take into account the
management of the irrigated areas (King 1993). The Tiga and Chal awa
essential income and nutrition benefits in the form of agriculture, grazing
Gorge dams also supply water to Kano City for domestic and industrial
resources, non-timber forest products, fuel wood and fishing provided for
purposes. After the Tiga Dam was completed there was a 21 to 22%
local populations by the Hadejia-Nguru wetlands. The wetlands also serve
reduction in stream flow of the Hadejia River (Oyebande 2001). Water
wider regional economic purposes, such as providing dry-season grazing
use in the Basin is estimated to be 2.6 times higher than available water
for semi-nomadic pastoralists, agricultural surpluses for neighbouring
in the Komadugu-Yobe Basin (IUCN 2003b).
states, groundwater recharge of the Chad Formation aquifer and
`insurance' resources in times of drought (Barbier et al. 1997).
Conclusion
Stream flow modification has been caused by the immediate causes of
According to the Ramsar Convention on Wetlands the present value
decreased rainfall events and the diversion of water resources. Reduced
of the aggregate stream of agricultural, fishing and fuel wood benefits
rainfall has been caused by changes in the regional and global climate
were estimated to be around 34 to 51 USD per ha (1989/90 prices
and therefore policy to address this immediate cause needs to be
based on the maximum flood inputs) (Barbier et al. 1997). The Hadejia-
discussed at a global forum (IPCC 2001). According to expert opinion
Nguru wetlands have declined by 210 000 to 230 000 ha. It is therefore
the most significant GIWA assessed immediate cause is the increased
estimated that decline in this wetland has had an economic cost of
diversion of rivers by the large dam developments in the Komadugu-
between 7.1 mil ion and 11.7 mil ion USD. However, it must be noted
Yobe region. The fol owing section will identify the root causes for the
that this has been a result of both upstream water developments and
unsustainable use of water resources in the Basin.
because of climatic variability. There is little evidence that the large
irrigation and water developments provided any economic benefits,
Root causes
and in fact it is thought that they had negative impacts because of the
Demographic
significant implementation costs involved and because of the above
Population growth: Increases in the Basin's population has led to greater
mentioned loss of environmental goods and services.
pressure on the natural resources of the Komadugu-Yobe sub-system
including its water resources. The population of the sub-system is
Lack of incentives promoting environmentally sound practices: There is an
currently estimated to be 20.8 mil ion (ORNL 2003) representing over 55%
absence of economic instruments, incentive measures, and specific
of the Lake Chad Basin's population. Such a concentration of population
programmes to promote and support local initiatives (World Bank
has led to extreme pressure on the diminished water resources.
2002a). For example farmers have no incentive to conserve water, as
they do not pay for the resource. This encourages farmers to grow crops
Migration: There has been a large influx of immigrants from the
such as rice, which fetch high market prices, yet are water intensive.
northern provinces into the Komadugu-Yobe Basin due to drought
and desertification forcing communities to leave the increasingly arid
Knowledge
northern environment. This has increased competition and aggravated
Public awareness: Information is only disseminated amongst the
conflicts between stockbreeders who are moving southwards and
scientific community and to ministerial departments. Information
sedentary farmers (LCBC 2000b).
does not filter down to the traditional communities such as those in
the Hadejia-Nguru wetlands, partial y due to poor communication
Economic
infrastructure and a lack of consideration by policy makers of traditional
Poverty: Endemic poverty faced by the population of the Komadugu-
management systems.
Yobe sub-system is a catalyst for environmental degradation. For
their short-term survival the population exploits natural resources
Information sharing: There is weak information sharing networks
at an unsustainable level. The people suffer greatly from the effects
between the Nigerian Federal States and between the two riparian
90
GIWA REGIONAL ASSESSMENT 43 LAKE CHAD BASIN
CAUSAL CHAIN ANALYSIS
91
nations. The Nigeria-Niger Joint Commission has meetings where some
fuel ed disputes between the downstream states of Borno and Yobe
information is exchanged verbally; however these meetings primarily
about who has the right to this diminishing resource. With no water
resolve disputes rather than being an information dissemination
al ocation law for the entire basin, the uncertainty over water rights also
mechanism. Environmental and hydrological data are rarely centralised
transcends national boundaries. It has been argued that since Nigeria
in the Nigerian Federal ministries and are thus difficult to access
uses a large share of Lake Chad's water for irrigation, they have special
(Lemoal e 1997). For instance, the water resources Master Plan is yet to
responsibility in insuring the long-term sustainability of water use for
be updated since 1993.
all riparian countries (Isiorho et al. 2000).
An insufficient knowledge of water resources and the functioning of
Prior to the Decree No. 101 of 1993, water users in northern Nigeria
aquatic ecosystem: The Komadugu-Yobe sub-system has a larger
had customary rights, which had the force of law, permitting anyone
body of scientific information as compared to the Chari-Logone sub-
to make use of water where available for his personal needs and for his
system, and it is the most studied region of the Lake Chad Basin. Hollis
livestock and agriculture. This inadequately regulated the use of inter-
et al. (1993) created a model simulation of the maximum flood extent
state waters, and prevented the effective management of the growing
between Hadejia and Gashua, but the region stil lacks a comprehensive
demand for water resources (Bdilya et al. 1999).
model that is able to predict the hydrodynamic reactions of proposed
water projects. The current model could be significantly improved
Governance
through the application of remote sensing and GIS. There is a lack of
No integrated management strategy: There is no overal water
hydrometeorological information to support decision making in the
management strategy for the Komadugu-Yobe sub-system (Bdliya
region and monitoring networks have not been operating since the
et al. 1999). The Nigeria-Niger Joint Commission brokered an agreement
late 1970s (IUCN 2003b). Information networks on sediment loads are
on the equitable sharing of the water resources common to the two
particularly weak. There is presently a lack of knowledge regarding
countries in 1989 and, unlike the Chari-Logone equivalent, there are
future climate changes and its impact on water infrastructure, ecology
regular meetings between the two states. The Commission provides
and socio-economic status of the Komadugu-Yobe sub-system.
an interface between the two countries that enables concerns to be
discussed and conflicts to be resolved. However, this only tackles issues
Scientific resources: Nigeria and Niger place inadequate importance
concerning the last 160 km stretch of the Komadugu-Yobe that forms
on scientific and technical research, which can be partly blamed on
the border between Niger and Nigeria. The major water developments,
financial difficulties. The region lacks professional human resources and
which are located in the upstream states are not represented at these
monitoring and evaluation facilities. Although there is a greater wealth
meetings. The Commission therefore does not enable integrated
of information than in the Chari-Logone Basin, the Federal ministries do
management of the entire Komadugu-Yobe sub-system. The meetings
not centralise or coordinate research efforts.
are a forum to discuss problems, rather than long-term solutions for the
water problems that face the entire region. The most acute obstacle in
Legal
the management of water is the absence of a coordinating mechanism
Although in the Komadugu-Yobe River Basin there is some legislation
to harmonise the activities of the water users.
related to water resources managment, it does not enable integrated
management of the entire sub-system. The Federal Government of
Institutional weakness: Out of the six government organisations and
Nigeria Decree No. 101 of 1993 (National Water Resources Legislation)
over 14 non-government organisations in the Komadugu-Yobe Basin
does relate to this, but the regulations for and rules for administration
that have interest in the management of water resources in the sub-
and enforcement have not been published (see next paragraph
system, only two governmental institutions, namely the Federal Ministry
Governance: Capacity to promote compliance and enforce agreements).
of Water Resources (FMWR) and the Federal Ministry of Environment
There is also a policy of the National Water Resources Council, which
(FME), and two non-government organisation, the Hadejia-Nguru
stipulates releases of water from the Federal Government/River Basin
Wetlands Conservation Project (HNWCP) (recently taken over by
Authority dams at a prescribed charge per m3 to State Water Agencies
the Jigawa Enhancement of Wetlands Livelihoods (JEWEL) project),
downstream of such dams. For example, releases from the Tiga and
and the Stakeholders Consultative Forum, are concerned with the
Chal awa Gorge dams to Kano State Water Corporation. There is
sustainable utilisation of the water resources of the Komadugu-Yobe
however no water al ocation law between Nigerian States or between
sub-system. The Federal Ministry of Water Resources has accordingly
Nigeria and Niger. The inadequate water for the downstream states has
set up the Komadugu-Yobe Basin Consultative Commitee. Al the other
92
GIWA REGIONAL ASSESSMENT 43 LAKE CHAD BASIN
CAUSAL CHAIN ANALYSIS
93
institutions are inward-looking concerned only with meeting their
focused on general expansion in al areas of the economy. Concerns
water requirements, with minimal or no concern for the impacts of
over the food security for the rapidly expanding population resulted
their activities on other users. There is no organisation that regulates
in agricultural policy focusing on increased production. It was decided
the water uses in the Basin. Furthermore there are overlaps in the roles
to invest in large-scale agro-industry projects that included large
and mandates of the various governmental institutions in the Basin. This
dams, particularly in the Hadejia river system. They relied on modern
scenario clearly cal s for a coordinating and control mechanism (Bdilya
technologies and focused on producing maximum yields in the shortest
et al. 1999). The two River Basin Development Authorities (RBDAs),
time (Neiland & Béné 2003). These hydro-agricultural schemes that now
which are implementing agencies of the FMWR, are cal ed the Hadejia-
threaten the wetland ecosystems and economies were planned based
Jama'are River Basin Development Authority (HJRBDA) and the Chad
on data gathered during a wet period in the 1960s. Planners did not take
Basin Development Authority (CBDA). They both act independently
into consideration the climatic variability that has been demonstrated
of each other and their development-orientated mandates do not
throughout the Lake Chad Basin's history. Droughts lowered the flow
take responsibility for environmental protection. While the River Basin
at Gashua by 23% while the Tiga Dam lowered it again by a similar
Development Authorities are required to control pol ution in the projects,
measurement (Hol is et al. 1993). The large irrigation projects have
there is no specific provision for Health Impact Assessment (HIA), or for
put stress on the available water resources. For example the water
the mitigation and control of vector-borne diseases. Although Nigeria is
requirements in the Hadejia river system are already at times exceeding
known to have endemic schistosomiasis and other water-related diseases,
the available water resources (Bdilaya et al. 1999). The possibility of
the institutional arrangements for water resources development have not
reduced flows and the impact this could have on populations in the
taken health issues into consideration (Ofoezie 2002).
downstream Nigerian States and Niger, whose productive systems are
highly dependent on the river flow, was not sufficiently taken into account.
Lack of coordination: Water resource management in the Komadugu-
The governments of the sub-system have continued to demonstrate a
Yobe sub-system is fragmented with il -defined and often conflicting
lack of political commitment at the leadership level with no long-term
responsibilities between government agencies and stakeholders. The
goals and objectives to solve freshwater shortage concerns.
Nigerian water resource sector is treated as a different sector to the
environment ministry. The environment ministry is not consulted during
Lack of stakeholder participation: The upstream dam developments had
the planning of water projects. They concentrate on managing toxic
minimal stakeholder involvement. Decision-making and consultations
substances. When environmental problems from water resource projects
were only made at the state and federal level in Nigeria. Lobbying
did arise, the environment departments were requested to assist.
from state officials for large dams occurred at the Federal Government
However they had no expertise in water-related environmental issues.
level as capital required to finance the projects exceeded state funds.
Consultants were hired to assess the concerns, but the departments
Niger, which is located downstream of the dam constructions was not
still lack the expertise to analyse the results of their studies and turn
consulted or considered during planning. There was no involvement
recommendations into policy. The recently established Komadugu-Yobe
of the public in the planning or implementation process including
Coordinating Committee chaired by the Minister of water resources also
the traditional communities of the Hadejia-Nguru wetlands. At the
includes the ministries of environment and health as members.
Nigerian national level, the National Council on Water Resources, which
is comprised of the state water authorities under the chairmanship of
There is a lack of coordination and cooperation between the two
the FMWR, is responsible for coordinating water use (Bdliya et al. 1999).
River Basin Development Authorities operating in the sub-system
There have been concerns that stakeholders are not represented in the
(IUCN 2003b) and between Nigerian States during planning and
technical committee who make recommendations at these forums. The
implementation of water projects. Uncoordinated water developments
water authorities (RBDAs) control the dams and are therefore a water
(e.g. the recently approved expansion of the Hadejia Val ey Project
user rather than a regulator. The federal or national authorities are
without execution of an Environmental Impact Assessment for the
dominating the decision making process at the Nigeria-Niger Joint
Basin) throughout the Basin due to increasing water demands for
Commission with little interaction with, and involvement of the local
water are resulting in an inequitable water allocation and environmental
populations (Lemoal e 1997).
damage (Bdliya et al. 1999).
Capacity to promote compliance and enforce agreements and policies:
Lack of water resource environmental planning: The Nigerian Government
The LCBC lacks the capacity to enforce issues under its mandate (see
with increasing revenues from oil exports during the period 1970-1980,
Root causes, Chari-Logone and Lake Chad, Lack of capacity to promote
92
GIWA REGIONAL ASSESSMENT 43 LAKE CHAD BASIN
CAUSAL CHAIN ANALYSIS
93
compliance and enforce agreements and policies). Earlier agreements
intake is expected to have an even more severe problem with silting. The
in the Komadugu-Yobe sub-system had guaranteed that certain
water at this intake is very turbid as a result of severe erosion upstream
amounts of flow from the Hadejia river system would be released for
in the Watari and other tributaries. The siltation decreases the inflow by
downstream communities. For instance, the Bagauda Agreement which
diverting water to the other bank. Inadequate sediment studies were
emerged after the construction of Tiga Dam in 1974 stipulated the long-
made when situating the intakes. The discharge in the Hadejia River from
term average annual flow at Gashua as minimum guaranteed flow at
the Tiga and Chal awa Gorge dams towards the end of the dry season
Gashua. This has not been implemented (IUCN 2003b). Fol owing the
is maintained at higher than optimal levels to ensure that the sumps
promulgation of the Water Use Decree 101 of 1993 in Nigeria, rules and
are fil ed (Diyam 1996 in Bdliya et al. 1999). The Kano State Government
regulations for the administration and enforcement were drafted. They
puts pressure on the HJRBDA to release more water in order to meet the
have never been published as a White Paper and therefore the law has
requirements of Kano City. This consequently results in the flooding of
not been implemented.
downstream farmland (JEWEL 2003). This is highly wasteful particularly
during periods of low water availability (Bdliya et al. 1999).
Poor water use efficiency: The scarcity of water in the Basin has not
prompted management to utilise resources that are available in a more
Stream flow conveyance is hampered by the proliferation of blockages
efficient manner. There are no guidelines or incentives for the farmers
from weeds and siltation in the Hadeijia river system. The blockages
to conserve water with inefficient gravity irrigation stil being employed
in the Old Hadejia River have prevented the Hadejia River from
rather than more efficient techniques such as drip or sprinkler irrigation
contributing to the Yobe River. These have not been cleared and have
systems. Irrigation channels are open and unlined, and therefore prone
consequently continued to impede freshwater from reaching the main
to infiltration and evaporation losses. There are no immediate incentives
river channels. The water is instead restricted to the wetlands of the
for the upstream farmers to conserve water, as they do not pay for the
Hadejia-Nguru and does not reach downstream users.
resource, which consequently al ows farmers to grow water intensive
crops such as rice. It also has to be questioned whether growing such
Slow progress in implementing environmental degradation mitigation
crops is appropriate in a region prone to freshwater shortages.
measures: As with the Chari-Logone sub-system, the aforementioned
root causes have long been realised by the governments, and
An international dam safety specialist recruited by the World Bank as
international assistance organisations as a result of the studies by
part of the GEF project has reviewed the Tiga Dam (Hadejia River Basin).
GEF and UN organisations (see Root causes, Chari-Logone and Lake
The main threats were identified in decreasing order of probability:
Chad, Slow progress in implementing environmental degradation
internal erosion due to arching of fil material over the cut off trench,
mitigation measures). Specifically to the Komadugu-Yobe Basin, the
internal erosion caused by a fracture of one of the two secondary
FMWR conceived a strategy for the "ultimate utilisation of the water
outlet pipes, and slope failure under seismic load. The probability of
resources potentials" of the Basin in 1996. This strategy has stil not been
failure was considered high for the 8 km zoned earthfill embankment,
finalised and the intended in-house coordinating body to facilitate the
with the main threat coming from piping i.e. water creating channels
implementation of the strategy has not materialised (Bdliya et al. 1999).
through the dam. Tens of thousands of people are at risk at Tiga. The
Chal awa Gorge Dam is newer and was not considered to pose an
Traditional management systems
immediate threat (World Bank 2002a). Although the Tiga Reservoir has
In the Komadugu-Yobe sub-system, the rural population is highly
approximately twice the inflow of the Chal awa Reservoir, the maximum
differentiated and the poor, critical y, do not have access to fishing
capacity of the main Tiga Dam outlet is just a third of the maximum of
and farming resources (Bene et al. 2002). This can be attributed to the
the two outlets of Chal awa Gorge Dam.
predominance of traditional management systems at a local level (83%
of Nigerian vil ages) and the absence of strong modern systems, which
The operation of dams is highly uncoordinated (Bdliya et al. 1999). The
results in the majority of the benefits from water resources, such as the
Greater Kano Water Supply (GKWS) intake is located on Kano River before
fisheries, being retained by a powerful elite minority, including local
the confluence between the Chal awa and Kano rivers. The intake has a
leaders, their extended families, and other prominent people and their
sump that is easily silted, so that constant dredging is necessary. A canal
associates (Neiland & Béné 2003).
had to be constructed on the Kano River to bring water to the sump.
Sandbagging is also used to simulate a weir structure, but they are
Climate change
eroded with time, particularly with varying water releases. The Chal awa
See Chari-Logone/Lake Chad, Root causes, Climate change.
94
GIWA REGIONAL ASSESSMENT 43 LAKE CHAD BASIN
CAUSAL CHAIN ANALYSIS
95
Conclusions
Table 11 Summary of root causes.
Chari-Logone/Lake Chad sub-system
The root causes of the stream flow modification are similar in both the
Broad root
Specific root cause
cause
Chari-Logone/Lake Chad sub-system and the Komadugu-Yobe sub-
- Population: High population growth rates increasing water requirements.
Demographic
system. Table 11 gives a summary of the root causes identified by the
- Migration: Large influx of migrants from north arid regions of Lake Chad Basin.
Causal chain analysis. The causes include poor water policy and legal
- Poverty: Vulnerable to environmental changes.
- Inadequate valuation of environmental goods and services: The construction of
frameworks, particularly the absence of water al ocation laws, a lack of
Economic
dam and flood infrastructure as part of the SEMRY irrigation project did not take
into account the economic value of the Waza-Logone floodplains downstream of
coordination and cooperation between stakeholders at al levels and
the Maga dam.
poor enforcement partly due to institutional weaknesses. These key
Lack of:
- Public awareness;
problems have led to the unsustainable use of water resources, and
- Information sharing;
the subsequent non-implementation of agreed recommendations
- Identifying and quantifying water abstraction;
Knowledge
- An insufficient knowledge of water resources and the functioning of aquatic
from the Master Plan (LCBC 1992) and further initiatives from GEF
ecosystems;
- Pol ution data;
and other partners. Policy options wil need to directly address some
- Scientific resources.
of the prominent root causes such as the lack of integrated water
- No water al ocation laws.
- No legal instruments to enforce agreements.
management, the inequitable sharing of available water, and the
Legal
- Weaknesses in Fort Lamy Convention.
poor water resources management. Other root causes such as poor
- See also conflicting policies between ministries. Legal aspects relating to land
management and use.
stakeholder involvement need to be taken into account during the
- Conflicting policies between ministries;
planning and implementation of policy options/projects.
- Lack of water resource environmental planning;
- Lack of stakeholder participation;
Governance
- Lack of capacity to promote compliance and enforce agreements and policies;
- Poor water resource management;
- Slow progress in implementing environmental degradation mitigation measures.
Climate change
- Reduction in rainfall in region.
Komadugu-Yobe sub-system
Broad root
Specific root cause
cause
- Population: 55% of the Lake Chad Basin's population live in this sub-system
(based on ORNL 2003). Water requirements are 2.6 available water supplies in the
Demographic
Hadejia river system.
- Migration: Large influx of migrants from north arid regions of Lake Chad Basin.
- Poverty: Unsustainable exploitation for short-term survival.
- Inadequate valuation of environmental goods and services: Upstream water
Economic
developments did not take into account the value of the downstream Hadejia-
Nguru wetland resources.
- Lack of incentives promoting environmental y sound practices.
Lack of:
- Public awareness;
- Information sharing;
Knowledge
- An insufficient knowledge of water resources and the functioning of aquatic
ecosystems;
- Scientific resources.
- No water al ocation law between Federal Nigerian States and between Nigeria
and Niger.
Legal
- Influence of customary rights.
- Regulations and rules for enforcement of Nigerian Decree 101 Water Resources
has not been published.
- No integrated management strategy;
- Institutional weakness;
- Lack of coordination;
- Lack of water resource environmental planning;
Governance
- Lack of stakeholder participation;
- Lack of capacity to promote compliance and enforce agreements and policies;
- Poor water efficiency management;
- Slow progress in implementing environmental degradation mitigation measures.
Traditional
Traditional management systems are dominant in the region. Socio-economic
management
differentiation restricts access of water resources to the poor.
systems
Climate change
Reduction in rainfall in region.
94
GIWA REGIONAL ASSESSMENT 43 LAKE CHAD BASIN
CAUSAL CHAIN ANALYSIS
95
Policy options
This section aims to identify feasible policy options that target
However to successfully implement projects/policy actions aimed
key components identified in the Causal chain analysis in order
at alleviating these challenges, water governance issues, primarily
to minimise future impacts on the transboundary aquatic
the institutional and legislative failures identified during causal chain
environment. Recommended policy options were identified
analysis, need to be addressed as a priority. Many of the root causes
through a pragmatic process that evaluated a wide range of
were identified, and recommendations made, by the Lake Chad Basin
potential policy options proposed by regional experts and
Commission (LCBC) Master Plan (LCBC 1992), fol owed by an update of
key political actors according to a number of criteria that were
this plan and the formulation of a Strategic Action Plan (SAP) (LCBC 1998).
appropriate for the institutional context, such as political
Implementation of these recommendations by riparian countries has
and social acceptability, costs and benefits and capacity for
been very slow (see Root causes, Governance, Slow implementation
implementation. The policy options presented in the report
of mitigation measures). The GEF project entitled the `Reversal of Land
require additional detailed analysis that is beyond the scope
and Water Degradation Trends in the Lake Chad Basin Ecosystem' is
of the GIWA and, as a consequence, they are not formal
beginning to implement prioritised recommendations made by the
recommendations to governments but rather contributions to
Master Plan and SAP. The projects development objective is "to build
broader policy processes in the region.
capacity within the LCBC and its national committees so that it can better
achieve its mandate of managing land and water resources in the greater
conventional basin of Lake Chad" (World Bank 2002a). The GIWA Policy
option analysis firstly outlines the recommendations made by the SAP,
fol owed by project options aimed at addressing base-wide root causes,
Problem definition
and then in turn, more specific project options that can be implemented
once the fundamental root causes have been addressed.
The Policy options analysis aims to describe the freshwater shortage
issues that need to be resolved or mitigated, and wil describe
The fol owing projects were discussed for the entire Lake Chad Basin:
alternative courses of action that may be taken by policy-makers in
1. Implementation of the GEF project `Reversal of Land and Water
the region. Each course of action will have a set of projected outcomes
Degradation Trends in the Lake Chad Basin Ecosystem';
with the trade-offs of each action discussed. The policy options are a
2. Water al ocation agreement;
preliminary analysis of actions and conceptual ideas for projects that
3. Inter-basin water transfer.
are currently being considered and/or being developed. Specific policy
options are evaluated for the entire conventional basin and for the
The fol owing projects were discussed for the Chari-Logone/Lake Chad
Chari-Logone/Lake Chad and the Komadugu-Yobe sub-systems.
sub-system:
4a. Reinundation of the Waza-Logone floodplains (Chari-Logone sub-
Two of the broad challenges facing water management in the Lake
system);
Chad Basin were noted as being: (i) how to control unsustainable water
4b. Assessment of changing land use in the head waters of the Chari-
consumption; and (i ) how to enhance the water allocation mechanisms.
Logone sub-system.
96
GIWA REGIONAL ASSESSMENT 43 LAKE CHAD BASIN
POLICY OPTIONS
97
5. Chad-Niger Transboundary Project to Combat Sand Dunes and
Long-term objective 2
Reverse Water Degradation Trends in Lake Chad (Lake Chad sub-
Integrated management of the use of finite and vulnerable water
system).
resources in the ecosystem, based on better knowledge of these
The fol owing projects were discussed for the Komadugu-Yobe sub-
resources.
system:
Rehabilitation and development of a permanent network to
6. Grant subsidies to irrigation farmers in northern Nigeria for
monitor water, the environment and the way they are exploited, to
implementing water conservation measures;
provide better knowledge of the way in which the hydrosystems
7. Maintenance and improvements for safety and improved efficiency
function.
of dams and stream flow.
Dynamic monitoring of water management (floods, droughts, etc.)
and regular monitoring of development works and resources in
Recommendations from the GEF project
the Basin, using modern integrated data management tools and
Strategic Action Plan
simulations to assist in decision-making and anticipate possible
The Strategic Action Plan described the aims and objectives for a
crises.
20 year strategic plan (LCBC 1998). The overal aim was `Sustainable
Preparation of two Sustainable Basin Development Plans to enable
Development of the Lake Chad Basin' and the main objective `Lake
the LCBC member States to evaluate, on a continuous and scientific
Chad is sustainable protected by concerted, integrated management of
basis, the break-down of costs, benefits and environmental impacts
the Basin's resources, guaranteed by all players within the Basin taking
of the alternative development works proposed by the various
responsibility and cooperating'.
countries.
Long-term objective 1
Long-term objective 3
Concerted management of international waters, based on regional
Players in the Basin take responsibility for protecting common
cooperation and national policies harmonised and applied in each
heritage.
sub-basin.
Concrete priority actions, to protect Lake Chad, and the international
A water policy in each country, taking into account, the value
waters that feed it, in order to preserve the ecosystems against new
of hydrosystems and aquatic ecosystems in sectoral economic
risks.
policies and in environmental legislation.
Regional promotion of productive, water saving, economical y
Updated regional cooperation agreements between countries with
beneficial techniques and practices that are accepted by local
a view to ensuring sustainable management of the international
people and local economic operators, and do not harm the
waters of the Lake Chad Basin, particularly with respect to risks of
environment.
cross border pollution and overexploitation of water.
A renewed framework of incentives and laws in each country
Reforms and new institutional mechanisms for cooperation and
harmonised on a regional basis in particular with respect to risks of
consultation in each country, for each international sub-basin
cross-border pollution.
and for the Lake Chad Basin, so that water can become a link and
Development of suitable mechanisms and instruments for
catalyst for balanced regional development, and not a source of
mobilising internal and external financial resources, aimed
conflict.
at progressively achieving self-sufficiency for the sustainable
People placed at the heart of decision making, in particular by
management of patrimonial resources in the Lake Chad Basin.
enabling local associations to draw up their own community
development scheme and seek sustainable means of existence,
Priority actions
with the active participation of the local inhabitants (environmental
Once the main guidelines had been met the SAP (LCBC 1998) identified
awareness teaching), linking up this activity with policies and water
through national workshops six priority actions:
management in the Basin.
1. Initiate shared management of water resources, with mechanisms
The creation of essential links between research programmes, the
for cooperation and integration both within and between the
fight against poverty, biodiversity programmes, the fight against
countries, at the various levels (national, sub-basin and basin).
desertification, modifications in the climate and in international
2. Set up viable networks for col ecting basic information in order to
waters throughout the Lake Chad Basin.
identify and monitor water resources, ecosystems and the ways in
which they are exploited more accurately.
96
GIWA REGIONAL ASSESSMENT 43 LAKE CHAD BASIN
POLICY OPTIONS
97
3. Carry out basic sectoral measures to control water demand in order
The project wil address the fol owing root causes identified by the
to combat desertification and the loss of biodiversity.
GIWA Causal chain analysis: Lack of water resource environmental
4. Ensure the prevention and control of contaminants and preserve
planning, lack of stakeholder participation, lack of coordination
fisheries resources.
and integrated management, and the lack of capacity to promote
5. Improve methods of exploiting aquatic ecosystems and protect
compliance and enforce agreements and policies. The LCBC member
floodplains in relation with regional development.
States recognised that uncoordinated development is unsustainable in
6. Begin pre-feasibility studies (physical, technical and economic)
terms of investment, socio-economic and ecosystem welfare, and that
and environmental impact studies to intra- and inter-basin water
they needed to coordinate their national plans and actions with each
transfers.
other at the regional level (World Bank 2002a). The GEF project appraisal
states that "for the LCBC to assume a more central role within the basin,
The 8-year action plan in fact includes four programmes, the first of
working with the countries and regional projects, its capacity will need
which (A) represents the GEF comprehensive regional programme
to be strengthened" (World Bank 2002a).
based on: (i) institutional coordination; (i ) scientific knowledge of
water resources and ecosystems; and (i i) pilot or research actions, to
The primary development objective of the GEF project, in accordance
be carried out on cross-sector (priority) issues and in the particular sub-
with the SAP, is to strengthen the capacity in the LCBC, by placing a
system of the Lake Chad itself.
Project Management Unit (PMU) to work within and alongside it, to
work together in implementing the project, so that the LCBC may
Each of the 36 projects of the Master Plan (LCBC 1992) was examined
be able to execute ful y future projects. Although the project will
critically to take account of the new strategy and conditions outlined
not undertake national-level policy or institutional reforms, it will
in the SAP. Certain pertinent modules will be taken up at the time the
strengthen existing regional policies and institutions to better manage
sub-programmes are formulated in detail.
the shared Lake Chad resources. This wil occur by drawing support
from LCBC member States in order to raise awareness of impacts at
regional level of national policies, and therefore, the need to harmonise
national actions at the regional level. This should in turn translate into
Lake Chad Basin
stronger regional mechanisms and coherence, as voiced in the SAP, and
raise donor interest.
Political and organisational frameworks
For details on the political and institutional framework for the entire
Links to policy and institutional change and renewal in each component
Lake Chad Basin, see Regional definition, Institutional arrangements.
are highlighted as fol ows in the first component of the project:
(i) LCBC members review and recommit to the institution; (i ) define
Options
and promote integration of transboundary water and environmental
Option 1: Implementation of the GEF project for the `Reversal
policies into national development plans; (iii) review and recommend
of Land and Water Degradation Trends in the Lake Chad Basin
means to harmonise relevant frameworks so as to get integrated
Ecosystem'.
regional approach to long-term management of the resources; and
The development objective of the GEF project is "to build capacity
(iv) establish regional structures that review, harmonise and coordinate
within the Lake Chad Basin Commission (LCBC) at its national
management of shared resources and uses. The second component
committees so that it can better achieve its mandate of managing
of the project wil initiate a number of pilot projects that constitute
land and water resources in the greater conventional basin of Lake
the country-identified most urgent priority actions, and it is hoped,
Chad" (LCBC 2002).
the successful implementation of these projects by the LCBC and
countries as soon as possible, will build donor confidence. Formulating
The United Nations Development Programme (UNDP) first prepared
these new institutional mechanisms wil link regional, national and local
the project, and a PDF-B was approved by the Global Environment
planning initiatives. The third component of the project will finalise a
Facility (GEF) in 1995 and executed by UN Department of Economic
Transboundary Diagnostic Analysis (TDA) with regional validation and
and Social Affairs (UNDESA). Work at that time resulted in an update of a
agreement on LCBC SAP, and subsequent mobilisation of donor support
Diagnostic Study, an update of LCBC Master Plan, as wel as the elements
(LCBC 2002).
of a Strategic Action Plan.
98
GIWA REGIONAL ASSESSMENT 43 LAKE CHAD BASIN
POLICY OPTIONS
99
Option 2: Water allocation agreement
rights based on customary patterns and rights implicit in social norms
A water al ocation agreement has been proposed by the LCBC and a
and local practices.
draft agreement based upon an earlier draft by the FAO is presently
under negotiation.
A possible incentive could be to put a value on the quantity of water that
farmers save. Water that is saved can be purchased and then diverted to
Integrated river basin management requires a suitable and effective
the river channels to real ocate the water to downstream users.
legal framework to achieve its required goals. There needs to be an
agreement between the member States to share responsibility for the
Option 3: Inter-basin water transfer
management and al ocation of water resources. A water al ocation
The LCBC Master Plan and Strategic Action Plan identified water transfer
process cannot simply be achieved from technical specifications, but
as an option amongst a list of projects.
to be successful requires economic analysis and a legal framework
to be instal ed. The Lake Chad Basin Commission has not had the
Preliminary studies of the feasibility of this project have now begun in
legal framework to implement and enforce the equitable sharing of
accordance with the SAP (LCDC 1998). Inter-basin transfer supporters
the Basin's water resources. A draft water al ocation agreement was
argue that "there cannot be much water saving to be expected from
prepared by the FAO after a request in 1969 at the 9th Council Meeting
efficient management as the largest amount of water is attributed
of the LCBC, but was never ratified. A revised version of this draft was
to evaporation" and thus "conditions in the Lake Chad Basin cal for
presented in 2000 and has since been under discussion by member
measures beyond management of the available water resources in
States. This agreement will set minimum flow rates for points along the
the Basin." It is argued that a major water transfer to the region is
Komadugu-Yobe and Chari-Logone sub-systems. Water users will not
"required to restore the Lake, improve base flow and channel storage,
be able to abstract water at a level that would cause flows to drop below
arrest groundwater recession and fal ing water table, and enhance
these levels. The flows will be maintained by control ed flood releases
groundwater recharge, so that a state of equilibrium may ultimately be
from the dam infrastructure. This aims to increase water availability for
attained" (UNECA unpublished).
downstream users and ecosystems and maintain the extent of the Lake
Chad during times of low precipitation. There is a need to "formulate
The 49th session of the Council of Ministers of LCBC held in Yaoundé,
principles of equitable water utilisation, development, conservation,
Cameroon, January 2002, discussed a possible feasibility study of the
management and protection, with a view to the promotion of optimal
project to feed Lake Chad with water from the Congo Basin. The
and sustainable utilisation thereof for present and future generations"
commission members directed a contribution of 1 mil ion USD by
(LCBC 2000a). Water al ocation is distinct from the task of distribution,
member States for the project feasibility study. However a feasibility
which is defined as delivering water in accordance with al ocations.
study has not found backing from any international donor organisation.
Feasibility studies for the inter-basin transfer in terms of engineering
The theory "Tragedy of the Commons" is applicable to water use in
design have not yet begun, as not all member States have submitted
the Lake Chad Basin (Hardin 1968). Each water user sees the benefits
their contributions. There are therefore insufficient funds to finance the
of using more water as the productivity of an individual's economic
feasibility studies and requisite social and environmental assessments.
activities increase with a greater use of the common water resource.
There was a previous International Competitive Bidding (ICB) process
However with common access to the water supply, if one individual
launched unsuccessful y, for which several private sector firms
after another uses too much, other water users will suffer. The "tragedy"
submitted bids (and tendering fees), but which was later suspended
appears when the common resource is overused, and then al wil suffer
for lack of funds on the part of the LCBC.
(Hardin 1968). Property rights to any resource are therefore much more
than a title on paper: they are essentially a relationship between people
This project proposes moving 900 m3/s of water from the Oubangui;
and the use of natural resources. A single user rarely has full ownership
the major tributary of the Congo River in a navigable canal. In current
rights to control, use, and dispose of the resource purely as he or she
proposals the infrastructure comprises: construction of one dam at
sees fit. Rather, it is useful to think of a bundle of rights, with different
Palambo (65 km upstream from Bangui) to regulate the flow on the
users and stakeholders having the right to use water for a certain
Oubangui River in CAR; construction of one main canal to transfer
purpose, or subject to various types of conditionality. Water rights are
water by gravity from Palambo Dam reservoir to Fafa-Ouham River in
a basis for a claim on the resource, and include formal rights embodied
CAR and to link the two basins; river channel improvement works from
in official titles, permits and seasonal irrigation schedules, less formal
Ouham River through Chari to Lake Chad; construction of a navigable
98
GIWA REGIONAL ASSESSMENT 43 LAKE CHAD BASIN
POLICY OPTIONS
99
canal to link Chari, Logone, and Benue rivers through the Mayo Kebbi
Box 4
Potential greenhouse gas emission reductions.
onward to Port Harcourt; improvement works on the existing river
The GIWA Assessment identified global climate change as a key factor in
determining rainfall patterns in the Sahel and thus the freshwater availability in
port at Garoua, taking into consideration the new river flow regimes;
the Lake Chad Basin. Below is a summary of the results from many sectoral studies,
largely at the project, national and regional level with some at the global levels,
improvement works to increase the Lake Chad storage capacity and
providing estimates of potential greenhouse gas emission reductions in the 2010
reduce evaporation losses; construction works of river port at Bouca
to 2020 timeframe. Some key findings are:
Hundreds of technologies and practices for end-use energy efficiency in buildings,
in CAR; identification of irrigable areas and agro-al ied industries
transport and manufacturing industries account for more than half of this potential.
for profitable uses of available water resources; and instal ation of a
At least up to 2020, energy supply and conversion will remain dominated by
relatively cheap and abundant fossil fuels. Natural gas, where transmission is
hydroelectric power plant at Palambo to supply Bangui and other
economically feasible, will play an important role in emission reduction together
with conversion efficiency improvement, and greater use of combined cycle
regional demands.
and/or co-generation plants.
Low-carbon energy supply systems can make an important contribution
through biomass from forestry and agricultural by-products, municipal and
Proponents suggest that by restoring Lake Chad, it will also al ow the
industrial waste to energy, dedicated biomass plantations, where suitable land
reinstatement of activities such as recession farming, fishing, and animal
and water are available, landfill methane, wind energy and hydropower, and
through the use and lifetime extension of nuclear power plants. After 2010,
husbandry in which the local population used to be engaged. It is also
emissions from fossil and/or biomass-fueled power plants could be reduced
substantially through pre- or post-combustion carbon removal and storage.
intended that it would facilitate communication among countries by
Environmental, safety, reliability and proliferation concerns may constrain the
use of some of these technologies.
al owing year round navigation. The water transfer project is envisaged
In agriculture, methane and nitrous oxide emissions can be reduced, such as those from
to deter environmental degradation, enhance environmental and
livestock enteric fermentation, rice paddies, nitrogen fertiliser use and animal wastes.
ecosystem equilibrium and reduce migration of people and conflict
Depending on application, emissions of fluorinated gases can be minimised
through process changes, improved recovery, recycling and containment, or
among settlers and environmental refugees (UNECA unpublished).
avoided through the use of alternative compounds and technologies.
However there has been no environmental or social assessment
(Source: IPCC 2001)
(including stakeholder analysis) of the negative impacts this could
therefore exist to control environment and water policy in Chad.
have on both the Lake Chad Basin and the Congo Basin. This option
The Chad-Cameroon Joint Commission was created to develop
remains firmly in a conceptual stage and there are many drawbacks
consultation on the water use in the Logone River between the two
in resorting to this option (see Identification of recommended policy
neighbouring states, but it is presently inactive. In Cameroon local
options for drawbacks) .
technical administrations and other institutions operate in the region,
which include the Hydrological Service. The SEMRY is a company for
Global change mitigation
agricultural development in Cameroon, which formerly specialised on
Global change was identified as playing a very important role in
rice but has diversified in recent years. The present project in the Chari-
determining freshwater shortage in the Lake Chad Basin. There are
Logone (SEMRY 3) is aimed at small irrigation schemes.
many policy options being discussed at the global forum that are aimed
at reducing the extent of anthropogenic climate change. The emission
IUCN Waza-Logone or CACID project
of greenhouse gases such as carbon dioxide has been identified as one
The IUCN Waza-Logone Project (WLP), which is also known as the `Cel ule
of the causes of global warming. Box 4 provides estimates of potential
D'Appui a la Conservation et aux de Initiatives Développement Durable'
greenhouse gas reductions in the 2010 to 2020 time frame.
(CACID), was started in 1987 with the support of the Government
of the Netherlands. Over three phases CACID did the following:
(i) gathered data and conducted studies in socio-economic, ecological
and hydrological issues; (ii) provided training for villages, and study
Chari-Logone/Lake Chad
tours and seminars for project and government staff; (iii) undertook
sub-system
ecomanagement activities regarding resource management for
livestock, sustainable forest use, formed apiculture groups, ecotourism
Political and organisational framework
and water and sanitation; (iv) encouraged community participation and
In CAR the Ministry of Transport and Civil Aviation (Department of
awareness through a communication programme; (v) catalysed pilot
Meteorology and Hydrology) is responsible for surface water, but
releases for floodplain rehabilitation through a large-scale reinundation
the Ministry of Mines and Energy also play a role in groundwater. The
programme; (vi) audited releases made in 1994 and 1997; (vi ) jointly with
Chad government formed in 1997 includes a Ministry of Environment
the communities drafted proposals for the sustainable use of floodplains'
and Water and a Master Plan was prepared in 2000 by the Ministry
natural resources; and (vi i) assisted in developing management plans for
of Planning and Co-operation regarding water resources. Institutes
the Waza and Kalamaloue National Parks (World Bank 2002a).
100
GIWA REGIONAL ASSESSMENT 43 LAKE CHAD BASIN
POLICY OPTIONS
101
Waza-Logone Pilot Project
Table 12 The incremental benefit of reinundation over current
Based upon recommendations from the Lake Chad Basin Commission's
situation.
Incremental
Net present
member countries and institutions involved, and guided by integrated
Reflooded
net benefit
value of
Benefit:
Additional
area in
ecosystems management principles and GEF objectives, the Waza-
of flooding
investment
Cost ratio of
flow (m3/s)
average
(million USD/
(million
investment
Logone Pilot Project aims to support the CACID project and its
year (km2)
year)
USD @ 10%)
partners by promoting the sustainable management and use of the
Maximum flood
215
867
2.32
7.76
6.57
release option
Basin's resources (water and biodiversity) by relevant institutions
Middle flood
165
687
1.78
7.19
6.13
and communities; and developing and implementing an effective
release option
Minimum flood
monitoring and evaluation system that looks at the overall ecosystem,
115
479
1.15
5.61
4.66
release option
hydrology and socio-economic issues (World Bank 2002a). The project
(Source: IUCN 2002)
has not been implemented and is still in a planning stage.
Options
Valuation studies conducted by IUCN (2002) on the economic impacts
Option 4a: Reinundation of the Waza-Logone floodplains
of the pilot flood releases in 1994 and 1997, calculated an added value of
(Proposed by the IUCN Waza-Logone Project)
800 000 USD per year through restoring floodplain goods and services.
They predict that by implementing the reinundation options currently
The high productivity of the Waza-Logone region depends to a
under consideration there wil be incremental economic benefit of
large extent on the overbank flooding of the Logone River between
between 1.1 million USD and 2.3 million USD per year over the current
September and December each year. Since 1979 the annual inundation
situation, translating into positive net present values of between
of the Waza-Logone floodplain has reduced significantly, due to a
5.6 million USD and 7.8 million USD when investment and operational
combination of climatic factors and the construction of the Maga
costs were taken into account (Table 12). On a per capita basis, this
Dam as part of the SEMRY project. The Project of Conservation and
equates to 50 USD added economic value per floodplain-dependent
development of the Waza-Logone has initiated studies to explore the
member of the population (IUCN 2003b). Non-monetary benefits and
effects of reinundation by control ed flood releases (IUCN 2002) that
development improvements could include poverty al eviation, food
led to two pilot flood releases in 1994 and 1997. The studies concluded
security, diversified production base, and future economic growth
that although reinundation could not re-establish the flooding patterns
with possible multiplier effects.
seen before the construction of SEMRY, the release of waters from the
Logone River and Lake Maga wil be able to contribute towards the
The studies also identified that there would be management and
rehabilitation of the region's hydrology, ecology and biodiversity and
opportunity costs and economic costs to other activities in the Waza-
consequently restore the economic activities that depend on the Waza-
Logone floodplain and give rise to a number of flood related economic
Logone floodplain (IUCN 2002).
costs. These will include: investment and recurrent costs of designing,
planning instal ing and maintaining the infrastructure required to
Reinundation could have many positive impacts on floodplain goods
reinundate the floodplain, and of monitoring its effects; costs of
and services (IUCN 1999b, Mott MacDonald 1999, Wessling et al. 1994
training staff to operate and monitor the reinundation programme;
in IUCN 2002). Increased flooding wil contribute to the restoration
programmes to mitigate any negative health and other socio-economic
of the floodplain fisheries including greater fish migration. It may
impacts of the reinundation programmes; loss of mil et, sorghum, and
also rehabilitate some of the dry season grassland and improve crop
gum Arabic harvesting areas to flooding; and crop damage resulting
agriculture including an increase in the area available for dry season
from increased populations of wildlife and birds.
mil et, cultivation around Lake Maga and the SEMRY scheme and
the return of flood-fed rice around the Logomatya, El Beid and Waza
According to the Pilot release studies when comparing the economic
National Park borders. A recovery of wildlife populations may also be
costs and benefits, al of the proposed flood release options would have
possible, through the restoration of grazing and watering areas in and
net economic benefits over the current situation of reduced flooding.
around Waza National Park, and an increase in fish and waterfowl
The flood release measures proposed by the project would cost
populations in the wider floodplain. Increased flooding wil assist in
between 2-8 billion CFA (franc de la Communauté Financičre Africaine)
the replenishment of surface water through increased storage and
to implement over a period of 5 years. The incremental benefits would
availability of water, especial y in dry seasons.
be 0.9-1.8 billion CFA per year or 2 million CFA/km2.
100
GIWA REGIONAL ASSESSMENT 43 LAKE CHAD BASIN
POLICY OPTIONS
101
The IUCN argue that the results of their valuation study present a
rationale, that to halt the degradation of waters and ecosystem of the
convincing argument for investment in flood release measures in the
Lake Chad Basin, it is essential to combat the degradation of soils and
Waza-Logone floodplain as a mechanism for rural poverty al eviation
vegetation cover, which is exacerbated by sand dune formation in areas
and sustainable livelihood development (IUCN 2003b).
either side of the Chad-Niger border.
Option 4b: Assessment of changing land use in the head waters
Reversing the degradation, tributary basins wil require efforts to promote
of the Chari-Logone sub-system
sustainable water management practices and to preserve biodiversity.
This project initiative is based on the concern of the CAR Ministry of
The chances of survival and reproduction of plant and animal species
Environment on the present rapid changes in land use in the north-
will be improved through sand dune fixation by biological means
northeastern part of the Central African Republic and its likely impact
(planting). Over the long-term, the regeneration of vegetation cover wil
on water resources downstream in the Lake Chad Basin (Scholte 2000).
promote carbon fixation. This wil assist in mitigating severe atmospheric
From an agricultural point of view, the changes in the northwest seem
disturbances resulting from the level of soil humidity, the roughness of
to be equal y pressing, an argument supported by the northwest's
terrain, and the composition of the atmosphere.
important hydrological functions. Given the low knowledge level
of both parts of the basin, these concerns have been considered as
The Environment Ministry in both Chad and Niger will be responsible
complimentary. It is therefore proposed that this project will be dealing
for monitoring sand dune fixation. The Lake Chad Basin Commission
with the entire CAR part of the Lake Chad basin. A comprehensive land
(LCBC), and the livestock extension and environmental services
use information system needs to be developed and disseminated.
agencies wil be closely involved in pastureland management and
There is also need for data rescue especial y from numerous studies
dissemination of information. Regional coordination wil be provided by
previously conducted on vegetation, wildlife, livestock agriculture and
the LCBC. An important task is to ensure the logical alignment between
fisheries in the area but scattered in different places. These studies
the implementation of the regional Action Program to Combat
would culminate in a detailed impact study of upstream activities on
Desertification (UNCCD 2003) and the execution of this project.
the water resources of the Chari-Logone sub-system.
Both the Chad and Niger Governments back the project. The
Option 5: Chad-Niger Transboundary Project to Combat Sand
traditional management systems that are predominant in the region
Dunes and Reverse Water Degradation Trends in Lake Chad
must participate in the planning and implementation process for the
The project has been proposed under the GEF project `Reversal of Land
long-term success and permanence of the project. The project aims
and Water Degradation Trends in the Lake Chad Basin Ecosystem'. It
to benefit groups that rely on the fertile "sinks" and ponds; users of
is planned that the intervention zone wil cover Di fa, N'Guigmi, and
the surrounding grazing lands; women engaged in farming and
Mainé-Soroa in Niger and Bol, Liwa and Rig-Rig in Chad.
algae production; residents of vil ages isolated by encroaching sand
dunes. The pastoralists must be consulted, but communications may
The overal objective of the project is to restore the ecosystems of
be difficult due to the migratory nature of their activities. Educational
the Lake Chad. The specific objectives are to develop a mechanism
programmes facilitated through local community groups would be a
for coordination of the management of shared resources; to create
useful tool in increasing awareness amongst these stakeholders.
greater synergy in implementing the Conventions on desertification
(UNCCD 1994), the Climate Change Convention and the Kyoto Protocol
(UNFCCC 1992, UNFCCC 1997), the Convention on Biodiversity (CBD
1992) and to improve living standards.
Komadugu-Yobe sub-system
The decline in rainfal which has caused a decline in the Lake Chad
Political and organisational framework
poses a serious threat to farming, pastoral, and fishing activities, at both
(extracted from Bdilya et al. 1999, updated).
the local and transboundry level, and is leading to the degradation of
the Lake's ecosystem, upstream and downstream. This project attempts
The Federal Ministry of Water Resources (FMWR) is the apex organ of the
to reverse the influence that soil and vegetation cover degradation has
government that has the statutory responsibility for policy formulation
had on the rainfall and temperature fluctuations in the region, which in
and coordination for water resources development and management
turn have influenced water flow patterns. This will be based upon the
throughout the Federation of Nigeria. The FMWR functions through the
102
GIWA REGIONAL ASSESSMENT 43 LAKE CHAD BASIN
POLICY OPTIONS
103
National Council on Water Resources (the highest policy body) and the
Komadugu-Yobe pilot project
National River Basin Development Coordinating Committee (NRBDCC).
Based upon recommendations from the Lake Chad Basin Commssion's
However, due to the dependence of other sectors of the economy on
member countries, and institutions involved, and guided by integrated
this critical resource, as wel as the three tier system of government which
ecosystems management principles and GEF objectives, the Komadugu-
Nigeria operates, several other statutory and non-statutory institutions
Yobe pilot project aims to support the HNWCP by promoting the
are active players in the management of water resources in the sub-
sustainable management and use of the Basin's resources (water and
system. These include the fol owing: the Federal Ministry of Environment
biodiversity) by relevant institutions and communities; and developing
(FME); the Hadejia-Jama'are River Basin Development Authority (HJRBDA)
and implementing an effective monitoring and evaluation system that
and the Chad Basin Development Authority (CBDA); the governments
looks at the overall ecosystem, hydrology and socio-economic issues
of Bauchi, Borno, Jigawa, Kano and Yobe States which have interests in
(World Bank 2002a).
the Basin; the North East Arid Zone Development Programme (NEAZDP);
Local Government Authorities; the IUCN Hadejia-Nguru Wetlands
The Komadugu-Yobe Integrated Management Project
Conservation Project (HNWCP) recently taken over by the Jigawa
The project "aims to create the institutional environment that al ows
Enhancement of Wetlands Livelihoods (JEWEL) project and several
participatory and informed decision-making [...] based on agreed
water-user associations, such as the Stakeholders Consultative Forum.
principles for equitable use and sustainable management of the
Komadugu-Yobe Basin" (IUCN 2003b). The project is part of the IUCN
Only two governmental institutions (FMWR and FME) and two non-
Water and Nature Initiative (WANI), which is a 5-year partnership for
government organisation (HNWCP-JEWEL and the Stakeholders
action to promote sustainable water use and management.
Consultative Forum) are concerned with the sustainable utilisation of the
water resources of the Komadugu-Yobe sub-system (Bdilya et al. 1999).
Options
Option 6: Grant subsidies to irrigation farmers in northern Nigeria
The Niger sector of the Komadugu-Yobe Basin is far from the capital
for implementing water conservation measures
Niamey and the government institutions involved consists of the
This option was formulated during the GIWA workshop hosted by the
Department of Hydraulics and Department of Agriculture. The Nigeria-
LCBC. However, water conservation has already been under discussion
Niger Joint Commission was established to resolve bilateral disputes.
within the LCBC and by donor organisations. In exchange, farmers
would dedicate water rights to water saved. This water could be allowed
The Federal Government of Nigeria has two legal instruments which,
to flow into the river systems so that there is greater water available for
when properly applied, can control the uncoordinated development of
downstream users.
water resources in the Basin. These are the Water Use Decree No. 101 of
August 1993, and the Environmental Impact Assessment Decree No. 86 of
The current water requirements from the Hadejia river system are already
1992. Although both decrees are already enforced the modalities are being
exceeding available resources during periods of lower precipitation. Any
finalised by their custodians. It is planned that a water management plan is
further expansion of the requirements of one use will deprive others of
to be implemented according to the provisions of the two decrees.
water. Potential water requirements are at least 2.6 times greater than
the mean available water resources. Annual available water resources
Hadejia-Nguru Wetlands Conservation Project (HNWCP)
are able to sustain the present water requirements in the Jama'are
The project was established in 1987 by the Federal Government of Nigeria,
and Yobe river systems. However, if construction is finished on the
the Nigerian Conservation Foundation, the World Conservation Union
Kafin Zaki Dam (Jama'are Val ey Irrigation Project), the potential water
(IUCN), and the Royal Society for the Protection of Birds (British NGO)
requirements for the Jama'are river system wil be 1.8 times the available
and the International Council for Bird Preservation (now renamed Birdlife
water resources in a mean year (Bdilya et al. 1999). Table 13 compares
International). Objectives of the project were (World Bank 2002a):
the available surface water resources with current and potential water
To explore appropriate use options for water resources for the
requirements in the Hadejia, Jama'are and Yobe river systems. Water
benefit of wildlife and human communities;
demand management therefore needs to be a priority in addressing
To monitor wildlife resources, especial y migrant water birds;
freshwater shortage.
To develop conservation education and public awareness
programme;
Increasing demands for water and the increasing costs of water supply
To train the staff in the State Wildlife Departments.
are giving rise to a need for countries to maximise the use of their
102
GIWA REGIONAL ASSESSMENT 43 LAKE CHAD BASIN
POLICY OPTIONS
103
Table 13 Relationship between water resources and both
Box 5
Water conservation techniques.
current and potential water requirements for the
Numerous techniques, modern and traditional, for improving the use, and
Hadejia, Jama'are and Yobe river systems.
augmenting the availability of water resources have been developed and
Present water
Potential water
implemented in different parts of the world that can be replicated within the
Available surface Mean river flow
requirements
requirements
Lake Chad Basin. The technological improvements to conserve water must be
River
water resources
reduction
suitable for the farmers; operation and maintenance must require minimum
system
(million m3/year)
(million m3/year)
technical skills and financial constraints must be considered. Commercial
(million m3/year) (million m3/year) Formal Informal Formal Informal
farmers in the sub-system have objectives usually aiming to maximise yield and
income, but the subsistence farmer is likely to be more interested in improving
536-2 567
food security by reducing crop failure, or improving the return on inputs of seed,
Hadejia
7981
8944
765
2 353
2 241
(mean 1 739)
fertiliser, and labour (Hudson 1995). Technologies must therefore be suited to
the local and specific conditions based on local resources, skills and knowledge
518-4 577
Jama'are
9192
0
1 620
1 388
2 635
(Batchelor et al. 1998).
(mean 2 194)
Technological methods that could be employed in the agricultural sector
381-2 551
Yobe
8553
58
246
111
504
for water conservation include: improved maintenance of existing irrigation
(mean 1 201)
systems; altered tillage and soil management; changes in cropping patterns (e.g.
Note: Part of the natural flow reduction is due to evaporation. The total surface water resources are
reduce hectares cropped, and switch from rice to less water intensive crops e.g.
the flows at the upstream ends of each river system. 1Wudil to Hadejia, Hadejia to Likori and Likori
sorghum). Structural methods include: lining of irrigation canals; replacing of
to Nguru. 2Foggo to Gashua. 3Gashua to Yau. 4144 million m3/year extra in 2002 when expansion
open canals with underground pipes; and the switching from gravity irrigation
of the Hadejia Valley Project has been completed.
to more efficient irrigation techniques such as drip or sprinkler irrigation
Formal requirements: evaporation and domestic water supply from reservoirs and irrigation.
Informal requirements: all other users (e.g. flood and small-scale agriculture and contribution to
systems.
Yobe River), these partly depend on natural flow reductions.
Rain water harvesting would also be another useful technique of storing water
(Source: Blidya et al. 1999, updated)
from the rainy season for later use during periods of low rainfall. Rainfall can
be collected either from rooftops or in situ. For freshwater augmentation
using rainwater harvesting from rooftops, there are three components to
existing water supplies and make use of hitherto unexploited freshwater
the rainwater harvesting system: the collection area, the conveyance system,
resources. Despite the freshwater shortage concerns that the people of
and the storage facility. The collection area is usually the individual rooftop
of a house or other building. Large communal catchments including hillsides
the Komadugu-Yobe Basin face, water is utilised extremely inefficiently.
may also be used. The conveyance system is a series of gutters that carry the
rainwater from the collection area to the cistern. The cistern or storage facility
For example, Isiorho et al. (2000) estimated that in the Maiduguri region
varies from steel and polyethylene tanks of various sizes to underground
concrete tanks. It could be a part of the home or constructed separately,
of Nigeria 10 to 25% of water is used inefficiently. However, there have
above or underground (IETC 2000). Rainfall harvesting in situ consists of using
topographic depressions, either natural or artificial, to store rainwater where it
been no studies that accurately quantify the level of water wasted in the
falls for future use. Construction of furrows and raised beds is a normal practice
sub-system. Agriculture is the largest user of water in the Komadugu-
in this technology.
Another form of water augmentation method is run-off collection using surface
Yobe Basin; in the Hadejia river system upstream of Hadejia, irrigated
and underground structures. There are two types of structures commonly used:
local impoundments and dams. Local impoundments are storage ponds dug
agriculture accounts for approximately two-thirds of the total water
into the ground, while dams are designed to increase the storage capacity of
requirements for agriculture, domestic, industrial and livestock use
areas of a river or stream by intercepting run-off and storing it for future use.
The extension of this technique is the artificial recharge of aquifers. There are
(Bdilya et al. 1999). These irrigation projects, particularly large-scale
several different artificial recharge techniques, ranging from infiltration basins
and canals, water traps, surface run-off drainage wells, to septic tank system
government schemes, are utilising water resources inefficiently.
effluent disposal wells, and the diversion of excess flows from irrigation canals
into sinkholes.
Irrigation channels are unlined and open resulting in infiltration and
evaporative losses. By implementing water conservation measures
less water will be needed to produce a unit of rice. Presently there are
no guidelines or incentives for the farmers to conserve water; farmers
channels in the Hadejia river system will need to be cleared of weeds
do not have to purchase the water and by saving water they do not
and silts on a regular basis to allow Hadejia River to contribute to the
achieve any personal gain. Education programmes and incentives
Yobe River.
may therefore be necessary to promote water conservation. Water
conservation strategies in northern Nigeria are discussed in a study by
A study on the efficiency of water uses by the large irrigation projects,
Dabi & Anderson (1999).
such as KRIP and Hadejia Val ey Project, and the applicability of
freshwater augmentation technologies would be required before
Water conservation is one of the most effective tools in demand
efficiency improvements could be implemented. An education
management and is often the cheapest policy action to increase water
programme and improved communication networks would promote
availability (Box 5). More efficient use of water in the Hadejia river system
the advantages of using more efficient water use techniques, provide
would al ow more water to reach the Hadejia-Nguru wetlands without
training in new techniques and help farmers to adapt from habitual
decreasing the productivity of large irrigation projects e.g. Kano River
methods. Local associations that represent the interests and needs of
Irrigation Project (KRIP). Greater flooding of the Hadejia-Nguru wetlands
the user communities should be utilised as a means to disseminate
will rejuvenate fishing, flood and recessional farming, grazing lands and
information and to promote appropriate technologies. However there
other wetland resources. In order for communities downstream of the
may be difficulties in encouraging the farmers to change and invest
Hadejia-Nguru wetlands to benefit from the increased water supply,
in more efficient methods, due to there being no purchase price
104
GIWA REGIONAL ASSESSMENT 43 LAKE CHAD BASIN
POLICY OPTIONS
105
for water and also due to financial constraints in a poverty stricken
construct dams, the safety of dams is important, as the project will rely
region. Incentives may therefore be needed (Dabi & Anderson 1999,
on the performance of existing dams. The project reviewed two dams
Gardner & Stern 2002).
in the Komadugu-Yobe Basin (Tiga and Chal awa Gorge) and the Maga
Dam in the Chari-Logone. The Maga and Tiga dams were considered a
A possible incentive could be to put a value on the quantity of water
threat to the safety of the populations below the dams (see Root causes,
that farmers save. Water that is saved can be purchased and then
Governance, Poor water use efficiency).
diverted to the river channels to real ocate the water to downstream
users. A regulatory body would be needed and meters instal ed to
The fol owing activities were recommended by the review for the
monitor water use. A source of funding for the subsidies would need
Tiga Dam (World Bank 2002a):
to be found, be it governmental or from donor agencies. However
Further lowering of reservoir level as a short-term non structural
a concern of providing incentives to save water is that farming may
measure, to minimise overtopping by floods;
become more attractive, and hence increase the number of farmers
Improved monitoring e.g. improved seepage monitoring;
and thus water requirements. Consequently, the net outcome on water
Instal ation of an Early Warning System, e.g. sirens in communities
demand is uncertain. Subsidies may also not be the most cost-effective
downstream;
technique for encouraging farmers to convert. An alternative economic
An Emergency Preparedness Plan (EPP). To include a dam-break
incentive for more efficient use could be to put a price on the water
analysis, flood propagation study, population awareness, and
used by irrigation farmers; the revenues col ected can then be used to
training;
help invest in more efficient technologies. In the economic situation
Reduction of the full storage level by additional excavation of the
of this region, particular attention needs to be paid to what price the
emergency spil way of the left bank.
farmers can afford and the impact of increased costs on domestic and
export markets.
The instal ation of a valve at the second outlet structure of Tiga Dam
is recommended to enable the dam to contribute to peak wet season
Although improved policies of the Nigerian government wil not
releases for flood farmers and to serve as back-up in case the other
result in the adoption of water efficient technologies, they can play an
outlet is out of order.
important role in encouraging the uptake of improved technologies
or methods as wel .
Some recommendations have been made by different studies within
the Basin, particularly in what concerns the Komadugu-Yobe Basin.
Option 7: Maintenance and improvements for safety and
A flow proportioning structure has been recommended for installation
improved efficiency of dams and stream flow in the Komadugu-
at Likori in the Hadejia-Nguru wetlands (Diyam Consultants 1996). The
Yobe Basin
structure is expected to distribute water between the Marma Channel,
Option 7 was formulated at the GIWA workshop, although the World
the Burum Gana River and the Old Hadejia River. The proposal is
Bank/GEF project, LCBC and others have discussed the issue of
considered to be the best option for conveying water from the Hadejia
maintenance and improvements that are needed in the Basin.
River to the Komadugu-Yobe River without any adverse impact on water
uses along the Marma Channel and the Burum Gana River.
Water resources management is the application of structural and non-
structural measures to control natural and man-made water resources
There has been proliferation of blockages from weeds and siltation in
systems for beneficial human and environmental purposes (Grigg 1996).
the Hadejia river system. The blockages in the Old Hadejia River have
The goal is to provide water in the quantity and quality required, when
prevented the Hadejia River from contributing to the Yobe River. These
it is needed, where it is needed, and with the appropriate level of
have not been cleared and have consequently continued to impede
reliability. In the Komadugu-Yobe dam infrastructure is not effectively
freshwater from reaching the main river channels. The water is instead
regulating the flow of water to achieve these goals. Currently the
restricted to the wetlands of the Hadejia-Nguru and does not reach
dams have been il -maintained and therefore to implement the water
downstream users. There needs to be a programme to clear these
al ocation agreement (Option 2) the dams need to be repaired so that
channels to improve flow rates.
flood releases can be undertaken effectively. The height of the Tiga Dam
has already been lowered, and the reservoir level accordingly, in 1992
due to structural instability. Although the GEF project does not plan to
104
GIWA REGIONAL ASSESSMENT 43 LAKE CHAD BASIN
POLICY OPTIONS
105
Identification of the
incentives to promote compliance. The implementation of water
recommended options
conservation measures would al ow water supplies that are available
in the Komadugu-Yobe sub-system to be used more efficiently and
The World Summit on Sustainable Development ( WSSD 2002) included a
would be an effective tool for long-term water demand management
special agreement related to Africa "Sustainable development for Africa".
as part of the wider al ocation of water in the Basin. Such a project
Paragraph 66 states "promote integrated water resources development
would support the SAP Long-term objective 3: "Players in the basin
and optimise the upstream and downstream benefits..." and to "develop
take responsibility for protecting common heritage" through "regional
and implement integrated river basin and watershed management
promotion of productive, water saving, economical y beneficial
strategies and plans for al major water bodies". In accordance with
techniques and practices that are accepted by local people and local
this agreement and the SAP, before projects considered by the GIWA
economic operators, and do not harm the environment" (LCBC 1998).
assessment can be implemented, there is a need to coordinate the
member States national plans and actions with each other at the Lake
Justification for not recommending
Chad basin level (see Root causes, Governance, Lack of coordination and
Option 3, 4b and 5
Institutional weakness). To achieve regional coordination a review of the
Option 4b and 5 were not selected as recommended options not
LCBC is needed and subsequent strengthening of its capacity. Therefore
because the GIWA Assessment recognised them as poor actions but
the GIWA Assessment recommends as a perquisite to all the proposed
because the selected options were more specific in addressing the
projects, the development and prioritisation of recommendations
root causes identified during causal chain analysis and it was therefore
made in the SAP and subsequently the implementation of the GEF
considered that these options should be prioritised.
project (Option 1).
Option 3, inter-basin water transfer, was not selected as a recommended
The two broad chal enges facing policy makers in the region were
option as it would require substantial investment and although it could
identified as: (i) to improve the al ocation of water; and (i ) how to
significantly increase freshwater availability such projects are associated
increase freshwater availability. The improvement of water al ocation
with high costs per unit of water. The effect that possible future climatic
wil require the implementation of Options 2, 4a and 7 that complement
scenarios could have on the current water developments, irrigation and
each other by facilitating the equitable distribution of available surface
the ecosystems of the Basin would need to be assessed. To undertake
and groundwater supplies. A water al ocation agreement enforced
such a project, large financial investment is required and the economic
and coordinated by a strengthened LCBC is necessary if integrated
viability of such a project in the Lake Chad Basin is undetermined. The
management of the Basin is to be achieved. Such an agreement will
systems involved in inter-basin transfer require high operation and
support the SAP Long-term objective 1: "Concerted management of
maintenance costs. There is usual y extensive networks of pipelines
international waters based regional cooperation and national objectives
and canals. Highly qualified engineers and technicians are required to
and national policies harmonised and applied in each sub-basin" by
plan, design and implement and operate inter-basin transfer schemes.
creating "new institutional mechanisms for cooperation" (LCBC 1998)
The technology employed has high capital and operational costs
(see recommendations from GEF project Strategic Action Plan). The
(IETC 2000). These costs could make this option unaffordable and
implementation of a water al ocation agreement wil address the
inappropriate for the people of the Lake Chad Basin.
root causes: (i) lack of coordination; (ii) legal - no water al ocation law;
and (iii) lack of capacity to promote compliance. The legal framework
There is some evidence now that river discharges are increasing in
that this wil provide wil al ow the implementation of Option 4a (the
the Lake Chad Basin, with an associated increase in the Lake Chad
reinundation of the Waza-Logone floodplains). Dam maintenance
and the regional floodplains. Presently there are no accurate models
and enhancement, and the improvement of stream flow (Option 7)
for predicting future precipitation rates in the region and although
wil al ow the effective implementation of Option 2 (water al ocation
some studies point to greater or similar levels of aridity, there is also
agreement) and Option 4a by allowing greater control and efficiency
the possibility that precipitation will increase and provide greater water
of water conveyance.
resources for the region.
The GIWA Assessment recommends Option 6 (water conservation) as
The livelihood strategies of the Lake Chad Basin's population have
a possible means of increasing freshwater availability and addressing
always been dependent on the intra and inter-annual fluctuations in
the root causes of: (i) poor water management; and (i ) the lack of
the water availability. The economic activities of the Basin have adapted
106
GIWA REGIONAL ASSESSMENT 43 LAKE CHAD BASIN
POLICY OPTIONS
107
to this dynamic environment. The question should be asked, whether
the Congo Basin for such a development to commence and there has
flooding the Lake Chad Basin would actual y al eviate poverty and
been little involvement from the countries of Democratic Republic of
promote economic development or be yet another large-scale water
Congo (DRC) and Congo Brazzavil e.
development which on the contrary derogates the rural livelihood
safety-net (Neiland & Béné 2003).
CAR, Cameroon, Congo, and DRC have formed a new regional
organisation cal ed Commission Internationale du Bassin du Congo-
Particular attention should be paid to the medium and long-term
Ubangi-Sangha (CICOS) at the 49th Session of the Council of Ministers of
consequences for the original biodiversity of the Lake Chad Basin with
the LCBC, 14-15 January 2002. This commission has been formed both to
the introduction of alien species into a fragile ecosystem, and the final
respond to the LCBC's plans for the transfer of water out of the Congo
quality of the water that results from the mixing of the waters of the
Basin as well as to respond to a hydroelectric dam-building project in
Lake Chad Basin and the Oubangui and the effect this will have on the
the region near Inga. International environmental organisations are also
ecosystems (Nami 2002). There are also often public health impacts
closely monitoring progress in the identification and design of the inter-
associated with water transfer canals that can serve as water-borne
basin transfer proposal.
disease vectors (IETC 2000).
Priority recommended option
At the UNESCO International Workshop on Inter-basin Water Transfer
Option 1: Implementation of the GEF project for the `Reversal
(UNESCO 1999), it was highlighted that "the recipient catchments need
of Land and Water Degradation Trends in the Lake Chad Basin
to demonstrate that available water is optimally used and reasonable
Ecosystem'.
water conservation measures enforced. On the other hand, the rights
of donor catchments need to be respected ...." (UNESCO 1999). There
Table 14 evaluates the option using criteria stipulated at the GIWA
has been no economic analysis or exploration of least-cost alternatives,
Workshop.
including demand management and solutions that utilise the surface
and groundwater resources already in the Lake Chad Basin. It is argued
Main reasons for selection
that more effective use and management of current water supplies
The project directly addresses the root cause of institutional weakness
should be investigated before resorting to such an option. So far, there
and the lack of coordination in the region by strengthening the capacity
has been no non-objection from some of the riparian countries with
of the LCBC. It also addresses secondly, the root causes of: lack of water
Table 14 Evaluation of priority recommended option, using criteria stipulated by GIWA regional experts.
Priority recommended policy option
Project option Legal & Institutional
Political feasibility
Administrative
Information intensity
Efficiency
Equity
Permanence
framework
(stakeholder analysis)
feasibility
Option 1:
National legislative and
Political will and
LCBC currently lacks
TDA will determine the
Benefits: Primarily
Greater coordination,
Consistent and committed
Implementation regulatory changes to
cooperation has been
capacity to solely
precise linkages between addresses the root causes
cooperation
effort by member
of the GEF
enhance transboundary
expressed by member
implement project.
environmental and
of institutional weakness
and stakeholder
states to the long-term
project
institutional
states.
PMU established to
social-economic systems. and lack of coordination but participation will ensure implementation of project.
"Reversal of
mechanisms.
Pilot projects will
implement project, in
LCBC will report to
also: Lack of water resource a more equitable use of
The project needs to work
Land and Water
bring water users at
cooperation with the
the World Bank and
environmental planning;
the water resources of
within existing regional
Degradation
the local level into the
LCBC. Only five pilot
ensure compliance
lack of stakeholder
the basin.
mechanisms to ensure
Trends in the
decision making process.
projects were selected with GEF project
participation; and the lack
the long-term capacity to
Lake Chad Basin
Consultations have
due to financial
design and contracts.
of capacity to promote
harmonise national policies
Ecosystem".
been undertaken with
feasibility and project
Environmental and social compliance and enforce
at regional level.
stakeholders.
realism.
assessments undertaken
agreements and policies.
However, what influence
Risk of member States
Project financed by
and an Environmental
The primary regional
would negative changes
not realising long-term
GEF and co-financing
Management Plan
benefit is a stronger LCBC
in economic and social
benefits of regional
organisations, as well
is being prepared.
for the decision making
conditions have on the
approach.
as member states
Designated bodies will
process at all levels.
long-term commitment to a
in kind.
undertake evaluation and
regional approach?
review procedures.
Costs: Total project cost
18.07 mil ion USD. Does
not include associated
infrastructure costs.
Technical staff recruitment
and training costs. Creation
of inter-ministerial
committees, and the PMU.
106
GIWA REGIONAL ASSESSMENT 43 LAKE CHAD BASIN
POLICY OPTIONS
107
resource environmental planning; lack of stakeholder participation; and
legislation frameworks to enhance prospects for an integrated regional
the lack of capacity to promote compliance and enforce agreements
approach for long-term, sustainable basin management.
and policies.
The long-term success of the GEF project depends on the political
The primary regional benefit of the project is a stronger LCBC for the
wil ingness of the LCBC member States, to continue project programmes
decision making process at the regional, national and local level. This
and approaches after the life of the GEF intervention, and the extent
should result in: (i) strengthened regional institutional capacity for
to which activities successful y engage end users at the community
coordinated decision making; (ii) local communities more empowered
level. The LCBC member States have few economic resources and have
in managing the Lake Chad resources; (i i) design of an effective
found it difficult to focus on long-term environmental imperatives.
mechanism to translate regional policies at the local level for managing
There is however a growing realisation by the countries that
the natural resources; and (iv) regional consensus and support for the
environmental sustainability is inextricably linked to the economic and
next phase of work voiced in the SAP (LCBC 1998).
social wel -being of the region. Consequently, they have increasingly
demonstrated their commitment to improving environmental
The LCBC will be stronger, as it will be able to build more commitment
management and have begun to realise the advantages of a regional
from members, more capacity to implement projects, and serve its
approach to environmental concerns. Subsequently, political will and
member States efficiently.
cooperation have been expressed for the GEF project and there has
been a high level of participation in the preparatory process. However
There wil be improved coordination and environmental planning,
LCBC member States may not realise the long-term benefits from a
as member governments wil have mechanisms in place with which
regional approach to water issues. To mitigate this risk, the role of LCBC
to harmonise their activities, wil be better prepared to attract donor
should be strengthened and paral el national-level water resource
support and investment fol owing the Project, and wil perceive the
management dialogue should continue.
benefits of a longer-term perspective. The finalisation of the LCBC SAP
with implementation methodologies validated on a regional level
Stakeholders wil further be encouraged to participate in the project
wil create an integrated strategy for environmental planning at the
through links to national institutions and the pilots wil bring users at
regional, national, and local level. Pilot demonstration projects will test
the local level into the decision making process. Efforts have already
and validate methodologies and implementation modalities before
been made to include the public during environmental planning,
implementing projects throughout the region and therefore reduce the
by disseminating a short version of the executive summary from the
risk of inappropriate project ideas being implemented (LCBC 1998).
environmental and social assessment report to LCBC member States
for publication in national and local media outlets in 2002. Stakeholders
There will be improved stakeholder involvement, as local communities
have also been visited by consultants hired to prepare initial technical
wil be more involved in decision making processes to manage the
demonstration reports, and the Environmental and Social Assessment
natural resources that they depend upon. The paral el design and
team.
implementation of the TDA, SAP and pilot projects wil stimulate
public participation.
Although the LCBC is the executing agency, given the current capacity
of the institution, it was decided to have the LCBC focus their capabilities
The TDA wil address the deficiencies in knowledge identified during
on the organisational review of roles and responsibilities, cross-project
the causal chain analysis in both the Chari-Logone and Lake Chad sub-
learning opportunities, and hosting TDA and SAP workshops. A Project
system and Komadugu-Yobe sub-system.
Management Unit (PMU) wil be established and wil be responsible
for contracting, fund management, procurement, disbursement,
Conditions for successful implementation
programme administration and project level monitoring. The LCBC will
Countries will have to make national legislative and regulatory changes
therefore participate in the project but will not carry the whole burden
to enhance transboundary institutional mechanisms. Changes will
for implementing the project. It is anticipated that by the end of the GEF
include new and updated national water policies in each country that
project in four years time, the capacity of the LCBC will be sufficient to
take into account transboundary water issues, encourage environmental
take sole responsibility for project implementation (LCBC 1998).
protection and are incorporated into National Action Plans (NAPs).
Recommendations wil be made regarding changes in existing relevant
108
GIWA REGIONAL ASSESSMENT 43 LAKE CHAD BASIN
POLICY OPTIONS
109
Only five pilot projects were selected due to financial feasibility and
Unresolved questions
project realism. GEF financing, in the amount of 10.1 mil ion USD, is
What level of donor support wil there be fol owing the GEF
required to remove barriers to regional management of the Basin,
project?
completion of a TDA, and subsequent development and negotiation
Will the PMU work in isolation from the LCBC?
of the SAP. There is also a total co-financing of 7.3 mil ion USD. There
Wil LCBC member States continue to realise the long-term benefits
is a risk that the pilot projects are not sufficiently supported in terms
from a regional approach to water issues?
of financing, implementation and technical support, and therefore
Wil LCBC work in isolation from local level and water resource
arrangements need to be made to work directly with local communities
initiatives in Lake Chad basin member countries?
to serve their needs as well as the interest of the Basin.
Wil key regional institutions and national governments work
cooperatively?
The risk of the PMU working independently of the LCBC should be
Will countries seek to develop alternative, bi-lateral approaches to
addressed through incentives to balance project implementation with
resolving existing and future potential disputes rather than taking
LCBC institutional capacity-building in the project implementation
a broader regional approach?
plan.
Wil suitable levels of cooperation be established and
maintained?
The third component of the project wil undertake a TDA to address
Will all stakeholders be willing to participate?
the insufficiencies in knowledge building upon and refining priorities
from previous efforts, such as the Diagnostic Analysis (Kindler et al.
Recommended options for enhancing water
1990), the Master Plan (LCBC 1992), the PDF-B project, and this GIWA
allocation mechanisms
Assessment. The TDA wil need to determine the precise linkages
Option 2: Water allocation agreement
between environmental and socio-economic systems and their
Option 4a: Reinundation of Waza-Logone floodplain
transboundary impacts.
Option 7: Dam maintainance and enhancement, and the
improvement of stream flow
LCBC will report to the World Bank and be responsible for ensuring that
all GEF-funded activities are carried out in compliance with the project
The above options compliment each other in achieving greater
design and contracts. Evaluation should rely on both quantitative and
equitable allocation of water resources. They address the transboundary
qualitative criteria using World Bank guidelines, with independent
water al ocation difficulties that have been experienced in the Lake
reviewers to ensure the correct conduct is adhered to.
Chad Basin. A prerequisite to addressing water al ocation, and achieving
integrated river basin management, is a suitable and effective legal
An Environmental Assessment has been undertaken and an Environmental
framework. It is therefore critical for a water al ocation agreement
Management Plan is in preparation. The Lake Chad GEF project has had
to be ratified amongst the LCBC member States (Option 2). Within
to comply with GEF Environmental Operational Policy (OP), which has
this framework it wil then be possible for the other options to be
prompted the designation of Lake Chad shoreline as a transboundary
implemented.
Ramsar site, and also initiated field visit assessments on dam safety issues.
Evaluation and review procedures wil be undertaken by the Project Task
To implement Option 4a (the reinundation of the Waza-Logone
Force (PTF), UNDP, Scientific and Technical Advisory Program (STAP) and
floodplains) it is necessary to set minimum flow rates for both the water
through the Project Implementation Review (PIR) of the GEF.
entering the wetland systems and of that flowing in the main channels
to the Lake Chad. The water al ocation agreement will stipulate these
The project needs to work within existing regional mechanisms in the
flow rates. Option 4a can also be replicated for the Hadejia-Nguru
Lake Chad Basin to ensure that in the long-term they have the capacity
wetlands.
and constituency to coordinate and harmonise national policies at the
regional level. There has been consistent and committed effort from the
The implementation of Option 7 wil be necessary to ensure the
LCBC headquarters and member States, which suggests a long-term
effective distribution of the water resources. Dam maintenance and
commitment to implementing the project. The ability of the countries,
enhancement, and the clearance of river channels will al ow improved
with GEF assistance, to solicit enhanced donor support will be crucial
water conveyance and control, to ensure the adherence to minimum
to the permanence of project efforts.
flows stipulated by the water al ocation agreement.
108
GIWA REGIONAL ASSESSMENT 43 LAKE CHAD BASIN
POLICY OPTIONS
109
Table 15 Evaluation of recommended options to improve the allocation of freshwater, using criteria stipulated by GIWA regional experts.
Policy options to improve freshwater allocation
Project option Legal & institutional
Political feasibility
Administrative
Information intensity
Efficiency
Equity
Permanence
framework
(stakeholder analysis)
feasibility
Option 2:
A water al ocation
There may be difficulties
Dam maintenance and An analysis of the water
Benefits: Increased water
Increased water supplies Minimum flows can be
Water al ocation agreement will provide
in achieving an equitable
enhancement, and the requirements of all
availability for downstream for downstream users.
maintained in dry years.
agreement
a legal framework. There agreement due to political clearance of channels
stakeholders. A study to
users and ecosystems.
Although traditional
In wet years, water is stored
are currently no water
pressures. Political y
to ensure flow rates
calculate the appropriate Maintain the extent of the
management systems
in reservoir as fall back for
regulation authorities in stronger nations may insist that are stipulated
minimum flow rates. An
Lake Chad during times of
may still restrict access
drier years. If freshwater
the river basins.
that their water demands
by the agreement
accurate model to predict low precipitation.
to water resources for
shortage continues to
A strengthened
are met. Water Authorities can be technical y
the ecological and social
Costs: Decreases in
the poor.
increase in severity upstream
LCBC could serve as a
and irrigation projects may implemented.
impacts. Stream flow
water for upstream
states may not comply with
regulatory body.
not cooperate, as they will
monitoring network.
users including the large
the agreement.
lose out on water resource
An analysis of existing
irrigation projects.
rights.
information and
educational systems.
Option 4a:
A legal mechanism
Objections from remaining Maga Dam is presently IUCN Pilot releases have
Benefits: Includes the
Will give greater
Minimum flows can be
Reinundation of for the equitable
SEMRY irrigation farmers,
in poor condition
demonstrated benefits
restoration of fisheries, dry water al ocation to
maintained in drier years.
Waza-Logone
management of water
although the project is
and maintenance is
and there is information
season pasture, recovery
the communities of
In wet years, water is stored
floodplains
between riparian
operating on a smal er
required. There are
available on the economic of wildlife populations,
the Waza-Logone
in reservoir as fall back for
countries is needed.
scale now.
presently difficulties
benefits provided.
replenishment of surface
floodplains.
dryer years.
A regulatory
in effectively releasing Flow rate-monitoring
water in Waza-Logone
organisation is needed to
floods due to poor
network, to ensure
floodplain.
manage flood releases.
upkeep of the flood
equitable al ocation
Costs: Investment and
release outlet.
between Waza-Logone
recurrent costs, training.
General y a low cost
floodplains, and
Loss of mil et and sorghum
option.
discharges to the Lake
production. Crop damage
Design and instal ation Chad.
from increased wildlife.
of flow proportioning
mechanism is required.
Table 15 uses criteria to rate the performance and feasibility of Option 2
to be resolved by the rule of law rather than through conflict where
and 4a. Option 7 supplements these policies and is a requirement for
users are confused as to who has the right to the water resources (see
the implementation of Option 2 and 4a; it has therefore not been
Root causes, Demographic).
subject to evaluation under the performance criteria.
Water al ocation wil quantify and designate water resources through
Option 2: Water allocation agreement
a negotiated process involving consultations between claimants/
Main reasons for selection
stakeholders, rather than unilateral decisions that have been associated
Integrated river basin management requires a suitable and effective
with previous water management in the Basin (see Root causes,
legal framework to achieve its required goals. There needs to be an
Governance, Lack of water resource environmental planning). The
agreement between the member States to share responsibility for the
sequencing of legal reforms may be best engaged at the LCBC Heads
management and al ocation of surface and groundwater resources.
of State and Council of Ministers.
The agreement wil form the basis for integrated river basin
Within a legal framework it will be possible for Option 4a and 7 to be
management that wil al ow increased coordination between water
implemented.
users (see Root causes, Governance, Lack of coordination).
A regulatory body wil improve the coordination and cooperation
The water al ocation agreement wil fil the current legislative gap in
between member States, water users and other relevant organisations
both the Komadugu-Yobe and Chari-Logone/Lake Chad sub-systems
(see Root causes, Governance, Lack of coordination).
(see Root causes, Legal).
Conditions for successful implementation
The increases in population in the conventional basin will increase the
Studies wil be required to establish recommended minimum flow
water requirements of the region, and it wil be necessary for water
rates for surface and groundwater at strategic positions in the river
resources to be equitably shared if the population is to be able to subsist
basins to ensure the equitable distribution of water resources. The
(LCBC 2000b). A legal framework for water al ocation will al ow disputes
development of groundwater data management tools and surface-
110
GIWA REGIONAL ASSESSMENT 43 LAKE CHAD BASIN
POLICY OPTIONS
111
groundwater interaction modelling (studies that are being initiated by
The agreement should apply to the abstraction, diversion or other
the World Bank/GEF project) will be required to accurately monitor and
utilisation of surface waters but also groundwater as wel . Applicable
predict the impacts of a proposed water al ocation agreement.
minimum rates for groundwater levels and stream flow should be
determined. A network of monitoring points will be required to ensure
For an equitable and effective water al ocation, stakeholders must
that these minimum rates are maintained.
be involved through consultations so that the water requirements
of the various water users can be identified. If the stakeholders are
A comprehensive analysis of the water requirements of all stakeholders
not included during the planning and implementation of the water
in the Lake Chad Basin is required before an al ocation process can
al ocation agreement, there wil be a high level of non-compliance.
begin. There should also be an accurate model to predict the ecological
Consultations should involve al water users ranging from traditional
and social impacts resulting from alterations in the hydrological cycle
fishing communities to large irrigation projects. Farmers and their
by the implementation of an al ocation agreement. This model should
representative organisations should be involved in the formulation
build upon existing models, such as the flow model management tool
of policy (UNCED 1992). An effective dissemination of information to
already existing for the Komadugu-Yobe Basin (Hollis et al. 1993), and
disadvantaged groups can help to maintain their rights and thus bring
apply remote sensing and GIS technologies. The member States must
about equality. To improve public awareness educational systems need
agree to forward to the LCBC, on a regular basis, available data on the
to be strengthened through supporting local networks and developing
condition of the watercourse.
education and information programmes (Gardner & Stern 2002).
The agreement should be flexible in that the "minimum" and "safe
Furthermore, the institutions through which water rights are negotiated
maximum" rates may be altered by the LCBC should changes in
and renegotiated have a critical influence on the possibility of
climatic conditions trigger river or lake fluctuations that fal below
generating equitable and efficient solutions to conflict, or increasing
the "safety level" (see Root causes, Climate change). In other words, it
confusion, rigidity, inefficiency and inequity. Traditional management
should prescribe rates for different climatic scenarios of wet, average
systems are predominant in the Basin and access to water is general y
and dry years.
control ed by vil age leaders rather than modern systems (Neiland &
Bene 2003). For an al ocation law to be effective, it is essential that
A water regulatory body is required to enforce the agreement. It is
these management systems are included during planning and
important that it is independent and is not associated with a water user
implementation. Educational programmes and improved information
group/sector (see Root causes, Governance, Institutional weakness). A
dissemination could improve the involvement of these stakeholders.
strengthened LCBC could be best suited for this task. Equitable access
The utilisation of existing community groups could assist in raising the
to water resources wil only be achieved through a participatory and
awareness in traditional communities.
transparent management including support of effective water users
associations and involvement of marginalised groups (UNEP 2003) such
For the effective implementation of the water al ocation agreement
as traditional farming and fishing communities of the Waza-Logone
where integrated basin management is achieved it is essential to
floodplains. The agreement should support and enhance the legal
"encourage knowledge generation and transfer through research,
capacity of vulnerable groups with regard to access and use of the
extension, education and communications" (WEHAB 2002). National
water resources (UNCED 1992).
policies can be designed to facilitate the establishment of function
linkages between these desirables (WEHAB 2002).
Dam maintenance and enhancement, and the regular clearance of river
channels (Option 7) wil al ow the effective implementation of water
There must be an extensive process of consultations between member
al ocation by al owing control ed flood releases from dam infrastructure
States and stakeholders where water al ocation is agreed based on
and by improving stream flow by clearing river channels and installing
scientific studies on surface and groundwater and the interactions
appropriate flow proportioning structures.
between them. Member States must be willing to make concessions in
order to achieve an equitable al ocation agreement, as some riparian
Unresolved questions
countries wil undoubtedly have to concede water to other member
There may be political difficulties in accomplishing a workable
States.
agreement that achieves equitable water utilisation, as the upstream
countries wil be under political pressure to retain adequate water
110
GIWA REGIONAL ASSESSMENT 43 LAKE CHAD BASIN
POLICY OPTIONS
111
to meet the demands of their people. The wil ingness of upstream
By restoring the floodplains, the Chad and Cameroon government
member States to concede water rights to downstream users is
policies of: (i) poverty reduction and increasing economic growth and
undetermined. In Nigeria there are further irrigation developments
food sufficiency; and (i ) wildlife conservation through the creation of
planned in the upstream states and water requirements will continue
national parks, can both benefit. The floodplain economic activities will
to increase.
be restored and national parks rehabilitated and in the long-term the
enhancement of the national parks could also lead to greater tourism
The permanence of the agreement will depend on the willingness of
(IUCN 2003b).
the member States to abide by the abstraction rates stipulated, when
demand wil be increasing as a result of population growth. This is
Conditions for successful implementation
why it has to be a negotiated process involving al the parties from
A legal mechanism for the equitable al ocation of water between Chad
the onset.
and Cameroon, or for the entire conventional basin (see Option 2) is
necessary so that a multi-lateral allocation is achieved. Flood releases
How will the River Basin Development Authorities in Nigeria react
from Maga Dam should also be used to feed the Logone River channel
to a water al ocation agreement that will limit the amount of water
to ensure the regulation of stream flows below the Waza-Logone
that can be stored in the reservoirs and used for irrigation?
floodplain so that the benefits from flood releases are also experienced
How will the issues of insufficient oulet capacity of Tiga and Maga
by downstream and Lake Chad water users.
dams impact on the objective of flow redistribution in the Basin?
If an agreement is ratified, will member states comply if freshwater
A regulatory body would be required to monitor stream flow and
availability decreases again in future years? (The draft Agreement
regulate flood releases. It should be independent from a water user
already makes provision for reviews of set minimum flow rates and
group so that flood releases are not biased to a particular sector (see
maximum abstraction rates as and when necessary).
Root causes, Governance, Institutional weakness).
How will natural and human systems respond to changes in water
distribution?
Stakeholders such as the SEMRY project, Waza-Logone floodplain
communities and Lake Maga fishing communities must be included
Option 4a: Reinundation of Waza-Logone Floodplain
during planning and the implementation of flood releases (see Root
Main reasons for selection
causes, Governance, Lack of stakeholder participation). Community
Increased flooding wil restore some of the environmental goods
awareness raising programmes and meetings are possible methods to
and services that were lost/reduced after the construction of the
ensure stakeholder participation. The traditional management systems
Maga Dam (see Root causes, Economic, Inadequate valuation of
must be taken into account and kept ful y informed of flood releases
environmental goods and services). Reinundation wil contribute to
and the impact that this wil have on their activities. Communication
the restoration of the floodplain fisheries, rehabilitate some of the dry
networks with the rural communities may need to be improved in order
season grassland and improve crop agriculture and the return of flood-
to effectively communicate the project (see Root causes, Knowledge,
fed rice production. Wildlife populations may also recover, through the
Public awareness and Information sharing). This could be achieved
restoration of grazing and watering areas in and around Waza National
through the IUCN Waza-Logone project, as they have experience in
Park, and an increase in fish and waterfowl populations in the wider
working with the local communities.
floodplain.
A network of flow rate monitoring points is required to ensure flood
IUCN predicted that by implementing the reinundation options
releases are reaching the intended areas of the floodplain and that
currently under consideration there wil be incremental economic
downstream water users are also receiving adequate water supplies
benefit of between 1.1 mil ion USD and 2.3 mil ion USD per year over
(see Root causes, Knowledge, Insufficient knowledge of water resources
the current situation (IUCN 2003b).
and the functioning of aquatic ecosystems). In accordance with the SAP
(LCBC 1998) priority must be given to the fol owing three uses of water
According to the IUCN studies the proposed reinundation options are
resources: (i) inflow to the northern and southern pools of the Lake
robust in the face of possible future changes in climate, flooding, and
Basin; (i ) maintenance of the annual flood on the Chari-Logone and
resource use conditions (see Root causes, Climate change).
Hadejia-Nguru wetlands; and (iii) consideration for the supply of water
to big riparian cities and large irrigation areas where there has been
112
GIWA REGIONAL ASSESSMENT 43 LAKE CHAD BASIN
POLICY OPTIONS
113
considerable investment and which ensure a minimum guaranteed
Waza-Logone floodplains (Option 4a) the dams need to be repaired so
production. There is equal y a need to prioritise water uses to apply to
that flood releases can be undertaken effectively.
the al ocation of water resources when there is shortfall in supply.
Dams are currently unsafe and are threatening thousands of people
down stream, particularly the Tiga Dam. Flow proportioning structures
There needs to be studies on the impacts on the Maga Reservoir for
at Likori wil convey water from the Hadejia River to the Komadugu-
each flood release option, such as shoreline erosion. Dam maintenance
Yobe River without any adverse impact on water uses along the Marma
and enhancement, (Option 7) will ensure that the flood releases from
Channel and the Burum Gana River.
the Maga Dam are control ed safely and according to stipulated flow
rates.
The clearing of weeds and silts from river channels wil improve flow
rates and thus al ow improved water distribution. This will assist in the
There also needs to be investigations on the impact of increased
implementation of Option 2 and 4a. These measures wil address the
flooding on terrestrial wildlife communities in the downstream
root cause of poor water efficiency management in the Komadugu-
floodplains. The SEMRY project has been recognised as a failure and
Yobe Basin identified in the Causal chain analysis.
has diversified including a new irrigation project, SEMRY 3, which has
an emphasis on smal er-scale irrigation rather than large irrigation areas
Conditions for successful implementation
associated with the previous SEMRY projects. The SEMRY 3 needs to
A legal water al ocation agreement, based upon scientific predictive
be ful y incorporated with the flood release scheme and its farmers
model ing of environmental responses to different water al ocation
considered during planning. Many of the original SEMRY farmers have
scenarios, should stipulate minimum flow rates. The flow proportioning
diversified, with many fishing in the Lake Maga, the impact of reduced
structures can then be positioned and calibrated to these rates.
lake levels on these reservoir fisheries needs to be taken into account.
Al stakeholders must be kept informed of the new flooding regime
Channels should be dry during several months of the year, a pattern
so that they can adapt if necessary to the modified environmental
similar to pre-dam period, to help control the invasion of Typha. Its
conditions.
growth is limited by a prolonged dry soil, as is occurring natural y in
the Jama'are River Basin.
Communication networks within rural communities should be improved
to effectively implement the project. This could be achieved through
To ensure stakeholder involvement there should be consultations with
the IUCN Waza-Logone or CACID project, as they have experience in
local fishermen who use the river channels. The clearance of weeds and
working with the local communities. The flood release outlet needs
silts may affect their activities.
maintenance, so that effective and control ed flood releases can be
implemented (see Option 7).
Improved monitoring of dam safety, in accordance with
recommendations made by GEF review, requires the fol owing
Unresolved questions
elements: upgrading instrumentation system; training local staff;
What wil the impacts be on the Maga Reservoir for each of the
local staff for surveil ance; quality control; and independent review on
flood release options such as shoreline erosion and the fisheries?
annual basis. Essential records that should be kept are: daily readings
What impacts from increased flooding will there be on terrestrial
of reservoir water levels; weekly readings of seepage flows; monthly
wildlife communities in the downstream floodplains?
readings of piezometer and wel s; annual level survey of crest of dam;
Who wil finance the flood releases, the associated management
and inspection of vulnerable areas.
and opportunity costs, and economic costs to other activities?
The Hadejia-Jama'are River Basin Authority needs to cooperate to the
Option 7: Maintenance and improvements for safety and
ful est extent with the civil authorities in the preparation of an Early
improved efficiency of dams and stream flow in the Komadugu-
Warning system. A pre-feasibility study for the further reduction of the
Yobe Basin:
full storage capacity of the Tiga Dam is required.
Main reasons for selection
Unresolved questions
Currently the dams have been il -maintained and therefore to implement
What maintenance and enhancement is required to ensure the
the water al ocation agreement (Option 2) and the reinundation of the
effective implementation of Option 2 and 4a? Technical studies
112
GIWA REGIONAL ASSESSMENT 43 LAKE CHAD BASIN
POLICY OPTIONS
113
on all dam and water infrastructure should be undertaken to set a
developed and implemented in different parts of the world that can be
work plan for maintenance and enhancement.
replicated within the Basin. These can be tailored to suite the particular
What environmental and social impacts wil there be from dam
local and regional budgetary, technical and workforce skill constraints
maintenance and stream flow improvements?
found in the Komadugu-Yobe Basin.
Who will fund the instal ation of additional oulet structures on the
Tiga Dam so that more releases can be effected from the dam?
More efficient use of water in the Hadejia river system would al ow
more water to reach the Hadejia-Nguru wetlands without decreasing
Recommended option for increasing freshwater
the productivity of large irrigation projects e.g. Kano River Irrigation
availability and/or reducing water demand
Project (KRIP). Greater flooding of the Hadejia-Nguru wetlands will
Option 6: Grant subsidies to irrigation farmers in northern Nigeria
rejuvenate fishing, flood and recessional farming, grazing lands and
for implementing water conservation measures
other wetland resources.
Main reasons for selection
Conditions for successful implementation
Increasing demands for water and the increasing costs of providing water
A fundamental requirement for implementing water conservation
for the sub-systems population wil result in the need for authorities to
measures is the involvement of stakeholders, namely the farmers
maximise the use of their existing water supplies. Despite the freshwater
and other water resources users. Incentives wil be a useful tool in
shortage concern, water continues to be utilised extremely inefficiently.
promoting compliance with water conservation schemes. Traditional
The ever-increasing populations in the Komadugu-Yobe Basin will
management systems that are predominant in the region need to be
continue to stretch available water supplies and there is little that can be
taken into account, and it is therefore critical that vil age leaders etc. are
done to change climate patterns in the region; therefore the population
kept ful y informed and involved in the project.
of the Komadugu-Yobe sub-system need to utilise available water
resources efficiently. By implementing water conservation measures the
Although water conservation wil not provide a `quick fix' answer to
poor water management that is currently employing inefficient practices
freshwater shortage due to the time it wil take to change attitudes
such as the unlined and open irrigation canals, which were identified
and habits (Eagly & Chaiken 1993), it wil contribute to a long-term
during the causal chain analysis, wil be addressed.
solution to the concern and wil be particularly applicable during future
periods of low rainfal . Changing attitudes and habits wil be critical
Subsidies wil address the current absence of economic incentives
for the successful implementation of this project. Strategies on how
for farmers to conserve water resources. An incentive wil encourage
to change attitudes and behaviour are further discussed by Gardner &
farmers to learn about and take up the water conservation measures, as
Stern (2002). The current lack of public awareness, identified during the
they wil receive a personal gain. An alternative incentive could be to put
causal chain analysis, about conservation measures and the advantages
a price on water resources to encourage the efficient use of water and
of employing such methods needs to be addressed. The communities
reinvest revenues in water efficient technologies. This would be a more
need to be empowered, "including through capacity building, to
cost efficient policy action than subsidies (see Root causes, Economic,
implement projects and programmes to enable smal farmers to take up
Lack of incentives promoting environmental y sound practices).
improved technologies" (WEHAB 2002). The promotion of information
exchange, networking and technology generation and dissemination
The Lake Chad Basin is essential y one of the poorest regions in the
related to best practices of agriculture (WEHAB 2002) can strengthen
world. Freshwater augmentation technologies will al ow individuals to
the farmer's role in applying water conservation measures. Education
become self-sufficient in freshwater rather than relying on upstream
programmes facilitated by local community groups such as farmer
water developments releasing enough water for downstream users to
organisations could help to increase the awareness and benefits of
meet their requirements. Rainwater harvesting wil al ow the storage
water conservation measures, and trigger farmer to farmer exchange
of water from periods of abundant rain for use during dry periods,
of water saving practices (WSSD 2002) and hence improve the level
thereby reducing the vulnerability of the poor to climatic variability
of participation and cooperation of local farmers with the project.
(Dabi & Anderson 1999) (see Root causes, Climate change).
Farmer organisations should be supported through cooperation with
international and national research centres in developing location-
Numerous techniques, modern and traditional, for improving the
specific water conservation measures (UNCED 1992). The Nigeria and
use, and augmenting the availability of water resources have been
Niger Governments, multilateral and bilateral development agencies
114
GIWA REGIONAL ASSESSMENT 43 LAKE CHAD BASIN
POLICY OPTIONS
115
and NGOs such as the Hadejia-Nguru Wetlands Conservation Project
and extend to smal -scale farmers in the Basin? If external donors
(HNWCP), the Jigawa Enhancement of Wetlands Livelihood (JEWEL)
intervene with respect to smal -scale farmers, would they also
Project, the North East Arid Zone Development Programme (NEAZDP)
consent to subsidising the large-scale schemes belonging to
and the IUCN-BRAO Initiative on "Improving Land and Water Resources
government agencies, particularly in view of the perceived poor
Management in the Komadugu-Yobe Basin", should col aborate with
regime of cost recovery presently practised on such schemes?
farming organisations in formulating a water conservation project
If donor funds are used, who would implement the project and
specific to the Komadugu-Yobe Basin.
distribute funds?
Will the governments also benefit from donor support?
Investigations are needed to identify what appropriate technologies
In what form should the subsidies be provided; monetary,
wil be required to meet local conditions and constraints. This can
agricultural inputs (agro-chemicals, technologies etc.), inter-sectoral
be implemented through consultations with farmers and through
income transfers from other water users to agriculture, or other?
evaluating technologies employed in other drought prone river basins.
If pricing is used as an incentive, what impact wil this have on
There is limited public sector finance available for sustainable agriculture.
domestic and export markets, and how much will the farmers be
Therefore the provision of appropriate technical and financial assistance
able to afford?
and the promotion of private sector investment and support efforts
How will subsidies be al ocated and how much water needs to be
in the Komadugu-Yobe Basin are necessary to strengthen agricultural
saved to justify `x' amount of subsidy?
research in water conservation and the dissemination of the results from
How much capital for subsidies wil be required to ensure a high
this research (WSSD 2002).
level of participation by farmers?
Wil subsidies have to remain in place for farmers to continue to
There needs to be instal ation of a monitoring system to quantify water
employ water conservation measures, or will farmers change their
saved, to al ow the effective payment of subsidies to farmers and for
habits and attitudes in the long-term?
evaluation purposes. Maintenance and improvements to the efficiency
An analysis of Option 6 would be required to compare the cost
of stream flow in the Komadugu-Yobe Basin will be required to ensure
efficiency with other freshwater availability increasing measures.
that water that is saved will be able to reach downstream communities
Water conservation wil not increase freshwater availability to total y
(see Option 7).
meet potential water requirements and it needs to be identified
how much water can be potential y saved by implementing water
Unresolved questions
conservation measures and at what cost.
Should subsidies or water pricing be used as the incentive for
What probable changes in agricultural cropping choices will there
farmers to convert to more water efficient practices? How effective
be to obtain lower water consuming crops? What consequences
would each incentive be?
will this have on domestic and export markets? Will the more water
Where would the funding for the subsidies come from? Would the
efficient crops be marketable? If the crops are not marketable, what
governments of countries of the Lake Chad Basin fund the scheme
impact will this have on the permanence of the project?
or would external donors be needed? If it is the governments,
Table 16 uses criteria to rate the performance and feasibility of
would they initiate the policy from their own large-scale schemes
Option 6.
Table 16 Evaluation of recommended option to increase freshwater availability using criteria stipulated by GIWA regional experts.
Policy option to increase freshwater availability
Project option Legal & Institutional
Political feasibility
Administrative
Information intensity
Efficiency
Equity
Permanence
framework
(stakeholder analysis)
feasibility
Option 6:
Minimal legislation
Possible difficulties in
Capital required to
Feasibility study of water Benefits: Decrease water
Increased water supplies Will subsidies have to remain
Water
needed as it would be
farmers complying as
purchase saved water. conservation techniques.
demand by irrigation
for downstream users.
in place for the continued
conservation
voluntary participation.
water is presently free,
Technology must
Monitoring system to
scheme whilst not reducing Downstream
efficient use of water?
Regulatory body needed and there may be an
take into account low
quantify water saving.
yields.
communities will be less However, once technology is
to monitor water use
unwil ingness to change
budgets and minimal
Educational programmes Relatively low cost.
reliant on stream flow if in place e.g. drip irrigation,
and oversee subsidy
habits. Subsidies may
technical skil s.
for increasing the
Costs: Will not be sufficient they employ freshwater greater efficiency will
al ocation. Might
therefore be needed.
knowledge and
enough to solve future
augmentation
continue.
require a new mandate
awareness of water
imbalance between water
technologies.
What effect will changes in
for the River Water
issues.
availability and potential
agricultural cropping choices
Development Authorities
water requirements.
have? What consequences
so that they enforce
How much capital will be
will there be on domestic and
methods.
required for farmers to
export markets?
continue to comply?
114
GIWA REGIONAL ASSESSMENT 43 LAKE CHAD BASIN
POLICY OPTIONS
115
Conclusions and recommendations
The GIWA Assessment of the Lake Chad Basin aimed to identify
identified as one hotspot and the Komadugu-Yobe sub-system as another
priorities for remedial and mitigatory actions. The report investigates
where there had been severe impacts from stream flow modification. In
the ecological status, the causes of their degradation and the policy
the Chari-Logone/Lake Chad sub-system the immediate causes of stream
options available to improve their status. The Assessment focused on
flow modification were the significant decreases in precipitation in the
the five major problem areas of: Freshwater shortage, Global change,
catchment and the increased diversion caused by the construction of the
Habitat and community modification, Unsustainable exploitation of fish
Maga Dam in 1979 as part of the SEMRY irrigation project.
and other living resources, and Pollution.
The root causes behind the stream flow modification witnessed in the
The GIWA Assessment ranked Freshwater shortage as severe and
region were identified to serve as a foundation for the selection of policy
it was considered the priority concern in the Lake Chad Basin. All
options. In the Chari-Logone and Lake Chad region the demographic
the other concerns except for Pol ution (rated as slight) were rated
pressures from rapid population growth and environmental refugees
as having a moderate impact. Although there has been significant
escaping drought in the northern regions of the Basin and from fishermen
modification of habitats and significant fluctuations in fish production,
migrating following the receding lake waters have concentrated the
these were primarily a function of freshwater shortage, rather than
pressure on water resources in this region. The poverty in the region
as a consequence of direct habitat modification or unsustainable
and reliance of the population on flooding and the lake resources made
exploitation of fish. Stream flow modification as a result of decreased
the population particularly vulnerable to the environmental changes.
rainfal events and upstream dam impoundments primarily in the
The planners of the SEMRY project did not take sufficient account of
Chari-Logone and Komadugu-Yobe river systems, have impacted on
the impacts of stream flow modification from the Maga Dam, on the
the habitats downstream. Wetlands have been the most affected as
downstream populations and the ecosystems that support them.
a result of changes in the timing and extent of seasonal flooding. For
Planners also did not take into account the value of the environmental
example the surface area of Hadejia-Nguru wetlands, located in the
goods and services provided by the Waza-Logone floodplains. The
Komadugu-Yobe sub-system, at one time covered nearly 300 000 ha,
inundated area of the Waza-Logone floodplain was reduced by almost
today, these wetlands have shrank to an estimated 70 000-90 000 ha
30%, incurring annual economic costs to the local economy of more
(Barbier et al. 1997). The reduction in the stream flow has also caused
than 2 million USD (IUCN 2002). Stakeholders were not involved in
the Lake Chad to shrink to less than 10% of its former surface area in
the initial planning and implementation of and management of the
the 1960s (Lemoal e 1991, USGS 2001). This has significantly altered the
SEMRY project. The lack of available information is a hindrance to sound
Lake from being an open water environment to being a predominantly
decision-making and to public awareness in the region and the countries
marshy environment. The fish species composition has correspondingly
have difficulties in cooperating and sharing information. According to
been modified. The fluctuations in fisheries production is also primarily
the WSSD (2002) it is important to "enhance and accelerate human,
attributed to the variations in freshwater availability in the region.
institutional and infrastructure initiatives and promote partnerships in
that regard that respond to the specific needs of developing countries
The Causal chain analysis (CCA) focused on the priority issue of stream
in the context of sustainable development". The governments active
flow modification. The Chari-Logone/Lake Chad sub-system was
in the Chari-Logone sub-system, namely Cameroon and Chad have
116
GIWA REGIONAL ASSESSMENT 43 LAKE CHAD BASIN
CONCLUSIONS AND RECOMMENDATIONS
117
two conflicting policies, one to reduce poverty and increase economic
There is no overal water management strategy for the Komadugu-
growth and food self-sufficiency, which they hope to achieve through
Yobe sub-system (Bdliya et al. 1999) and the most acute obstacle in
irrigated rice cultivation, and the other to conserve wildlife through the
achieving this is the absence of a coordinating mechanism to harmonise
creation of national parks. These policies need to be integrated so that
the activities of the water users such as a water al ocation law between
they are able to benefit each other. The irrigations projects use water
the Federal Agencies and the Nigerian States or between Nigeria and
inefficiently; the farmers receive a low return on the amount of water
Niger. Water management institutions are only concerned with meeting
used in the irrigated fields, at the expense of downstream traditional
their water requirements, with minimal or no concern for the impacts
farmers (King 1993). King (1993) identified that rice extraction rates in
of their activities on other users (Bdilya et al. 1999). Management is
Chad and Cameroon are very low by modern standards and it has to be
also fragmented with il -defined and often conflicting responsibilities
questioned whether water intensive crops such as rice, should be grown
between government agencies and stakeholders. Water continues to
anyway in a region prone to freshwater shortages.
be used inefficiently whilst poor water use management continues,
and farmers are given no incentives or guidelines aimed at conserving
Stream flows in the Komadugu-Yobe sub-system have also been
water resources. Traditional management systems that are predominant
reduced by the decrease in rainfal events and because of the many
in the region also play a role in the inequitable use of water. The rural
dams constructed aimed at utilising the water resources of the region.
population is highly differentiated and the poor, critical y, do not have
During the 1970s and early 1980s around 20 reservoir dams were built
access to fishing and farming resources (Béné et al. 2002).
on the Hadeija River system, to supply irrigation and domestic water
supply projects. They had a negative impact on the hydrology of the
The Policy option analysis described alternative courses of action that
Yobe River, the only inflowing river into Lake Chad's northern pool. The
may be taken by policy-makers in the region, and discussed the projected
potential water requirements in the Hadejia river system are 2.6 times
outcomes and trade-offs of each action. These actions should address the
higher than available water supplies (IUCN 2003b).
root causes identified during the CCA. Firstly, basin wide options were
discussed fol owed by projects under discussion for the Chari-Logone
There has been rapid population growth that has led to greater pressure
and Lake Chad sub-system and Komadugu-Yobe sub-system.
on the natural resources including water resources in the Komadugu-
Yobe sub-system. The population currently represents over 55% of the
The fol owing options were discussed for the entire Lake Chad Basin:
Lake Chad Basin's population. The communities suffer from endemic
1. Implementation of the GEF project for the "Reversal of Land and
poverty, which is often a catalyst for environmental degradation
Water Degradation Trends in the Lake Chad Basin Ecosystem".
as they exploit natural resources at an unsustainable level for their
2. Water al ocation agreement.
short-term survival. The hydro-agricultural schemes were planned
3. Inter-basin water transfer.
without consideration of the climatic variability of the region and
there was insufficient account of the impact of reduced flows on these
The fol owing projects were discussed for the Chari-Logone and Lake
communities in the downstream Nigerian States and Niger. For example
Chad sub-system:
the Hadejia-Nguru wetlands that provide essential income and nutrition
4a. Reinundation of the Waza-Logone floodplains (Chari-Logone sub-
benefits for local populations have been reduced in extent since the
system).
construction of upstream dams (Barbier 1997).
4b. Assessment of chaning land use in the head waters of the Chari-
Logone sub-system.
The traditional communities and other stakeholders most affected
5. Chad-Niger Transboundary Project to Combat Sand Dunes and
by the water developments were not consulted during the planning
Reverse Water Degradation Trends in Lake Chad (Lake Chad sub-
or during the management of the dam infrastructure. Large irrigation
system).
and water developments are thought to have provided more negative
economic impacts than positive. Existing knowledge is not utilised
The fol owing projects were discussed for the Komadugu-Yobe sub-
with poor information dissemination, particularly to the traditional
system:
communities, weak information sharing networks, and limited pol ution
6. Grant subsidies to irrigation farmers in northern Nigeria for
monitoring and regulations. Information, education and local networks
implementing water conservation measures.
are important strategies for awareness raising (Gardner & Stern 2002,
7. Maintenance and improvements to the efficiency of dams and
UNCED 1992, WSSD 2002).
stream flow in the Komadugu-Yobe Basin.
116
GIWA REGIONAL ASSESSMENT 43 LAKE CHAD BASIN
CONCLUSIONS AND RECOMMENDATIONS
117
Two of the broad chal enges facing water management in the Lake
compliance. The implementation of water conservation measures
Chad Basin were identified as increasing freshwater availability and/or
would al ow water supplies that are available in the Komadugu-Yobe
reducing water demand and enhancing water al ocation mechanisms.
system to be used more efficiently and would be an effective tool for
However to successful y implement projects/policy actions aimed at
long-term water demand management as part of the wider al ocation
al eviating these chal enges, the institutional and legislative failures
of water in the Basin.
identified during CCA that are resulting in the unsustainable and
inequitable use of water resources needs to be addressed as a priority.
The GIWA Assessment recommends the fol owing actions in priority
order:
Many of the root causes were identified in the LCBC Master Plan
1. Continued development of recommendations made by the Master
(LCBC 1992), fol owed by an update of this plan and the formulation
Plan and Strategic Action Plan.
of a Strategic Action Plan (LCBC 1998), but unfortunately the
2. Implementation of the GEF project "Reversal of Land and Water
implementation by riparian countries of recommendations made in
Degradation Trends in the Lake Chad Basin Ecosystem".
these plans has been very slow. They serve as foundation from which
3. An agreement on the equitable and reasonable al ocation of water
the root causes identified in the CCA can be addressed. The GIWA
resources should be negotiated, finalised and ratified by member
Assessment recommends as a perquisite to all other proposed projects,
States (Option 2).
the development and prioritisation of recommendations made in the
4. The reinundation of the Waza-Logone and Hadejia-Nguru wetlands
Strategic Action Plan (SAP). The GEF project entitled "Reversal of Land
(Option 4a), according to flow rates stipulated by Option 2.
and Water Degradation Trends in the Lake Chad Basin Ecosystem" is
5. Maintenance and improvements in efficiency of dams and stream
beginning to implement prioritised recommendations made by the
flow in both the Chari-Logone and Komadugu-Yobe basins, to
Master Plan and SAP. It has a development objective "to build capacity
ensure the effective implementation of the al ocation agreement
within the Lake Chad Basin Commission (LCBC) and its national
(Option 7).
committees so that it can better achieve its mandate of managing land
6. Feasibility study of water conservation techniques suitable for
and water resources in the greater conventional basin of Lake Chad"
selected project sites (Option 6).
(World Bank 2002a). A strengthened LCBC will coordinate the member
States national plans and actions with each other at the Lake Chad basin
level and primarily address the root causes of: lack of coordination; and
institutional weakness.
As a subsidiary priority to the strengthening of capacity in the LCBC,
a water al ocation agreement would be a key legal instrument in
addressing the inequitable al ocation of the water resources in the Lake
Chad Basin. A water al ocation agreement enforced and coordinated
by a strengthened LCBC is necessary if integrated management of
the Basin is to be achieved. The implementation of a water al ocation
agreement will address the root causes: i) lack of coordination, ii) legal -
no water al ocation law, and iii) lack of capacity to promote compliance.
The reinundation of the Waza-Logone floodplains (Option 4a) can be
incorporated within the flow rates stipulated by this legal framework,
so that increased flooding can restore floodplain economic activities.
Dam maintenance and enhancement, and the improvement of stream
flow (Option 7) wil al ow the effective implementation of Option
2 (water al ocation agreement) and Option 4a by al owing greater
control and efficiency of water conveyance. The GIWA Assessment
also recommends Option 6 (water conservation) as a possible means
of increasing freshwater availability and addressing the root causes
of poor water management and the lack of incentives to promote
118
GIWA REGIONAL ASSESSMENT 43 LAKE CHAD BASIN
References
Acreman, M.C. and Hol is, G.E. (1996). Water Management and Wetlands
Beauvilain, A. (1996). La pluviometrie dans le bassin du lac Tchad. Dans
in sub-Saharan Africa, IUCN, Gland.
l'Atlas d'elevage du bassin du lac Tchad. CIRAD/CTA.
Adams, W. M. and Hol is. G. E. (1988). Hydrology and sustainable resource
Béné, C., Mindjimba, K., Belal, E. and Jol ey, T. (2000). Evaluating livelihood
development of a Sahelian floodplain wetland: Report for the
strategies and the role of inland fisheries in rural development and
Hadejia-Nguru Wetlands Conservation Project to IUCN, Gland,
poverty al eviation: the case of the Yaérés floodplains in North
Switzerland and RSPB, Sandy, UK.
Cameroon. CEMARE Research paper 153.
AEO (2002). African Environment Outlook: Past, present and future
Béné, C., Neiland, A.E., Jol ey, T., Ladu, B.M.B., Ovie, S., Sule, S., Baba,
perspectives. Part E: Freshwater, Central Africa. United Nations
O., Belal, E., Mindjimba, K., Tiotsop, F., Dara, L., Zakara, A. and
Environment Programme.
Quensičre, J. (2002). Contribution of inland fisheries to rural
Amin, A.A. and Dubois, J. (1999). A 1999 Update of the Cameroon Poverty
livelihoods in Africa: Empirical evidence from the Lake Chad Basin
Profile. Retrieved July 2003 from: http://www4.worldbank.org/afr/
areas. In: Neiland A.E. and Béné C. (eds), Sustainable Development
poverty/pdf/internal/docnav/01794.pdf
of African Continental Fisheries: A study of policy options and
Atlas du monde diplomatique (2003). Atlas du monde diplomatique,
policy-making in the Lake Chad Basin. Final Technical Report to
Paris, January 2003, in col aboration with Alain Gresh, Dominique
EU-INCO. Project no. ERBICI8CT980331, 1999-2001, p 153-187.
Vidal, Jean Radvanyi et Gilbert Achcar.
Bénech, V. (1992). The northern Cameroon floodplain: the influence of
Attewil and Lawerence (2002). Apprasial of the Safety of Maga Dam,
hydrology on fish production. In: Maltby, E., Dugan P. and LeFueve
Cameroon. GEF/LCBC Project on Reversal of Land and Water
(eds), Conservation and development: The Sustainable use of
Degradation Trends in the Lake Chad Basin.
wetland resources. IUCN, Gland, Switzerland, p 155-164.
Barbier, E.B., Acreman, M. and Knowler, D. (1997). Economic Valuation of
Bénech, V., Durand, J.R. and Quensičre, J. (1983). Fish communities of
Wetlands: a guide for policy makers and planners. Retrieved Aug.
Lake Chad and associated rivers and floodplains. In: Carmouze,
2003 from: http://www.ramsar.org/lib_val_e_index.htm
J.P., Durand, J.R. and Lévęque, C. (eds), Lake Chad. Ecology and
Barbier, E.B., Adams, W.M. and Kimmage, K. (1991). Economic Valuation
productivity of a shal ow tropical ecosystem. Monographiae
of Wetland Benefits: The Hadejia-Jama'are Floodplain, Nigeria. LEEC
Biologica 53, W. Junk, The Haye, p 293-356.
Discussion Paper No. DP91-02, April 1991.
Bénech, V. and Quensičre, J. (1989). Dynamique des peuplements
Batchelor, C., Cain, J., Farquharson, F. and Roberts, J. (1998). Improving
ichtyologiques de la region du lac Tchad (1966-1978). Influence de la
water utilisation from a catchment perspective. SWIM Paper 4.
sécheresse sahélienne. Paris, ORSTOM, TDM 51, vol 2, 428+195 p.
Colombo, Sri Lanka: International Water Management Institute.
Birkett, C.M. (2000). Synergistic Remote Sensing of Lake Chad: Variability
Bdliya, H.H., Chiroma, M., Goes, B.J.M., Kazure, Y.D., Offie, M.O., Polet, G.,
of Basin Inundation. Universities Space Research Association, NASA/
Shal angwa, P.B., Thompson, J.R. and Zabudum, A.N. (1999). Water
GSFC, Greenbelt. Remote Sensing of Environment, 72:218-236.
Management Options for the Hadejia-Jam'are-Yobe River Basin,
Elsevier Science Inc.
Northern Nigeria. IUCN-World Conservation Union: Hadejia-Nguru
Wetland Conservation Project. First Version Dec 1997, updated
May 1999.
REFERENCES
119
Burgess, N., D'Amico Hales, J., Underwood, E., Dinerstein, E., Olson, D.,
Diouf, M., Nonguierma, A., Amani, A., Royer, A. and Somé, B. (2000). Lutte
Itoua, I., Schipper, J., Ricketts, T. and Newman, K. (In press). Terrestrial
contre la sécheresse au Sahel : résultats, acquis et perspectives au
ecoregions of Africa and Madagascar: a continental assessment.
Centre régional AGRHYMET. Science et changements planétaires/
Island Press, Washington DC.
Sécheresse, 4: 257-66.
Carmouze, J.P. and Lemoalle, J. (1983). The lacustrine environment. In:
Diyam Consultant (1996). Yobe Basin Water Resources Study Report on
Carmouze, J.P., Durand, J.R. and Lévęque, C. (eds), Lake Chad Ecology
Stage 1a. Federal Environment Protection Agency, Nigeria.
and productivity of a shal ow tropical ecosystem. Monographiae
Durand, J.R. (1973). Note on the evolution of catch per unit effort in Lake
Biologica 53, W. Junk, La Haye.
Chad. Cahiers ORSTOM. Serie Hydrobiologie, 7:195-207.
Carmouze, J.P., Chantraine, J-M. and Lemoal e, J. (1983a). Physical and
Durand, J.R. (1978). Biologie et dynamique des populations d'Alestres
chemical characteristics of the waters. In: Carmouze, J.P., Durand,
baremoze (Pisces, Characidae) du basin tchadien. Trav. Doc.
J.R. and Lévęque, C. (eds), Lake Chad. Ecology and productivity of
ORSTOM, No 98.
a shal ow tropical ecosystem. Monographiae Biologica 53, W. Junk,
Durand, J.R (1980). Evolution of total catch (1962-1977) and the future
La Haye.
of fisheries in the Lake Chad region. Cahiers ORSTOM. Serie
Carmouze, J.P., Durand, J.R. and Lévęque, C. (1983b). Lake Chad. Ecology
Hydrobiologie, 13:93-111.
and productivity of a shal ow tropical ecosystem. Monographiae
Eagly, A.H. and Chaiken, S. (1993). The Psychology of Attitudes. Orlando,
Biologica 53, W. Junk, La Haye.
Harcourt Brace & Company.
CBD (1992). United Nations Convention on Biological Diversity. Basic
Eaton, D. and Sarch, M.T. (1997). The Economic Importance of Wild
text. Secretariat of the Convention of Biological Diversity, Montreal,
Resources in the Hadejia-Nguru Wetlands, Nigeria. London, CREED
Canada.
Working Paper No 13, International Institute for Environment and
Coe, M. (2001). Climate and Human Impacts on water Resources in
Development.
Africa. University of Wisconsin-Madison. Retrieved July 2003 from:
Eden Foundation (2000). Desertification - a threat to the Sahel.
http://lcluc.gsfc.nasa.gov/products/pdfs/Abstract-Coe2001.pdf
Retrieved Aug. 2003 from: http://www.eden-foundation.org/
Coe, M.T. and Foley, J.A. (2001). Human and natural impacts on the water
project/desertif.html
resources of the Lake Chad basin. Journal of Geophysical Research,
EROS Data Center (2002). HYDRO 1K Elevation Derivative Database.
106:3349-3356.
ESRI (1996). Environmental Systems Research Institute, Inc. and DATA.
Compčre, P. and Iltis, A. (1983). The phytoplankton. In: Carmouze,
ArcAtlas: Our Earth.
J.P., Durand, J.R. and Lévęque, C. (eds), Lake Chad. Ecology and
ESRI (2000). Environmental Systems Research Institute, Inc. and DATA.
productivity of a shal ow tropical ecosystem. Monographiae
Retrieved from: http://www.Countrywatch.com
Biologica 53, W. Junk, La Haye.
ESSO (1999). Project Documentation. Chad-Cameroon Oil Development.
Dabi, D.D. and Anderson, W.P. (1999). Water use for sommodity
Retrieved July 2003 from: http://www.essochad.com/Chad/Library/
production in Katarko vil age, northern Nigeria. Applied Geography,
Documentation/Chad_Documentation.asp
19:105-122.
Evans, T.E. (1996). The effects of changes in the world hydrological
Darkoh, M. (1993). Desertification: the scourge of Africa . Tiempo Climate
cycle on availability of water resources. Chapter. 2. In: Bazzaz, F.
Cyberlibrary. Retrieved Aug. 2003 from: http://www.cru.uea.ac.uk/
and Sombroek, W. (eds), Global Climate Change and Agricultural
cru/tiempo/issue08/desert.htmr
Production. Published by Food & Agriculture Organisation of the
Deichmann, U. and Eklundh, L. (1991). Global digital data sets for land
United Nations, and Jon Wiley & Sons.
degradation studies: a GIS approach. GRID Case Study Series No. 4;
Everyting Nigeria (2002). http://www.everything-nigeria.com
UNEP/GEMS and GRID; Nairobi, Kenya, p. 29-32.
FAO (1995). Review of the State of World Fishery Resources: Inland
Dejoux, C. (1983). The fauna associated with the aquatic vegetation.
Capture Fisheries. Rome: FAO Fisheries Circular No.885.
In: Carmouze, J.P., Durand, J.R. and Leveque, C. (eds), Lake Chad,
FAO (1997). Irrigation potential in Africa: A basin approach. FAO Land
ecology and productivity of a shal ow tropical ecosystem.
and Food Bul etin 4. Land and Water Development Division,
Monographiae Biologica 53, W. Junk, La Haye.
Chapter 6.
Demaree, G.R. (1990). An indication of climatic-change as seen from
FAO/GIEW (2001). Foodcrops & Shortages. Retrieved Aug. 2003 from:
the rainfall data of a mauritanian station. Theoretical and Applied
http://www.fao.org/docrep/004/x9786e/pays/chd0102e.htm
climatology, 42:139-147.
FAOSTAT (2003). FAO Agricultural Data. Retrieved Dec. 2003 from:
http://apps.fao.org/page/col ections?subset=agriculture
120
GIWA REGIONAL ASSESSMENT 43 LAKE CHAD BASIN
REFERENCES
121
Favreau, G., Leduc, C. and Marlin, C. (2001). Increase of groundwater
Hardin, G. (1968). The Tradgedy of the Commons. Science, 162:1243-
recharge induced by a change in land use: comparison of
1248.
hydrodynamic and isotopic estimates in semi-arid Niger. In: Impact
Hollis, G.E., Adams, W.M. and Aminu-Kano, M. (eds) (1993). The Hadejia-
of human activity on groundwater dynamics. Maastricht. IAHS Publ.
Nguru Wetlands Environment, Economy and Sustainable
no. 269, p 6774.
Development of a Sahelian Floodplain Wetland. IUCN, Gland,
Federal Government of Nigeria (1992). Inland Fisheries Decree.
Switzerland.
Supplement to the Official Gazette Extraordinary No 75, vol. 79,
Holz, R.K., Helfert, M.R. and Phil ips, P.L. (1984). Temperal Variations of Lake
31st December 1992.
Chad, Central Africa. University of Texas at Austin. Retrieved Aug.
Federal Government of Nigeria (2002). Combating Desertification and
2003 from: http://visibleearth.nasa.gov/cgi-bin/viewrecord?25301
Mitigating the Effects of Drought in Nigeria: The revised National
Hudson, N. (1995). Soil Conservation. London: Batsford Ltd.
report on the Implementation of the United Nations Convention
Hughes, R.H. and Hughes, J.S. (1992). A directory of African Wetlands.
to Combat Desertification in those countries experiencing serious
IUCN, Gland, Switzerland and Cambridge, UK.
drought and/or desertification, particularly in Africa (CCD). Retrieved
IETC (2000). Sourcebook of Alternative Technologies for Freshwater
July 2003 from: http://www.unccd.int/cop/reports/africa/national/
Augmentation in Africa. Puplication Series 8. No. 8a. UNEP
2002/nigeria-eng.pdf
International Environment Technology Centre. Avaialble at:
FEWS (1997). Special Report 97-4, Lake Chad - Untapped Potential, May
http://www.unep.or.jp/ietc/publications/techpublications/
1997. Retrieved Feb. 2003 from: http://www.fews.org/fb970527/
techpub-8a/index.asp
fb97sr4.html
ILEC
(1999).
International
Lake
Environment
Committee
Froese, R. and Pauly, D. (2003). FishBase. World Wide Web electronic
Foundation, World's Lakes Database. Retrieved Feb. 2003 from:
publication. Version 07 August 2003. Retrieved from: http://
http://www.ilec.or.jp/database/afr/dafr02.html
www.fishbase.org
Iltis, A. and Lemoal e, J. (1983). Tha aquatic vegetation of Lake Chad.
Gardner, G.T. and Stern, P.C. (2002). Environmental Problems and Human
In: Carmouze, J.P., Durand, J.R. and Lévęque, C. (eds), Lake Chad.
Behavior. (Second Edition). Boston, Pearson Custom Publishing.
Ecology and productivity of a shal ow tropical ecosystem.
Gaston, A. (1991). La vegetation pastorale du bassin du lac Tchad. In:
Monographiae Biologica 53, W. Junk, La Haye, p 125-143.
Livestock Atlas for the Lake Chad Basin. CIRAD/CTA
Imevbore, A.M.A., Ofoezie, I.E. and Obot, E.A. (1988). Vector-borne
GEO 3 (2002). Global Environment Outlook 3. Chapter 2: State of the
disease problems of small water resources projects in Kano State,
Environment and Policy Respective - Freshwater. United Nations
I. Snail vectors of schistosomiasis. Afrancet, 1:17-23.
Environment Programme. Earthscan.
IMF International Monetary Fund (2003). Chad: Poverty Reduction
Government of CAR (2000). Preliminar statement of the Government
Strategy Paper. IMF Country Report No. 03/209.
on the poverty strategy and medium-term economic policies.
IPCC (2001). Climate Change 2001: Impacts, Adaptation and Vulnerability
Interim Reduction Strategy Paper. I-PRSP. Retrieved Aug. 2003 from:
- Contribution of Working Group II to the Third Assessment Report
http://poverty.worldbank.org/files/cenafrica%iprs.pdf
of the IPCC. Chapter 10.2.6.3. Climatic Factors in Desertification.
Government of Niger (2002). Ful Poverty Reduction Strategy.
Available at: http://www.grida.no/climate/ipcc_tar/wg2/403.htm
Retrieved July 2003 from: http://poverty.worldbank.org/files/
Isiorho, S.A. and Matisoff, G. (1990). Groundwater recharge from Lake
9355_NigerPRSP.pdf
Chad. Limnology and Oceanography, 35:931-938.
Grigg, N.S. (1996). Water Resource Management Principles, Regulations
Isiorho, S. A., Matisoff, G. and Wehn, K. (1996). A Seepage relationship
and Cases. McGraw Hill Publishers.
between Lake Chad and the Chad Aquifers. Ground Water, 34:
Grove, A.T. (1996). African river discharges and lake levels in the
819-826.
twentieth century. In: Johnson, T.C. and Odada, E. (eds), Liminology,
Isiorho, S.A. and Nkereuwem, T.O. (1996). Reconnaissance study of the
Climatology, and Palaeoclimatology of the East African lakes.
relationship between lineaments and fractures in the southwest
Gordan and Breach, Newark, N.J, p 95-100.
portion of the Lake Chad basin: Journal of Environmental and
Grove, A.T. and Pul man, R.A. (1963). Some of the aspects of the
Engineering Geophysics, 1:47-54.
Pleistocene Paleogeography of the Chad Basin: African Ecology
Isiorho S.A., Oguntola J.A. and Olojoba A. (2000). Conjunctive water use
and Human Evolution. In: Howel, F. C. and Bourliere, F. (eds), Viking
as a solution to sustainable economic development in Lake Chad
Fund Publications in Anthropology, No. 36. p 230-245.
Basin, Africa. Xth World Water Congress Melbourne.
120
GIWA REGIONAL ASSESSMENT 43 LAKE CHAD BASIN
REFERENCES
121
IUCN (1998). Water Management Options for the Hadejia-Jama'are-Yobe
LCBC Lake Chad Basin Commission (1992). Master Plan: For the
River basin, Northern Nigeria.
redevelopment and environmental sound management of the
IUCN (2002). Economic Value of Reinundation of the Waza Logone
natural resources of the Lake Chad Conventional Basin. LCBC with
Floodplain. IUCN - The World Conservation Union. Retrieved Sept.
the assistance and cooperation of PNUE, UNSO and FAO.
2003 from: http://www.iucn.org/brao/eng/kibaar6/waza/waza%2
LCBC Lake Chad Basin Commission (1998). Integrated and sustainable
0Valuation%20Report.pdf
management of the international waters of the Lake Chad basin.
IUCN (2003a). Integrated management of the Komadugu-Yobe
Lake Chad Basin Commission: Strategic Action Plan.
River Basin (Nigeria). World Conservation Union (IUCN):
LCBC Lake Chad Basin Commission (2000a). Lake Chad Basin
Water and Nature Initiative. Retrieved Sept. 2003 from:
Commission: Memorandum submitted to Second Meeting of
http://www.waterandnature.org/d1.html
Permanent Technical Committee on Water Resources, Bangui,
IUCN (2003b). Waza Logone Floodplain, Cameroon: Economic
C.A.R, 24-26 October 2000. Draft agreement on the equitable and
benefits of wetland restoration. Integrating Wetland Economic
reasonable utilisation, development, conservation, management
Values into River Basin Management. Retrieved Sept. 2003 from:
and protection of the International Waters of the Conventional
http://www.waterandnature.org/econ/casestudy04waza.pdf
Lake Chad Basin.
Jauro, A.B. (1998). (Executive Secretary LCBC) LAKE CHAD BASIN
LCBC Lake Chad Basin Commission (2000b). The Lake Chad Basin Vision
COMMISSION (LCBC) PERSPECTIVES. Conférence Internationale "Eau
for 2025. Second World Water Forum.
et Développement Durable" PARIS - 19-20-21 Mars 1998. Retrieved
LCBC Lake Chad Basin Commission (2002). Integrated Environmental
Jan. 2003 from: http://www.oieau.fr/ciedd/contributions/atriob/
Assessment and Social Assessment (EA/SA). Of the GEF Project
contribution/cblt.htm
entitled `Reversal of Land and Water Degradation Trends in the
JEWEL (2003). Apprasial of hydrological information on the the
Lake Chad Basin. E563. Vol.3. Retrieved July 2003 from: http://www-
Komadugu-Yobe Basin in the light of JEWEL's Project Needs.
wds.worldbank.org/servlet/WDSContentServer/WDSP/IB/2002/04/
Unpublished Report by Prof L. Oyebande, June 2003. DFID
19/000094946_02040604050966/Rendered/PDF/multi0page.pdf
Jigawa Wetlands Livelihoods (JEWEL) Project, Dutse, Jigawa State,
Le Barbé, L. and Lebel, T. (1997). Rainfall Climatology of the HAPEX-Sahel
Nigeria.
region during the years 1950-1990. Journal of Hydrology, 188-189:
Jol ey, T., Béné, C. and Neiland, E. (2001). Lake Chad Fisheries: Policy
43-73.
Formulation mechanism for sustainable development. Portsmouth
L'Hôte, T., Mahé, G., Somé, B. and Triboulet, J. P. (2002). Analysis of a
University, UK.
Sahelian annual rainfal index from 1896 to 2000; the drought
Keith, J.O. and Plowes, D.C. (1997). Considerations of Wildlife Resources
continues. Hydrological Sciences Journal, 47:563572.
and Land Use in Chad. Productive Sector Growth and Environment
Lemoal e, J. (1991). The hydrology of Lake Chad during the drought
Division Office of Sustainable Development, Bureau for Africa. U.S.
period (1973-1989). FAO Fisheries Report, 445: 54-61.
Agency for International Development. SD Technical Paper No. 45.
Lemoal e, J. (1997). Diagnostic report 3: Environment and International
Kindler, J., Warshal , P., Arnould, E.J., Hutchinson, C.F. and Varady, R.
Waters. Integrated and sustainable management of the water
(1990). The Lake Chad Conventional Basin - A Diagnostic Study of
resources in the Lake Chad Basin. Preparatory Assistance - Phase B
the Environmental Degradation. UNEP and UNSO.
- RAF/95/G48. GEF/LCBC/ONU-DESDNRM-DESA.
King, G.R. (1993). Definition of the development strategies of the Water
Lévęque, C., Dejoux, C. and Lauzanne, L. (1983). The benthic fauna:
Resources of the Lake Chad Basin. Project RAF/88/029/PNUD/
ecology, biomass and communities. In: Carmouze, J.P., Durand,
DDSMS/CBLT.
J.R. and Lévęque, C. (eds), Lake Chad. Ecology and productivity
Krings, M. (1998). Migrant Hausa Communities in the Lake: Preliminary
of a shal ow tropical ecosystem. Monographiae Biologica 53, W.
Research Notes from Lake Chad.' Borno Museum Society Newsletter
Junk, La Haye.
34-35:31-41.
Mockrin, M. and Thieme, M. (2001). World Wildlife Fund (WWF)
Lamb, P. J. (1978). Large-scale tropical Atlantic surface circulation
Ecoregions, 2001.
patterns associated with sub-Saharan weather anomlies. Tel us,
Nami, B. (2002). Environmental Degradation of the Lake Chad Basin:
30:240-251.
Implications for Food Security.
Nana-Sinkam, S.C. (1995). Land and environmental degradation and
desertification in Africa. ECA/FAO Agriculture Division.
122
GIWA REGIONAL ASSESSMENT 43 LAKE CHAD BASIN
REFERENCES
123
Narayan, D. and Petesch, P. (2002). Voices of the Poor: From Many Lands.
Oyebande, L. (2001). Stream flow regime change and ecological
New York, N.Y: Published for the World Bank, Oxford University
response in the Lake Chad basin in Nigeria. Hydro-ecology: Linking
Press. Chapter 4: Nigeria - Illbeing and Insecurity.
Hydrology and Aquatic Ecology (Proceedings of Workshop HW2
Ndifon, G.T., Betterton, C. and Rol inson, D. (1988). Schistosoma curassoni
held at Birmingham, UK, July 1999). IAHS Publ. No. 266.
Brumpt, 1931 and S. bovis (Sonsino, 1876) in cattle in northern
Ramsar (2003). A Directory of Wetlands of International Importance, 7th
Nigeria. Journal of Helminthology, 62:33-34.
edition. Retrieved Sept. 2003 from: http://www.wetlands.org/RDB/
Neiland, A.E. and Verinumbe, I. (1990). Fisheries Development and
africa/AFRICA_map.html
Resource-usage Conflict: A Case Study of Deforestation Associated
Reich, P.F., Numbem, S.T., Almaraz, R.A. and Eswaran, H. (2001). Land
with the Lake Chad Fishery in Nigeria. Paper provided by Centre for
resource stresses and desertification in Africa. In: Bridges, E.M.,
the Economics and Management of Aquatic Resources. Retrieved
Hannam, I.D., Oldeman, L.R., Pening de Vries, F.W.T., Scherr, S.J. and
from: http://www.pbs.port.ac.uk/econ/index.html
Sompatpanit, S. (eds), Responses to Land Degradation. Proc. 2nd.
Neiland, A.E., Jol ey, T.H. and Jaffry, S. (1997). A comparitive Study of
International Conference on Land Degradation and Desertification,
Fisheries Production Patterns in the Upper River Benue, Lake Chad
Khon Kaen, Thailand. Oxford Press, New Delhi, India. Retrieved July
and the Nguru-Gashua Wetlands of N.E Nigeria. Paper No. 5; Final
2003 from: http://www.nrcs.usda.gov/technical/worldsoils/papers/
Report; Traditional Management Of Artisanal Fisheries, N.E Nigeria.
desertification-africa.html
CEMARE, University of Portsmouth.
Republic of Chad (2003). Schéma Directeur de l'eau et de
Neiland, A. and Béné, C. (eds) (2003). Sustainable Development of
l'Assainissement 2003-2020. Pour atteindre les objectifs du
African Continental Fisheries: A Regional Study of Policy Options
mil énaire et assurer une gestion intégrée et participative. Volume
and Policy Formation Mechanisms for the Lake Chad Basin.
thematique 6: Assainissement en mileux urbain, semi-urban, rural
University of Portsmouth and European Commission, EU-INCO
et industriel. UNDP & ONU-DAES.
Project. Final Report.
Revenga, C., Brunner, J., Henninger, N., Kassem, K. and Payne, R.
Ngantou, D. and Braund, R. (1999). Waza-Logone: Restoring the
(2000). Pilot Analysis of Global Ecosystems: Freshwater Systems.
good life. World Conservation 2/99. Retrieved Sept. 2003 from:
Washington, DC. World Resources Institute.
http://www.iucn.org/bookstore/bulletin/1999/wc2/content/
Revenga, C. and Cassar, A. (2002). Freshwater Trends and Projections:
wazalogone.pdf
Focus on Africa. World Wide Fund for Nature (WWF) Global Network
Obot, E.A. (2000). World Wildlife Fund, Africa/Madagascar Programme:
/World Wildlife Fund.
The Great Lake that nearly vanished. Retrieved Jan. 2003 from: http:
RIMS (1992). Nigerian Livestock Resources. Resource Inventory and
//www.panda.org/about_wwf/where_we_work/africa/where/
Management Limited for Federal Department of Livestock and
western_africa/lake_chad/lake_chad.cfm
Pest Control Services. Jersey, UK.
Ofoezie, I.E. (2002). Human health and sustainable water resources
RIVDIS database (1991). Monthly Average from 1933-1991 Chari-Logone
development in Nigeria: Schistosomiasis in artificial lakes. Natural
River. Global River Discharge Database. Retrieved Aug. 2003 from:
Resources Forum, 26:150-160.
http://www.daac.ornl.gov/RIVDIS/guides/rivdis.html
LCBC/UNESCO Project Report. (1997). Hydrogeological Synthesis for
Sagua, V.O. (1986). Review of the Evolution of the Fisheries of Lake Chad,
Project 507/RAF/45. Management of Water Resources for Sustainable
1980-85. Paper presented by the Sub-committee for the Protection
Development, Lake Chad Basin. UNESCO project report.
and Development of the Fisheries in the Sahelian Zone (Accra,
Olivry, J.C., Chouret, G., Vuil aume, G., Lemoal e, J. and Bricquet, J.P. (1996).
Ghana, 6-9 Oct 1996). FAO/CIFA/PH/5/86/3.
Hydrologie du Lac Tchad, ORSTOM, Monographies Hydrologiques,
Saint-Jean, L. (1983). The zooplankton. In: Carmouze, J.P., Durand, J.R. and
12:266. Paris, France.
Lévęque, C. (eds), Lake Chad. Ecology and productivity of a shal ow
ORNL (2003). Landscan 2002. Oak Ridge National Laboratory. Retrieved
tropical ecosystem. Monographiae Biologica 53, W. Junk, La Haye.
Nov. 2003, from http://www.ornl.gov/gist
Sarch, M.T. (2000). Institutional Evolution at Lake Chad: Traditional
Otite, O. (1990). Ethnic Pluralism and Ethnicity in Nigeria. Shaneson,
Administration and Flexible Fisheries Management. In: Solomon,
Ibadan.
H. and Turton. A.R. (eds), Water Wars: An Enduring Myth or an
Quensičre, J. (1990). Les resources haleutiques du basin tchadien.
Impending Reality? Durban: ACCORD Publishers.
Influence de la sécheresse et situation actual e. ORSTOM.
Sarch M.T. (2001). Fishing and farming at Lake Chad: Institutions for
access to natural resources. Journal of Environmental management
62:185-199.
122
GIWA REGIONAL ASSESSMENT 43 LAKE CHAD BASIN
REFERENCES
123
Sarch, M.T. and Al ison, E.H. (2000). Fluctuating Fisheries in Africa's Inland
Tschierschke, K. (2002). Universitat Frankfurt, Evaluation of long term
Waters: Wel Adapted Livelihoods, Maladapted Management. In:
climatic data in the Lake Chad Basin. Retrieved Jan. 2003 from: http:
Proceedings of the Tenth International Conference of the Institute of
//www.informatik.uni-frankfurt.de/~sfb268/d6/tschierschkeklima-
Fisheries, Economics and Trade, Corval is, Oregon, 2000. Retrievable
en.html
at: http://oregonstate.edu/dept/I FET/2000/papers/sarch.pdf
UNAIDS United Nations Programme on HIV/AIDS (2001). Inter-Country
Sarch, M.T. and Birkett, C. (2000). Fishing and farming at Lake Chad:
Team for West and Central Africa. Initiative of the Lake Chad Basin
Responses to lake-level fluctuations. Geographic Journal, 166:
Countries. Retrieved July 2003 from: http://www.onusida-aoc.org/
156-172.
Eng/Lake%20Chad%20Basin.htm
Schmaltz, J. (2003). MODIS Rapid Response Team, NASA/GSFC.
UNCCD United Nations Concention to Combat Desertification(1994).
Schneider, J.L. (1991). Contribution of isotopic data to palaehydro-
Elaboration of an international convention to combat desertification
climatological investigations - the late pleistocene formations
in countries experiencing serious drought and/or desertification,
of northern Kanem (Chad). Comptes rendus de l academie des
particularly in Africa. Geneva, 21.31 March.
sciences serie ii, 312: 869-874.
UNCCD United Nations Concention to Combat Desertification (2003).
Scholte, P. (2000). Assessment of changing land use in the head waters
Conference Sessions Official Documents.
of the Lake Chad Basin, Central African Republic. Project outline
UNCED United Nations Confrerence on Environment and Development
prepared for the LCBC/GEF project.
(1992). Agenda 21, the United Nations Programme of Actions from
Schuijt, K. (2002). Land and Water Use of Wetlands in Africa: Economic
Rio. New York, UN Department of Public Information.
Values of African Wetlands. International Institute for Applied
UNDP/FAO (1972). Survey of the water resources of the Lake Chad Basin
System Analysis. Interim Report IR-02-03, p 21-22.
for development purposes. UNDP/FAO Project AGL:DP:RAF/66/579.
Second World Water Forum (2000). Lake Chad Region - From Vision to
Rome, 1972.
Action. Rapporteur name: Dr. J.A. Oguntola. Retrieved Jan. 2003
UNECA United Nations Economic Commission for Africa (Unpublished).
from: http://www.worldwaterforum.net/Dossiers/lake_chad.html
Preliminary Study on Various Aspects of Inter-basin water transfer
Servant, M. and Servant, S. (1983). Paleolimnology of an upper
from the Oubangui River to Lake Chad.
quaternary endorheic lake in Chad basin. In: Carmouze, J.P., Durand,
UNEP United Nations Environment Programme (1999). Singh A., Dieye
J.R. and Leveque, C. (eds), Lake Chad. Monographiae Biologica 53:
A., Finco M., Chenoweth M.S., Fosnight E.A. and Al otey A. Early
11-26.
Warning of Selected Emerging Environmental Issues in Africa:
Siddig, E. A. (2000). Discours-programme: Causes et conséquences
Change and Correlation from a Geographic Perspective.
de la désertification sur la gestion des ressources en eau dans les
UNEP United Nations Environment Programme (2003). Background
zones arides. Actes du Séminarie International sur la Lutte contre
Paper for Consideration by the Plenary: State of the Environment.
la Désertification. (Ressources en eau douce et réhabilitation des
Discussion paper presented by the Executive Director: Implementing
terres dégradées dan les zones arides). N'Djamena Tchad. 30
the outcomes of the World Summit on Sustainable Development:
Octobre-4Novembre, 2000.
Water UNEP/GC.22/10/Add.3/Rev.1.
Thieme, M.L. et al. (eds). (In preparation). Freshwater ecoregions
UNEP GRID Arendal (2003). Atlas mondial de l'eau, une pénurie annoncée
of Africa: a conservation assessment. World Wildlife Fund-US,
(World atlas of water, an announced scarcity) and Vital watergraphics:
Washington, DC, USA.
an overview of the state of the world's fresh and marine water,
Tiffen, M. (1989a). Guidelines for the incorporation of Health Safeguards
Editions autrement, Paris, March 2003 and UNEP/GRID-Arendal,
into Irrigation Projects through inter-sectoral cooperation. PREEM
Norway and Nairobi, July 2002, in col aboration with Salif Diop and
Guidelines Series 1, Geneva, WHO.
Dennys Lisbjerg.
Tiffen, M. (1989b). Guidelines for forecasting the Vector-Borne Diseases
UNESCO United Nations Educational, Scientific and Cultural Organization
Implications of Water Resources Development. PREEM Guidelines
(1999). International Workshop on Interbasin Water Transfer.
Series 2. Geneva, WHO.
UNESCO, Paris, 25-27 April. Hydrological Programme UNESCO.
Tilho, J. (1910). Documents scientifiques de la mission Tilho 1906-1909.
Available at: http://www.worldwatercouncil.org/Vision/Documents/
Imp. Nat., Paris, Vol 1.
IWBTReport.PDFSee
UNFCCC United Nations Framework Convention on Climate Change
(1992). UNEP/IUC/99/9.
124
GIWA REGIONAL ASSESSMENT 43 LAKE CHAD BASIN
REFERENCES
125
UNFCCC United Nations Framework Convention on Climate Change
World Bank (2002b). GEF Reversal of Land and Water Degradation Trends
(1997). The Kyoto Protocol to the Framework Convention on Climate
in the Lake Chad Basin Ecosystem: Project Brief
Change. UNEP/IUC/99/10.
World Bank (2002c). World Development Indicators. Development
UN Population Division (2002). World Populations Prospects: The 2002
Data group.
Revision Population Database. Retrieved Jan. 2004 from: http://
World Bank (2003a). Sudan: Stabilization and Reconstruction - Country
esa.un.org/unpp
Economic Memorandum. Prepared jointly by the Government of
USGS United States Geological Survey (2001). Earthshots: Satel ite Images
Sudan and Poverty Reduction and Economic Management 2, Africa
of Environmental Change, Lake Chad, West Afrcia. Retrieved Jan. 2003
Region. Report No. 24620-SU.
from: http://edc.usgs.gov/earthshots/slow/LakeChad/LakeChad
World Bank (2003b). The Chad-Cameroon Petroleum Development
Van Est, D.M.E. (1999). Fishing in another man's pond. Natural resource
and Pipeline Project. Retrieved Aug. 2003 from: http://
management and conflicting interests among Mousgoum and
www.worldbank.org/afr/ccproj/
Kotoko in the Logone floodplain (Northern Cameroon). PhD.
World Gazetter (2003). Retrieved July 2003 from: http://www.world-
thesis CML Leiden University: Leiden. Retrieved Sept. 2003 from:
gazetteer.com/c/c_cm.htm
http://www.uni-bayreuth.de/afrikanistik/mega-tchad/nouvelles/
WSSD (2002). Report of the World Summit on Sustainable Development,
dernieres_nouvel es/theses-vanest.html
Johannesburg, South Africa 26 August 4 September 2002. A/
Verhoeye, J. and De Wulf, R. (2001). Imaging radar for mapping and
CONF.199/20. Plan of Implementation of the WSSD. Chap I. p 46
monitoring of wetland ecosystems in the Lake Chad Basin. Retrieved
Paragraph 66. United Nations, New York.
Feb. 2003 from: http://al serv.rug.ac.be/~educheyn/projecten/lake_
WWF (2001). Terrestrial Ecoregions of the World: A New Map of
chad2001/StudyArea/StudyArea.html
Life on Earth. GIS Download. Retrieved Aug. 2003 from: http://
WFP World Food Programme (2003). World Hunger - Chad. World
www.worldwildlife.org/ecoregions/
Food Programme, Country Briefs. Retrieved Dec. 2003 from:
Xue, Y. and Shukla, J. (1998). Model Simulation of the Influence of
http://www.wfp.org/country_brief/indexcountry.asp?country=148
Global SST Anomalies on Sahel Rainfal . Monthly Weather Review,
WHO World Health Organization (1996). Weekly Epidemiological Record
126: 2782-2792.
(WER), 71:225-232.
Zeng, N., Neelin, J.D., Lau, K.-M. and Tucker, C.J. (1999). Enhancement
WEHAB Water, Energy, Health, Agriculture and Biodiversity (2002). A
of interdecadal climate variability in the Sahel by vegetation
Framework for Action on Agriculture. WEHAB Working group
interaction. Science, 286:1537-1540.
paper for the World Summit on Sustainable Development (WSSD)
August 2002.
WIWO Foundation Working Group International Waterbird and Wetland
Research(2001). Bird censuses of the Logone floodplain in Chad and
Cameroon. Foundation Working Group International Waterbird
and Wetland Research (WIWO), The Netherlands. Retrieved Aug.
2003 from: http://home.wanadoo.nl/rene.t.vos/wiwo/chad2001/
chad2001b.htm
World Bank (1994). World Development Report 1993: Investing in Health.
Washington D.C.
World Bank (1999). Poverty Monitoring Data Base. Poverty Assessment
Summaries: Growth, Employment and Poverty reduction-Algeria.
Retrieved from: http://wbln0018.worldbank.org/dg/povertys.nsf/
de9638da553fbfbf8525678a0070b1af/ddb9e4875fad3d9a85256b2
2005b933d?OpenDocument
World Bank (2001). The World Bank Group in sub-Saharan Africa: Sudan
Retrieved Aug. 2003 from: http://www.worldbank.org/afr/sd2.htm
World Bank (2002a). GEF Reversal of Land and Water Degradation Trends
in the Lake Chad Basin Ecosystem: Project Appraisal Document
124
GIWA REGIONAL ASSESSMENT 43 LAKE CHAD BASIN
REFERENCES
125
Annexes
Annex I
GIWA workshop participants.
Name
Institutional affiliation
Country
Field of work
Dr. Johnson A. Oguntola
Lake Chad Basin Commission
Chad
Chief Water Resources Unit
(regional co-ordinator)
Mr. Martin Gbafolo
Lake Chad Basin Commission
Chad
Director, Department of Water Resources and Environment
Mr. Alainaye Jogromel
Direction des Ressources en Eau et de la Météorologie
Chad
Hydrologist
Mr. Anza Zakara
Lake Chad Basin Commission,
Chad
Fishery Expert
Mr. Abdal ah Adam Mohamed
Société du Développement du Lac (SODELAC),
Chad
Agronomist
Mr. Dodo Garba
Direction Régional de l'Environnement
Niger
Deputy Regional Director of Environment
Mr. Timothée Essang
Institut des Récherches Agronomiques pour le Développement (IRAD)
Cameroon
Agro-Economist
Mr. Maman Moussa
Direction Régional de l'Hydraulique
Niger
Directeur Régional de l'Hydraulique
Mr. Mahmat Mey
Lake Chad Basin Commission
Chad
Live stock
Mr. Ndong Ebozo'o Daniel
Délégué Provincial des Mines, de l'Eau et de l'Energie de l'Extręme Nord
Cameroon
Ingénieur du Génie Rural
Engr. Usman K. Sandabe
Chad Basin Development Authority (CBDA)
Nigeria
Assistant Chief Irrigation Engineer (SCIP)
Mr. Anada Tiega
Lake Chad Basin Commission,
Chad
GEF Project Manager
Dr. Belomal Yongar
Sécretaire Exécutif, ONU-SIDA, s/c Commission du Bassin du Lac Tchad (CBLT)
Chad
Health Project Manager
Mme. Asta Morombaye
Lake Chad Basin Commission
Chad
Translator
Mr. Marcus Njumbe Ediage
Lake Chad Basin Commission
Chad
Translator
Mr. Yakubu Ramoni
Lake Chad Basin Commission
Chad
Technician
Mr. Matthew Fortnam
Global International Waters Assessment (GIWA)
Sweden
Consultant
Ms. Edith Mussukuya
Global International Waters Assessment (GIWA)
Sweden
GIWA coordinator, sub-Saharan Africa
Dr. Juan-Carlos
Global International Waters Assessment (GIWA)
Sweden
GIWA coordinator for the Southern Hemisphere
Belausteguigoitia
Mr. Stephen Donkor
United Nations Economic Commission for Africa (UNECA)
Ethiopia
Senior Regional Adviser
126
GIWA REGIONAL ASSESSMENT 43 LAKE CHAD BASIN
ANNEXES
127
Annex II
Detailed scoring tables.
I: Freshwater shortage
II: Pollution
Weight-
Weight-
Environmental
Environmental
Environmental Issues
Score
Weight %
Averaged
Environmental Issues
Score
Weight %
Averaged
Concerns
Concerns
Score
Score
1. Modification of streamflow
3
60
Freshwater shortage
2.5
4. Microbiological
0
0
Pol ution
1.0
2. Pol ution of existing supplies
1
10
5. Eutrophication
1
15
3. Changes in the water table
2
30
6. Chemical
1
15
7. Suspended solids
1
40
Criteria for Economic Impacts
Raw Score
Score Weight %
8. Solid wastes
1
30
Size of Economic or Public Sectors
Very Small
Very Large
3
40
Affected
0
1
2
3
9. Thermal
0
0
Degree of Impact (cost, output changes
Minimum
Severe
3
35
etc)
0
1
2
3
10. Radio nuclide
0
0
Occasion/Short
Continuous
Frequency/Duration
3
25
0
1
2
3
11. Spil s
0
0
Weight Average Score for Economic Impacts
3.0
Criteria for Health Impacts
Raw Score
Score Weight %
Criteria for Economic Impacts
Raw Score
Score Weight %
Very Small
Very Large
Number of People Affected
2
40
Size of Economic or Public Sectors
Very Small
Very Large
0
1
2
3
1
55
Affected
0
1
2
3
Minimum
Severe
Degree of Severity
2
35
Degree of Impact (cost, output changes
Minimum
Severe
0
1
2
3
1
45
etc)
0
1
2
3
Occasion/Short
Continuous
Frequency/Duration
2
25
Occasion/Short
Continuous
0
1
2
3
Frequency/Duration
0
0
0
1
2
3
Weight Average Score for Health Impacts
2.0
Weight Average Score for Economic Impacts
1.0
Criteria for Other Social and
Raw Score
Score Weight %
Community Impacts
Criteria for Health Impacts
Raw Score
Score Weight %
Number and/or Size of Community
Very Small
Very Large
2
30
Very Small
Very Large
Affected
0
1
2
3
Number of People Affected
1
50
0
1
2
3
Minimum
Severe
Degree of Severity
2
40
Minimum
Severe
0
1
2
3
Degree of Severity
1
30
0
1
2
3
Occasion/Short
Continuous
Frequency/Duration
2
30
Occasion/Short
Continuous
0
1
2
3
Frequency/Duration
1
20
0
1
2
3
Weight Average Score for Other Social and Community Impacts
2.0
Weight Average Score for Health Impacts
1.0
Criteria for Other Social and
Raw Score
Score Weight %
Community Impacts
Number and/or Size of Community
Very Small
Very Large
1
50
Affected
0
1
2
3
Minimum
Severe
Degree of Severity
1
30
0
1
2
3
Occasion/Short
Continuous
Frequency/Duration
1
20
0
1
2
3
Weight Average Score for Other Social and Community Impacts
1.0
126
GIWA REGIONAL ASSESSMENT 43 LAKE CHAD BASIN
ANNEXES
127
III: Habitat and community modification
IV: Unsustainable exploitation of fish
Weight-
Weight-
Environmental
Environmental
Environmental Issues
Score
Weight %
Averaged
Environmental Issues
Score
Weight %
Averaged
Concerns
Concerns
Score
Score
Habitat and Community
12. Loss of ecosystems
2
60
2.0
Unsustainable
Modification
14. Overexploitation
2
25
2.0
exploitation of fish
13.Modification of ecosystems or
15. Excessive by-catch and
2
25
ecotones, including community
discards
2
40
structure and/or species
composition
16. Destructive fishing practices
2
50
17. Decreased viability of stock
0
0
through pol ution and disease
Criteria for Economic Impacts
Raw Score
Score Weight %
18. Impact on biological and
0
0
genetic diversity
Size of Economic or Public Sectors
Very Small
Very Large
2
45
Affected
0
1
2
3
Degree of Impact (cost, output changes
Minimum
Severe
2
30
etc)
0
1
2
3
Criteria for Economic Impacts
Raw Score
Score Weight %
Occasion/Short
Continuous
Frequency/Duration
2
25
0
1
2
3
Size of Economic or Public Sectors
Very Small
Very Large
2
33.3
Affected
0
1
2
3
Weight Average Score for Economic Impacts
2.0
Degree of Impact (cost, output changes
Minimum
Severe
2
33.3
etc)
0
1
2
3
Criteria for Health Impacts
Raw Score
Score Weight %
Occasion/Short
Continuous
Frequency/Duration
2
33.3
0
1
2
3
Very Small
Very Large
Number of People Affected
2
40
0
1
2
3
Weight Average Score for Economic Impacts
2.0
Minimum
Severe
Degree of Severity
2
30
0
1
2
3
Criteria for Health Impacts
Raw Score
Score Weight %
Occasion/Short
Continuous
Frequency/Duration
2
30
0
1
2
3
Very Small
Very Large
Number of People Affected
2
33.3
0
1
2
3
Weight Average Score for Health Impacts
2.0
Minimum
Severe
Degree of Severity
2
33.3
0
1
2
3
Criteria for Other Social and
Raw Score
Score Weight %
Occasion/Short
Continuous
Community Impacts
Frequency/Duration
2
33.3
0
1
2
3
Number and/or Size of Community
Very Small
Very Large
2
40
Affected
0
1
2
3
Weight Average Score for Health Impacts
2.0
Minimum
Severe
Degree of Severity
2
30
Criteria for Other Social and
0
1
2
3
Raw Score
Score Weight %
Community Impacts
Occasion/Short
Continuous
Frequency/Duration
2
30
0
1
2
3
Number and/or Size of Community
Very Small
Very Large
1
40
Affected
0
1
2
3
Weight Average Score for Other Social and Community Impacts
2.0
Minimum
Severe
Degree of Severity
1
35
0
1
2
3
Occasion/Short
Continuous
Frequency/Duration
1
25
0
1
2
3
Weight Average Score for Other Social and Community Impacts
1.0
128
GIWA REGIONAL ASSESSMENT 43 LAKE CHAD BASIN
ANNEXES
129
V: Global change
Weight-
Environmental
Environmental Issues
Score
Weight %
Averaged
Concerns
Score
19. Changes in the hydrological
2
100
Global change
2.0
cycle
20. Sea level change
0
0
21. Increase UV-B radiation as a
0
0
result of ozone depletion
22. Changes in ocean CO 2
0
0
source/sink function
Criteria for Economic Impacts
Raw Score
Score Weight %
Size of Economic or Public Sectors
Very Small
Very Large
3
30
Affected
0
1
2
3
Degree of Impact (cost, output changes
Minimum
Severe
3
40
etc)
0
1
2
3
Occasion/Short
Continuous
Frequency/Duration
3
30
0
1
2
3
Weight Average Score for Economic Impacts
3.0
Criteria for Health Impacts
Raw Score
Score Weight %
Very Small
Very Large
Number of People Affected
2
40
0
1
2
3
Minimum
Severe
Degree of Severity
2
30
0
1
2
3
Occasion/Short
Continuous
Frequency/Duration
2
30
0
1
2
3
Weight Average Score for Health Impacts
2.0
Criteria for Other Social and
Raw Score
Score Weight %
Community Impacts
Number and/or Size of Community
Very Small
Very Large
2
40
Affected
0
1
2
3
Minimum
Severe
Degree of Severity
2
30
0
1
2
3
Occasion/Short
Continuous
Frequency/Duration
2
30
0
1
2
3
Weight Average Score for Other Social and Community Impacts
2.0
Comparative environmental and socio-economic impacts of each GIWA concern
Types of Impacts
Environmental Score
Economic Score
Human Health Score
Social & Community Score
Concern
Overall Score
Present (a)
Future (b)
Present (c)
Future (d)
Present (e)
Future (f)
Present (g)
Future (h)
Freshwater shortage
3
3
3
3
2
3
2
3
2.8
Pol ution
1
2
1
2
1
2
1
2
1.5
Habitat and community
2
3
2
3
2
3
2
2
2.4
modification
Unsustainable exploitation of fish
2
2
2
3
2
3
1
2
2.1
and other living resources
Global change
2
3
3
1
2
3
2
3
2.4
128
GIWA REGIONAL ASSESSMENT 43 LAKE CHAD BASIN
ANNEXES
129

(1,1) -1- Cover 43_only.indd 2004-04-06, 09:23:33
The Global International Waters Assessment (GIWA) is a holistic, globally
comparable assessment of all the world's transboundary waters that recognises
the inextricable links between freshwater and coastal marine environment and
integrates environmental and socio-economic information to determine the
impacts of a broad suite of infl uences on the world's aquatic environment.
Broad Transboundary Approach
The GIWA not only assesses the problems caused by human activities manifested by
the physical movement of transboundary waters, but also the impacts of other non-
hydrological infl uences that determine how humans use transboundary waters.
Regional Assessment - Global Perspective
The GIWA provides a global perspective of the world's transboundary waters by assessing
66 regions that encompass all major drainage basins and adjacent large marine ecosystems.
The GIWA Assessment of each region incorporates information and expertise from all
countries sharing the transboundary water resources.
Global Comparability
In each region, the assessment focuses on 5 broad concerns that are comprised
of 22 specifi c water related issues.
Integration of Information and Ecosystems
The GIWA recognises the inextricable links between freshwater and coastal marine
environment and assesses them together as one integrated unit.
The GIWA recognises that the integration of socio-economic and environmental
information and expertise is essential to obtain a holistic picture of the interactions
between the environmental and societal aspects of transboundary waters.
Priorities, Root Causes and Options for the Future
The GIWA indicates priority concerns in each region, determines their societal root causes
and develops options to mitigate the impacts of those concerns in the future.
This Report
This report represents the GIWA Assessment of the Lake Chad Basin, which is located
in one of the poorest and most drought prone regions in the world. Climatic variability
and poor water governance has threatened the ecological and socio-economic integrity
of the region. The past and present status and future prospects are discussed, and
the transboundary issues traced back to their root causes. Policy options have been
recommended that aim to address these driving issues and reverse the environmental
degradation trends witnessed in the region over the past 30 years.