Global International
Waters Assessment
Regional assessments
Other reports in this series:
Caribbean Sea/Small Islands ş GIWA Regional assessment 3a
Caribbean Islands ş GIWA Regional assessment 4
Barents Sea ş GIWA Regional assessment 11
Caspian Sea ş GIWA Regional assessment 23
Gulf of California/Colorado River Basin ş GIWA Regional assessment 27
Patagonian Shelf ş GIWA Regional assessment 38
Brazil Current ş GIWA Regional assessment 39
Amazon Basin ş GIWA Regional assessment 40b
Guinea Current ş GIWA Regional assessment 42
Lake Chad Basin ş GIWA Regional assessment 43
Indian Ocean Islands ş GIWA Regional assessment 45b
East African Rift Valley Lakes ş GIWA Regional assessment 47
Indonesian Seas ş GIWA Regional assessment 57
Pacifi c Islands ş GIWA Regional assessment 62
Global International
Waters Assessment
Regional assessment 17
Baltic Sea
GIWA report production
Series editor: Ulla Li Zweifel
Report editors: Elina Rautalahti-Miettinen, Anna Thestrup
Editorial assistance: Marianne Lindstr÷m,
Monique Stolte, Johanna Egerup
Maps & GIS: Niklas Holmgren
Design & graphics: Joakim Palmqvist
Global International Waters Assessment
Baltic Sea, GIWA Regional assessment 17
Published by the University of Kalmar on behalf of
United Nations Environment Programme
ę 2005 United Nations Environment Programme
ISSN 1651-940X
University of Kalmar
SE-391 82 Kalmar
Sweden
United Nations Environment Programme
PO Box 30552,
Nairobi, Kenya
This publication may be reproduced in whole or in part and
in any form for educational or non-profi t purposes without
special permission from the copyright holder, provided
acknowledgement of the source is made. No use of this
publication may be made for resale or for any other commercial
purpose whatsoever without prior permission in writing from the
United Nations Environment Programme.
CITATIONS
When citing this report, please use:
UNEP, 2005. Lńńne, A., Kraav, E. and G. Titova. Baltic Sea, GIWA
Regional assessment 17. University of Kalmar, Kalmar, Sweden.
DISCLAIMER
The views expressed in this publication are those of the authors
and do not necessarily refl ect those of UNEP. The designations
employed and the presentations do not imply the expressions
of any opinion whatsoever on the part of UNEP or cooperating
agencies concerning the legal status of any country, territory,
city or areas or its authority, or concerning the delimitation of its
frontiers or boundaries.
This publication has been peer-reviewed and the information
herein is believed to be reliable, but the publisher does not
warrant its completeness or accuracy.
Printed and bound in Kalmar, Sweden, by Sunds Tryck Íland AB.
Contents
Preface 9
Executive summary
10
Acknowledgements 12
Abbreviations and acronyms
13
Regional defi nition
15
Boundaries of the region
15
Physical characteristics
16
Socio-economic characteristics
18
Assessment 26
Freshwater shortage
26
Pollution
28
Habitat and community modifi cation
33
Unsustainable exploitation of fi sh and other living resources
34
Global change
37
Priority concerns for further analysis
37
Causal chain analysis
39
Eutrophication
39
Overexploitation of fi sh
47
Conclusions
50
Policy options
51
Defi nition of the problems
51
Framework for implementing policy options
51
Eutrophication
52
Overexploitation of fi sh
56
Conclusions and recommendations
59
References 61
Annexes 65
Annex I List of contributing authors and organisations
65
Annex II Detailed scoring tables
66
Annex III List of conventions and specifi c laws that aff ect water use in the region
69
The Global International Waters Assessment
i
The GIWA methodology
vii
CONTENTS
Preface
The Global International Waters Assessment (GIWA) has been given the unique
task of assessing current problems and future threats of transboundary aquatic
ecosystems, considering both environmental as well as socio-economic issues
in freshwater and marine ecosystems on the entire globe.
The Baltic Sea, being enclosed by nine countries, has an obvious transboundary
character. This is illustrated by a history of more than 100 years of international
cooperation around the Sea, starting with the foundation of the International
Council for the Explorations of the Sea (ICES) at Copenhagen in 1902.
Since then, the Baltic Sea has been subject to a variety of assessments,
reports and discussions. However, the GIWA report is the fi rst to present
major environmental and socio-economic issues in a global context. This
report is the 18th report published in the series of GIWA regional reports.
Similar assessments have been conducted for the Pacifi c Islands, the Amazon
Basin, the Barents Sea and the East African Rift Valley Lakes, to name some
examples. The coherent GIWA method enables global comparison of the
Baltic Sea region results, thereby providing information and guidance to
policy makers.
It is with great pleasure that I welcome the current report that summarises
the state of the Baltic Sea.
Harry Liiv
Deputy Secretary General on Environmental Management
Ministry of the Environment, Estonia
PREFACE
9
Executive summary
The GIWA region 17 Baltic Sea is located in northeast Europe, comprising
Environmental protection measures; such as biological wastewater
a catchment area of 1 720 270 km2, of which nearly 93% belongs to
treatment, nitrogen and phosphorus removal, use of best available
the nine riparian countries; Denmark, Estonia, Finland, Germany,
technology (BAT) and best environmental practice (BEP), are expected
Latvia, Lithuania, Poland, Russia and Sweden. Five upstream states,
to bring about a reduction in the nutrient load in the region, thus
Belarus, Ukraine, Czech Republic, Slovakia and Norway, account for the
decreasing the impact of pollution. Generally no signifi cant change of
remaining 7% of the catchment area. The Baltic Sea is one of the largest
the region's population size is expected, although in some coastal areas
brackish water areas in the world, is an almost enclosed sea, connected
the population may increase due to further migration and urbanisation.
to the North Sea by the narrow and shallow waters of the Belt Sea and
Consequently, pressure on the coastal areas will increase.
the Sound only. This is a sea comprising of a complex system of water
basins, which can be further divided into several gulfs and bays. The
The issues of eutrophication and overexploitation were assessed causing
physical characteristics of the Baltic Sea including its hydrographic,
severe impacts in the region and were also considered as having the
hydrochemical and biological properties as well as socio-economic
most transboundary impacts; the Causal chain analysis was therefore
characteristics, makes it very sensitive to anthropogenic pressures.
conducted on these two issues. The input of nitrogen has decreased
considerably in the Baltic Sea following the implementation of measures
The GIWA assessment evaluated the relative importance of diff erent
by the riparian countries, however eutrophication still remains an urgent
concerns in the Baltic Sea region. Environmental and socio-economic
problem in most coastal areas. Fishing activities are eff ecting the species
impacts were assessed under present and future conditions, and
composition and size distribution of the main target species as well as
overall impacts and priorities were identifi ed. The GIWA assessment
non-commercial fi sh stocks. Despite regulations, fi shing fl eets continue
ranked Pollution as having severe impact in the region, whereas all of
to overexploit the fi sh stocks in the Baltic Sea.
the other concerns except for Global change had a moderate impact.
Global change was not considered to have signifi cant impacts in the
The immediate causes of eutrophication identifi ed in the Causal
Baltic Sea region at present. The concerns for the Baltic Sea region were
chain analysis were the aquatic load of nutrients from urban areas
ranked in descending order:
and agriculture, and the atmosphere deposition of nitrogen into the
1. Pollution
Baltic Sea, mainly from the energy and transport sector. The root causes
2. Unsustainable exploitation of fi sh and other living resources
connected to the issue involved diffi
culties in integrating agriculture,
3. Habitat and community modifi cation
energy and transport policies into a broader environmental context, for
4. Freshwater
shortage
example inadequate adoption of modern agricultural technology, lack
5. Global
change
of investment in wastewater facilities, as well as population growth and
increased road and sea traffi
c.
There is expected to be no major changes in the future regarding the
concerns of Freshwater shortage, Habitat and community modifi cation
The causal chain analysis identifi ed the immediate causes for
or Unsustainable exploitation of fi sh and other living resources.
overexploitation to be a combination of high exploitation rates and
The impact of Global change is however predicted to increase.
overutilisation of fi shing quotas on the one hand and an oversized fl eet
10
GIWA REGIONAL ASSESSMENT 17 BALTIC SEA
capacity on the other. Economic factors such as fi shing subsidies, market
Development of comprehensive approaches combining
failure and reform failures, are driving these immediate causes but
decommissioning schemes and regulatory measures, and the
inappropriate assessment methods and other governance weaknesses
construction of a stabile system of taxation, prices of fuel and
are also inhibiting the successful management of the fi sheries.
materials.
Establish more stringent control over vessel documentation and
The Policy option analysis aimed to address the root causes identifi ed
fi shing statistics.
in the Causal chain analysis. Identifi ed policy options and the
Ensure obligatory registration of all catches and all export
mechanisms necessary to solve the problems were identifi ed for the
transactions on land.
Baltic Sea region, taking into account the international obligations
Improve and unify a system of fi sh auctions for all Baltic countries.
and agreements adopted by the Baltic Sea states during the last two
A creation of appropriate assessment methods leading to the
decades. There have been a number of international agreements that
establishment of reliable total allowable catches (TACs).
have established a framework for reducing the nutrient enrichment
Improve the reporting of landings by introducing an electronic
of the Baltic Sea and for managing the fi sheries resource. The most
network and exchange of this information between Baltic
important of these are the Convention on the protection of the marine
countries.
environment of the Baltic Sea (Helsinki Convention); the Convention on
Support for the construction of appropriate fi shery laws that can
Fishing and Conservation of the Living Resources in the Baltic Sea and
effi
ciently manage the new market conditions is emphasised.
the Belts (Gdansk Convention), and for the EU member states, the Water
Framework Directive (WFD).
For aspects concerning eutrophication the following courses of action
were identifi ed:
Integrate agricultural, energy and transport policy with the
environmental policy proposed by the European Commission,
the Helsinki Commission, the International Baltic Sea Fishery
Commission and other international conventions in order to reduce
the discharge of nutrients to the Baltic Sea.
Cooperate with countries outside the EU, such as Russia, Belarus and
Ukraine, with the aim to harmonise their environmental legislation
with the EU countries, such as adopting the EU Water Framework
Directive.
Support and develop existing agricultural cooperation projects and
networks.
The European Commission is invited further to support the
implementation of transboundary environmental projects.
Governments are invited to support economically the
implementation of new environmentally friendly technologies in
agriculture, transport and energy production.
Governments, especially in the new EU countries and Russia, are
invited to support investments in wastewater treatment facilities
to reduce emissions from heat and electricity production units as
well as from road and sea traffi
c.
Concerning aspects related to overexploitation of living resources the
following course of action were identifi ed:
An
integration
of
fi shery policies with economic and environmental
strategies in order to strengthen sustainable fi sheries.
EXECUTIVE SUMMARY
11
Acknowledgements
This report of the Global International Waters Assessment is the result of
the regional Task team. The authors would like to recognise the valuable
contributions of experts, advisors and representatives of the countries
of the Baltic Sea region.
The authors have been assisted in assessment work by analysing the
material and prioritising the issues as well as analysing the causal chains
and would like to acknowledge particularly the following experts:
Eugeniusz Andrulewitcz, Sea Fishery Institute, Poland
Saara Bńck, Finnish Environment Institute, Finland
Sverker Evans, Swedish Environmental Protection Agency, Sweden
Kaisa Kononen, Maj and Tor Nessling Foundation, Finland
Heikki Latostenmaa, Ministry of the Environment, Finland
Astrid Saava, University of Tartu, Estonia
Special acknowledge to the GIWA Scientifi c Director Dag Daler for his
valuable support during the execution of the project.
Acknowledgements are also to the GEF, University of Kalmar, and UNEP
for providing the funding required undertaking the study.
12
GIWA REGIONAL ASSESSMENT 17 BALTIC SEA
Abbreviations and acronyms
BAP
Best Agricultural Practice
BAT
Best Available Technology
BEP
Best Environmental Practice
BSP
Baltic Sea Project
BSRP
Baltic Sea Regional Project
CAP
Common Agricultural Policy
CEPI
Confederation of European Paper Industries
CFP
EU Common Fisheries Policy
ELV
Emission Limit Values
ERB
European Baltic cooperation
FAO
United Nations Food and Agriculture Organization
GDP
Gross Domestic Product
GEF
Global Environmental Facility
HELCOM Helsinki Commission
IBSFC
International Baltic Sea Fishery Commission
ICES
International Council for the Explorations of the Sea
IFI
International Financial Institution
JCP
Joint Comprehensive Programme
JTDP
Joint Transnational Development Programme
LME
Large Marine Ecosystem
MWWTP Municipal Waste Water Treatment Plant
NGO
Non Governmental Organisation
NEMO
Non-Indigenous Estuarine and Marine Organisms
PHC
Petroleum HydroCarbons
PLC
Pollution Load Compilation
TAC
Total Allowable Catches
TFC
Total Final energy Consumption
UNEP
United Nations Environment Programme
WQO
Water Quality Objectives
WFD
Water Framework Directive
WGA
Working Group on Agriculture
WSSD
World Summit on Sustainable Development
ABBREVIATIONS AND ACRONYMS
13
List of figures
Figure 1
Boundaries of the Baltic Sea region. . . . . . . . . . . . . . . . . . . . . . . . . . . . . . . . . . . . . . . . . . . . . . . . . . . . . . . . . . . . . . . . . . . . . . . . . . . . . . . . . . . . . . . . . . . . . . . . . . . . . . . . . . . . . . . . . . . . . . . . . . . . . 15
Figure 2
River run-off to the Baltic Sea and its various sub-catchments from 1950 to 1998. . . . . . . . . . . . . . . . . . . . . . . . . . . . . . . . . . . . . . . . . . . . . . . . . . . . . . . . . . . . . . . . . . . . . . . . . . . . . . . 17
Figure 3
Population density in the Baltic Sea region.. . . . . . . . . . . . . . . . . . . . . . . . . . . . . . . . . . . . . . . . . . . . . . . . . . . . . . . . . . . . . . . . . . . . . . . . . . . . . . . . . . . . . . . . . . . . . . . . . . . . . . . . . . . . . . . . . . . . . 19
Figure 4
Cod, herring and sprat landings in the Baltic Sea 1963-2000. . . . . . . . . . . . . . . . . . . . . . . . . . . . . . . . . . . . . . . . . . . . . . . . . . . . . . . . . . . . . . . . . . . . . . . . . . . . . . . . . . . . . . . . . . . . . . . . . . . 23
Figure 5
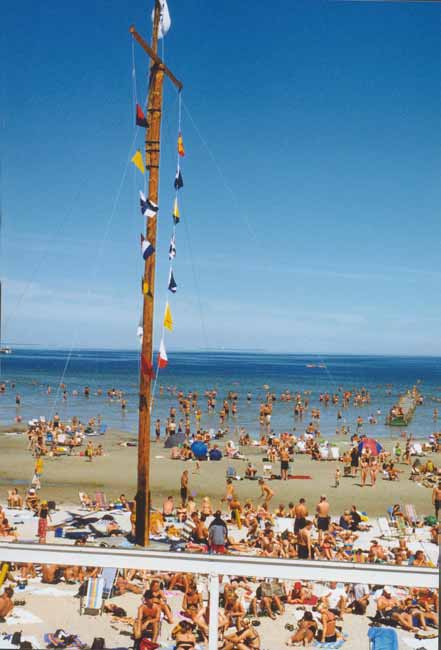
Bathing tourists at a beach, K÷pingsvik, Íland, Sweden. . . . . . . . . . . . . . . . . . . . . . . . . . . . . . . . . . . . . . . . . . . . . . . . . . . . . . . . . . . . . . . . . . . . . . . . . . . . . . . . . . . . . . . . . . . . . . . . . . . . . . . 24
Figure 6
The annual flow rate of the Narva River before and after construction of the dam in 1956. . . . . . . . . . . . . . . . . . . . . . . . . . . . . . . . . . . . . . . . . . . . . . . . . . . . . . . . . . . . . . . . . . . . . . 27
Figure 7
Overexploitation of groundwater resources and saltwater intrusion in the Baltic Sea region. . . . . . . . . . . . . . . . . . . . . . . . . . . . . . . . . . . . . . . . . . . . . . . . . . . . . . . . . . . . . . . . . . . 27
Figure 8
The nitrate hot spots for groundwater. . . . . . . . . . . . . . . . . . . . . . . . . . . . . . . . . . . . . . . . . . . . . . . . . . . . . . . . . . . . . . . . . . . . . . . . . . . . . . . . . . . . . . . . . . . . . . . . . . . . . . . . . . . . . . . . . . . . . . . . . 28
Figure 9
Number of ships, excluding ferry traffic, in the Baltic Sea 2000. . . . . . . . . . . . . . . . . . . . . . . . . . . . . . . . . . . . . . . . . . . . . . . . . . . . . . . . . . . . . . . . . . . . . . . . . . . . . . . . . . . . . . . . . . . . . . . . . . 31
Figure 10
St. Petersburg commercial seaport, at the mouth of the Neva River . . . . . . . . . . . . . . . . . . . . . . . . . . . . . . . . . . . . . . . . . . . . . . . . . . . . . . . . . . . . . . . . . . . . . . . . . . . . . . . . . . . . . . . . . . . . 32
Figure 11
Cod (Gadus morhua).. . . . . . . . . . . . . . . . . . . . . . . . . . . . . . . . . . . . . . . . . . . . . . . . . . . . . . . . . . . . . . . . . . . . . . . . . . . . . . . . . . . . . . . . . . . . . . . . . . . . . . . . . . . . . . . . . . . . . . . . . . . . . . . . . . . . . . . . . . 34
Figure 12
Landings and mortality of cod age 1. . . . . . . . . . . . . . . . . . . . . . . . . . . . . . . . . . . . . . . . . . . . . . . . . . . . . . . . . . . . . . . . . . . . . . . . . . . . . . . . . . . . . . . . . . . . . . . . . . . . . . . . . . . . . . . . . . . . . . . . . . . 35
Figure 13
Recruitment and spawning stock biomass of cod age 2. . . . . . . . . . . . . . . . . . . . . . . . . . . . . . . . . . . . . . . . . . . . . . . . . . . . . . . . . . . . . . . . . . . . . . . . . . . . . . . . . . . . . . . . . . . . . . . . . . . . . . . . 35
Figure 14
Salmon (Salmo salar). . . . . . . . . . . . . . . . . . . . . . . . . . . . . . . . . . . . . . . . . . . . . . . . . . . . . . . . . . . . . . . . . . . . . . . . . . . . . . . . . . . . . . . . . . . . . . . . . . . . . . . . . . . . . . . . . . . . . . . . . . . . . . . . . . . . . . . . . . 36
Figure 15
Causal chain diagram illustrating the causal links for eutrophication. . . . . . . . . . . . . . . . . . . . . . . . . . . . . . . . . . . . . . . . . . . . . . . . . . . . . . . . . . . . . . . . . . . . . . . . . . . . . . . . . . . . . . . . . . 40
Figure 16 Nitrogen inputs to the Baltic Sea in 1995. . . . . . . . . . . . . . . . . . . . . . . . . . . . . . . . . . . . . . . . . . . . . . . . . . . . . . . . . . . . . . . . . . . . . . . . . . . . . . . . . . . . . . . . . . . . . . . . . . . . . . . . . . . . . . . . . . . . . . . 40
Figure 17 Input of nitrogen and phosphorus to the Baltic Sea region. . . . . . . . . . . . . . . . . . . . . . . . . . . . . . . . . . . . . . . . . . . . . . . . . . . . . . . . . . . . . . . . . . . . . . . . . . . . . . . . . . . . . . . . . . . . . . . . . . . . . 41
Figure 18
Distribution of total phosphorus load by country into the Baltic Sea region. . . . . . . . . . . . . . . . . . . . . . . . . . . . . . . . . . . . . . . . . . . . . . . . . . . . . . . . . . . . . . . . . . . . . . . . . . . . . . . . . . . . 41
Figure 19
Distribution of total nitrogen load by country in the Baltic Sea region. . . . . . . . . . . . . . . . . . . . . . . . . . . . . . . . . . . . . . . . . . . . . . . . . . . . . . . . . . . . . . . . . . . . . . . . . . . . . . . . . . . . . . . . . . 41
Figure 20
Deposition of nitrogen oxide (NO -N) and ammonia (NH -N) into the Baltic Sea in 1998.. . . . . . . . . . . . . . . . . . . . . . . . . . . . . . . . . . . . . . . . . . . . . . . . . . . . . . . . . . . . . . . . . . . . . . . 42
3
4
Figure 21
Nitrogen load to water bodies from municipalities between the late 1980s and 1995. . . . . . . . . . . . . . . . . . . . . . . . . . . . . . . . . . . . . . . . . . . . . . . . . . . . . . . . . . . . . . . . . . . . . . . . . . . 43
Figure 22
Phosphorus load to water bodies from municipalities between the late 1980s and 1995.. . . . . . . . . . . . . . . . . . . . . . . . . . . . . . . . . . . . . . . . . . . . . . . . . . . . . . . . . . . . . . . . . . . . . . . 43
Figure 23
Energy production in the Baltic Sea region. . . . . . . . . . . . . . . . . . . . . . . . . . . . . . . . . . . . . . . . . . . . . . . . . . . . . . . . . . . . . . . . . . . . . . . . . . . . . . . . . . . . . . . . . . . . . . . . . . . . . . . . . . . . . . . . . . . . . 44
Figure 24
Annually applied nitrogen by mineral fertilisers.. . . . . . . . . . . . . . . . . . . . . . . . . . . . . . . . . . . . . . . . . . . . . . . . . . . . . . . . . . . . . . . . . . . . . . . . . . . . . . . . . . . . . . . . . . . . . . . . . . . . . . . . . . . . . . . 45
Figure 25
Annually applied phosphorus by mineral fertilisers. . . . . . . . . . . . . . . . . . . . . . . . . . . . . . . . . . . . . . . . . . . . . . . . . . . . . . . . . . . . . . . . . . . . . . . . . . . . . . . . . . . . . . . . . . . . . . . . . . . . . . . . . . . . 45
Figure 26
Livestock density in the Baltic Sea countries 1990-1996.. . . . . . . . . . . . . . . . . . . . . . . . . . . . . . . . . . . . . . . . . . . . . . . . . . . . . . . . . . . . . . . . . . . . . . . . . . . . . . . . . . . . . . . . . . . . . . . . . . . . . . . . 45
Figure 27
Water tariffs in the Baltic Sea countries. . . . . . . . . . . . . . . . . . . . . . . . . . . . . . . . . . . . . . . . . . . . . . . . . . . . . . . . . . . . . . . . . . . . . . . . . . . . . . . . . . . . . . . . . . . . . . . . . . . . . . . . . . . . . . . . . . . . . . . . 46
Figure 28
Causal chain diagram illustrating the causal links for overexploitation of fish.. . . . . . . . . . . . . . . . . . . . . . . . . . . . . . . . . . . . . . . . . . . . . . . . . . . . . . . . . . . . . . . . . . . . . . . . . . . . . . . . . 48
Figure 29
Recorded catches of the main target species in the Baltic Sea between 1973-1998. . . . . . . . . . . . . . . . . . . . . . . . . . . . . . . . . . . . . . . . . . . . . . . . . . . . . . . . . . . . . . . . . . . . . . . . . . . . . . 48
Figure 30
Concentrated bloom of blue green algae, most probably Nodularia spumigena, at the eastern coast of Sweden, 2003. . . . . . . . . . . . . . . . . . . . . . . . . . . . . . . . . . . . . . . . . 52
Figure 31
Cod fishing in the southern Baltic Sea, 1994. . . . . . . . . . . . . . . . . . . . . . . . . . . . . . . . . . . . . . . . . . . . . . . . . . . . . . . . . . . . . . . . . . . . . . . . . . . . . . . . . . . . . . . . . . . . . . . . . . . . . . . . . . . . . . . . . . . . 57
List of tables
Table 1
The Baltic Sea region's sub-systems and their catchment areas. . . . . . . . . . . . . . . . . . . . . . . . . . . . . . . . . . . . . . . . . . . . . . . . . . . . . . . . . . . . . . . . . . . . . . . . . . . . . . . . . . . . . . . . . . . . . . . . 16
Table 2
Annual average air temperature in the Baltic Sea sub-systems. . . . . . . . . . . . . . . . . . . . . . . . . . . . . . . . . . . . . . . . . . . . . . . . . . . . . . . . . . . . . . . . . . . . . . . . . . . . . . . . . . . . . . . . . . . . . . . . . . 17
Table 3
Demographic data of the Baltic Sea region, 2002. . . . . . . . . . . . . . . . . . . . . . . . . . . . . . . . . . . . . . . . . . . . . . . . . . . . . . . . . . . . . . . . . . . . . . . . . . . . . . . . . . . . . . . . . . . . . . . . . . . . . . . . . . . . . . 18
Table 4
Life expectancy at birth in 2001. . . . . . . . . . . . . . . . . . . . . . . . . . . . . . . . . . . . . . . . . . . . . . . . . . . . . . . . . . . . . . . . . . . . . . . . . . . . . . . . . . . . . . . . . . . . . . . . . . . . . . . . . . . . . . . . . . . . . . . . . . . . . . . . . 19
Table 5
Gross domestic product in the Baltic Sea countries. . . . . . . . . . . . . . . . . . . . . . . . . . . . . . . . . . . . . . . . . . . . . . . . . . . . . . . . . . . . . . . . . . . . . . . . . . . . . . . . . . . . . . . . . . . . . . . . . . . . . . . . . . . . . . 19
Table 6
GDP per capita in the Baltic Sea countries. . . . . . . . . . . . . . . . . . . . . . . . . . . . . . . . . . . . . . . . . . . . . . . . . . . . . . . . . . . . . . . . . . . . . . . . . . . . . . . . . . . . . . . . . . . . . . . . . . . . . . . . . . . . . . . . . . . . . . 20
Table 7
Unemployment rates in the Baltic Sea countries.. . . . . . . . . . . . . . . . . . . . . . . . . . . . . . . . . . . . . . . . . . . . . . . . . . . . . . . . . . . . . . . . . . . . . . . . . . . . . . . . . . . . . . . . . . . . . . . . . . . . . . . . . . . . . . . 20
Table 8
Gross domestic product by sector in the Baltic Sea countries. . . . . . . . . . . . . . . . . . . . . . . . . . . . . . . . . . . . . . . . . . . . . . . . . . . . . . . . . . . . . . . . . . . . . . . . . . . . . . . . . . . . . . . . . . . . . . . . . . . . 21
Table 9
Land use structure in 2001-2002.. . . . . . . . . . . . . . . . . . . . . . . . . . . . . . . . . . . . . . . . . . . . . . . . . . . . . . . . . . . . . . . . . . . . . . . . . . . . . . . . . . . . . . . . . . . . . . . . . . . . . . . . . . . . . . . . . . . . . . . . . . . . . . . 22
Table 10
Aquaculture production for human consumption in 1996.. . . . . . . . . . . . . . . . . . . . . . . . . . . . . . . . . . . . . . . . . . . . . . . . . . . . . . . . . . . . . . . . . . . . . . . . . . . . . . . . . . . . . . . . . . . . . . . . . . . . . 23
Table 11
Share of transport in GDP. . . . . . . . . . . . . . . . . . . . . . . . . . . . . . . . . . . . . . . . . . . . . . . . . . . . . . . . . . . . . . . . . . . . . . . . . . . . . . . . . . . . . . . . . . . . . . . . . . . . . . . . . . . . . . . . . . . . . . . . . . . . . . . . . . . . . . 23
Table 12
Scoring table for the Baltic Sea region.. . . . . . . . . . . . . . . . . . . . . . . . . . . . . . . . . . . . . . . . . . . . . . . . . . . . . . . . . . . . . . . . . . . . . . . . . . . . . . . . . . . . . . . . . . . . . . . . . . . . . . . . . . . . . . . . . . . . . . . . . 26
Table 13
Introduced species to the Baltic Sea. . . . . . . . . . . . . . . . . . . . . . . . . . . . . . . . . . . . . . . . . . . . . . . . . . . . . . . . . . . . . . . . . . . . . . . . . . . . . . . . . . . . . . . . . . . . . . . . . . . . . . . . . . . . . . . . . . . . . . . . . . . . 36
Table 14
Contribution of the transport sector to NO emissions. . . . . . . . . . . . . . . . . . . . . . . . . . . . . . . . . . . . . . . . . . . . . . . . . . . . . . . . . . . . . . . . . . . . . . . . . . . . . . . . . . . . . . . . . . . . . . . . . . . . . . . . . . 44
x
Table 15
Forecast of passenger and freight transport in the recently acceded EU countries and Russia. . . . . . . . . . . . . . . . . . . . . . . . . . . . . . . . . . . . . . . . . . . . . . . . . . . . . . . . . . . . . . . . . . . 47
Table 16
Expected growth in volume of trade in the Baltic Sea from 1995 to 2017. . . . . . . . . . . . . . . . . . . . . . . . . . . . . . . . . . . . . . . . . . . . . . . . . . . . . . . . . . . . . . . . . . . . . . . . . . . . . . . . . . . . . . . . 47
Table 17
Number of fishing vessels per country operating in the Baltic Sea. . . . . . . . . . . . . . . . . . . . . . . . . . . . . . . . . . . . . . . . . . . . . . . . . . . . . . . . . . . . . . . . . . . . . . . . . . . . . . . . . . . . . . . . . . . . . . 49
List of boxes
Box 1
Specific requirements included in Annex III of the Helsinki Convention in order to decrease eutrophication. . . . . . . . . . . . . . . . . . . . . . . . . . . . . . . . . . . . . . . . . . . . . . . . . . . . 54
Box 2
Helsinki Commission, regulations to prevent pollution from industry and municipalities.. . . . . . . . . . . . . . . . . . . . . . . . . . . . . . . . . . . . . . . . . . . . . . . . . . . . . . . . . . . . . . . . . . . . . . 55
Box 3
Fishing management measures related to overfishing proposed by FAO. . . . . . . . . . . . . . . . . . . . . . . . . . . . . . . . . . . . . . . . . . . . . . . . . . . . . . . . . . . . . . . . . . . . . . . . . . . . . . . . . . . . . . . 56
Box 4
The Biodiversity Action Plan for Fisheries.. . . . . . . . . . . . . . . . . . . . . . . . . . . . . . . . . . . . . . . . . . . . . . . . . . . . . . . . . . . . . . . . . . . . . . . . . . . . . . . . . . . . . . . . . . . . . . . . . . . . . . . . . . . . . . . . . . . . . . 57
14
GIWA REGIONAL ASSESSMENT 17 BALTIC SEA
Regional defi nition
This section describes the boundaries and the main
Elevation/
physical and socio-economic characteristics of the
Depth (m)
region in order to defi ne the area considered in the
4 000
regional GIWA Assessment and to provide suffi
cient
2 000
Mu
oni
1 000
oa
background information to establish the context
lv
i
500
ijok
within which the assessment was conducted.
Kem
100
Ske
0
Livajoki
llefteńl
┼
Oul
nger
ujok
-50
v
i
ma
Bothnian
n
-200
ńlve
Bay
n
Finland
-1 000
Boundaries of the region
-2 000
Onezhskoye Ozero
The main objective when defi ning the geographic
Sweden
Volga-Baltic Wat
boundaries of the GIWA Baltic Sea region was that it
Bothnian
Svir'
er
Kokemaenjoki
way
Sea
Ladozhskoye
Ozero
should embrace estuarine, coastal and open waters,
Norway
Dalńlve
defi ned by GIWA as "international waters", that constitute
n
Helsinki
Saint Petersburg
Gulf of Finland
Neva
Russia
a source and/or recipient of potentially signifi cant
Achipelago
Tallinn
ovh
Stockholm
k
Sea
av
Vol
transboundary environmental impacts. The Baltic Sea
Nar
Vńnern
G÷ta
Estonia Chudskoye Ozero Il'men
Kanal
regional boundaries correspond to the boundaries of
Vńttern
Pskovskoye Ozero
G÷tańlv
Gulf of
the Helsinki Convention (HELCOM) area (Figure 1).
Ve
Riga
likaya
Kattegat
RigaLatvia
The Baltic Sea region was divided according to HELCOM
Denmark
Sound
Baltic Proper
Daugava
into the following sub-systems: Bothnian Bay, Bothnian
Copenhagen
Smolensk
N
Sea, Archipelago Sea, Gulf of Finland, Gulf of Riga, Baltic
emuna Lithuania
Vitsyebsk
s
Western Baltic
Kaliningrad
Proper, Western Baltic, Sound and Kattegat. In order to
Gdansk
Kaliningrad
Vilnius
be able to compare the assessment results with the
Belarus
Hrodna
Szczecin
other GIWA regions, the Baltic Sea was considered as
Bydgoszcz
Bialystok
Germany
Oder
one single system.
Poznan
Warsaw
Brest
Poland
Lodz
Vistula Lublin
Wroclaw
Czestochowa
Ukraine
Katowice
Figure 1
Czech Republic
L'viv
Ostrava
Krakow
Boundaries of the
Baltic Sea
0
500 Kilometres
ę GIWA 2004
Slovakia
region.
REGIONAL DEFINITION
15
Physical characteristics
the total water exchange during one year is high enough to maintain
the vertical density stratifi cation, but too small to renew the deeper
The Baltic Sea, situated between the old Fennoscandian Shield and
waters. The water in the deepest parts, e.g. in the Eastern Gotland Basin,
the North European Plain, is one of the largest brackish water areas in
is renewed very irregularly by infl ows of suffi
ciently high salinity. It is
the world. It is a semi-enclosed sea with a surface area of 415 000 km2
estimated that a renewal of the total water mass of the Baltic Sea would
and a volume of 21 700 km3, thereby representing 0.1% of the world's
take about 25-35 years. Nutrients and hazardous substances therefore
oceans in area, but only 0.002% of the volume. The Baltic Sea is shallow,
have a long residence time in the Sea and accumulate in sediments
with an average depth of about 60 m and a maximum of 460 m. The
(Westing 1989).
Sound and the Belt Sea constitute shallow transition areas between
the North Sea and the Baltic Sea. Weather conditions determine the
The Baltic Sea catchment area comprises 1 720 270 km2, of which nearly
volume of high-salinity water from the North Sea which enters the Baltic
93% belongs to the nine riparian countries; Denmark, Estonia, Finland,
Sea, taking place at irregular intervals. In the Baltic Sea, a permanent
Germany, Latvia, Lithuania, Poland, Russia and Sweden. Sweden has the
stratifi cation layer exists between an upper water layer of low salinity
largest Baltic Sea catchment area with 440 000 km2, followed by Poland,
and a deeper layer of more saline water. The surface salinity decreases
Russia and Finland, all of which have areas larger than 300 000 km2. Six of
from about 30 in the Kattegat area to 10 in the Arkona Basin, 6-8
the nations - Estonia, Finland, Latvia, Lithuania, Poland and Sweden - are
in the Central Baltic, and from 6 to 0.5 in the Gulf of Finland and
situated almost entirely within the catchment, while less than half of the
the Gulf of Botnia (Melvasalo et al. 1981). The Baltic Sea coast is highly
land area in Denmark and only one-eighteenth in Germany is situated
variable, from deep embayments to extensive archipelagos while other
within the catchment. Only a very small fraction of the total area of
areas have open coasts. The turnover time for water therefore varies
the Russian Federation, including St. Petersburg, Leningrad oblast, and
widely in the diff erent coastal areas, from less than 1 day at the open
Kaliningrad, is found within the catchment (1.7%). The remaining 7%
coasts to nearly 100 days in the more enclosed archipelagos. This in
belongs to the fi ve upstream states, which have a relatively insignifi cant
turn infl uences how pollution aff ects the local coastal environment
infl uence on the Baltic Sea. The detailed division of the Baltic Sea
which is impacted by both marine and land-based sources. Generally,
catchment area is presented in Table 1.
Table 1
The Baltic Sea region's sub-systems and their catchment areas.
Archipelago
Country
Bothnian Bay
Bothnian Sea
Gulf of Finland
Gulf of Riga
Baltic Proper
Western Baltic
The Sound
Kattegat
Total
Sea
Carchemnt area riparian state (km2)
Finland
146 000
39 300
9 000
107 000
301 300
Russia
276 100
23 700
15 000
314 800
Estonia
26 400
17 600
1 100
45 100
Latvia
3 400
50 100
11 100
64 600
Lithuania
11 140
54 160
65 300
Poland
311 900
311 900
Germany
18 200
10 400
28 600
Denmark
1 200
12 340
1 740
15 830
31 110
Sweden
113 620
176 610
83 225
2 885
63 700
440 040
Total
259 620
215 910
9 000
412 900
102 540
495 885
22 740
4 625
79 530
1 602 750
Catchment area upstream states (km2)
Belarus
258 000
58 050
83 850
Ukraine
11 170
11 170
Czech Rep.
7 190
7 190
Slovakia
1 950
1 950
Norway
1 055
4 855
13 360
Total catchment area (km2)
Total
260 675
220 765
9 000
412 900
128 340
574 245
22 740
4 625
86 980
1 720 270
(Source: HELCOM 2002)
16
GIWA REGIONAL ASSESSMENT 17 BALTIC SEA
Climate
6 000
The climate of the Baltic Sea region diff ers from the rest of Europe.
5 000
Bothian Bay
4 000
Cold arctic and sub-tropical air masses often collide here, forming
3 000
2 000
a polar front. The amount and intensity of solar radiation varies
1 000
0
markedly depending on latitude and season. The air temperature is
1950
1955
1960
1965
1970
1975
1980
1985
1990
1995
6 000
greatly infl uenced by season, latitude, and distance from the Sea. In
5 000
Bothian Sea
4 000
the northern parts of the region, the average mid-winter atmospheric
3 000
2 000
temperature is usually around -12░C, and the average mid-summer
1 000
0
1950
1955
1960
1965
1970
1975
1980
1985
1990
1995
temperature +15░C. Whereas in the southern parts of the region,
6 000
the average winter and summer air temperature is -2░C and +18░C,
5 000
Gulf of Finland
4 000
respectively. The annual variation in air temperature in the diff erent
3 000
2 000
Baltic Sea sub-systems is summarised in Table 2.
1 000
0
1950
1955
1960
1965
1970
1975
1980
1985
1990
1995
/s3 3 000
Gulf of Riga
2 000
Table 2
Annual average air temperature in the Baltic Sea
m
1 000
sub-systems.
0
1950
1955
1960
1965
1970
1975
1980
1985
1990
1995
Average air temperature (░C)
6 000
5 000
Baltic Proper
Sub-system
4 000
1981-
1994-
1994
1995
1996
1997
1998
3 000
1993
1998
2 000
1 000
0
Bothnian Bay
0.0
0.0
0.7
0.4
0.9
-0.4
0.3
1950
1955
1960
1965
1970
1975
1980
1985
1990
1995
3 000
Bothnian Sea
2.5
2.1
3.0
2.1
3.6
2.8
2.7
Belt Sea + Kattegat
2 000
1 000
Gulf of Finland
3.4
3.1
4.7
3.4
3.9
3.4
3.7
0
1950
1955
1960
1965
1970
1975
1980
1985
1990
1995
Gulf of Riga
5.3
5.1
6.3
4.9
5.8
5.7
5.6
20 000
Baltic Marine Area
15 000
Baltic Proper
6.9
7.5
7.5
6.0
7.4
7.5
7.2
10 000
5 000
Belt Sea + Kattegat
7.1
7.6
7.3
6.0
7.6
7.2
7.1
0
1950
1955
1960
1965
1970
1975
1980
1985
1990
1995
Baltic Sea region
4.3
4.4
5.0
3.9
4.9
4.5
4.6
Year
(Source: HELCOM 2002)
Figure 2 River
run-off to the Baltic Sea and its various sub-
catchments from 1950 to 1998.
Note: The horizontal lines represent the mean values for the years 1950-1993.
(Source: HELCOM 2002)
The region is characterised by relatively uniform seasonal and
spatial distributions of precipitation. The major regional diff erence is
whether the precipitation is in the form of rain or snow. As regards the
Neva (Russia), Vistula (Poland), Daugava (Latvia), Nemunas (Lithuania),
hydrological regime, it is important to note that regional precipitation
the Kemijoki (Finland), the Oder (Poland, Germany) and the G÷ta ─lv
exceeds regional evaporation substantially. In the northern parts of the
(Sweden) (HELCOM 2002). Run-off volumes diff er signifi cantly in the
region, average annual precipitation is approximately 400 mm (mostly
various parts of the Baltic Sea catchment area (Figure 2 ). The average
as snow), and in the southern parts of the region about 700 mm.
run-off to the Bothnian Bay varies between 10 and 20 l/s/km2, and run-
Precipitation falling onto the Baltic Sea surface averages about 620 mm
off to the Gulf of Finland ranges from 7 to 9 l/s/km2 (Pitkńnen & Lńńne
per year (Westing 1989).
2001). Run-off from Poland and Germany to the southern part of the
Baltic Proper is only about 5 l/s/km2.
Inflow from rivers
Long-term cyclical fl uctuations with alternating wet and dry periods
The annual hydrological regime is characterised by low river discharges
are typical for the area. There is signifi cant inter-annual variation in
at the beginning of the year, and a signifi cant rise in infl ow during the
precipitation and, subsequently, the annual run-off cycle. The mean
spring when discharges peak (HELCOM 1986).
fl ow rate from all catchment rivers to the Baltic Sea is 15 190 m3/s
(479 km3/year), of which nearly half drains from the seven largest rivers;
REGIONAL DEFINITION
17
Socio-economic characteristics Table 3 Demographic data of the Baltic Sea region, 2002.
Country area
Population
Population
Urbanisation
Country area
Country
in the region in catchment
density
rate
The Baltic Sea catchment area is divided between 14 states. Nine of
(km2)
(km2)
area
(inhab./km2)
(%)
them are riparian states, which have a signifi cant infl uence on the Baltic
Riparian countries
Sea. Economically these states can be divided into two groups: old
Denmark
43 100
31 100
4 500 000
145
85
market economy countries (Denmark, Finland, Germany and Sweden)
Estonia
45 100
45 100
1 400 000
31
69
and countries in transition (Estonia, Latvia, Lithuania, Poland, which have
Finland
338 200
301 300
5 000 000
17
59
acceded the EU in 2004, and Russia). The countries in transition have
Germany
357 000
28 600
3 100 000
108
88
the most diffi
cult socio-economic problems due to the political and
Latvia
64 600
64 600
2 700 000
42
68
economic changes they underwent in the early 1990s; therefore this
Lithuania
65 200
65 200
3 700 000
57
68
section will focus on the latter group.
Poland
312 700
311 900
38 100 000
122
63
Russia*
17 100 000
314 800
10 200 000
32
73
Political framework
Sweden
450 000
440 000
8 500 000
19
83
The nine riparian states are democratic. In accordance with the
Upstream countries
decision of the European Council in Copenhagen 2002 concerning the
Belarus
207 600
83 850
4 000 000
48
74
enlargement of the European Union, 10 states including Estonia, Latvia,
Ukraine
603 700
11 200
1 800 000
161
68
Lithuania and Poland, were acceded to the EU in 2004; meaning that all
Czech Rep.
78 900
7 200
1 600 000
222
75
of the riparian states states of the Baltic Sea, except Russia, are members
Slovak Rep.
49 000
2 000
200 000
100
58
of the Europeian Union.
Norway
323 900
13 400
0
-
75
Total
20 039 000
1 720 250
85 000 000
The political changes of the late 1980s and early 1990s had a signifi cant
Note: *About 1.6% (269 500 km2) of Russia is in the Gulf of Finland catchment area. The population
in this area is 8 million, with a population density of 30 inhab./km2. Kaliningrad constitutes 0.1%
infl uence on the economies of these new EU states and Russia. The
of the Russian territory, with a population of 878 000 and a population density of 58 inhab./km2
(Russian Statistical Yearbook 1998).
collapse of the Soviet Union resulted in economic insecurity, which
(Source: CIA 2002, Statistics Finland 2002, Central Statistical Bureau of Latvia 2001, Statistics
Lithuania 2002, Central Statistical Office 2002, Statistical Office of Estonia 2002b, Statistics
negatively impacted the economies of the states under its immediate
Sweden 2002, HELCOM 1998a, Partanen-Hertell et al. 1999, World Bank Group 2004)
sphere of infl uence (Estonia, Latvia, Lithuania and Poland) as well as in
Russia. However, the economies of these states have recovered and
their Gross Domestic Product (GDP) is considerably higher than it was in
Germany, where more than 80% of the population is living in urban
1990 (Partanen-Hertell et al. 1999). The diff erences in the development
areas (Table 3). The least urbanised countries are Finland, and Poland,
patterns of the last 60 years have nevertheless shaped, to a degree, the
in which the urbanisation rate is below 70%. In Estonia, Latvia and
socio-economic conditions of these countries.
Lithuania the urbanisation rate is about 70%, and in the Russian Baltic
Sea catchment area the rate is around 75%.
The situation of the newly acceded countries is compared to that of
the other EU countries in the following defi nition of the region's socio-
The population is primarily distributed in settlements along the coast.
economic status, while Russia is considered separately. This is due to the
Population density in the whole catchment area varies considerably
diffi
culties in obtaining information about the Russian regions found
from over 500 inhabitants/km2 in the urban areas of Poland, Germany
within the Baltic Sea region. Statistics on Russia are therefore frequently
and Denmark to less than 10 inhabitants/km2 in the northern parts of
not included in tables and text. Russia's average socio-economic
Finland and Sweden (Figure 3). Five capital cities are located on the
characteristics are not relevant for analysis in this assessment, as they
coastline of the Baltic Sea; Copenhagen, Helsinki, Riga, Stockholm
are signifi cantly diff erent the specifi c characteristics of the Russian part
and Tallinn. St. Petersburg is the largest coastal city. Other large cities
of the Baltic Sea catchment area.
situated within the catchment area are the two capitals, Warsaw
and Vilnius, as well as the cities of Kaliningrad, Lodz, Krakow and
Population
Wroclaw.
A fairly stable and largely urbanised population of nearly 85 million
people reside within the Baltic Sea catchment area, of which about
Generally, no signifi cant changes in population size are expected in the
half live in Poland (Table 3). The urbanisation rate is relatively high in
next decade. However, the population is expected to increase in coastal
the Baltic Sea catchment area, particularly in Denmark, Sweden and
areas close to large cities, due to migration in general and urbanisation
18
GIWA REGIONAL ASSESSMENT 17 BALTIC SEA
Table 4
Life expectancy at birth in 2001.
Population
density
Life expectancy (year)
(persons/km2)
Country
<1
Total population
Female
Male
1-2
Denmark
76.9
79.7
74.3
3-5
Estonia
70.0
76.3
64.0
6-10
11-100
Finland
77.8
81.5
74.1
Finland
>100
Germany 77.8
81.1
74.6
Latvia
69.0
75.2
63.1
Norway
Lithuania
69.4
75.6
63.5
Poland
73.7
78.1
69.5
Sweden
Russia
67.5
73.0
62.3
Estonia
Sweden
79.8
82.7
77.2
Russia
(Source: CIA 2002)
Latvia
Denmark
recent years, life expectancy rates have increased in all former socialist
Lithuania
countries, but they are still considerably lower than the EU member
states of before the 2004 enlargement (Table 4).
Germany
Belarus
Poland
Economic overview
Ukraine
The economic situation diff ers widely between the countries in the
Czech
Baltic Sea region (Table 5). While the regional GDP per capita has
Republic
increased during the 1990s, the economic gap between the countries
ę GIWA 2004
Slovakia
Figure 3
Population density in the Baltic Sea region.
acceded the EU in 2004 and the old market economy is narrowing
(Source: ORNL 2003)
rather slowly. In 2001, GDP per capita in the newly acceded countries
was only a third of that in the other EU member states.
in particular. As a result of this migration, pressure on the coastal zone
The insecure economic situation following the collapse of the Soviet
is expected to increase.
Union negatively impacted the East European countries. The diffi
cult
transition to a new economic system, resulted in the GDPs of the
Life expectancy at birth is one of the most commonly used statistics
recently acceded countries decreasing sharply between 1991 and 1994.
for assessing the health of a population. This characteristic is directly
By 1995, the recession was over, and economic growth rate accelerated
dependant of the socio-economic development of a country. In
reaching a peak in 1997. However, due to a crisis in the fi nancial sector,
Table 5
Gross domestic product in the Baltic Sea countries.
GDP growth (annual % change)
GDP in 2001*
Country
(billion USD)
1993
1994
1995
1996
1997
1998
1999
2000
2001
2002
Denmark
149.8
ND
5.5
2.8
2.5
3.0
2.8
2.1
3.2
1.4
2.0
Estonia
14.3
-8.2
-1.8
4.6
4.0
10.0
5.0
-0.7
6.9
4.5
5.0
Finland
133.5
-1.1
4.0
3.8
4.0
6.3
5.3
4.0
5.7
2.0
2.6
Germany
2 174
-1.8
2.1
1.4
0.5
1.2
2.0
1.8
3.1
0.8
1.8
Latvia
18.6
-14.9
0.6
-0.8
3.3
8.6
3.9
1.1
6.6
6.0
6.0
Lithuania
27.4
-16.2
-9.8
3.3
4.7
7.3
5.1
-3.9
3.3
3.6
4.7
Poland
339.6
4.3
5.2
6.8
6.0
6.8
4.8
4.1
4.1
2.5
3.7
Russia
1 200
-13.0
-13.5
-4.2
-3.4
0.9
-4.9
5.4
8.3
4.0
4.0
Sweden
219
-2.2
4.1
3.7
1.1
2.1
3.6
4.1
3.6
1.7
2.5
Notes: * Using purchasing power parity rates. ND = No Data.
(Source: CIA 2002, IMF 2001, Statistics Finland 2002, Central Statistical Bureau of Latvia 2001, Statistics Lithuania 2002, Central Statistical Office 2002, Statistical Office of Estonia 2002b, Statistics Sweden 2002)
REGIONAL DEFINITION
19
Table 6
GDP per capita in the Baltic Sea countries.
GDP per capita (USD using purchasing power parity rates)
Country
1993
% of the highest
1994
1995
1996
1997
2001
% of the highest
Denmark
19 920
100
20 990
22 150
23 000
23 690
28 000
100
Estonia
4 030
20.2
4 080
4 420
4 700
5 240
10 000
35.7
Finland
16 220
81.4
17 220
18 510
19 250
20 150
25 800
92.1
Germany
18 940
95.1
19 760
20 650
21 060
21 260
26 200
93.6
Latvia
3 230
16.2
3 370
3 480
3 670
3 940
7 800
27.9
Lithuania
3 850
19.3
3 560
3 780
4 010
4 220
7 600
27.1
Poland
4 850
24.3
5 190
5 740
6 140
6 520
8 800
31.4
Northwest Russia*
4 104
20.6
3 632
3 576
3 488
3 496
8 300
29.6
Sweden
17 330
87.0
18 140
19 270
19 690
19 790
24 700
88.2
Highest
19 920
100
21 250
22 560
23 900
24 450
28 000
100
Lowest
3 230
16.2
3 370
3 480
3 490
3 500
7 600
27.1
Note: * The GDP per capita for Russia has been calculated on the basis of Russian data (World Bank data source) using an index of 0.8. The index (0.8) is the ratio of Russian sub-system GDP rbl per capita
to Russian Federation GDP rbl per capita in 1994-1996 (Russian Statistical Yearbook 1998).
(Source: World Bank 1999, CIA 2002)
foreign demand began to decline in 1998. The same year saw a crisis in
Table 7
Unemployment rates in the Baltic Sea countries.
the Russian market and as a result the country's GDP continued to fall
Unemployment rates* (% of labour force)
Country
up until 1999. In 2000, the growth rate had picked up again and, driven
1993
1994
1995
1996
1997
1998
1999
2000
2001
2002
by economic integration with EU member states, Estonia's economy
Denmark
ND
8
7
7
7.8
6.5
5.6
5.2
5.2
5.4
showed a rapid increase of 6.9%, and Latvia of 6.6%. This high rate of
Estonia
2
2
2
2
ND
10.5
12.9
13.7
12.4
11.3
growth continued until 2001 and 2002. Since 2000, the increase of GDP
Finland
18
18
17
16
12.6
11.4
10.3
9.8
9.9
10.4
in the acceded countries has been considerably higher than in the other
Germany
10
11
13
9
9.5
8.9
8.2
7.5
7.5
7.9
EU member states.
Latvia
5
6
6
7
5.9
6.4
8.4
11.5
12.5
ND
Lithuania
4
4
6
7
6.7
6.5
10.0
11.5
ND
ND
Due to the faster economic growth, the economies of the recently
Poland
16
16
15
14
10.3
10.4
13.1
15.1
17.5
ND
acceded countries - calculated on the basis of GDP per capita using
Russia
1
2
3
3
ND
ND
ND
ND
ND
ND
purchasing power parities (in USD) - have drawn nearer to the countries
Sweden
8
8
8
8
8
6.5
5.6
4.7
4.1
4.1
with developed economies but still lag far behind (Table 6). Between
Note: ND = No Data. *Unemployment rate is the percentage of the labour force which is without
1993 and 2001 the GDP per capita in Estonia has grown 2.5 times, in
work but available and seeking employment. Definitions of labour force and unemployment
differ by country.
Latvia 2.4 times, in Lithuania 2 and in Poland 1.8 (World Bank 1999, CIA
(Source: World Bank1999, Statistics Finland 2002, Central Statistical Bureau of Latvia 2001,
Statistics Lithuania 2002, Central Statistical Office 2002, Statistical Office of Estonia 2002b,
2002). Although there has been a considerable rise in GDP per capita, it
Statistics Sweden 2002)
is still only a third of that in countries with a more developed economy
in the region.
by the economic crisis in Russia, unemployment increased again at
the end of 1998 and reached a peak in 2000, exemplifi ed by a rate of
The unemployment rate, which here is used as an indicator of the level
13.7% in Estonia and 15.1% in Poland. In 2001, the unemployment rate
of welfare in the Baltic Sea region, varies considerably between the
fell in Estonia to 12.4%, while at the same time in Poland and Latvia,
countries. During the 1990s, the unemployment rate has increased
unemployment further escalated.
in many of the market economy countries (Table 7), while changes in
the labour market of the transition countries are diff erent from those
Economic inequality between the rich and poor is greater in the
of the earlier EU countries. Growth in unemployment also occurred in
transitional countries than in many developed countries in Europe. It
the Baltic States and Polish labour markets in the early 1990s. Due to
is estimated that poverty will aff ect as many as 15% of the population
successful economic reforms, the labour market stabilised in 1996-
in Poland during the transformation phase (United Nations 2002). In
1998 and the unemployment rate remained around 10%. Infl uenced
2001, the percentage of the population living below the poverty line
20
GIWA REGIONAL ASSESSMENT 17 BALTIC SEA
in Estonia was 17%. When using the subsistence level established by
Industry
the Government of Estonia as the poverty line, 3% of the population
All countries around the Baltic Sea are considered industrialised
was below this level in 2000 and 2001 (Statistical Offi
ce of Estonia
and during the last six years the industrial sector has experienced
2002a).
considerable growth. The highest growth rates have been recorded in
Estonia (47%), Poland (44%) and Finland (43%) (CIA 2002). In Denmark
As for the future, the recently acceded EU countries are all members
and Sweden, industrial production grew from 20% in 1995 to 23% in
of the World Trade Organisation and are steadily moving towards a
2001. The lowest growth rate during these years was in Latvia, where
modern market economy with increasing ties to the West, including
the eff ect of the 1998 economic crisis was the largest.
the alignment of their currencies with the Euro.
In 2001 the industrial production growth rate varied signifi cantly
Main economic sectors
between the countries. In Latvia it rose to 6.4%; in Estonia, Finland and
The economies of each country are variably divided between the
Sweden it was 5% and in Poland 4.3 to 4.5%. Industrial growth rates
diff erent economic sectors, although there are some general patterns.
were negligible in Denmark with 1.1% and in Germany there was no
The dominant sector in the region is the service sector, which accounts
notable growth at 0.2% (CIA 2002).
for 56 to 75% of the GDP of the countries in the Baltic Sea region. The
industrial sector contributes between 22 and 37% to GDP, and the
The industrial sectors with the most harmful aff ect on the environment
are the pulp and paper, chemical, food processing and mining
Table 8
Gross domestic product by sector in the Baltic Sea
industries. There are, however, major diff erences in the processes and
countries.
technologies employed within the industrial sector of each country,
GDP by sector (%)
which infl uences the level of impact industry has on the environment.
Country
Agriculture, forestry and fishing
Industries in the northern and western countries of the region have
Industry
Services
Agriculture
Total
implemented gradual and fundamental changes to maintain their
Denmark
2.3
3
22
75
market competitiveness, and contemporary technology has been used
Estonia
3.4
6
28
66
in order to comply with progressively stricter environmental standards
Finland
0.1
3
28
69
(Partanen-Hertell et al. 1999). In contrast to these countries, the industries
Germany
ND
1
28
71
of the countries acceded in 2004, especially in the metal, pulp and
Latvia 3.9
5
24
71
paper, energy and construction sectors are still utilising technologies
Lithuania
6.3
9
32
59
originally installed when the plants were constructed, in some cases
Poland
3.3
4
32
64
as early as the 1930s. However, since 1990 the situation has changed
signifi cantly; industrial production has declined, many older industrial
Russia
ND
7
37
56
facilities have been closed, renovated or reconstructed to create new
Sweden
1.5
2
29
69
Note: ND = No Data. (Source: CIA 2002, Statistics Finland 2002, Central Statistical Bureau of
profi table and more environmentally friendly units, for example in the
Latvia, 2001, Statistics Lithuania 2002, Central Statistical Office 2002, Statistical Office of Estonia
2002b, Statistics Sweden 2002)
paper and pulp industry and food processing industries. The principles
for developing the industrial and energy sector in an environmentally
agricultural, forestry and fi shing sector 1 to 9% (Table 8).
sound way were formulated in Agenda 21 for the Baltic Sea Region
Estonia, Latvia and Lithuania have undertaken enormous economic
(Baltic 21 1998a). The ideology behind sustainable development in the
reforms during the last decade. These countries all have relatively few
industrial sector is based upon maintaining continuity of economic,
natural resources, the most important being forest, fi sh, arable land
social, technological and environmental improvements.
and local mineral building materials. Estonia is the only country with
a signifi cant local energy resource - oil shale. Despite these limitations,
Agriculture
they have transformed from being dependent on agriculture and
The contribution agricultural production makes to GDP has decreased
industry into service sector dominant economies. However, there
remarkably in recent decades. The recently acceded states still have
remains considerable diff erences between the states; while earlier EU
a consiberably higher share of agriculture in the GDP compared to
member states have established economies based upon advanced
the other countries (Table 8). This decrease in agricultural production
high-tech industry, the countries acceded in 2004 are only in transition
is closely connected with the substantial decline in agricultural
towards a modern market economy.
employment. In EU, about 5% of the labour force was active in the
REGIONAL DEFINITION
21
agricultural sector, while the corresponding fi gure for the newly acceded
Fishery
countries in 2001 varied from 9 to 20% (Brouwer et al 2001). In addition,
In the Baltic Sea region the fi sheries has traditionally played an important
the land area used for agriculture has decreased considerably in all
role as a source of food, especially in Estonia, Latvia and Lithuania.
Baltic Sea region countries, and varies markedly from 61.3% in Poland
Fishing in the Baltic is mainly focused on marine species, but also on
to 7% in Finland (Table 9). The decline in agricultural land combined
some freshwater and anadromous species (i.e. migrate between the
with a reduction in fertiliser application has decreased the impact of
sea and rivers). The Baltic Sea ichthyofauna consists of approximately
agriculture on biological diversity and the aquatic environment.
100 fi sh species. Cod (Gadus morhua), herring (Clupea harengus), sprat
(Sprattus sprattus) and salmon (Salmo salar) are the main commercially
Table 9
Land use structure in 2001-2002.
exploited in marine fi sheries and the only species regulated by quotas
Land use (%)
established by the International Baltic Sea Fishery Commission (IBSFC).
Country
Forest and
Arable land
Inland waters
Others
These species constitute over 90% of the total catch in the region. Other
wooded land
commercial species, found mainly in coastal waters, are eel (Anguilla
Denmark
55.7
12.7
1.7
30.6
anguilla), trout (Salmo trutta), fl ounder (Platichthys fl esus), pike (Esox
Estonia
15.5
51.6
8.0
24.9
lucius), perch (Perca fl uviatilis), pike-perch (Stizostedion lucioperca), smelt
Finland
7.0
74.8
11.0
7.2
(Osmerus eperlanus), blue mussels (Mytilus edulis), whitefi sh (Coregonus
Latvia
29.0
48.1
3.8
19.1
lavaretus) and shrimp (Crangon crangon).
Lithunia
60.6
32.7
4.2
2.5
Poland
61.3
29.4
2.7
6.6
The FAO has highlighted the importance of recreational fi sheries and has
Sweden
7.9
74.1
10.7
7.3
(Source: CIA 2002, Statistics Finland 2002, Central Statistical Bureau of Latvia 2001, Statistics
stated that in many cases it can provide greater economic benefi ts to
Lithuania 2002, Central Statistical Office 2002, Statistical Office of Estonia 2002b, Statistics
Sweden 2002, UN-ECE/FAO 2000)
local communities than would accrue from subsistence or commercial
fi shing of the same resource (FAO 1996). Many species are exploited
by recreational fi shers in the Baltic region, and catches of freshwater
Forestry
fi sh species are in some cases 10 times higher than the commercial
Forest is one of the principal natural resources in the Baltic Sea region.
catch. The relative economical value is even higher. In some areas the
There is a relatively high percentage of forest and wooded land in the
growing recreational fi shery could lead to overfi shing (Baltic 21 1998b).
Nordic countries (Finland and Sweden, more than 70% of the territory)
Unfortunately, reliable information of catch levels by recreational fi sheries
compared with Denmark (12.7%) (Table 9).
is lacking in most Baltic countries except for Finland where amateur
fi shers (more than 1 million) purchase licenses annually. To gain more
Forestry has constitutes the backbone of the Finnish and Swedish
information, over 25 000 questionnaires are dispatched every year to these
economies as does the wood manufacturing industry for the Danish
recreational fi shers, of which 70% respond (Hilden 1990). Total landings
economy. Governments of these countries have actively promoted
by the recreational fi sheries in Finland was approximately 50 000 tonnes
sustainable forest management practises for generations. In commercial
in 1998 (Finnish Ministry of Agriculture and Forestry 2003).
forestry the utmost consideration is given to the environmental values
and cultural heritage of forested areas. Furthermore, the recycling of
Landings of sprat increased during the 1990s, while there was no dramatic
paper and cardboard and other forest products is widely practiced.
change in the landings of herring (Figure 4). Cod catches decreased
Close to 70% of the total Finnish paper and board consumption is
during this period, as a result of a number of reasons (ICES 2003). Firstly,
collected for recycling, in Sweden the level of recycling is even higher
the breeding success of Baltic cod is dependent on certain environmental
(87%), while Poland is recycling 33% (CEPI 2004).
conditions. After spawning, their eggs sink into deeper Baltic waters where
they drift during incubation. The deep waters are oxygen depleted and if
In Estonia, Latvia and Lithuania, forest products have become some
the eggs sink to these waters it can result in a low recruitment of cod. This
of the most important exports. In 2001, timber and wood products
is what has happened in the central Baltic for the past decade or more.
accounted for 18% of Estonia's total exports, with raw timber the main
The hydrography of the Baltic Sea is largely determined by the sporadic
export. Although the quantity raw timber exported has progressively
infl ows of saline North Sea water and the intermediate stagnation periods
increased, its relative importance is decreasing, as the export market for
(lowering of salinity). Such a period started in the beginning of 1980s. The
sawn timber and furniture has signifi cantly grown. Recycling of forest
other reason for the decline in landingsis severe fi shing pressure, with
products is undertaken only on a small scale.
many young fi sh being caught before they have reproduced.
22
GIWA REGIONAL ASSESSMENT 17 BALTIC SEA
Transport
600 000
The transport sector is of great importance to modern society,
Cod
Herring
500 000
mobilising people and goods. There is an increasing demand for
Sprat
transport and more individualised and fl exible transport services. The
400 000
onnes)
percentage of the countries' GDP attributed to transport is considerable,
(t
h 300 000
especially in Estonia, Latvia and Lithuania (Table 11). In these countries
Catc
the development of the transport
200 000
sector has been particularly rapid
Table 11
Share of transport
100 000
due to the intensity of Russian
in GDP.
Share of transport
0
transit traffi
c.
Country
in GDP (%)
1963
1965
1967
1969
1971
1973
1975
1977
1979
1981
1983
1985
1987
1989
1991
1993
1995
1997
1999
Denmark
9.4
Year
There are extensive shipping routes
Estonia
16.3
Figure 4
Cod, herring and sprat landings in the Baltic Sea
across the Baltic Sea. Compared to
1963-2000.
Finland
8.5
(Source: HELCOM 2003a)
land transport via rail and roads,
Latvia
13.6
shipping is a rather slow but
Lithuania
11.1
The decline of the cod stocks have had considerable economic impacts
relatively sustainable transport
Poland
6.4
on the Baltic Sea fi sheries. This has led to an economic crisis, and
mode. Shipping and harbours
Sweden
7.4
governments subsequently provided funds to assist the most severely
are of major importance for the
(Source: Statistics Finland 2002, Central
aff ected areas, e.g. Bornholm (Baltic 21 1998b).
import and export of goods, and
Statistical Bureau of Latvia 2001, Statistics
Lithuania 2002, Central Statistical Office
also for travel via passenger ferries.
2002)
Aquaculture
However, technical and economic
There is a tradition of aquaculture in the Baltic Sea region which is an
development in the transport sector has focused predominantly
important alternative to the declining wild fi sheries in certain regions
on road transport in the last 50 years. Today maritime transport, in
today. Aquaculture for human consumption currently equates to about
particular RO/RO and ferry transport (especially the trend towards high-
9% of sea fi sh landings (Baltic 21 1998b). The production by country
speed ferries, called feeder-ships), requires specifi c attention regarding
and main species in the Baltic area is shown in Table 10. Other species
energy consumption and their environmental impacts (Baltic 21 1998c).
of importance are silver carp, arctic charp, eel and crayfi sh. However
Oil poses the greatest potential impact and hazard from sea transport.
the aquaculture sector can have negative environmental impacts and
for example the proportion of direct total nitrogen and phosphorus
Tourism
discharge from industry and fi sh farms constitute 5% and 8% of the
Tourism has grown substantially over the past decade and is now one of
total load to the Baltic (HELCOM 2004a).
the major economic activities in the Baltic Sea region. The main reason for
this relatively rapid development is explained by the collapse of the Soviet
Table 10 Aquaculture production for human consumption
Union, which has opened the borders between the West European and
in 1996.
former socialist countries. This development is most notable in Estonia,
Country
Production (tonnes)
Main species
where tourism has become one of the most important economic sectors.
Poland
28 088
Carp
Foreign currency received from tourism services constitute 18% of the
Finland
17 311
Rainbow trout
total exports of Estonian goods and services. The total contribution to
Denmark*
13 120
Rainbow trout
GDP in 1998 from overseas visitors was 15% (including secondary eff ects),
Sweden
6 440
Rainbow trout
which was double that of 1994 (United Nations 2002). In Finland, tourism
Lithuania
1 600
Carp
accounted for only 1.8% of GDP in 1998, the lowest fi gure in the region,
Germany
1 059
Carp
and in the other countries it was between 3.7% (Sweden) and 4.5%
Latvia
380
Carp
(Latvia, Lithuania, Poland, Denmark) (United Nations 2002). Tourism
Estonia
195
Rainbow trout
in the Baltic Sea region is estimated to generate over 35 billion USD
Russia
274
Carp
annually in foreign income (HELCOM 2002). Forecasts by the World
Total
68 467
Tourism Organisation indicate higher growth of tourism in the Baltic Sea
Note: *The Danish aquaculture figures also include the North Sea catchment area.
(Source: Baltic 21 1998b)
area compared with other parts of Europe up to 2020.
REGIONAL DEFINITION
23
tourism and the environment is needed in order for the industry to
be sustainable in the region. Tourists, tourist destinations and tourist
business are in the focus of the Tourism Sector Action Programme
launched by Agenda 21 for the Baltic Sea Region (Baltic 21 1998a).
Likewise, the Helsinki Commission initiated enforcement of the
legislation regarding sustainable development of tourism. The tourism
sector has the potential to benefi t itself by protecting and enhancing the
region's natural assets, whilst contributing to sustainable development
by supporting the economy in regions where traditional activities are
declining, and by initiating good management practices to enhance
the environmental quality of the region.
International cooperation
Water protection in the Baltic Sea region is regulated by several
international conventions ratifi ed by the Baltic Sea states. The list of
conventions and agreements can be found in Annex III.
The Baltic Sea region has a history of more than hundred years of
international cooperation. One of the early forms of cooperation in
the Baltic Sea region involved the establishment of the International
Council for the Explorations of the Sea (ICES). The Council was founded
in Copenhagen 1902, as a result of the Stockholm Conference in 1899
and Christiania (Oslo) Conference in 1901. The council was entrusted
with the task of carrying out a programme of international investigation
of the sea. Today ICES is one of the main organisations coordinating and
promoting marine research in the North Atlantic including adjacent
seas such as the Baltic Sea and North Sea. The organisation constitutes
a focal point for a community of more than 1 600 marine scientists from
Figure 5
Bathing tourists at a beach, K÷pingsvik, Íland, Sweden.
(Photo: S. Ekelund)
19 countries around the North Atlantic. The scientists working through
ICES gather information about the marine ecosystem and carry out
research to investigate key issues.
Tourism is increasingly impacting the environment, especially in the
coastal zone and in areas that are of importance to the local fl ora and
From the 1970s to the mid-1990s, the two most important conventions
fauna, which are naturally attractive to tourists and locals and provide
regulating the protection of the environment and living resources
an amenity for recreation and leisure activities. In the Baltic region
of the Baltic Sea were recognised to be the Convention on Fishing
tourism peaks during the summer months, when its negative impacts
and Conservation of the Living Resources in the Baltic Sea and the
are particularly visible. For example, waste disposal systems are placed
Belts, signed in Gdansk in September 1973 (Gdansk Convention),
under greater stress and coastal habitats are disturbed by the infl ux of
soon followed by the Convention of the Protection of the Marine
visitors. Figure 5 shows bathing tourists at the island of Íland, Sweden.
Environment of the Baltic Sea, signed in Helsinki in March 1974 (Helsinki
Convention).
In the advanced market economies, no major negative environmental or
cultural impact from tourism was observed (Baltic 21 1998a). However, in
The implementing unit for the Gdansk Convention is the International
countries acceded to the EU in 2004, rapidly growing and uncontrolled
Baltic Sea Fishery Commission (IBSFC), which plays a central role in the
tourism has in many cases endangered and ultimately destroyed
management of the Baltic Sea region. Its activities include the gathering,
environmental assets upon which tourism is ironically dependent. A
analysis and dissemination of statistics and the undertaking of scientifi c
common understanding and awareness of the relationship between
research. The IBSFC also makes recommendations for the regulation of
24
GIWA REGIONAL ASSESSMENT 17 BALTIC SEA
fi shing gear and catch sizes, and for the designation of fi shing grounds
In recent years the Baltic Sea regional development has also become
and seasons. Each year, on the basis of recommendations from the
increasingly related to European integration. The EU's environmental
global science community and the ICES, the IBSFC sets total allowable
regulations are increasingly implemented in the old member states
catches (TAC) for the four main commercial species, namely cod,
and recently acceded countries in the Baltic region. Russia's non-
salmon, herring and sprat.
member partnership and cooperation agreement with the European
Commission has also been initiated.
The Helsinki Convention is responsible for the protection of the
Baltic Sea from pollution and also for the assessments of the state
Since 2000 following the adoption of the EU Water Framework Directive,
of the marine environment in the region. The Helsinki Commission
a directive was made on the implementation of water protection in the
(HELCOM), which is responsible for the implementation of the
Baltic Sea states. The aim of the Directive is to maintain and to improve
Convention, coordinates a joint monitoring programme of the Baltic
the aquatic environment in the Community including coastal areas up
Sea. On basis of this programme several assessments on the state of
to 10 nautical miles off shore. Its main focus is on water quality, although
the Baltic Sea and its pollution load were prepared and subsequently
the full implementation of the Water Framework Directive by 2015 will
published in the Baltic Sea Environment Proceedings series. More
also improve the overall environmental quality of the Baltic Sea.
than 150 HELCOM Recommendations have been drawn up and
adopted by the Commission for the protection of the Sea. As a rule,
In March 2003, the Global Environmental Facility (GEF) Baltic Sea
the recommendations were implemented by the Contracting Parties
Regional Project (BSRP) was adopted in collaboration with HELCOM.
through amendment of the requirements of the recommendations to
This project will be executed between 2003 and 2008. In order to
national legislation.
address the needs of an ecosystem-based approach to resource
management; the BSRP was designed under the principles of the
In addition, to implement the objectives of the Helsinki Convention, the
Large Marine Ecosystem (LME) concept, focusing on land-based, coastal
Joint Comprehensive Programme (JCP), was approved in 1992. This action
zone and marine activities. The project includes social and ecosystem
programme established a framework for sustained cooperation among
management tools for decision makers to address transboundary issues
the Contracting Parties to the Convention, other governments within
of the Baltic Sea.
the region, international fi nancial institutions, and non-governmental
organisations, who share a common interest in environmental
protection and natural resources management within the sensitive
Baltic Sea region. The JCP emerged as a direct result of a meeting of
the region's Prime Ministers, and has therefore a particularly high level of
political visibility, which has been complemented by sustained broad-
based public interest and support for its implementation. The action
programme provides an environmental management framework for
the long-term restoration of the ecological balance of the Baltic Sea. It is
to be implemented through a series of phased preventive and curative
actions. The JCP includes all the countries of the drainage basin and was
mandated by the resolution endorsed at the Baltic Sea Environment
Conference held at Ronneby, Sweden in 1990. At this unprecedented
international environmental conference, the participating Heads of
Government, High Political Representatives from the region, senior
representatives of invited international fi nancial institutions (IFIs) and
observers from non-governmental organisations collaborated to create
a "shared vision" for environmental management of the Baltic Sea and
its drainage basin to be implemented through this action programme.
The Helsinki Commission was requested to coordinate the JCP process
with the cooperating parties (HELCOM 1998b).
REGIONAL DEFINITION
25
Assessment
Table 12
Scoring table for the Baltic Sea region.
This section presents the results of the assessment of the impacts
Assessment of GIWA concerns and issues according to
The arrow indicates the likely
of each of the fi ve predefi ned GIWA concerns i.e. Freshwater
scoring criteria (see Methodology chapter)
direction of future changes.
T
T
shortage, Pollution, Habitat and community modifi cation,
C
C
Increased impact
A 0
No known impacts
A 2
Moderate impacts
IMP
IMP
T
T
No changes
C
C
Unsustainable exploitation of fi sh and other living resources,
A 1
Slight impacts
A 3
Severe impacts
IMP
IMP
Decreased impact
Global change, and their constituent issues and the priorities
ts
ts
identifi ed during this process. The evaluation of severity of each
core**
Baltic Sea
ts
ts
issue adheres to a set of predefi ned criteria as provided in the
vironmental
t
her community
v
erall S
chapter describing the GIWA methodology. In this section, the
En
impac
E
c
onomic impac
Health impac
O
impac
O
Priority***
Freshwater shortage
2*
1
1
1
1.3
4
scoring of GIWA concerns and issues is presented in Table 12.
Modification of stream flow
1
Pollution of existing supplies
2
Changes in the water table
1
Pollution
3*
2
2
1
2.1
1
T
C
A
Freshwater shortage
IMP
Microbiological pollution
1
Eutrophication
3
Chemical
2
A fundamental characteristic of the hydrological regime in the Baltic
Suspended solids
1
Sea region is that regional precipitation substantially exceeds regional
Solid wastes
1
Thermal
0
evaporation. In the northern parts of the Baltic Sea region, the average
Radionuclides
1
annual precipitation is about 400 mm and in the southern parts about
Spills
2
700 mm. Overall, the precipitation falling onto the Baltic Sea surface
Habitat and community modification
2*
1
1
1
1.4
3
averages about 620 mm per year (Westing 1989). Taking into account
Loss of ecosystems
1
Modification of ecosystems
2
this level of freshwater availability, the concern of Freshwater shortage
Unsustainable exploitation of fish
2*
2
0
2
1.5
2
was considered to have slight to moderate environmental impacts.
Overexploitation
3
The severity of the concerns is not expected to change before 2020.
Excessive by-catch and discards
1
Furthermore, the concern's transboundary aspects are less signifi cant
Destructive fishing practices
1
Decreased viability of stock
2
compared with the other concerns.
Impact on biological and genetic diversity
2
Global change
0*
1
1
1
1.3
5
There have been some localised problems resulting from changes in the
Changes in hydrological cycle
1
water table and the modifi cation of stream fl ow, although overall these
Sea level change
0
Increased UV-B radiation
0
issues were considered to be of only slight environmental signifi cance at
Changes in ocean CO source/sink function
0
2
present. The Pollution of existing supplies was recognised as the most
*
This value represents an average weighted score of the environmental issues associated to
the concern.
severe Freshwater shortage issue in the region, which was considered
**
This value represents the overall score including environmental, socio-economic and likely
to have moderate impacts.
future impacts.
*** Priority refers to the ranking of GIWA concerns.
26
GIWA REGIONAL ASSESSMENT 17 BALTIC SEA
Environmental impacts
Groundwater
Modifi cation of stream fl ow
overexploitation
Most of the rivers that fl ow into the Baltic Sea have been regulated
Saltwater intrusion
by hydropower dams, which signifi cantly reduce the occurrence of
No data available
fl ooding in springtime, but do not change the annual discharge of
the rivers. Modifi cation of stream fl ow and decrease in the occurrence
Finland
of exceptional discharges due to the construction of dams used for
hydropower is therefore not relevant for the region on an annual
Sweden
Norway
basis. For instance, analysis of the Narva River hydrograph since
the construction of the Narva hydropower plant (Russia) in 1956,
has shown that annual fl ow rate has not changed (Figure 6). This
Russia
Estonia
conclusion is also valid for other rivers regulated by dams in the Baltic
Sea region.
Latvia
Denmark
Lithuania
700
Upstream Vasknarva
Belarus
600
Downstream Narva
Hydropower station
Poland
500
/s)3
Germany
400
(m
Ukraine
off 300
Run- 200
Czech Republic
ę GIWA 2004
100
Figure 7
Overexploitation of groundwater resources and
0
1950
1960
1970
1980
1990
saltwater intrusion in the Baltic Sea region.
Year
(Source: EEA 1995)
Figure 6
The annual fl ow rate of the Narva River before and after
construction of the dam in 1956.
(Source: EMHI 2000)
Changes in the water table
Changes in the water table are determined by the level of exploitation
However, the natural annual variation in fl ow rates has altered
of groundwater resources. This issue was assessed to be of slight
signifi cantly in some rivers but it is diffi
cult to generalise about the
environmental importance in the Baltic Sea region, as in general
impact of human activities on fl ow regime (EEA 1995). Other indicators
groundwater supplies are not overexploited. However, changes in
of changes in stream fl ow such as decreasing trends in annual river
the water table have been more noticeable in certain locations where
fl ows, declines in the extent of wetlands and changes in the mean
freshwater demand is high, for example in region close to large urban
salinity of estuaries or coastal lagoons have not been registered. In
areas (Figure 7) (EEA 1995).
addition, the issue of modifi cation of stream fl ow was not considered
to be of transboundary relevance in the Baltic Sea region.
Socio-economic impacts
The economic impacts of Freshwater shortage were considered
Pollution of existing supplies
to be slight, as although in general freshwater availability is not a
The pollution of existing supplies was assessed having moderate
limiting factor for economic activities, in some areas it may have a
impacts in the region. According to the European Environment Agency
slight influence on municipal water supply and industrial activities.
(EEA 1995), the quality of most rivers discharging into the Baltic Sea
There may be increased costs from finding alternative water supplies,
is fair (moderate organic pollution and nutrient content) or poor
deepening wells, increased pumping, and from intake treatment. At
(heavy organic pollution, low oxygen concentration, sediment locally
the same time, however, the reduction of groundwater abstraction
anaerobic). In addition, the overexploitation of groundwater in densely
in some regions (Tallinn, Riga, Vilnius) has caused the water level
populated coastal areas of the Baltic Sea has caused saltwater intrusion
to rise (EEA 1995), which might lead to a reduction in water supply
in aquifers, which may aff ect drinking water quality (Figure 7).
costs.
ASSESSMENT
27
The health impacts were also considered to be slight in the Baltic
Conclusions and future outlook
Sea region, as there is some concern for human health regarding the
Freshwater shortage is not considered to be an urgent problem
pollution of drinking water by point and non-point sources. The surface
for the Baltic Sea region and was considered having a slight overall
water does not meet WHO drinking water standards in rivers/streams
impact. There are some problems with the pollution of existing
draining more than 30% of the catchment area (EEA 1995). The level of
supplies, which justifi ed the overall environmental impact of the
chemical contamination and the quality of drinking water is dependent
concern being assessed as moderate. In the future, taking into
on many factors, including the quality of raw water, the extent and type
account the implementation of the Water Framework Directive by
of treatment, and the materials and integrity of the distribution system.
the Baltic Sea region countries (except Russia), an improvement in
However, there is no information available on the risks of this poor water
the quality of freshwater is expected, or at least there will be no
quality on human health in the region.
change in the concern's level of impact in the future. A reduction in
water consumption has been recorded in the transitional countries
Other social and community impacts were considered slight in the
in recent years (Baltic Environmental Forum 2000), which will reduce
region. The people who are mostly aff ected by freshwater shortage
the pressure on freshwater supplies. The same development was
are those who live in densely populated areas and in areas with
observed in the market economy countries in the mid-1970s during
intensive agriculture where water demand is high. In addition nitrogen
the energy crisis.
compounds may contaminate the groundwater in agricultural regions.
Monitoring data supplied by the countries of the region on nitrates
in groundwater is very heterogeneous. The nitrate concentrations in
T
C
A
the Baltic Sea catchment area only exceed the maximum admissible
Pollution
IMP
concentration (50 mg NO /l) of water for human consumption in
3
specifi c locations (Figure 8) (EEA 1995).
The marine ecosystem of the Baltic Sea is particularly vulnerable to
pollution, due to the limited exchange of its water and because of
the run-off from a catchment area containing 85 million people. Over
Ranking of the risks
Leaching more than
the past 10 to 20 years, water pollution in the Baltic Sea region has
50 mg nitrate/l
not increased signifi cantly and has even decreased in certain areas
High aquifer risk
Low to medium
(HELCOM 2003a). However, pollution remains prevalent, particularly
aquifer risk
Leaching less than
euthrophication which is depleting bottom waters of oxygen, oil spills
50 mg nitrate/l
Estimates not made for
from ships that are threatening birds and mammals, and the persistence
these areas (includes
montaneous areas,
forests and areas
of hazardous pollutants that are harming animals and humans alike.
outside the study area)
Finland
The overall impact of Pollution was assessed as being moderate in the
Norway
Baltic Sea region. The most alarming issues were eutrophication, which
Sweden
Russia
was considered to have a severe impact, and chemical pollution and
Estonia
spills that are having a moderate impact. Microbiological pollution,
suspended solids and solid waste were considered to have a slight
Latvia
Denmark
impact on the Baltic Sea region.
Lithuania
Thermal pollution was considered to have no known impact in the
Belarus
region and is therefore not further discussed. The discharge of cooling
Germany
water from nuclear power plants and certain large industries has
Poland
been observed but these were of local nature with no large-scale
Ukraine
environmental eff ects. The assessment of the state of the Baltic Sea
Czech Republic
ę GIWA 2004
(HELCOM 2002) did not deem this issue to be of suffi
cient importance
Figure 8
The nitrate hot spots for groundwater.
in the Baltic Sea to be studied.
(Source: EEA 1995)
28
GIWA REGIONAL ASSESSMENT 17 BALTIC SEA
Environmental impacts
In the western Gotland Basin, oxygen concentrations have fallen since
Microbiological
1993 due to increased stratifi cation of the water column, resulting in
Microbiological pollution was assessed as having a slight impact, as it has
the lowest oxygen content since the mid-1980s. At the end of 1998,
caused mainly local problems and only aff ected recreational activities.
anoxic conditions prevailed, which initiated denitrifi cation, thus causing
During the last decade, the construction of biological wastewater
nitrogen to escape from the sea into the air. It also caused phosphate
treatment plants in the coastal and catchment areas of the Baltic Sea
to be released from the seabed causing phosphate concentrations to
has reduced the concentrations of microbes in wastewater. Nearly all of
increase. In the Gulf of Finland, enhanced stratifi cation during 1994-1998
the beaches along southeastern coast of the Baltic Sea that were closed
caused a rapid decline in deeper-layer oxygen conditions. The mean
in the late 1980s due to the abnormal microbiological conditions were
oxygen concentration in the near-bottom layer during the period 1994-
re-opened in the mid-1990s (HELCOM 1993b, HELCOM 1996a). In the
1998 was less than the mean for the previous period 1989-1993 and
older EU countries, the problem was resolved much earlier. From the
close to that in the period 1979-1983. In the summer of 1996, extensive
late 1980s, the countries in transition began to construct biological and
anoxia occurred at the sediment-water interface in the eastern Gulf of
biochemical wastewater treatment plants, which became operational
Finland resulting in phosphate release from the sediment in quantities
by the mid-1990s. The most important treatment plants are located
that almost equalled the total annual riverine load. This additional
in Tallinn, Riga, Vilnius, Kaunas, Gdansk and Gdynia. The treatment
nutrient supply then became available to the phytoplankton growth
effi
ciency and the amount of treated wastewater in for example
cycle (HELCOM 2002).
St. Petersburg increased signifi cantly, and the discharge of untreated
wastewater has been reduced from 3.2 to 1.42 million m3/day (Lńńne
In 1993 and 1994 the infl ows of oxygen-rich salt water adversely
et al. 2002). Moreover, many small coastal municipalities no longer
aff ected the benthic communities throughout the open sea areas of
discharge untreated wastewater into the Baltic Sea.
the Baltic Proper and the western Gulf of Finland, manifested as short-
term increases in biomass and abundance. The subsequent stagnation
Eutrophication
and hypoxic sediments resulted in considerable decimation of the
Eutrophication was considered to have a severe impact in the Baltic
macrozoobenthos, and in some cases even caused extinction. However,
Sea region. Large quantities of nutrients are entering the Sea via rivers,
none of the changes in the open sea benthic conditions could be linked
coastal run-off and airborne depositions. The issue will be further
to changes in the prevalence of eutrophication (HELCOM 2002).
discussed in the Causal chain analysis.
The second feature is increased occurrence of harmful algal
The process of eutrophication can be explained as a state where
blooms. Algal blooms are naturally occurring phenomena. Due to
concentrations of inorganic nutrients become so high that they lead
eutrophication, however, mass occurrences of microscopic algae
to excessive production of plants and algae. Eutrophication caused
have increased both in frequency and intensity (HELCOM 2002).
by anthropogenic activities is particularly evident in areas with limited
These included not only cyanobacterial blooms, but also blooms
water exchange such as the Baltic Sea. Nitrogen and phosphorus
of dinofl agellates such as Scrippsiella hangoei, Heterocapsa triquetra,
are the predominant nutrients in the Sea causing euthrophication.
Prorocentrum minimum and Gymnodinium mikimotoi, which caused
Nutrient enrichment results in higher primary production of algae in
reddish discoloration of the water. Dinofl agellate blooms were usually
the surface layers and on the shore, followed by higher secondary
relatively short in duration and occurred in all parts of the Baltic Sea
production. Excessive enrichment may result in large algal blooms.
region in summer and early autumn. The algal blooms, especially those
The eutrophication phenomena can aff ect human health and the
formed by cyanobacteria like Nodularia spumigena, can also be toxic,
recreational amenity of marine coastal areas.
and thus represent a potential health risk for humans and animals. High
biomass blooms also form an aesthetic problem with possible eff ects
The three main symptoms of eutrophication in the Baltic Sea region
on tourism (HELCOM 2003a). A secondary eff ect of a bloom is that it
are hypoxic conditions in deepwater over widespread areas, increased
causes mortality of benthic fauna and depletes oxygen concentrations
occurrence of harmful algal blooms, and signifi cant biological changes
when a bloom collapses.
in the littoral communities (HELCOM 2002). Hypoxic conditions found
in deep water between 1996 and 1998 were characterised by repeated
Chemical
changes in the redox regime at the seabed and the formation of
Chemical pollution was considered to have a moderate impact instead
hydrogen sulphide, causing an alternating distribution of nutrients.
of severe, based on fi ndings that indicate a steady decrease in the
ASSESSMENT
29
concentrations of organochlorine compounds throughout the Baltic
cadmium. Between 1991 and 1994, the yearly mean deposition of
Sea region over the past 30 years.
lead and cadmium to the Baltic Sea was 600 and 25 tonnes per year,
respectively (HELCOM 2003a). Due to the lack of data, an accurate
The concentration of metals and organic pollutants has been
assessment of the impacts from heavy metals and persistent organic
investigated in sediment and biota samples throughout the Baltic Sea.
matter could not be undertaken.
Of the metals studied in the biota (cadmium, copper, lead, arsenic,
mercury and zinc), only cadmium exhibited systematic spatial variation,
Suspended solids
with the highest concentrations being found in the southern Bothnia
The impact of suspended solids was considered slight. The quantity
Sea and in the Baltic Proper (HELCOM 2002). With the other metals, local
of suspended sediments has increased due to a proliferation of
variation is observed that is probably related to urban activities, but this
phytoplankton in eutrophicated areas and increased coastal erosion
is generally less than one order of magnitude. Sediment concentrations
in the southern and eastern Baltic Sea. Since hydropower plants have
of mercury were highest in the Bay of Bothnia and the eastern Gulf of
moderated the annual peaks in stream fl ow, the annual cycle in the
Finland, while concentrations of cadmium, zinc and copper were highest
supply of suspended solids to the sea has also been aff ected. However,
in the central basin of the Baltic Sea. High concentrations of metals in
this issue was considered to be of minor importance in the region, and
sediments were only recorded in the Bay of Bothnia. Lead seems to be
as a consequence, it has been given little attention in previous reports
evenly distributed throughout the region (HELCOM 2002).
(Melvasalo et al. 1981, HELCOM 1987a, HELCOM 1990, HELCOM 1996b,
HELCOM 2002).
Concentrations of dioxins in herring and salmon vary regionally. The
most contaminated fi sh are found in the northern part of the Baltic,
Solid wastes
including herring in the Bothnian Sea, and salmon in the Bothnian Bay
The amount of litter on beaches and the damage caused to fi shing nets
(HELCOM 2004b). Transfer of dioxins up the marine food chain can
by solid waste were used as indicators when making this assessment.
be observed in fi sh eating birds and their eggs. The concentrations
The litter comes from a variety of sources. For example, litter from ships
of dioxins in guillemots eggs have decreased to one third of their
and vessels includes normal household waste, cargo holds, discarded
1970-levels. These concentrations decreased rapidly until the
fi shing equipment, and medical and sanitary articles, while litter from
mid-1980s, but have since remained at roughly the same level. Dioxin
tourists includes plastic bags, bottles and cans. The proportion of
concentrations in sediments peaked in the 1970s, but have began to
waste that is plastic material has increased sharply in recent decades,
decrease recently (HELCOM 2004b).
accounting for more than 90% of the total waste volume, causing
signifi cant environmental problems. In Poland for example, the annual
The health conditions for many birds of prey and mammals have
coastal beach clean collected 50 to 100 m3 of waste (HELCOM 2002).
improved but some species still struggle with reproductive problems.
However, the infl uence of solid waste on the Baltic Sea is slight because
The concentrations of dioxins and PCBs seem to have remained stable
beaches and tourists areas are regularly cleaned and the amount of litter
during the 1990s, indicating that the substances are still released to
from ships is minor.
the Baltic Sea. The concentrations of most heavy metals monitored
in mussels, fi sh and bird eggs have decreased or remained stable
Radionuclides
(HELCOM 2001). An exception is cadmium where the concentration has
Minor releases of radionuclides were recorded in the region, but under
increased in fi sh from the Baltic Sea during the 1990s. The reason for
well-regulated conditions and in compliance with the Radiological
this increase is unclear (HELCOM 2001). Despite of the implementation
Basic Safety Standards. However, the impact of radionuclide pollution is
of the HELCOM Recommendations to reduce discharges of pollutants
considered slight, because there remains a small element of risk that an
into the Baltic Sea, there are indications that chlorinated compounds
accident may occur. The majority of artifi cial radionuclides found in the
and other toxicants such as pesticides and PCB/PCT are still released
Baltic Sea originate from the fallout following the Chernobyl accident in
into the environment.
Ukraine, April 1986. The second most important source of radionuclides
is the fallout from atmospheric weapon tests during the 1960s. The least
Data about water-borne discharges and atmospheric deposition
signifi cant source of artifi cial radionuclides is the operational discharges
of heavy metals is not as reliable as that for nutrients, and may
from the eight nuclear power plants within the drainage area of the
be considered as only rough estimates. Reasonable deposition
Baltic Sea region (HELCOM 1995, HELCOM 2002).
calculations are only available for lead, and only tentatively for
30
GIWA REGIONAL ASSESSMENT 17 BALTIC SEA
Oil spills
oil tankers and ferries, are transiting the Baltic Sea at any given time.
The impact of oil spills was considered moderate due to the amount
Moreover, the amount of maritime traffi
c is steadily growing (Figure 9).
of illegal spills and accidents at irregular intervals. Oil spills may
The risk of an accident, and subsequently a spill occurring, may increase
occasionally cause high mortality of sea birds, as well as contaminate
due to the high traffi
c volume.
the coastal zone. Oil spills pose a serious threat due to the vulnerability
of the Baltic Sea, which has a long residence time of water and has a
Despite the designation of the Baltic Sea as a "Special Area" under
high risk of an accident due to intensity of sea transportation.
MARPOL 73/78, which prohibits the discharge of oil/oily mixtures from
all ships, many illegal oil discharges are observed in the Baltic Sea. In
More than 500 million tonnes of cargo is transported across the Baltic
addition, accidental oil spills occur, although more rarely but with
Sea each year. Approximately 50 ferries have fi xed routes between the
considerable impact. These oil spills have immediate impacts such as
Baltic ports, and more than 2 000 larger ships, including cargo carriers,
contamination of beaches and seabird mortality, and have also had
Number of ships
Number of ships expected
Point
crossing in 2000
to cross in 2015
Kemi
Lule
1462
1
23 388
31 600
Haraholmen
1104
1176
Oulu
2
34 692
70 100
Skellefte
Raahe
1032
3
46 476
83 700
Kokkola
Ume
4
58 500
105 300
1152
480
5
75 696
121 100
ęrnsk÷ldsvik
Vaasa
6
85 296
136 500
Hńrn÷sand
216
Sundsvall
Mantyluoto
2568
Rauma
Hudiksvall
Iggesund
2664
3408 Hamina
S÷derhamn
Uusikaupunki
2088
Kotka
Primorsk
Naantali
Sk÷ldvik
St.Petersburg
Gńvle
2520
Turku
Helsinki
14544
5280
1152
3912
2280
Oslo
2
Muuga 3600
1
Tallinn 5160
Paldiski
Stockholm
1488
744
Nynńshamn
552
3
3384
Arendal
Brofjorden
528
8064
3312
Gothenburg
Ventspils
Skagen
11016
Riga
6
432
2640
Aalborg
2856
5
Liepaja
Kalmar
5064
Karlshamn
5400
Aarhus
Klaipeda
768
Kalundborg
4488
2760
2784
4
Fredericia
6312
Copenhagen
3168
816
Aabenraa
4032
Kaliningrad
4872
120
Flensburg
Gdynia
2112
Gdansk
Kiel
5280
696
5064
Rostock
Swinoujscie
Lubeck
Figure 9
Number of ships, excluding ferry traffi
c, in the Baltic Sea 2000.
(Source: Rytk÷nen et al. 2002)
ASSESSMENT
31
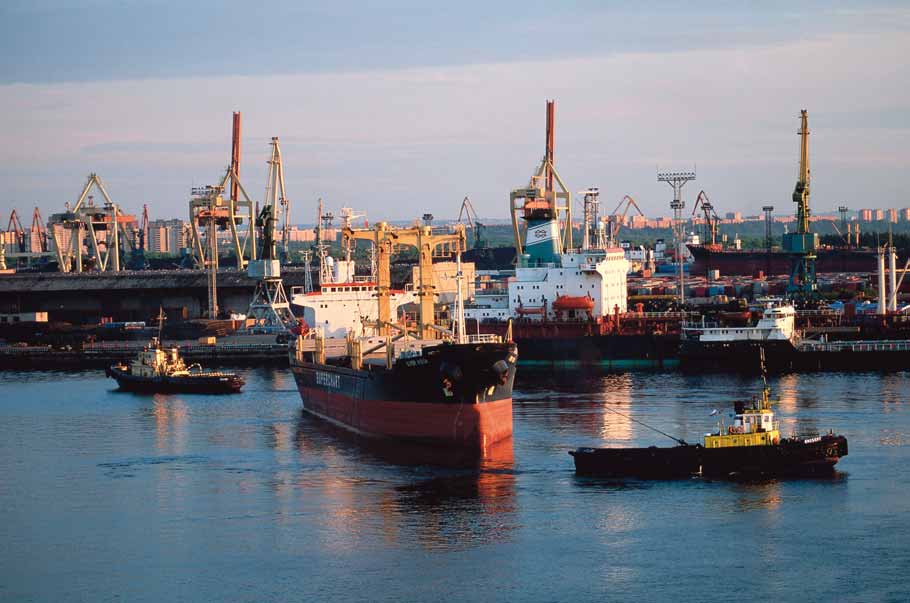
Figure 10 St. Petersburg commercial seaport, at the mouth of the Neva River.
(Photo: Corbis)
long-term eff ects, for example, increased concentrations of petroleum
Socio-economic impacts
hydrocarbons (PHC) in sediments. Statistically, the number of oil spill
Pollution was considered to have a moderate economic impact in
accidents in the Baltic Sea is estimated to be 2.9 per year (HELCOM
the region. This is attributed to the higher transportation costs of raw
1996b). A risk assessment indicates that the statistical number of oil spill
water and additional expenses for water treatment. Moreover, the
accidents will rise to 3.2 if the present oil terminal capacities are fully
costs of preventive measures and of cleaning intakes were considered
utilised, and to 4.9 accidents per year if plans to construct new terminals
to increase moderately, while costs regarding tourism and recreational
and to enlarge existing terminals are implemented, and the terminals
values were expected to fall moderately. Eutrophication, chemical
are fully utilised. As a consequence, the predicted amount of oil spilled
pollution and spills have some eff ect on fi sh mortality but it is diffi
cult
annually will increase to 775 tonnes and 1 475 tonnes, respectively
to accurately assess the economic impact on the fi sheries associated
(HELCOM 2002). Between 1969 to 1995, about 40 major oil spills of more
with pollution.
than 100 tonnes were registered in the Baltic Sea region. However, this
is not entirely surprising for an area where 7 000 voyages involving
Health impacts of pollution in the Baltic Sea region were assessed
the transport of oil take place annually. The number of accidents may
as moderate. Pollution such as hazardous substances, heavy metals
rise during the next decade as the sea-borne oil transport is expected
and nitrogen compounds cause diff erent health problems such as
to increase from its current level of 77 to 177 million tonnes per year
allergies, poisonings, chronic infl ammations, infectious diseases. Due
(HELCOM 2002). Figure 10 shows the St. Petersburg commercial seaport,
to the advanced water treatment processes, epidemics or infectious
which following the collapse of the Soviet Union became one of the
diseases are no longer a problem in the Baltic Sea catchment area.
busiest among the newly independent countries and Baltic states.
Discharges of untreated wastewater in the market economy countries
are practically non-existent, whereas in the countries in transition the
32
GIWA REGIONAL ASSESSMENT 17 BALTIC SEA
percentage is between 7 to 19% except in certain areas in Russia where
Environmental impacts
the fi gure can be as high as 37% (Lńńne et al. 2002). Some problems
Modifi cation of ecosystems or ecotones
have also been recorded in the countryside where the nitrogen
Approximately 90% of the marine and coastal biotopes in the Baltic
concentration or microbiological pollution in local shallow wells
Sea are to some degree threatened, either by loss of area or reduction
sometimes exceeds the maximum admissible concentrations (see
in quality (HELCOM 2001, 1998c). According to HELCOM (1998c), 88%
Figure 8 above). The infl uence of the toxic algal blooms to the public
of the identifi ed 133 marine biotopes and 13 biotope complexes are
is local and very limited. Possible health risks arise from consuming
exposed to some kind of threat (e.g. eutrophication, contamination,
contaminated fi sh. However, the implementation of the EU Directives
fi shery or settlements) and are regarded as endangered or heavily
will limit the use of fi sh with high dioxin levels, which will reduce the
endangered. In 1998, HELCOM compiled a status report on biotopes
potential health impacts.
and biotope complexes in the HELCOM area (HELCOM 1998c), including
a classifi cation system for Baltic coastal and marine biotopes. Of the
Pollution was considered to have only a slight eff ect on other social
66 pelagic and benthic marine biotopes described in the report,
and community Impacts. The point and diff use (agriculture) sources
2 biotopes were classifi ed as heavily endangered, 58 as endangered,
were considered to aff ect the water quality, which in turn aff ects the
4 as potentially endangered, and 2 had no data available. This indicates
use of water for diff erent purposes. Furthermore, the use of nature for
a considerable pressure on the Baltic Sea habitats. Marine habitats are
recreational value may be aff ected as a consequence of pollution such
mainly aff ected by human settlements, pollution and construction
as oil spills and eutrophication.
along the coastline. The main reasons for the modifi cation of
ecosystems were considered to be related to agricultural, municipal
Conclusions and future outlook
and industrial discharges, dredging and excavation of peat and gravel,
The overall environmental impact of Pollution is presently severe.
construction of ports, as well as tourism.
Over the next 20 years, environmental impacts from pollution were
predicted to reduce only to moderate despite improved regulations
Wetlands, the peat bogs and marshlands were considered to be the
and the implementation of internationally adopted environmental
most aff ected habitats with a moderate degree of impact. The peat
protection measures such as the EU Water Framework Directives and
bogs have been subject to extraction and drainage especially in the
HELCOM Recommendations. The signifi cant reduction in the discharge
northern and eastern Baltic Sea. The marshlands on the other hand
of hazardous and biogenic substances at the end of the 20th century
have been aff ected mostly in the southern parts of the Baltic Sea,
was an important step towards reducing the pollution load of the Baltic
despite attempts to restore these habitats. Other habitats have been
Sea. However, signifi cant improvements in water quality may take a long
impacted to varying degrees. Littoral belts alongside lakes and ponds
time, due to the slow water exchange and the accumulation of large
are severely aff ected in the southern Baltic, but only slightly in the
quantities of pollutants in the Baltic Sea.
northern regions. In running water wetlands (tidal rivers are excluded),
drainage and agricultural activity have been the predominant causes
of habitat modifi cation. The impact on them was considered slight,
although impacts were greatest in the southern regions. There are no
T
C
A
Habitat and community
IMP
known impacts on saline wetlands.
modification
Open or running waters (fast fl owing, stony bottomed, and sandy/
The GIWA concern of Habitat and community modifi cation consists
muddy fl ood plain rivers) have been aff ected by pollution and the
of two environmental issues: loss of ecosystems or ecotones and
construction of dams. Standing waters have also been aff ected to a
the modifi cation of ecosystems or ecotones, including community
certain extent, as lakes and ponds have been enriched with nutrients
structure and/or species composition. Loss of ecosystem or ecotones
from agricultural activities (diff used discharges) and discharges from
was considered to be slight in the Baltic Sea region and as the two issues
point sources (municipal and industrial discharges). The subsequent
are closely connected, the assessment of this concern will only focus
changes in the trophic status aff ect the fl ora and fauna of the
on the modifi cation of ecosystems or ecotones, which was considered
impacted areas. The damming of rivers has changed the hydrological
to be of moderate impact.
regime necessary for salmon to reproduce and caused a decline in
their populations (HELCOM 2001). In compensation for these losses,
hatcheries have been built to sustain wild salmon stocks. This has
ASSESSMENT
33
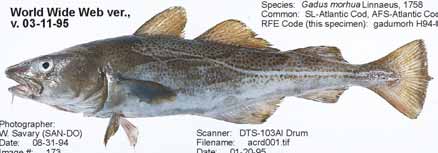
led to the loss of distinct populations and a decline in overall genetic
Conclusions and future outlook
variability. Recent estimates indicate that wild salmon reproduction has
Improvements are occurring due to EU, HELCOM, and NGO activities
increased, although yields of juvenile wild salmon in certain rivers are
and the implementation of environmental protection legislation as
still alarmingly low (HELCOM 2003a).
well as diff erent projects, for example the Baltic Sea Regional project
(HELCOM 2003b). Freshwater habitats are generally believed to react
The coastal marine ecotones have experienced slight to moderate
more quickly to changes than the larger marine habitats, as they are
impacts. Sandy foreshores (including dunes) are comparatively
smaller water bodies and have faster water turnover times. Greater
sensitive to anthropogenic infl uences and have been moderately
public awareness of the impact of human activities on sensitive habitats
aff ected by tourism, pollution and construction. Lagoons and estuaries
is needed, although in many instances it may be too late to rehabilitate
were also considered to have had moderate impacts. Lagoons are
the modifi ed ecosystems.
threatened by pollution, urbanisation, industry, agriculture and
dredging, while estuaries suff er from land-based pollution and
construction activities, e.g. harbours. Other habitats considered to be
under slight impact in the Baltic Sea region were muddy
foreshores and rocky foreshores. Muddy foreshores
have been aff ected by dredging, whereas the rocky
foreshores have been impacted by the construction of
harbours (for example in Sweden and Finland).
Other benthic marine habitats that have been seriously aff ected are
Figure 11 Cod
(Gadus morhua).
(Photo: W. Savary, Regulatory Fish Encyclopedia)
seagrass and fucus meadows, which have experienced moderate
impacts from pollution. Sandy and gravel extraction has had a slight
T
C
A
impact on nearby ecosystems. There are no known impacts on
Unsustainable exploitation of
IMP
mud bottoms, as they suff ered from oxygen depletion even before
fish and other living resources
industrialisation. Pelagic habitats (above and below the halocline)
have been slightly impacted by changes in light above the halocline
The overall environmental impact of unsustainable exploitation of
and from oxygen depletion below the halocline.
fi sh and other living resources in the Baltic Sea region was assessed
as moderate. Overexploitation was considered severe; average annual
Socio-economic impacts
landings of the most important commercial species (for example cod
Generally, the economic impacts of habitat and community
Figure 11) have decreased two-fold, between the 1980s and 1990s.
modifi cation were considered slight in relation to human needs
Since the mid-1800s close to 100 non-indigenous species have been
for aesthetic and recreational values. The loss and modifi cation of
introduced to the Sea as well as escapes from fi sh farms and the
ecosystems and ecotones will have serious economic impacts in the
uncontrolled restocking of salmon have altered the composition of
future, and considerable investment is needed in order to rehabilitate
ecosystems and aff ected genetic biodiversity. There has also been
modifi ed habitats. The economic impact of this concern will therefore
decreased viability of stocks in the region due to pollution and diseases,
increase from slight to moderate in the future.
for example the recently discovered mouth disease on pike, crayfi sh
disease in Sweden and salmon M-74 disease. There is expected to be a
There have been slight health as well as other social and community
slight improvement in the future due to the implementation of fi shing
impacts associated with the loss and modifi cation of habitats. The
regulations.
capacity for the ecosystems to meet human food demand has been
reduced and the degraded environment has caused health risks for
Environmental impacts
the local population. In the future, the situation will improve slightly
Overexploitation
but because of a low level of confi dence, there are no reasons to lower
The impact of overexploitation in the Baltic Sea region was considered
the assessed impact degree.
severe and was chosen for further analysis by the GIWA Task team. For
more information and data please refer to the causal chain analysis
section.
34
GIWA REGIONAL ASSESSMENT 17 BALTIC SEA
Total average annual landings of the most important commercial
Excessive by-catch and discards
species in the Baltic Sea region have decreased two-fold between the
The total by-catch of fi sh in the Baltic Sea is unknown, as no quantitative
1980s and 1990s. Cod landings have become 3.5 times smaller over
estimates are currently available. However, in some coastal fi sheries
the same period (ICES 1994, 1999, Baltic 21 1998b). Figure 12 shows
there may be very high rates of by-catch, such as in the roe fi shery
the changes in landings and mortality of cod, and Figure 13 represents
(Vendace, Coregonus alba). As a result of these discards, the abundance
recruitment and spawning stock biomass. Major infl ows of saline North
of organic matter may increase, which in turn may contribute to the
Sea water before 1976 led to the highest cod spawning stock biomass
depletion of oxygen in bottom waters (HELCOM 2002).
in 1980-1985 (Baltic 21 2000). Total lack of infl ow in 1980-1992 and only
one major infl ow in 1993 caused a stagantion period in Baltic deep
By-catch of Harbour porpoises (Phocoena phocoena) has been estimated
water and poor recruitment. A minor decrease in eastern cod landings
to amount to a few percentages of the population in the Danish and
in 1994-1996 (when the salinity increased) was followed by a general
German waters, although this fi gure is believed to be underestimated.
decline since 1997. Total landings of cod in 2000 were estimated to
Seals mortality as a result of being caught as by-catches does not seem
be 66 000 tonnes (Walday & Kroglund 2002). The stocks have been
to have threatened their populations since their numbers are increasing
highly exploited beyond the levels advised by the ICES. There has
(HELCOM 2002). Based on these fi ndings the infl uence of this issue was
not been a reduction in fl eet capacity or fi shing eff ort in response to
assessed to be slight in the region.
the overexploitation, and fi sh mortality has increased as stocks have
declined (Baltic 21 1998b).
Destructive fi shing practices
Some seabeds in the region exposed to trawling recover quickly while
The lack of accurate data for fi sh landings and an overassessment of
some have a longer recovery time (Baltic 21 1998b). Trawling in shallow
resources has led to exploitation beyond the region's biological limits. This
areas is prohibited, but it is unknown to what extent it does continue.
was recognised in the Agenda 21 for the Baltic Sea Region, as the main
However, relatively few fi shers employ illegal fi shing techniques and
cause for the overfi shing of cod, and is also considered a major factor in the
beam trawling, so this issue was considered to have a slight impact.
depletion of other commercial fi sh stocks in the Baltic Sea region.
Decreased viability of stock through pollution and disease
60 000
2.0
Evidence has been found of decreased viability of stocks in the Baltic
Fish mortality
1.8
Sea ecosystem caused by pollution and diseases (Walday & Kroglund
50 000
1.6
2002). The presence of pollution such as eutrophication and toxic
1.4
40 000
1.2
contaminants may not only spread diseases but also infl uence species
(tonnes)
(proportion)
30 000
1.0
composition, reproduction biology and migratory habits. Examples of
0.8
20 000
0.6
diseases include the recently discovered mouth disease on pike, crayfi sh
Landings
0.4
10 000
disease in Sweden, salmon M-74 disease, and diseases in eel and fl atfi sh,
0.2
0
from which the eel is yet to recover. The stocks of the naturally spawning
0
1970
1971
1972
1973
1974
1975
1976
1977
1978
1979
1980
1981
1982
1983
1984
1985
1986
1987
1988
1989
1990
1991
1992
1993
1994
1995
1996
1997
1998
salmon (Figure 14) have been signifi cantly depleted after the appearance
Year
of the M-74 syndrome in Swedish and Finnish rivers, which was fi rst
Figure 12 Landings and mortality of cod age 1.
observed in 1974. In the 1970s-1980s the M-74 mortality was about
(Source: Baltic 21 2000)
15-30 %, but it increased to 60-80% in 1992-1996 and has decreased since
Spawning stock biomass
900
800 000
1997 to levels between 15% (1998) and 40% in 1999 (Karlstr÷m n/d).
800
700 000
700
600 000
(million) 600
500 000
In 1996 production of wild smolt was very limited as a result of disease,
500
400 000
with the smallest stocks at risk of extinction. However, the situation
400
300 000
300
has improved considerably in recent years. The viral lymphocystis
200 000
200
(tonnes)
disease was prevalent in 5 to 38% of fl ounder larger than 20 cm, with
100
100 000
Recruitment, age 1
0
0
a decreasing spatial trend from the western to eastern parts of the
1966 1967 1968 1969 1970 1971 1972 1973 1974 1975 1976 1977 1978 1979 1980 1981 1982 1983 1984 1985 1986 1987 1988 1989 1990 1991 1992 1993 1994 1995 1996 1997 1998 1999
Baltic Sea (HELCOM 1996b). The most externally visible disease of Baltic
Year
cod is the bacterial skin ulcer, which has been found on between 15%
Figure 13 Recruitment and spawning stock biomass of cod age 2.
(Source: Baltic 21 2000)
and 40% of the cod. Its prevalence decreased from the 1980s to 1990s
ASSESSMENT
35
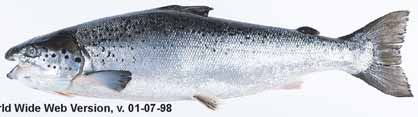
2002). Since 1990, 10 new species have been introduced
into the Baltic (Walday & Kroglund 2002). However, it should
be noted that these new species have been introduced
relatively slowly, and to date, the Baltic system does not
appear to be signifi cantly impacted.
Figure 14 Salmon
(Salmo salar).
(Photo: W. Savary, Regulatory Fish Encyclopedia)
Socio-economic impacts
The economic and other social and community impacts of the
(HELCOM 1996a), but according to recent studies (HELCOM 2002), a high
unsustainable exploitation of fi sh and other living resources was
prevalence of acute skin ulceration in Baltic cod has been observed
considered as moderate. Although in some areas it is more severe, for
in the last few years. There is concern that this disease may cause
example in countries where the fi sheries has greater signifi cance for the
mortality and thus deplete stocks, and may also reduce the fi tness and
national economy like Poland (EU Enlargement 1998) and Kaliningrad,
reproductive potential of surviving cod. Based on these fi ndings the
Russia (Dvornyakov 2000).
GIWA Task team assessed the impact of this issue to be moderate in
the Baltic Sea region.
The fi shing market is aff ected as fi sh landings become more variable and
uncertain. The reduced landings have also increased unemployment
Impact on biological and genetic diversity
in the fi shing sector, and jeopardised income growth. An economic
Biological and genetic diversity in the Baltic Sea has been aff ected by a
downturn in the fi shing sector may lead to increased demand for
variety of activities. The uncontrolled restocking of salmon and escapes
subsidies and other governmental support. Moreover, stringent
from fi sh farms have altered the composition of ecosystems and aff ected
protection measures to help fi sh stocks recover may in the short-term
genetic diversity. Fishing is recognised to have both direct and indirect
exacerbate the economic impacts (Baltic 21 1998b, FAO 1997).
impacts on biodiversity and has caused a loss of habitats and biotopes
in certain parts of the Baltic. Foremost are the direct eff ects caused by
Increasing unemployment and the loss of fi shermen's livelihoods is a
the removal of fi sh and shellfi sh for landings, and the capture of non-
growing concern especially in the recently EU acceded countries and
target fi sh and shellfi sh and other animals (Baltic 21 1998b). Overfi shing
Russia. For example, the unemployment level in Russian fi shing regions
has altered the ecological balance of many ecosystems in the region;
has been identifi ed to be 1.5 to 3.5 times higher than in other sectors of
key biotopes have been depleted, which has modifi ed predator-prey
the economy (Dvornyakov 2000). Increasing unemployment associated
relationships within the food chain.
with the declining fi shing resource is having social and community
impacts in many communities that have traditionally depended heavily
The introduction of new species into the Baltic Sea ecosystem has
on the fi shing industry.
been another major factor that has impacted on biological and genetic
diversity. Over the past 20 years, a growing number of alien species have
The unsustainable exploitation of living resources was considered as
been released into the Sea, and as ship traffi
c increases, more and more
having no known health impact in the region.
`stowaway species' have arrived
Table 13 Introduced species
(HELCOM 2001). NEMO (Non-
Conclusions and future outlook
to the Baltic Sea.
Indigenous Estuarine and Marine
Fishing activities are aff ecting the species composition and the size
Number of
Taxon
introduced species
Organisms) is an inventory of
distribution of the main target species as well as non-commercial fi sh
alien species, maintained by a
stocks in the Baltic Sea region. The fi shing pressure on the stock is
Fishes
29
group of non-governmental one reason why many young fi sh have been caught before they have
Crustaceans
21
Baltic marine biologists, which
reproduced for the fi rst time. The number of fi sh in the reproductive
Molluscs
13
has recorded that close to
stage is estimated to be far below the sustainable limit. At such low
Polychaeta/oligochaeta
7
100 non-indigenous species levels the stock is unlikely to replenish itself. Despite regulations, fi shing
Phytoplankton
8
have been introduced since the
fl eets continue to overexploit the fi sheries resource in the Baltic Sea.
Macroalgae
7
mid-1800s, including plankton,
Concerning the future a slight improvement is anticipated due the
Mammals
2
invertebrates, fi
sh, birds and
implementation of fi shing regulations, however, cod stocks are not
Others
13
(Source: NEMO 2002)
mammals (Table
13) (NEMO expected to recover in the near future.
36
GIWA REGIONAL ASSESSMENT 17 BALTIC SEA
T
C
A
Global change
IMP
same impact for the future as for the present is appropriate, albeit the
situation is getting slightly worse.
The GIWA assessment considered that there are currently no known
environmental impacts associated with global change, due to there
Conclusions and future outlook
being insuffi
cient data available to make an accurate evaluation.
There is currently insuffi
cient information on the impacts of global
However some changes in the hydrological cycle have been noticed.
changes in the Baltic Sea region, and therefore it was assessed as having
There are no known impacts of increased UV-B radiation as a result of
no known impact. In the future, the economic and health impacts may
ozone depletion, as there is currently a lack of information exploring how
increase slightly, yet these were considered minor compared with many
increased UV-B radiation as a result of ozone depletion has aff ected the
of the other assessed concerns.
Baltic Sea region. There is either no known impact from changes in ocean
CO source/sink function, and an assessment could not be made due to a
2
lack of information. These issues are therefore not further discussed.
Priority concerns for further
Environmental impacts
analysis
Changes in the hydrological cycle (climate change scenarios)
Only slight changes in the hydrological cycle were identifi ed, with
The GIWA concerns were prioritised in the following order:
impacts mainly associated with changes in ice conditions. As a result
1. Pollution
of climate changes, the break-up of ice on rivers is expected to occur
2. Unsustainable exploitation of fi sh and other living resources
earlier, the frequency of saline water entering the Baltic Sea will be
3. Habitat and communtiy modifi cation
reduced, and there will be an increase in the frequency of heavy storms
4. Freshwater
shortage
and fl oods. The sea surface temperature of the Baltic Sea is expected to
5. Global
change
increase by 2-4░C and ice is estimated to be 20-30 cm thinner. Climate
changes are predicted to increase the water fl ow entering the Gulf of
The most alarming issues were found under the two concerns; Pollution
Finland by 2% during the next 20 years which will result in an estimated
and Unsustainable exploitation of fi sh and other living resources. Based
increase of the phosphorus load from non-point sources by 4% and
on the assessment results, the priority issues of eutrophication and
load of total nitrogen by 4% (Pitkńnen et al. 2004).
overexploitation of fi sh were selected for the Causal chain analysis
since these were identifi ed as the most severe transboundary issues
Sea level change
of the Baltic Sea.
It is not known what extent global changes are infl uencing sea level in
the Baltic Sea region, as it is unclear to what extent isostatic movements
Eutrophication has been caused by the excessive input of nutrients;
from the last ice age are infl uencing this issue. In addition the predicted
namely nitrogen and phosphorus. According to the conclusions of
2% increase in water fl ow to the Baltic Sea is not expected to infl uence
the most recent HELCOM periodic assessment of the state of the
sea level (Pitkńnen et al. 2004).
Baltic Sea (HELCOM 2003a), eutrophication remains the most pressing
environmental issue in the Baltic. None of the nine Baltic Sea countries
Socio-economic impacts
have been able to meet the target adopted at the Helsinki Commission
Global changes were assessed to have a slight economic impacts
in 1988; to halve their total nutrient discharges to the Sea. The countries
in the Baltic Sea region under present conditions. Concerning the
acceded to the EU in 2004 have managed to come closer to meeting
future, more serious impacts are expected due to changes in the
this target than the other EU countries, largely due to political and
hydrological cycle, but it is unclear what impact the other issues may
economic changes. However, a substantial reduction in nutrients from
have in the future.
the agricultural sector is still urgently needed (Lńńne et al. 2002).
Health impacts were considered to be slight. Other social and
Although landings of commercially important species have been
community impacts from global changes are connected to certain
stable at between 0.9 to 1 million tonnes per year, this does not mean
groups of people, who are more exposed to these changes than others.
fi sh populations are also stable in the Baltic Sea. Closer analysis of
The degree of these impacts was considered slight. As the confi dence
individual species such as sprat and cod reveal wide fl uctuations in
level is low concerning the other social and community impacts, the
landings, indicating ecological imbalances. As populations of cod
ASSESSMENT
37
are depleted, the number of sprat increases, refl ecting their predator-
prey relationship. Studies of the main target species between 1994
and 1998 indicated that the cod, herring, salmon and eel fi shery
is unsustainable in the Baltic Sea. In order to avoid the collapse of
these stocks, there is a need to allow populations to recover to safe
biological limits. In accordance with HELCOM's working group on
habitats (HELCOMHABITAT) in 2001, sustainable fi shery management
practices need to be designed that meet the needs of the entire Baltic
ecosystem. HELCOM has intensifi ed cooperation with the International
Baltic Sea Fishery Commission (IBSFC), including a joint seminar held in
February 2002 in Gdynia, Poland. The parties agreed at this seminar on
a sustainable fi shery management strategy designed to meet the needs
of the whole ecosystem, and discussed how to address concerns such
as the impact of commercial fi shing on the Baltic food web, excessive
by-catch, and the change in abundance and distribution of non-
commercial fi sh stocks and main targeted fi sh species.
38
GIWA REGIONAL ASSESSMENT 17 BALTIC SEA
Causal chain analysis
This section aims to identify the root causes of the environmental
species as well as non-commercial fi sh stocks. The fi shing pressure
and socio-economic impacts resulting from those issues and
on the stock is one reason why many young fi sh have been caught
concerns that were prioritised during the assessment, so that
before they have reproduced for the fi rst time. The number of fi sh in
appropriate policy interventions can be developed and focused
the reproductive stage is estimated to be far below the sustainable
where they will yield the greatest benefi ts for the region. In order
limit. At such low levels the stock is unlikely to replenish itself. Despite
to achieve this aim, the analysis involves a step-by-step process
regulations, fi shing fl eets continue to overexploit the fi sheries
that identifi es the most important causal links between the
resource in the Baltic Sea. The causal chain diagrams illustrating the
environmental and socio-economic impacts, their immediate
causal links for eutrophication and overexploitation are presented in
causes, the human activities and economic sectors responsible
Figure 15 and 28 respectively.
and, fi nally, the root causes that determine the behaviour of
those sectors. The GIWA Causal chain analysis also recognises
that, within each region, there is often enormous variation in
capacity and great social, cultural, political and environmental
Eutrophication
diversity. In order to ensure that the fi nal outcomes of the GIWA
are viable options for future remediation, the Causal chain
Environmental and socio-economic impacts
analyses of the GIWA adopt relatively simple and practical
Environmental impacts of eutrophication in the Baltic Sea are for
analytical models and focus on specifi c sites within the region.
example:
For further details on the methodology, please refer to the GIWA
Loss of commercial valuable fi sh;
methodology chapter.
Loss of benthic fauna;
Modifi cation of ecosystems and ecotones;
In this section, the root causes of the environmental and socio-
Toxic
algal
blooms;
economic impacts of the prioritised issues and concerns from the
Oxygen
depletion.
assessment are identifi ed. The concerns of Pollution and Unsustainable
exploitation of fi sh and other living resources were selected as having
Examples of socio-economic impacts are:
the most transboudary impacts in the Baltic Sea region. More
Loss of recreational value;
specifi cally, eutrophication and overexploitation were the most severe
Cost of drinking water treatment;
issues under these concerns, which are analysed further in this section.
Infections, diseases and allergies.
In the case of eutrophication, inputs of phosphorus have decreased
considerably in the Baltic Sea following the implementation of
Immediate causes
measures by the Baltic Sea riparian countries. However, eutrophication
Nutrients released into the aquatic environment and deposited from
still remains an urgent problem in most coastal areas. In the other
the atmosphere constitute the immediate causes of eutrophication
prioritised issue, overexploitation, fi shing activities are aff ecting the
in the Baltic Sea region.
species composition and the size distribution of the main target
CAUSAL CHAIN ANALYSIS
39
Impacts
Issues
Immediate causes
Sectors/Activities
Root causes
Environmental:
Eutrophication
Aquatic load of nutrients from
Agriculture
Aquatic nutrient load
intensive agriculture:
Loss of commercial
into the Baltic Sea
Technology
valuable
fish
- Inadequate adoption of modern
Loss of benthic fauna
Urbanisation
agricultural technology
Modification of ecosystems
Governance
and
ecotones
Atmospheric deposition of
- Inadequate integration of environmental
nitrogen
Toxic algal blooms
Energy production
and agricultural practices
Oxygen depletion
Aquatic load of nutrients from
Transport
urbanisation:
Economy
Socio-economic:
- Lack of investment in wastewater
Loss of recreational value
facilities
Cost of drinking water
Urbanisation
treatment
- High urbanisation rate
Infections, diseases and
allergies
Atmospheric deposition from energy
production and transportation:
Population growth and urbanisation
Transport
- Increased sea and road traffic
Governance
- Ineffective laws and regulations to
control emissions
- Lack of adequate transport policy
Figure 15 Causal chain diagram illustrating the causal links for eutrophication.
PLC-4, which also apportioned nutrients to their source. The following
Towns on the coast
Industry on the coast
(61 000 tonnes)
paragraphs are extracts from the PLC-4 Report (HELCOM 2004a).
(15 000 tonnes)
Atmospheric inputs
including shipping
The majority of nutrient losses and discharges into inland surface waters
(230 000 tonnes)
within the Baltic Sea catchment area are related to anthropogenic
activities. In 2000 the discharges from point sources, the losses from
diff use sources (e.g. agriculture, scattered dwellings, stormwater
overfl ows) and natural background losses (natural losses from forest,
wetlands and natural meadows) into inland surface waters within the
Baltic Sea catchment area for total nitrogen and total phosphorus
Rivers including upstream
towns and industry
amounted to 82 2000 tonnes of nitrogen and 41 200 tonnes of
(684 000 tonnes)
phosphorus (Figure 17) (HELCOM 2004a). The major portions of the
total nitrogen losses and discharges (58%) and the total phosphorus
losses and discharges (53%) originated from diff use sources. Natural
Figure 16 Nitrogen inputs to the Baltic Sea in 1995.
background losses and discharges from point sources for nitrogen
(Source: HELCOM 2001)
amounted to 32% and 10% of the total losses and discharges entering
inland surface waters within the Baltic Sea catchment area, respectively.
Aquatic nutrient loads
The corresponding fi gures for phosphorus were 27% and 20%.
The nutrient load entering the Baltic Sea is assessed by the HELCOM
Pollution Load Compilations (PLCs) (HELCOM 1987b, HELCOM 1993a,
The distribution of phosphorus and nitrogen load between the
HELCOM 1998a, HELCOM 2004a). Rivers transport the majority of the
countries of the Helsinki Commission is presented in Figures 18 and 19 ,
nutrients from point and diff use sources to the Baltic Sea (Figure 16).
respectively.
The reports of PLC-2 (HELCOM 1993a), PLC-3 (HELCOM 1998a) and
PLC-4 (HELCOM 2004a) presented the sum nutrient load from point
In 2000, the total riverine nitrogen load entering the Baltic Sea
and diff use sources (from agriculture) that enter the Baltic Sea via rivers
amounted to 706 000 tonnes (420 kg/km2). The bulk (81%) of this
in the drainage basins, including both anthropogenic and natural
load was discharged by monitored rivers, with about 40% of the
(background) contributions. The latest pollution load compilation was
total load originating from the catchment area of the Baltic Proper
40
GIWA REGIONAL ASSESSMENT 17 BALTIC SEA
(HELCOM 2004a). Approximately 75% of the riverine nitrogen load in
Nitrogen:
the Baltic Proper (286 000 tonnes, 525 kg N/km2) was discharged by
822 000 tonnes
Natural background losses
the region's three large rivers: Vistula (117 000 tonnes, 600 kg N/km2),
(259 520 tonnes, 32%)
Oder (53 600 tonnes, 450 kg N/km2) and Nemunas (46 830 tonnes,
480 kg N/km2). The second largest proportion of the total nitrogen
Discharges from point source
(78 640 tonnes, 10%)
load entering the Baltic Sea was 17% or 100 400 tonnes (230 kg N/km2),
and was discharged from the Gulf of Finland catchment area, where the
Losses from diffuse sources
(484 090 tonnes, 58%)
River Neva discharged 52 500 tonnes (195 kg N/km2) (HELCOM 2004a).
Phosphorus:
41 200 tonnes
In 2000, the total riverine phosphorus load entering into the Baltic Sea
Natural background losses
(10 960 tonnes, 27%)
amounted to 31 800 tonnes (19 kg P/km2). The majority (84%) of this
load was discharged by monitored rivers, with up to 50% of the total
Losses from
load or 15 640 tonnes (29 kg P/km2) originating in the catchment area of
diffuse sources
(22 040 tonnes, 53%)
the Baltic Proper (HELCOM 2004a). Approximately 83% of the load fed
Discharges
to the Baltic Proper, was discharged by the region's three large rivers:
from point source
(8 220 tonnes, 20%)
Vistula (7490 tonnes, 39 kg P/km2), Oder (3740 tonnes, 31 kg P/km2) and
Nemunas (1 840 tonnes, 19 kg P/km2). Roughly
Figure 17 Input of nitrogen and phosphorus to the
15% or 4 760 tonnes (11 kg P/km2) of
Baltic Sea region.
the total riverine phosphorus load
(Source: HELCOM 2004a)
Finland
Poland
6 790 tonnes
18 730 tonnes
Latvia
1 470 tonnes
Denmark
1 490 tonnes
Germany
1 200 tonnes
Estonia
1 370 tonnes
Lihuania
780 tonnes
Sweden 6 850 tonnes
Point
Diffuse
Natural
source (tonnes)
source (tonnes)
background (tonnes)
Figure 18 Distribution of total phosphorus load by
country into the Baltic Sea region.
Note: Based on the source-oriented approach.
(Source: HELCOM 2004a).
Sweden
Finland
Poland
175 610 tonnes
146 560 tonnes
229 990 tonnes
Denmark
Latvia
62 240 tonnes
54 070 tonnes
Estonia
Germany
Lihuania
Russia
32 990 tonnes
31 500 tonnes
35 560 tonnes
53 720 tonnes
Point
Diffuse
Natural
source (tonnes)
source (tonnes)
background (tonnes)
Figure 19 Distribution of total nitrogen load by country in the Baltic Sea region.
Note: Based on the source-oriented approach.
(Source: HELCOM 2004a)
CAUSAL CHAIN ANALYSIS
41
fl owing into the Baltic Sea came from the Gulf of Finland catchment area
Sector activities
where the River Neva discharged 2 380 tonnes (9 kg P/km2).
This section discusses the sectors responsible for eutrophication;
namely agriculture, urbanisation, energy production and transport.
The reported total nitrogen and total phosphorus aquatic discharges
entering directly into the Baltic Sea from municipalities, industrial plants
Agriculture
and fi shfarms amounted to 38 900 tonnes for nitrogen and 2 850 tonnes
The main source of nitrogen into the Baltic Sea is agricultural discharges
for phosphorus (HELCOM 2004a). The majority of the total nitrogen
via rivers and is mainly derived from four sources:
and total phosphorus direct discharges were produced by municipal
Soil
cultivation;
wastewater treatment plants (MWWTPs) which accounted for more
Use
of
fertilisers;
than 80% of both total direct nitrogen and total direct phosphorus
Spreading and storing of manure;
discharges. Direct discharges from industry constituted 16% of the
Intensive and uncontrolled agriculture.
total direct nitrogen discharges and 14% of total direct phosphorus
discharges into the Baltic Sea. Direct nitrogen discharges from industry
Uncontrolled and intensive agriculture has led to the excessive release
into the Bothnian Bay and the Bothnian Sea are similar to the direct
of nutrients into the surrounding areas. However, recently agricultural
total nitrogen discharges from MWWTPs. The direct total phosphorus
practices have been reformed considerably, and according to the
discharges from industry to these regions are about 3 times higher than
EU Agri-Environmental Programme, which covers most of the GIWA
the corresponding MWWTP discharges, while the direct discharges
Baltic Sea region, agriculture has become more environmentally
from fi sh farms are insignifi cant.
friendly, although its impact on watercourses is still alarming. The use of
fertilisers is decreasing, and the practise of growing cover crops during
Atmospheric nutrient deposition
the winter is increasing to the target level of 30% of the cultivated
The deposition of nutrients from the atmosphere to the Baltic Sea is
area. Livestock densities have fallen, lower grassland fertilisation has
not directly linked to atmospheric emissions in the Baltic Sea region
rapidly decreased the loss of dissolved phosphorus, and the loss of
but depends largely on transboundary pollutants from adjacent areas.
nitrogen from agricultural areas has also declined. But at the same
The atmpospheric deposition of nitrogen into the Baltic Sea increased
time, increased tillage and the reduction of land set aside is considered
gradually during the 20th century, and was at its highest in the mid-1980s.
to have contributed to a slight increase in particulate phosphorus losses
From 1985 to 1995 the atmospheric deposition was reduced by 10-25%.
(Baltic Environment Forum 2000).
The mean annual deposition of total nitrogen to the Baltic Sea between
1985 and 1995 was 320 000 tonnes/year (HELCOM 1998b). Figure 20 shows
To reduce the unnecessary application of artifi cial and organic
the deposition of nitrogen oxide (NO -N) and ammonia (NH -N) into the
fertilisers for crop production, the Helsinki Commission (HELCOM)
3
4
Baltic Sea in 1998. It should be noted that 12-20% of the overall nitrogen
has established a Working Group on Agriculture (WGA) under the
deposition to the Baltic Sea comes from shipping (HELCOM 2002).
Baltic Sea Joint Comprehensive Environmental Action Programme
(JCP). Similar aims are being pursued in the GEF Baltic Sea Regional
Nitrogen
Ammonia
Project, launched in 2002. The progress on implementing the 1988
Oxide
HELCOM Ministerial Declaration and the HELCOM recommendations
concerning agriculture are discussed in the report "Evaluation of
the implementation of the 1988 Ministerial Declaration regarding
nutrient load reductions in the Baltic Sea catchment area" (Lńńne et
al. 2002). According to this evaluation, between 1988 and 1995 there
was a reduction in the release of nitrogen and phosphorus into the
environment, although there was only a small or negligible decrease
Deposition
of Nitrogen
(mg/m2)
of the latter. In Denmark, Finland, Germany and Sweden, there was no
0-200
recorded decrease in agricultural phosphorus, despite reductions in the
200-400
400-600
use of phosphorus-containing fertilisers. This was due to the historic
600-800
>800
GIWA 2004
accumulation of phosphorus in agricultural land. The estimates show
Figure 20 Deposition of nitrogen oxide (NO -N) and ammonia
3
that the 50% reduction target for nitrogen and phosphorus will only
(NH -N) into the Baltic Sea in 1998.
4
(Source: HELCOM 2002)
be achieved by some of the countries in transition. The achievement
42
GIWA REGIONAL ASSESSMENT 17 BALTIC SEA
of this target is less certain for diff use sources than for point sources,
from municipalities decreased by 30% and 39%, respectively, during
despite various measures designed to reduce inputs into the Sea from
1980-1995 (Lńńne et al. 2002). The 50% reduction target was achieved
agriculture.
by the majority of the Baltic Sea countries for phosphorus, while most
countries did not reach the target for nitrogen. The most substantial
The reduction in the release of nitrogen and phosphorus in the
reductions were achieved by the countries in transition (except Poland
transitional countries can be linked with the sharp decrease in
and Russia) and in Denmark.
agricultural production in Estonia, Latvia and Lithuania, between 1989
and 2000. Land reform, privatisation, the collapse of large collective
The nutrient load reductions achieved in Denmark, Finland, Sweden
farms and market changes for meat and other agricultural products,
and Germany (western part) can be attributed to the implementation
all contributed to the decline in both livestock numbers and use of
of protection measures. In Estonia, Germany (former DDR), Latvia,
mineral fertilisers in these countries. These factors also made the
Lithuania, Poland and Russia, the decreases resulted from economic
distribution of livestock more uniform. Thus, environmental pollution
reforms and the construction or improvement of wastewater treatment
caused by livestock has decreased substantially in these countries (Baltic
plants (Lńńne et al. 2002).
Environmental Forum 2000).
There is expected to be further reductions in nutrient discharges from
Compared with other countries in the Baltic Sea region, livestock density
municipal point sources. The introduction of chemical phosphorus
(animal units per ha of arable land) and use of mineral fertilisers is low in
precipitation, nitrifi
cation-denitrifi
cation processes, and the
Estonia and Latvia. Even though Lithuania has a greater livestock density
enhancement of wastewater treatment will decrease municipal loads in
than the other two Baltic states, the current level is considerably lower
than in countries such as Germany and Denmark. The Baltic States are
160 000
also below the maximum density set out in the EU Directive Concerning
Nitrogen
late 1980
the Production of Water Against Pollution Caused by Nitrates from
120 000
1995
Agricultural Sources (170 kg nitrogen per ha of land or approximately
ear
1.7 animal unit per ha). However, production is expected to increase
80 000
nnes/y
in this region, so the question remains whether the demand for using
T
o
fertilisers will increase or if more sustainable agricultural practices will
40 000
be introduced. Both the EU (in the form of the Common Agriculture
0
Denmark
Est
F
Germ
Lat
Lithuania
P
Russia
S
Programme) and the national EU programmes (which determine the
i
nland
o
w
onia
v
land
eden
ia
an
farming conditions), have a considerable infl uence on this issue. In
y
order to accurately assess the nutrient load of the region there is a
Country
need to develop methods for measuring the quantities of nitrogen
Figure 21 Nitrogen load to water bodies from municipalities
between the late 1980s and 1995.
and phosphorus released from diff use agricultural sources into surface
(Source: Lńńne et al. 2002)
waters.
30 000
Despite the implementation of measures targeted at agriculture, the
Phosphorus
25 000
late 1980
contribution of nutrients from this sector to the Baltic Sea remains an
1995
20 000
immediate cause of the eutrophication in the region. Policy options
ear
concerning agriculture will be discussed in the following section.
15 000
nnes/y
T
o 10 000
Urbanisation
5 000
The discharge of untreated or inadequately treated urban wastewaters
0
Denmark
Est
F
Germ
Lat
Lithuania
P
Russia
S
is another major source of nutrients. The contribution of nutrients
i
nland
o
w
onia
v
land
eden
ia
an
between the late 1980s and 1995 from municipalities located within the
y
Country
catchment area of the Baltic Sea is presented in Figures 21 and 22. Due
Figure 22 Phosphorus load to water bodies from municipalities
to changed nutrient load monitoring methods, more recent data on this
between the late 1980s and 1995.
specifi c item are not available. Nitrogen and phosphorus discharged
(Source: Lńńne et al. 2002)
CAUSAL CHAIN ANALYSIS
43
wastewater. In addition, industrial wastes will be reduced by the further
Table 14 Contribution of the transport sector to NO emissions.
x
introduction of best available technologies, and greater investment in
Total NO emission
Transport sector NO emission
x
x
process technology for wastewater treatment.
Country
Per capita
(tonnes)
(tonnes)
(%)
(tonnes)
Denmark
321 149
162 218
51%
0.031
Despite these improvements in waste managment, there are
Estonia
42 592
15 788
37%
0.01
regions where urban wastewater is still being discharged into water
Finland
308 709
168 499
55%
0.033
bodies without treatment or only partially treated. For example,
Germany
3 82 482
2 282 454
59%
0.027
in St. Petersburg, 30% of wastewaters are discharged without any
Latvia
51 629
31 739
61%
0.013
treatment, and a similar situation exists in the Kaliningrad region
Lithuania
68 957
33 961
49%
0.009
where construction of wastewater treatment plants is still in the
Poland
1 308 424
388 732
30%
0.01
planning phases in the following towns: Kaliningrad, Sovetsk, Neman
Norway
222 100
127 100
57%
0.029
Gvardeisk and others (Lńńne et al. 2002). A comparison of 1995 load
Russia
6 653 453
905 528
14%
0.0006
fi gures with recent data published by HELCOM (HELCOM 2004a)
Sweden
372 704
286 062
72%
0.030
shows a considerable reduction in the nutrient load. However, fi nal
(Source: Reynolds & White 1997)
approval concerning the eff ects of the implementation of the 1988
Ministerial Declaration concerning nutrient load should be completed
by HELCOM.
emissions did not increase proportionally with energy production
(Baltic 21 2000).
Energy production and transport
Energy production and transport realease nitrogen compounds
Table 14 shows the total NO air emissions and the percentage of
x
into the atmosphere, which is later deposited, thus stimulating
transport emissions in the Baltic Sea region. The nitrogen emissions
eutrophication. Both land and marine transport create signifi cant
from transport are between 14 to 72% of the total emissions, depending
amounts of air emissions. The energy consumption and exhaust
to a great extent on transport intensity and industrial emissions
emissions of modern high-speed ships are increasing rapidly.
(Reynolds & White 1997).
According to model calculations, international marine traffi
c was the
second largest source of nitrogen oxide deposition in the Baltic Sea
Root causes
in 1997 (HELCOM 2002).
Root causes for eutrophication can be divided into aquatic nutrient load,
mainly from agricultural activities and urbanisation, and atmospheric
The largest contributor of nitrogen compounds (NO ) to the atmosphere
deposition from increased energy production and transport.
x
originates from the use of fossil fuels in energy production. Energy
production in the Baltic Sea region has increased slightly as indicated
Aquatic nutrient load from intensive agriculture
in Figure 23 although due to more stringent emission standards,
High crop production rates have been achieved through the intensive
application of artifi cial and organic fertilisers. However, a part of nutrients
25 000
from these fertilisers enter surface and groundwaters. The losses are
highly dependent on local geophysical conditions, agricultural practices
20 000
and the technologies employed. The Helsinki Commission, after taking
ear)
J/y
into account the outcomes of the periodic assessments of the state of
(P
15 000
the Baltic Sea and pollution load compilations, remain concerned about
tion
the use of fertilisers despite the reduction between the late 1980s and
oduc 10 000
1995 (Figures 24 and 25) in all of the Baltic Sea countries. The largest
gy pr
reductions were achieved by the countries in transition, but mainly as
Ener
5 000
a result of the economic recession in the early 1990s.
0
1990
1991
1992
1993
1994
1995
1996
1997
Greater production of meat and milk at a minimal cost was achieved
Year
through increasing livestock densities. This has produced vast quantities
Figure 23 Energy production in the Baltic Sea region.
(Source: Baltic 21 2000)
of manure and slurry in production areas. In order to minimise nitrogen
44
GIWA REGIONAL ASSESSMENT 17 BALTIC SEA
Denmark
Germany
Sweden
Russia
Denmark
Germany
Lithuania
Russia
180
Estonia
Lithuania
Norway
Estonia
Sweden
Norway
1.4
Finland
Latvia
Poland
Finland
Latvia
Poland
160
1.2
140
120
1.0
a 100
/
h
0.8
80
Kg
60
0.6
Units/ha
40
0.4
20
0
0.2
1990
1991
1992
1993
1994
1995
1996
Year
0.0
1990
1991
1992
1993
1994
1995
1996
Figure 24 Annually applied nitrogen by mineral fertilisers.
Year
(Source: Baltic 21 2000)
Figure 26 Livestock density in the Baltic Sea countries 1990-1996.
Definition: The livestock density (livestock unit per ha) is an aggregate measure
of the number of animals per ha of arable land. The livestock unit has been
40
calculated by using conversion factors (presented in Appendix to HELCOM
35
Recommendation 13/17) for different animals.
Denmark
Latvia
(Source: Baltic 21 2000)
30
Estonia
Sweden
Finland
Norway
a
25
Germany
Poland
/
h
Lithuania
Russia
Technology ş Inadequate adoption of modern agricultural technology
20
Kg
The quantity of fertiliser entering the environment is closely
15
connected to whether appropriate technologies have been employed
10
5
in agricultural production. Often the agricultural technology is
0
antiquated and the farmers have insuffi
cient funds to invest in modern
1990
1991
1992
1993
1994
1995
1996
Year
technology, due to the low value of agricultural products. The former
Figure 25 Annually applied phosphorus by mineral fertilisers.
socialist countries still employ highly polluting Soviet technology that
(Source: Baltic 21 2000)
was used on collective farms.
losses to the atmosphere and to surface and groundwater, additional
The lack of modern technology and best agricultural practice (BAP) can
funds are needed for the construction of manure storage facilities and
result in extreme erosion and high concentrations of nutrients entering
for the long-distance transportation of manure and slurry. Funding is
the aquatic environment. Example of BAP could be minimising tilling,
especially problematic for the countries in transition that started the
direct seeding, soil mapping, associated fertilisation and precision
renovation process of large farms in the Soviet era.
farming, and buff er zones and strips to protect watercourses. However,
these practices have not been fully implemented in the region.
The average livestock density of a country indicates not only the
possible quantities of manure generated but also the potential
Nutrient discharge can occur due to the use of inappropriate technology
releases of nutrients into the environment. Livestock densities are
in cattle farming and a lack of manure and slurry storages. For instance
lower in the transitional countries and Poland than in the other
in the southern part of the Baltic Sea region the storage capacity
countries, in terms of the number of livestock per total arable land in
should be at least 6 months and in the northern part 12 months
the country (Figure 26). However, at the local level, large production
due to climatologic diff erences. The technologies used in manure
units are common in these countries, despite the considerable change
spreading are outmoded, with an absence of environmentally sound
in production levels during the early 1990s, and represent substantial
technologies such as injection and trailing hoses. However, farmers in
point sources of pollution. The amount of livestock has been greatly
the Baltic Sea region are increasingly given fi scal and market incentives
reduced in the countries in transition and Poland since the beginning
to make provisions to minimise their impact on the environment, such
of the 1990s as the export market practically disappeared. At the
as agricultural production subsidies and consumer demand.
same time the amount of arable land has also decreased, so the
trend regarding livestock units per ha arable land has been relatively
Governance ş Inadequate integration of environmental and agricultural
stable. Germany, Denmark, Sweden and Finland are characterised by
policies
family farms, which have become larger and more specialised in either
The EU's Common Agricultural Policy (CAP) plays a central role in
plant production or animal husbandry.
directing and controlling agricultural policy in the Baltic Sea region.
CAUSAL CHAIN ANALYSIS
45
The CAP gave subsidies to farmers to increase the production of
dairy products, beef, veal, cereal and oils seeds, which stimulated the
GDP2 per capita
USD
35 000
intensifi cation of farming. Production exceeded the environmental
3.5
30 000
Water supply
optimum, with intensive use of fertilisers and degradation of
25 000
Sewerage
farming land. There have been few incentives for farmers to adopt
3
20 000
15 000
environmentally sustainable systems. However, the CAP was reformed
10 000
in 1992, and now it is less clear what infl uence the policy has on the
2.5
5 000
environment. Baldock et al. (2002) made a study on how environmental
0
Denmark
Est
F
German
Lat
Lithuania
P
S
3
i
nland
o
w
2
onia
via
land
eden
policy is integrated in the CAP. They reported the diffi
culties in
3
3
5
y
5
5
5
5
6
identifying causal links due to the variety of responses by the diff erent
EURO/m 1.5
nations when applying the common agricultural policy. However,
some environmental degradation has been associated with changes in
1
farming practices brought about by the implementation of the CAP.
0.5
Aquatic load from urbanisation
Economy ş Lack of investment in wastewater facilities for municipal and
0
industrial wastes
Denmark6 Estonia5
Finland6 Germany4/3 Latvia4
Lithuania5 Poland6
Sweden3
Country
Insuffi
cient investment in wastewater treatment facilities and collection
1) Data from Russia are not included.
2) According to the official exchange rate. Source: International Statistical Yearbook 2000. Central Statistical
systems has led to the uncontrolled discharge of pollutants from
Office Warsaw 2001 and Statistical Yearbook of the Republic of Poland. Central Statistical Office. Warsaw 2002.
3) 1997. 4) 1998. 5) 2000. 6) 2001.
municipalities and industries. As a rule, the cost of water supply and
Figure 27 Water
tariff s in the Baltic Sea countries.
sewerage services should be recovered by charging the user and waste
(Source: Redrawn from Roman 2002)
producer. Unfortunately the GDP of the newly acceded countries is
mucher lower than in the Nordic countries and Germany (5-10 times
as low) and therefore it is not feasible to recover the costs in these
Estonia, Latvia, Lithuania and Poland, the legislation provides a formal
countries.
basis for a profi t to made from these services, although charges in these
countries currently do not even cover the total cost of providing the
At present, the countries in the region use a variety of systems for
services (Roman 2002).
setting water tariff s. However, the introduction of legislation in Estonia,
Latvia, Lithuania and Poland, based on the EU Water Framework
The direct costs related to the water services are fully recovered
Directive is expected to make water policy more homogenous. In all
only in Finland and Sweden. However, full cost recovery as defi ned
these countries operation and depreciation costs are included in the
in the EU Water Framework Directive is not achieved because the
charges, but investment costs are only fully recovered in Finland and
environmental costs are accounted for in the tariff . In Denmark and
Sweden. In Denmark and Germany the majority of investment costs are
Germany the degree of cost recovery is high, whereas in Estonia, Latvia,
included, in Lithuania they are only partially, and in Estonia, Latvia and
Lithuania and Poland it is low (Roman 2002). The new legislation in the
Poland not at all. Correspondingly, water tariff s are signifi cantly lower
latter countries will enable full recovery of the cost of services, but this
in the latter countries (Figure 27).
will take time to be fully operational. The newly acceded countries,
due to fi scal diffi
culties, have received permission to prolong their
The environmental charges (for water supply and wastewater
implementation of the EU urban wastewater directive (Roman 2002).
discharges) are included in the charges for water services in Estonia,
Germany, Latvia, Lithuania and Poland, but not in Denmark, Finland
Urbanisation ş High urbanisation rate
and Sweden. All countries have introduced a VAT taxation for recovering
The urbanisation rate is increasing in Estonia, Latvia, Lithuania and
the costs of water and sewage services, except Lithuania with regard
Russia, although a large proportion of the population reside within
to water supply services, and Germany and Lithuania with regard to
the countryside. This trend is leading to increasing pressure on the
sewerage services. VAT in these countries ranges from 7% to 25%.
environment in urban areas. Further consequences include a reduction
In Sweden no profi t is allowed to made from providing water and
in the amount of cultivated area, losses of semi-natural habitats and an
sewerage services, as is the same for sewerage services in Germany. In
increase in fallow land due to poor maintenance of fi elds and grassland
46
GIWA REGIONAL ASSESSMENT 17 BALTIC SEA
(Baltic Environmental Forum 2000). The growth in urban population
Table 15 Forecast of passenger and freight transport in the
is requiring greater capacity in water supply systems and wastewater
recently acceded EU countries and Russia.
treatment plants. Signifi cant investment is needed to upgrade or
Passenger traffic (relative %)
1995
2010
2030
replace antiquated facilities. The market economy countries have
Passenger cars
100
200
400
already undergone a similar process.
Public transport
100
100
75
Rail
100
100
75
Atmospheric deposition from energy production and
Freight transport (relative %)
transportation
Road
100
250
400
Population growth and urbanisation
Rail
100
100
100
Population growth and urbanisation has increased the demand for heat
(Source: Baltic 21 1998c)
and electricity, which has consequently required greater oil, gas and
Table 16 Expected growth in volume of trade in the Baltic Sea
coal combustion. This has increased emissions of nitrogen compounds,
from 1995 to 2017.
and thus also the deposition of nitrogen into the Baltic Sea. Laws
Trade volume
(million tonnes)
Growth
and regulations have failed to control emissions to reduce nitrogen
Commodity
(%)
1995
2017
deposition to the recommended level. The average total fi nal energy
Break bulk
29
82
186
consumption (TFC) per GDP in the region is around 12 PJ/billion USD.
Dry bulk
61
113
84
However, there are major diff erences between the countries, ranging
General cargo
22
64
186
from 7.7 PJ/billion USD in Denmark to 35.6 PJ/billion USD in Russia in 1997
Liquid bulk
1
2
84
(Baltic 21 2004a). Besides economic inequality between the countries,
Oil
81
112
39
the diff erence in TFC/GDP may also refl ect diff erences in energy
Total
194
372
92
consumption patterns and the effi
ciency of energy generation.
(Source: COWI 1998)
Transports ş Increased sea and road traffi
c
Increased sea and road traffi
c has resulted in greater emissions.
Baltic Sea region. There is a need to strengthen laws and regulations
Government transport policy is inadequate with measures to curb
regarding emissions into the atmosphere from energy production
emissions proving ineff ective. Passenger and freight road traffi
c is
and transport. In Denmark, Finland, Germany and Sweden, laws
predicted to increase considerably between 2010 and 2030 in former
and regulations were developed in parallel to social and economic
state economy countries, while the importance of less polluting
development. The countries in transition have reformed their
public transport and rail services is expected to decline, or remain
legal systems over the last decade, but only part of the HELCOM
static (Table 15). Sea transport is the source of 10-20% of the nitrogen
recommendations and EU directives have been incorporated into
deposited into the Baltic Sea. This form of transport is expected increase,
national laws and regulations. However, the national legislation of the
as assessed by COWI Consult in Table 16.
countries in transition must be harmonised with EU requirements, and
enforced appropriately.
The emission of NO from industry and traffi
c follows the same trends as
2
the total emissions. Despite reductions in emissions of some pollutants,
the large and increasing number of fossil fuel driven motor vehicles
is in confl ict with the need to reduce the negative impact on human
Overexploitation of fish
health and the environment. There is a need to balance the mobility
of people and goods, with maintaining the health of the population
Environmental and socio-economic impacts
and environment. Attention needs to be given to maritime transport,
Environmental impacts of overexploitation living resources in the Baltic
particularly RO/RO and ferry transport (including high-speed ferries,
Sea are for example:
called feeder-ships), which are energy intensive (Baltic 21 1998c).
Considerable changes in the structure and number of fi sh
populations;
Governance ş Ineff ective laws and regulations to control emissions and
Decline in spawning stock size;
Lack of adequate transport policy
Decrease in the total landings of the most important commecial
There are a number of barriers to sustainable development in the
species.
CAUSAL CHAIN ANALYSIS
47
Impacts
Issues
Immediate causes
Sectors/Activities
Root causes
Environmental:
Overexploitation
High exploitation rates
Fishery
Economic
- Fishing subsidies
Considerable changes in the
- Market failure
structure and number of
- Economic reform failures
populations
Overutilisation of quotas
Decline in spawning stock
size
Knowledge
Decrease in the total
- Inappropriate assessment methods
landings of the most
Extensive fleet capacity
important commercial species
Governance
- Fishery management coordination
Socio-economic:
- Inadequate fishery control
Loss of livelihood and
- Lack of fishery statistics
increased unemployment in
the fishery sector
Effects in the fishing
markets as fish landings
become more variable and
uncertain
Figure 28 Causal chain diagram illustrating the causal links for overexploitation of fi sh.
Examples of socio-economic impacts are:
1 200 000
Loss of livelihood and increased unemployment in the fi shery
Cod
sector;
Sprat
1 000 000
Herring
Eff ects in the fi shing markets as fi sh landings become more variable
Other
and uncertain.
800 000
onnes)
Immediate causes
600 000
(t
h
The primary immediate causes for the overexploitation of living
Catc 400 000
resources in the Baltic Sea region were considered to be high
exploitation rates, overutilisation of quotas and an oversized fl eet
200 000
capacity.
0
High exploitation rates and overutilisation of quotas
1973
1974
1975
1976
1977
1978
1979
1980
1981
1982
1983
1984
1985
1986
1987
1988
1989
1990
1991
1992
1993
1994
1995
1996
1997
1998
Year
High exploitation rates of cod since the early 1980s has resulted in a
Figure 29 Recorded catches of the main target species in the
decline in stocks and today the stock is no longer considered to be
Baltic Sea between 1973-1998.
within safe biological limits. Furthermore, the Baltic cod have slower
(Source: HELCOM 2001)
growth rates than the North Sea cod and reach maturity later (at the
age of 3 to 5 years). More effi
cient fi shing gear has been employed to
fi shing in the Baltic (European Commission 2000). Today, the fi shing
catch cod, including demersal trawls, high opening trawls (operating
fl eet has a catch capacity that continues to be greater than what the
both pelagically and demersally) and gill nets. Gill net fi shing increased
fi sh stocks can sustain. The fl eet capacity in the Baltic Sea countries is
during the 1990s, and up to 50% of the total catch is currently landed
presented in Table 17.
by gill nets (HELCOM 2002). Fishing is unsustainable under the present
environmental scenario. Eff orts are being made to assess the fi sheries of
Root causes
the Baltic Sea, through the acquisition of more accurate catch statistics
As the fi shery is considered a sector on its own, sector aspects are not
for commercial species and by further investigating the impacts of
discussed in the case of overexploitation. On the basis of further analysis
fi shing activities. Figure 29 shows catches of the main targeted species
the following root causes were specifi ed:
in the Baltic Sea.
Economic: Fishing subsidies, market failure and economic reform
failures.
Extensive fl eet capacity
Knowledge: Inappropriate assessment methods.
Overexploitation of the fi sh stocks has also resulted from the expansion
Governance: Fishery management coordination, inadequate fi shery
of the Baltic Sea fi shing fl eet. The European Commission has calculated
control and lack of fi shery statistics.
that the EU fl eet is 40% larger than that required to carry out sustainable
48
GIWA REGIONAL ASSESSMENT 17 BALTIC SEA
Table 17 Number of fi shing vessels per country operating in the
Regarding market failures, in order to reduce overfi shing, it is necessary
Baltic Sea.
to improve the balance between the fi shing potential and the biological
Number of fishing vessels
reality. This can be achieved by reducing the fi shing potential or the
Countries
1997
1998
catches. This process cannot be left to market forces, as the relevant
fi sh stocks may be depleted before equilibrium has been reached. It
Denmark
1 527
1 376
can only be secured through a comprehensive approach combining
Estonia
ND
233
decommissioning schemes and regulatory measures, to reduce fi shing
Finland
3 987
ND
eff ort.
Germany
ND
2 160
Latvia
222
220
The third contributing factor, economic reform failures, is related to
Lithuania
65*
65*
privatisation in the former Soviet Union, where most connections
Poland
1 296
1 315
between catch and processing have been lost, and fi nancial problems
Russia
134
130
became much sharper. The current system of taxation, fuel and material
Sweden
2 443
ND
Note: ND = No data. *Only vessels operating in the open sea.
prices, high tariff s for fi sh product transportation, and high interest rates
(Source: Baltic 21 2004a)
has led to the growth of illegal fi shing (Titova 2001).
The Agenda 21 for the Baltic Sea Region states that irrational fi shery
Knowledge
management is among the main causes of the overfi shing of cod
Fish stock monitoring assessments are considered to be inadequate,
(Baltic 21 1998b). The International Baltic Sea Fishery Commission
according to experts from the region. There is a lack of understanding
(IBSFC) has for many years been infl ating catching intensity. Social,
of the current status of the Baltic marine ecosystems, which inhibits the
economic and political reasons are of top priority for the IBSFC while
eff ective assessment of biological resources in order to set appropriate
stock stabilisation is not given suffi
cient consideration. Policies aimed at
total allowable catches (TACs). Estimates of permissible landings (50%
controlling the exploitation of cod stock have failed, as demonstrated
and more) are therefore fundamentally fl awed (LME 1990, Sherman
by indicators used to evaluate the biological viability of fi sh stocks;
et al. 1996, Denisov 2002, Kotenev 2001).
spawning stock biomass, fi shing mortality and recruitment (see
Figures 12 and 13 in the Assessment).
The impacts of long-term natural cycles and anthropogenic pressures
on the Baltic Sea ecosystem have not been fully explored. It is therefore
Economic
diffi
cult to accurately predict future trends in the fi sheries. A greater
Three major factors constitute the economic root causes of
understanding is needed in order for fi sheries managers to eff ectively
overfi shing: fi shing subsidies, market failure and economic reform
balance fi shing eff ort, catch capacity of fl eets and the estimated
failure. Extensive analytical research supports the conclusion that
long-term average catch levels of the target species. In addition
subsidies for fl eet and fi shing gear modernisation have resulted in
there has been a lack of studies investigating the linkages between
the overexploitation of fi sh stocks. According to FAO (1993), the EU
fi shing subsidies, fi shery quotas and auctions administration and the
countries' fi shing subsidies were approximately twice as large as
socio-economic status of fi shing communities. Confronted with the
necessary. Consequently, all major commercial species in the Baltic
insuffi
cient knowledge, national policy makers and planners are severely
Sea were being overexploited by the early 1990s. There are no
constrained in their ability to promote sustainable fi shing practices.
publications that specifi cally investigate the impacts of subsidies on
fi sh stocks in the Baltic, but offi
cial documents acknowledge that the
Governance
fi shing fl eet has excessive capacity in many parts of the Baltic Sea and
In most coastal regions of the Baltic, fi sh is sold directly from the
that there is limited economic profi tability for all fi shermen (Baltic 21
producer or their organisations to the trade and processing industries
1998b). Subsidies have stimulated fl eet overcapitalisation and led to
instead of marketed at auctions. The wholesale and consumer price
signifi cant by-catch and discards of small fi sh species and non-target
for fi sh products vary considerably between the eastern and western
species, however quantitative estimates are lacking. Yet subsidies
regions of the Baltic, refl ecting their diff erent economic characteristics.
aimed at fl eet modernisation in the EU countries continue to grow
Fish sales and direct landings at dumping prices have been reported,
(Iudicello et al. 1999).
especially in Russia. Producer organisations have failed to exchange
information about prices, quantities and quality requirements. The role
CAUSAL CHAIN ANALYSIS
49
of auctions is insuffi
cient not only in correlating landing rules with the
-
Transport: Increased sea and road traffi
c.
activities of producer organisations but also with regards to sales.
- Governance:
Ineff ective laws and regulations to control
emissions and Lack of adequate transport policy.
The Russian system of fi shery quota distribution between vessel
owners has loopholes. Overexploitation can be proved indirectly by
As to overfi shing, the immediate causes are high exploitation rates,
the fact that vessel owners usually get a small quota that is not enough
overutilisation of quotas and too extensive fl eet capacity.
to cover exploitation costs. The fact that vessels keep on fi shing for
several years proves that their actual catches are much higher than the
The following root causes were identifi ed causing overfi shing:
awarded quota. This is also known as "industrial" poaching (Voytolvsky
Economic: Fishing subsidies and market failure.
et al. 2003).
Knowledge: Inappropriate assessment methods.
Governance: Coordination of management, fi shery control and
A third problem is data-related. Recently awareness of deterioration
fi shery statistics.
in the basic data made available for stock assessment has risen. In
some cases there is evidence of miss-reporting of catches (both non-
It is obvious that the follow-up of the selected root causes will be a time-
reporting and miss-reporting by area). Fishing eff ort data (e.g. days
consuming process which cannot be completed without the proper
or hours fi shing) that is provided by national statistical offi
ces is also
resources. A contributing factor is the implementation of international
unreliable. As a result of incomplete submissions, the ICES decided to
agreements on environmental protection in the Baltic Sea region. The
discontinue the offi
cial reporting of eff ort data and the data is now in
policy options dealing with the root causes presented in the next
most cases reported to the ICES on a voluntary basis (Baltic 21 1998b).
section are mainly defi ned in the Water Framework Directive and in the
guidelines and recommendations issued by the Helsinki Commission.
Conclusions
An analysis of the main root causes shows that many of the same root
causes apply for the diff erent sectors (agriculture, urbanisation, traffi
c
and energy production, and fi shing). The most common root causes
are economic problems, technological matters, lack of knowledge and
governance.
Concerning eutrophication, the following two immediate causes were
identifi ed:
Aquatic nutrient load into the Baltic Sea;
Atmospheric deposition of nitrogen.
The following root causes were identifi ed behind eutrophication:
Aquatic load of nutrients from intensive agriculture:
- Technology: Inadequate adoption of modern agricultural
technology.
-
Governance: Inadequate integration of environmental and
agricultural practices.
Aquatic load of nutrients from urbanisation:
-
Economy: Lack of investment in wastewater facilities.
-
Urbanisation: High urbanisation rate.
Atmospheric deposition from energy production and transportation:
-
Population growth and urbanisation.
50
GIWA REGIONAL ASSESSMENT 17 BALTIC SEA
Policy options
This section aims to identify feasible policy options that target
Framework for implementing
key components identifi ed in the Causal chain analysis in order to
policy options
minimise future impacts on the transboundary aquatic environment.
Recommended policy options were identifi ed through a pragmatic
The policy options identifi ed for this report are closely connected to the
process that evaluated a wide range of potential policy options
basic principles of the Helsinki Convention and EU Water Framework
proposed by regional experts and key political actors according
Directive to cater for a harmonised implementation of water protection
to a number of criteria that were appropriate for the institutional
measures in the Baltic Sea States.
context, such as political and social acceptability, costs and benefi ts
and capacity for implementation. The policy options presented in
With its origin in the 1970s, international cooperation is well developed
the report require additional detailed analysis that is beyond the
in the Baltic Sea region. The legislation and economic base almost meet
scope of the GIWA and, as a consequence, they are not formal
the needs of environmental protection. Environmental awareness in the
recommendations to governments but rather contributions to
Baltic Sea countries is well developed and at a high level in comparison
broader policy processes in the region.
to other GIWA regions (HELCOM, 2003). Educational programmes in
progress are, amongst others:
Baltic University Programme: a network of 180 universities and other
institutes of higher learning (Baltic University Programme 2003,
2004);
Definition of the problems
Baltic Sea Project (BSP): including about 300 schools (Baltic Sea
Project 2004);
The GIWA concerns Pollution and Unsustainable exploitation of fi sh
Baltic 21: an Agenda 21 for Education for sustainable development
and other living resources were identifi ed as most important to deal
in the Baltic Sea Region (Baltic 21 2002).
with within the Baltic Sea region. Eutrophication and overexploitation
of fi sh were selected as GIWA priority issues which were highly urgent
The Baltic Sea protection policy concerning eutrophication,
to consider. According to the fi ndings presented in the Causal chain
overexploitation of fi sh and other issues was agreed upon at the Helsinki
analysis as well as assessments made by Helsinki Commission (HELCOM
Commission and at the Baltic Sea Fishery Commission. In addition to
2002), the following key facts are important for the policy option
these, a comprehensive policy for water issues was recently adopted in
regarding eutrophication and overfi shing:
the EU Water Framework Directive (European Parliament and Council
Eutrophication remains the most pressing problem in the Baltic, as
2000). These activities are in line with Agenda 21 for the Baltic Sea
nitrogen and phosphorus inputs are still too high;
region. Therefore, the identifi ed policy options for protection of the
Overexploitation of fi sh is considered as a severe problem due to
Baltic Sea are well aligned with the above-mentioned policies and will
the overutilisation of quotas, high exploitation rate and oversized
support the implementation of the EU Water Framework Directive and
fl eet capacity.
the HELCOM recommendations to guarantee sustainable development
in the Baltic Sea region.
POLICY OPTIONS
51
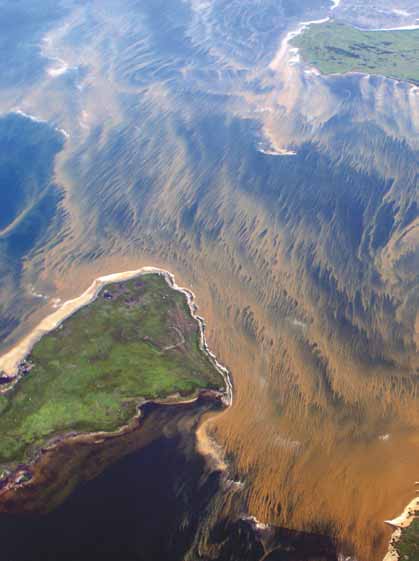
All of the Baltic Sea region countries are signatories to the Helsinki
Convention and all, but Russia, are members of the European Union
since 2004. The Baltic Sea has become almost an internal sea of the
European Union. Policies in order to protect the Baltic Sea were
defi ned clearly in the text of the two main documents: the Convention
on the Protection of the Marine Environment of the Baltic Sea Area
(Helsinki Convention 1992) and in the EU Water Framework Directive
(WFD) (European Parliament and Council 2000). Other conventions
and international agreements are also taken into account but the
Helsinki Convention and WFD are the most comprehensive (see
Annex III).
The countries ratifying the Helsinki Convention are obliged to
implement the requirements laid out in the Convention. In addition,
the EU member states have to implement the EU Water Framework
Directive before 2015.
According to the EU Water Framework Directive (European Parliament
and Council 2000, introductory part, paragraph 18), the Community
water policy requires a transparent, eff ective and coherent legislative
framework; and the Community should provide common principles and
an overall framework for action. This directive should provide for such
a framework and coordinate, integrate, and, in a longer perspective,
further develop the overall principles and structures for protection and
Figure 30 Concentrated bloom of blue green algae, most probably
sustainable use of water in the Community.
Nodularia spumigena, at the eastern coast of Sweden, 2003.
(Photo: Johan Forssblad, IBL Bildbyrň)
The Directive aims at maintaining and improving the aquatic
environment, including rivers, lakes, coastal waters as well as
groundwaters. The objective is to ensure that all waters meet "good
Eutrophication
status" by 2015. Control of quantity is an ancillary element in securing
good water quality and therefore measures of quantity, serving the
The immediate causes of eutrophication are aquatic load of nutrients
objective of ensuring good quality, should also, according to the
and atmospheric deposition of nitrogen to inland water bodies and
Directive, be established (European Parliament and Council 2000,
into the Baltic Sea. The main sectors responsible for eutrophication
introductory part, paragraph 19). In addition to the Water Framework
identifi ed in the casual chain analysis are agriculture, urbanisation,
Directive, the implementation of other EU directives such as the Urban
energy production and transport. Agriculture is responsible mainly for
Wastewater Treatment Directive (European Council 1991b), the Nitrate
the diff use inputs of nitrogen compounds due to overfertilisation and
Directive (European Council 1991a), the Drinking Water Directive
uncontrolled manure and slurry disposal. Urban areas are responsible
(European Council 1980, 1998), the Habitats Directive (European Council
for nutrient inputs from municipalities and industrial enterprises
1992) cover the issues considered by GIWA.
discharging untreated or partly treated wastewaters to the environment.
Energy production and transport are responsible for the high emission
More specifi c identifi cation of the policy options for eutrophication and
level of nitrogen, having a signifi cant infl uence on the deposition rate.
overexploitation of fi sh will be presented below. First the policy options
for eutrophication will be presented and then the policy options for
A number of measures have been adopted over the years to halt the
overexploitation of fi sh.
negative development of the environmental situation in the Baltic
Sea area (HELCOM Recommendations, see achievements and targets
below). Some actions have improved the situation, while others have
52
GIWA REGIONAL ASSESSMENT 17 BALTIC SEA
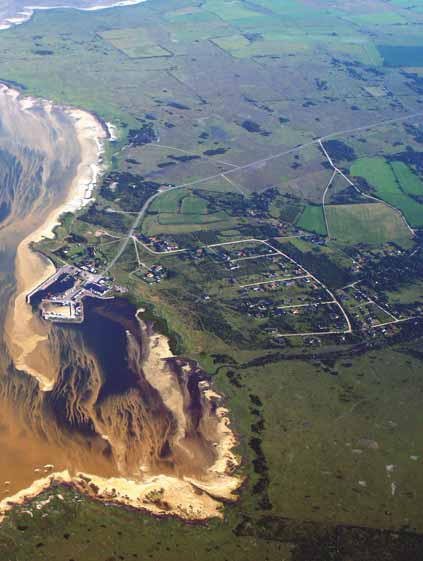
The following root causes were identifi ed in the causal chain analysis:
Aquatic load of nutrients from intensive agriculture:
- Technology: Inadequate adoption of modern agricultural
technology.
-
Governance: Inadequate integration of environmental and
agricultural practices.
Aquatic load of nutrients from urbanisation:
-
Economy: Lack of investment in wastewater facilities.
-
Urbanisation: High urbanisation rate.
Atmospheric deposition from energy production and
transportation:
-
Population growth and urbanisation.
-
Transport: Increased sea and road traffi
c.
- Governance:
Ineff ective laws and regulations to control
emissions and Lack of adequate transport policy.
The aim of policy options is to list the diff erent options that could
mitigate or solve the problems of eutrophication; i.e. aquatic load
of nutrients from agriculture and urbansiation and atmospheric
deposition of nitrogen.
Aquatic load from agriculture
Agriculture was discussed at the World Summit Conference on
Sustainable Development in Johannesburg in 2002, and was, together
with water, energy, health and biodiversity, considered as one of
the most important and urgent issues to deal with (WSSD 2002).
The HELCOM Ministerial Declaration (1988) aimed at reducing total
resulted in the status quo. Often appropriate spatial and temporal
discharges into the Baltic Sea by 50% within a 10-year period. During the
monitoring is lacking (especially relating to fi sheries activities), making
revision of the 1992 Helsinki Convention requirements to prevent and
it diffi
cult to detect changes in the environment. The following text
eliminate pollution from agriculture, Annex III of the Convention was
will concentrate on measures proposed as well as measures taken by
revised and an obligation to use the best environmental practice (BEP)
HELCOM and the International Baltic Sea Fishery Commission (IBSFC)
was included. Furthermore, new regulations concerning agricultural
regarding eutrophication and exploitation of fi sh stocks.
activity were inserted in Annex III. The new regulations comprise issues
dealing with animal density, manure storage, agricultural wastewater
Achievements:
and silage effl
uents, application of organic manure, application rates
Atmospheric deposition of nitrogen has been reduced by 40%
for nutrients and water protection measures and nutrient reduction
during the last 15 years (HELCOM 2002).
areas. Specifi c requirements proposed by the Helsinki Commission are
None of the nine Baltic Sea countries have been able to halve the
presented in Box 1. These requirements are minimum requirements for
total aquatic load of nutrients from all sources since the late 1980s
national legislation.
by the end of 1995. However, Estonia, Latvia, Lithuania, Poland and
Russia have come closer to the 50% reduction targets than the
The EU Nitrates Directive (European Council 1991a) aims to reduce
other Baltic countries (Lńńne et al. 2002).
water pollution caused or induced by nitrates from agricultural
sources and to prevent further pollution of this type. The various
Targets:
steps of implementing the directive include detection of polluted or
Discharge of polluting substances, including nutrients into the Sea,
threatened waters, designation of "vulnerable zones", establishment
must be reduced, particularly from sewage, agriculture and transport.
of codes of good agricultural practice, action programmes within
POLICY OPTIONS
53
Box 1
Specifi c requirements included in Annex III of the
Lack of modern technology and best agricultural practice (BAP), results
Helsinki Convention in order to decrease eutrophication.
high concentrations of nutrients entering the aquatic environment.
Animal density
Governmental fi nancial support for improving the existing agricultural
To ensure that manure is not produced in excess in comparison to the amount
of arable land, there must be a balance between the amount of animals on
technology is urgently needed.
the farm and the amount of land available for spreading manure, expressed as
animal density. The maximum number of animals should be determined with
consideration of the phosphorus and nitrogen concentration in manure and the
crops requirements of plant nutrients.
It is important to increase the cooperation between the countries
Manure storage
around the Baltic Sea for attaining sustainable agriculture. According
Manure storage facilities must be of such a quality that losses do not occur. The
storage capacity must be sufficiently large to ensure that manure will only be
to Baldock et al. (2002) there are diffi
culties in applying a common
spread when the plants can utilise the nutrients. The minimum level should be a
6-month storage capacity. Urine and slurry stores should be covered or maintained
agricultural policy. However, several initiatives towards a sustainable
by a method that efficiently reduces ammonia emissions.
agriculture are taken, for example, work on a regional `Virtual Research
Agricultural wastewater and silage effluents
Wastewater from animal housings should either be stored in urine or slurry stores
Institute on Sustainable Agriculture' has been initiated in the Nordic
or else be treated in some suitable manner to prevent pollution. Effluents from
the preparation and storage of silage should be collected and directed to urine or
countries, and similar initiative has been taken in Poland (Baltic 21
liquid manure storages.
2004b). There is a need for further supporting research and projects
Application of organic manures
Organic manure (slurry, solid manure, urine, sewage sludge, composts, etc.) should
aimed at increasing knowledge in order to integrate environmental
be spread in a way that minimises the risk of plant nutrient loss and should not be
spread on soil that is frozen, water-saturated or covered with snow. Organic manure
policies with agricultural and other policies.
should be applied as soon as possible after bare soils. Periods shall be defined
when no manure application is allowed.
Application rates for nutrients
Aquatic load from urbanisation
Application rates for nutrients should not exceed the nutrient requirements of
crops. National guidelines should be developed with fertilising recommendations
The identifi ed root causes of urbanisation were lack of investments
and they should take reference to: a) soil conditions, soil nutrient content, soil
type and slope; b) climatic conditions and irrigation; c) land use and agricultural
and high urbanisation rate. The main tools to control discharges
practices, including crop rotation systems; d) all external potential nutrient
connected to urbanisation in the Baltic Sea are described in the EU
sources.
Winter crop cover
Water Framework Directive (European Parliament and Council 2000).
In relevant regions, the cultivated area should be sufficiently covered by crops in
winter and autumn to effectively reduce the loss of plant nutrients
Minimum requirements proposed by the European Commission in the
Water protection measures and nutrient reduction areas
Water Framework Directive are as follows:
a) Surface water: Buffer zones, riparian zones or sedimentation ponds should be
established, if necessary. b) Groundwater: Groundwater protection zones should
1. Expanding the scope of water protection to all waters, surface
be established if necessary. Appropriate measures such as reduced fertilisation
rates, zones where manure spreading is prohibited and permanent grass land
waters and groundwater;
areas should be established. c) Nutrient reduction areas: Wetland areas should be
2. Achieving "good status" for all waters by the 2015 deadline;
retained and where possible restored, to be able to reduce plant nutrient losses
and to retain biological diversity.
3. Water management based on river basins;
(Source: The Helsinki Convention 1992)
4. "Combined approach" of emission limit values (ELV) and water
quality objectives (WQO) shall be used;
designated vulnerable zones, and national monitoring. To limit the
5. Getting the prices right: charges for water and wastewater refl ecting
negative eff ects linked to agricultural activities, the Nitrates Directive
the true costs;
promotes fi ve main principles (European Council 1991a):
6. Getting the citizens involved more closely;
1. Crop rotation, soil winter cover and catch crops to limit leaching
7. Streamlining
legislation.
during wet seasons;
2. Use of fertilisers and manure, with a balance between crop needs,
According to the Directive, rivers and lakes will need to be managed
nitrogen inputs and soil supply; frequent manure and soil analysis,
by river basin borders instead of administrative boundaries. These
mandatory fertilisation plans and general limitations per crop for
approaches mean that a transboundary aspect is clearly included in
both mineral and organic nitrogen fertilisation;
the Directive. The Directive also recommends that the charges for water
3. Appropriate nitrogen spreading calendars and suffi
cient manure
and wastewater should refl ect the true costs.
storage, for availability only when the crop needs nutrients, and
good spreading practices;
The implementation of the EU Water Framework Directive is one of
4. "Buff er zones" that is, non-fertilised grass strips and hedges along
the main measures to meet nutrient discharge targets in the Baltic
watercourses and ditches;
Sea. Since the goal is to reduce nutrients in the whole catchment
5. Good management and restriction of cultivation on steeply sloping
area and to adopt a transboundary approach, it is necessary that the
soils, and of irrigation.
EU Water Framework Directive is also implemented in Russia, even
if Russia is not an EU member. One example of a transboundary
54
GIWA REGIONAL ASSESSMENT 17 BALTIC SEA
project including Russia in the work for implementing the EU Water
The Helsinki Commission regulations aim to prevent environmental
Framework Directive is the European Baltic (ERB) cooperation. Nine
damage made through discharge of urban wastewater and waste
neighbouring partner-regions in Denmark, Latvia, Lithuania, Poland,
from industrial processes. Depending on their size and designated
Russia (Kaliningrad) and Sweden established contacts on the political
location, all newly built areas must have urban wastewater collection
level in 1998.
and treatment systems by the end of 1998, 2000 or 2005 (European
Council 1991b). The level of treatment depends on the sensitivity of the
In order to concretise the ERB cooperation, the EU-project SEAGULL
receiving water and can be:
was formed in 2002 with the aim of developing a Joint Transnational
Primary: removal of suspended solids by passing wastewater
Development Programme (JTDP) for the entire region (Eurobalt 2004).
through settlement or fl otation tanks.
One of the main objectives is to improve water management and
Secondary: biological treatment where wastewater passes through
prepare for implementation of the EU Water Framework Directive and
tanks where bacteria eat pollutants and transform them into
the HELCOM Joint Comprehensive Action Programme. In-depth studies
sludge.
in special strategic areas, analyses, preparatory measures and exchange
Tertiary: more advanced treatment that involves nutrient removal
of knowledge are methods used. The project also aims to compare
or disinfection by means of chlorination, ultraviolet (UV) radiation
and evaluate diff erent methods for enhanced dialogue and awareness
or ozone treatment.
among the citizens and other local stakeholders (Eurobalt 2004).
The Urban Wastewater Treatment Directive (European Council 1991b)
To further reduce nutrient loads from urban areas and to stop
concerns collection, treatment and discharge of urban wastewater
eutrophication of the Baltic Sea, additional measures must be
from agglomeration and treatment and discharge of biodegradable
implemented. According to the regulations of the Helsinki Commission,
wastewater from certain industrial sectors. Its objective is to protect
measures such as presented in Box 2 must be implemented.
the environment from the adverse eff ects of such wastewater
Such measures could prevent pollution from industries and from
discharges.
municipalities.
The EU Member States must ensure that urban wastewater is collected
and treated prior to discharge according to specifi c standards and
Box 2
Helsinki Commission, regulations to prevent pollution
deadlines. In terms of the treatment objectives, secondary (i.e.
from industry and municipalities.
biological) treatment is the general rule, with additional nutrient
Regulation 1: General provisions
removal in what are considered sensitive areas (tertiary treatment).
In accordance with the relevant parts of the Helsinki Convention, the Contracting
Parties shall apply the criteria and measures in this Annex in the whole catchment
Implementation of the EU Water Framework Directive and other
area and take into account Best Environmental Practice (BEP) and Best Available
Technology (BAT) as described in:
directives and regulations mentioned above, could raise awareness of
Regulation 2: Specific requirements
the environmental situation and increase the responsibility for the Baltic
- Municipal sewage water shall be treated at least by biological or other methods
equally effective with regard to reduction of significant parameters. Substantial
Sea as a common resource.
reduction shall be introduced for nutrients.
- Water management in industrial plants should aim at closed water systems or at
a high rate of circulation in order to avoid wastewater wherever possible.
Atmospheric deposition
- Industrial wastewaters should be separately treated before mixing with diluting
The root causes of atmospheric deposition were identifi ed as:
waters.
- Wastewaters containing hazardous substances or other relevant substances
population growth and urbanisation, increased sea and road traffi
c,
shall not be jointly treated with other wastewaters unless an equal reduction
ineff ective laws and regulations to control emissions and lack of
of the pollutant load is achieved compared to the separate purification of each
wastewater stream. The improvement of wastewater quality shall not lead to a
adequate transport policy. There is a need for improving laws and
significant increase in the amount of harmful sludge.
- Limit values for emissions containing harmful substances to water and air shall
regulations in the region to control emissions. It is also important to
be stated in special permits.
implement an adequate governmental policy for transport.
- Industrial plants and other point sources connected to municipal treatment
plants shall use Best Available Technology in order to avoid hazardous
substances which cannot be made harmless in the municipal sewage treatment
plant or which may disturb the processes in the plant. In addition, measures
The Air Quality Framework Directive (European Council 1996) covers
according to Best Environmental Practice shall be taken.
a revision of previously existing legislation and the introduction of
- Pollution from fish-farming shall be prevented and eliminated by promoting
and implementing Best Environmental Practice and Best Available Technology.
new air quality standards for previously unregulated air pollutants,
- Pollution from diffuse sources, including agriculture, shall be eliminated by
setting the timetable for the development of daughter directives
promoting and implementing Best Environmental Practice.
(Source: The Helsinki Convention 1992)
on a range of pollutants. The list of atmospheric pollutants to be
POLICY OPTIONS
55
considered includes sulphur dioxide, nitrogen dioxide, particulate
Overexploitation of fish
matter, lead and ozone.
High exploitation rates and excessive fi shing quotas were identifi ed as
The Convention on Long-Range Transboundary Air Pollution
the main immediate causes of overfi shing. The causal chain analysis
(UNECE 1979) was signed by 34 governments, including Russia and the
identifi ed that the root causes behind this issue were mainly poor
European Community. The Convention entered into force in 1983, and
landing statistics, overestimated quotas due to socio-economic factors
has been extended by eight protocols.
and constant overfi shing of the most popular commercial species.
Despite continuously lowered quotas for cod, herring and salmon
In addition to the implementation of the Air Quality Framework Directive
since the mid-1990s, the populations have not recovered.
and the Convention on Long-Range Transboundary Air Pollution it is
suggested that further reduction of nitrogen emission and consecutive
Policy options concerning overfi shing in the Baltic Sea region will
reduction of depositions will take place through the implementation
be managed within the framework of the International Baltic Sea
of the Kyoto Protocol by the EU countries. For implementation of the
Fishery Commission (IBSFC) which is the main advisory body in
Kyoto Protocol in the Baltic Sea region, a harmonised policy should be
the management of living resources in this region. All countries
formulated.
around the Baltic Sea are contracting parties of the Commission, and
measures proposed for management of living resources are obligatory
Identified policy options
to them and have the potential for being of great infl uence. Other
Concerning the root causes related to eutrophication, the identifi ed
examples of international cooperation of importance in the question
course of action involves:
of overfi shing include the European Union's Common Fisheries
Policy and its Fisheries Action Plan, and the UN Food and Agriculture
For aspects concerning governance:
Organization (FAO) and its Code of Conduct for Responsible Fisheries.
Integrate agricultural, energy and transport policy with the
The policy options presented in this section are based on the work
environmental policy proposed by the European Commission,
of these organisations.
the Helsinki Commission, the International Baltic Sea Fishery
Commission and other international conventions in order to reduce
Fishing subsidies and market failure
the discharge of nutrients to the Baltic Sea.
The UN Food and Agriculture Organization (FAO) have developed a code
Cooperate with countries outside the EU, such as Russia, Belarus and
of conduct to set out principles and international standards of behaviour
Ukraine, with the aim to harmonise their environmental legislation
for responsible practices. The objective is to prepare guidelines for an
with the EU countries, such as adopting the EU Water Framework
eff ective conservation, management and development of living aquatic
Directive.
resources, with due respect to the ecosystem and biodiversity. Four
Support and develop existing agricultural cooperation projects and
fi shing management measures related to overfi shing in the Baltic Sea
networks.
Region are stated in this context in Box 3.
For economic aspects:
The European Commission is invited further to support the
Box 3
Fishing management measures related to overfi shing
implementation of transboundary environmental projects.
proposed by FAO.
Governments are invited to support economically the
- States should ensure that the level of fishing permitted is commensurate with
the state of fisheries resources.
implementation of new environmentally friendly technologies in
- Where excess fishing capacity exists, mechanisms should be established to
reduce capacity to levels commensurate with the sustainable use of fisheries
agriculture, transport and energy production.
resources so as to ensure that fisheries operate under economic conditions that
Governments, especially in the new EU countries and Russia, are
promote responsible fisheries. Such mechanisms should include monitoring the
capacity of fishing fleets.
invited to support investments in wastewater treatment facilities
- The efficacy of conservation and management measures and their possible
interactions should be reviewed regularly.
to reduce emissions from heat and electricity production units as
- States and subregional and regional fisheries management organisations, all
well as from road and sea traffi
c.
according to their respective competencies, should introduce measures for
depleted resources and resources threatened with depletion that facilitate the
sustained recovery of such stocks. They should make every effort to ensure that
resources and habitats critical to the wellbeing of such resources, affected by
fishing or other human activities, are restored.
(Source: FAO 1996)
56
GIWA REGIONAL ASSESSMENT 17 BALTIC SEA
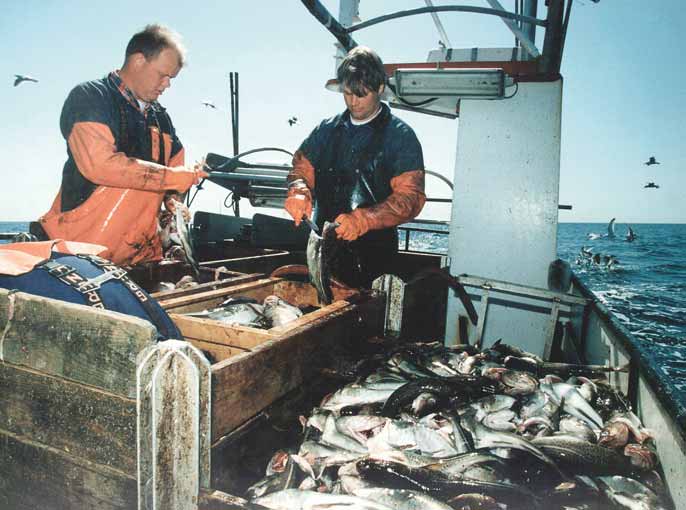
Inappropriate assessment methods
Box 4
The Biodiversity Action Plan for Fisheries.
The EC Biodiversity Action Plan for Fisheries includes requirements
The Biodiversity Action Plan for Fisheries includes the following:
- Overall reduction in fishing pressure to promote the conservation and
for the formulation and implementation of strategies that will enable
sustainable use of commercially important fish stocks.
the "conservation and sustainable use of biodiversity" across all
- Technical measures with the objective of improving the conservation and
sustainable use of commercially exploited fish stocks.
policy sectors (Box 4). The overall objective is to defi ne and identify,
- Technical measures with the objective of reducing the impact on non-target
within the current legislative framework, coherent measures that
species and habitat.
- Research priorities to secure traditional support for the EU Common Fisheries
will lead to the preservation or rehabilitation of biodiversity where
Policy (CFP).
it is perceived as being under threat due to fi shing or aquaculture
- Research to provide enhanced knowledge related to biodiversity.
activities. Increased research and improved monitoring methods are
- Monitoring and assessment of the state of commercially important fish stocks.
- Monitoring of other organisms and habitats.
emphasised.
(Source: ECCHM 2004)
Coordination of management, fishery control
and fishery statistics
Legal protection of threatened marine habitats is needed;
The International Baltic Sea Fishery Commission (IBSFC) has
Improved catch statistics are needed to accurately estimate the
developed the Fisheries Rules for Fisheries Management. These
fi sh populations and determine the impact exerted by commercial
rules include calculations concerning fi shing behaviour such as Total
fi shing operations. No-take zones and restrictions in gear use are
Allowable Catches (TACs). The targets suggested by the IBSFC are
measures to be taken under consideration.
(Baltic 21 1998b):
The by-catch of mammals and birds, as well as discard of fi sh must
As a contribution to the Baltic Sea region application of Agenda 21,
be reduced;
the IBSFC has also been appointed to develop action programmes for
Figure 31 Cod
fi shing in the southern Baltic Sea, 1994.
(Photo: Uno Andersson, Sydsvenskan Bild)
POLICY OPTIONS
57
the fi sheries sector in this region. Action programmes recognised as
A better application of the rules, which implies further development
prioritised in the Agenda 21 for the Baltic Sea are (Baltic 21 1998b):
in the cooperation among the various authorities concerned and a
Baltic Cod Strategy Plan implementation from 1999.
strengthening of the uniformity of control and sanctions.
IBSFC Salmon Action Plan 1997-2010 (in collaboration with HELCOM
An increase in stakeholders' involvement, which implies that
in 1997).
stakeholders, particularly fi shermen, need to take a more central role
Long Term Strategy for Pelagic Species implementation from 2000.
in the CFP management process. Regional advisory councils will be
established to integrate the knowledge of fi shermen and scientists,
In addition to the these priority action programmes according to the
together identifying ways of achieving sustainable fi sheries.
Baltic 21 (1998b) the targets are to:
Improve the management resources in coastal areas.
Identified policy options
Increase cooperation in the fi eld of control and enforcement.
Concerning the root causes related to economy and governance, the
Improve the quality of stock and fi sheries assessment.
identifi ed course of action involves:
Increase sustainable use and preservation of freshwater fi sh stocks
An
integration
of
fi shery policies with economic and environmental
and species.
strategies in order to strengthen sustainable fi sheries.
Restore habitats that are important to fi sh and fi sheries in inland
Development of comprehensive approaches combining
waters.
decommissioning schemes and regulatory measures, and the
Achieve sustainable aquaculture.
construction of a stabile system of taxation, prices of fuel and
Improve economic and social stability of the fi sheries sector.
materials.
Establish more stringent control over vessel documentation and
As a member of the IBSFC, the EU supports policy measures agreed by
fi shing statistics.
the IBSFC, and has incorporated technical measures in its legislation,
Ensure obligatory registration of all catches and all export
relating to gear meshes used by vessels and the minimum size of fi sh
transactions on land.
caught locally. The European Union's Common Fisheries Policy (CFP)
Improve and unify a system of fi sh auctions for all Baltic countries.
can be divided into four main areas (CFP 2004):
Conservation, in order to protect fi sh resources by regulating
For causes related to educational aspects the following actions were
the amount of fi sh taken from the sea, by allowing young fi sh to
identifi ed:
reproduce, and by ensuring that the regulations are adhered to.
A creation of appropriate assessment methods leading to the
Structures, in order to help the fi shing and aquaculture industries
establishment of reliable total allowable catches (TACs).
to adapt their equipment and organisations to the constraints
Improve the reporting of landings by introducing an electronic
imposed by scarce resources and by the market.
network and exchange of this information between Baltic
Markets, in order to maintain a common organisation of the market
countries.
in fi sh products and to match supply and demand for the benefi t
of both producers and consumers.
For causes related to legal aspects:
Relations with the outside world, with the objective of setting up
Support for the construction of appropriate fi shery laws that can
fi sheries agreements and to negotiate at the international fi sheries
effi
ciently manage the new market conditions is emphasised.
organisations for common conservation in deep sea fi sheries.
However, the CFP has met strong criticism for supporting structural
problems in fi sheries, in particular, when giving subsidies to oversized
fi shing fl eets. In 2002, a reform was made in the fi sheries policy
to address these problems, resulting in new measures as follows
(CFP 2004):
A new policy for the fl eets: (i) a simpler fl eet policy that puts
responsibility for matching fi shing capacity to fi shing possibilities
with the member states; and (ii) phasing out of public aid, while
keeping aid to improve security and working conditions on board.
58
GIWA REGIONAL ASSESSMENT 17 BALTIC SEA
Conclusions and recommendations
Eutrophication and overfi shing were identifi ed as the main GIWA issues
regions during the last decade have proved that Russia is serious
having a severe impact on the state of the Baltic Sea and therefore
about the implementation of water protection measures. For example
the causal chain analysis and elaboration of policy options were
construction of wastewater treatment plants in St. Petersburg and
carried out for these two issues. The other issues, such as pollution of
Kaliningrad have reduced the pollution load to the Baltic Sea.
existing freshwater supplies, chemical pollution, oil spills, modifi cation
of ecosystems, decreased viability of stock through pollution and
For the management of overfi shing, policy options are recommended
diseases, and impact on biological and genetic diversity, having a
based on the root causes identifi ed in the causal chain analysis.
moderate environmental impact on the state of the Baltic Sea, were
Concerning causes related to economy and governance, the
not further analysed.
recommended course of action involves an integration of economic
policies with environmental strategies, in order to strengthen
As mentioned in the beginning of the report, the Baltic Sea is almost an
sustainable fi sheries and to establish more stringent control.
internal sea in the European Union. This will aff ect the environmental
policy in the region signifi cantly. The implementation of the EU Water
For causes related to educational aspects, creation of appropriate
Framework Directive will infl uence the overall water protection
assessment methods leading to the establishment of reliable total
strategy in the region. The purpose of the Directive is to prevent
allowable catches (TACs) is recommended. As regards legal aspects,
further deterioration of water bodies and to protect and enhance the
support for the construction of an appropriate fi shery law that can
status of aquatic ecosystems on land and along the coasts, to promote
effi
ciently manage the new market conditions is emphasised. Here
sustainable water use and ensure the progressive reduction of pollution
it is also important that fi shery legislation incorporates the demands
of water bodies.
for sustainable development. In addition, when establishing a strategy
to come to terms with the above issues, a comprehensive integration
The EU Water Framework Directive requires that the member states
of the socio-economic and environmental aspects will be of great
meet the obligations of international agreements, which in the case of
importance. By recognising these inter-linked environmental/socio-
the Baltic Sea means continued work under the Helsinki Commission,
economic impacts, from data gathering to assessment and further on
and that the HELCOM recommendations are followed, which take into
to settled targets, a more solid ground for managing this issues will
account the vulnerability of the Baltic Sea.
hopefully be created. The transboundary issues such as eutrophication
and fi sheries and how to establish a coordinated approach to
The decisions and recommendations of the Helsinki Commission
ecosystem-based management has been addressed in the "Baltic Sea
link Russia and the EU together, because compliance by Russia is
Joint Comprehensive Environmental Action Programme" (JCP), and the
crucial to the Baltic. The political will of Russia to protect the Baltic
governments of the Baltic Sea States should also be involved in the GEF
Sea environment as well as to improve the living conditions of the
LME Project.
population will be needed for the implementation of EU and HELCOM
decisions to protect the Baltic Sea and its resources from pollution.
An eff
ective management system includes a coordinated
The measures implemented in the St. Petersburg and Kaliningrad
implementation of coastal and open-sea ecosystem-based
CONCLUSIONS AND RECOMMENDATIONS
59
management practices, which should be based on coordinated
national and international fi nancing. The policy options listed are mainly
aimed at cooperation actions in the present and in the decades to come
between the Baltic Sea states through the Helsinki Commission, the
European Union, and the International Baltic Sea Fishery Commission.
However, no quick cure can be foreseen. Despite the protection
measures in the Baltic Sea, improvement will not be immediate because
of the natural slowness of the environment to react and to change. The
improvement will start from the coastal zones, moving slowly towards
the central parts.
The main suggestions are:
To integrate environmental policies with agricultural policies by
supporting cooperation networks and action programmes.
To strengthen sustainable fi sheries by means of increased
cooperation in the fi eld of control and enforcement as well as
to integrate fi shery policies with economic and environmental
strategies.
To implement the EU Water Framework Directive in all the EU
countries situated in the catchment area of the Baltic Sea and to
ensure similar actions in Russia.
60
GIWA REGIONAL ASSESSMENT 17 BALTIC SEA
References
Baldock, D., Dwyer, J. and Sumpsi Vinas, J.M. (2002). Environmental
Baltic University Programme (2004). The Baltic University Programme.
integration and the CAP. Institute for European Environmental
Retrieved Oct. 2004 from: http://www.balticuniv.uu.se
Policy IEEP.
Brouwer, F., Baldock, D. and la Chapelle, C. (2001). Agriculture and Nature
Baltic 21 (1998a). An Agenda 21 for the Baltic Sea Region. Baltic 21 Series
conservation in the candidate countries: perspectives in Interaction.
No 1/98. Agenda 21 for the Baltic Sea Region, Stockholm, Sweden.
Report for the Ministry of Agriculture, Nature Management and
Baltic 21 (1998b). Sector Report on Fisheries, Contribution to Baltic 21.
Fisheries, the Netherlands. LEI Agricultural Economics Research
Baltic 21 Series No 4/98. International Baltic Sea Fishery Commission.
Institute, The Hague, Netherlands.
Agenda 21 for the Baltic Sea Region.
Central Statistical Bureau of Latvia (2001). Statistical Yearbook of Latvia.
Baltic 21 (1998c). Transport Sector Report, Baltic 21 series No 8/98.
Riga, Latvia.
Wuppertal Institute for Climate Environment and Energy GmbH,
Central Statistical Offi
ce (2002). Statistical Yearbook of the Republic of
Wuppertal, Germany.
Poland. Warsaw, Poland.
Baltic 21 (2000). Development in the Baltic Sea Region towards the
CEPI (2004). Collection follows the increased demand of recovered
Baltic 21 Goals - an indicator based assessment. Baltic 21 Series
paper. Special recycling 2003 statistics. Confederation of European
No 2/2000.
Paper Industries. Retrieved Oct. 2004 from: http://www.cepi.org/
Baltic 21 (2002). Agenda 21 for the Baltic Sea Region Sector Report
fi les/SpecRec2003-092022A.pdf
ş Education (Baltic 21 E). Baltic 21 Series No 2/2002. Agenda 21 for
CFP (2004). EU Common Fisheries Policy. Retrieved Dec 2004 from: http:
the Baltic Sea Region.
//europa.eu.int/comm/fi sheries/doc_et_publ/cfp_en.htm
Baltic 21 (2003). Baltic 21 Report 2000-2002: Towards Sustainable
CIA (2002). The World Factbook. U.S. Central Intelligence Agency.
Development in the Baltic Sea Region. Baltic 21 Series No 1/2003.
COWI (1998). Existing and Future Shipping through the Baltic Sea. Tacis,
Agenda 21 for the Baltic Sea Region, Stockholm, Sweden.
DG 1a. 1998.
Baltic 21 (2004a). Overall goals and core indicators for sustainable
Denisov, V.V. (2002). Ecological and geographical basis for the effi
cient
development. Baltic 21. Retrieved Oct 2004 from: http://
nature-use in shelf seas (ecological geography of the sea). Apatity,
www.baltic21.org/reports/indicators
Russia. (In Russian)
Baltic 21 (2004b) Five Years of Regional Progress Towards Sustainable
European Commission (2000). MAGP IV not eff ective enough in
Development. A Baltic 21 Report to the Prime Ministers of the Baltic
dealing with overcapacity. EU press release 01.10.2000. Retrieved
Sea States. Baltic 21 Series No 1/2004. Agenda 21 for the Baltic Sea
Jan. 2005 from: http://www.europa.eu.int/comm/fi sheries/pcp/
Region, Stockholm, Sweden.
faq2_en.htm
Baltic Environmental Forum (2000). Second Baltic State of the
Dvornyakov, V.A. (2000). Fisheries of Russia: on the eve of change.
Environment Report. Riga, Latvia.
Moscow: International Relations. (In Russian)
Baltic Sea Project (2004). About the Baltic Sea Project. Retrieved Oct.
ECCHM (2004). Biodiversity Action Plan for Fisheries. European
2004 from: http://www.kiss.pl/bsp
Community Biodiversity Clearing-House Mechanism. Retrieved
Baltic University Programme (2003). Annual Report 2003. University of
Oct. 2004 from: http://biodiversity-chm.eea.eu.int/convention/
Uppsala, Sweden.
cbd_ec/strategy/fi sh/ENV-2000-681-EN-01- 03-FISH.pdf
REFERENCES
61
EMHI (2000). Annual run-off from Narva River at Vasknarva. Estonian
HELCOM (1986). Water Balance of the Baltic Sea. A Regional Cooperation
Meteorological and Hydrological Institute.
Project of the Baltic Sea States; International Summary Report. Baltic
EU Enlargement (1998). Briefi ng No 29. European Union enlargement
Sea Environment Proceedings No. 16. Helsinki Commission, Helsinki,
and fi sheries. Retrieved Oct. 2004 from: http://www.europarl.eu.int/
Finland.
enlargement/briefi ngs/29a2_en.htm
HELCOM (1987a). First Periodic Assessment of the State of the Marine
Eurobalt (2004). Seagull Project. Retrieved Sept. 2004 from: http://
Environment of the Baltic Sea Area, 1980-1985; Background
www.eurobalt.org/english/projects/seagull/seagull.asp
document. Baltic Sea Environment Proceedings No 17 B. Helsinki
European Council (1980). Council Directive 80/778/EEC of 15 July 1980
Commission, Helsinki, Finland.
relating to the Quality of Water Intended for Human Consumption.
HELCOM (1987b). First Baltic Sea Pollution Load Compilation. Baltic Sea
Offi
cial Journal of the European Communities 229, 30/08/1980.
Environment Proceedings, No. 20. Helsinki Commission, Helsinki,
European Council (1991a). Council Directive 91/676/EEC of 12 December
Finland.
1991 concerning the Protection of Waters Against Pollution Caused
HELCOM (1990). Second Periodic Assessment of the State of the Marine
by Nitrates from Agricultural Sources. Offi
cial Journal of the
Environment of the Baltic Sea, 1984-1988; Background document.
European Communities 375, 31/12/1991.
Baltic Sea Environment Proceedings, No. 35B. Helsinki Commission,
European Council (1991b). Council Directive 91/271/EEC of 21 May 1991
Helsinki, Finland.
concerning Urban Waste-water Treatment. Offi
cial Journal of the
HELCOM (1993a). Second Baltic Sea Pollution Load Compilation. Baltic
European Communities 135 , 30/05/1991.
Sea Environment Proceedings, No. 45. Helsinki Commission,
European Council (1992). Council Directive 92/43/EEC of 21 May 1992 on
Helsinki, Finland.
the Conservation of Natural Habitats and of Wild Fauna and Flora.
HELCOM (1993b). First Assessment of the State of the Coastal Waters of
Offi
cial Journal of the European Communities 206, 22/07/1992.
the Baltic Sea. Baltic Sea Environment Proceedings, No. 54. Helsinki
European Council (1996). Council Directive 96/62/EC of 27 September
Commission, Helsinki, Finland.
1996 on Ambient Air Quality Assessment and Management. Offi
cial
HELCOM (1995). Radioactivity in the Baltic Sea 1984-1991. Baltic Sea
Journal of the European Communities 296, 21/11/1996.
Environment Proceedings, No. 61 Helsinki Commission, Helsinki,
European Council (1998). Council Directive 98/83/EC of 3 November
Finland.
1998 on the Quality of Water Intended for Human Consumption.
HELCOM (1996a). Third Periodic Assessment of the State of the Marine
Offi
cial Journal of the European Communities 330, 05/12/1998.
Environment of the Baltic Sea, 1989-1993; Executive Summary.
European Parliament and Council (2000). Directive 2000/60/EC of
Baltic Sea Environment Proceedings, No. 64A. Helsinki Commission,
the European Parliament and of the Council of 23 October 2000
Helsinki, Finland.
establishing a Framework for Community Action in the Field of
HELCOM (1996b). Third Periodic Assessment of the State of the Marine
Water Policy. Offi
cial Journal of the European Communities 327,
Environment of the Baltic Sea, 1989-1993; Background document.
22/12/2000.
Baltic Sea Environment Proceedings, No. 64B. Helsinki Commission,
EEA (1995). Europe's Environment. The Dobris Assessment. European
Helsinki, Finland.
Environment Agency, Offi
ce for Off cial Publication of the European
HELCOM (1998a). The Third Baltic Sea Pollution Load Compilation.
Communities, Luxembourg.
Baltic Sea Environment Proceedings, No. 70. Helsinki Commission,
FAO (1993). Marine Fisheries and The Law of the Sea: A Decade of
Helsinki, Finland.
Change. The State of Food and Agriculture 1992. Fisheries Circular
HELCOM (1998b). The Baltic Sea Joint Comprehensive Environmental
FAO No. 853. Food and Agriculture Organization of the United
Action Programme: Recommendations for Updating and
Nations, Rome, Italy.
Strengthening. Baltic Sea Environment Proceedings, No. 72. Helsinki
FAO (1997). Review of the State of World Aquaculture. Former USSR
Commission, Helsinki, Finland.
Area. FAO Fisheries Circular No. 886 Rev 1. Food and Agriculture
HELCOM (1998c). Red List of Marine and Coastal Biotope Complexes
Organization of the United Nations, Rome, Italy.
of the Baltic Sea, Belt Sea and Kattegat. Baltic Sea Environment
FAO (1996). Fisheries and aquaculture in Europe: situation and outlook
Proceedings, No. 75. Helsinki Commission, Helsinki, Finland.
in 1996. FAO Fisheries Circular No. 911. Food and Agriculture
HELCOM (2001). Fourth Periodic Assessment of the State of the Marine
Organization of the United Nations, Rome, Italy.
Environment of the Baltic Sea, 1994-1998; Executive Summary.
Baltic Sea Environment Proceedings, No. 82A. Helsinki Commission,
Helsinki, Finland.
62
GIWA REGIONAL ASSESSMENT 17 BALTIC SEA
HELCOM (2002). Environment of the Baltic Sea Area 1994-1998. Baltic
LME (1990). Large Marine Ecosystems: Patterns, Processes, and Yields.
Sea Environmental Proceedings, No. 82B. Helsinki Commission,
Sherman, K., Alexander, L.M. and Gold, B.D. (eds.) AAAS Publications,
Helsinki, Finland.
Washington DC.
HELCOM (2003a). The Baltic Sea Joi8nt Comprehensive Environmental
Melvasalo, T., Pawlak, J., Grasshoff , K., Thorell, L. and Tsiban, A. (eds.) (1981).
Action Programme (JCP) ş Ten Years of Implementation. Baltic Sea
Assessment of the eff ects of pollution on the natural resources of
Environment Proceedings No. 88. Helsinki Commission, Helsinki,
the Baltic Sea, 1980. Baltic Sea Environment Proceedings No. 5B.
Finland.
Helsinki Commission, Helsinki, Finland.
HELCOM (2003b). The Baltic Sea Regional Project. Retrieved Oct. 2004
Finnish Ministry of Agriculture and Forestry (2003). Fisheries Statistic.
from: http://www.helcom.fi
/helcom/projectsmeetings/GEF-
Retrieved Oct 2004 from: http://www.mmm.fi /svenska/fi skeri/
BSRP.html
statistik (In Swedish)
HELCOM (2004a). The Fourth Baltic Sea Pollution Load Compilation (PLC-
NEMO (2002). Baltic Sea Alien Species Database. Baltic Marine Biologists
4) Baltic Sea Environment Proceedings No. 93. Helsinki Commission,
Working Group on Non-indigenous Estuarine and Marine
Helsinki, Finland.
Organisms. Retrieved Oct. 2004 from: http://www.ku.lt/nemo/
HELCOM (2004b). Dioxins in the Baltic Sea. Environmental Focal Point
ORNL (2003). Landscan 2002. Oak Ridge National Laboratory. Retrieved
Information. Helsinki Commission, Helsinki. Finland.
Nov 2003 from: http://www.ornl.gov/gist
Helsinki Convention (1992). Convention on the Protection of the Marine
Partanen-Hertell, M., Harju-Autti, P., Kreft-Burman, K. and Pemberton, D.
Environment of the Baltic Sea Area. Entered into force on 17 January
(1999). Raising Environmental Awareness in the Baltic Sea area. The
2000.
Finnish Environment No. 327. Helsinki, Finland.
Hilden, M. (1990). Fishery on inland reservoirs of Finland. Fish Industry,
Pitkńnen, H. (2004). The State of the Coastal and Open Sea Areas at
9:48-52. (In Russian)
the Turn of the New Millennium; the Background Documents of
ICES (1999). Report of the ICES Advisory Committee on the Marine
the Finland's Programme for the Protection of the Baltic Sea. The
Environment 1998. Cooperative Research Reports No. 233.
Finnish Environment No. 669. Helsinki, Finland. (In Finnish)
International Council for the Exploration of the Sea, Copenhagen,
Pitkńńnen, H. and Lńńne, A. (2001). Evaluation of the Implementation
Denmark.
of the 1988 Ministerial Declaration regarding Nutrient Load
ICES (2001). Report of the ICES Advisory Committee on Fisheries
Reductions. Working Document by The Finnish Environment
Management 2001. ICES Cooperative Report No. 246. International
Institute for Helsinki Commission. Helsinki Commission, Helsinki,
Council for the Exploration of the Sea, Copenhagen, Denmark.
Finland.
ICES (2003). Environmental Status of the European Seas. International
Reynolds, A. and White, A. (1997). Marketing Climate-Protective
Council for the Exploration of the Sea, Copenhagen, Denmark.
Transport. SEI-Boston Centre.
IMF (2001). World Economic Outlook ş October 1999. A Survey by the
Roman, M. (2002). Report on water pricing/cost recovery in the Baltic
Staff of the International Monetary Fund. Washington DC.
Sea countries. Helsinki Commission, Finland.
Iudicello, S., Weber, M. and Wieland, R. (1999). Fish, Markets, and
Russian Statistical Yearbook (1998). State Committee of Russia for
Fishermen: The Economics of Overfi shing. Island Press.
Statistics. Logos Publishing House, Moscow, The Russian Federation.
Karlstr÷m, Í. (No Date). The Baltic and Torne River salmon (Salmo
(In Russian)
salar L.): biological status, management and local development.
Rytk÷nen, J., Siitonen, L., Riipi, T., Sassi, J. and Sukselainen, J. (2002).
Retrieved Jan 2005 from: http://www.tornedalen.org/pdf_fi ler/Bal
Statistical Analyses of the Baltic Maritime Traffi
c. SEASTAT-
tic%20and%20Torne%20river%20salmon.pdf
1 Finnish Environment Institute and Ministry of Traffi
c and
Kotenev, B.N. (2001). The Ecosystem Strategy of an Evaluation of
Communications.
Bioresources of World Ocean; World Catch and Reserves of a Source
Sherman, K., Jaworski, N.A. and Smayda, T.J. (1996). The Northeast Shelf
of Raw Materials. In: World Ocean: Use of Biological Resources, 2:
Ecosystem-Assessment, Sustainability, and Management. Blackwell
69-86. Moscow, Russia. (In Russian)
Science.
Lńńne, A., Pitkńnen, H., Arheimer, B., Behrendt, H., Jarosinski, W., Lucane,
Statistical Offi
ce of Estonia (2002a). Indicators of Sustainable
S., Pachel, K., Rńike, A., Shekhovtsov, A., Svendsen, L.M. and Valatka,
Development. Tallinn. Estonia.
S. (2002). Evaluation of the implementation of the 1988 Ministerial
Statistical Offi
ce of Estonia (2002b). Statistical Yearbook of Estonia.
Declaration regarding nutrient load reductions in the Baltic Sea
Tallinn, Estonia.
catchment area. The Finnish Environment No. 524.
REFERENCES
63
Statistics Finland (2002). Statistical Yearbook of Finland. Helsinki,
Finland.
Statistics Lithuania (2002). Statistical Yearbook of Lithuania. Vilnius,
Lithuania.
Statistics Sweden (2003). Statistical Yearbook of Sweden. Stockholm,
Sweden.
Titova, G. (2001). Rental Payments for Aqua Bioresources. Part 1. An
evaluation of Russia's state quotas management system. UK
Geophylos Autumn, 1(2):116-128.
UNECE (1979). Convention on Long-range Transboundary Air Pollution.
United Nations Economic Commission for Europe.
UN-ECE/FAO (2000). Forest Resources of Europe, CIS, North America,
Australia, Japan and New Zealand (TBFRA-2000). United Nations
Economic Commission for Europe and Food and Agricultural
Organisation of the United Nations.
UNESCO (1994). Fishes and fi sheries in the coastal zone of Estonia.
In: Volskis, R. (ed.) Species and Environment. Proceedings of the
International Meeting on The Urbanization and theProtection of the
Natural Biocenoses in the Baltic Coasts, Joudkrante, Lithuania, 4-8
October 1994. UNESCO ROSTE Technical Report No. 22.
United Nations (2002). National Information on Sustainable
Development. Retrieved Sept. 2004 from: http://www.un.org/esa/
sustdev/natlinfo/natlinfo.htm
Voytolvsky, G.K., Kireev V.E., Korzun V.A., Ranenko V.V. and Titova G.D.
(2003). Speculations About Fishery: Search of the Approaches to
Sustainable Development. The Theory and Practice of Marine
Activity No. 1. Council on Disposal of Productive Forces, Moscow,
Russia. (In Russian)
Walday, M. and Kroglund, T. (2002). The Baltic Sea; the largest brackish
sea in the world. The European Environment Agency, Copenhagen,
Denmark.
Westing, A.H. (1989). Comprehensive Security for the Baltic, An
Environmental Approach. International Peace Research Institute
IPRI, Oslo, Norway and UNEP, Nairobi, Kenya.
World Bank (1999). World Development Indicators. Washington DC, US.
WSSD (2002). Report of the World Summit on Sustainable Development.
Johannesburg, South Africa, 26 August-4 September 2002. Report
A/CONF.199/20. United Nations, New York.
64
GIWA REGIONAL ASSESSMENT 17 BALTIC SEA
Annexes
Annex I
List of contributing authors and organisations
Authors
Name
Institutional Affiliation
Country
Field of work
Ain Lńńne
Consultant Company OY ECOTEST
Estonia
Pollution load to the environment
Galina Titova
Laboratory of Economy of Use of Nature, St. Petersburg Research Centre for Ecological Security of RAS
Russia
Environmental economy
Eva Kraav
Ministry of the Environment
Estonia
Environmental economy
Regional Task team
Name
Institutional Affiliation
Country
Field of work
Eugeniusz Andrulewitcz
Sea Fisheries Institute, Department of Fisheries Oceanography and Marine Ecology
Poland
Chemical pollution
Ain Lńńne
Consultant Company OY ECOTEST
Estonia
Pollution load to the environment
Elmira Boikova
Institute of Biology of Latvian Academy for Sciences
Latvia
Marine and freshwater biology
Kaisa Kononen
Maj and Tor Nessling Foundation
Finland
Eutrophication
Sverker Evans
Swedish Environmental Protection Agency
Sweden
International conventions
Guenther Nausch
Baltic Sea Research Institute
Germany
Marine biology
Sergei Olenin
Klaipeda University Centre of System Analysis
Lithuania
Environmental assessment
Tatjana Roshkoshnaya
Laboratory of Economy of Use of Nature, St. Petersburg Research Centre for Ecological Security of RAS
Russia
Environmental economy
Galina Titova
Laboratory of Economy of Use of Nature, St. Petersburg Research Centre for Ecological Security of RAS
Russia
Environmental economy
Susanna Stymne
University of Kalmar
Sweden
Environmental economy
Hans Borg
Stockholm University
Sweden
Ecotoxicology
Astrid Saava
University of Tartu
Estonia
Public health
ANNEXES
65
Annex II
Detailed scoring tables
I: Freshwater shortage
II: Pollution
Weight
Weight
Environmental
Environmental
Environmental issues
Score
Weight
averaged
Environmental issues
Score
Weight
averaged
concern
concern
score
score
1. Modification of stream flow
1
N/A
Freshwater shortage
2
4. Microbiological
1
N/A
Pollution
3
2. Pollution of existing supplies
2
N/A
5. Eutrophication
3
N/A
3. Changes in the water table
1
N/A
6. Chemical
2
N/A
7. Suspended solids
1
N/A
Criteria for Economics impacts
Raw score
Score
Weight %
8. Solid wastes
1
N/A
Very small
Very large
Size of economic or public sectors affected
1
N/A
0 1 2 3
9. Thermal
0
N/A
Minimum
Severe
Degree of impact (cost, output changes etc.)
1
N/A
10. Radionuclides
1
N/A
0 1 2 3
Occasion/Short
Continuous
Frequency/Duration
1
N/A
11. Spills
2
N/A
0 1 2 3
Weight average score for Economic impacts
1
Criteria for Economics impacts
Raw score
Score
Weight %
Criteria for Health impacts
Raw score
Score
Weight %
Very small
Very large
Very small
Very large
Size of economic or public sectors affected
2
N/A
Number of people affected
1
N/A
0 1 2 3
0 1 2 3
Minimum
Severe
Minimum
Severe
Degree of impact (cost, output changes etc.)
2
N/A
Degree of severity
1
N/A
0 1 2 3
0 1 2 3
Occasion/Short
Continuous
Occasion/Short
Continuous
Frequency/Duration
2
N/A
Frequency/Duration
1
N/A
0 1 2 3
0 1 2 3
Weight average score for Economic impacts
2
Weight average score for Health impacts
1
Criteria for Health impacts
Raw score
Score
Weight %
Criteria for Other social and
Raw score
Score
Weight %
community impacts
Very small
Very large
Number of people affected
2
N/A
Very small
Very large
0 1 2 3
Number and/or size of community affected
1
N/A
0 1 2 3
Minimum
Severe
Degree of severity
2
N/A
Minimum
Severe
0 1 2 3
Degree of severity
1
N/A
0 1 2 3
Occasion/Short
Continuous
Frequency/Duration
2
N/A
Occasion/Short
Continuous
0 1 2 3
Frequency/Duration
1
N/A
0 1 2 3
Weight average score for Health impacts
2
Weight average score for Other social and community impacts
1
Criteria for Other social and
Raw score
Score
Weight %
community impacts
Note: N/A = Not applied
Very small
Very large
Number and/or size of community affected
1
N/A
0 1 2 3
Minimum
Severe
Degree of severity
1
N/A
0 1 2 3
Occasion/Short
Continuous
Frequency/Duration
1
N/A
0 1 2 3
Weight average score for Other social and community impacts
1
Note: N/A = Not applied
66
GIWA REGIONAL ASSESSMENT 17 BALTIC SEA
III: Habitat and community modification
IV: Unsustainable exploitation of fish
Weight
and other living resources
Environmental
Environmental issues
Score
Weight
averaged
concern
score
Weight
Environmental
Environmental issues
Score
Weight %
averaged
Habitat and community
concern
12. Loss of ecosystems
1
N/A
2
score
modification
13. Modification of ecosystems or
Unsustainable
14. Overexploitation
3
N/A
2
ecotones, including community
2
N/A
exploitation of fish
structure and/or species composition
15. Excessive by-catch and
1
N/A
discards
16. Destructive fishing practices
1
N/A
Criteria for Economics impacts
Raw score
Score
Weight %
Very small
Very large
17. Decreased viability of stock
Size of economic or public sectors affected
1
N/A
2
N/A
0 1 2 3
through pollution and disease
Minimum
Severe
18. Impact on biological and
Degree of impact (cost, output changes etc.)
1
N/A
2
N/A
0 1 2 3
genetic diversity
Occasion/Short
Continuous
Frequency/Duration
1
N/A
0 1 2 3
Criteria for Economics impacts
Raw score
Score
Weight %
Weight average score for Economic impacts
1
Very small
Very large
Size of economic or public sectors affected
2
N/A
Criteria for Health impacts
Raw score
Score
Weight %
0 1 2 3
Minimum
Severe
Very small
Very large
Degree of impact (cost, output changes etc.)
2
N/A
Number of people affected
1
N/A
0 1 2 3
0 1 2 3
Occasion/Short
Continuous
Minimum
Severe
Frequency/Duration
2
N/A
Degree of severity
1
N/A
0 1 2 3
0 1 2 3
Occasion/Short
Continuous
Weight average score for Economic impacts
2
Frequency/Duration
1
N/A
0 1 2 3
Criteria for Health impacts
Raw score
Score
Weight %
Weight average score for Health impacts
1
Very small
Very large
Criteria for Other social and
Number of people affected
0
N/A
Raw score
Score
Weight %
0 1 2 3
community impacts
Minimum
Severe
Very small
Very large
Degree of severity
0
N/A
Number and/or size of community affected
1
N/A
0 1 2 3
0 1 2 3
Occasion/Short
Continuous
Minimum
Severe
Frequency/Duration
0
N/A
Degree of severity
1
N/A
0 1 2 3
0 1 2 3
Occasion/Short
Continuous
Weight average score for Health impacts
0
Frequency/Duration
1
N/A
0 1 2 3
Criteria for Other social and
Raw score
Score
Weight %
Weight average score for Other social and community impacts
1
community impacts
Very small
Very large
Number and/or size of community affected
2
N/A
Note: N/A = Not applied
0 1 2 3
Minimum
Severe
Degree of severity
2
N/A
0 1 2 3
Occasion/Short
Continuous
Frequency/Duration
2
N/A
0 1 2 3
Weight average score for Other social and community impacts
2
Note: N/A = Not applied
ANNEXES
67
V: Global change
Weight
Environmental
Environmental issues
Score
Weight
averaged
concern
score
19. Changes in the hydrological cycle
1
N/A
Global change
0
20. Sea level change
0
N/A
21. Increased UV-B radiation as a
0
N/A
result of ozone depletion
22. Changes in ocean CO2
0
N/A
source/sink function
Criteria for Economics impacts
Raw score
Score
Weight %
Very small
Very large
Size of economic or public sectors affected
1
N/A
0 1 2 3
Minimum
Severe
Degree of impact (cost, output changes etc.)
1
N/A
0 1 2 3
Occasion/Short
Continuous
Frequency/Duration
1
N/A
0 1 2 3
Weight average score for Economic impacts
1
Criteria for Health impacts
Raw score
Score
Weight %
Very small
Very large
Number of people affected
1
N/A
0 1 2 3
Minimum
Severe
Degree of severity
1
N/A
0 1 2 3
Occasion/Short
Continuous
Frequency/Duration
1
N/A
0 1 2 3
Weight average score for Health impacts
1
Criteria for Other social and
Raw score
Score
Weight %
community impacts
Very small
Very large
Number and/or size of community affected
1
N/A
0 1 2 3
Minimum
Severe
Degree of severity
1
N/A
0 1 2 3
Occasion/Short
Continuous
Frequency/Duration
1
N/A
0 1 2 3
Weight average score for Other social and community impacts
1
Note: N/A = Not applied
Comparative environmental and socio-economic impacts of each GIWA concern
Types of impacts
Environmental score
Economic score
Human health score
Social and community score
Concern
Overall score
Rank
Pr
esent (a)
F
uture (b)
Pr
esent (a)
F
uture (b)
Pr
esent (a)
F
uture (b)
Pr
esent (a)
F
uture (b)
Freshwater shortage
2
2
1
1
1
1
1
1
1.3
4
Pollution
3
2
2
3
2
2
1
2
2.1
1
Habitat and community
2
2
1
2
1
1
1
1
1.4
3
modification
Unsustainable exploitation of fish
2
2
2
2
0
0
2
2
1.5
2
and other living resources
Global change
0
1
1
2
1
2
1
2
1.3
5
68
GIWA REGIONAL ASSESSMENT 17 BALTIC SEA
Annex III
List of conventions and
specific laws that affect water
use in the region
The Convention on Fishing and Conservation of the Living
Resources in the Baltic Sea and the Belts, signed in Gdansk in
September 1973 (Gdansk Convention);
The Convention of the Protection of the Marine Environment of the
Baltic Sea, signed in Helsinki in March 1974 (Helsinki Convention);
The Nordic Environmental Protection Convention, signed in
Stockholm in February 1974 (Stockholm Convention);
The Convention on the Conservation of European Wildlife and Natural
Habitats, signed in Bern in September 1979 (Bern Convention);
The Convention on Long-Range Transboundary Air Pollution,
signed in Geneva in November 1979;
The Convention on the Protection and Use of Transboundary
Watercourses and International Lakes, signed in Helsinki March
1992 and entered into force in 1996;
United Nations Convention of the Law of the Sea (UNCLOS);
UNESCO
World
Heritage
Convention;
United
Nations
Convention
on
Biological
Diversity;
The Ramsar Convention on Wetlands, signed in Ramsar, Iran, 1972;
International Convention for the Prevention of Pollution from
Ships, 1973, as modifi ed by the Protocol of 1978 relating thereto
(MARPOL 73/78);
Convention on the Prevention of Marine Pollution by Dumping of
Wastes and Other Matter (London Convention);
The European Parlament and the Council of the European Union
Directive 2000/60/EC (Water Framework Directive).
ANNEXES
69
The Global International
Waters Assessment
This report presents the results of the Global International Waters
Adequately managing the world's aquatic resources for the benefi t of
Assessment (GIWA) of the transboundary waters of the Baltic Sea.
all is, for a variety of reasons, a very complex task. The liquid state of
This and the subsequent chapter off er a background that describes
the most of the world's water means that, without the construction
the impetus behind the establishment of GIWA, its objectives and
of reservoirs, dams and canals it is free to fl ow wherever the laws of
how the GIWA was implemented.
nature dictate. Water is, therefore, a vector transporting not only a
wide variety of valuable resources but also problems from one area
to another. The effl
uents emanating from environmentally destructive
activities in upstream drainage areas are propagated downstream
The need for a global
and can aff ect other areas considerable distances away. In the case of
international waters
transboundary river basins, such as the Nile, Amazon and Niger, the
assessment
impacts are transported across national borders and can be observed
in the numerous countries situated within their catchments. In the case
of large oceanic currents, the impacts can even be propagated between
Globally, people are becoming increasingly aware of the degradation of
continents (AMAP 1998). Therefore, the inextricable linkages within
the world's water bodies. Disasters from fl oods and droughts, frequently
and between both freshwater and marine environments dictates that
reported in the media, are considered to be linked with ongoing global
management of aquatic resources ought to be implemented through
climate change (IPCC 2001), accidents involving large ships pollute public
a drainage basin approach.
beaches and threaten marine life and almost every commercial fi sh stock
is exploited beyond sustainable limits - it is estimated that the global
In addition, there is growing appreciation of the incongruence
stocks of large predatory fi sh have declined to less that 10% of pre-
between the transboundary nature of many aquatic resources and the
industrial fi shing levels (Myers & Worm 2003). Further, more than 1 billion
traditional introspective nationally focused approaches to managing
people worldwide lack access to safe drinking water and 2 billion people
those resources. Water, unlike laws and management plans, does not
lack proper sanitation which causes approximately 4 billion cases of
respect national borders and, as a consequence, if future management
diarrhoea each year and results in the death of 2.2 million people, mostly
of water and aquatic resources is to be successful, then a shift in focus
children younger than fi ve (WHO-UNICEF 2002). Moreover, freshwater
towards international cooperation and intergovernmental agreements
and marine habitats are destroyed by infrastructure developments,
is required (UN 1972). Furthermore, the complexity of managing the
dams, roads, ports and human settlements (Brinson & Malvßrez 2002,
world's water resources is exacerbated by the dependence of a great
Kennish 2002). As a consequence, there is growing public concern
variety of domestic and industrial activities on those resources. As a
regarding the declining quality and quantity of the world's aquatic
consequence, cross-sectoral multidisciplinary approaches that integrate
resources because of human activities, which has resulted in mounting
environmental, socio-economic and development aspects into
pressure on governments and decision makers to institute new and
management must be adopted. Unfortunately however, the scientifi c
innovative policies to manage those resources in a sustainable way
information or capacity within each discipline is often not available or
ensuring their availability for future generations.
is inadequately translated for use by managers, decision makers and
GLOBAL INTERNATIONAL WATERS ASSESSMENT
i
policy developers. These inadequacies constitute a serious impediment
The Global Environment Facility (GEF)
to the implementation of urgently needed innovative policies.
The Global Environment Facility forges international co-operation and fi nances actions to address
six critical threats to the global environment: biodiversity loss, climate change, degradation of
international waters, ozone depletion, land degradation, and persistent organic pollutants (POPs).
Continual assessment of the prevailing and future threats to aquatic
The overall strategic thrust of GEF-funded international waters activities is to meet the incremental
ecosystems and their implications for human populations is essential if
costs of: (a) assisting groups of countries to better understand the environmental concerns of
their international waters and work collaboratively to address them; (b) building the capacity
governments and decision makers are going to be able to make strategic
of existing institutions to utilise a more comprehensive approach for addressing transboundary
policy and management decisions that promote the sustainable use of
water-related environmental concerns; and (c) implementing measures that address the priority
transboundary environmental concerns. The goal is to assist countries to utilise the full range of
those resources and respond to the growing concerns of the general
technical, economic, fi nancial, regulatory, and institutional measures needed to operationalise
public. Although many assessments of aquatic resources are being
sustainable development strategies for international waters.
conducted by local, national, regional and international bodies, past
United Nations Environment Programme (UNEP)
assessments have often concentrated on specifi c themes, such as
United Nations Environment Programme, established in 1972, is the voice for the environment
biodiversity or persistent toxic substances, or have focused only on
within the United Nations system. The mission of UNEP is to provide leadership and encourage
partnership in caring for the environment by inspiring, informing, and enabling nations and
marine or freshwaters. A globally coherent, drainage basin based
peoples to improve their quality of life without compromising that of future generations.
assessment that embraces the inextricable links between transboundary
UNEP work encompasses:
freshwater and marine systems, and between environmental and
Assessing global, regional and national environmental conditions and trends;
Developing international and national environmental instruments;
societal issues, has never been conducted previously.
Strengthening institutions for the wise management of the environment;
Facilitating the transfer of knowledge and technology for sustainable development;
Encouraging new partnerships and mind-sets within civil society and the private sector.
International call for action
University of Kalmar
University of Kalmar hosts the GIWA Co-ordination Offi ce and provides scientifi c advice and
administrative and technical assistance to GIWA. University of Kalmar is situated on the coast of
The need for a holistic assessment of transboundary waters in order to
the Baltic Sea. The city has a long tradition of higher education; teachers and marine offi cers have
been educated in Kalmar since the middle of the 19th century. Today, natural science is a priority
respond to growing public concerns and provide advice to governments
area which gives Kalmar a unique educational and research profi le compared with other smaller
universities in Sweden. Of particular relevance for GIWA is the established research in aquatic and
and decision makers regarding the management of aquatic resources
environmental science. Issues linked to the concept of sustainable development are implemented
was recognised by several international bodies focusing on the global
by the research programme Natural Resources Management and Agenda 21 Research School.
environment. In particular, the Global Environment Facility (GEF)
Since its establishment GIWA has grown to become an integral part of University activities.
The GIWA Co-ordination offi ce and GIWA Core team are located at the Kalmarsund Laboratory, the
observed that the International Waters (IW) component of the GEF
university centre for water-related research. Senior scientists appointed by the University are actively
suff ered from the lack of a global assessment which made it diffi
cult
involved in the GIWA peer-review and steering groups. As a result of the cooperation the University
can offer courses and seminars related to GIWA objectives and international water issues.
to prioritise international water projects, particularly considering
the inadequate understanding of the nature and root causes of
environmental problems. In 1996, at its fourth meeting in Nairobi, the
causes of degradation of the transboundary aquatic environment and
GEF Scientifi c and Technical Advisory Panel (STAP), noted that: "Lack of
options for addressing them. These pro cesses led to the development
an International Waters Assessment comparable with that of the IPCC, the
of the Global International Waters Assessment (GIWA) that would be
Global Biodiversity Assessment, and the Stratospheric Ozone Assessment,
implemented by the United Nations Environment Programme (UNEP) in
was a unique and serious impediment to the implementation of the
conjunction with the University of Kalmar, Sweden, on behalf of the GEF.
International Waters Component of the GEF".
The GIWA was inaugurated in Kalmar in October 1999 by the Executive
Director of UNEP, Dr. Klaus T÷pfer, and the late Swedish Minister of the
The urgent need for an assessment of the causes of environmental
Environment, Kjell Larsson. On this occasion Dr. T÷pfer stated: "GIWA
degradation was also highlighted at the UN Special Session on
is the framework of UNEP┤s global water assessment strategy and will
the Environment (UNGASS) in 1997, where commitments were
enable us to record and report on critical water resources for the planet for
made regarding the work of the UN Commission on Sustainable
consideration of sustainable development management practices as part of
Development (UNCSD) on freshwater in 1998 and seas in 1999. Also in
our responsibilities under Agenda 21 agreements of the Rio conference".
1997, two international Declarations, the Potomac Declaration: Towards
enhanced ocean security into the third millennium, and the Stockholm
The importance of the GIWA has been further underpinned by the UN
Statement on inter action of land activities, freshwater and enclosed
Millennium Development Goals adopted by the UN General Assembly
seas, specifi cally emphasised the need for an investigation of the root
in 2000 and the Declaration from the World Summit on Sustainable
ii
REGIONAL ASSESSMENTS
Development in 2002. The development goals aimed to halve the
International waters and transboundary issues
proportion of people without access to safe drinking water and basic
The term "international waters", as used for the purposes of the GEF Operational Strategy,
sanitation by the year 2015 (United Nations Millennium Declaration
includes the oceans, large marine ecosystems, enclosed or semi-enclosed seas and estuaries, as
well as rivers, lakes, groundwater systems, and wetlands with transboundary drainage basins
2000). The WSSD also calls for integrated management of land, water and
or common borders. The water-related ecosystems associated with these waters are considered
living resources (WSSD 2002) and, by 2010, the Reykjavik Declaration on
integral parts of the systems.
The term "transboundary issues" is used to describe the threats to the aquatic environment
Responsible Fisheries in the Marine Ecosystem should be implemented
linked to globalisation, international trade, demographic changes and technological advancement,
by all countries that are party to the declaration (FAO 2001).
threats that are additional to those created through transboundary movement of water. Single
country policies and actions are inadequate in order to cope with these challenges and this makes
them transboundary in nature.
The international waters area includes numerous international conventions, treaties, and
agreements. The architecture of marine agreements is especially complex, and a large number
The conceptual framework
of bilateral and multilateral agreements exist for transboundary freshwater basins. Related
conventions and agreements in other areas increase the complexity. These initiatives provide
and objectives
a new opportunity for cooperating nations to link many different programmes and instruments
into regional comprehensive approaches to address international waters.
Considering the general decline in the condition of the world's aquatic
the large-scale deforestation of mangroves for ponds (Primavera 1997).
resources and the internationally recognised need for a globally
Within the GIWA, these "non-hydrological" factors constitute as large
coherent assessment of transboundary waters, the primary objectives
a transboundary infl uence as more traditionally recognised problems,
of the GIWA are:
such as the construction of dams that regulate the fl ow of water into
To provide a prioritising mechanism that allows the GEF to focus
a neighbouring country, and are considered equally important. In
their resources so that they are used in the most cost eff ective
addition, the GIWA recognises the importance of hydrological units that
manner to achieve signifi cant environmental benefi ts, at national,
would not normally be considered transboundary but exert a signifi cant
regional and global levels; and
infl uence on transboundary waters, such as the Yangtze River in China
To highlight areas in which governments can develop and
which discharges into the East China Sea (Daoji & Daler 2004) and the
implement strategic policies to reduce environmental degradation
Volga River in Russia which is largely responsible for the condition of
and improve the management of aquatic resources.
the Caspian Sea (Barannik et al. 2004). Furthermore, the GIWA is a truly
regional assessment that has incorporated data from a wide range of
In order to meet these objectives and address some of the current
sources and included expert knowledge and information from a wide
inadequacies in international aquatic resources management, the GIWA
range of sectors and from each country in the region. Therefore, the
has incorporated four essential elements into its design:
transboundary concept adopted by the GIWA extends to include
A broad transboundary approach that generates a truly regional
impacts caused by globalisation, international trade, demographic
perspective through the incorporation of expertise and existing
changes and technological advances and recognises the need for
information from all nations in the region and the assessment of
international cooperation to address them.
all factors that infl uence the aquatic resources of the region;
A drainage basin approach integrating freshwater and marine
systems;
A multidisciplinary approach integrating environmental and socio-
The organisational structure and
economic information and expertise; and
implementation of the GIWA
A coherent assessment that enables global comparison of the
results.
The scale of the assessment
Initially, the scope of the GIWA was confi ned to transboundary waters
The GIWA builds on previous assessments implemented within the GEF
in areas that included countries eligible to receive funds from the GEF.
International Waters portfolio but has developed and adopted a broader
However, it was recognised that a truly global perspective would only
defi nition of transboundary waters to include factors that infl uence the
be achieved if industrialised, GEF-ineligible regions of the world were
quality and quantity of global aquatic resources. For example, due to
also assessed. Financial resources to assess the GEF-eligible countries
globalisation and international trade, the market for penaeid shrimps
were obtained primarily from the GEF (68%), the Swedish International
has widened and the prices soared. This, in turn, has encouraged
Development Cooperation Agency (Sida) (18%), and the Finnish
entrepreneurs in South East Asia to expand aquaculture resulting in
Department for International Development Cooperation (FINNIDA)
GLOBAL INTERNATIONAL WATERS ASSESSMENT
iii
1
15
11
16
14
12
28
10
13
17
25
29
9
18
30
19
23
22
8
7
31
6
20
24
26
35
33
2
34
27
5
21
50
32
51
36
37
41
52
4
49
53
43
65
55
48
54
3
42
56
46
62
47
40b
40a
57
62
45b
39
59
45a
58
60
64
44
61
38
63
66
1 Arctic
12
Norwegian Sea (LME)
24 Aral
Sea
36 East-China
Sea
(LME)
46
Somali Coastal Current (LME)
58 North
Australian
Shelf
(LME)
2 Gulf
of
Mexico
(LME)
13 Faroe
plateau
25
Gulf of Alaska (LME)
37
Hawaiian Archipelago (LME)
47
East African Rift Valley Lakes
59 Coral
Sea
Basin
3
Caribbean Sea (LME)
14
Iceland Shelf (LME)
26
California Current (LME)
38
Patagonian Shelf (LME)
48
Gulf of Aden
60 Great
Barrier
Reef
(LME)
4 Caribbean
Islands
15
East Greenland Shelf (LME)
27
Gulf of California (LME)
39 Brazil
Current
(LME)
49
Red Sea (LME)
61 Great
Australian
Bight
5
Southeast Shelf (LME)
16
West Greenland Shelf (LME)
28
East Bering Sea (LME)
40a Brazilian Northeast (LME)
50 The
Gulf
62
Small Island States
6
Northeast Shelf (LME)
17
Baltic Sea (LME)
29
West Bering Sea (LME)
40b Amazon
51 Jordan
63 Tasman
Sea
7
Scotian Shelf (LME)
18 North
Sea
(LME)
30
Sea of Okhotsk (LME)
41
Canary Current (LME)
52
Arabian Sea (LME)
64 Humboldt
Current
(LME)
8
Gulf of St Lawrence
19
Celtic-Biscay Shelf (LME)
31
Oyashio Current (LME)
42
Guinea Current (LME)
53
Bay of Bengal S.E.
65 Eastern
Equatorial
Pacific
9
Newfoundland Shelf (LME)
20 Iberian
Coastal
(LME)
32 Kuroshio
Current
(LME)
43 Lake
Chad
54 South
China
Sea
(LME)
66 Antarctic
(LME)
10
Baffin Bay, Labrador Sea,
21
Mediterranean Sea (LME)
33
Sea of Japan/East Sea (LME)
44 Benguela
Current
(LME)
55 Mekong
River
Canadian Archipelago
22 Black
Sea
(LME)
34 Yellow
Sea
(LME)
45a Agulhas Current (LME)
56
Sulu-Celebes Sea (LME)
11
Barents Sea (LME)
23 Caspian
Sea
35 Bohai
Sea
45b Indian Ocean Islands
57 Indonesian
Seas
(LME)
Figure 1
The 66 transboundary regions assessed within the GIWA project.
(10%). Other contributions were made by Kalmar Municipality, the
Considering the objectives of the GIWA and the elements incorporated
University of Kalmar and the Norwegian Government. The assessment of
into its design, a new methodology for the implementation of the
regions ineligible for GEF funds was conducted by various international
assessment was developed during the initial phase of the project. The
and national organisations as in-kind contributions to the GIWA.
methodology focuses on fi ve major environmental concerns which
constitute the foundation of the GIWA assessment; Freshwater shortage,
In order to be consistent with the transboundary nature of many of the
Pollution, Habitat and community modifi cation, Overexploitation of fi sh
world's aquatic resources and the focus of the GIWA, the geographical
and other living resources, and Global change. The GIWA methodology
units being assessed have been designed according to the watersheds
is outlined in the following chapter.
of discrete hydrographic systems rather than political borders (Figure 1).
The geographic units of the assessment were determined during the
The global network
preparatory phase of the project and resulted in the division of the
In each of the 66 regions, the assessment is conducted by a team of
world into 66 regions defi ned by the entire area of one or more
local experts that is headed by a Focal Point (Figure 2). The Focal Point
catchments areas that drains into a single designated marine system.
can be an individual, institution or organisation that has been selected
These marine systems often correspond to Large Marine Ecosystems
on the basis of their scientifi c reputation and experience implementing
(LMEs) (Sherman 1994, IOC 2002).
international assessment projects. The Focal Point is responsible
for assembling members of the team and ensuring that it has the
Large Marine Ecocsystems (LMEs)
necessary expertise and experience in a variety of environmental
Large Marine Ecosystems (LMEs) are regions of ocean space encompassing coastal areas from river
and socio-economic disciplines to successfully conduct the regional
basins and estuaries to the seaward boundaries of continental shelves and the outer margin of the
major current systems. They are relatively large regions on the order of 200 000 km2 or greater,
assessment. The selection of team members is one of the most critical
characterised by distinct: (1) bathymetry, (2) hydrography, (3) productivity, and (4) trophically
elements for the success of GIWA and, in order to ensure that the
dependent populations.
most relevant information is incorporated into the assessment, team
The Large Marine Ecosystems strategy is a global effort for the assessment and management
of international coastal waters. It developed in direct response to a declaration at the 1992
members were selected from a wide variety of institutions such as
Rio Summit. As part of the strategy, the World Conservation Union (IUCN) and National Oceanic
and Atmospheric Administration (NOAA) have joined in an action program to assist developing
universities, research institutes, government agencies, and the private
countries in planning and implementing an ecosystem-based strategy that is focused on LMEs as
sector. In addition, in order to ensure that the assessment produces a
the principal assessment and management units for coastal ocean resources. The LME concept is
also adopted by GEF that recommends the use of LMEs and their contributing freshwater basins
truly regional perspective, the teams should include representatives
as the geographic area for integrating changes in sectoral economic activities.
from each country that shares the region.
iv
REGIONAL ASSESSMENTS
The GIWA is comprised of a logical sequence of four integrated
components. The fi rst stage of the GIWA is called Scaling and is a
Steering Group
process by which the geographic area examined in the assessment is
defi ned and all the transboundary waters within that area are identifi ed.
GIWA Partners
IGOs, NGOs,
Core
Thematic
Once the geographic scale of the assessment has been defi ned, the
Scientific institutions,
Team
Task Teams
private sector, etc
assessment teams conduct a process known as Scoping in which the
66 Regional
magnitude of environmental and associated socio-economic impacts
Focal Points
of Freshwater shortage, Pollution, Habitat and community modifi cation,
and Teams
Unsustainable exploitation of fi sh and other living resources, and Global
Figure 2
The organisation of the GIWA project.
change is assessed in order to identify and prioritise the concerns
that require the most urgent intervention. The assessment of these
predefi ned concerns incorporates the best available information and
In total, more than 1 000 experts have contributed to the implementation
the knowledge and experience of the multidisciplinary, multi-national
of the GIWA illustrating that the GIWA is a participatory exercise that
assessment teams formed in each region. Once the priority concerns
relies on regional expertise. This participatory approach is essential
have been identifi ed, the root causes of these concerns are identifi ed
because it instils a sense of local ownership of the project, which
during the third component of the GIWA, Causal chain analysis. The root
ensures the credibility of the fi ndings and moreover, it has created a
causes are determined through a sequential process that identifi es, in
global network of experts and institutions that can collaborate and
turn, the most signifi cant immediate causes followed by the economic
exchange experiences and expertise to help mitigate the continued
sectors that are primarily responsible for the immediate causes and
degradation of the world's aquatic resources.
fi nally, the societal root causes. At each stage in the Causal chain
analysis, the most signifi cant contributors are identifi ed through an
analysis of the best available information which is augmented by the
expertise of the assessment team. The fi nal component of the GIWA is
GIWA Regional reports
the development of Policy options that focus on mitigating the impacts
of the root causes identifi ed by the Causal chain analysis.
The GIWA was established in response to growing concern among the
general public regarding the quality of the world's aquatic resources
The results of the GIWA assessment in each region are reported in
and the recognition of governments and the international community
regional reports that are published by UNEP. These reports are designed
concerning the absence of a globally coherent international waters
to provide a brief physical and socio-economic description of the
assessment. However, because a holistic, region-by-region, assessment
most important features of the region against which the results of the
of the condition of the world's transboundary water resources had never
assessment can be cast. The remaining sections of the report present
been undertaken, a methodology guiding the implementation of such
the results of each stage of the assessment in an easily digestible form.
an assessment did not exist. Therefore, in order to implement the GIWA,
Each regional report is reviewed by at least two independent external
a new methodology that adopted a multidisciplinary, multi-sectoral,
reviewers in order to ensure the scientifi c validity and applicability of
multi-national approach was developed and is now available for the
each report. The 66 regional assessments of the GIWA will serve UNEP
implementation of future international assessments of aquatic resources.
as an essential complement to the UNEP Water Policy and Strategy and
UNEP's activities in the hydrosphere.
UNEP Water Policy and Strategy
The primary goals of the UNEP water policy and strategy are:
(a) Achieving greater global understanding of freshwater, coastal and marine environments by
Global International Waters Assessment
conducting environmental assessments in priority areas;
(b) Raising awareness of the importance and consequences of unsustainable water use;
(c) Supporting the efforts of Governments in the preparation and implementation of integrated
management of freshwater systems and their related coastal and marine environments;
(d) Providing support for the preparation of integrated management plans and programmes for
aquatic environmental hot spots, based on the assessment results;
(e) Promoting the application by stakeholders of precautionary, preventive and anticipatory
approaches.
GLOBAL INTERNATIONAL WATERS ASSESSMENT
v
References:
AMAP (1998). Assessment Report: Arctic Pollution Issues. Arctic
Monitoring and Assessment Programme (AMAP), Oslo, Norway.
Barannik, V., Borysova, O. and Stolberg, F. (2004). The Caspian Sea Region:
Environmental Change. Ambio, 33:45-51.
Brinson, M.M. and Malvßrez, A.I. (2002). Temperate freshwater wetlands:
types, status, and threats. Environmental Conservation, 29:115-133.
Daoji, L. and Daler, D. (2004). Ocean Pollution from Land-based Sources:
East China Sea, China. Ambio, 33:98-106.
FAO (2001). Reykjavik conference on responsible fi sheries in the marine
ecosystem. Iceland, 1-4 October 2001.
IOC (2002). IOC-IUCN-NOAA Consultative Meeting on Large Marine
Ecosystems (LMEs). Fourth Session, 8-9 January 2002, Paris,
France.
IPCC (2001). Climate Change 2001: The Scientifi c Basis. Contribution
of Working Group I to the Third Assessment Report of the
Intergovernmental Panel on Climate Change. In: Houghton,
J.T., Ding, Y., Griggs, D.J., Noguer, M., van der Linden, P.J., Dai, X.,
Maskell, K. and Johnson, C.A. (eds). Cambridge University Press,
Cambridge, United Kingdom and New York, NY, USA.
Kennish, M.J. (2002). Environmental threats and environmental future of
estuaries. Environmental Conservation, 29:78-107.
Myers, R.A. and Worm, B. (2003). Rapid worldwide depletion of predatory
fi sh communities. Nature, 423:280-283.
Primavera, J.H. (1997) Socio-economic impacts of shrimp culture.
Aquaculture Research, 28:815-827.
Sherman, K. (1994). Sustainability, biomass yields, and health of coastal
ecosystems: an ecological perspective. Marine Ecology Progress
Series, 112:277-301.
United Nations conference on the human environment (1972). Report
available on-line at http://www.unep.org
United Nations Millennium Declaration (2000). The Millennium
Assembly of the United Nations, New York.
WHO-UNICEF (2002). Global Water Supply and Sanitation Assessment:
2000 Report.
WSSD (2002). World Summit on Sustainable Development.
Johannesburg Summit 2002. Key Outcomes of the Summit,
UN Department of Public Information, New York.
vi
REGIONAL ASSESSMENTS
The GIWA methodology
The specifi c objectives of the GIWA were to conduct a holistic and globally
The assessment integrates environmental and socio-economic data
comparable assessment of the world's transboundary aquatic resources
from each country in the region to determine the severity of the
that incorporated both environmental and socio-economic factors
impacts of each of the fi ve concerns and their constituent issues on
and recognised the inextricable links between freshwater and marine
the entire region. The integration of this information was facilitated by
environments, in order to enable the GEF to focus their resources and to
implementing the assessment during two participatory workshops
provide guidance and advice to governments and decision makers. The
that typically involved 10 to 15 environmental and socio-economic
coalition of all these elements into a single coherent methodology that
experts from each country in the region. During these workshops, the
produces an assessment that achieves each of these objectives had not
regional teams performed preliminary analyses based on the collective
previously been done and posed a signifi cant challenge.
knowledge and experience of these local experts. The results of these
analyses were substantiated with the best available information to be
The integration of each of these elements into the GIWA methodology
presented in a regional report.
was achieved through an iterative process guided by a specially
Table 1 Pre-defi ned GIWA concerns and their constituent issues
convened Methods task team that was comprised of a number of
addressed within the assessment.
international assessment and water experts. Before the fi nal version
of the methodology was adopted, preliminary versions underwent
Environmental issues
Major concerns
an extensive external peer review and were subjected to preliminary
1. Modification of stream flow
testing in selected regions. Advice obtained from the Methods task
2. Pollution of existing supplies
I Freshwater shortage
3. Changes in the water table
team and other international experts and the lessons learnt from
preliminary testing were incorporated into the fi nal version that was
4. Microbiological
5. Eutrophication
used to conduct each of the GIWA regional assessments.
6. Chemical
7. Suspended
solids
II Pollution
8. Solid
wastes
Considering the enormous diff erences between regions in terms of the
9. Thermal
10. Radionuclide
quality, quantity and availability of data, socio-economic setting and
11. Spills
environmental conditions, the achievement of global comparability
12. Loss of ecosystems
required an innovative approach. This was facilitated by focusing
III Habitat and community
13. Modification of ecosystems or ecotones, including community
modification
structure and/or species composition
the assessment on the impacts of fi ve pre-defi ned concerns namely;
Freshwater shortage, Pollution, Habitat and community modifi cation,
14. Overexploitation
15. Excessive by-catch and discards
IV Unsustainable
Unsustainable exploitation of fi sh and other living resources and Global
16. Destructive fishing practices
exploitation of fish and
change, in transboundary waters. Considering the diverse range of
17. Decreased viability of stock through pollution and disease
other living resources
18. Impact on biological and genetic diversity
elements encompassed by each concern, assessing the magnitude of
19. Changes in hydrological cycle
the impacts caused by these concerns was facilitated by evaluating the
20. Sea level change
V Global change
impacts of 22 specifi c issues that were grouped within these concerns
21. Increased uv-b radiation as a result of ozone depletion
22. Changes in ocean CO source/sink function
(see Table 1).
2
THE GIWA METHODOLOGY
vii

political boundaries but were instead, generally defi ned by a large but
T
r
ansboundar
The GIWA approach
discrete drainage basin that also included the coastal marine waters into
which the basin discharges. In many cases, the marine areas examined
1
Scaling
st
W
orkshop
Detailed
during the assessment coincided with the Large Marine Ecosystems
y
D
(LMEs) defi ned by the US National Atmospheric and Oceanographic
iagnostic
A
ssessment
Scoping
Administration (NOAA). As a consequence, scaling should be a
relatively straight-forward task that involves the inspection of the
Analy
boundaries that were proposed for the region during the preparatory
Causal Chain
2
sis
nd
Analysis
phase of GIWA to ensure that they are appropriate and that there are
W
orkshop
no important overlaps or gaps with neighbouring regions. When the
Policy Option
proposed boundaries were found to be inadequate, the boundaries of
Analysis
the region were revised according to the recommendations of experts
from both within the region and from adjacent regions so as to ensure
that any changes did not result in the exclusion of areas from the GIWA.
Once the regional boundary was defi ned, regional teams identifi ed all
SAP
the transboundary elements of the aquatic environment within the
SAP
region and determined if these elements could be assessed as a single
Figure 1
Illustration of the relationship between the GIWA
coherent aquatic system or if there were two or more independent
approach and other projects implemented within the
systems that should be assessed separately.
GEF International Waters (IW) portfolio.
The GIWA is a logical contiguous process that defi nes the geographic
Scoping ş Assessing the GIWA concerns
region to be assessed, identifi es and prioritises particularly problems
Scoping is an assessment of the severity of environmental and socio-
based on the magnitude of their impacts on the environment and
economic impacts caused by each of the fi ve pre-defi ned GIWA concerns
human societies in the region, determines the root causes of those
and their constituent issues (Table 1). It is not designed to provide an
problems and, fi nally, assesses various policy options that addresses
exhaustive review of water-related problems that exist within each region,
those root causes in order to reverse negative trends in the condition
but rather it is a mechanism to identify the most urgent problems in the
of the aquatic environment. These four steps, referred to as Scaling,
region and prioritise those for remedial actions. The priorities determined
Scoping, Causal chain analysis and Policy options analysis, are
by Scoping are therefore one of the main outputs of the GIWA project.
summarised below and are described in their entirety in two volumes:
GIWA Methodology Stage 1: Scaling and Scoping; and GIWA Methodology:
Focusing the assessment on pre-defi ned concerns and issues ensured
Detailed Assessment, Causal Chain Analysis and Policy Options Analysis.
the comparability of the results between diff erent regions. In addition, to
Generally, the components of the GIWA methodology are aligned
ensure the long-term applicability of the options that are developed to
with the framework adopted by the GEF for Transboundary Diagnostic
mitigate these problems, Scoping not only assesses the current impacts
Analyses (TDAs) and Strategic Action Programmes (SAPs) (Figure 1) and
of these concerns and issues but also the probable future impacts
assume a broad spectrum of transboundary infl uences in addition to
according to the "most likely scenario" which considered demographic,
those associated with the physical movement of water across national
economic, technological and other relevant changes that will potentially
borders.
infl uence the aquatic environment within the region by 2020.
Scaling ş Defining the geographic extent
The magnitude of the impacts caused by each issue on the
of the region
environment and socio-economic indicators was assessed over the
Scaling is the fi rst stage of the assessment and is the process by which
entire region using the best available information from a wide range of
the geographic scale of the assessment is defi ned. In order to facilitate
sources and the knowledge and experience of the each of the experts
the implementation of the GIWA, the globe was divided during the
comprising the regional team. In order to enhance the comparability
design phase of the project into 66 contiguous regions. Considering the
of the assessment between diff erent regions and remove biases
transboundary nature of many aquatic resources and the transboundary
in the assessment caused by diff erent perceptions of and ways to
focus of the GIWA, the boundaries of the regions did not comply with
communicate the severity of impacts caused by particular issues, the
viii
REGIONAL ASSESSMENTS
results were distilled and reported as standardised scores according to
Table 2
Example of environmental impact assessment of
Freshwater shortage.
the following four point scale:
Weight
0 = no known impact
Environmental
Environmental issues
Score
Weight %
averaged
concerns
1 = slight impact
score
2
=
moderate
impact
1. Modification of stream flow
1
20
Freshwater shortage
1.50
3 = severe impact
2. Pollution of existing supplies
2
50
The attributes of each score for each issue were described by a detailed
3. Changes in the water table
1
30
set of pre-defi ned criteria that were used to guide experts in reporting
Table 3
Example of Health impacts assessment linked to one of
the results of the assessment. For example, the criterion for assigning
the GIWA concerns.
a score of 3 to the issue Loss of ecosystems or ecotones is: "Permanent
Criteria for Health impacts
Raw score
Score
Weight %
destruction of at least one habitat is occurring such as to have reduced their
Very small
Very large
surface area by >30% during the last 2-3 decades". The full list of criteria is
Number of people affected
2
50
0 1 2 3
presented at the end of the chapter, Table 5a-e. Although the scoring
Minimum
Severe
Degree of severity
2
30
0 1 2 3
inevitably includes an arbitrary component, the use of predefi ned
Occasion/Short
Continuous
Frequency/Duration
2
20
0 1 2 3
criteria facilitates comparison of impacts on a global scale and also
Weight average score for Health impacts
2
encouraged consensus of opinion among experts.
The trade-off associated with assessing the impacts of each concern
After all 22 issues and associated socio-economic impacts have
and their constituent issues at the scale of the entire region is that spatial
been scored, weighted and averaged, the magnitude of likely future
resolution was sometimes low. Although the assessment provides a
changes in the environmental and socio-economic impacts of each
score indicating the severity of impacts of a particular issue or concern
of the fi ve concerns on the entire region is assessed according to the
on the entire region, it does not mean that the entire region suff ers
most likely scenario which describes the demographic, economic,
the impacts of that problem. For example, eutrophication could be
technological and other relevant changes that might infl uence the
identifi ed as a severe problem in a region, but this does not imply that all
aquatic environment within the region by 2020.
waters in the region suff er from severe eutrophication. It simply means
that when the degree of eutrophication, the size of the area aff ected,
In order to prioritise among GIWA concerns within the region and
the socio-economic impacts and the number of people aff ected is
identify those that will be subjected to causal chain and policy options
considered, the magnitude of the overall impacts meets the criteria
analysis in the subsequent stages of the GIWA, the present and future
defi ning a severe problem and that a regional action should be initiated
scores of the environmental and socio-economic impacts of each
in order to mitigate the impacts of the problem.
concern are tabulated and an overall score calculated. In the example
presented in Table 4, the scoping assessment indicated that concern III,
When each issue has been scored, it was weighted according to the relative
Habitat and community modifi cation, was the priority concern in this
contribution it made to the overall environmental impacts of the concern
region. The outcome of this mathematic process was reconciled against
and a weighted average score for each of the fi ve concerns was calculated
the knowledge of experts and the best available information in order
(Table 2). Of course, if each issue was deemed to make equal contributions,
to ensure the validity of the conclusion.
then the score describing the overall impacts of the concern was simply the
arithmetic mean of the scores allocated to each issue within the concern.
In some cases however, this process and the subsequent participatory
In addition, the socio-economic impacts of each of the fi ve major
discussion did not yield consensus among the regional experts
concerns were assessed for the entire region. The socio-economic
regarding the ranking of priorities. As a consequence, further analysis
impacts were grouped into three categories; Economic impacts,
was required. In such cases, expert teams continued by assessing the
Health impacts and Other social and community impacts (Table 3). For
relative importance of present and potential future impacts and assign
each category, an evaluation of the size, degree and frequency of the
weights to each. Afterwards, the teams assign weights indicating the
impact was performed and, once completed, a weighted average score
relative contribution made by environmental and socio-economic
describing the overall socio-economic impacts of each concern was
factors to the overall impacts of the concern. The weighted average
calculated in the same manner as the overall environmental score.
score for each concern is then recalculated taking into account
THE GIWA METHODOLOGY
ix
Table 4
Example of comparative environmental and socio-economic impacts of each major concern, presently and likely in year 2020.
Types of impacts
Environmental score
Economic score
Human health score
Social and community score
Concern
Overall score
Present (a)
Future (b)
Present (c)
Future (d)
Present (e)
Future (f)
Present (g)
Future (h)
Freshwater shortage
1.3
2.3
2.7
2.8
2.6
3.0
1.8
2.2
2.3
Pollution
1.5
2.0
2.0
2.3
1.8
2.3
2.0
2.3
2.0
Habitat and community
2.0
3.0
2.4
3.0
2.4
2.8
2.3
2.7
2.6
modification
Unsustainable exploitation of fish
1.8
2.2
2.0
2.1
2.0
2.1
2.4
2.5
2.1
and other living resources
Global change
0.8
1.0
1.5
1.7
1.5
1.5
1.0
1.0
1.2
the relative contributions of both present and future impacts and
should be regarded as a framework to guide the analysis, rather than
environmental and socio-economic factors. The outcome of these
as a set of detailed instructions. Secondly, in an ideal setting, a causal
additional analyses was subjected to further discussion to identify
chain would be produced by a multidisciplinary group of specialists
overall priorities for the region.
that would statistically examine each successive cause and study its
links to the problem and to other causes. However, this approach (even
Finally, the assessment recognises that each of the fi ve GIWA concerns
if feasible) would use far more resources and time than those available
are not discrete but often interact. For example, pollution can destroy
to GIWA1. For this reason, it has been necessary to develop a relatively
aquatic habitats that are essential for fi sh reproduction which, in turn,
simple and practical analytical model for gathering information to
can cause declines in fi sh stocks and subsequent overexploitation. Once
assemble meaningful causal chains.
teams have ranked each of the concerns and determined the priorities
for the region, the links between the concerns are highlighted in order
Conceptual model
to identify places where strategic interventions could be applied to
A causal chain is a series of statements that link the causes of a problem
yield the greatest benefi ts for the environment and human societies
with its eff ects. Recognising the great diversity of local settings and the
in the region.
resulting diffi
culty in developing broadly applicable policy strategies,
the GIWA CCA focuses on a particular system and then only on those
Causal chain analysis
issues that were prioritised during the scoping assessment. The
Causal Chain Analysis (CCA) traces the cause-eff ect pathways from the
starting point of a particular causal chain is one of the issues selected
socio-economic and environmental impacts back to their root causes.
during the Scaling and Scoping stages and its related environmental
The GIWA CCA aims to identify the most important causes of each
and socio-economic impacts. The next element in the GIWA chain is
concern prioritised during the scoping assessment in order to direct
the immediate cause; defi ned as the physical, biological or chemical
policy measures at the most appropriate target in order to prevent
variable that produces the GIWA issue. For example, for the issue of
further degradation of the regional aquatic environment.
eutrophication the immediate causes may be, inter alia:
Enhanced nutrient inputs;
Root causes are not always easy to identify because they are often
Increased
recycling/mobilisation;
spatially or temporally separated from the actual problems they
Trapping of nutrients (e.g. in river impoundments);
cause. The GIWA CCA was developed to help identify and understand
Run-off and stormwaters
the root causes of environmental and socio-economic problems
in international waters and is conducted by identifying the human
Once the relevant immediate cause(s) for the particular system has
activities that cause the problem and then the factors that determine
(have) been identifi ed, the sectors of human activity that contribute
the ways in which these activities are undertaken. However, because
most signifi cantly to the immediate cause have to be determined.
there is no universal theory describing how root causes interact to
Assuming that the most important immediate cause in our example
create natural resource management problems and due to the great
had been increased nutrient concentrations, then it is logical that the
variation of local circumstances under which the methodology will
most likely sources of those nutrients would be the agricultural, urban
be applied, the GIWA CCA is not a rigidly structured assessment but
or industrial sectors. After identifying the sectors that are primarily
1 This does not mean that the methodology ignores statistical or quantitative studies; as has already been pointed out, the available evidence that justifies the assumption of causal links should
be provided in the assessment.
x
REGIONAL ASSESSMENTS
responsible for the immediate causes, the root causes acting on those
The policy options recommended by the GIWA are only contributions
sectors must be determined. For example, if agriculture was found to
to the larger policy process and, as such, the GIWA methodology
be primarily responsible for the increased nutrient concentrations, the
developed to test the performance of various options under the
root causes could potentially be:
diff erent circumstances has been kept simple and broadly applicable.
Economic (e.g. subsidies to fertilisers and agricultural products);
Legal (e.g. inadequate regulation);
Global International Waters Assessment
Failures in governance (e.g. poor enforcement); or
Technology or knowledge related (e.g. lack of aff ordable substitutes
for fertilisers or lack of knowledge as to their application).
Once the most relevant root causes have been identifi ed, an
explanation, which includes available data and information, of how
they are responsible for the primary environmental and socio-economic
problems in the region should be provided.
Policy option analysis
Despite considerable eff ort of many Governments and other
organisations to address transboundary water problems, the evidence
indicates that there is still much to be done in this endeavour. An
important characteristic of GIWA's Policy Option Analysis (POA) is that
its recommendations are fi rmly based on a better understanding of
the root causes of the problems. Freshwater scarcity, water pollution,
overexploitation of living resources and habitat destruction are very
complex phenomena. Policy options that are grounded on a better
understanding of these phenomena will contribute to create more
eff ective societal responses to the extremely complex water related
transboundary problems. The core of POA in the assessment consists
of two tasks:
Construct policy options
Policy options are simply diff erent courses of action, which are not
always mutually exclusive, to solve or mitigate environmental and
socio-economic problems in the region. Although a multitude of
diff erent policy options could be constructed to address each root
cause identifi ed in the CCA, only those few policy options that have
the greatest likelihood of success were analysed in the GIWA.
Select and apply the criteria on which the policy options will be
evaluated
Although there are many criteria that could be used to evaluate any
policy option, GIWA focuses on:
Eff ectiveness (certainty of result)
Effi
ciency (maximisation of net benefi ts)
Equity (fairness of distributional impacts)
Practical
criteria
(political
acceptability,
implementation
feasibility).
THE GIWA METHODOLOGY
xi
Table 5a: Scoring criteria for environmental impacts of Freshwater shortage
Issue
Score 0 = no known impact
Score 1 = slight impact
Score 2 = moderate impact
Score 3 = severe impact
Issue 1: Modification
No evidence of modification of stream
There is a measurably changing trend in
Significant downward or upward trend
Annual discharge of a river altered by more
of stream flow
flow.
annual river discharge at gauging stations
(more than 20% of the long term mean) in
than 50% of long term mean; or
"An increase or decrease
in a major river or tributary (basin >
annual discharges in a major river or tributary Loss of >50% of riparian or deltaic
in the discharge of
40 000 km2); or
draining a basin of >250 000 km2; or
wetlands over a period of not less than
streams and rivers
There is a measurable decrease in the area
Loss of >20% of flood plain or deltaic
40 years (through causes other than
as a result of human
of wetlands (other than as a consequence
wetlands through causes other than
conversion or artificial embankment); or
interventions on a local/
of conversion or embankment
conversion or artificial embankments; or
Significant increased siltation or erosion
regional scale (see Issue
construction); or
Significant loss of riparian vegetation (e.g.
due to changing in flow regime (other than
19 for flow alterations
There is a measurable change in the
trees, flood plain vegetation); or
normal fluctuations in flood plain rivers);
resulting from global
interannual mean salinity of estuaries or
Significant saline intrusion into previously
or
change) over the last 3-4
coastal lagoons and/or change in the mean
freshwater rivers or lagoons.
Loss of one or more anadromous or
decades."
position of estuarine salt wedge or mixing
catadromous fish species for reasons
zone; or
other than physical barriers to migration,
Change in the occurrence of exceptional
pollution or overfishing.
discharges (e.g. due to upstream
damming.
Issue 2: Pollution of
No evidence of pollution of surface and
Any monitored water in the region does
Water supplies does not meet WHO or
River draining more than 10% of the basin
existing supplies
ground waters.
not meet WHO or national drinking water
national drinking water standards in more
have suffered polysaprobic conditions, no
"Pollution of surface
criteria, other than for natural reasons; or
than 30% of the region; or
longer support fish, or have suffered severe
and ground fresh waters
There have been reports of one or more
There are one or more reports of fish kills
oxygen depletion
supplies as a result of
fish kills in the system due to pollution
due to pollution in any river draining a
Severe pollution of other sources of
point or diffuse sources"
within the past five years.
basin of >250 000 km2 .
freshwater (e.g. groundwater)
Issue 3: Changes in
No evidence that abstraction of water from Several wells have been deepened because Clear evidence of declining base flow in
Aquifers are suffering salinisation over
the water table
aquifers exceeds natural replenishment.
of excessive aquifer draw-down; or
rivers in semi-arid areas; or
regional scale; or
"Changes in aquifers
Several springs have dried up; or
Loss of plant species in the past decade,
Perennial springs have dried up over
as a direct or indirect
Several wells show some salinisation.
that depend on the presence of ground
regionally significant areas; or
consequence of human
water; or
Some aquifers have become exhausted
activity"
Wells have been deepened over areas of
hundreds of km2;or
Salinisation over significant areas of the
region.
Table 5b: Scoring criteria for environmental impacts of Pollution
Issue
Score 0 = no known impact
Score 1 = slight impact
Score 2 = moderate impact
Score 3 = severe impact
Issue 4:
Normal incidence of bacterial related
There is minor increase in incidence of
Public health authorities aware of marked
There are large closure areas or very
Microbiological
gastroenteric disorders in fisheries product
bacterial related gastroenteric disorders
increase in the incidence of bacterial
restrictive advisories affecting the
pollution
consumers and no fisheries closures or
in fisheries product consumers but no
related gastroenteric disorders in fisheries
marketability of fisheries products; or
"The adverse effects of
advisories.
fisheries closures or advisories.
product consumers; or
There exists widespread public or tourist
microbial constituents of
There are limited area closures or
awareness of hazards resulting in
human sewage released
advisories reducing the exploitation or
major reductions in the exploitation or
to water bodies."
marketability of fisheries products.
marketability of fisheries products.
Issue 5:
No visible effects on the abundance and
Increased abundance of epiphytic algae; or
Increased filamentous algal production
High frequency (>1 event per year), or
Eutrophication
distributions of natural living resource
A statistically significant trend in
resulting in algal mats; or
intensity, or large areas of periodic hypoxic
"Artificially enhanced
distributions in the area; and
decreased water transparency associated
Medium frequency (up to once per year)
conditions, or high frequencies of fish and
primary productivity in
No increased frequency of hypoxia1 or
with algal production as compared with
of large-scale hypoxia and/or fish and
zoobenthos mortality events or harmful
receiving water basins
fish mortality events or harmful algal
long-term (>20 year) data sets; or
zoobenthos mortality events and/or
algal blooms; or
related to the increased
blooms associated with enhanced primary
Measurable shallowing of the depth range
harmful algal blooms.
Significant changes in the littoral
availability or supply
production; and
of macrophytes.
community; or
of nutrients, including
No evidence of periodically reduced
Presence of hydrogen sulphide in
cultural eutrophication
dissolved oxygen or fish and zoobenthos
historically well oxygenated areas.
in lakes."
mortality; and
No evident abnormality in the frequency of
algal blooms.
xii
REGIONAL ASSESSMENTS
Issue 6: Chemical
No known or historical levels of chemical
Some chemical contaminants are
Some chemical contaminants are above
Chemical contaminants are above
pollution
contaminants except background levels of
detectable but below threshold limits
threshold limits defined for the country or
threshold limits defined for the country or
"The adverse effects of
naturally occurring substances; and
defined for the country or region; or
region; or
region; and
chemical contaminants
No fisheries closures or advisories due to
Restricted area advisories regarding
Large area advisories by public health
Public health and public awareness of
released to standing or
chemical pollution; and
chemical contamination of fisheries
authorities concerning fisheries product
fisheries contamination problems with
marine water bodies
No incidence of fisheries product tainting;
products.
contamination but without associated
associated reductions in the marketability
as a result of human
and
catch restrictions or closures; or
of such products either through the
activities. Chemical
No unusual fish mortality events.
If there is no available data use the following
High mortalities of aquatic species near
imposition of limited advisories or by area
contaminants are
criteria:
outfalls.
closures of fisheries; or
here defined as
If there is no available data use the following
Some use of pesticides in small areas; or
Large-scale mortalities of aquatic species.
compounds that are
criteria:
Presence of small sources of dioxins or
If there is no available data use the following
toxic or persistent or
No use of pesticides; and
furans (e.g., small incineration plants or
criteria:
If there is no available data use the following
bioaccumulating."
No sources of dioxins and furans; and
bleached kraft/pulp mills using chlorine);
Large-scale use of pesticides in agriculture
criteria:
No regional use of PCBs; and
or
and forestry; or
Indications of health effects resulting
No bleached kraft pulp mills using chlorine Some previous and existing use of PCBs
Presence of major sources of dioxins or
from use of pesticides; or
bleaching; and
and limited amounts of PCB-containing
furans such as large municipal or industrial Known emissions of dioxins or furans from
No use or sources of other contaminants.
wastes but not in amounts invoking local
incinerators or large bleached kraft pulp
incinerators or chlorine bleaching of pulp;
concerns; or
mills; or
or
Presence of other contaminants.
Considerable quantities of waste PCBs in
Known contamination of the environment
the area with inadequate regulation or has
or foodstuffs by PCBs; or
invoked some public concerns; or
Known contamination of the environment
Presence of considerable quantities of
or foodstuffs by other contaminants.
other contaminants.
Issue 7: Suspended
No visible reduction in water transparency; Evidently increased or reduced turbidity
Markedly increased or reduced turbidity
Major changes in turbidity over wide or
solids
and
in streams and/or receiving riverine and
in small areas of streams and/or receiving
ecologically significant areas resulting
"The adverse effects of
No evidence of turbidity plumes or
marine environments but without major
riverine and marine environments; or
in markedly changed biodiversity or
modified rates of release
increased siltation; and
changes in associated sedimentation or
Extensive evidence of changes in
mortality in benthic species due to
of suspended particulate No evidence of progressive riverbank,
erosion rates, mortality or diversity of flora
sedimentation or erosion rates; or
excessive sedimentation with or without
matter to water bodies
beach, other coastal or deltaic erosion.
and fauna; or
Changes in benthic or pelagic biodiversity
concomitant changes in the nature of
resulting from human
Some evidence of changes in benthic or
in areas due to sediment blanketing or
deposited sediments (i.e., grain-size
activities"
pelagic biodiversity in some areas due
increased turbidity.
composition/redox); or
to sediment blanketing or increased
Major change in pelagic biodiversity or
turbidity.
mortality due to excessive turbidity.
Issue 8: Solid wastes
No noticeable interference with trawling
Some evidence of marine-derived litter on
Widespread litter on beaches giving rise to
Incidence of litter on beaches sufficient
"Adverse effects
activities; and
beaches; or
public concerns regarding the recreational
to deter the public from recreational
associated with the
No noticeable interference with the
Occasional recovery of solid wastes
use of beaches; or
activities; or
introduction of solid
recreational use of beaches due to litter;
through trawling activities; but
High frequencies of benthic litter recovery
Trawling activities untenable because of
waste materials into
and
Without noticeable interference with
and interference with trawling activities;
benthic litter and gear entanglement; or
water bodies or their
No reported entanglement of aquatic
trawling and recreational activities in
or
Widespread entanglement and/or
environs."
organisms with debris.
coastal areas.
Frequent reports of entanglement/
suffocation of aquatic species by litter.
suffocation of species by litter.
Issue 9: Thermal
No thermal discharges or evidence of
Presence of thermal discharges but
Presence of thermal discharges with large
Presence of thermal discharges with large
"The adverse effects
thermal effluent effects.
without noticeable effects beyond
mixing zones having reduced productivity
mixing zones with associated mortalities,
of the release of
the mixing zone and no significant
or altered biodiversity; or
substantially reduced productivity or
aqueous effluents at
interference with migration of species.
Evidence of reduced migration of species
noticeable changes in biodiversity; or
temperatures exceeding
due to thermal plume.
Marked reduction in the migration of
ambient temperature
species due to thermal plumes.
in the receiving water
body."
Issue 10: Radionuclide No radionuclide discharges or nuclear
Minor releases or fallout of radionuclides
Minor releases or fallout of radionuclides
Substantial releases or fallout of
"The adverse effects of
activities in the region.
but with well regulated or well-managed
under poorly regulated conditions that do
radionuclides resulting in excessive
the release of radioactive
conditions complying with the Basic Safety
not provide an adequate basis for public
exposures to humans or animals in relation
contaminants and
Standards.
health assurance or the protection of
to those recommended under the Basic
wastes into the aquatic
aquatic organisms but without situations
Safety Standards; or
environment from
or levels likely to warrant large scale
Some indication of situations or exposures
human activities."
intervention by a national or international
warranting intervention by a national or
authority.
international authority.
Issue 11: Spills
No evidence of present or previous spills of
Some evidence of minor spills of hazardous Evidence of widespread contamination
Widespread contamination by hazardous
"The adverse effects
hazardous material; or
materials in small areas with insignificant
by hazardous or aesthetically displeasing
or aesthetically displeasing materials
of accidental episodic
No evidence of increased aquatic or avian
small-scale adverse effects one aquatic or
materials assumed to be from spillage
from frequent spills resulting in major
releases of contaminants
species mortality due to spills.
avian species.
(e.g. oil slicks) but with limited evidence of
interference with aquatic resource
and materials to the
widespread adverse effects on resources or
exploitation or coastal recreational
aquatic environment
amenities; or
amenities; or
as a result of human
Some evidence of aquatic or avian species
Significant mortality of aquatic or avian
activities."
mortality through increased presence of
species as evidenced by large numbers of
contaminated or poisoned carcasses on
contaminated carcasses on beaches.
beaches.
THE GIWA METHODOLOGY
xiii
Table 5c: Scoring criteria for environmental impacts of Habitat and community modification
Issue
Score 0 = no known impact
Score 1 = slight impact
Score 2 = moderate impact
Score 3 = severe impact
Issue 12: Loss of ecosystems or
There is no evidence of loss of
There are indications of fragmentation Permanent destruction of at least one
Permanent destruction of at least one
ecotones
ecosystems or habitats.
of at least one of the habitats.
habitat is occurring such as to have
habitat is occurring such as to have
"The complete destruction of aquatic
reduced their surface area by up to 30
reduced their surface area by >30%
habitats. For the purpose of GIWA
% during the last 2-3 decades.
during the last 2-3 decades.
methodology, recent loss will be
measured as a loss of pre-defined
habitats over the last 2-3 decades."
Issue 13: Modification of
No evidence of change in species
Evidence of change in species
Evidence of change in species
Evidence of change in species
ecosystems or ecotones, including
complement due to species extinction
complement due to species extinction
complement due to species extinction
complement due to species extinction
community structure and/or species
or introduction; and
or introduction
or introduction; and
or introduction; and
composition
No changing in ecosystem function
Evidence of change in population
Evidence of change in population
"Modification of pre-defined habitats
and services.
structure or change in functional group
structure or change in functional group
in terms of extinction of native species,
composition or structure
composition or structure; and
occurrence of introduced species and
Evidence of change in ecosystem
changing in ecosystem function and
services2.
services over the last 2-3 decades."
2 Constanza, R. et al. (1997). The value of the world ecosystem services and natural capital, Nature 387:253-260.
Table 5d: Scoring criteria for environmental impacts of Unsustainable exploitation of fish and other
living resources
Issue
Score 0 = no known impact
Score 1 = slight impact
Score 2 = moderate impact
Score 3 = severe impact
Issue 14: Overexploitation
No harvesting exists catching fish
Commercial harvesting exists but there One stock is exploited beyond MSY
More than one stock is exploited
"The capture of fish, shellfish or marine
(with commercial gear for sale or
is no evidence of over-exploitation.
(maximum sustainable yield) or is
beyond MSY or is outside safe
invertebrates at a level that exceeds the
subsistence).
outside safe biological limits.
biological limits.
maximum sustainable yield of the stock."
Issue 15: Excessive by-catch and
Current harvesting practices show no
Up to 30% of the fisheries yield (by
30-60% of the fisheries yield consists
Over 60% of the fisheries yield is
discards
evidence of excessive by-catch and/or
weight) consists of by-catch and/or
of by-catch and/or discards.
by-catch and/or discards; or
"By-catch refers to the incidental capture
discards.
discards.
Noticeable incidence of capture of
of fish or other animals that are not the
endangered species.
target of the fisheries. Discards refers
to dead fish or other animals that are
returned to the sea."
Issue 16: Destructive fishing
No evidence of habitat destruction due Habitat destruction resulting in
Habitat destruction resulting in
Habitat destruction resulting in
practices
to fisheries practices.
changes in distribution of fish or
moderate reduction of stocks or
complete collapse of a stock or far
"Fishing practices that are deemed to
shellfish stocks; or
moderate changes of the environment;
reaching changes in the environment;
produce significant harm to marine,
Trawling of any one area of the seabed
or
or
lacustrine or coastal habitats and
is occurring less than once per year.
Trawling of any one area of the seabed
Trawling of any one area of the seabed
communities."
is occurring 1-10 times per year; or
is occurring more than 10 times per
Incidental use of explosives or poisons
year; or
for fishing.
Widespread use of explosives or
poisons for fishing.
Issue 17: Decreased viability of
No evidence of increased incidence of
Increased reports of diseases without
Declining populations of one or more
Collapse of stocks as a result of
stocks through contamination and
fish or shellfish diseases.
major impacts on the stock.
species as a result of diseases or
diseases or contamination.
disease
contamination.
"Contamination or diseases of feral (wild)
stocks of fish or invertebrates that are a
direct or indirect consequence of human
action."
Issue 18: Impact on biological and
No evidence of deliberate or accidental Alien species introduced intentionally
Measurable decline in the population
Extinction of native species or local
genetic diversity
introductions of alien species; and
or accidentally without major changes
of native species or local stocks as a
stocks as a result of introductions
"Changes in genetic and species diversity No evidence of deliberate or accidental
in the community structure; or
result of introductions (intentional or
(intentional or accidental); or
of aquatic environments resulting from
introductions of alien stocks; and
Alien stocks introduced intentionally
accidental); or
Major changes (>20%) in the genetic
the introduction of alien or genetically
No evidence of deliberate or accidental
or accidentally without major changes
Some changes in the genetic
composition of stocks (e.g. as a result
modified species as an intentional or
introductions of genetically modified
in the community structure; or
composition of stocks (e.g. as a result
of escapes from aquaculture replacing
unintentional result of human activities
species.
Genetically modified species
of escapes from aquaculture replacing
the wild stock).
including aquaculture and restocking."
introduced intentionally or
the wild stock).
accidentally without major changes in
the community structure.
xiv
REGIONAL ASSESSMENTS
Table 5e: Scoring criteria for environmental impacts of Global change
Issue
Score 0 = no known impact
Score 1 = slight impact
Score 2 = moderate impact
Score 3 = severe impact
Issue 19: Changes in hydrological
No evidence of changes in hydrological Change in hydrological cycles due
Significant trend in changing
Loss of an entire habitat through
cycle and ocean circulation
cycle and ocean/coastal current due to
to global change causing changes
terrestrial or sea ice cover (by
desiccation or submergence as a result
"Changes in the local/regional water
global change.
in the distribution and density of
comparison with a long-term time
of global change; or
balance and changes in ocean and coastal
riparian terrestrial or aquatic plants
series) without major downstream
Change in the tree or lichen lines; or
circulation or current regime over the
without influencing overall levels of
effects on river/ocean circulation or
Major impacts on habitats or
last 2-3 decades arising from the wider
productivity; or
biological diversity; or
biodiversity as the result of increasing
problem of global change including
Some evidence of changes in ocean
Extreme events such as flood and
frequency of extreme events; or
ENSO."
or coastal currents due to global
drought are increasing; or
Changing in ocean or coastal currents
change but without a strong effect on
Aquatic productivity has been altered
or upwelling regimes such that plant
ecosystem diversity or productivity.
as a result of global phenomena such
or animal populations are unable to
as ENSO events.
recover to their historical or stable
levels; or
Significant changes in thermohaline
circulation.
Issue 20: Sea level change
No evidence of sea level change.
Some evidences of sea level change
Changed pattern of coastal erosion due Major loss of coastal land areas due to
"Changes in the last 2-3 decades in the
without major loss of populations of
to sea level rise has became evident; or
sea-level change or sea-level induced
annual/seasonal mean sea level as a
organisms.
Increase in coastal flooding events
erosion; or
result of global change."
partly attributed to sea-level rise
Major loss of coastal or intertidal
or changing prevailing atmospheric
populations due to sea-level change or
forcing such as atmospheric pressure
sea level induced erosion.
or wind field (other than storm
surges).
Issue 21: Increased UV-B radiation as No evidence of increasing effects
Some measurable effects of UV/B
Aquatic community structure is
Measured/assessed effects of UV/B
a result of ozone depletion
of UV/B radiation on marine or
radiation on behavior or appearance of
measurably altered as a consequence
irradiation are leading to massive loss
"Increased UV-B flux as a result polar
freshwater organisms.
some aquatic species without affecting
of UV/B radiation; or
of aquatic communities or a significant
ozone depletion over the last 2-3
the viability of the population.
One or more aquatic populations are
change in biological diversity.
decades."
declining.
Issue 22: Changes in ocean CO
No measurable or assessed changes
Some reasonable suspicions that
Some evidences that the impacts
Evidences that the changes in
2
source/sink function
in CO source/sink function of aquatic
current global change is impacting the
of global change have altered the
source/sink function of the aquatic
2
"Changes in the capacity of aquatic
system.
aquatic system sufficiently to alter its
source/sink function for CO of aquatic
systems in the region are sufficient to
2
systems, ocean as well as freshwater, to
source/sink function for CO .
systems in the region by at least 10%.
cause measurable change in global CO
2
2
generate or absorb atmospheric CO as a
balance.
2
direct or indirect consequence of global
change over the last 2-3 decades."
THE GIWA METHODOLOGY
xv
