


Global International
Waters Assessment
Regional assessments
Other reports in this series:
Caribbean Sea/Small Islands GIWA Regional assessment 3a
Caribbean Islands GIWA Regional assessment 4
Barents Sea GIWA Regional assessment 11
Baltic Sea GIWA Regional assessment 17
Caspian Sea GIWA Regional assessment 23
Gulf of California/Colorado River Basin GIWA Regional assessment 27
Patagonian Shelf GIWA Regional assessment 38
Brazil Current GIWA Regional assessment 39
Amazon Basin GIWA Regional assessment 40b
Guinea Current GIWA Regional assessment 42
Lake Chad Basin GIWA Regional assessment 43
Indian Ocean Islands GIWA Regional assessment 45b
East African Rift Valley Lakes GIWA Regional assessment 47
Pacifi c Islands GIWA Regional assessment 62

Global International
Waters Assessment
Regional assessment 57
Indonesian Seas
GIWA report production
Series editor: Ulla Li Zweifel
Report editors: Lyndon De Vantier, Clive Wilkinson,
David Lawrence, David Souter
Editorial assistance: Johanna Egerup
Maps & GIS: Niklas Holmgren
Design & graphics: Joakim Palmqvist
Global International Waters Assessment
Indonesian Seas, GIWA Regional assessment 57
Published by the University of Kalmar on behalf of
United Nations Environment Programme
© 2005 United Nations Environment Programme
ISSN 1651-940X
University of Kalmar
SE-391 82 Kalmar
Sweden
United Nations Environment Programme
PO Box 30552,
Nairobi, Kenya
This publication may be reproduced in whole or in part and in any form
for educational or non-profi t purposes without special permission
from the copyright holder, provided acknowledgement of the source
is made. No use of this publication may be made for resale or for any
other commercial purpose whatsoever without prior permission in
writing from the United Nations Environment Programme.
CITATIONS
When citing this report, please use:
UNEP, 2005. Vantier, L., Wilkinson, C., Lawrence, D., and D. Souter (eds.)
Indonesian Seas, GIWA Regional assessment 57. University of Kalmar,
Kalmar, Sweden.
DISCLAIMER
The views expressed in this publication are those of the authors and
do not necessarily refl ect those of UNEP. The designations employed
and the presentations do not imply the expressions of any opinion
whatsoever on the part of UNEP or cooperating agencies concerning
the legal status of any country, territory, city or areas or its authority, or
concerning the delimitation of its frontiers or boundaries.
This publication has been peer-reviewed and the information herein
is believed to be reliable, but the publisher does not warrant its
completeness or accuracy.
Contents
Executive summary
9
Abbreviations and acronyms
12
Regional defi nition
14
Boundaries of the region
14
Physical characteristics
16
Socio-economic characterstics
20
Assessment 26
Freshwater shortage
27
Pollution
30
Habitat and community modifi cation
37
Unsustainable exploitation of fi sh and other living resources
48
Global change
55
Priority concerns for further analysis
59
Causal chain analysis
62
System description
62
Causal chain analysis
63
Conclusions
66
Policy options
68
Defi nition of the problem
68
Construction of the policy options
69
Identifi cation of recommended policy options
71
Performance of the chosen option
73
Conclusions and recommendations
75
References 77
Annexes 87
Annex I List of contributing authors and organisations involved
87
Annex II Detailed scoring tables
89
Annex III List of important water-related programmes and assessments
98
Annex IV List of conventions and specifi c laws that aff ect water use
103
CONTENTS
Annex V The large marine ecosystem of Indonesian Seas
111
Annex VI Criteria for scoring environmental impacts
113
Annex VII Marine protected areas and benefi ts to the fi shery
114
Annex VIII Models for development of a fully integrated PA network in Indonesian Seas
121
Annex IX Small versus large PAs in tropical developing nations
132
Annex X Selection of coral reef marine protected areas
133
The Global International Waters Assessment
i
The GIWA methodology
vii
Acknowledgements
The Regional Task Team would like to thank David Hopley and Annadel Cabanban for their constructive reviews.
Executive summary
The Indonesian Seas GIWA region 57 contains most of the land and seas
people live in Sunda, with 100 million on Jawa alone. Future scenarios
of the Republic of Indonesia; some 18 000 islands with 1.9 million km2
suggest an overall human population increase of approximately 1.7%
of land area and 6 million km2 of seas. The region is geologically and
per year to approximately 300 million in 2020. There is expected to be
topographically diverse, lying at the global centre of tropical marine
increasing urbanisation and reliance on extractive industries; mining,
biodiversity. Because of the highly signifi cant geographic, oceanographic,
plantation agriculture, aquaculture, mariculture and industrial fi shing.
demographic and biodiversity diff erences within the region, the
There is already widespread overexploitation and use of inappropriate
Assessment was conducted independently for three sub-systems:
technologies, raising serious concerns as to even the medium-term
Sunda (western part of the region);
(decadal) sustainability of the production systems. There are also likely
Wallacea
(central
part);
to be limits to development of other sectors from freshwater shortage,
Sahul
(eastern
part).
particularly through linkages with habitat loss and global change.
The priority international waters issues and concerns vary markedly
Total pressures are likely to increase moderately to severely over the
among the three sub-systems. Sunda's international waters resources
next 20 years, being driven by the continued population growth,
are under most severe environmental and socio-economic pressure.
which is expected to cause signifi cant deterioration in environmental
Major concerns for the present include Pollution, Habitat and
and socio-economic aspects of all major concerns. Importantly, rate
community modifi cation and Unsustainable exploitation of fi sh. All
of deterioration will be contingent upon the success of improved
of these concerns are already having severe environmental and socio-
regulation and ongoing and future planned interventions by
economic impacts and are expected to deteriorate further over the
government and non-government organisations (NGOs).
next 20 years, primarily because of population growth and lack of
adherence to and enforcement of regulations. Freshwater shortage is,
The causal chain analysis was focused on destructive fi shing practices;
at present, exerting moderate to severe impacts on the sub-system and
particularly poison fi shing to supply the burgeoning international live
is also expected to caused severe environmental and socio-economic
fi sh food trade and ornamental aquarium trade. Destructive fi shing, and
impacts in the future. For Wallacea and Sahul, the major concerns
poison fi shing in particular, is an increasing problem of great future
are Unsustainable exploitation of fi sh and Habitat and community
concern that already impacts all three sub-systems, both in terms of
modifi cation, with the present moderate to severe environmental and
fi sh and habitat loss. It has major transboundary implications, both in
socio-economic impacts expected to stabilise (habitats) and worsen
terms of target species population dynamics and replenishment, and
(fi sh) in the future. There are expected to be complex linkages between
in terms of the driving forces of international market demand. The
global change eff ects on freshwater shortage and habitat loss, and also
most signifi cant root causes are the interactions among market trends
between continuing habitat loss and fi sheries and increasing pollution
(notably the insatiable international demand for seafood) and poverty
and fi sheries in all three sub-systems.
among coastal people, driven by rapid population growth. Population
growth is exacerbating the lack of employment and poverty, which
The present population of the region is approximately 210 million,
are placing greater pressure on fi sheries. Lack of enforcement of laws
with approximately140 million living within 60 km of the coasts. Most
governing destructive fi shing, abetted through corruption within
EXECUTIVE SUMMARY
9
enforcement agencies and government, allows the illegal practices
Expanded research and development to `close' the reproductive
to fl ourish. Indonesia is party to most of the key international treaties
cycles of the key mariculture species in captivity, with opportunities
and conventions, and the relevant government departments have
for increased regional collaboration.
proposed policies or legislation in relation to these obligations.
Major expansion and improved integration of the marine protected
However, only modest progress has been made to date in their eff ective
area (MPA) network, with improved management, including major
implementation and the resolution of related problems.
focus on community co-management, particularly in relation to
fi sheries, with increased development of `no-take' zones, and
Most laws and regulations are not well accepted and the eff ectiveness
protection of spawning aggregation sites.
of implementation of national laws at provincial and local levels varies
markedly. There is insuffi
cient capacity for eff ective alleviation, in
National surveillance strategies, with participation from all levels of
part related to currency depreciation, shifts in government spending
government, NGOs and local communities may be the best way of
and recent political instability. Despite a recent trend towards
bridging the gaps between formulation, legislation and enforcement
decentralisation in governance, there remains insuffi
cient capacity
of regulations. There are many national, regional and international
for eff ective stewardship and control of the renewable resources. Key
"players" actively pursuing sustainable development initiatives, and best
government departments, including the enforcement agencies, are
use of this developing network should be made during future policy
hampered by a lack of qualifi ed and experienced staff , and also by
implementation. Government donor projects such as the Coral Reef
funding shortfalls and cutbacks.
Rehabilitation and Management Project (COREMAP) and Marine and
Coastal Resources Management Project (MCREP), among others, and
Economics and market trends drive the unsustainable use of resources
NGO programmes such as the Wallacea Bioregion (World Wildlife Fund),
and also infl uence corruption and the illegal practices. Addressing the
Komodo National Park Management Plan and others provide useful
combined synergistic negative impacts of population growth, political
models for future improvements in fi sh and habitat protection.
instability and widespread poverty among coastal populations is at
the core of developing successful policy options and implementing
In this regard, there has been recent convergence in views among
successful interventions, along with concurrent eff orts to address
scientists and resource managers on the crucial importance of
international demands.
MPAs and MPA network strategies as tools for sustainable fi sheries
management and resource protection. An integrated network of well-
At present, policy options and legislation are neither suffi
ciently
designed and well-managed MPAs should form the core of fi sheries
well developed nor integrated to facilitate implementation of the
management and marine conservation strategies. The development of
most urgent remedial measures. Recommended policy options for
a functional, integrated network of MPAs is an extremely urgent priority
Indonesian Seas, from the broad-scale to the fi ne-scale, include:
and there is an immediate need for the establishment of substantial no-
Improved integration of local, provincial and national laws and
take zones, with the development of policy and legal frameworks that
regulations in order to maximise eff ectiveness of the legislative
facilitate the process.
instruments to control destructive fi shing at local and national
levels, and to better encompass all sectors and meet obligations
Two major foci for action are apparent:
under international conventions and treaties.
The
urgent
need
for
eff ective management of the existing MPA
Improved surveillance, enforcement and eff ective policing of laws to
network.
reduce illegal fi shing practices, including development and eff ective
Careful planning and continued support for expansion of the
implementation of export quotas, catch and fi sh size limits.
network in terms of integration, particularly of cluster and
Continued and expanded community education programmes;
transboundary protected areas with neighbouring nations in
Improved
incomes
for
fi shermen through generation of ecologically
relation to the increasing eff ects of global change.
viable alternative or additional incomes (e.g. well planned and
ecologically-sustainable mariculture).
Successful implementation will primarily require a high degree of local
Development of alternative legal supply lines for live fi sh,
intervention and community-based support, including application
particularly through mariculture, with increased supply of such
and local enforcement of `no-take' replenishment areas in MPAs and
maricultured species to supplement dwindling catches of wild
protection of fi sh spawning aggregation sites, and also reliable stock
stocks.
assessment and monitoring. These need to be founded in an improved
10
GIWA REGIONAL ASSESSMENT 57 INDONESIAN SEAS
understanding of the population biology of the target species and
issues of ecological scale and connectivity in relation to replenishment,
including:
Catch volumes and Catch Per Unit Eff ort (CPUE).
Traditional knowledge (e.g. locations of spawning aggregation
sites of major commercial species), for development of protection
measures.
Natural changes in diversity, distribution and abundance of major
commercial species, in relation to seasonality eff ects, predator-prey
relationships, recruitment fl uctuations.
Concurrently, policies addressing the international demand aspects
of the fi shery, both for food and aquarium fi shes, need to be
implemented. A useful model is provided by the Marine Aquarium
Council (MAC). The Indonesian Ministry of Marine Aff airs and Fisheries
signed a Memorandum of Understanding (MoU) with the MAC
in July 2003, formalising the strong government support for the
MAC's work in developing fi shery sustainability in Indonesia. With
eff ective management, the aquarium industry can support long-term
conservation and sustainable use of coral reefs in regions where other
options for generating revenue are limited (UNEP-World Conservation
Monitoring Centre Director Mark Collins). Thus, the recent MoU between
the Government of Indonesia and the MAC regarding the collection and
export of ornamental aquarium fi sh can provide a useful model for the
live food fi sh industry.
The Indonesian Seas region lies at the centre of the world's marine
biodiversity, support rapidly growing, generally poor, coastal
populations and have rapidly deteriorating riverine, coastal and marine
ecosystems, with continued degradation and possible collapse of many
international waters resources. The policy options recommended herein
aff ect much of society, and place major responsibilities on government,
NGOs, educational institutions and the private sector. The challenge of
gathering the cooperation necessary for the sustainable development
of this critical region is great, but not insurmountable. More appropriate
allocation of local funds with continuing international assistance will be
required in the short-term. In particular, development and population
policies require urgent review if growth over the next several decades
is to be managed eff ectively and the present rapid rate of increase of
impacts is to be curbed. In recognition of the central importance of
Indonesian Seas in terms of global biodiversity, and the severe threat
posed by the complex interaction of factors identifi ed herein, the Task
team suggests that Indonesian Seas be aff orded the highest priority by
the Global International Waters Assessment.
EXECUTIVE SUMMARY
11
Abbreviations and acronyms
ADB
Asian Development Bank
MoU
Memorandum of Understanding
AIG
Alternative Income Generation
MPA
Marine Protected Area
ASEAN
Association of South East Asian Nations
MREP
Marine Resources Evaluation and Planning Project
BAPEDAL Environmental Impact Management Agency
MSY
Maximum Sustainable Yield
BAPPEDA Regional Planning Boards
NGO Non
Governmental
Organisation
BOD
Biological Oxygen Demand
PEMSEA Partnership in Environmental Management for the Seas of
CBD
Convention on Conservation on Biological Diversity
East
Asia
CI
Conservation International
PKA
Directorate General for Forestry Protection and Nature
CITES
Convention on International Trade in Endangered Species
Conservation
COREMAP Coral Reef Rehabilitation and Management Project
PROKASIH Program Kali Bersih (Clean River Programme)
CPUE
Catch Per Unit Eff ort
SARS Severe
Acute
Respiratory
Syndrome
CRIF
Central Research Institute for Fisheries
SPM
Suspended Particulate Matter
CSIRO
Commonwealth Scientifi c & Industrial Research Organisation
SST
Sea Surface Temperature
DGWRD Directorate General of Water Resources Development
TNC
The Nature Conservancy
EEZ
Exclusive Economic Zone
ULCC
Ultra Large Crude Carriers
ENSO
El Nińo Southern Oscillation
UNCLOS United Nations Convention on the Law of the Sea
GCRMN Global Coral Reef Monitoring Network
UNDP
United Nations Development Programme
GNP
Gross National Product
UNESCO
United Nations Educational, Scientifi
c and Cultural
GOI
Government of Indonesia
Organization
IOD
Indian Ocean Dipole
UNFCCC United Nations Framework Convention on Climate Change
IPCC
Intergovernmental Panel on Climate Change
WHO
World Health Organization
IPM
Integrated Pest Management Program
WRI
World Resources Institute
IUCN
World Conservation Union
WWF World
Wildlife
Fund
IUUF
Illegal, Unreported, and Unregulated Fisheries
KNP
Komodo National Park
LIPI
Indonesian Institute of Science
LME
Large Marine Ecosystem
MAC
Marine Aquarium Council
MAREMAP Marine Resources Evaluation, Management and Planning
Project
MARPOL International Convention on the Protection of Pollution from
Ships
MCREP
Marine and Coastal Resources Management Project
12
GIWA REGIONAL ASSESSMENT 57 INDONESIAN SEAS
List of figures
Figure 1
Boundaries of the Indonesian Seas region.. . . . . . . . . . . . . . . . . . . . . . . . . . . . . . . . . . . . . . . . . . . . . . . . . . . . . . . . . . . . . . . . . . . . . . . . . . . . . . . . . . . . . . . . . . . . . . . . . . . . . . . . . . . . . . . . . . . . . . 14
Figure 2
Reefs at risk in the Indonesian Seas region. . . . . . . . . . . . . . . . . . . . . . . . . . . . . . . . . . . . . . . . . . . . . . . . . . . . . . . . . . . . . . . . . . . . . . . . . . . . . . . . . . . . . . . . . . . . . . . . . . . . . . . . . . . . . . . . . . . . . 18
Figure 3
Population density in the Indonesian Seas region. . . . . . . . . . . . . . . . . . . . . . . . . . . . . . . . . . . . . . . . . . . . . . . . . . . . . . . . . . . . . . . . . . . . . . . . . . . . . . . . . . . . . . . . . . . . . . . . . . . . . . . . . . . . . . 20
Figure 4
Locals processing copra, Anambas & Natuna Archipelago, Indonesia. . . . . . . . . . . . . . . . . . . . . . . . . . . . . . . . . . . . . . . . . . . . . . . . . . . . . . . . . . . . . . . . . . . . . . . . . . . . . . . . . . . . . . . . . . . 21
Figure 5
Reefs at risk due to sedimentation. . . . . . . . . . . . . . . . . . . . . . . . . . . . . . . . . . . . . . . . . . . . . . . . . . . . . . . . . . . . . . . . . . . . . . . . . . . . . . . . . . . . . . . . . . . . . . . . . . . . . . . . . . . . . . . . . . . . . . . . . . . . . 32
Figure 6
Deforestation, Jawa, from October 19, 2002. . . . . . . . . . . . . . . . . . . . . . . . . . . . . . . . . . . . . . . . . . . . . . . . . . . . . . . . . . . . . . . . . . . . . . . . . . . . . . . . . . . . . . . . . . . . . . . . . . . . . . . . . . . . . . . . . . . 33
Figure 7
Waste in a local canal, Jakarta, Indonesia.. . . . . . . . . . . . . . . . . . . . . . . . . . . . . . . . . . . . . . . . . . . . . . . . . . . . . . . . . . . . . . . . . . . . . . . . . . . . . . . . . . . . . . . . . . . . . . . . . . . . . . . . . . . . . . . . . . . . . 34
Figure 8
Reefs at risk due to marine pollution. . . . . . . . . . . . . . . . . . . . . . . . . . . . . . . . . . . . . . . . . . . . . . . . . . . . . . . . . . . . . . . . . . . . . . . . . . . . . . . . . . . . . . . . . . . . . . . . . . . . . . . . . . . . . . . . . . . . . . . . . . . 36
Figure 9
Retaining wall made from coral.. . . . . . . . . . . . . . . . . . . . . . . . . . . . . . . . . . . . . . . . . . . . . . . . . . . . . . . . . . . . . . . . . . . . . . . . . . . . . . . . . . . . . . . . . . . . . . . . . . . . . . . . . . . . . . . . . . . . . . . . . . . . . . . 42
Figure 10
Reefs at risk due to alteration of land cover.. . . . . . . . . . . . . . . . . . . . . . . . . . . . . . . . . . . . . . . . . . . . . . . . . . . . . . . . . . . . . . . . . . . . . . . . . . . . . . . . . . . . . . . . . . . . . . . . . . . . . . . . . . . . . . . . . . . . 44
Figure 11
Catches of various fish resources in the Indonesian Seas. . . . . . . . . . . . . . . . . . . . . . . . . . . . . . . . . . . . . . . . . . . . . . . . . . . . . . . . . . . . . . . . . . . . . . . . . . . . . . . . . . . . . . . . . . . . . . . . . . . . . . . 48
Figure 12
Reefs at risk threat analysis for overfishing. . . . . . . . . . . . . . . . . . . . . . . . . . . . . . . . . . . . . . . . . . . . . . . . . . . . . . . . . . . . . . . . . . . . . . . . . . . . . . . . . . . . . . . . . . . . . . . . . . . . . . . . . . . . . . . . . . . . 53
Figure 13
Fish for sale at local market, Unjung Pandang, Sulawesi. . . . . . . . . . . . . . . . . . . . . . . . . . . . . . . . . . . . . . . . . . . . . . . . . . . . . . . . . . . . . . . . . . . . . . . . . . . . . . . . . . . . . . . . . . . . . . . . . . . . . . . 54
Figure 14
Sea surface temperature anomalies during 1998 in the Indonesian Seas region. . . . . . . . . . . . . . . . . . . . . . . . . . . . . . . . . . . . . . . . . . . . . . . . . . . . . . . . . . . . . . . . . . . . . . . . . . . . . . . . 57
Figure 15
Causal chain diagram illustrating the causal links for destructive fishing practices. . . . . . . . . . . . . . . . . . . . . . . . . . . . . . . . . . . . . . . . . . . . . . . . . . . . . . . . . . . . . . . . . . . . . . . . . . . . . 63
Figure 16
Live fishholding pens, Anambas & Natuna Archipelago, Indonesia.. . . . . . . . . . . . . . . . . . . . . . . . . . . . . . . . . . . . . . . . . . . . . . . . . . . . . . . . . . . . . . . . . . . . . . . . . . . . . . . . . . . . . . . . . . . . 64
Figure 17
Live reef fish, including large groupers Epinephelis and Plectropomus spp. for sale in restaurants, Hong Kong. . . . . . . . . . . . . . . . . . . . . . . . . . . . . . . . . . . . . . . . . . . . . . . . . 65
Figure 18
Live reef fish, including Barramundi cod Cromileptes altivelis for sale in restaurants, Hong Kong. . . . . . . . . . . . . . . . . . . . . . . . . . . . . . . . . . . . . . . . . . . . . . . . . . . . . . . . . . . . . . . 65
Figure 19
Live reef fish, including Maori wrasse Chelinus undulatus for sale in restaurants, Hong Kong. . . . . . . . . . . . . . . . . . . . . . . . . . . . . . . . . . . . . . . . . . . . . . . . . . . . . . . . . . . . . . . . . . 65
Figure 20
Collecting fish from holding cages for live fish market, Kapoposang Island, Sulawesi. . . . . . . . . . . . . . . . . . . . . . . . . . . . . . . . . . . . . . . . . . . . . . . . . . . . . . . . . . . . . . . . . . . . . . . . . . 70
Figure 21
Local boat, Kaposang Island, Sulawesi. . . . . . . . . . . . . . . . . . . . . . . . . . . . . . . . . . . . . . . . . . . . . . . . . . . . . . . . . . . . . . . . . . . . . . . . . . . . . . . . . . . . . . . . . . . . . . . . . . . . . . . . . . . . . . . . . . . . . . . . . 73
List of tables
Table 1
Diversity of selected groups of marine organisms in Indonesia. . . . . . . . . . . . . . . . . . . . . . . . . . . . . . . . . . . . . . . . . . . . . . . . . . . . . . . . . . . . . . . . . . . . . . . . . . . . . . . . . . . . . . . . . . . . . . . . . . 19
Table 2
Socio-economic indicators for Indonesia. . . . . . . . . . . . . . . . . . . . . . . . . . . . . . . . . . . . . . . . . . . . . . . . . . . . . . . . . . . . . . . . . . . . . . . . . . . . . . . . . . . . . . . . . . . . . . . . . . . . . . . . . . . . . . . . . . . . . . . 21
Table 3
Scoring table for Sunda, Wallacea and Sahul sub-systems. . . . . . . . . . . . . . . . . . . . . . . . . . . . . . . . . . . . . . . . . . . . . . . . . . . . . . . . . . . . . . . . . . . . . . . . . . . . . . . . . . . . . . . . . . . . . . . . . . . . . 26
Table 4
Overview of environmental impacts of relevance to Indonesia's marine mammals. . . . . . . . . . . . . . . . . . . . . . . . . . . . . . . . . . . . . . . . . . . . . . . . . . . . . . . . . . . . . . . . . . . . . . . . . . . . 38
Table 5
Coral cover of reefs in Indonesia. . . . . . . . . . . . . . . . . . . . . . . . . . . . . . . . . . . . . . . . . . . . . . . . . . . . . . . . . . . . . . . . . . . . . . . . . . . . . . . . . . . . . . . . . . . . . . . . . . . . . . . . . . . . . . . . . . . . . . . . . . . . . . . 39
Table 6
Status of the coral reefs in Indonesia using the 1999 LIPI data. . . . . . . . . . . . . . . . . . . . . . . . . . . . . . . . . . . . . . . . . . . . . . . . . . . . . . . . . . . . . . . . . . . . . . . . . . . . . . . . . . . . . . . . . . . . . . . . . . 39
Table 7
Coral reef degradation in Indonesia.. . . . . . . . . . . . . . . . . . . . . . . . . . . . . . . . . . . . . . . . . . . . . . . . . . . . . . . . . . . . . . . . . . . . . . . . . . . . . . . . . . . . . . . . . . . . . . . . . . . . . . . . . . . . . . . . . . . . . . . . . . . 39
Table 8
Terrestrial and marine conservation areas in Indonesia. . . . . . . . . . . . . . . . . . . . . . . . . . . . . . . . . . . . . . . . . . . . . . . . . . . . . . . . . . . . . . . . . . . . . . . . . . . . . . . . . . . . . . . . . . . . . . . . . . . . . . . . 46
Table 9
Live fish exports for Indonesia 1996-1998. . . . . . . . . . . . . . . . . . . . . . . . . . . . . . . . . . . . . . . . . . . . . . . . . . . . . . . . . . . . . . . . . . . . . . . . . . . . . . . . . . . . . . . . . . . . . . . . . . . . . . . . . . . . . . . . . . . . . . 51
List of boxes
Box 1
Restoration of coral reefs following blast fishing. . . . . . . . . . . . . . . . . . . . . . . . . . . . . . . . . . . . . . . . . . . . . . . . . . . . . . . . . . . . . . . . . . . . . . . . . . . . . . . . . . . . . . . . . . . . . . . . . . . . . . . . . . . . . . . 40
Box 2
Mangrove clearance and development for aquaculture ponds. . . . . . . . . . . . . . . . . . . . . . . . . . . . . . . . . . . . . . . . . . . . . . . . . . . . . . . . . . . . . . . . . . . . . . . . . . . . . . . . . . . . . . . . . . . . . . . . . 40
Box 3
Remedial actions for mangrove loss in the Mahakam Delta. . . . . . . . . . . . . . . . . . . . . . . . . . . . . . . . . . . . . . . . . . . . . . . . . . . . . . . . . . . . . . . . . . . . . . . . . . . . . . . . . . . . . . . . . . . . . . . . . . . . 47
Box 4
Challenges for effective management of an expanding protected network. . . . . . . . . . . . . . . . . . . . . . . . . . . . . . . . . . . . . . . . . . . . . . . . . . . . . . . . . . . . . . . . . . . . . . . . . . . . . . . . . . . . 47
Box 5
The importance of coral reef fisheries in Indonesia. . . . . . . . . . . . . . . . . . . . . . . . . . . . . . . . . . . . . . . . . . . . . . . . . . . . . . . . . . . . . . . . . . . . . . . . . . . . . . . . . . . . . . . . . . . . . . . . . . . . . . . . . . . . . 49
Box 6
Impacts and threats to marine mammals. . . . . . . . . . . . . . . . . . . . . . . . . . . . . . . . . . . . . . . . . . . . . . . . . . . . . . . . . . . . . . . . . . . . . . . . . . . . . . . . . . . . . . . . . . . . . . . . . . . . . . . . . . . . . . . . . . . . . 50
Box 7
Destructive fishing methods in Indonesia. . . . . . . . . . . . . . . . . . . . . . . . . . . . . . . . . . . . . . . . . . . . . . . . . . . . . . . . . . . . . . . . . . . . . . . . . . . . . . . . . . . . . . . . . . . . . . . . . . . . . . . . . . . . . . . . . . . . . . 51
Box 8
Impacts and threats to marine mammals. . . . . . . . . . . . . . . . . . . . . . . . . . . . . . . . . . . . . . . . . . . . . . . . . . . . . . . . . . . . . . . . . . . . . . . . . . . . . . . . . . . . . . . . . . . . . . . . . . . . . . . . . . . . . . . . . . . . . 52
Box 9
Charactestics of eastern Indonesia which affect the scale and response of climate change. . . . . . . . . . . . . . . . . . . . . . . . . . . . . . . . . . . . . . . . . . . . . . . . . . . . . . . . . . . . . . . . . . . . . 56
Box 10
The scenario for climate change in Indonesia. . . . . . . . . . . . . . . . . . . . . . . . . . . . . . . . . . . . . . . . . . . . . . . . . . . . . . . . . . . . . . . . . . . . . . . . . . . . . . . . . . . . . . . . . . . . . . . . . . . . . . . . . . . . . . . . . . 58
Box 11
Benefits of a well managed Marine Protected Area in Komodo National Park. . . . . . . . . . . . . . . . . . . . . . . . . . . . . . . . . . . . . . . . . . . . . . . . . . . . . . . . . . . . . . . . . . . . . . . . . . . . . . . . . . 71
ABBREVIATIONS AND ACRONYMS
13
Regional defi nition
This section describes the boundaries and the main physical and
Boundaries of the region
socio-economic characteristics of the region in order to defi ne the
area considered in the regional GIWA assessment and to provide
The Indonesian Seas regional boundaries encompass most of the
suffi
cient background information to establish the context within
approximately 18 000 islands and territory of the Republic of Indonesia,
which the assessment was conducted.
being bounded on its western and northern extent by the adjacent
GIWA regions of Bay of Bengal (GIWA region 53), South China Sea (GIWA
Malaysia
S
Ma
u
hak
am
m
M A K A S S A R
a
S T R A I T
t
r
I
K a l i m a n t a n
a
N
K A R I M A T A
I
S u l a w e s i
S T R A I T
D
n
I
57a - Sunda
A
d
57b - Wallacea
J A W A S E A
N
Jakarta
o
Bandung
Semarang
n
Elevation/
O
e
Surabaya
s
Depth (m)
J
a
w
a
i
a
C
Lombok
4 000
E
Bali
Flores
2 000
A
1 000
N
N u s a T e n g g a r a
500
100
0
-50
-200
-1 000
-2 000
Figure 1
Boundaries of the Indonesian Seas region.
14
GIWA REGIONAL ASSESSMENT 57 INDONESIAN SEAS
region 54) and Sulu-Celebes (Sulawesi) Sea (GIWA region 56); on its
The boundary continues from the north coast of Sumatra in Jambi
southern extent by the North Australian Shelf (GIWA region 58); and
Province across the Karimata Strait to include the southeastern area of
northeastern extent by Pacifi c Islands (GIWA region 62). The region is
Sumatra and Pulau Bangka and Belitung to the South-West Kalimantan
composed of many smaller seas of diverse character; including the Jawa
border, then north along the provincial border to include all of South
Sea, Bali Sea, Flores Sea, Sawu Sea, Timor Sea, Banda Sea, Seram Sea,
Kalimantan and parts of East Kalimantan, notably the Mahakam River
Maluku Sea, Halmahera Sea and Arafura Sea, and the Makassar Strait.
catchment.
At its eastern extent, the regional boundary was extended to
On its northwestern extent, the boundary continuing east across
encompass all of Irian Jaya (Papua), Kepulauan Aru and Kepulauan
Makassar Strait and includes most of Sulawesi. The northern boundary
Tanimbar, following the 200 m depth contour on the northern coast of
includes the islands of Halmahera and Morotai, and follows the 200 m
Irian in the north and across the Arafura Sea on the Indonesia/Australia
depth contour eastwards along the north coast of Irian to the Irian Jaya/
territorial boundary to the Irian Jaya/Papua New Guinea territorial
Papua New Guinea (PNG) territorial border. The southern boundary
boundary in the south (Figure 1).
extends from the Irian Jaya/PNG territorial border across the Arafura
Sea following the Indonesia/Australia territorial boundary, to the south
On its western extent, the boundary include the southwestern portion
of the main island chain, including the Jawa Trench in the Indian Ocean,
of Sumatra, its catchments, and islands of Kepulauan Mentawi and Nias.
to the northwestern tip of Sumatra (Aceh). The region also includes the
The region boundary includes all of southern and eastern Sumatra,
small independent state of East Timor.
following the central dividing range of Sumatra from Aceh in the
north to Jambi in the central highlands, then northwards to the coast.
Exclusions of Indonesia's territory from the region include the
northeastern and central parts of Kalimantan facing the Malacca Strait
as well as the western part of Kalimantan (including Indonesian West
Kalimantan, Malaysian Sarawak and Sabah and Brunei). The north
coast of Sulawesi, parts of East Kalimantan and the south of the Jawa
Trench, Christmas Island and Cocos-Keeling Island (Australia) are also
excluded.
M
a
International waters, in the sense of the GIWA defi nition, include the
M A L U K U
lu
S E A
k
entire coastal and marine area; as this is a potential source or recipients
u
of transboundary impacts, primarily from shipping, fi sheries, pollution,
i sl
introduction of alien species, riverine discharges, and law and order
a
Mam
n
be
d
ra
issues.
mo
s
I r i a n J a y a
Given the major diff erences that exist in geomorphology, oceanography,
bathymetry, climate, biodiversity, patterns of human demography, use
57c - Sahul
u
B A N D A S E A
Pula
P a p u a
and impact and transboundary issues within Indonesian Seas, the
region was assessed as three sub-systems:
Digul
A R A F U R A
Sunda (western part of the region);
S E A
East Timor
Wallacea
(central
part);
Sahul
(eastern
part).
Boundaries of the sub-systems
The Sunda sub-system includes all the western islands and waters that
are developed on the Sunda Shelf from the northern tip of Sumatra,
0
500
Kilometres
southeast along the central range then northeast to include East
© GIWA 2004
Kalimantan, and southwards to Jawa and Bali in the east. The sub-
system also includes the Indian Ocean waters of the Jawa Trench to
REGIONAL DEFINITION
15
the south of Sumatra/Bali. The boundary between Sunda and Wallacea
numerous active volcanoes and earthquake occurrences). In total,
passes through Makassar Strait and Lombok Strait to the east of Bali.
Indonesia has some 129 volcanoes, 15 of which are considered critical
and likely to explode, with three to fi ve eruptions annually. Thus, most
Wallacea includes the central islands and waters of the region,
of Indonesian Seas are in a geologically active region.
extending eastwards from the Makassar and Lombok Straits to
encompass Sulawesi, Lombok, Sumbawa, Flores, Sumba and the smaller
Climate
islands of Nusa Tenggara, Ambon, Ceram, Buru and the other Maluku
The Indonesian archipelago stands between the Pacifi c and Indian
Islands, Halmahera and Morotai and the Kai, Aru and Tanimbar Islands
Oceans and is heavily infl uenced by annual and inter-annual variations
in the east. The eastern boundary of Wallacea follows the border of the
in surface temperature due to a reversing monsoonal system. The
Sahul Shelf. Wallacea encompasses the area of transition of Asiatic and
region lies within the sub-equatorial and equatorial zones (from
Australasian biodiversity initially noted by A.R. Wallace in the mid-1800s
latitudes 4° N to 10° S), and mostly lies under the infl uence of the
(`Wallace Line'), and after which the sub-system is named. Boundaries
seasonal monsoon winds. There are two seasons, the dry season and
of the Wallacea sub-system are also in close congruence with those of
the wet season. The dry season lasts from March to August and the
the WWF Wallacea Bioregion (see below).
wet season from September to March with the heaviest rainfall usually
from November to February. Annual rainfall in excess of 1 000 mm
Sahul includes Irian Jaya and the Rajah Ampat Islands of Pulau Waigeo
occurs in many of the western and eastern areas and annual minimum
and others, Pulau Misool and Kepulauan Schouten. The sub-system
temperatures are usually more than 20°C other than in the highlands.
includes the major central mountain range of Pegunungan Maoke and
Rainfall in the region is highest on the upland areas, notably of central
major river systems of Mamberamo-Tariku-Van Daatan-Taritatu on the
Kalimantan (Borneo), central Sumatra, Jawa and Papua. Some places
north coast and Digul and Pulau Vriendschaps on the south coast.
receive more than 3 000 mm of rain annually. By contrast, parts of the
lowlands, coastal areas and other areas in rain-shadows receive far
less rain (less than 1 000 mm/year), and may experience severe water
shortages. Examples include some of the islands of Nusa Tenggara, to
Physical characteristics
the east of Bali and Lombok. The temperature ranges from 21 to 33°C,
but at higher altitudes the climate is cooler. Humidity is mostly between
The Indonesian Seas region contains most of the land and seas of
60 and 80% (FAO AQUASTAT 2003).
the Republic of Indonesia, which is the world's largest archipelagic
nation, with some 18 000 islands. The region is 6 million km2 of which
A recently discovered climate feature, the Indian Ocean Dipole (IOD),
1.43 million km2 is land. The major islands in the region are Sumatra,
is linked with fl uctuations in sea surface temperature (SST) within the
Jawa, Nusa Tenggara, Kalimantan, Sulawesi, Maluku and Irian Jaya
region. For example, in 1997, anomalously cool SSTs occurred in the
(Papua). Most of the major islands have a mountain range running for
eastern Indian Ocean, aff ecting parts of the region, both in terms of
much of their length. The mountains are mostly of volcanic origin and
environmental and socio-economic impacts (Abram et al. 2003).
in some cases remain active. The elevations of the islands range from 0
to 5 030 m above sea level.
River basins and water resources
The region includes the drainage basins of streams and rivers of most
Geologically, the Indonesian Seas region lies at the confl uence of
of Indonesia, some 5 590 rivers in all, and including the major river
three tectonic plates: the Eurasian Plate, the Indo-Australian Plate and
systems of the larger islands of Jawa, Irian, Sumatra and Kalimantan.
the Pacifi c Plate. The Island of Kalimantan (Borneo), the third largest
The regional boundary was extended to include the major Mahakam
island on Earth, lies on the Asian continental (Sunda) shelf, is physically
River and catchment of East Kalimantan, fl owing into the Makassar Strait.
stable and has been joined by a land bridge to the Asian mainland
The Mahakam River drains almost one third of East Kalimantan, with
during Pleistocene and earlier periods of glaciation (Daws & Fujita
a discharge of 1 500 m3/sec, a suspended sediment load of 80 mg/l,
1999). Similarly, Papua lies on the relatively geologically stable Sahul
a sediment yield of up to 10 million tonnes annually, producing a
Shelf, and the larger Island of Irian (New Guinea) has been joined to
plume for some 400 km to the southeast of the delta into Makassar
Australia during glacial falls in sea level. Sumatra and Jawa lie on the
Strait (Dutrieux 1991). South Kalimantan has many smaller rivers and
southeastern edge of the Sunda Shelf, and with many of Indonesia's
streams, including the Negara, Medawai, Sampit, Pembuang, Arut and
islands are subject to tectonic instability and volcanic activity (with
Lamandau rivers. Major rivers of southeast Sumatra include the Seputih,
16
GIWA REGIONAL ASSESSMENT 57 INDONESIAN SEAS
Tulangbawang, Musi, Kamering, Rawas and Hari rivers. On Jawa, major
Halmahera, Morotai and Papua and focused through the Lombok Strait
rivers include the Japat, Sadane, Tarujm, Kali Mas, Manuk, Serang, Solo
(Bali-Lombok) and corridors around Timor. There is a general north-
and Brantas rivers fl owing into the Jawa Sea on the north coast. In
south through-fl ow, but with some (mostly sub-surface) fl ow in the
Papua, the major rivers include Digul and Vriendschaps.
opposite direction. Additionally, reversing seasonal surface currents
driven by the monsoon winds bring waters from the South China
There are also numerous smaller rivers and streams fl owing from the
Sea into and out of the Jawa Sea along the north coasts of Sumatra
mountainous interiors of most of the islands in the region. Although
and Jawa and southern coast of Kalimantan. The Jawa coastal current
water resources are abundant, the seasonal and spatial variation in
fl ows eastwards to the south of Jawa/Sumatra. Local current patterns
the rainfall pattern and lack of adequate storage create competition
form complex eddies and counter-currents around most islands, and
and confl icts among users. Most of the lakes in Indonesia are volcanic
in places reach speeds of more than 5 knots.
in origin. Lake Toba, Sumatra, is the largest volcanic lake in the world,
with an average surface area of 1 100 km˛ and an average volume of
The southern coastlines from Sumatra to Timor and northern coastlines
1 258 kmł (FAO AQUaSTAT 2003).
of Halmahera, Morotai and Papua are under the infl uence of long period
ocean swell that can exceed 5 m in height from the Indian and Pacifi c
Oceanography
Oceans, generated by tropical-temperate storms, many of which are
The Indonesian Seas Large Marine Ecosystem (LME) has an area of
thousands of kilometres away. More localised severe waves (tsunamis)
400 000 km2 and extends from east to west across a distance of 5 000 km
can be generated by tectonic activity, such as that which devastated
(LME 2003). The LME has strong tidal currents and the pattern of surface
southern Sumatra and northern Jawa following the Krakatau volcanic
currents varies during the southeast and northwest monsoon. It also
cataclysm of August 1883. By contrast, within the marginal seas of
experiences annual and interannual variations in surface temperature.
the Indonesian Archipelago, ocean swells are generally less than 2 m
The warm ocean and its links to the atmosphere create the El Nińo
high and generated by local weather patterns and the trade winds of
Southern Oscillation (ENSO) phenomenon. The infl uence of El Nińo,
the monsoons, and sea conditions are often calm and referred to as
La Nińa and the Australian and Asian monsoons contribute to the
"the doldrums".
unique climate conditions in this region, of major relevance to global
climate and the subject of continuing climatological research.
Coastal and marine ecosystems
Mangroves and seagrasses
The region has complex bathymetry, the western area lying on the
Most of the region's protected coastlines were originally fringed
Sunda Shelf, the central area forming a transition zone composed in
by mangrove forests and seagrass beds. Mangroves, with some
part by the deep basins of the Flores and Banda Seas and the eastern
47 species known from Indonesian Seas, have an area estimated at
area lying on the Sahul Shelf. Coastal waters of the Sunda Shelf, the Jawa
between 2.49 million ha (Tomascik et al. 1997) and 4.25 million ha
Sea and the Sahul Shelf are shallow (<200 m depth) and infl uenced
(Wilkinson 1994). Most mangroves are located in Papua (estimated
by both marine and terrestrial inputs. By contrast, the Banda Sea has
at 29 000 km2), Sumatra (4 170 km2), Kalimantan (2 750 km2) and Jawa
depths greater than 4 500 m, the Flores Sea is deeper than 5 000 m
(343 km2) (Priyono & Sumiono 1997). This represents over two thirds of
and the Jawa Trench exceeds 6 500 m in depth. Most of these seas
the area of mangroves in South East Asia. Seagrass beds are even more
can be characterised as marginal seas, being enclosed by island
extensive (30 000 km2 according to Tomascik et al. 1997) with 13 species
landmasses, and with oceanic input from the Pacifi c and Indian Oceans
developed in varied habitats from intertidal mudfl ats to shallow sandy
in the Indonesian Through-fl ow. The Through-fl ow, the exchange of
beaches to coral reef fl ats. However, extensive cutting for timber,
ocean water between the Pacifi c and Indian Oceans, is thought to be
conversion for aquaculture and other forms of coastal development and
infl uenced by, and may infl uence in turn, ENSO.
extensive siltation/sedimentation have caused major fragmentation
and reduction in the area of these habitats (see Assessment, Habitat
The Indonesian Through-fl ow exports warm, relatively fresh (low
and community modifi cation).
salinity) thermocline water from the North Pacifi c, providing a major
freshwater source for the Indian Ocean. Strong ocean mixing infl uences
Coral reefs
sea surface temperature and nutrient concentrations (LME 2003). This
With a total estimated area of between 50 000 and 90 000 km2,
infl ux of Pacifi c oceanic waters moves into the area from the Sulawesi
Indonesia's coral reefs comprise more than 10% of the global total
Sea via the Makassar Strait and through corridors between Sulawesi,
(Spalding et al. 2001). By contrast, an earlier offi
cial estimate for the area
REGIONAL DEFINITION
17
Malaysia
57a - Sunda
57b - Wallacea
57c - Sahul
I
n
d
o
n
e
s
i
a
East Timor
Estimated
threat level
High
Medium
Low
0
500 Kilometres
©
GIWA©
2004
Figure 2
Reefs at risk in the Indonesian Seas region.
(Source: Burke et al. 2002)
of coral reefs is just 7 500 km2 (KLH 1992). However, another re-estimate
Berau Delta, in places only 10 km off shore, and has a length of 25 km.
by Tomascik et al. (1997), based on a longer fi gure for total coastline, is
Parts of the Mangkalihat Peninsula are also bordered by a barrier reef.
85 707 km2 which represents about 14% of the world total (Hopley &
The most unique barrier system in Indonesia is the Banggai Barrier Reef
Suharsono 2000). As with the coastal habitats, reefs of the region have
running 175 km along the southern margins of the Banggai Islands. Part
been damaged through destructive fi shing, sedimentation and other
of this barrier consists of lagoonal `faro' reefs very similar to those of
forms of human use. Many of the region's reefs (~ 80%) are at extremely
the Maldives. North of the Mangkalihat Peninsula are three major reefs
high risk of further damage from human activities (e.g. Bryant et. al.
which Tomascik et al. (1997) term atolls, although Hopley and Suharsono
1998, Burke et al. 2002) (Figure 2).
(2000) consider that they are more likely to be large lagoonal shelf reefs
rather than fulfi lling the strict geological criteria for oceanic atolls with
The coast under the immediate infl uence of the major river systems (e.g.
volcanic foundations. Similarly, Tomascik et al. (1997) describe 27 atolls
Mahakam and Berau rivers, East Kalimantan) is mostly devoid of fringing
in the waters around Sulawesi. Tomascik et al. (1997) and Hopley and
coral reefs, although small fringing and patch reefs are present in some
Suharsono (2000) provide detailed analysis of the reef types and their
places. Fringing reefs are very well developed away from the major
distribution. Moosa et al. (2002) provide a recent overview of the status
river estuaries and fringe much of the coastlines of the approximately
of research into Indonesia's coral reefs.
18 000 islands of the Archipelago. Some of the most widespread
fringing reefs in Indonesia are in the turbid waters of the Aru Islands,
Because of their rich biodiversity, diverse geo-morphology and great
which consist of six main islands and 79 smaller islands separated by
importance in providing sustenance for local human populations, the
long narrow channels (Tomascik et al. 1997, Hopley & Suharsono 2000).
coral reef areas around much of Indonesia are recognised as being of
Off shore, series of large platform reefs and atolls are developed; the
exceptional conservation value. These include the patch reef complexes
most famous being the Taka Bone Rate Atoll reefs of the Flores Sea. All
of northern Jawa, fringing reefs of Bali, fringing, patch and atoll reefs
major reef types; fringing, patch-platform (including barrier) and atolls,
of Sulawesi (e.g. Taka Bone Rate, Tukang Besi Islands, Bay of Tomini,
occur. Off shore in eastern Kalimantan, the better water quality has
Bunaken), Nusa Tenggara, the Banda Sea and northern Papua (notably
allowed the development of barrier reef systems.
Rajah Ampat Islands and Teluk Cendarawasa).
The longest barrier reef in Indonesia, the Great Sunda Barrier Reef, runs
Halimeda bioherms
inside the 200 m isobath at the margin of the Sunda shelf, some 60 km
A closely related habitat which requires similar management and
off shore, and has a length of 630 km. Smaller barrier reefs occur north
conservation approaches to coral reefs is the major area of Halimeda
of the Mahakam Delta. The Berau system is immediately north of the
algal bioherms, notably at the southern end of the Makassar Strait
18
GIWA REGIONAL ASSESSMENT 57 INDONESIAN SEAS
(Phipps & Roberts 1988, Hopley & Suharsono 2000). Associated with the
Chou 1997, Tomascik et al. 1997, Veron 2000, Spalding et al. 2001).
Kalukalukuang Bank in particular, these algal `reefs' also occur around
The exceptional biodiversity of marine fl ora and fauna is a result of its
the margin of the Sunda Shelf towards Kalimantan. Here algal growth
geographical and geologic history. The vast archipelago is a "melting
is favoured over reef growth as nutrient rich deep Pacifi c water fl oods
pot of a number of biogeographic provinces" (Tomascik et al 1997),
southwards through the Makassar Strait and upwells around the banks
and includes seven of the eight fi rst order biogeographic divisions of
and shelf margin (Hopley & Suharsono 2000).
East Asian Seas (Hayden et al. 1984, Bleakley & Wells 1995). Indonesian
Seas also include the deepest seas of South East Asia, and the pelagic
For further information and a detailed and informative description
realm is an important habitat, supporting high biodiversity of large and
of the oceanography, biology and ecology of Indonesian Seas, see
small migratory marine life, including a wide variety of cetaceans. The
Tomascik et al. (1997).
cetaceans, including the Blue whale (Balaenoptera musculus, considered
endangered by the World Conservation Union IUCN) and the vulnerable
Biodiversity
Fin whale (B. physalus) and Humpback whale (Megaptera novaeangliae),
With the adjacent regions of Sulu-Celebes (Sulawesi) Sea and South
and other migratory species, frequently use the marine corridors of the
China Sea, the region lies within the global centre of biodiversity
archipelago in migrations, particularly the deep seas of Maluku and the
for marine species (Table 1), supporting for example more than
straits at Flores and Lombok (Kahn & Pet 2003, Kahn pers. comm.).
500 species of reef-building corals, 2 500 species of marine fi shes,
47 species of mangroves and 13 species of seagrasses (Veron 1995,
Marine species considered by the World Conservation Union (IUCN)
as vulnerable, threatened or endangered that occur in Indonesian
Table 1
Diversity of selected groups of marine organisms in
Seas include dugongs, turtles, whales and dolphins (29 species)
Indonesia.
(Moosa 1999). Under various Indonesian Government decrees, some
Range
Major group
Group forms
Species
25 species, including the Dugong (Dugong dugon), six species of sea
recorded*
Green algae
1
196
turtle, 12 species of mollusc and six species of whales are listed for
Brown algae
1
134
protection (Cheung et al. 2002).
Plants
Red algae
1
452
Seagrasses
1
13
The distribution of dugongs is fairly widespread, from sheltered to
Mangrove
1
38
highly wave-exposed coasts (e.g. South Bali) although mostly occurring
Scleractinians
2
350
in low numbers as a result of hunting and accidental catch (Cheung
Corals
Soft corals
1
210
et al. 2002). The major populations occur in western Cenderawasih in
Gorgonians
1
350
Papua and Kepulauan Aru in the Arafura Sea (Husar 1978). More than
Desmospongia
1
850
140 turtle nesting sites are known (Salm & Halim 1984, Soehartono 1994),
Sponges
Gastropoda
2
1 500
although the degree of usage by large nesting populations remains
Mollusca
Bivalvia
1
1 000
unclear, and it is thought to be declining because of widespread habitat
Stomatopoda
1
102
destruction, targeted and accidental capture and other disturbances
Crustacea
Brachyura
1
1 400
(Cheung et al. 2002).
Crinoidea
2
91
Asteroidea
2
87
Biodiversity and endemism is particularly high on the Island of Sulawesi
Echinoderms
Ophiuroidea
2
142
(Wallacea sub-system), formed from three diff erent land masses (Daws
Echinoidea
2
284
& Fujita 1999). On neighbouring Kalimantan (Sunda sub-system), there
Holothuroidea
2
141
are some 10 000 species of fl owering plants, 222 mammals, including
Fishes
Marine fishes
1
2 140
primates (e.g. orang-utan), 420 birds, 166 snakes, 7 100 amphibians
Sea turtles
1
6
and 390 freshwater fi shes (with 1 400 freshwater fi sh species for
Reptiles
Crocodiles
1
ND
Indonesia as a whole). A.R Wallace fi rst described in the 1880s the
Birds
Marine birds
2
148
major faunal discontinuity between Asia and Australasian that divides
Whales & dolphins
1
29
the archipelago into two major faunal realms, subsequently named
Mammals
Dugong
2
1
"Wallace's LineSocio-economic characteristics.
Note:* 1 = Specifically Indonesia; 2 = Indonesia and adjacent waters. ND = No Data.
(Source: Hopley & Suharsono 2000, Moosa 1999, amended from Soegiarto & Polunin 1981)
REGIONAL DEFINITION
19
Socio-economic characterstics
More recent estimates suggest a total population of 230 million in
Indonesia as a whole, with most (200 million) residing in the GIWA
Indonesia has a population of some 200 million people, which is
region Indonesian Seas, and some 140 million living within 60 km
comprised predominantly by peoples of Indo-Malay and Melanesian
of the coast (UN 2002). In 1996, the average population density was
origin (Irian). Peoples of other ethnic origins are also present, some
105 inhabitants per km2, increasing to 112 per km2 by 1998 (FAO
forming ancestral tribal groups, particularly in Kalimantan (Borneo),
AQUASTAT 2003). The population is unevenly distributed with about
Sumatra and adjacent islands (e.g. Nias and Kepulauan Mentawi),
60% living on the Island of Jawa, which has an average population
others of more recent arrival (e.g. Chinese and Indian traders). Within
density of over 800 inhabitants per km2, among the highest population
these broad ethnic groups, there are substantial cultural diff erences
density of any island on Earth. Another 20% of the population live on the
and various forms of religious belief, principally Islam, but with areas of
Island of Sumatra, with a population density of 77 inhabitants per km2.
Christianity (notably Ambon, North Sulawesi and parts of Kalimantan),
Kalimantan supports another 10 million, with a density of less than
Hinduism (notably Bali) and Buddhism (parts of Jawa and Bali). There
17 inhabitants per km2. By contrast, some of the smaller islands of Nusa
has been broad acceptance of diff erent religious viewpoints in the
Tenggara are sparsely populated, in part because of water shortages,
past, and Indonesia's guiding principle is `Unity through Diversity'.
while to the east, the comparatively large area of Papua supports less
However, racial, cultural and religious tensions have been building
than 10 million people, almost entirely of Melanesian ancestry. Of the
in recent times, concomitant with the economic diffi
culties of the
three sub-systems, approximately 150 million live in Sunda, some
late 1990s. For example, parts of Sumatra, Jawa, East Kalimantan
35 million in Wallacea and less than 10 million in Sahul (Figure 3).
and the Moluccas (Ambon) have experienced civil instability and
clashes between diff erent religious and political groups. The recent
The population is distributed in the larger urban settlements and
independence of East Timor created civil unrest and armed clashes
throughout thousands of villages spread along the coast, across
requiring the intervention of an UN-led international peacekeeping
the lowlands and into the highlands, usually concentrated on the
force. Secessionist movements, groups seeking autonomy or semi-
watercourses. The larger urban centres include Jakarta (>10 million),
autonomy, are also active in Northern Sumatra (Aceh area) and Irian.
Surabaya eastern Jawa (>4 million), Bandung Jawa (2.5 million),
Semarang Jawa (2 million), Makassar Sulawesi (4 million), Denpasar Bali
Population
(1 million), Mataram Lombok(0.5 million), Palu (300 000), Kupang Timor
In 1996, the total population in Indonesia was about 198 million
(300 000), Ambon city Ambon (300 000) and Jayapura Papua (300 000).
inhabitants (63.6% rural), with a growth rate of 1.7% (FAO AQUASTAT
With very few exceptions the major cities, towns and villages are all
2003). By 2000, this had grown to more than 206 million, and by 2001
developed on rivers, with concomitant water-related issues of use and
to 209 million (World Bank 2003).
pollution. The rivers passing through the major cities and adjacent
Malaysia
Population
57a - Sunda
57b - Wallacea
density
57c - Sahul
Jakarta
(persons/km2)
Semarang I
n
d
o
n
e
s
i
a
Bandung
Surabaja
<1
East Timor
1-2
3-5
6-10
11-100
>100
©
GIWA©
2004
Figure 3
Population density in the Indonesian Seas region.
(Source: ORNL 2003)
20
GIWA REGIONAL ASSESSMENT 57 INDONESIAN SEAS
coastal waters are in most cases badly polluted by sewage, heavy metals
situation. Large gaps remain in reliable socio-economic data at the scale
and other industrial and agricultural waste products.
of the sub-systems. This is in part because of government restrictions
on data access, and in part because of the lack of accurate census
Some areas are also experiencing substantial immigration of the order
information from the widespread human populations.
of 4% annually through a transmigration project developed to ease
population pressures in Jawa. It is predicted that the population of the
Agriculture
region will reach 300 million by 2020 and double to 400 million by 2035
The agriculture sector provides employment for 49% of the population.
(UN 2002). Levels of literacy have been relatively stable over the past
In 1995, the total cultivated area was estimated to be 35 579 000 ha. Of
decade, at greater than 85%.
the cultivated area, 13 836 000 ha were under permanent crops such
as rubber, coconut, coff ee, cocoa and palm oil (Figure 4). Annual crops
Economic activities
such as rice, maize, soybean, sugar cane and tobacco were grown on
Indonesian Seas support a wide range of economic activities, from
21 743 000 ha. Farm-holdings in Indonesia are relatively small: 34%
subsistence agriculture and artisanal fi sheries to high technology
are less than 0.25 ha and a further 25% are between 0.25 and 0.5 ha.
industries (Table 2). The region has various forms of traditional land-
In total, value added to GDP from agriculture in Indonesia averaged
ownership customs and systems of natural resource use. Economic
approximately 16-17% from 1997 to 2001 (World Bank 2003).
development and a tremendous growth in population have taken
place in this coastal country. The climatic fl uctuations within the Asian-
Australian monsoon region have important implications for the society
and the economy. Indonesian waters play a major role, providing food
resources for millions of people, as well as a mode of transportation
and area of exploration and production of minerals and natural gas.
The coastline areas are sites for industrial and other economic activities.
Ports of importance are Ujung Pandang (Makassar), Kalianget, Surabaya,
Jakarta, Arjuna, Cirebon, Tegal and Semarang. Tourism is an important
economic activity.
Gross National Product (GNP) in 1997-1998 was estimated at 130.6 billion
USD, with a negative annual growth rate of -16.7%, and international
rank of 30th. Per capita GNP was 640 USD, with a negative growth of
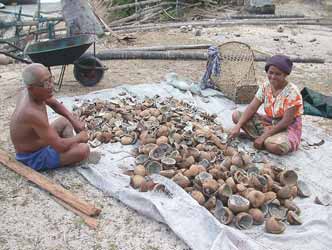
Figure 4
Locals processing copra, Anambas & Natuna
-18% and international rank of 198th (World Bank 2003).
Archipelago, Indonesia.
(Photo: J.L.N. Sivasothi, Reefbase)
Overall eff ects of globalisation in the region are not well understood,
but may be exacerbated over the next few years by the unstable global
Fishing
Subsistence farming and fi shing are the major activities of large
Table 2
Socio-economic indicators for Indonesia.
numbers of people outside the main urban centres. Most of the
Socio-economic indicator
1997
2000
2001
approximately 6
000 regional coastal communities are directly
Population
198 200 000
206 300 000
209 000 000
dependent on the sea as their primary source of both food and income
(Dahuri & Dutton 2000), with some 16.5 million fi shermen. Domestic
Illiteracy (%)
15.1
13.2
12.7
agricultural and artisanal fi sheries production (15.5 kg per person per
GDP (billion USD)
215.7
152.2
145.3
year) are very important, with increased fi sheries production required
GDP Growth
4.7
4.9
3.3
to meet the increase in domestic demand from the growing population
Value of GDP added in Agriculture (%)
16.1
17
16.4
(Talaue-McManus 2000). During the 1980s and 1990s, there were major
Value of GDP added in Industry (%)
44.3
47
46.5
increases in aquaculture (notably Tilapia in lakes and inland waters) and
Value of GDP added in Services (%)
39.6
35.9
37.1
mariculture (shrimps) in coastal ponds, to supply both domestic and
Value of GDP added in Exports (%)
27.9
42.4
41.1
international consumption, concomitant with major expansion in reef
Value of GDP added in Imports (%)
28.1
31.7
32.6
(Source: World Bank 2003)
fi sheries to supply the live fi sh trade to Hong Kong, China and Japan.
REGIONAL DEFINITION
21
At present, mariculture is largely dependent on wild stocks, although
and through the Jawa Sea to the east via the Arafura Sea. These
hatcheries are being developed. The estimated contribution of the
shipping routes all have associated risks of collisions and spills (Etkin
fi sheries sector to the national GDP is about 2%. However, a signifi cant
1997, MPP/EAS 1998).
proportion of total catch is illegal and unreported.
Secondary industries
Live reef fi sh export operations have increased since the 1980s. This has
These include natural resource processing and light manufacturing,
caused the loss of large numbers (thousands of tonnes) of demersal
and are also of growing importance, particularly in the major urban
coral reef fi shes from many reefs in Indonesia - even in remote areas.
centres of north Jawa. Service industries, including tourism, were
Poison fi shers mostly use two forms of cyanide (sodium and potassium
expanding during the 1990s and make a substantial contribution to
cyanide) but there have been recent shifts toward locally produced and
GDP, contributing between 37-40% of GDP from 1997-2001. Tourism,
inexpensive vegetable poisons (Johannes & Riepen 1995). Collecting
centred on Bali but with expansion during the 1980s and early to
of ornamental reef fi shes and other organisms for the global aquarium
mid-1990s throughout much of western and central Indonesia, has
market is also widespread and is expanding in the region. It has
increased annually. However, the Asian fi nancial crisis and growing civil
already caused serious damage to reefs in some areas, through use of
unrest, combined with the recent upsurge in international terrorism
destructive techniques of poison fi shing and/or coral breakage.
and concern over epidemic diseases (e.g. Severe Acute Respiratory
Syndrome, SARS), have caused a recent major decline in international
Forestry
tourism. This is expected to be exacerbated over the next few years by
Forestry is a major industry, particularly in Kalimantan, Sumatra and
the unstable global situation.
Papua, and less so in many other areas, where much of the harvestable
forests has already been exploited. Much of the land area of the region
Exports
was originally covered by diverse tropical forest. However, as noted
The major export earners include commercial exploitation of natural
above, substantial deforestation of dipterocarps and other commercial
resources; particularly mining (Papua, Kalimantan, Sulawesi, Sumatra,
timber species has taken place since the colonial era and continuing
Jawa Sea), forestry (mostly in Sumatra, Kalimantan, Papua), pelagic
logging is further reducing the original forest cover. Fertile lowlands
and demersal reef fi sheries, aquaculture and mariculture, oil palm and
and hill areas have been extensively developed for rice production,
other forms of plantation agriculture. Crop production and livestock
as paddy fi elds and upland terraces. Lowland areas and river fl ood
contribute approximately 18% of GDP (World Bank 2003).
plains also support mixed agriculture. In total, Indonesia has 1 million
km2 of forests remaining, and an annual deforestation rate of 1.2%
In 1992, exports yielded Indonesia a profi t of more than 1 billion USD,
(World Bank 2003).
accounting for about 2% of the global total. Imports at the time
accounted for some 60 million USD, less than 1% of the global total
Oil and mining
(Talaue-McManus 2000). In the mid-1990s, GDP for Indonesia as a whole
Oil production, mostly off shore in the Jawa Sea, supplies the large
was estimated at 160 billion USD, with a growth rate of approximately
domestic market and also provides export earnings. Indonesia is one of
79 million USD per year in 1995-1996, prior to the economic crisis of the
the world's major oil producers, with 1.36 million barrels per day in 1997
late 1990s. Output and consumption varies in relation to the degree of
from 8 535 wells and much if this is from Sunda (Edinger & Browne In
industrialisation. In 1995/1996, the percentage GDP industry growth rate
press in Hopley & Suharsono 2000). Another major producing area is off
was about 38% per year, compared with the agriculture growth rate of
the coast of East Kalimantan, particularly the Mahakam Delta. Bontang
13% per year, with a per capita GNP of about 1 000 USD per year (Talaue-
Bay in south Kalimantan is a major producer of liquifi ed natural gas.
McManus 2000). GDP and economic growth have been declining over
Mining for gold, copper, zinc and other minerals, notably in Papua and
the past several years (Table 2).
Sulawesi, is another major export earner.
Overall eff ects of globalisation in the region are not well understood,
Shipping
but may be exacerbated over the next few years by the unstable global
The northern Jawa Sea and Makassar Strait/Lombok Strait form part of
situation. Large gaps remain in reliable socio-economic data at the scale
major oil tanker routes (the Main route and ULCC route respectively)
of the sub-systems. This is in part because of government restrictions
between Japan and the greater Pacifi c Ocean and the Indian Ocean
on data access, and in part because of the lack of accurate census
and west Asia-Europe. Minor routes pass between Jawa and Sumatra
information from the widespread human populations.
22
GIWA REGIONAL ASSESSMENT 57 INDONESIAN SEAS
Governance
at present by insuffi
cient resources for management and enforcement
The Republic of Indonesia gained independence in 1948 and has been
of regulations. Many of the protected areas are not well managed,
governed since then from the capital city of Jakarta on Jawa. Indonesia
despite ongoing eff orts, and the ecosystems that sustain this rich
is a constitutional democracy, with the President elected for fi ve year
biodiversity are under severe threat in much of the region (e.g. Chia
terms. Indonesia has a three tiered system of government, with national
& Kirkman 2000).
(central), provincial and district levels. In addition, there are two further
levels, sub-district level and village level, which are not considered
However, several large government initiatives and smaller community-
autonomous because they do not have a local house of representatives.
based management programmes are helping to protect coastal and
The provincial district, sub-district and village levels are coordinated by
marine habitats. Several such projects have been implemented by the
the Ministry for Home Aff airs (Hopley & Suharsono 2000).
Indonesian Government since the 1990s, including the Marine and
Coastal Resources Management Project (MCREP) and the Coral Reef
Indonesia has undergone extensive political reform since 1997
Rehabilitation and Management Project (COREMAP) (see also Annex III).
and currently pursues a policy of decentralisation and regional
MCREP, a large coastal and marine management project focused on 15
autonomy. There is a growing trend for decentralisation of political
of Indonesia's provinces, has been operational since the early 1990s
and administrative activity, and after Jakarta much of the political life is
and is now in its second phase. COREMAP has also been operational
focused in the provinces, cities, towns and villages. For administrative
since the mid-1990s, the initial phase documenting reef resources and
purposes Indonesia is divided into 26 provinces. Overall planning
management capacities of reefs in 10 provinces, while latter phases are
and implementation of government policies follow fi ve year terms or
focusing on developing ecologically sustainable management, under
`Repelita' with Repelita VI covering the period 1994-999 and Repelita
international funding from the World Bank and Asian Development
VII from 2000-2004. These Repelita are in turn within a larger 25 year
Bank. Other projects are being coordinated by various NGOs including
development period `Pembangunan Jangka Panjang I' (PJP I), the fi rst
Worldwide Fund for Nature (WWF), The Nature Conservancy (TNC) and
phase of long-term development (FAO AQUASTAT 2003).
Conservation International.
Indonesia has sovereign rights to the 12 nautical mile limit and has also
International treaties and conventions
declared a 200 nautical mile Exclusive Economic Zone (EEZ). Several
With its neighbouring nations, Indonesia forms part of the Association
diff erent schemes and doctrines with diff erent geographic, political and
of South East Asian Nations (ASEAN), with strong multi-lateral links at
legislative relevance are considered in relation to Indonesia's area and
political and trade levels. As noted above, Indonesia is signatory to
waters including internal, archipelagic, territorial (12 mile limit), Exclusive
several international conventions and has enacted various national
Economic Zone (200 nautical mile limit), High Seas, continental shelf,
laws and regulations that are relevant to water-related issues in the
internal seas and seabed, and Contiguous zone.
region, including:
United Nations Convention on the Law of the Sea (UNCLOS);
The Indonesian Government has declared its commitment to sustainable
International Convention on the Protection of Pollution from Ships
development in the oceans by ratifying a number of conventions and
(MARPOL);
formulating programmes and projects that aim to defend and conserve
United Nations Convention on Conservation on Biological Diversity
the environment. Indonesia has gazetted 331 terrestrial protected areas
(CBD);
covering some 19 253 000 ha and representing some 10% of total land
Convention on International Trade in Endangered Species (CITES);
area of 1.9 million km2. Indonesia also has 102 gazetted marine protected
Ramsar
Wetlands
Convention;
areas (MPAs) e.g. Laut Banda, Bunaken and Taluk Cendraw, fi ve biosphere
United Nations Framework Convention on Climate Change
reserves (1 329 000 ha), three World Heritage sites (2 845 000 ha)
(UNFCCC);
and two wetlands of international importance (243 000 ha). Thus,
World
Heritage
Convention.
Indonesia has many legally designated protected areas including
coastal and marine habitats and has a target of developing a network
The relevant government departments have proposed policies or
of MPAs encompassing some 30 million ha. In total, there are estimates
legislation in relation to obligations under the various international
of between 34 and 50 protected areas in the region containing coral
conventions. However, it is apparent that, despite the international
reefs (Hopley & Suharsono 2000, Spalding et al. 2001), with a total area
ratifi cations of the conventions, there has been only modest progress
estimated at 4.6 million ha. The eff ectiveness of many MPAs is limited
to date in their eff ective implementation and the resolution of related
REGIONAL DEFINITION
23
problems. This has been attributed to the lack of action by diff erent
Conservation and Marine National Parks, Ministry of Marine Aff airs
government departments in addressing their obligations under the
and Fisheries;
conventions. A recently developed "Environmental Strategy for the Seas
The State Ministry for Environment;
of East Asia" provides many pertinent recommendations and solutions
Directorate General of Forest Protection and Nature Conservation,
to these problems (Chua pers. comm.).
under the Ministry of Forest and Crop Estates;
Research and Development Centre for Oceanology (Pusat Perelitian
Recently, Indonesia has taken steps at the community (local), provincial
dan Pengembangan Oseanologi, LIPI), Indonesian Institute of
and national levels, including implementation of legislation, to provide
Science;
a modern framework for sustainable resource management. Indonesia's
Universities
throughout
Indonesia;
Constitution provides the legal basis for development of legislature
United Nations - UNEP (Regional Seas and Regional Organization
relevant to use and management of water resources. The Constitution
for Asia and Pacifi c);
is expected to undergo major review in the near future.
IOC Sub-Commission for teh Western Pacifi c (IOC-WESTPAC);
GEF/UNDP/IMO Regional Programme on Partnerships in
Legislative instruments and integration
Environmental Management for the Seas of East Asia (PEMSEA);
At international and national levels, a raft of legislation addressing resource
World Wide Fund for Nature (WWF);
management and protection has been developed. However, there are
The
World
Conservation
Union
(IUCN);
ineffi
ciencies related to the transfer and application of international and
The
Nature
Conservancy
(TNC);
national legislation at provincial and local levels, with large inter-provincial
Conservation
International
(CI).
and local diff erences in effi
ciency and success of such application.
Legal and institutional framework regulating
Some national and provincial laws relevant to diff erent sectors such
biodiversity and the environment
as fi sheries, mining, forestry and environmental protection, are not
(also see Annexes III-V)
fully integrated, and have legislation that does not refer specifi cally to
The Ministry of Environment is the key national body for coordinating
particular sectoral or environmental systems, causing uncertainty in
sustainable development, with the National Clearing House on
application of legislative instruments. This has provided `loop-holes'
Biodiversity and a National Coordinating Body on Biodiversity being
for exploitation and caused confusion over which laws have priority,
established to supervise and plan activities relating to the conservation
which departments or agencies hold responsibilities for management,
and sustainable use of biodiversity. The Ministry of Forestry, specifi cally
and the rights of stakeholders and interest groups. Some government
its Directorate General for Forestry Protection and Nature Conservation
departments are hampered by a lack of qualifi ed and experienced
(formerly PHPA now PKA) and the Ministry of Agriculture also play
staff , and also by funding shortfalls and cutbacks. There is also a lack of
important roles in coastal environmental matters (Cheung et al. 2002).
awareness and acceptance of some laws among local populations, and
insuffi
cient capacity for dissemination of information and enforcement of
The Ministry of Marine Aff airs and Fisheries may in future prove to be
regulations and quotas. Thus, the lack of understanding and adherence
most relevant for coastal and marine environmental issues. There are
to laws and regulations among local communities is compounded by
two Directorates within the PKA, one dealing with Nature Conservation
insuffi
cient communication of information and the lack of surveillance
and one with National Parks and Recreation Forest. The Directorate for
and enforcement, which provides complex management challenges.
Nature Conservation provides overall planning of the terrestrial and
marine protected areas network, drafting of conservation legislation
These diffi
culties notwithstanding, there have been major advances
and the proposal, establishment and management of protected areas.
since the 1980s in regional capacity for development of policy and
The Directorate of National Parks and Recreation Forest oversees the
legislation based in sound science. This has relevance to international
development of the national parks programme. The regional planning
waters assessment and monitoring and implementation of measures
boards (BAPPEDA) work with the provincial offi
ces of PKA. In 1990, the
to promote sustainable development and conservation. For example,
"Conservation of Living Natural Resources and their Ecosystem Act"
a critical mass of regional expertise now resides in government, inter-
became the chief legislative tool for the management of protected
governmental agencies, academic institutions and NGOs, including:
areas. Based on this Act, the various MPAs fall under four categories
Directorate for Marine and Coastal Degradation Control,
corresponding with IUCN classifi cations (see Cheung et al. 2002 for
Environmental Impact Management Agency (Bappedal);
details).
24
GIWA REGIONAL ASSESSMENT 57 INDONESIAN SEAS
Other government departments and agencies concerned with marine
conservation and protected areas include the Ministry of State for
Population and Environment, through the Environmental Impact
Management Agency (BAPEDAL), the Department of Agriculture's
Directorate of Fisheries, the Department of Communications' Directorate
of Marine Communications and the Indonesian Institute of Science (LIPI).
The Bappedal coordinates coastal zone management and assesses
development projects through the Analysis of Environmental Impacts
(Amdal), while LIPI's Research and Development Centre for Oceanology
provides scientifi c advice to other agencies (Cheung et al. 2002).
Legal and institutional framework regulating
the water sector
The 1945 Constitution declared national water and land resources
to be controlled by the State and that they should be utilised in an
equitable manner for the benefi t of the people. The responsibilities for
the development and management of water resources and irrigation
schemes are specifi ed in laws, presidential instructions and government
regulations. The most important are:
Presidential Instruction No. 1 (1969), on the management of
irrigation water and maintenance of irrigation networks.
Law on water resources development No. 11 (1974).
Government regulations on:
- Benefi
ciaries
contribution
for
maintenance
cost
of
water
resources facilities No. 6 (1981);
-
Water management No. 6 (1982) ;
-
Irrigation, No. 23 (1982);
- Rivers
(1991);
- Swamps
(1991).
Decree of the Minister of Mining and Energy concerning
underground water resources management (1983).
Numerous institutions are presently involved in water resources
management. Their tasks and responsibilities are clearly stated in
national legislation:
The Ministry of Public Works, with its Directorate General of Water
Resources Development, is responsible for planning, design,
construction, equipment, operation and maintenance (O&M), and
guidance in water resources development.
The Ministry of Forestry is responsible for catchment area
development.
The
Ministry
of
Environment
is
responsible
for
environmental
quality development and management.
The Environmental Impact Management Agency is responsible for
environmental impact control.
REGIONAL DEFINITION
25
Assessment
This section presents the results of the assessment of the impacts of each of the fi ve predefi ned GIWA concerns i.e. Freshwater shortage,
Pollution, Habitat and community modifi cation, Overexploitation of fi sh and other living resources, Global change, and their constituent
issues and the priorities identifi ed during this process. The evaluation of severity of each issue adheres to a set of predefi ned criteria
as provided in the chapter describing the GIWA methodology. In this section, the scoring of GIWA concerns and issues is presented in
Table 3. Detailed scoring information is provided in Annex II of this report.
Table 3 Scoring
table
for Sunda,
Sunda
Wallacea
Sahul
Wallacea and
ts
ts
ts
Sahul sub-
ts
ts
ts
systems.
core**
core**
core**
ts
ts
ts
ts
ts
ts
vironmental
t
her community
v
erall S
vironmental
t
her community
v
erall S
vironmental
t
her community
v
erall S
En
impac
E
c
onomic impac
Health impac
O
impac
O
Priority***
En
impac
E
c
onomic impac
Health impac
O
impac
O
Priority***
En
impac
E
c
onomic impac
Health impac
O
impac
O
Priority***
Freshwater shortage
3*
3
3
3
2.8
2
2*
3
2
2
2.4
3
1*
1
1
1
1.0
4
Modification of stream flow
2
2
2
Pollution of existing supplies
3
2
1
Changes in the water table
3
3
1
Pollution
3*
3
3
3
3.0
1
1*
3
2
1
1.8
4
1*
1
1
1
1.3
3
Microbiological pollution
3
1
1
Eutrophication
2
1
0
Chemical
3
1
1
Suspended solids
3
2
1
Solid wastes
3
2
1
Thermal
1
0
0
Radionuclides
0
0
0
Spills
1
2
1
Habitat and community modification
3*
3
2
3
2.8
3
3*
3
2
3
2.6
1
2*
1
1
1
1.3
2
Loss of ecosystems
3
2
1
Modification of ecosystems
3
3
2
Unsustainable exploitation of fish
3*
3
2
3
2.6
4
3*
3
1
3
2.3
2
2*
2
1
3
2.1
1
Overexploitation
3
3
3
Excessive by-catch and discards
3
3
3
Destructive fishing practices
3
3
3
Decreased viability of stock
3
1
0
Impact on biological and genetic diversity
3
1
1
Global change
1*
1
0
1
1.1
5
1*
0
0
0
0.9
5
1*
0
0
1
0.9
5
Changes in hydrological cycle
2
2
2
Sea level change
1
1
0
Increased UV-B radiation
0
0
0
Changes in ocean CO source/sink function
0
0
0
2
Sea surface temperature
2
2
1
Assessment of GIWA concerns and issues according to scoring criteria (see Methodology chapter)
The arrow indicates the likely direction of future changes.
T
T
T
T
C
C
C
C
A 0
No known impacts
A 1
Slight impacts
A 2
Moderate impacts
A 3
Severe impacts
Increased impact
No changes
Decreased impact
IMP
IMP
IMP
IMP
* This value represents an average weighted score of the environmental issues associated to the concern. ** This value represents the overall score including environmental, socio-economic and likely
future impacts. *** Priority refers to the ranking of GIWA concerns.
26
GIWA REGIONAL ASSESSMENT 57 INDONESIAN SEAS
International waters in the sense of this analysis include all coastal
The results presented herein are supported wherever possible by
and marine waters in the Indonesian Seas region. These waters are
published data. However, for many of the issues and concerns raised
all potential sources or recipients of transboundary impacts, primarily
in this analysis, few if any publications exist, and of those, many are of a
from shipping, fi sheries, riverine discharges, and the transport of
confi dential nature, either by government or `commercial in confi dence'
pollutants via ocean currents. Several of East Kalimantan's rivers rise
and thus were unavailable for inclusion in this report. Furthermore, large
in the mountainous interior of Kalimantan, including Malaysian Sabah,
gaps in information remain, particularly at the sub-system level (Statistik
and cross the international boundary into Indonesia. Conversely,
Indonesia 1996), and thus the scores presented herein are the consensus
pollution and other impacts arising in the Indonesian Seas may be
view of the Task team, derived during three workshops and subsequent
transported to the waters of adjacent nations. Of particular concern in
discussions.
this regard are detrimental eff ects on the population viability of target
marine species, the planktonic larvae of which may be dispersed in the
Indonesian Through-fl ow and other currents into international waters,
replenishing populations further a fi eld.
Freshwater shortage
T
T
T
C
C
C
A
A
A
IMP
Sunda
IMP
Wallacea
IMP
Sahul
A wide range of coastal and near-shore ecosystems exist in Indonesia
with three; coral reefs, mangroves and seagrass beds, having particularly
In Indonesia in 1990, water withdrawals were 69.2 kmł for agriculture,
signifi cant transboundary importance (Hopley pers. comm.). Each has
4.7 kmł for domestic and municipal water supply and 0.38 kmł for
an international importance because of its biodiversity. Additionally,
industrial use. As the nation has started to implement development
each provides an important habitat and breeding ground for many fi sh
programmes in order to meet the sharply increasing needs for irrigation,
species (which also reach their maximum biodiversity in Indonesian
safe drinking water, industrial water, energy, and other uses, the demand
waters) including pelagic species (for example, see Jeyaseelan 1998).
on water resources has increased rapidly. It is estimated that from 1990
All these environments are also visited by other wide-ranging marine
to 2020 the demand will increase by about 220%. More than 50% of
species including turtles and marine mammals. Continental shelf
all irrigation water is consumed in Jawa. By 2002, overall consumption
environments may also be highly complex, and have considerable
of freshwater in Indonesia was even more strongly dominated by the
transboundary importance. Ecosystems include deepwater coral
agricultural sector, which uses some 98% of water resources. Potable
communities and algal (mainly Halimeda sp.) banks for which Indonesia
water supplied by the regional Drinking Water Company provides water
is well known (Phipps & Roberts 1988, Roberts et al. 1987, Sydow 1996
for some 20% of the more than 200 million Indonesians (UN 2002).
in Hopley & Suharsono 2000).
In 1995, Indonesia had 82 large dams with capacities exceeding
Another important transboundary consideration is the distribution and
15.8 kmł and an additional 638 reservoirs, 10 770 weirs, 1 017 barrages,
exploitation of off shore oil and gas, with signifi cant oil and gas fi elds in
1 192 pumping stations; and 6 792 intakes were used to supply water
the Jawa Sea, off the Mahakam Delta and at Bontang Bay in Kalimantan.
to an area of 4.6 million ha. Moreover, irrigation from groundwater
There are also extensive oil and gas reserves in the Timor Sea, although
reportedly covered an area of 44 209 ha (FAO AQUASTAT 2003). Total
these are partly outside the boundaries of this GIWA region. The
groundwater resources are estimated at 455 kmł per year, although
1989 Timor Gap Treaty with Australia and the more recent 1997 Perth
most (an estimated 90%) return as base fl ow to the rivers. The
Treaty have not fully settled all political issues related to resource
groundwater potential in Indonesia is limited and can meet only part
development of this area of shelf and the more recent independence
of the urban and rural needs for water supply, while providing irrigation
of East Timor has created further uncertainties (Sitepu 1999 in Hopley
water for very limited areas in the eastern parts of Indonesia (Wallacea
& Suharsono 2000, Herriman & Tsamenyi 1999) (also see GIWA regional
and Sahul). In some places, overexploitation of groundwater has led to
assessment 58 North Australian Shelf).
intrusion of saline water.
A fi nal important transboundary implication for international waters is
Of the more than 500 river basins in the region, many have been
the major role played by Indonesian Seas as a heat engine for global
extensively modifi ed, primarily through loss of riparian vegetation, major
climate and their pivotal role (with nearby areas) in ENSO events, both
clearing of catchments, with resulting loss of soils as sedimentation into
of which hold particular signifi cance for global climate change.
rivers and streams (also see Pollution, suspended solids and Habitat
and community modifi cation). All river systems supporting major urban
ASSESSMENT
27
developments have been seriously polluted by industrial and sewage
Sahul
wastes (FAO AQUASTAT 2003).
Pollution of existing supplies by mining wastes has caused slight
environmental impacts resulting in occasional fi sh kills. Wastewater
Modification of stream flow
is discharged into rivers and streams virtually without any treatment,
Sunda, Wallacea and Sahul
causing rapid deterioration in the water quiality (FAO AQUASTAT
Modifi cation of stream fl ow was assessed as having severe impacts
2003).
in the Sunda sub-system and moderate in Wallacea and Sahul. There
are however severe local eff ects in the major urban areas of Jawa
Changes in the water table
(particularly the north coast) (Douglas 1978), and agricultural/forestry
Sunda and Wallacea
areas of Jawa, Sumatra and South and East Kalimantan, where major
Changes in the water table has caused moderate to severe impact
loss of riparian vegetation and deltaic wetlands has occurred through
in the sub-systems, where many aquifers are suff ering widespread
eff ects of logging (also see Douglas & Spencer 1985). The high rates of
salinisation and pollution, and wells have been deepened due to
sediment transport in streams and rivers has caused signifi cant changes
lowering of water tables (e.g. wells that were originally 20 m deep
to stream fl ow and increases in fl ood plains and river deltas, some of
are 35 m deep in 2001). Hotspots include the north coast of Jawa,
which are prograding rapidly, notably on north coast of Jawa (e.g. Solo
particularly the major urban centres of Jakarta, Semarang and Surabaya
River prograding at more than 70 m per year) (Spalding et al. 2001). In
where increasing populations are placing increasing pressures on
Wallacea, the urban centres and agricultural areas of south Sulawesi,
groundwater resources.
Bali, Lombok, Sumbawa and the many "dry islands" are particularly
susceptible to alterations to stream fl ow. In Sahul, impacts are less
Overexploitation of groundwater has led to critical problems in for
widespread, being focused around Jayapura (Irian Jaya) and in areas
example in Jakarta where the total groundwater abstraction in 1993
aff ected by stream alterations of mining.
was 32.6 million mł. Groundwater abstraction has caused saline
groundwater to reach about 10 km inland from the coastline and led
Pollution of existing supplies
to land subsidence at a rate of 2 to 34 cm per year in east Jakarta.
Sunda
According to the GIWA Experts, pollution of existing supplies is severe
The supply of groundwater is limited and can meet only part of the
in the sub-system, both to surface and groundwater supplies. Most
urban and rural needs for water, while providing irrigation water for
human settlements are concentrated on rivers and streams and
very limited areas in the eastern part of Indonesia. In some places,
chemicals from agriculture, industry, aquaculture and domestic sewage
overexploitation of groundwater has led to critical problems. In
have caused severe and widespread pollution. Municipal and industrial
Wallacea, the "dry islands" of East Nusa Tenggara are worst aff ected,
wastewater is discharged virtually untreated into the waterways causing
where 70% of the groundwater aquifer supply is used, wells have been
rapid deterioration in the quality of river water (FAO AQUASTAT 2003).
deepened and there is widespread salinisation. Hotspots include East
Hotspots include the Siburik, Lahat, Japat and Kali Mas rivers, with
Nusa Tenggara, Taka Bone Rate, the Togian Islands and Tukang Besi
severe oxygen depletion and fi sh kills. In these areas, many people are
Islands. Wells have been deepened hundreds of km2 in these areas.
getting water from sources contaminated by human, agricultural and
industrial wastes, and surface water does not meet WHO drinking water
Sahul
criteria because of human inputs resulting in water of poor quality.
Changes in the water table have caused only slight environmental
impacts and have been concentrated in the major urban area of
Wallacea
Jayapura.
Pollution of existing supplies in Wallacea has experienced moderate
environmental impact, but with highly localised severe damage
Socio-economic impacts
around Makassar and Ambon, East Nusa Tenggara and Kupang (Timor).
Sunda and Wallacea
According to the GIWA Experts, there have been fi sh kills from various
The impacts of freshwater shortage on economic, health and other
chemical inputs, notably from agricultural chemicals and increases
social and community impacts were considered moderate to severe in
in nutrient loads from aquaculture activities, with likely increases in
the Sunda and Wallacea sub-systems. Major socio-economic impacts
other inputs. Some surface water does not meet WHO drinking water
are concentrated in Jawa and Sumatra, particularly the larger urban
criteria.
centres. For millions of people there is little access to potable water
28
GIWA REGIONAL ASSESSMENT 57 INDONESIAN SEAS
either in wells or through piped supply. Even in some areas with
next 20 years. As noted above, major forcing factors include widespread
reticulated water, there are regular or episodic interruptions to supply.
increases in human populations, and the compounding problems of
poor water supply and contamination. Despite the best eff orts of
Freshwater shortage is already a food security concern, and although
government and NGOs, a continuing lack of eff ective enforcement
water resources are abundant, the seasonal and spatial variation in
of regulations and little environmental control will contribute to the
the rainfall pattern and lack of adequate storage create competition
expected deterioration in economic aspects of freshwater shortage.
and confl icts among users. In Wallacea, freshwater shortage is a food
security concern in many of the semi-arid areas, notably of East Nusa
Parts of Wallacea have a natural vulnerability to freshwater shortage,
Tenggara. Additional economic impacts accrue from costs in supplying
being semi-arid. This natural vulnerability is being exacerbated by
irrigation (FAO AQUASTAT 2003).
impacts from the increasing human populations. The environmental
situation is expected to deteriorate further, remaining moderate. From
Socio-economic impacts and threats in large areas of Sunda and Wallacea
the socio-economic perspective, impacts to health and other social
remain unquantifi ed at the sub-system scale but clearly include loss/
and community aspects are expected to remain moderate, being
interruptions to human drinking water supplies, changes in traditional
managed through intervention, although the economic situation is
use, losses of agricultural uses such as crops, livestock, aquaculture
expected to deteriorate further and will continue to be severe over the
and also reacreational use. Impacts also include increased potential for
next 20 years. Major forcing factors include the widespread increases in
upstream/downstream confl icts or confl icts among urban and squatter
human populations, and the compounding problems of natural, semi-
groups, increased costs of alternative water supplies, loss of waste
arid conditions, poor water supply and contamination.
assimilative capacity, reduction in future use options as well as human
health impacts. Other socio-economic impacts in the sub-systems
In Sahul, freshwater shortage has caused only minor environmental
include reduced agricultural production and reduced availability of fi sh
impacts mainly to urban areas and mining sites. The environmental
as food, increased intake treatment costs, increased damage to water-
situation is expected to deteriorate but will remain slight. From
related equipment, increased costs of deepening wells and pumping,
the socio-economic perspective, impacts to the economy are also
damage to infrastructure, and population migration and transboundary
expected to deteriorate, while health and other social and community
implications (see also FAO 1992, FAO/UNDP/UNEP 1994, ESCAP 1995).
aspects are likely to be little changed.
Sahul
Remedial interventions
Socio-economic impacts of feshwater shortage in the Sahul sub-system
In 1990, just 35% of Indonesia's urban population and 33% of the
were considered slight and most of the socio-economic impacts are
rural population had access to reliable water supply. It is estimated
concentrated in the major urban centre of Jayapura.
that between 1990 and 2020, the demand will increase by about
220% (FAO AQUASTAT 2003). The Ministry of Public Works through its
Conclusions and future outlook
Directorate General of Water Resources Development (DGWRD) has
The environmental and socio-economic impacts of freshwater shortage
identifi ed four main missions in water resources sector programming
in the Indonesian Seas region range from slight to severe, with Sunda
as part of Repelita VI, namely: (i) maintanance of self-suffi
ciency in rice
being worst aff ected. The environmental and economic impacts are
production to achieve long-term food security; (ii) provision of water to
expected to worsen in all three sub-systems in the future, whereas
meet increasing water supply demands; (iii) fl ood alleviation and river
health and other social and community aspects are expected to remain
management; and (iv) water resources development, conservation and
as they are, or show some improvement.
management (DGWRD 1993a-c, 1995a-b, 1996).
In Sunda, freshwater shortage has caused severe environmental impact,
The four missions directed by the DGWRD are being implemented
with little access to potable water among poor urban populations in
through several major and support programmes. The water resources
much of the sub-system. The environmental situation is expected to
sector now has two major sub-sectors:
deteriorate further, remaining severe in the future. By contrast, impacts
Water resources development, with three major programmes:
to health and other social and community aspects are expected to be
- Water resources development and conservation;
ameliorated through intervention, improving from severe to moderate,
- Supply and management of water;
although the economic situation is expected to remain severe over the
- Management of rivers, lakes and other water resources.
ASSESSMENT
29
Irrigation, with two major programmes:
attempts to achieve improved management of water resources have
- Development and management of irrigation networks;
focused on enhancing the effi
ciency of water use, improving the
- Development and management of swamp areas.
quality of water resources, balancing water source availability and
developing an integrated water resource management programme
Major forcing factors on freshwater shortage include widespread
(UN 2002).
increases in human populations; with a doubling expected by 2035,
which is compounded by problems caused by poor water supply and
Nevertheless, despite the best eff orts of government (as outlined
contamination. Deforestation, which is driven by signifi cant foreign
above) and NGOs, a continuing lack of eff ective regulation and
investment in the forestry sector, the use and market for the timbers
little environmental control is expected to contribute to the further
and other social causes such as Indonesia's transmigration programme,
deterioration in socio-economic aspects of freshwater shortage. With
is another major contributor. Deforestation in Indonesia as a whole is
the sharply increasing needs for irrigation, safe drinking water, industrial
estimated at approximately 1.6 million ha annually (UN 2002).
water, energy, and other uses, the demand on water resources has
increased rapidly.
By 2015, water use is predicted to grow by some 7% for irrigation,
7% for domestic needs and 13% for industry (UN 2002). Increasing
water consumption, combined with the decreasing quantity and
quality of water resources, has already created water scarcity issues.
Pollution
The government aims to mitigate these issues in three ways (also see
T
T
T
C
C
C
A
A
A
IMP
Sunda
IMP
Wallacea
IMP
Sahul
Jezeph 1992, Soenarno 1995), by:
Reducing pollution from industries;
Not much is known about the status of the region in regards to
Conserving water resources;
pollution. Urban expansion and industrialisation have resulted in water
Rehabilitating the physical conditions of rivers.
pollution from industrial wastes, sewage problems, and air pollution. Oil
spills, slowly degrading toxic wastes from chemical and non-chemical
Recent legislation on freshwater use include Ministerial Decree
industries, agricultural run-off and the dumping of materials such
No. 20/2001 dealing with the rehabilitation of forest and land as issued
as metals threaten inland and coastal waters. Toxic materials settle
by the Ministry of Forestry, Government Regulation No. 82/2001 dealing
into seafl oor sediments where they accumulate as hazards to living
with Water Quality Management and Water Pollution Control and
organisms that feed on bottom mud. Long-lasting chemicals may enter
ratifi cation of the Ramsar Convention through Regulation No. 27/1991
the food web and contaminate fi sh and shellfi sh. There are threats to
(also see Annexes III-V).
the reefs and mangroves (LME 2003).
Three government agencies are responsible for research on these and
Specifi c catchment and riverine eff ects of pollution are in direct relation
other issues relating to water conservation; the Agency for Assessment
to (FAO AQUASTAT 2003, Hopley pers. comm.):
and Application of Technology; the Agency for Irrigation Research
Flow rates and natural sedimentation levels;
and Development; and the Ministry of Settlement and Regional
Channel capacity and modifi cation in relation to changing
Infrastructure. Government partner institutions and collaborating
catchment conditions including deforestation, mining and release
international organisations also include: the Ministry of Energy and
of tailings, dams and other structures;
Mineral Resources; the Ministry of Foreign Aff airs, the World Bank; the
Water quality including nutrients and human health
Asian Development Bank; and the German Gesellschaft fur Technische
considerations;
Zusammenarbeit.
Use and status of groundwater resources including land subsidence
(after groundwater pumping) and saltwater intrusion.
In developing its water resources further, greater integration among
all government departments and agencies is crucially important, in
Municipal and industrial wastewater is discharged virtually untreated
order to ensure that decisions regarding water resources (e.g. increased
into the waterways causing rapid deterioration of the water quality in
irrigation and conversion of swampland) are managed to minimise
the region (FAO AQUASTAT 2003). Industrial forms of water pollution
adverse impacts on other aspects of international waters (e.g. habitat
are concentrated in the major urban centres, primarily the large cities of
loss and modifi cation) (also see Jezeph 1992, Soenarno 1995). Recent
northern Jawa (e.g. Jakarta, Suribaya, Semarang, Bandung), and capital
30
GIWA REGIONAL ASSESSMENT 57 INDONESIAN SEAS
cities of Sulawesi (Makassar), Sumatra (Medan), and Kalimantan (e.g.
Wallacea and Sahul
Balikpapan). Sewage treatment is superfi cial at best, with raw and/or
The environmental impacts of microbiological pollution are slight
primary treated sewage is discharged directly into watercourses from
overall, with moderate impacts localised around Makassar and the other
most towns and cities. Agricultural pollution is also widespread, through
major urban centres (e.g. Denpasar, Bali and Jayapura, Papua). There
leaching of fertilisers and pesticides into watercourses, massive loss of
it is a locally signifi cant problem stemming from inadequate sewage
soils following land clearing and forestry and increasing aquaculture
disposal and treatment in virtually all towns and cities. As with Sunda,
activities.
there is little or no sewage treatment for much of the sub-system. In
the urban areas, elevated levels of faecal coliform contamination and
Total emissions of organic water pollution have experienced a rapid
incidences of bacterial-related gastro-enteric disorders have occurred
increase from some 214 tonnes per day in 1980 to more than 537 tonnes
in fi sheries product consumers, but with no fi sheries closures or
per day in 1993. The food sector is the major industrial contributor (59%).
advisories.
Municipal and industrial wastewater is discharged virtually untreated
into the waterways causing rapid deterioration in quality of river water
Eutrophication
(FAO AQUASTAT 2003).
Sunda
The overall environmental impacts of eutrophication in Sunda are
Environmental impacts from thermal pollution in Indonesia are slight
moderate, but with severe impacts locally, particularly in enclosed
to negligible, being notable only in the immediate vicinity of the few
bays, harbours and lagoons with limited water circulation, and where
power plants where ocean discharge of cooling waters occurs (e.g.
sewage, agricultural and/or industrial discharges are present. This is
north Jawa). For example, hot water discharges from the Botang plant
most common along the north coast of Jawa, notably in Jakarta Bay and
have killed corals on adjacent fringing reefs (Edinger & Browne in press
the river deltas. In Jakarta Bay, massive blooms of phytoplankton several
in Hopley & Suharsono 2000). There are no known eff ects beyond the
metres thick are present for several kilometres off shore, moderating
mixing zone and no signifi cant interference with migration patterns.
slowly with increasing distance away from Jakarta (Brown 1986). There
There are no known environmental impacts from radionuclides, with
is some use of fertilisers, particularly in plantation agriculture, although
no nuclear power plants in the region, although there may be some
by world standards pesticide and fertiliser use are low.
episodic discharge from nuclear powered ships navigating through
the area.
Iron fertilisation by the Indonesian wildfi res resulting from the
1997 Indian Ocean Dipole was considered suffi
cient to produce an
Microbiological pollution
extraordinary red tide causing extensive reef death in the islands off
Sunda
Eastern Sumatra (Abram et al. 2003), highlighting the relation between
The environmental impacts of microbiological pollution in Sunda
climate, wildfi res and impacts to coastal marine ecosystems.
are severe in most of the major urban areas and along major rivers in
Jawa and Sumatra, while fi sheries in parts of the Jawa Sea have also
Wallacea
been aff ected. Microbiological pollution is a signifi cant problem from
Eutrophication in Wallacea has only slight environmental impact,
inadequate sewage disposal and treatment. There is only rudimentary
concentrated around the major urban centre of Makassar. There have
sewage treatment for much of the sub-system, where most sewage is
been some episodic fi sh kills, notably in south Bali and Lombok Strait
discharged without treatment or treated only by settlement, and most
in December 1997, but these remain anomalies rather than regular or
primary treatment consists of screening, particularly in the urban areas.
widespread events.
Most streams and rivers fl owing through urban centres (e.g. Jakarta,
Surabaya) have highly elevated levels of faecal coliform contamination
Sahul
and there has been a major increase in incidence of bacterial-related
There are no known environmental impacts of eutrophication in Sahul
gastro-enteric disorders in fi sheries product consumers, but no fi sheries
at present.
closures or advisories. Blooms of toxic dinofl agellates (Maclean 1989)
have caused paralytic shellfi sh poisoning and shellfi sh from most of the
Chemical pollution
Jawa Sea are no longer eaten. By contrast, rural areas of Sumatra and
Sunda
Kalimantan have lower impacts.
Chemical pollution has had moderate to severe environmental impact
in Sunda at present, being a signifi cant problem in the rivers of north
ASSESSMENT
31
Jawa and urban areas of Jakarta, Bandung, Semarang, Surabaya and
Suspended solids
Padang in Sumatra. Water contamination occurs from agricultural
There is a well-demonstrated correlation between catchment size and
pesticides and from manufacturing, metal fabrication, ship repair and
erosion rate and the generally small size of Indonesian catchments
agricultural and food processing industries (oil milling, sugar refi ning
automatically produces a high sediment yield (Hopley pers. comm.).
and meat and fi sh processing) and from mining, with contaminant
This is exacerbated by deforestation which, for Indonesia as a whole, is
loads concentrated near the discharges. Releases of chemical and
estimated at approximately 1.6 million ha annually (UN 2002), caused
other forms of pollution from shipping in harbours are common, as
largely by forest concessionaires, forest fi res, illegal logging, lack of
regulations and controls relating to ship-derived pollution are rarely
law enforcement, mining, and transmigration and is driven by market
enforced. Pollution on coral reefs has been identifi ed in bio-indicator
demand. Details of government eff orts at ameliorative interventions
studies using stomatopod crustaceans (Erdmann & Caldwell 1997).
for deforestation are provided in Remedial interventions section below.
Figure 5 shows reefs at risk due to sedimentation in the Indonesian
Wallacea and Sahul
Seas region.
Chemical pollution has had only minor environmental impact at
present, being a signifi cant problem only around Makassar, and in
Sunda
Jayapura, and in mining-aff ected streams and coastal waters, with
Environmental impacts from suspended solids are severe in streams,
contaminant loads concentrated near the discharges. For example, the
rivers and coastal waters throughout most of Sunda, particularly in
Minahasa mine on North Sulawesi discharges tailings into Buyat Bay
north Jawa and Sumatra, with major increased turbidity over wide
just 80 m below sea level. Since it opened in 1996, people living around
areas and changes in biodiversity due to excessive sedimentation. This
the bay have complained about mud and dead fi sh being washed up
has mostly resulted from sediment transport in streams and rivers to
along the shoreline, empty fi shing nets, and skin rashes among people
coastal waters following extensive deforestation in many watersheds,
exposed to the seawater. Toxicologist Rizal Rompas of Sam Ratulangi
compounded by high rates of erosion, and siltation rates among the
University in Manado, Sulawesi, found heavy-metal contamination in
highest on Earth (Hodgson & Dixon 1992).
fi sh and plankton. He blamed the mine discharges and warned that,
contrary to the mine operator's claims, toxic tailings were returning to
Most large-scale forestry by both national and international
the surface (Pearce 2000). The nickel mine on Gebe Island, Sahul, also
commercial operators is focused in Kalimantan and Sumatra. In
loses tailings and ore into coastal waters, producing locally signifi cant
Borneo overall, more than half the original forest remained in the
impacts (Done et al. 1997).
mid-1990s, although lowland forests are under particular threat from
logging, and also from drought and fi re (e.g. the 1997 ENSO event)
(Kartawinata, pers. comm., Daws & Fujita 1999) (Figure 6). Major ENSO-
Malaysia
57a - Sunda
57b - Wallacea
57c - Sahul
I
n
d
o
n
e
s
i
a
East Timor
Estimated
threat level
High
Medium
Low
0
500 Kilometres
©
GIWA©
2004
Figure 5
Reefs at risk due to sedimentation.
(Source: Burke et al. 2002)
32
GIWA REGIONAL ASSESSMENT 57 INDONESIAN SEAS
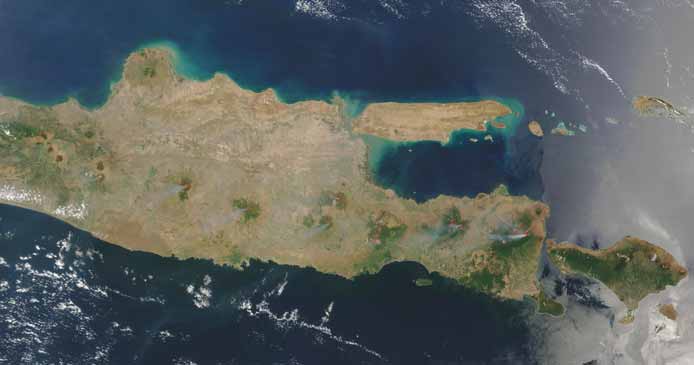
Figure 6
Deforestation, Jawa, from October 19, 2002.
Islands of forest appear green against the paler landscape. In nearly every patch active fires can be seen (red dots).
(Photo: NASA)
related droughts and fi res in the 1990s contributed to loss of ground
Quantitative data of sediment loss for most Indonesian rivers are not
cover, sediment mobilisation and loss.
generally available. As noted earlier, the Mahakam River, which drains
about one third of East Kalimantan, is very turbid with suspended
In Sumatra and Kalimantan, large areas of forest have already been
particulate matter (SPM) concentrations reaching 80 mg/l. The river
logged and other areas have been assigned for logging, contributing to
has a potential to discharge from 4 million tonnes (Dutrieux 1991) up
the severe soil erosion. This is of particular concern given that the timber
to 10 million tonnes sediments per year (Eisma et al. 1989 in Hopley &
industry in Indonesia, as well as other areas of South East Asia, has
Suharsono 2000). Fluvial sediments extend up to 50 km off shore and the
traditionally suff ered from mismanagement and corruption, although
Mahakam River plume can extend up to 400 km to the southeast and
there have been recent improvements. Nonetheless, implementation
is considered by Tomascik et al. (1997) to be responsible for the general
of "best-practice" forestry management (Ascher 1993), such as the
lack of coral reefs along a large part of the East Kalimantan coastline.
retention of buff er zones along watercourses, is rarely enforced
These fi gures are almost certainly enhanced by land degradation
and violations are common. Large-scale sediment mobilisation
within the Mahakam River Basin, especially as the soils developed on
from unregulated forestry and agriculture has already impacted on
the Tertiary sedimentary rocks are highly erodable (Hopley 1999a).
water quality of streams and rivers and ultimately on estuarine and
coastal habitats e.g. fringing reefs (Edinger et al. 1998) (Figure 5) and
Wallacea
processes in parts of the region (e.g. East Kalimantan, north coast of
Environmental impacts from suspended solids are moderate in streams,
Jawa). For example, rates of progradation of the Solo River Delta are
rivers and coastal waters throughout most of Wallacea, particularly in
of the order of 70 m per year (Spalding et al. 2001), partly the result of
Sulawesi and western Lombok. Close to the major urban centres, such as
natural processes but with a contribution from human impacts in the
Makassar, the aff ected zone extends up to 50 km from the city (Hopley &
catchment. In the Jawa Sea, enormous quantities of sediment are lost
Suharsono 2000). Industrial mining is a major contributing factor. Mega-
to coastal waters annually (Edinger et al. 1998), carrying high loads of
mines across the sub-system are already adding prodigious volumes of
particle-bound nutrients. This has, in turn, contributed to massive levels
ground-up rock to the bays. The biggest and newest is the Batu Hijau
of eutrophication (e.g. Jakarta Bay, see Eutrophication).
copper and gold mine, opened last year on Sumbawa. It will discharge
more than 1 billion tonnes of tailings over the next decade or so into
ASSESSMENT
33
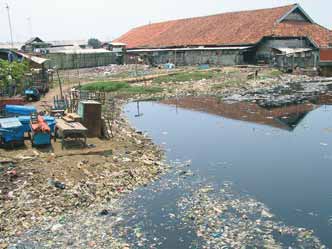
the local bay. No mine in Indonesia has ever dumped so much over so
production (Figure 7). Massive amounts of plastic bags and other waste
wide an area (Pearce 2000).
products fl ow into Jakarta Bay and foul the Pulau Seribu islands (see e.g.
report by Willoughby et al. in Brown 1986).
In the more heavily settled areas, a doubling or more of sediment yield
and an increase in run-off as vegetation has been cleared is possible.
Wallacea and Sahul
Pollnac et al. (1997 in Hopley & Suharsono 2000) report sediments
Environmental impacts from solid wastes have had severe impact
from the Tondano River, North Sulawesi, aff ecting the nearby Molas
locally, particularly around major cities, towns and villages, but have
coast and spreading towards the Bunaken National Park situated in the
caused slight (Sahul) to moderate (Wallacea) environmental impact
neighbouring GIWA region Sulu-Celebes Sea. In a quantitative study
overall. Plastic and other fl oating wastes wash ashore on many beaches
of fi ve coral reefs (in Jawa and Eastern Indonesia), Edinger et al. (1998)
and clog outboard motors of boats.
showed that a variety of land-based pollutants caused reductions in
coral diversity of about 30 - 60%, with greater impacts where the reefs
Spills
were subjected to combined sewage and sedimentation (Figure 5)
Sunda
(Hopley & Suharsono 2000).
Environmental impacts from spills in Sunda are moderate, with
widespread contamination by hazardous or other materials from
Sahul
shipping and oil exploration and transport in the Jawa Sea, and
Environmental impacts from suspended solids are minor throughout
industrial discharges into rivers and streams. Jawa Sea forms part of both
most of Sahul, with some erosion from forestry concessions and mining.
the main and ULCC oil tanker routes between the Indian and Pacifi c
Here also, mines (e.g. nickel mine on Gebe Island) lose signifi cant
Oceans, with regular discharge of ship ballast waters. International trade
quantities of ore to the sea during loading or from tailings disposal, but
is expected to triple by 2020, and much of this trade will be transported
usually with highly restricted spatial impact (Done et al. 1997). Future
by sea (Chua pers. comm.). Increased tanker traffi
c has the potential
plans for sub-marine tailings disposal in developing mines are the
for damaging spills to oceanic and coastal habitats, mangroves and
subject of considerable controversy in relation to their likely impacts
coral reefs. Indonesia has yet to ratify the International Convention
from suspended solids and chemical pollution (Pearce 2000, Kahn
on Prevention of Marine Pollution from Ships (MARPOL), and there is
pers. comm.).
an urgent need for developing oil spill contingency planning. Little
spill control equipment is in place and implementation of emergency
Solid wastes
procedures is not well developed.
Sunda
Environmental impacts from solid wastes in the Sunda sub-system
There is chronic pollution from production facilities and oil refi neries in
are severe, particularly in the Jawa Sea and around the cities, towns
Sunda. Blowouts have occurred at off shore platforms near Balikpapan
and villages where waste management is unable to keep pace with
in East Kalimantan. Most production is exported and tanker traffi
c is
concentrated in three major shipping lanes: Malacca Strait, Makassar
Strait and Lombok Strait. Between 1974 and 1994, 36 major tanker spills
were reported in Indonesian waters, 66% of which were in the Malacca
Strait (Hopley & Suharsono 2000).
Wallacea and Sahul
Environmental impacts from spills are slight overall, but with moderate
impact in some areas, where spills have occurred during tanker delivery
to urban centres (e.g. Makassar). Ships discharge ballast waters near
Take Bone Rate and there are tar balls from ballast in Lombok Strait and
Makassar Strait, forming part of the ULCC oil tanker route between the
Indian and Pacifi c Oceans. These impacts notwithstanding, spills occurring
in Wallacea and Sahul are much fewer than those in Sunda. Edinger and
Browne (in press in Hopley & Suharsono 2000) believe that the ability of the
Figure 7
Waste in a local canal, Jakarta, Indonesia.
(Photo: J. Oliver, Reefbase)
Indonesian network to respond to a major spill has not yet been tested.
34
GIWA REGIONAL ASSESSMENT 57 INDONESIAN SEAS
As with Sunda, there is an urgent need for developing oil spill
virtually all populated and/or highly industrialised areas of Indonesia
contingency planning. Little spill control equipment is in place and
(Dahuri 1999, Hopley & Suharsono 2000). Point sources include rivers
implementation of emergency procedures is not well developed. In
and discharge pipes, with more widespread pollution from groundwater
Sahul, spills of hazardous materials, mostly associated with mining
seepage. No sewage treatment plant is available for any major coastal
and off shore shipping, have only small-scale adverse eff ects with no
city in Indonesia (Edinger et al. 1998), and the problem is aggravated by
signifi cant avian mortality.
recent increased intensity of rice cultivation and application of chemical
fertilisers (Ministry for Environment/UNDP 1997 in Hopley & Suharsono
Socio-economic impacts
2000). Continuing deforestation, at the rate of some 1.6 million ha
Sunda
annually is a major contributor to suspended solids in watercourses.
The economic, health and other social and community impacts of
Coral reefs throughout the region are also at signifi cant risk (Figure 8),
pollution are severe for the Sunda sub-system. Most socio-economic
with major future socio-economic implications (see Habitat and
impacts are concentrated in and around the major urban centres,
community modifi cation and Unsustainable exploitation of fi sh and
coastal villages and Jawa Sea. Indeed, Jawa is the top source of
other living resources below).
domestic, agricultural and industrial pollution in Indonesia. The key
impacts and threats, focused in Jawa and the Jawa Sea, are mostly
In Sunda, present levels of environmental impact from pollution as
unquantifi ed at the sub-system scale, but include, according to the
a whole are severe, particularly for microbiological pollution (mostly
GIWA Experts, impacts such as increased risks to human health, and
sewage and agriculture), chemical pollution (industrial and agricultural
increased costs of human health protection, including preventive
inputs), suspended solids (deforestation and erosion) and solid wastes.
medicine and medical treatment as well as loss of water supplies (e.g.
Environmental impacts from pollution in streams and rivers, the inter-
potable water) and increased costs of water treatment. There has also
tidal zone, and waters of the Jawa Sea are likely to deteriorate further,
been losses of tourism, recreational or aesthetic values, and also in
with overall impact remaining severe. This is primarily because of the
fi sheries, including negative eff ects on subsistence artisanal fi sheries
predicted major increases in population, in the major sectors of forestry,
and aquaculture; together with reduction in options of other uses
agriculture and aquaculture and expanding industrialisation. These
of freshwater and future costs of disruption to shipping and other
increases are expected to override improvements in infrastructure
contingency measures.
and regulations. For the socio-economic indicators, future economic
deterioration is expected, with health and other social and community
Wallacea
impacts remaining stable. Thus, the socio-economic prognosis
Socio-economic impacts from pollution range between slight to severe.
for the future is severe for economy, health and other social and
Most impacts are related to aquaculture, fi sheries, tourism and mining
community aspects from water pollution, despite regulatory and
and are concentrated in the major urban centres or mine discharge
other interventions.
sites. Tailings are discharged into the Buyat Bay from the Minahasa mine
on North Sulawesi and, as noted above, people living around the Bay
In Wallacea, present levels of environmental impacts of pollution
have complained about mud and dead fi sh being washed up along the
are slight whereas the overall impacts of pollution were assessed as
shoreline, empty fi shing nets, and skin rashes among people exposed
moderate. However, environmental impact of suspended solids, solid
to the seawater (Pearce 2000). Impacts from inadequate waste disposal
wastes and spills are already moderate to severe in some areas. For
are widespread among the urban centres, and are also likely to aff ect
example, Makassar (Sulawesi), with a population of over 1 million, has
international tourism (e.g. Bali).
heavy industry and no primary sewage treatment. The Berang and Tello
rivers, with a combined catchment of over 1 150 km2, are major sources
Sahul
of terrigenous sediments and run-off to which the sewage loading of
Socio-economic impacts from pollution are slight for the three
Makassar is added (Hopley & Suharsono 2000). The eff ects of the chronic
components of the three indicators. Most impacts are concentrated in
pollution gradient across the adjacent coral reef tract are clear. The
the major urban centres and in streams aff ected by mine tailing wastes.
water quality indicators are closely paralleled by ecological responses,
most especially coral cover and coral diversity. Over the next 20 years,
Conclusions and future outlook
environmental impacts are likely to deteriorate, becoming moderate
Water pollution of suffi
cient severity to cause massive fi sh kills, harvest
overall. For economic impacts, future improvements are expected and
failure in aquaculture ponds and threats to human health is found in
health and other social impacts will remain the same.
ASSESSMENT
35
Malaysia
57a - Sunda
57b - Wallacea
57c - Sahul
I
n
d
o
n
e
s
i
a
East Timor
Estimated
threat level
High
Medium
Low
0
500 Kilometres
©
GIWA©
2004
Figure 8
Reefs at risk due to marine pollution.
(Source: Burke et al. 2002)
In Sahul, the environmental impacts from pollution are slight at
about 5% of Indonesian manufacturing facilities in 11 river basins
present; being highly restricted both geographically and sectorally,
on the Sunda Islands of Jawa, Sumatra and Kalimantan. While it has
primarily to mining, forestry and urban wastes. Over the next 20 years,
succeeded in eliciting signifi cant pollution reductions from some of
environmental impacts are likely to deteriorate markedly, becoming
Indonesia's largest polluters, PROKASIH represents only the fi rst stage
moderate, primarily because of the predicted increases in forestry,
of regulation.
mining and agriculture, and a major increase in population without
major improvements in infrastructure. Future deterioration is also
Yet, despite weak or non-existent formal regulation, there are many
expected for the economic impacts. By contrast, there is expected to
clean industrial plants. However, there are also many plants that are
be a slight improvement in health, while other social and community
among the world's most serious polluters (Hettige et al. 1996). The
aspects may remain stable.
analysis of Hettige et al. (1996) demonstrated that pollution intensity
was negatively associated with scale, productive effi
ciency, and the use
Remedial interventions
of new process technology. It was strongly and positively associated
Indonesia is adopting industrial water pollution control standards
with public ownership, but foreign ownership had no signifi cant eff ect
similar to those in developed countries. However, formal regulation
once other plant characteristics were taken into account. Among
has been greatly hampered by the absence of clear and legally binding
external sources of pressure, community action, or informal regulation,
regulations (UNDP 1991), as well as limited institutional capacity, lack
emerged as a clear source of interplant diff erences. Hettige et al. (1996)
of appropriate equipment and trained personnel, and inadequate
suggested that local income and education are powerful predictors
information on emissions (Hettige et al. 1996).
of the eff ectiveness of informal regulation. The results also showed
that existing formal regulation had measurably benefi cial eff ects, even
Indonesia began formal regulation in 1992 (Pargal et al. 1997) with
when it was quite weakly developed. Abatement is generally subject
establishment of maximum allowable volumes and concentrations
to signifi cant scale economies; within-country variations in labour and
(in kg/tonnes of output) for emissions of Biological Oxygen Demand
energy prices have little impact on pollution intensity; and community
(BOD) and other water pollutants from 14 broadly defi ned industry
incomes have a powerful negative association with pollution intensity
sectors (e.g. textiles, wood pulping). Although self-reported BOD
(Pargal et al. 1997). Although the plant and fi rm characteristics are
emissions are now mandated by law, reporting was extremely
important in Indonesia, community income is particularly important,
sparse until recently. Until 1995, the only consistent programme of
since this suggests a powerful role for informal regulation whether or
monitoring and pressure for compliance was a voluntary arrangement
not formal regulation is in place.
instituted in 1989. This PROKASIH or Clean Rivers programme covers
36
GIWA REGIONAL ASSESSMENT 57 INDONESIAN SEAS
Indonesia's Environmental Impact Management Agency (BAPEDAL)
Other organisations and agencies involved in forest protection include:
has recently initiated PROPER-PROKASIH. This programme gives
Consultative Group of Indonesian Forestry, established in 1994 as a
participating industrial and other manufacturing plants colour-coded
coalition of institutions for various donor countries;
grades indicating their compliance with pollution regulations. PROPER-
Inter-Departmental Committee on Forestry, organised to formulate
PROKASIH is continuing and preliminary results suggest it has had a
the National Forest Programme.
positive impact on polluter behaviour as well as BAPEDAL's capacity
for regulation.
Funding for forest management has been provided by the World Bank,
Asian Development Bank, Canadian, German and Japanese government
In fostering sustainable agriculture, the Integrated Pest Management
aid agencies, among other donors. Continuing activities include the
Program (IPM) was initiated in 1986, after implementation of the
establishment in forest villages of forest production centres and forest
Presidential Instruction that banned use of 57 pesticides on rice, and also
and ground fi re control centres. The former support community-based
cut off subsidies. Some 1 million farmers have now been trained in IPM,
forest management, with routine patrols and intelligence operations
with some 2 700 full-time government IPM trainers and 1 200 part-time
checking for illegal logging and illegal distribution of forest products.
trainers now operating. In terms of funding for sustainable agriculture,
The latter, in association with a national coordinating team for the
the sector was allocated almost 10% of the national expenditure in
control of forest and ground fi res, focus on prevention of forest fi res.
1999-2000, down slightly from the previous year. Additional fi nancial
The Government has also established forest rehabilitation programmes
support is provided by sustainable agriculture networks in Australia,
with the participation of local communities, and in 1999-2000 targeted
France, Thailand, Japan, the EU and Morocco (UN 2002).
155 688 ha for reforestation and aff orestation (UN 2002).
In response to deforestation, the Government has classifi ed forests
Despite these and other pollution mitigation initiatives, future
according to function as production forest, protection forest, and nature
deterioration is expected in all four environmental and socio-economic
reserve. In 1999, total forest area was some 120.3 million ha (UN 2002),
indicators, particularly in Sunda. Addressing water security alone is a
of which 66.3 million ha was production forest, 33.5 million ha was
major challenge (as noted in the section on Freshwater shortage
protected forest, and 20.5 million ha was nature reserve.
above), and insuffi
cient progress is being made in addressing the
other major forms of water pollution at present. For example, river and
Substantial areas are being converted from production forests to
coastal aquaculture projects are growing rapidly, with little regulation
protection forest. For example, in 1999, a total forest area of 1 298 990 ha
or enforcement. Up to 1 million ha of land, mostly mangrove forests,
had been converted from production to protection forest or nature
were allocated by the government for the shrimp hatchery industry
reserve. Recent legislation, including Law No. 41/1999 on Forestry, has
during the 1980s and 1990s. By 2001, about 70% of the shrimp farms had
provided a new direction for forest development planning, which must
been abandoned, because the operators found them unsustainable
be transparent; integrated; and participatory (also see Annexes III-V).
due to the high concentrations of chemicals and the destruction of
The Law allows for the role and right of people living in and around
the mangrove habitat.
conservation areas in forest management (UN 2002). Furthermore,
President's Instruction No. 5/2001 details the abatement of illegal
logging and distribution of illegal forest products.
Habitat and community
Several government agencies hold jurisdiction of forests, including:
modification
Directorate General of Production Forests, under the Ministry
T
T
T
C
C
C
A
A
A
of Forestry and Crop Estates, the primary government agency,
IMP
Sunda
IMP
Wallacea
IMP
Sahul
authorises release of logging concession rights;
Department of Trade and Industry, issues permits for establishing
The GIWA region Indonesian Seas is located in the heart of the Indo-
timber and forestry enterprises;
West Pacifi c centre of diversity, supporting mega-diversity on both land
Department of Agriculture, conversion of forests to agricultural
and in the sea (Roberts et al. 2002), hosting some 17% of all known
land;
species (UN 2002), including:
Department of Mines and Energy, grants mining rights in areas that
11% of fl owering plants;
include forests.
12% of mammals;
ASSESSMENT
37
15% of amphibians and reptiles;
In addition to the Irrawaddy dolphins, other species and populations
17% of birds;
of coastal cetaceans face similar and equally severe threats (Perrin et.
37% of fi shes;
al. 2002). In many provinces there has been an increase in the rates of
>60% of reef-building corals.
extraction of natural resources, including rampant and uncontrolled
logging, large- and small-scale mineral mining, expanded coastal
Ecosystems range from icy mountain areas in Papua of more than
developments and industrialisation, and increased mariculture,
5 000 m altitude, to humid tropical lowland rainforest, from deep lakes,
together with ever-growing coastal and pelagic fi sheries. Hence, Perrin
including the largest volcanic lake in the world at Lake Toba, to immense
et al. (2002) concluded that many cetacean populations that inhabit
shallow swamps, mangrove forests, seagrass beds, coral reefs and
Indonesia's estuaries and coastal waters may be in decline. Similarly
deep ocean basins. A major discontinuity in fl oral and faunal diversity
for the oceanic cetacean species, fi shery by-catch has probably caused
occurs along the "Wallace's Line", where the Asiatic and Australasian
signifi cant reductions in abundance, especially for small cetaceans but
biogeographic realms converge (also see Boundaries of the region).
possibly also for large cetaceans such as sperm whales and blue whales
in the eastern provinces (Table 4).
On land, tropical forest support outstanding levels of diversity and
endemism across most plant and animal groups, with Sulawesi, Papua
The region supports populations of six species of sea turtles (Green,
and the Mentawi Islands hosting exceptional levels of endemism.
Hawksbill, Olive ridley, Loggerhead, Flatback and Leatherback) and
Indonesia is the centre of genetic diversity for cloves (Syzgium sp. )
some 29 species of marine mammals (Jacinto et al. 2000, Kahn & Pet
durian (Durio spp.), banana (Musa spp.) and rambutan (Nephelium
2003). In Komodo National Park alone, observations over the period
spp.), with more than 6 000 plant and animal species used daily by
May 1999 - April 2001 recorded 18 species of whales and dolphins
Indonesians (UN 2002).
(Kahn & Pet 2003).
In the sea, biodiversity and habitat complexity are no less outstanding.
Indonesia also forms part of the "coral triangle" of highest coral reef
Some 13 species of seagrasses are present, along with 47 species of
biodiversity (e.g. more than 500 reef-building coral species and some
mangroves, among the richest diversity on Earth. Mangrove forests
2 500 species of reef-associated fi shes) and has an unmatched variety
cover an area estimated at between 2.49 million ha (Tomascik et al.
of coral reef habitats. Wallace and Wolstenholme (1998) classifi ed
1997) to 4.25 million ha (Wilkinson 1994). Most mangroves are located in
15 diff erent types of major habitat. Depth of water immediately off shore
Sahul (Papua, estimated at 29 000 km2) and Sunda (Sumatra 4 170 km2,
Kalimantan 2 750 km2, Jawa 343 km2) (Priyono & Sumiono 1997),
Table 4
Overview of environmental impacts of relevance to
representing more than 67% of the total area of mangroves in South
Indonesia's marine mammals.
East Asia. Seagrass beds are even more extensive (30 000 km2 according
Habitats affected
Impacts
to Tomascik et al. 1997) and exist in varied habitats from intertidal
Riverine
Coastal
Oceanic
mudfl ats to shallow sandy beaches to coral reef fl ats. However extensive
Habitat destruction - Forest logging
cutting for timber, conversion for aquaculture and other forms of coastal
Habitat destruction - Coastal development
development and extensive siltation/sedimentation have caused major
Chemical pollution - Industrial and urban wastes, terrestrial run-off
fragmentation and reduction in the area of these habitats.
Chemical pollution - The discharge of mining wastes as sea. The disposal
of toxins via a procedure termed submarine tailings placement (STP) is
of special relevance to Indonesian marine life.
Despite the continuing loss and fragmentation of seagrass habitat, the
Acoustic pollution - Destructive fishing practices such as reef bombing.
dugong (Dugong dugon) is still present, particularly in areas of Wallacea
This illegal fishing method can have regional impacts, especially in the
vicinity of sensitive marine areas for cetaceans such as preferred feeding
(Sulawesi, Bali and Flores) although these were once more common
and breeding areas as well as migration passages.
Acoustic pollution - Seismic surveying for oil and gas by offshore
in suitable seagrass habitats throughout the entire region. Marsh et
industries.
al. (2001 in Perrin et al. 2002) describe dugongs as rare or depleted
Acoustic pollution - Military and scientific experiments
throughout their original range in the Indonesian archipelago, with
Gill netting in sensitive marine areas for cetaceans.
a rough population estimate of perhaps 1 000 animals in 1994. In
Traditional hunting, especially in the waters of the East Flores islands.
Indonesia, declines in dugong abundance and distribution, including
Discarded plastics and fishing gear.
extirpation of local populations, are likely to continue and may even
By-catch in local and regional fisheries.
accelerate.
(Source: Perrin et al. 2002, APEX 2004)
38
GIWA REGIONAL ASSESSMENT 57 INDONESIAN SEAS
may range from a few metres off inshore reefs, to 100 m off reefs on the
Table 7
Coral reef degradation in Indonesia.
margins of the continental shelves such as the Spermonde Archipelago,
Degraded reef (%)
Loss of productivity (%)
Area (Sub-system) *
to 2 000 m or more adjacent to the oceanic troughs which lie close to the
50 years ago
1993
50 years ago
1993
southern subduction zone (Jompa 1996, Hopley & Suharsono 2000).
Western Indonesia (Sunda)
20
60
10
60
Central Indonesia (Sunda and Wallacea)
10
40
5
30
In the region as a whole, coral reefs and associated habitats of
Eastern Indonesia (Wallacea and Sahul)
10
50
10
20
mangroves and seagrasses have experienced major declines in the
Note: * The three areas only roughly correspond to the three sub-systems dealt with in this report.
(Source: Modified from Hopley & Suharsono 2000, as modified from Chou et al. 1994 ASEAN report).
past several decades. WWF Indonesia (2000) estimated that 80% of
Indonesia's reefs were highly or moderately degraded and remain
under threat from human activities. A comprehensive review of
of productivity of coral reefs of the region is shown in Table 7. A detailed
Indonesia's coral reefs by the Indonesian Institute of Sciences (LIPI)
analysis of reef condition for various areas of Indonesia is provided by
estimated that 40% of sites were in poor condition, with living coral
Hopley and Suharsono (2000).
cover of less than 25% (Chou 2000, Suharsono pers. comm.). By contrast,
just 29% of sites were in good to excellent condition, with coral cover
Processes regulating diversity and recovery of coral reefs following
of greater than 50%. These data provide clear indications of rapidly
disturbance also vary enormously within the Indonesian Seas region
declining reef health. Notably, the reefs of eastern Indonesia (Wallacea
(Tomascik et al. 1996, 1997, DeVantier et al. 1999, Edinger et al. 1998).
and Sahul) remain in better condition than those of the western area
In some areas (e.g. Banda Islands), recovery following catastrophic
(Sunda), but are under increasing threat.
mortality (from volcanic eruption and lava fl ow) is among the fastest
yet documented (Tomascik et al. 1996, 1997). In other areas, and with
As reviewed by Hopley and Suharsono (2000), many summaries and
other forms of disturbance, natural recovery is much slower or non-
syntheses of the status of coral reefs, especially from survey data from
existent, particularly where the underlying reef substrate has been
Indonesian Institute of Science (LIPI), have been made over the last
modifi ed through sedimentation (i.e. terrestrial run-off ) or breakage
10 years (e.g. Wilkinson et al. 1993, Soekarno 1994, Chou et al 1994,
(i.e. rubble production during blast fi shing). This wide spectrum in
Soegiarto 1997, Chou 1997, 1998, Suharsono 1998, all in Hopley &
recovery potential is of signifi cant importance in both management
Suharsono 2002). The synthesis of the results, for various times during
and remediation, illustrating the stark contrast between some natural
this period, is shown in Table 5 and 6. The rate of degradation and loss
and human impacts and their medium to long-term eff ects. Local-scale
remediation in circumstances of blast damage producing unstable
Table 5
Coral cover of reefs in Indonesia.
rubble fi elds may rely on rebuilding solid substrate for recruitment
Coral cover * (%)
e.g. Komodo National Park (see Box 1) (TNC 2000, Mous and Pet
Number of
Date
stations
pers. comm.).
Excellent
Good
Fair
Poor
1989 124
5.6
30.6
33.9
29.8
Ambient waters may range from highly turbid to as clear as anywhere in
1995 217
4.6
24.4
28.6
42.4
the world, and a full range of energy levels are found from the southern
1998 421
6.4
24.2
29.2
40.4
oceanic swell coastlines of the islands of Sumatra, Jawa, Bali and Nusa
1999 410
6.1
22.7
31.5
39.8
Tenggara, to the almost constantly smooth waters of the Bay of Tomini
Note: * Excellent = 76-100% cover; Good = 51-75% cover; Fair = 26-50% cover; Poor = 0-25% cover.
(Source: Hopley & Suharsono 2000)
(Wallace & Wolstenholme 1998). High regional biodiversity levels are
maintained because diff erent types of reefs, with almost unlimited
Table 6
Status of the coral reefs in Indonesia using the 1999 LIPI
permutations of contrasting environmental conditions, are often found
data.
in close proximity (Hopley & Suharsono 2000).
Status of the reefs (%)
Area (Sub-system) *
Excellent
Good
Fair
Poor
Loss of ecosystems
Western Indonesia (Sunda)
3.0
14.5
28.9
53.6
Overall in Indonesia, somewhere between 20% and 70% of habitats are
Central Indonesia (Sunda and Wallacea)
6.7
25.4
38.8
29.1
considered lost, with extinction of species occurring at one per day (UN
Eastern Indonesia (Wallacea and Sahul)
10.0
31.8
26.4
31.8
2002). Of the better known groups, IUCN considers that 126 Indonesian
All Indonesia
6.1
22.7
31.5
39.8
birds, 63 mammals and 21 reptiles are endangered.
Note: * The three areas only roughly correspond to the three sub-systems dealt with in this report.
(Source: Modified from Hopley & Suharsono 2000)
ASSESSMENT
39
Box 1
Restoration of coral reefs following blast fi shing.
beds, muddy and sand-gravel bottoms and fringing coral reefs are
Illegal fishing with homemade bombs or dynamite is rampant throughout South
also impacted by trawling. Development and expansion of ports has
East Asia and has devastated many coral reefs in the region. In addition to fish and
other organisms being indiscriminately killed, coral skeletons are shattered by the
resulted in foreshore reclamation and channel dredging, with major
blasts, leaving fields of broken rubble. This rubble shifts in the current, abrading or
burying any new coral recruits, thereby slowing or preventing reef recovery.
destruction of reefs, and indeed their associated coral islands (cays, e.g.
Due to effective management, blast fishing has decreased in Komodo National Park
Jakarta Bay) (Soemodihardjo 1999).
(KNP), making restoration efforts worth investigating. Based on 4 years of pilot data
testing three different methods (rock piles, cement slabs, and netting pinned to the
rubble) rocks were selected for large-scale rehabilitation. Many more corals per m2
grew on the rock piles compared to untreated rubble. Rocks also provided the most
There is little information on the population status of Indonesia's
natural, complex substrate, were easiest to scale up, and are relatively inexpensive
compared to reef rehabilitation methods being investigated elsewhere. Mid-scale
cetaceans (Perrin et al. 2002) except for the Irrawaddy dolphins of
rock piles were installed in 2000; cover by hard corals on the rocks continued to
the Mahakam River, East Kalimantan. The population there has been
increase as of this most recent visit (March 2003).
In 2002, rehabilitation efforts in Komodo National Park were further scaled up,
declining rapidly and is currently estimated at less than 50 animals,
testing four rock pile designs at each of four different rubble field sites, covering
more than 6 000 m2 total. If the rubble fields have adequate source coral larval
possibly only 35-42 (Kreb 2002 in Perrin et al. 2002). The earliest estimates,
supply from nearby live coral, using rocks for simple, low-cost, large-scale
in 1978 by the Directorate of Forest Protection and Natural Conservation,
rehabilitation could be a viable option to restore the structural foundation of the
reefs, thereby facilitating the return of coral, fish, and other reef-associated life.
were 125-150 animals for the same population. In 1993 the population
(Source: Excerpted from Fox et al. 2003)
was at 68 individuals (Priyono 1993 in Perrin et al. 2002). Although these
numbers cannot be used for a rigorous trend analysis, the extremely
Sunda
small size of this apparently isolated population was regarded as
The environmental impacts of habitat loss in the Sunda sub-system
suffi
cient cause for IUCN to list it as critically endangered in 2000.
are severe. More than 30% of the surface area of mangroves in north
Jawa has disappeared during the last 150 years (also see Box 2). For
Wallacea and Sahul
most habitats, notably marshes, swamps, riparian belts, fast fl owing
The environmental impacts of habitat loss in Wallacea and Sahul are
stony bottomed streams and slow fl owing sandy/muddy fl oodplain
less severe than Sunda and were rated as moderate to slight, with
rivers, extensive habitat fragmentation has already occurred. Seagrass
reduction/loss of mangroves, particularly around major ports (e.g.
Box 2
Mangrove clearance and development for aquaculture ponds.
There are various estimates for the area of mangroves in Indonesia. Wilkinson (1994) quotes an area of 4.25 million ha, representing about 70% of the total for South East Asia or
25% of the global area. Atmadja and Soerojo (1994) estimated that in 1992, 32.4% of the mangrove area had been lost. There are numerous studies on the valuation (e.g. Turner &
Adger 1996) and exploitive impacts (e.g. Brown 1997) of mangroves in relation to clearing for fishponds. Apart from the loss of biodiversity, mangrove loss has immediate impact
on fish stocks, destabilises the coastline and affects a variety of resource uses (Atmadja & Man 1994). Conversion to fish ponds include the following impacts:
- Detrimental impact on wild stock as large brood stock are raided for larval rearing;
- Use of antibiotics, bacterial pond treatments, chemicals and feed can severely affect water quality both within the ponds and beyond;
- Water quality may also decline as flushing of the ponds, unless planned carefully, which can be far less than in natural coastal and deltaic channels;
- In even semi-intensive situations there is a real threat of disease which can pass to the wild stock;
- Construction of ponds in mangroves often leads to the formation of acid sulphate soils with serious consequences for the impounded species and wild stock.
Restoration of abandoned fish ponds is not easy. Many of the quoted impacts have important transboundary implications. Further, there are examples in Indonesia where the
investment in prawn factories which process the local product for export are owned and/or financed by overseas capital, especially from Japan. The market for the farmed product
extends across South East Asia, including Australia. A comprehensive assessment of the problem is provided by e.g. MacKinnon et al. (1996), Tomascik et al. (1997) and Marsden
(1998). The Mahakam Delta of Kalimantan Timur illustrates the seriousness and complexity of the mangrove clearance problems (Hopley 2001). Salient features of this are:
- The Mahakam Delta with an area of 150 000 ha is one of the most important and extensive areas of Nypa (palm) and mangrove wetlands in East Kalimantan, but over the
last few years has seen a rapid and unplanned clearing for aquaculture. In 1992 the approximate area of ponds was only 2 800 ha, mainly on land which was previously
converted to coconut plantations; by 1998 the area was about 13 800 ha or 9% of the delta and expanding.
- The industry is now well established and is the economic basis and main employee for much of the population of the delta. It is an important export earner, producing
about 1 400 tonnes of mainly Penaeus monodon prawns per year, about half of which are exported to Japan via two processing factories located in Anggana.
- Apart from the direct effects of wetland clearing, environmental impacts to date appear limited due to the extensive nature of the aquaculture system (no supplementary
feeds etc.) and the well-flushed waters of the delta.
- However, because of the ad hoc development of the industry there is a developing conflict of interest as tambak spread into areas utilised by the delta's other major
industry, oil and gas extraction. This is not only dangerous, as ponds are built over pipelines, but potentially creates a situation in which the oil industry could be blamed for
any downturn in aquaculture production which is due to other causes.
- Environmental problems which may arise include impacts on wild fish over a very large area as fish and crustacean nursery grounds are lost, erosion of delta front and
estuary banks because of clearing of the protective vegetation, and decline in water quality from acid sulphate soils, overdevelopment of tambak and possibly from
the middle and upper reaches of the Mahakam River. Disease could become a major problem though the discrete nature of the delta lobes could help in any quarantine
exercise.
- Socio-economic problems have also been recognised in other areas where rapid and unplanned expansion of aquaculture ponds has taken place. Conflicts arise from land
use competition, land ownership and distribution of economic benefits, especially as new people are drawn into the area. In part, this may result from the lack of awareness
of the direct non-market values of wetlands.
- The major problem in the development of the industry and in its current phase of rapid expansion is the lack of direction and management with little government
involvement above the sub-district level. Even existing regulations including those which provide for green zones and buffer zones at the delta front, estuary banks and
along oil and gas pipelines, are not observed.
(Source: Courtesy of D. Hopley )
40
GIWA REGIONAL ASSESSMENT 57 INDONESIAN SEAS
Makassar) and indications of fragmentation of riparian and stream
Sahul
habitats from mining in the past several decades.
The environmental impacts of habitat modifi cation are moderate and
are less intense than in Sunda or Wallacea. Although the coral reefs of
Modification of habitats
Eastern Indonesia may be in better condition than those of the west,
Sunda and Wallacea
they are still declining at a rapid rate. In the far eastern region, 32%
Environmental impacts from habitat modifi cation in the Sunda
are in poor condition, and just 10% are in excellent condition (Hopley
and Wallacea sub-systems were assessed as having severe impacts.
& Suharsono 2000). There has been destructive fi shing in some reef
These impacts include major changes in species complement due to
areas (e.g. Gag and Gebe Islands, Rajah Ampat area) (Done et al. 1997),
introduction of alien species in freshwaters basins (e.g. Tilapia and water
changes in species compliment from introductions (e.g. water hyacinth),
hyacinth), with at least 60 of the 1 400 freshwater fi sh species threatened
and some modifi cation of mangroves and disturbance to soft bottom
with extinction (World Bank 1999, WRI 2000). Development-aid projects
benthic habitats from trawling. Coral reefs in other parts of the sub-
aimed at improving agricultural productivity can impact adversely
system are thought to be in relatively good condition, notably in the
on habitats. For example, the Government is implementing a crash
Rajah Ampat Islands, and with a large marine national park established
programme in Repelita VI to improve 1.0 million ha of village irrigation
in Teluk Laut Cendrawasih.
systems and to develop a 600 000 ha rice estate by swamp reclamation
in central Kalimantan. Reclamation of swamps will undoubtedly cause
Socio-economic impacts
the fragmentation of these important habitats. In total, Indonesia has
Major economic costs are accruing from loss and modifi cation of coral
an estimated 39 million ha of coastal and inland swamps. The extent of
reef habitats, which are of immense economic value. In South East
arable swampland has not been assessed in detail but is estimated to
Asia generally, reef fi sheries alone are estimated to be worth some
be 7.5 million ha. In 1996, the tidal and non-tidal swamp area used for
2.4 billion USD per year (Burke et al. 2002). The reefs of Indonesia
irrigation (mainly for rice) was about 1.18 million ha. The environmental
provided annual economic benefi ts of 1.6 billion USD per year in
impacts of swamp and other reclamation projects need to be considered
2002, based on their value in food security, employment, tourism,
carefully before implementation, with much improved integration
pharmaceutical research and shoreline protection, however, over the
among the relevant government departments and agencies.
next 20 years, human impacts, notably overfi shing, destructive fi shing
and sedimentation, could cost Indonesia some 2.6 billion USD (Burke
There have also been major changes in population structure and
et al. 2002).
functional group composition, notably on coral reefs (e.g. DeVantier
et al. 1999) and massive changes in ecosystem services of coral reefs
In the case of destructive fi shing, the bombs, usually constructed
and mangroves. Many coral reefs have been degraded in terms of
from soda bottles stuff ed with explosive potassium nitrate, detonate
destructive fi shing practices and overfi shing (e.g. Edinger et al. 1998)
underwater, killing or stunning fi sh so that they are easy to collect. There
and the important fi sheries nursery-ground roles of large sections of
is considerable collateral damage to reef communities, with localised
mangroves and seagrass beds have been seriously depleted (see Box 2
death and injury to all incident species, and coral mortality rates of 50%
above). Muro-ami, blasting (see Box 1 above) and poison fi shing have
to 80% (Hopley & Suharsono 2000). For the fi sherman, the short-term
damaged or destroyed large areas of coral reef. For example, World
gains from bombing may be impressive, with a 1-2 USD investment
Resources Institute's Reefs at Risk in South East Asia reports (Bryant et
returning up to 15-40 USD in profi t on the local market. Moreover, given
al. 1998, Burke et al. 2002) estimate that up to 50% of some 51 000 km2
the ease with which fi sh bombs are assembled (potassium nitrate is a
of reef have already been degraded, with 85% threatened by human
common component of fertiliser) fi shermen seldom make the switch
activities, which includes coastal development, overfi shing, and marine-
to more sustainable, but time-consuming, technology like spears
based pollution (Figure 2 in Regional defi nition). In the last 50 years, the
and hooks. As a result, in many coastal areas, bombed reef fi sh often
proportion of degraded reef has increased from 10% to 50% (Hopley &
dominate local markets. But the practice has a devastating eff ect on
Suharsono 2000). In central Indonesia, currently 40% of coral reefs are
coral reefs, which may take more than 50 years to recover.
classifi ed as being in poor condition and only 6% in excellent condition
(Hopley & Suharsono 2000). However, because of the paucity of long-
According to Burke et al. (2002), destructive fi shing practices are the
term monitoring and data, exact fi gures are diffi
cult to obtain (Jompa
single largest threat to Indonesia's reefs. While the benefi ts to an
1996, Wilkinson 1998, 2000, 2002, Llewellyn in press).
individual fi sherman may be high in the short-term, the costs as a
whole are staggering. The report estimates that the cost from fi sh
ASSESSMENT
41
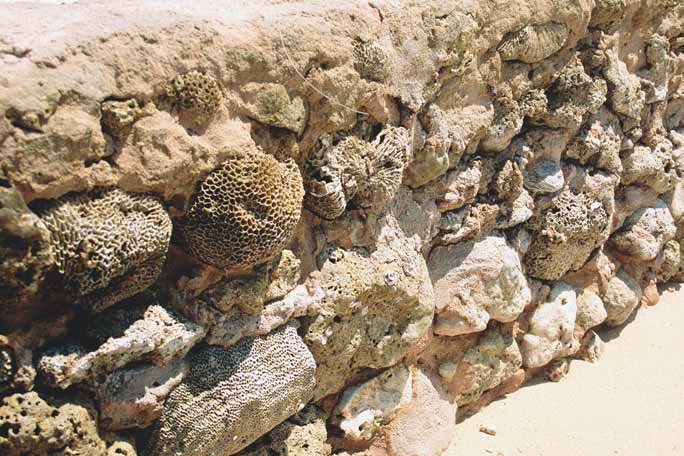
Figure 9
Retaining wall made from coral.
(Photo: J. Oliver, Reefbase)
bombing alone over the next 20 years will be at least 570 million USD
harbour valuable fi sh, but protect shorelines from erosion and facilitate
(Burke et al. 2002). That sum is more than 10% of the debts recently
the growth of coastal mangroves and seagrass beds, at 1.6 billion USD,
rescheduled with Indonesia's international lenders.
as noted above.
Cyanide use can be nearly as destructive as blast fi shing, but its focus is
Coral mining is another signifi cant socio-economic (and environmental)
often the international market, rather than local supply. Prized reef food
problem (Figure 9). Mining and quarrying of coral reefs is widespread at
fi sh like grouper (Serranidae) and Napoleon wrasse (Chelinus undulatus)
both subsistence and commercial levels, although banned by various
are chased into corals, where the diver uses cyanide-fi lled squirt bottles
provincial governments (1973 in Bali, 1985 in East Nusa Tenggara)
to stun the fi sh for capture and sale on the live reef fi sh market. These
(Hopley & Suharsono 2000). The COREMAP project noted that coral
fi sh are usually shipped aboard large cargo ships to discerning diners
mining was practiced at nearly all sites visited during their 1997
in Hong Kong, Singapore, Taiwan and the Chinese mainland, where the
reconnaissance visit (COREMAP 1997, DeVantier pers. obs.). As noted
fi sh are picked out of aquariums just prior to cooking. The cyanide does
by Hopley and Suharsono (2000), corals are mined to provide house
more than stun the fi sh, though, as coral is killed as well, particularly
foundations (especially in Kalimantan, Sulawesi and Maluku) and to
since the divers often have to tear apart the coral structure with
build seawalls and jetties. They are also used to provide foundations
crowbars to pull the fi sh out.
for roads, to manufacture lime for mortar and other building purposes,
to line shrimp ponds, as well as for decorative outlining of gardens
The cost to Indonesia from cyanide use is estimated to be 46 million USD
and properties and for export as decorative pieces. In the early 1990s
annually (Burke et al. 2002). By comparison, the report estimates the
642 000 pieces were exported to the USA (Cesar 1996).
annual economic benefi t to Indonesia from its reefs, which not only
42
GIWA REGIONAL ASSESSMENT 57 INDONESIAN SEAS
Some examples illustrate the scale of the problem:
In Lombok (Wallacea), seaweed cultivation has been stopped close
In the Sekotong region of Lombok, there are 116 limekilns each
to resorts, and in the Gili Islands of Lombok Strait ornamental fi sh
requiring 2 784m3 of corals per month. In addition, they require
collectors have deliberately bombed tourist reefs from which they are
almost 7 000 m3 of fi rewood which is taken from adjacent hill slopes
now excluded (Hopley & Suharsono 2000). Nonetheless, the industry
(COREMAP 1996).
contributes some 16% of Lombok's GNP, and even more in Bali. Cesar
In west Lombok, the production of lime has been in operation since
(1996) puts an economic value for tourism for Indonesian reefs at
at least 1935. The kilns here require 600 m3 of coral per month for
about 3 000 USD per km2. Tourism has a far greater chance of being
30 kilns (Djohani 1995 in Hopley & Suharsono 2002).
sustainable than the majority of other uses to which Indonesian reefs
Also in Lombok, 60 families have been mining a 2 km stretch of
are put (Hopley & Suharsono 2000), provided it is well managed and
fringing reef over a 10 year period, with each family producing
as far as practicable integrated into local society, with the potential to
about 25 kg of lime each year (Cesar 1996).
help generate alternative incomes for villagers.
In Bali, even in 1980 some 144 000 m3 of corals were being removed
for construction and in 1981 there were 400 coral mining enterprises
Loss of riparian and coastal vegetation also has enormous socio-
(Nikijuluw 1998b in Hopley & Suharsono 2000). 2 880 people were
economic implications, with up to 1 million ha of land, mostly
working in the industry, which still exists.
mangrove forests, allocated by the government for the shrimp
In Lasolo, Southeast Sulawesi, 20 tonnes of coral have been used to
hatchery industry. By 2001, about 70% of the shrimp farms had
construct a dock (COREMAP 1997).
been abandoned, because the operators found them unsustainable
The scale of coral usage is also illustrated from Nias in Sumatra
due to the high concentrations of chemicals in the mud and the
where coral heads from the adjacent fringing reef were used as
destruction of the mangrove habitat. Local NGOs claim that the donor
a road foundation between Gunung Sitoli and Teluk Dalam, a
agencies (including the World Bank) should be held accountable for
distance of about 100 km on Pulau Nias.
environmental destruction caused by shrimp farming, and that the
government should establish clear criteria for sustainable shrimp
The related increase in turbidity impairs coral regrowth, while local
farming and ways to rehabilitate damaged mangroves. In other parts
fi sheries decline and beach erosion increases where beaches are
of the region, similar habitat modifi cation and destruction has taken
no longer well protected by the reef. Hotels in Bali and Lombok are
place, and this has also led to human confl ict. Progress in managing
estimated to spend over 100 000 USD per year to mitigate beach erosion
human use of habitats (see Causal chain analysis and Policy options
caused in this way (Cesar 1996).
section) is not expected to be suffi
cient to fully mitigate the damaging
eff ects of population growth.
Additional socio-economic impacts can accrue from tourism, usually
at two stages in the development of the industry (Hopley & Suharsono
The socio-economic impacts of habitat loss and modifi cation in the
2000). The early construction phase may employ damaging techniques
Sunda and Wallacea sub-systems were considered severe. Health
of land clearing and quarrying of the reef for resort construction (see
impacts range from slight to severe, depending on the degree
above). After the resort is occupied, damage may result from sewage
to which spread of mosquito-borne diseases can be attributed
disposal, anchor damage at dive sites (mooring facilities are not normally
to modifi cation of swamps and of mangrove habitats. There are
installed) and breakage of corals by inexperienced divers and snorkelers
serious economic issues in fi shing communities and also from loss of
(when operators are not trained to give environmental advice to the
mangrove habitats. There are also health issues arising from habitat
tourists). Tourism may also create confl ict with the local communities
loss and modifi cation.
(Djohani 1995 in Hopley & Suharsono 2000). For example, tourism in
Kepulauan Seribu National Park (Jawa Sea, Sunda) has grown rapidly,
Key socio-economic issues remain unquantifi ed at the sub-system scale,
without comprehensive planning, since the 1970s, and caused a great
but clearly include:
deal of environmental and socio-economic impact. With 80 000 visitors
Reduced capacity to meet basic human needs (food, fuel) for local
in 1991 (Cheung et al. 2002) and despite a large amount of derived
populations, particularly among poor coastal fi shing villages heavily
revenue, less than 5% of the local island population is employed in
reliant on subsistence fi sheries;
the industry. This worsens the confl ict of interest between two major
Changes in employment opportunities for local populations and
users; local fi shermen and tourism developers/operators, and stimulates
associated changes in social structures, particularly in poor coastal
resentment among the local community.
communities;
ASSESSMENT
43
Malaysia
57a - Sunda
57b - Wallacea
57c - Sahul
Altered
I
n
d
o
n
e
s
i
a
land cover (%)
East Timor
0 - 20
21 - 40
41 - 60
61 - 80
0
500 Kilometres
81 - 100
© GIWA 2004
Figure 10 Reefs at risk due to alteration of land cover.
(Source: Burke et al. 2002)
Loss of aesthetic/recreational values and tourism opportunities,
Overexploitation of natural resources;
with associated economic loss of existing income and future
Introduction of alien species;
opportunity for investment income and foreign exchange from
Inappropriate agricultural and forestry policies.
fi sheries, tourism, etc., particularly in Wallacea;
Human confl icts, e.g. in West Nusa Tenggara (Wallacea) marine
In the present analysis, the major causes of loss and modifi cation of the
police have been the subject of death threats, and fi sh bombs have
freshwater, coastal and marine habitats include:
been thrown at police boats that approach illegal fi shermen;
Siltation, conversion for aquaculture, agriculture, industrial
Loss of educational and scientifi c values, with many undescribed
development aff ecting marshes, swamps, rice paddies and riparian
species, notably on coral reefs;
belts, notably in Jawa, Sumatra and Kalimantan;
Modifi cation or loss of cultural heritage, particularly among coastal
Deforestation: siltation, damming and waste disposal aff ecting rice
and sea-going people;
paddies and rivers (Sumatra, Kalimantan and increasingly Papua);
Costs of controlling invasive species (e.g. Tilapia and water hyacinth
Aquaculture conversion and timber collecting aff ecting mangroves
in freshwaters) in both sub-systems;
(many areas);
Costs of restoration/rehabilitation of modifi ed ecosystems,
Sediment run-off : siltation and dredging aff ecting sea-grass beds
including mangroves and marshes from aquaculture, coral reefs
and coral reefs (many areas, especially north Jawa);
from destructive fi shing (see Box 1 above), riparian vegetation from
Destructive fi shing and overfi shing aff ecting coral reefs (much of
unsustainable forestry in both sub-systems;
the region);
Intergenerational inequity, particularly among traditional fi sher
Mid-water trawling, drift netting and other forms of pelagic
families.
fi sheries, oil and gas exploration and pipelines aff ecting oceanic
habitats (many areas, especially Jawa Sea).
By contrast with Sunda and Wallacea, socio-economic impacts of
habitat loss and modifi cation in the Sahul sub-system were considered
At present, these impacts are most severe in Sunda and Wallacea
slight, and are concentrated around mining sites.
and of less concern in Sahul (Figure 10). Until recently, most habitats
were only poorly represented in protected areas and of those, most
Conclusions and future outlook
were not well-managed. For example, coral reefs in the Kepulauan
Factors responsible for loss of biodiversity in the region include:
Seribu National Park have been severely degraded by destructive
Inappropriate economic policies and strategies;
fi shing, pollution, and a lack of enforcement (Alder 1996, DeVantier
Weak law enforcement;
et al. 1999).
44
GIWA REGIONAL ASSESSMENT 57 INDONESIAN SEAS
Levels of environmental impact vary across the region, with the
on conservation of living resources and their ecosystems and Law No.
most intensive and extensive impacts occurring in Sunda, followed
5/1994 ratifying the Convention on Biological Diversity (CBD) (also see
by Wallacea and Sahul. Environmental impacts in Sunda are already
Annexes III-V). To specifi cally protect marine resources, the Indonesian
severe. Over the next 20 years, impacts are likely to deteriorate further,
Government has implemented Law No. 6/1996 on Indonesian waters
remaining severe. This is primarily because of the predicted increases
and Law No. 9 on Fisheries, and has ratifi ed UNCLOS (1982, Law No. 17/
in population, and increases in the major sectors of fi sheries, forestry,
1985) and MARPOL (Presidential Decree No. 46/1986).
agriculture and aquaculture, mining and industrialisation overriding
improvements in regulations and management, including protected
Biodiversity conservation initiatives are coordinated by the Directorate
areas (see later). For the socio-economic indicators, future deterioration
General of Forest Protection and Nature Conservation within the
is expected with severe impacts to economy and other social and
Ministry of Forests and Crop Estates. The State Ministry for the
community aspects and moderate to severe impacts to health, despite
Environment coordinates all government activities that have an impact
regulatory and other interventions.
on the environment, and developed a National Biodiversity Strategy in
the early 1990s (UN 2002). The Biodiversity Action Plan for Indonesia
Environmental impacts in Wallacea are also already moderate to severe,
has been recently revised as the Indonesian Biodiversity Strategy and
primarily because of modifi cation to coastal and marine habitats.
Action Plan.
Over the next 20 years, environmental impacts are likely to remain
stable. This is primarily because of improvements in regulation and
Thus, some important changes have taken place in the new Reformasi
expansion/improved management of protected areas balancing the
Era. In 1992, the Spatial Use Management Law was provided for
predicted increases in population and the major sectors of fi sheries and
provincial and local government to regulate the use of coastal and
aquaculture/mariculture. The socio-economic prognosis is for further
marine areas. However, it was only in 1999 that powers and fi nancial
deterioration such that the impacts on the economic and other social
support were delegated to provincial and local governments. At
and community aspects of the sub-system are expected to remain
the end of 1999, the Ministry of Marine Exploration and Fisheries
severe, while health impacts are expected to be slight.
was established. These new initiatives may create the long awaited
vertical and horizontal integration of Indonesia's coastal and marine
Sahul
management that has been so lacking in the past (Hopley & Suharsono
Environmental impacts in Sahul are slight to moderate, primarily because
2000). Thus, Indonesia's capacity to implement remedial interventions
of modifi cation to streams and mangroves. Notably most coral reef
has been building since the 1990s, and considerable expertise and
areas of the north coast (e.g. Rajah Ampat Islands) remain in relatively
commitment now resides in government, academia and NGOs.
good condition (Turak, Veron pers. comm.) and with a large marine
national park established in Teluk Cendrawasah. Over the next 20 years,
A strategic biodiversity agenda was formed in 2001 by the Indonesia
environmental impacts are likely to improve, remaining as moderate. This
Biodiversity Forum, with three main programmes:
is primarily because of improvements in regulations and management
Strategic alliance in education and awareness;
of protected areas. For the socio-economic impacts there is expected to
Policies and laws;
be future deterioration in the economic situation, a stabilisation of health
Data and information.
and improvement in other social and community aspects.
The Indonesia Biodiversity Forum, in partnership with the State Ministry
Remedial interventions
of Environment, LIPI and several NGOs is also developing a Biodiversity
As noted above, terrestrial and marine habitats in the Indonesian Seas
Clearing House mechanism. At national level, coastal zone and marine
region, including forests and riparian areas, mangrove forests, seagrass
management currently focuses on four main programmes:
beds, coral reefs, and the deep sea, are among the most biologically
Sustainable utilisation;
diverse on Earth, and conservation of representative habitats and
Conservation;
communities through ongoing development of protected areas
Promoting public participation;
remains a global priority.
Spatial planning.
To specifi cally protect biodiversity, the Indonesian Government has
The Directorate for Controlling Coastal and Marine Ecosystem
instituted legislation, notably since 1990, including Law No. 5/1990
Degradation is developing an Integrated Sustainable Coastal and
ASSESSMENT
45
Marine Program, focused on conserving ecological functions of the
The Komodo National Park comprises some 2 200 km2 and in addition
coastal environment to support sustainable development. Other
to coral reefs includes other coastal and marine habitats and the
large-scale coastal and marine projects, most with both government
islands conserving the endemic Komodo dragons for which the park
and international donor backing, include:
was initially established. The site is recognised as a biologically diverse
Marine Resources Evaluation and Planning Project (MREP);
coral reef system of importance for maintenance and replenishment of
Marine Resources Evaluation, Management and Planning Project
harvested species, and forms part of the key management areas in The
(MAREMAP);
Nature Conservancy's reef management initiatives (TNC 2000).
Coral Reef Rehabilitation and Management Project (COREMAP);
Marine and Coastal Resources Management Project (MCREP);
The Ujung Kulon National Park and adjacent Krakatau National
Development of Sustainable Mangrove Management Project.
Reserve cover some 1 200 km2 of coastal and marine areas on the
southwestern tip of Jawa and Jawa Strait. As with Komodo, the park
The Indonesian Government, with substantive donor support,
was not established for its coral reef attributes, rather for the presence
and international NGOs are thus working towards assessment and
of the Javan Rhino (Ujung Kulon) and for the geological and biological
management of critical biodiversity sites. Indonesia forms part of
processes represented by the 1883 eruption and subsequent ecological
the Global Coral Reef Monitoring Network (GCRMN) (Wilkinson 1998,
colonisation of Krakatau.
2000, 2002) and presently conducts annual biophysical survey and
monitoring expeditions to many parts of the archipelago. Conservation
In association with the Indonesian Government, The Nature
International and The Nature Conservancy, among others, have also
Conservancy (TNC), World Wide Fund for Nature (WWF) and other NGOs
conducted major biodiversity surveys in recent years (e.g. Roberts et
are working towards developing additional well-managed protected
al. 2002, Veron and Turak pers. comm.).
areas. The Nature Conservancy has major programmes underway or
in planning in Wakatobe area of Sulawesi, Komodo Islands, Bali Barat,
Plans drawn up in 1984 were aimed to develop 85 marine protected
Ujung Kulon, Derawan area of East Kalimantan, Rajah Ampat Islands,
areas covering 10 million ha by 1990 and 50 million ha by 2000 (Hopley
Papua and elsewhere, and with UNESCO undertook a thorough
& Suharsono 2000). This has not yet been realised, although in 2000,
assessment of the World Heritage values of the Banda Islands in 2002
356 terrestrial and more than 30 marine conservation areas were
(Mous, Djohani pers. comm.).
designated in Indonesia (Table 8) (UN 2002). As noted above, at present
the MPA network covers an area of some 4.6 million ha. However, only
The land, coastal and sea area to the east of East Kalimantan and Jawa
six have National Park status with just three having implemented
and encompassing Sulawesi, Halmahera and the Molucca Islands, Bali,
management plans. There are two World Heritage sites (Komodo and
Lombok and Nusa Tenggara and east to Aru is recognised as a special
Ujung Kulon) conserving coral reefs and related habitats in the region
management area by WWF (the Wallacea Bioregion). With their adjacent
(Spalding et al. 2001).
Sulu-Sulawesi Sea Marine Ecoregion, the Wallacea Bioregion is ranked
among the top global priority sites for coastal and marine management
(Putra, Miclat pers. comm.). Objectives of the WWF programme are to
Table 8
Terrestrial and marine conservation areas in Indonesia.
conserve the outstanding biodiversity of the area through improved
Terrestrial
Marine
implementation of ecologically sustainable forms of development
Conservation area
Number
Area (ha)
Number
Area (ha)
that allow traditional communities to practice customary fi shing rights,
Wildlife preserve
-
-
3
65 220
while also providing for commercial fi sheries and seabed management.
The approach includes both conservation planning in the long-term
Game reserve
47
3 440 085
7
208 780
and implementation of immediate conservation actions in key pilot
National park
34
11 050 743
6
3 682 955
sites (Bali and Bunaken).
Recreation park
79
293 682
-
-
Hunting park
15
247 392
-
-
Several smaller community-based management initiatives have
Grand forest park
15
247 876
-
-
proven very successful at protecting coral reefs and are facilitating
Nature reserve
166
2 464 722
-
-
replenishment of reef-based fi sheries. Detailed case-studies have
Total
356
17 744 500
16
3 956 955
conclusively demonstrated the fl ow-on and spill-over benefi ts to reef
(Source: UN 2002)
fi sheries of even small no-take reserves (e.g. Komodo Islands) (TNC
46
GIWA REGIONAL ASSESSMENT 57 INDONESIAN SEAS
Box 3
Remedial actions for mangrove loss in the Mahakam Delta.
1. A lead government agency needs to be recognised which can coordinate the regulation of the aquaculture industry in the Mahakam Delta, monitor its progress, make sure
existing regulations are strictly adhered to and work closely with the export processing factories and villagers involved in the industry.
2. Further information is required on a number of issues including the extent of the acid sulphate soil problem, socio-economic impacts of the rapid expansion of aquaculture
and the total value of the Nypa and mangrove wetlands to East Kalimantan. All information should be supplied to government agencies.
3. An education or extension programme, preferably carried out at the sub-district level is required to provide the information needed to the aquaculturists to make the industry
environmentally and economically sustainable.
4. Private enterprise, for example the oil and gas industry, could contribute to the information and extension programmes. They should also maintain, and be seen to maintain,
high environmental standards in their own operations.
5. To maintain sustainability, the aquaculture industry must remain extensive and should be incorporated into a delta-wide strategic integrated coastal zone management plan
as soon as possible.
Subsequently, a number of recommendations were made (Hopley 1999b) (see also Policy options):
Unplanned expansion of aquaculture in the Mahakam Delta over the last 10 years has produced the need for integrated coastal zone management. A land use plan is advocated
as part of a more comprehensive strategic plan for the delta which involves all stakeholders and complies with provincial and national government policies and obligations.
Because of difficulties of rehabilitation and the economic and social value of aquaculture, most of the present 18 000 ha of aquaculture ponds are recommended for retention
but the industry must be made compatible with other users, notably the oil and gas industry and the wild fishery, and must develop in a way which maintains economic and
ecological sustainability. Environmental parameters which will influence the future expansion of ponds include the preference of Nypa areas for aquaculture, water quality, tidal
range and the need to avoid acid sulphate soils. The landward limit of clearing for tambak should be a minimal tidal range of 1.5 m and water with moderate salinity. What is
termed here the "Dutrieux line" limits potential aquaculture sites to the outer 82 000 ha of the delta. The delta morphology consisting of relatively discrete lobes and islands can
determine the pattern for future land use and also aid in the isolation of specific areas of the delta if quarantine measures need to be taken in the future.
Specific recommendations include:
- Only the outer 82 000 ha of the delta be considered for aquaculture;
- All green zones adjacent to the delta front, channels and alongside oil and gas installations be strictly applied;
- Fish ponds not be developed more than 1.5 km from open channels so as to avoid the over concentration of effluent;
- Representative areas of the major ecological zones of the delta be set aside as protected zones, and these be chosen from the less developed delta lobes and islands. Such
measures will help protect the wild fisheries of East Kalimantan;
- Special provisions will be needed to set aside appropriate areas of land for future oil and gas extraction.
These measures should result in an upper limit of 30 000 ha under fish ponds with 25 000 ha set aside in the outer delta as protected areas. This represents a 12 000 ha increase in
the present area for aquaculture but will be sustainable only if the present extensive methodology of low stocking rates and avoidance of artificial feeds is continued.
(Source: Courtesy of D. Hopley)
2000), provided such reserves are not themselves exploited through
There are today no management plans or activities for the majority
ineff ective policing (also see Russ 1985, Russ and Alcala 1996a, b,
of MPAs, and only minimal levels of management in most national
Jackson et al. 2001, Pauly et al. 2002).
parks (Cheung et al. 2002), notably with NGO and donor support (e.g.
Komodo and Bunaken National Parks). For example, and despite the
For the specifi c case of mangrove loss in the Mahakam Delta of East
drafting of a management plan in 1982 and a zoning plan in 1986,
Kalimantan, a detailed strategy has been developed (Box 3), with
Kepulauan Seribu National Park was not fully managed in 1995, and had
opportunities for wider application.
degraded signifi cantly between 1985 and 1995 (DeVantier et al. 1999).
The long delay resulted largely from inter-agency jurisdictional disputes,
In relation to land conversion issues more generally, Indonesia's
confusion over island ownership, lack of human and fi nancial resources
Agenda 21, following from the United Nations Conference on
Box 4
Challenges for eff ective management of an expanding
Environment and Development in Rio and recent Johannesburg World
protected network.
Summit on Sustainable Development, recommends the inclusion of
Despite a very early start in the traditional sasi and much aid from inter-
governmental (FAO and UNDP), international (WWF, and The Nature Conservancy)
both long-term planning and environmental concerns in all major
and national non-government organisations, management has not been able
to keep pace with the expanding protected areas network. Causes include the
policies and programmes (UN 2002). These include legal restrictions
lack of funds, training and capable managerial personnel and consequent lack
on land conversion, monitoring and management of soil nutrition,
of organisational capability, technical personnel, motivation and enforcement.
Personnel and capabilities were originally oriented towards the management of the
water use, and control of pesticide use.
terrestrial environment. There is also an inadequate management framework for
identifying and controlling resource use, excessive centralisation in management
and low local community participation. The total number of existing and proposed
parks, reserves and protected areas, for example, is over 700, including marine
Although much of the coordinating legislation, strategies, programmes,
areas. Mangroves are not well represented in the current protected areas system.
Of the 700, some 79 sites are priority in terms of biodiversity protection, but only
projects and other initiatives are now developed, major problems for
31 (including terrestrial) have complete management plans, and not all have
management of Indonesia's biodiversity and protected areas remain,
been implemented. Specifically, of the six Marine National Parks, only three have
management plans being implemented. A large part of the 368 established
including lack of facilities for management, lack of funds; insuffi
cient
protected areas has not been surveyed, mapped or has clear boundaries. There are
also conflicts between national and local plans, conservation objectives and actual
political or legal support to enforce regulations, and lack of trained
use (including mining and oil exploration initiatives). Fortunately management is
being directed towards greater integration; local communities are being involved
personnel to apply scientifi cally based management (Hopley &
and their concerns addressed.
Suharsono 2000). See also Box 4.
(Source: Excerpted from Cheung et al. 2002).
ASSESSMENT
47
and inability to reach consensus over the zoning plan (Hutomo et al.
are known worldwide for their ornamental fi sh species exported to the
1993). Similarly, the draft management plan for Take Bone Rate National
United States, Japan and Germany including the clownfi sh (Amphiprion),
Park, completed in 1994 awaits implementation (Cheung et al. 2002).
damselfi sh (Dascyllus), and wrasse (Coris gaimardi).
Thus, the above programmes and initiatives notwithstanding, there
At present, rigorous data describing the condition of the fi sh stocks
remains a serious lack of resources for eff ective management of
in the Indonesian Seas region are scant and, as a consequence, the
biodiversity at present, which are limiting the eff ectiveness of the
status of these resources are poorly known. Historical fi sheries statistics
above initiatives. Moreover, the large-scale of Indonesia's territory
indicate that catches during the 1960s in the Indonesian Seas LME were
makes uniform application of policy and legislation, enforcement
around 200 000-300 000 tonnes of predominantly fi nfi shes, molluscs,
and protection all but impossible. To minimise such diffi
culties, the
crustaceans, echinoderms (e.g. holothurian `beche-de-mer') and sharks
development of additional protected areas should as far as practicable
and rays (Large Marine Ecosystems 2004). This tonnage increased
follow the successful models, and include extensive community and
relatively gradually to the late 1970s, when almost 800 000 tonnes
stakeholder consultation, education and regulations off ering real
were taken. The fi sheries increased rapidly in the following few years,
protection, with agreement and strong support from the customary
to a large peak in 1988-1990 with almost 1.2 million tonnes of catch, and
resource owners and users. Proposals for new and/or expanded marine
the catches have continued to increase to around 1.8 million tonnes in
protected areas, to improve integration of the developing network,
2000 (Figure 11) (see also Box 5).
include in Irian (Rajah Ampat Islands and elsewhere), northern and
southern Sulawesi, East and Southwest Kalimantan, and the islands
2
south and west of Sumatra (Cheung et al. 2002).
Flatfishes
1.8
Sharks & rays
Molluscs
Given that the region lies at the centre of global marine biodiversity
1.6
Anchovies
(with adjacent regions of Sulu-Celebes (Sulawesi) Sea and South China
1.4
Crustaceans
Sea), more extensive and intensive intervention is required. See also the
Herring -likes
onnes) 1.2
Other fishes & inverts
Policy option section.
Tuna & billfishes
1
(million t
Perch -likes
h
0.8
Catc
0.6
Unsustainable exploitation of
0.4
fish and other living resources
0.2
T
T
T
C
C
C
A
A
A
IMP
Sunda
IMP
Wallacea
IMP
Sahul
0
1960
1962
1964
1966
1968
1970
1972
1974
1976
1978
1980
1982
1984
1986
1988
1990
1992
1994
1996
1998
2000
Year
The Large Marine Ecosystem of Indonesian Seas is a moderately high
Figure 11 Catches of various fi sh resources in the
(150-300 gC/m2/year) productivity ecosystem (based on SeaWiFS global
Indonesian Seas.
primary productivity estimates) and has major seasonal variations in
(Sourc:e Large Marine Ecosystems 2004)
fi sh abundance (Zijlstra & Baars 1990 in LME 2003). During upwelling
connected to the southeast monsoon in August, fi sh stocks and the
general productivity of the ecosystem are enhanced. The changing
Overexploitation
conditions infl
uence phytoplankton and zooplankton species
Sunda, Wallacea and Sahul
composition. Fish species harvested in the region are for example
The use of maximum sustainable yield (MSY) as an indicator of fi shing
Giant gouramy (Osphronemus goramy), Common carp (Cyprinus carpio
pressure and overexploitation is now almost universally recognised as
carpio), Milk fi sh (Chanos chanos), Skipjack tuna (Katsuwonus pelamis),
outdated (e.g. Jackson et al. 2001, Pauly et al. 2002) and could be replaced
tilapia, tuna, barramundi, anchovy, trevally, mackerel, garfi sh, shrimp,
by more appropriate criteria based on the proportions of spawning
thumb nail (parrotfi sh), octopus, squid, crab, and lobster. Black marlin
biomass for individual species and a `whole of ecosystem' approach
(Makaira indica) is a highly mobile species, fi shed recreationally. The
to multi-species fi sheries such as Indonesian Seas (also see Annex VII).
coral reef environment harbours all kinds of reef fi sh. Indonesian waters
As noted by Kahn and Fauzi (2001) for the adjacent Sulu-Sulawesi Sea
48
GIWA REGIONAL ASSESSMENT 57 INDONESIAN SEAS
Box 5
The importance of coral reef fi sheries in Indonesia.
In 1992 fish production in Indonesia (including freshwater fish) was estimated at 3.5 million tonnes (of which 2.6 million tonnes was marine) with demand by 2000 lifting this to
an estimated 4.25 million tonnes. In part this is due to increasing population, but it is also the result of increasing domestic consumption (15.9 kg per capita per year in 1991 to
19 kg in 2000) with fish now contributing more than 60% of animal protein consumed and development of new export industries including prawns from mariculture ventures
and the live fish trade. In 1997 total marine fish production was 3.6 million tonnes with many of the fish being reefal. Indicative are the figures for groupers. In 1997 the total
catch weight was 42 164 tonnes and apart from 1995 the catch has grown steadily since 1988 when the total was only 16 665 tonnes. 47% of the 1997 catch came from the area
of Eastern Indonesia, with 29% from Sulawesi waters alone. Maximum sustainable yield (MSY) for Indonesian fisheries has been estimated at 5.3 million tonnes (more recently
6.6 million tonnes including EEZ fisheries) with the wild fishery alone estimated at exploiting only 48% of MSY.
However, with 85% of Indonesian fishers exploiting the coastal zone the effect is very uneven and coral reef fisheries
Marine fish production
even in the more remote areas of Eastern Indonesia are generally regarded as being under extreme pressure. On
coral reefs this pressure comes mainly from the traditional artisanal fishers, still sustaining local coastal communities,
1991
1993
Fresh market
but now using more modern gear and equipment. In addition the industrial fishery has also expanded. In 1994, 87
Province
(tonnes)
(tonnes)
(% in 1993)
749 Indonesian and 937 foreign owned vessels between 60 and 800 tonnes were operating in Indonesian waters.
As Wilkinson et al. (1994) have noted, such vessels operating near reefs can catch species migrating between reefs,
West Nusa Tenggara
64 825
79 200
70
with 40% of the catch being regarded as trash and discarded. Figures for total marine fishery production in the main
East Nusa Tenggara
56 604
62 189
58
fishing provinces of Eastern Indonesia (see Table) provide a general picture of the relative exploitation by province.
South Sulawesi ranks second behind only North Sumatra in marine fish production, but all provinces are important
South Sulawesi
233 396
241 059
70
producers, with production increasing during the 1990s. The percentage of the total catch marketed locally as fresh
Southeast Sulawesi
105 795
141 617
70
fish shows the high local consumption in Sulawesi. For the other provinces a more complex pattern is evident. In
Maluku
167 851
185 450
57
Irian Jaya, 54% of the catch is frozen for export (also 29% of the catch in Maluku). Elsewhere, freezing facilities are
limited. In Nusa Tenggara, drying is the principal method for preservation, with approximately one third of the catch
Irian Jaya
90 860
104 294
42
processed this way.
(Source: Excerpted from Hopley & Suarsono 2000)
(GIWA region 56), but with broad applicability across Indonesian Seas:
population centres. Large-scale commercial operations have also
"Overall, the state of (environmental and socio-economic) assessment
targeted beche-de-mer and shark, and according to the GIWA Experts
of ... fi sheries resources is not very accurate and there is a great amount
there is clear overexploitation of sharks, tuna, billfi sh and other pelagic
of uncertainty. Based on the limited data available it can be concluded
species. Indonesia produces more than 200 000 tonnes of tuna annually
that some of the fi sheries have already reached or surpassed their limits.
(sixth largest global producer and largest in East Asia) (Talaue-McManus
For others, the total lack of information indicates that further expansion
2000). Sharks are also caught as by-catch of the trawl fi sheries (Sharma
would be inappropriate.... It is estimated that 90% of the fi shery eff ort
2000) and the tuna long-line fi shery.
in Indonesia is carried out by artisanal and subsistence fi shermen whose
catches go unrecorded by offi
cial government statistics and it is partly
There has also been a signifi cant increase in eff ort in the pelagic
for this reason that government estimates of annual catches... are
fi sheries, with many foreign boats working in Indonesian waters.
considered to be gross under-estimates".
Poison fi shing for demersal reef fi sh to supply the live fi sh food trade in
Hong Kong, Taiwan and China has burgeoned in the 1990s (Johannes
At present, neither the current status nor the future viability of most
& Riepen 1995, Cesar et al. 2000), with prices increasing but catch per
fi sh stocks are understood, and for many stocks, their status may be
unit eff ort (CPUE) declining sharply. Many of Indonesia's coral reefs
summarised as being Illegal, Unreported, and Unregulated (IUUF) (also
are heavily overfi shed, producing less than 5 tonnes/km2/year (Pauly
see Annex VII). Nevertheless, with fi sh now contributing more than
1989, Pauly et al. 1998), in comparison with the remaining reefs which
60% of animal protein and with increasing per capita consumption
produce of the order of 15-20 tonnes/km2/year. Many of these reefs
and a growing total population, safe biological limits of Indonesian
have been chronically overfi shed over the past several centuries, with
fi sheries in many areas are already being exceeded, with resultant
major loss of production and serious adverse cascading eff ects to other
declines in catches (Hopley & Suharsono 2000). Aquaculture has also
components of the ecosystems (Carlton 1998, Jackson et al. 2001). In
burgeoned in recent years, with a major need for eff ective management
addition to the reduction in population sizes (e.g. major declines
(Chua et al. 1989).
in Bluefi n and Yellowfi n tuna populations) and local extinctions,
overfi shing has led to: decreased CPUE, smaller size fi shes and reduced
For all three sub-systems, many stocks are considered to be exploited
catch sold at markets, high 'by-catch' of rare and endangered species,
well beyond safe biological limits causing severe environmental
decrease in commercially exploited seashells (e.g. spider shells), and
impacts. Overexploited stocks include holothurian sea cucumbers,
degraded habitats through use of destructive methods.
giant clams and Trochus, crayfi sh, many species of reef fi sh such as
groupers, and threatened and endangered species such as sea turtles
Excessive by-catch and discards
and dugong. The benthic invertebrate fi sheries for sedentary species of
Sunda, Wallacea and Sahul
holothurian sea-cucumbers (trepang or beche-de-mer), trochus, green
For all three sub-systems, the present level of environmental impact
snails and clams are overfi shed, particularly around the major coastal
from excessive by-catch is severe. As with Sulu-Celebes (Sulawesi) Sea
ASSESSMENT
49
(GIWA region 56) and South China Sea (GIWA region 54), there is little
relocated to international waters and is now believed to be operating
or no by-catch or discards in the traditional sense, because virtually all
in Indonesian waters with little or no monitoring or regulation.
of the greatly diminished catch including turtles, sharks (FAO 1998),
dugong and whales is kept and eaten. An exception to this is the by-
For the oceanic cetacean species, fi sh by-catch has probably caused
catch produced by foreign fi sing fl eets.
signifi cant reductions in abundance, especially for small cetaceans but
possibly also for large cetaceans such as Sperm whales and Blue whales
Perrin et al. (2002) note that by-catch is the major threat to all marine
(Perrin et al. 2002).
mammals in Indonesian waters, and especially to small cetaceans and
dugong (Box 6), the latter caught unintentionally using gill and mesh
Destructive fishing
nets, dynamite fi shing, ghost fi shing (fi sh caught in lost or discarded
Sunda, Wallacea and Sahul
gear) and bamboo fi sh traps.
For all three sub-systems, the present level of environmental impacts
from destructive fi shing is already severe. Reef bombing remains
The level of marine cetacean by-catch is likely to have increased
widespread and occurs regularly, and has been attributed to increasing
signifi cantly due to the greatly expanded national and foreign
competition among fi shers and corresponding declines in catches. As
fi shing fl eets in Indonesian waters; both long-range long-liners and
detailed in the section on Habitat and community modifi cation above,
drift-netters (e.g. Rossiter 2002). No by-catch monitoring system is
many reefs in the region have also been targeted for the lucrative live
operational, and fi sheries data on sharks and marine mammal species
fi sh food trade in Hong Kong and mainland China (with prime live reef
are particularly poor, there is no indication that this problem has been
fi sh worth 100 USD/kg), initially using potassium cyanide or sodium
addressed in a meaningful or satisfactory way anywhere in the region.
cyanide and more recently using poisons derived locally from plants.
Illegal and unregulated fi shing by distant-water commercial fl eets is a
Poison fi shing has also been used in collection of ornamental reef fi shes
major problem for South East Asian countries (Sharma 2000). Exclusion
for the international aquarium trade. Blast and poison fi shing are illegal
of such vessels from one country's territorial waters all too often simply
but particularly diffi
cult to enforce in remote locations (Johannes &
displaces the problem. An example is the Taiwanese tuna driftnet fi shery
Riepen 1995) (also see the Causal chain analysis and Box 7).
in the Arafura Sea (Perrin et al. 2002). Australia banned this fi shery within
its EEZ after large by-catches of dolphins had been documented. Rather
In spite of the release of poisons into the sea being illegal (since 1995
than ending its operations, however, this Taiwanese fi shery simply
through Law No. 9), as is also the export of some target species, the
extensive returns from the live food fi sh trade mean that cyanide
fi shing is often the technique of choice, especially during the Asian
Box 6
Impacts and threats to marine mammals.
economic crisis. The most productive crest and fore slopes of reefs are
By-catch of cetaceans and dugongs in fisheries is a large and growing problem
in South East Asia. Unless this problem is addressed in an immediate, aggressive
targeted, with target species for the live food trade being Napoleon
manner, major losses of biodiversity are inevitable. Such losses are more than
aesthetic or academic; they eliminate future options for sustainable use, simplify
wrasse (Chelinus undulatus), Barramundi cod (Cromileptes altivelis), Coral
ecosystem structure, and increase the risk of catastrophic declines in marine
productivity, with severe implications for food security. A Regional Action Plan to
trout (Plectropomus spp.) and large grouper (Serranidae) (Pet & Pet-
address by-catch of small cetaceans and dugongs in South East Asia is both feasible
Soede 1999). Spawning aggregation sites are especially targeted and
and desirable. Such a plan should be developed and implemented in a phased
manner, beginning with a public awareness and education phase. While valuable
vulnerable. The cyanide is squirted from plastic bottles by divers either
information on by-catch has been obtained from rigorous interview/questionnaire
studies, accurate assessment of by-catch levels is generally impossible without
in front of large fi sh or more commonly into reef crevices, with the coral
independent on-board or site-based direct observation at a statistically
appropriate scale. To complement data on by-catch, per se, it is important to
often having to be broken to retrieve stunned fi sh. The solution is made
develop accurate quantitative information on characteristics of the fishing
industry, e.g., fleet size, temporal and spatial allocation of effort by gear type. Some
from one to six 20 g tablets dissolved in the bottle and the tablets
approaches to by-catch mitigation will need to be fishery-specific.
cost only 6 USD/kg (Cesar 1996). COREMAP (1997) suggest that up to
The expansion of live-capture operations directed at vulnerable coastal and
riverine small cetaceans may be contributing to the depletion of some local
640 tonnes of cyanide are used each year on Indonesian reefs, about
populations. While it is recognised that exposure to cetaceans in captivity may
benefit conservation in the long-term by changing public attitudes, the frequent
equally divided between the live fi sh trade and the aquarium trade.
claims by live-capture proponents that their facilities are engaged in "captive
breeding" for conservation are generally unfounded and misleading. "Tiger
nets" set in movement passages in Indonesia pose a clear, undeniable threat to
Three scales of operation have been identifi ed by Pet and Pet-Soede
populations of cetaceans and other large marine organisms. Such nets are, by
their very essence, highly damaging to the environment, and their use should be
(1999):
prohibited. The recent evidence linking military sonar activities to lethal mass
strandings of beaked whales gives cause for concern about similar activities in
Large-scale operators working from mother ships with crews of
South East Asian waters. Some kind of risk assessment should be undertaken, and
appropriate mitigation measures should be identified and implemented
about 20, using fl oating cages and land-based concrete holding
(Source: Excerpted from Perrin et al. 2002).
pens. Such operations use about 750 bottles of poison per month
50
GIWA REGIONAL ASSESSMENT 57 INDONESIAN SEAS
Box 7
Destructive fi shing methods in Indonesia.
caryophyllata) may reduce the bleaching eff ect as corals subsequently
The practices and their effects have been widely described. Many of the methods
recover. Without political will to enforce existing laws, even National
have been used for only 50 years or so (blast fishing, cyanide fishing) yet are so
firmly entrenched in the region that they are regarded locally as traditional. They
Parks such as Karimunjawa and Bunaken will continue to be raided by
are practiced especially in the more remote areas of Eastern Indonesia, even in
the cyanide fi shermen (Llewellyn 1999).
totally protected areas such as the Komodo Islands. Fishing methods regarded as
destructive include:
Blast fishing
The bombs, originally made from World War II explosives, are now made with
Accurate fi gures for the live fi sh trade are diffi
cult to obtain as offi
cial
artificial fertiliser (ammonium or potassium nitrate). Schooling reef fish (fusiliers,
records are for gross weights, which often include the water in which
surgeon fish, rabbit fish and snappers) are targeted and bombs thrown from only
5 m distance. Dead and stunned fish are collected by divers often using `hookah'
the fi sh are transported. In the case of ornamental fi sh, both freshwater
equipment. Although illegal, bribery or fishing in unpatrolled waters (or in the
case of Biak, in Irian Jaya, setting off the explosion at the time of incoming aircraft)
and marine fi sh are exported in the same boxes (Suharsono pers.
mean that the practice is rife with travelling Bugis, Bajau, Makassarese and Maduran
fishers most involved. The yield is about 30 kg of fish on intact reefs and 7.5 kg on
comm.). Figures presented in Table 9 for live fi sh exports should be
regularly bombed areas. However, as the fish may be damaged, they fetch about
taken with some reservation. However, a steady decline appears to have
one third lower price than catches by other methods and, as they do not keep as
well are usually sold only on the local market. In East Nusa Tenggara, and probably
set in both the aquarium and food fi sh exports, though whether or not
elsewhere, the practice is most in use during the doldrum seasons (April-May,
October-November), with 20 to 30 explosions heard daily in local areas. Individual
it is as dramatic as the fi gures suggest is dubious.
boats may explode 1 to 3 bombs a day but larger, far-reaching vessels may stay out
up to 10 days and return with up to two tonnes of fish. Damage to the coral reefs is
catastrophic. A single beer bottle bomb can destroy an area of 5 m2, a larger gallon
container up to 20 m2. On regularly bombed reefs coral mortality may be 50% to
Table 9 Live
fi sh exports for Indonesia 1996-1998.
80%, even in national parks. Reefs may take up to 40 years to regain a 50% coral
cover.
Fish export (kg)
Poison fishing and the live fish trade
Type of fish
The use of poisons to stun or kill fish is longstanding in Indonesia. The early Dutch
1996
1997
1998
naturalist Rumphius commented on this practice in the 17th century when crushed
Marine ornamental fish
1 708 751
528 217
166 920
roots and stems containing rotenone were used. However, since the 1960s, the use
of sodium or potassium cyanide has become very common, as it has throughout
Other live fish
3 261 271
1 098 234
741 934
the ASEAN region. Three fisheries all centred on coral reefs are involved:
(Source: Hopley & Suharsono 2000)
- The live fish food industry, almost entirely developed since 1990;
- The ornamental aquarium fish industry;
- The collection of rock lobsters (Panulirus sp.).
(Source: Excerpted from Hopley & Suharsono 2000)
In Johannes and Riepen (1995) forecasted the collapse of the live fi shing
industry in Indonesia and this does appear to be happening in many
(average cruise time) and collect about 2 500 kg of live fi sh per trip.
areas (e.g. Bentley 1999). Reefs with several years of cyanide fi shing are
Income profi t is about 35 000 USD per month. Large operators work
little more than "bleached calcium carbonate deserts" (Pet-Soede &
mainly in more remote parts of Eastern Indonesia where fi sh stocks
Erdmann 1999). Areas such as the Banggian Islands, which have been
still make this scale of fi shing profi table.
fi shed for 10 years or more, are being abandoned for "new" reefs such
Medium-scale operators with about 5 crew on 3 day trips. Usually
as the Togian Islands, Tukung Besi Archipelago and the Banda Sea and
at least 2 `hookah' divers are in the crew. About 15 bottles of
Irian Jaya. This pattern of eastward movement through the Indonesian
poison are used each trip for an average catch of about 20 kg.
Archipelago is similar to that of the blast fi shing industry.
Monthly profi t is about 413 USD. The reefs of the Makasser Strait
are potentially targeted by these fi shers.
Decreased viability of stocks
Small-scale operators, free diving from outrigger canoes. They are
Sunda
limited to inshore shallow reefs and sell their catch from fl oating
The present level of environmental impact from decreased viability of
cages. They earn about 100 USD per month, which is a signifi cant
stocks is severe, however no data is available to support this. According
sum. They use up to 1 kg of cyanide per day.
to the GIWA Experts, aquaculture stocks of the shrimp Penaeus monodon
from North Sumatra have introduced a disease in wild stocks of the Jawa
The eff ects of cyanide fi shing are multiple. Corals are broken retrieving
Sea, causing major mortality there.
fi sh, and a wide range of larvae and small fi sh are killed even by the
low concentrations. Corals are also bleached from the cyanide, at
Wallacea
concentrations far below those used. Pocillopora damicornis exposed
The present level of environmental impact from decreased viability
to 4% cyanide for only 10 minutes bleached within 4 hours and
of stocks is slight in Wallacea. However, there are some developing
9 out of 10 specimens died within 4 days (Johannes & Riepen 1995).
problems arising from the increased occurrence of red tides and
It may take about 30 to 55 years for the corals to recover (Cesar 1996).
diseases spread from aquaculture farms which have aff ected pearl
Erdmann (pers. comm.) has suggested that the use of clove oil (Eugenia
shells, particularly on Ambon and Aru Islands.
ASSESSMENT
51
Sahul
of coral reefs. The economic cost is equally impressive. The total cost
There is no known impact from decreased viability of stocks in the
to Indonesia over the next 20 years is conservatively estimated at
Sahul sub-system.
3 billion USD, or 306 800 USD per km2 of reef where there is a high
potential value of tourism and coastal protection and 33 900 USD per
Impact on biological and genetic diversity
km2 where the potential value is low. The economic loss to Indonesia
Sunda
of ...(poison fi shing) damage is (also) high, quantifi ed at 46 million USD
The present level of environmental impact in the Sunda sub-system on
with the industry collapsing within 4 years by the maintenance of current
biological and genetic diversity is severe. Introduced Tilapia and other
catch levels. Conversely a sustainable hook and line fi sheries option
species have replaced wild stocks of endemic fi shes, with local extinctions
could create net benefi ts of 321.8 million USD. However, with prices
and corresponding changes in community structure and diversity. At least
in Hong Kong for live Napoleon wrasse reaching 60 to 80 USD per kg,
60 freshwater fi sh species are threatened (Daws & Fujita 1999). There has
the incentives are high to maintain this destructive fi shing practice.
also been a clear decrease in heterozygosity in cultured fi sh stocks.
Demand from Hong Kong, China, Taiwan and Singapore continues to
control supply, even as catches decline in size and quality."
Wallacea and Sahul
The present level of environmental impact on biological and genetic
Foreign fl eets that continue to threaten the region, both within and
diversity is slight. However, it was not clear as to the degree to which
outside MPAs (see Box 8) also pose severe socio-economic impacts.
Tilapia and other aquaculture/mariculture species have replaced wild
Key socio-economic issues remain unquantifi ed at the sub-system scale,
stocks of endemic fi shes causing local extinctions and corresponding
but clearly include:
changes in community structure and diversity in the two sub-systems.
Reduced economic returns to poor fi sher families;
The introduced water hyacinths have also caused signifi cant damage
Loss of employment/livelihood to poor fi sher families;
to many freshwater communities.
Confl ict between user groups for shared resources (e.g. between
locals and foreign fi shermen, see Box 9);
Socio-economic impacts
Loss of food sources (e.g. sources of protein) for human and animal
Socio-economic impacts of unsustainable exploitation of living
consumption;
resources were considered having severe to slight impacts, with
Reduced earnings in one area by destruction of juveniles in other
Sunda being the worst aff ected. There are, however, important gaps in
(migrating populations);
socio-economic data (FAO 2000), particularly in relation to commercial
Loss of protected species (e.g. dugongs and turtles, see Box 6);
connections among population centres and peripheries in terms of
Reduced commercial value resulting from tainting (e.g. shellfi sh in
resource extraction, traditional village engagement with the marine
Jawa Sea);
environment and the extent to which police and military are involved
Box 8
Impacts and threats to marine mammals.
in resource extraction, both legally and illegally (Kahn & Fauzi 2001).
For decades now, Indonesia's rich and extensive marine natural resources have
Some fi shermen have been injured or killed from diving and blasting
been plundered at will by foreign fishing vessels. Some operate under official
licenses (purchased from Indonesian middlemen) and even fly the Indonesian flag,
accidents. Fisher families' children are malnourished as more fi sh are
while others simply poach into the vast archipelagic seas, bolstered by the slim
chances of encountering Indonesian Navy vessels and the knowledge that they can
exported. There are few alternative options, particularly on the smaller
usually pay their way out of any inconvenient situations that might arise if they do.
Many are said to simply work with the various enforcement agencies that should be
islands, and the levels of poverty are such that many children are trapped
preventing their activities. As fish wars erupt between nations all over the world,
Indonesia must realise and protect what is potentially its most sustainable and
into becoming fi shermen, often using destructive fi shing practices.
valuable natural resource; its fisheries. In acknowledgement of the importance of
this issue, Minister Sarwono recently suggested that the losses in revenue accrued
to the Indonesian economy as a result of foreign fish stealing may top 4 billion USD!
As noted by Hopley and Suharsono (2000):
Foreign fleets continue to threaten Indonesia's fisheries, including those in national
park(s), albeit in a less direct manner. Fishermen increasingly report conflicts
"The use of explosives in fi shing was introduced into Indonesia by the
with foreign tuna fishermen, and are now actively vandalising foreign fishing
gears when they encounter them (such as long line radio buoys, fish aggregating
Japanese during World War II. It was made illegal in 1985 (Law No. 9,
devices, etc). The local fishermen face a double whammy, with Filipino boats
actively poaching the waters, while Taiwanese, Korean and Hong Kong boats (with
Directorate General for Fisheries) but until the Asian Economic Crisis
official licenses also) work the seas. The latter have greatly increased in number
had seen increasing use because of the perceived economic benefi ts
since the spread of violence in Ambon, when a number of foreign fleets relocated
from Maluku to Bitung as their home port. Unfortunately, as these bigger and
to individual fi shers and boat owners. Crewmembers typically earn
more technologically advanced foreign fleets decimate stocks, fishermen must
travel further and further to catch fish (often 3-5 hours travel outwards by wooden
high salaries (55 to 197 USD per month) and boat owners 1 100 USD
speedboat) and now increasingly resort to spearfishing and gillnetting in order
to catch fish to feed their families. Tourism and fishing, once compatible, are now
per month. In the Spermonde Archipelago up to 15% of fi shers use
increasingly enemies. In large part due to the activities of foreign fishing fleets.
the method, which produces 10 to 40% of the catch over 16 000 km2
(Source: Excerpted from Perrin et al. 2002).
52
GIWA REGIONAL ASSESSMENT 57 INDONESIAN SEAS
Increased risks of disease in commercially valuable stocks (e.g.
to decline rapidly in the near future. The pattern of exploitation has
prawns in Jawa Sea);
been from the north and west, towards the south and east usually in
Inter-generational equity issues (access to resources);
association with the specialised fi shing populations such as the Bajau,
Human health impacts: fi shermen die and many more are injured
Bugis and Makassarese who have not only migrated into the islands
each year from diving accidents (Johannes & Djohani 1997), and
and reefs to the south and east but have also developed considerable
numbers of people aff ected by tainted/poisoned seafood are
mobility for exploitation. In the last 50 years even the most remote
unknown.
reefs have been exploited, and pressures developed have led to
increasing numbers of incursions of Indonesian fi shermen into the
Conclusions and future outlook
territorial waters of Indonesia's neighbours. Simultaneous with this
Levels of fi shing pressure within the region as a whole range from
increasing and spreading trend of exploitation has been a decline in
moderate to severe, providing a complex management challenge,
traditional management practices and increasing tensions between
with important linkages to the application of marine protected areas
local populations and outside fi shers. Many recommendations have
in stock replenishment (Annex VII) (TNC 2000, Pauly et al. 2002). Many
been made by the various project teams working in Eastern Indonesia.
of the region's coral reef and pelagic fi sh have been or are becoming
Some involve changes to fi shing practices, such as banning `hookah'
chronically overfi shed (Figure 12), including major use and increasing
equipment and ensuring compliance with even existing laws. It has
threat of destructive techniques, with major loss of production and
also been noted that there is a need to divert fi shing eff ort from the
serious adverse `cascading' eff ects to other components of the
overfi shed reef resources to the under-fi shed pelagic stocks, but
ecosystems. For example, data from reefs of the adjacent Sulu-Celebes
there are currently no incentives to do this. The far-fl ung and remote
(Sulawesi) Sea region (GIWA region 56) indicate that carnivorous families
characteristics of many of the islands of Eastern Indonesia necessitate
of reef fi sh will not fully recover their pre-fi shed levels of biomass for
management processes which safeguard the livelihood of the people
20 to 40 years after eff ective protection has been implemented, when
at the village level. Community management and secure marine tenure
20 to 25 kg of catch may be taken from 1 000 m2 of reef area annually
creating a recognisable core of stakeholders whose legitimate interests
(equivalent to 20 to 25 tonnes per km2) (A. Alcala pers. comm.).
lie in the care and management of marine resources, appear central to
Similar impacts and threats are occurring to dugong and cetaceans
these processes."
(Perrin et al. 2002).
Because of Indonesia's increasing coastal population, greater
As Hopley and Suharsono (2000) conclude:
commercialisation, decline in fi sh stocks from overexploitation and
"Locally some fi sheries have already collapsed, for example the trepang
destructive fi shing, lack of eff ective regulation and poor or non-
fi shery in West Nusa Tenggara and even the live fi sh trade is forecast
existent enforcement, there is expected to be continuing deterioration
Malaysia
57a - Sunda
57b - Wallacea
57c - Sahul
I
n
d
o
n
e
s
i
a
East Timor
Estimated
threat level
High
Medium
Low
0
500 Kilometres
©
GIWA©
2004
Figure 12 Reefs at risk threat analysis for overfi shing.
(Source: Burke et al. 2002)
ASSESSMENT
53
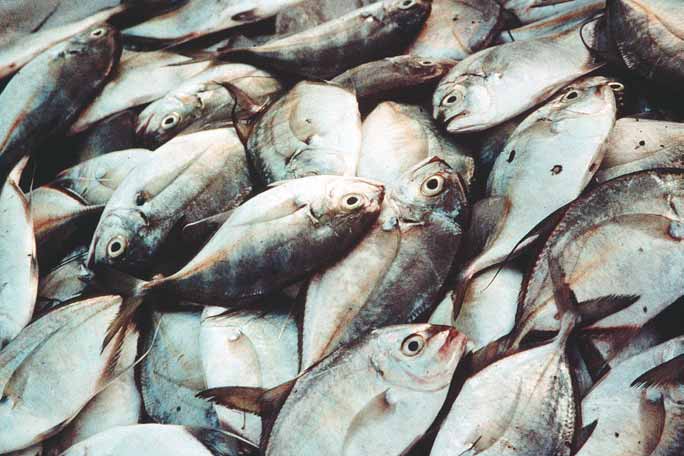
Figure 13 Fish for sale at local market, Unjung Pandang, Sulawesi.
(Photo: J. Oliver, Reefbase)
in fi sheries. This will be manifested mostly through overexploitation,
to deteriorate, remaining severe. Social and other community impacts
lack of by-catch and discards, destructive fi shing and changes in
associated with overexploitation are expected to remain stable and
diversity, and also with the potential for decreased viability of stocks.
severe and health impacts are expected to remain as slight.
Most socio-economic impacts are also expected to deteriorate or at
best remain stable.
The overall environmental impacts of unsustainable exploitation of
living resources in the Sahul sub-system at present is moderate. Three
Environmental impact in Sunda at present is severe, with all fi ve issues
of the fi ve issues unequivocally rated as severe, one issue (decreased
assessed as severe. Environmental impacts of overexploitation are
viability of stock) rated as no known impact and the remaining issue
expected to worsen, similarly with the economic impacts which also
(impact on biological and genetic diversity) was slight although
are expected to deteriorate, remaining as severe. Social and community
contentious among the Task team. As with the Sunda and Wallacea
impacts associated with overexploitation are expected to remain stable
sub-systems, environmental impacts of overexploitation are expected
and severe. Health impacts are expected to remain as slight.
to be severe in the future, although of the three sub-systems Sahul
has the least exploited resources. The economic impacts are expected
The overall environmental impact at present is severe in the Wallacea
to deteriorate but remain at a moderate level of impact. Social and
sub-system. Three of the fi ve issues unequivocally rated as severe, and
other community impacts associated with unsustainable exploitation
two issues (decreased viability of stock and impact on biological and
are expected to deteriorate and health impacts are also expected to
genetic diversty) rated as slight, although their impact was contentious.
deteriorate, but remain as slight.
As with Sunda, environmental impacts of overexploitation are expected
to worsen in teh future. Similarly, the economic impacts are expected
54
GIWA REGIONAL ASSESSMENT 57 INDONESIAN SEAS
Remedial interventions
designed and well-managed MPAs, with improved surveillance and
In a recent assessment of management options, Pet-Soede (2000)
stock assessment and reactive management, should form the core of
has advocated the need for co-management, a decentralised system
the fi sheries management (and marine conservation) strategies. There
creating a feeling of ownership in the local community but fi tting
is extreme urgency for development of a functional MPA network and
into more holistic planning. However, according to Pet-Soede (2000)
an immediate need for substantial no-take zones, with development of
"Implementation of co-management principles remains complex and
enabling policy and legal frameworks.
diffi
cult. Especially the tropical multi-species and multi-gear fi sheries
include socio-economic and socio-cultural processes at the local
Improved education and communication
level and complex legal and regulatory processes at the national and
A sense of stewardship over the resources within all sectors of the
provincial level, that make involving and satisfying all stakeholders in
fi shing industry, including both commercial and subsistence fi shers, is
the management process diffi
cult".
crucial to long-term sustainability. In future, opportunities for audited
and accredited co-management and self-management should develop
Pet-Soede (2000) also points out the need to agree to the current status
and so reduce the overall costs of managing for sustainability. There
of the fi shery. Fishers, fi sheries planners and government all have diff erent
is also a pressing need to educate the consumer side of the industry
perceptions of the status of fi sh stocks although all attribute a general
(both within and outside the region) that there are severe costs to the
decline between 1987 and 1997 (in Spermonde Archipelago, Wallacea)
ecosystems and future sustainability through many forms of extractive
to an increased number of fi shers. "... provincial authorities will not easily
fi shing. Positive change may be fostered by better-informed consumers
fi nd arguments for eff ort restrictions in their offi
cial data statistics, so that
(that is, market demand for products from sustainable fi sheries).
national support for restrictive management will be limited. Moreover, the
current tendency of Indonesia's government to upgrade the fi shery will
Better stock assessment and input for reactive management
make it more diffi
cult for offi
cers to convince managers (of) the need for
Accurate fi eld data and better models of both fi sh stocks and
restrictions of fi shing eff ort. Still, the tendency of fi shers to frequent remote
ecosystem responses to fi shing (Pauly et al. 2002), as well as system
grounds, partly as a consequence of falling catch rates, is already captured
responses to natural changes, particularly climate fl uctuations are
... by the trends in the number of motorised boats. If these data could be
required. The foundation of and input to these models should be
used to rework the presently used number of fi shing trips into a better
built using improved time-series survey-based environmental and
measure for fi shing eff ort, catch statistics will hold a closer relation to the
population data, with major opportunities for regional scientifi c
actual developments in the fi shery. The possibilities to evaluate data for
collaboration.
ecological or physical entities rather than for administrative entities should
be elaborated as their potential already exists" (Pet-Soede 2000).
Given all of the above, four major remedial interventions are required
Global change
to enhance long-term ecological and economic sustainability of the
T
T
T
C
C
C
A
A
A
IMP
Sunda
IMP
Wallacea
IMP
Sahul
fi sheries:
The Indonesian archipelago stands between the Pacifi c and Indian
Improved surveillance and enforcement
Oceans and is infl uenced by annual and inter-annual variations in
Increased use of automated methods of vessel and catch monitoring
surface temperature due to a reversing monsoonal system. Some
may reduce the cost of management and reduce the incidence of
places receive more than 3 000 mm of rain annually. By contrast,
illegal, unregulated or unreported fi shing. This is being addressed in
parts of the lowlands, coastal areas and other areas in rain-shadows
developed nations through use of satellite transponder technology to
receive far less rain (less than 1 000 mm/year), and may experience
identify locations of licensed fi shers, and to thereby aid in detection
severe water shortages, notably islands of Nusa Tenggara to the east
of illegal poaching activities. In Indonesian Seas, this remains a major
of Lombok.
challenge, even within the few MPAs and fi shery reserves.
The entire marine region is a "heat engine" of global atmospheric
Marine protected areas
circulation, with complex ocean-atmospheric dynamics. The warm
MPAs and MPA network strategies are crucial tools for sustainable
ocean and its links to the atmosphere create the El Nińo Southern
fi sheries management and resource protection. Networks of well-
Oscillation (ENSO) phenomenon. The infl uence of El Nińo, La Nińa
ASSESSMENT
55
and the Australian and Asian monsoons contribute to the unique
Considering the extensive damage caused to the world's coral reefs
climate conditions. The region also has complex oceanography, with
as a result of El Nińo driven increases in sea temperature in 1998 and
oceanic input from the Pacifi c and Indian Oceans in the Indonesian
2002 and the implications arising from large-scale coral mortality for
Through-fl ow. The Through-fl ow is thought to be infl uenced by, and
the human population dependent on coral reef resources (Hopley
may infl uence in turn, ENSO. The Through-fl ow exports warm, relatively
1999d, Wilkinson et al. 1999), the impacts of changes in sea surface
fresh (low salinity) thermocline water from the North Pacifi c, providing
temperature were also assessed, as an additional GIWA issue.
a major freshwater source for the Indian Ocean. Strong ocean mixing
infl uences sea surface temperature and nutrient concentrations
At present, there are no known environmental impacts associated with
(Annex VI) (LME 2003). Hopley and Suharsono (2000) provide a useful
increased UV-B radiation as a result of ozone depletion or changes in
summary of these key regional features (see Box 9).
ocean CO source/sink function in any of the three sub-systems. These
2
issues will therefore not be further discussed.
The generally equable characteristics of Indonesian waters
notwithstanding, strong current fl ow associated with the
Changes in hydrological cycle and ocean
Indonesian Through-fl ow and tides can generate major local-scale
circulation
sea temperature anomalies, of the order of 10°C. For example, the
Sunda, Wallacea and Sahul
corner of the Island of Nusa Lembongan in the Lombok Strait east
Changes in the local/regional water balance in recent decades arising
of Bali receives a localised upwelling from the Strait, with sea surface
from global change, and increased variability of current regimes
temperatures of 16°C, compared with 28°C in adjacent unaff ected
(including those caused by changes in ENSO events) have had
waters (DeVantier pers. obs.).
moderate environmental impacts in all three sub-systems. There is
evidence for recent increases in ENSO and other extreme climate
Box 9
Charactestics of eastern Indonesia which aff ect the
events, causing major impacts in Sumatra and Kalimantan (Sunda),
scale and response of climate change.
Seram and the smaller islands (Wallacea) and the island ecosystems of
The Indonesian Through-flow phenomenon
The water properties of both the western Pacific and eastern Indian Oceans are
Sahul, although considerable uncertainty remains. For example, iron
strongly influenced by the through-flow of warm water from the Western Pacific
Warm Pool to the Indian Ocean. Although the complexity of the Indonesian seas
fertilisation by the Indonesian wildfi res during the 1997 Indian Ocean
act as a filter and tranfuser of the water properties of the through-flow, this is
Dipole (IOD) was considered suffi
cient to produce an extraordinary
one of the Earth's most important transfers of energy which influences the global
thermohaline circulation, the distribution of sea surface temperature and the air/
phytoplankton bloom (red tide) causing extensive reef death in the
sea transfers of energy which drive the global atmospheric circulation. Indonesian
Seas inevitably will play (are playing) a role in global climate change.
islands off eastern Sumatra (Abram et al. 2003). This highlights the
El Nińo Southern Oscillation (ENSO) events
potential relation between climate, wildfi re and impacts to coastal
Inter-annual variation in the through-flow especially on the Western Pacific Warm
Pool which forms then retreats eastwards is a major part in the mechanism of ENSO
marine ecosystems. However, van Woesik (2004) has suggested that the
and La Nina events. As some global change predictions incorporate a more forceful
ENSO scenario in their predictions, the environmental perturbations associated
iron fertilisation from wildfi res was not necessary for the coral mortality.
with recent ENSO events may be a guide to future climate. This is especially
important in regions such as eastern Indonesia for which no specific forecasts are
Rather it may simply have been a function of nutrient, temperature and
available. In an El Nińo event, the Western Pacific Warm Pool retracts and there is
reduced outflow through Indonesian Seas to the Indian Ocean. Low rainfall and
sea level change associated directly with the IOD-induced upwelling.
droughts even in equatorial areas such as Kalimantan occur during ENSO events.
The degree to which the IOD upwelling was a natural phenomenon, or
A heat build up in South East Asia occurs before the retreat of the Warm Pool.
Harger believes there is evidence for increasing temperatures in Jawa over the last
linked with global change remains unclear.
100 years which are part of the global trend rather than just an urban heat island
effect. The results of an El Nińo in Indonesia are increased temperatures, especially
between September and November, and also May-June and widespread drought.
The economic consequences of widespread forest fires and crop failure have been
Sea level change
well documented but for coral reefs the major impacts come after the collapse
Sunda, Wallacea and Sahul
of the event. At the start of the contrasting La Nina period, heavy rains fall on hill
slopes poorly protected by reduced vegetation cover. Erosion is rapid and the
Environmental impacts of sea level change at present are slight in the
problems of siltation on coastal reefs are severely aggravated.
The equable characteristics of Indonesian waters
Sunda and Wallacea and unknown in the Sahul sub-systems, with
In spite of the part they play in global climate variability, the Indonesian Seas are
limited evidence of recent and unprecedented fl ooding in low-lying
remarkably equable in their physical and chemical oceanographic conditions. This
is largely because of their equatorial location (and lack of strong seasonality) and
coastal areas of the three sub-systems. As noted above, signifi cant sea
the degree of mixing which takes place as the result of strong tidal currents and
complex bottom topography. The effect is a very small amount of variability in, for
level changes occurred during the 1997 IOD upwelling along the south
example, ocean temperatures, even in shallow coastal waters. Typically sea surface
temperatures range from just over 25°C to just below 30°C and decrease only one
coasts of Indonesia, although the degree to which the IOD was driven
or two degrees with depth. This may be important for Indonesia's coral reefs as
bleaching has been shown to be the result not of absolute temperatures, but of
by global change remains unclear.
temperature variations beyond a norm. Relatively small temperature excursions
may have a potential for severe bleaching responses.
(Source: Excerpted from Hopley & Suharsono 2000)
56
GIWA REGIONAL ASSESSMENT 57 INDONESIAN SEAS
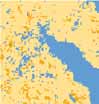


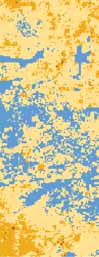


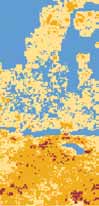

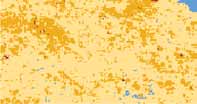


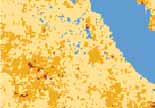


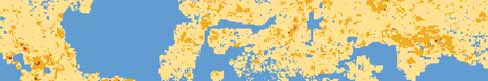


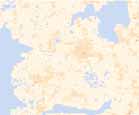

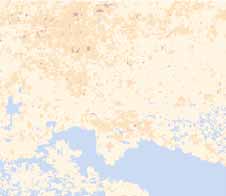
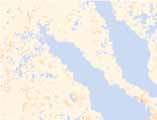

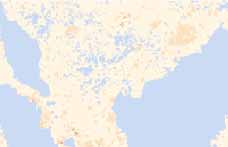


SST anomly during 1998 (°C)
Normal temperature
1-2
2-3
more than 3
Bleaching observation 1998-1999
© GIWA 2004
Figure 14 Sea surface temperature anomalies during 1998 in the Indonesian Seas region.
(Source: Burke et al. 2002)
Changes in sea surface temperature
of freshwaters and salinisation of wells. Damage to coral reefs during
Criteria used for scoring this issue are appended in Annex VI.
coral bleaching events also has the potential for major socio-economic
Sunda and Wallacea
impacts (Wilkinson et al. 1999), and has likely produced economic
Changes in Sea Surface Temperature (SST) are already having moderate
eff ects already. However, defi nite assignment to global change impact
environmental impact in Sunda and Wallacea, with changes in the
is not possible at present.
structure of coral reef communities during coral reef bleaching events
since 1983, notably in Pulau Seribu (Sunda) (Brown & Suharsono 1990,
The key socio-economic indicators remain unquantifi ed at the scale
Glynn 1996) and with increasingly severe and widespread impact since
of the sub-systems but clearly include freshwater availability, with
1998 (Figure 14) (Suharsono 1997, 1999, and reviewed in Wilkinson 2000,
predicted increases in intensity and frequency of ENSO (Timmerman et
2002, Wilkinson et al. 1999, Goreau et al. 2000). As noted above, massive
al. 1999) likely to severely alter rainfall and drought in the region, as well
mortality to coral communities along the south coasts of western and
as food (water) and employment security. Other indicators are changes
central Indonesia occurred during the 1997 IOD (Abram et al. 2003, van
in productivity of agriculture, fi sheries and forestry, linked with ENSO
Woesik 2004), although the degree to which the IOD was driven by
fl uctuations, response costs for extreme events, as foreshadowed by
global change remains unclear.
the major forest fi res and drought in Sumatra and Kalimantan associated
with the 1997 ENSO, loss of income and employment, including foreign
Sahul
exchange from fi sheries, loss of opportunity for investments (both
Changes in SST have had slight impact in Sahul, where the scant
domestic and foreign), and increased costs of human health care.
anecdotal information suggests that reefs have been less aff ected than
in other parts of Indonesia (Veron and Turak pers. comm.).
Conclusions and future outlook
Global change as a whole has had only slight overall environmental
Socio-economic impacts
impact at present in the three sub-systems. Despite the uncertainties,
There are little or no known socio-economic impacts that could be
there is likely to be moderate environmental and slight to moderate
categorically assigned to global change at present in the three sub-
socio-economic eff ects in the future. These will be manifested through
systems, other than some sea level/sea inundation eff ects in low-lying
impacts on freshwater shortage and oceanography (through predicted
coastal villages. There have been considerable economic and health
changes in frequency and intensity of ENSO), and on habitat loss and
eff ects associated with drought and linkages to habitat loss (clearing
modifi cation and fi sheries.
and forest fi res) and freshwater shortage; particularly overextraction
ASSESSMENT
57
The increasing populations in Indonesia will exacerbate local
has forecasted future prolonged drought in certain areas in all three
production of greenhouse gases, compounded by increasing per
sub-systems, however funding for remedial interventions is scarce and
capita release of carbon dioxide and harvesting of timber. However,
it is hoped that international donors will provide additional funds within
there remains considerable uncertainty in climate model predictions of
the framework of the Convention to Combat Desertifi cation.
changes in temperature and sea level. Additional uncertainty is caused
by the region's complex geological dynamics, and also by the capacity
Sea level rise over the next century is predicted to aff ect large numbers
for acclimation and adaptation of species and resilience of ecosystems
of people, with some 2 million people living within a 2 m elevation of
(Done 1999). See also Box 10.
present sea level (Hopley & Suharsono 2000). Sea level rise, even in the
next 50 years, is likely to see the displacement of many coastal villages,
Impacts to freshwater resources and loss of forests from land clearing
especially those on low lying coral islands, particularly in Wallacea.
and desertifi cation are expected to increase, with some 8.1 million ha
Thus, the potential scale of the problem, in terms of total numbers of
inside and 15.1 million ha outside forest areas considered as critical
people likely to be aff ected (but not in terms of proportion of total
land (UN 2002). Continuing land and catchment degradation is largely
population) in future is far greater than that for the atoll island nations
attributable to forest clearing and the eff ects of wildfi res, particularly
of the Maldives or Kiribati, to which much attention has already been
in ENSO years, and the extent of critical land is presently expanding at
drawn. Atolls, such as Taka Bone Rate, have populations of over 20 000
400 000 ha annually. Indonesia is party to the Convention to Combat
whilst smaller coral cays may support villages of at least several hundred
Desertifi cation, and the Ministry of Forestry and Crop Estates has
people (Hopley & Suharsono 2000). Many reef islands may disappear
been designated as the focal point for implementation of appropriate
in 50 years.
policies and interventions. Indonesia is in the initial stages towards
implementing a National Action Program to mitigate land degradation
Coral reef ecosystems are likely to be particularly badly aff ected through
and will also attempt to rehabilitate critical land, soil and water. Up to
predicted changes in SST (bleaching) (Hoegh-Guldberg 1999) and
2003, 2.6 million ha outside and 1.2 million ha inside forest areas were
ocean chemistry (CO source-sink function which aff ects capacity for
2
targeted for rehabilitation. However, to date, success has been marginal,
calcifi cation and reef growth (Kleypas et al. 1999). Recent experimental
in part because of the lack of coordination among institutions involved
studies have demonstrated the controlling function of both parameters
in the programme (UN 2002). The Meteorology and Geophysics Agency
on coral growth and reef development, and the likely importance of
Box 10
The scenario for climate change in Indonesia.
To assess the severity of impact of global change over the next century it is necessary to first identify the most probable scenario of change. The IPCC Third Assessment (IPPC
2001) and other regional data including recent Internet releases by the Commonwealth Scientific & Industrial Research Organisation Australia (CSIRO) are the basis for the
following predictions to 2100.
- Temperature: Although the global temperature increase is between 1.4°C and 5°C, Indonesia's increase will be at the lower end of the scale.
- Sea surface temperature: Again the Indonesian scenario will be far lower than average increases possibly 2°C.
- Rainfall: Both increases (in the wetter areas of Indonesia) and decreases (in the eastern islands) are predicted but most important will be an increase in variability and extreme events
- El Nińo: More frequent and more severe.
- Climate variability: Much greater, meaning that even if average conditions change little, extreme fluctuations will pass natural systems through important thresholds.
- Sea level: Global rise of between 0.1 m and 0.88 m, about 0.5 m is considered the most probable.
The various implications of this scenario with special reference to Indonesia have been discussed by Hopley (1999d), Cox (1999) and Holmes (1999)). Climatic impacts can be
grouped as follows:
- Atmospheric and sea surface temperatures: Likely to affect the zonation of high montane forests and shallow marine ecosystems, especially coral reefs, via bleaching.
- Rainfall, El Nińo and climatic variation: Even without any increase in rainfall, the greater variability and incidence of El Nińo events is likely to produce sequences of drought,
followed by severe flooding and enhanced erosion. Forest fires as occurred in 1997, but also previously occurring in other El Nińo years, including 1982-1983 which burnt 3.7
million ha and in 1991 (see Harger in Tomascik et al. 1997) will become more frequent. All problems associated with increased run-off including sedimentation, nutrient loss
and flooding especially in urban areas in the lower courses of streams will increase. A natural geomorphological response of increasing channel size to cope with higher flood
planes will be seen as serious bank erosion.
- Sea level rise: This will have the greatest impact on Indonesia and its seas, even if limited to only 0.5 m in the next 100 years. More than half of Indonesia's 210 million people
live near the coast. In particular, low lying urban areas need identification, especially where tidal range is negligible for example around the Jawa Sea. Most impacted will be
the numerous low coral reef islands, which will become uninhabitable even if they do not disappear totally. Saltwater intrusion will occur both here and in other low lying
coastal zones. Pressure on Indonesia's coastal population will increase the need for transmigration, and increase the associated social and environmental problems (Kramer &
Simanjuntak 2003 in Hopley & Suharsono 2000). Whilst there may be some positives for coral reefs (e.g. Hopley 1997, Kench & Cowell 2002) other shallow marine ecosystems
will be severely squeezed. The need of mangroves, seagrass beds etc to migrate landward as sea level rises will be blocked by existing human land uses which currently
dominate much of the coast. For example, along the coast of Central Jawa, rice paddies, already protected by embankments, are found immediately behind mangrove
fringes.
Indonesia itself has a pivotal role in future global changes because of its climatic and oceanographic locations. Whilst per head of population, its contribution to greenhouse
gases is low (1995: 0.41 tonnes carbon per capita cf Australia 4.43 and USA 5.27) it does depend on fossil fuels including oil, gas and coal for much of its overseas income and is
thus susceptible to global mitigation policies. Another significant figure is that even as far back as 1980, Indonesia was identified as producing 12% of global emissions from
deforestation (Falk & Brownlow 1989 in Hopley & Suharsono 2000), a figure which can only have increased. Unlike in many developed countries, the full implications of global
(Source: Courtesy of D. Hopley)
58
GIWA REGIONAL ASSESSMENT 57 INDONESIAN SEAS
their synergism in the short-term future of reefs (see e.g. Leclercq et al.
The strong trends of increasing commercial agriculture and forestry
2000, 2002, Reynaud et al. 2003).
are also expected to impact adversely on levels of water pollution,
particularly through increasing use of chemical fertilisers and pesticides
Remedial interventions
and sediment loss to watercourses, streams and rivers. Predicted
Global climate change must be addressed both uni- and multi-laterally
increases in all forms of fi shing are expected to impact adversely on
e.g. following recommendations of the Intergovernmental Panel
both biodiversity and stock replenishment, with severe socio-economic
on Climate Change (e.g. IPCC 1996, 2001) and through international
implications for poor coastal populations. Industrial exploitation,
legislative instruments such as the Kyoto Protocol, when ratifi ed, and
particularly of commercial meso-pelagic fi sheries, is expected to
as with most nations in the region, Indonesia is currently engaged in
increase. Reef fi sheries, while continuing to provide essential sustenance
climate change negotiations. For the forest catchments, concerted
to artisanal fi sherman and their families throughout the region, are
eff orts need to be focused on minimising fi res and other forms of
expected to be placed under increasing pressure to supply commercial
land-clearing (see Pollution, Remedial interventions), particularly
quantities of high value products for export to expanding international,
during ENSO events, through enforcement and education, and
national, and local markets. There are also plans to expand aquaculture
through enhanced development and improved management of
and mariculture operations substantially, with the potential for further
protected areas. For coastal and marine ecosystems, the strategy for
adverse impact to coastal habitats.
an integrated network of MPAs, some of which are purpose-designed
to best mitigate changes in SST (Salm & Coles 2001, West & Salm 2003),
Given the above, total pressures on international water resources
needs to be adopted as a matter of extreme urgency.
are likely to increase moderately to severely over the next 20 years,
most severely in the more developed areas of Jawa and Sunda,
causing signifi cant deterioration in both the environment and socio-
economic structures, despite improved regulation. The worst aff ected
Priority concerns for further
areas are expected to face severe environmental impacts and severe
analysis
socio-economic hardship in the future. Despite major advances and
improvements since the 1970s, there remains a lack of capacity for
Future scenarios for Indonesia as a whole suggest a human population
eff ective policing or enforcement of regulations or for developing
increase of between 1 to 4% (1.8% nationally from 1980-1998, declining
measures for alleviation of existing water-related problems. There
to 1.2% from 1998-2015) per year to more than 250 million by 2015 (World
are already serious health issues arising from episodic freshwater
Bank 2003). The population is expected to double, to some 400 million, by
shortage and habitat loss in some areas. The rate of deterioration can
2035, with increasing urbanisation and increasing reliance on extractive
be minimised by on-going and future planned interventions, including
industries. Conversion of agricultural to non-agricultural land is a major
those at multi-lateral, national, provincial and local government levels
issue, with urban areas increasing by some 367 500 ha from 1980 to 1995,
and through the concerted eff orts of NGOs. Nonetheless, continuing
an average increase of some 25 100 ha per year (UN 2002).
international assistance will be required in the short-term for major
improvement in international waters-related issues and concerns.
Within the region, population trends should be similar to the
national average, although with higher population growth among
There are expected to be substantial diff erences among the three sub-
poor agricultural and coastal communities likely to have important
systems in terms of their future trends in population/demographics,
implications for most international waters concerns, from land-
consumption and output, sectoral composition, use and impacts.
conversion to fi sheries. The increasing urbanisation will impact on
both freshwater shortage and pollution as growth is expected to
In the Sunda sub-system the total pressures are expected to increase
outpace successful interventions. International trade is expected
considerably, primarily because of increasing population pressures,
to increase signifi cantly, and there are also likely to be signifi cant
despite major improvements in coordination, application and
increases in mining (with potential for expanded off shore oil and
enforcement of regulations. This increase in total pressures is expected
mineral exploration), artisanal and industrial fi shing, various forms of
to cause socio-economic hardship, particularly to rural and poor urban
plantation agriculture and forestry, and production of manufactured
populations, but with improved awareness and interventions (e.g.
goods. There will be limits on other sectors from freshwater shortage,
health care, protected areas, fi sheries monitoring systems).
loss of habitats and fi sh and other concerns.
ASSESSMENT
59
In the Wallacea and Sahul sub-systems the total pressures are expected
In the Wallacea sub-system the concerns were prioritised as follows:
to increase moderately. There are expected to be improvements in
1. Habitat and community modifi cation
coordination among diff erent government levels and with NGOs
2. Unsustainable exploitation of fi sh and other living resources
although the expected improvements in regulations will still have
3. Freshwater shortage
local level diff erences in application. The increasing population, and
4. Pollution
increasing demands by multi-national industrial fi rms (mining, forestry,
5. Global change
plantation agriculture, aquaculture) will cause a moderate increase
in impacts on catchments, rivers, coastal and oceanic waters despite
There was an unambiguous overall prioritising of the fi ve GIWA
improved regulations and enforcement. This is expected to cause
concerns in this sub-system. Habitat loss and community modifi cation
moderate to severe socio-economic hardship, particularly to the
was of highest priority, with severe levels of environmental, economic
mostly rural population but with some improvement in awareness
and other social and community impacts. There was considerable
and interventions.
uncertainty in regard to the levels of health impact from Habitat and
community modifi cation. Unsustainable exploitation of fi sh was of near-
Prioritisation of the GIWA concerns was achieved through assigning
equal priority, followed by Freshwater shortage. Pollution, with only
equal weight to environmental, economic, human health and social and
slight to moderate present levels of impact, was of fourth priority and
community impacts in each of the three sub-systems.
of much less concern than Sunda. Global change was of fi fth priority,
with only slight present environmental and socio-economic impacts.
In the Sunda sub-system the concerns were prioritised as follows:
The international waters environment and socio-economy of Wallacea
1. Pollution
are presently in better condition than those of Sunda. Nonetheless,
2. Freshwater
shortage
moderate to severe impacts are already occurring, and will continue
3. Habitat and community modifi cation
from Habitat and community modifi cation and Unsustainable
4. Unsustainable exploitation of fi sh and other living resources
exploitation of fi sh and other living resources (as exemplifi ed by
5. Global
change
coral reefs, Figure 2 in Regional defi nition) and are a major focus of
government and NGO interventions.
At present, four of the fi ve GIWA concerns are already severe. Pollution
was of highest priority, followed closely by Freshwater shortage, Habitat
Because of the ongoing and planned interventions, there is expected
and community modifi cation and Unsustainable exploitation of fi sh and
to be a stabilisation of some environmental impacts of Habitat
other living resources. Global change was of fi fth priority, with only
and community modifi cation in the Wallacea sub-system, but with
slight environmental and socio-economic impacts. It is clear that the
continued deterioration in stocks of fi sh and other living resources,
international waters environment and socio-economy of Sunda are
Freshwater shortage, Pollution and Global change. Unsustainable
already under severe impact, and this will worsen, as exemplifi ed by
exploitation of fi sh and other living resources, Habitat and community
coral reefs. Continued interventions are urgently needed for any chance
modifi cation and Freshwater shortage all assessed as having moderate
of amelioration in the short to medium-term.
to severe future impacts. Pollution and Global change were of less
priority.
Even with ongoing and planned future interventions, there is still
expected to be deterioration in the environmental and economic
In the Sahul sub-system the concerns were prioritised as follows:
impacts in the Sunda sub-system, with stabilisation/improvement
1. Unsustainable exploitation of fi sh and other living resources
in some health and other social and community aspects. Pollution
2. Habitat and community modifi cation
scored the maximum value, followed closely by Habitat and community
3. Pollution
modifi cation, Unsustainable exploitation of fi sh and other living
4. Freshwater shortage
resources and Freshwater shortage. Global change is expected to have
5. Global change
moderate environmental and other social and community impacts and
minor economic and health impacts in the future. Future impacts from
There was an unambiguous overall prioritising of the fi ve GIWA
Global change were suffi
ciently uncertain for this to remain as the least
concerns. Unsustainable exploitation of fi sh and other living resources
of the concerns.
was of highest priority, with moderate to severe levels of environmental,
economic and other social and community concerns. Habitat and
60
GIWA REGIONAL ASSESSMENT 57 INDONESIAN SEAS
community modifi cation ranked second, being of equal priority from
environmental impact, but of less priority in socio-economic terms.
Pollution and Freshwater shortage were of third priority, followed by
Global change, with only slight environmental and socio-economic
impacts. The international waters environment and socio-economy of
Sahul are in better condition than either Wallacea or Sunda, primarily
because of the relatively small population (less than 10 million people).
Nonetheless, environmental impacts of Unsustainable exploitation of
fi sh and other living resources and Habitat and community modifi cation
require intervention.
There is expected to be future deterioration in most concerns in
the Sunda sub-system. Unsustainable exploitation of fi sh and other
living resources remained as highest priority, followed by Habitat and
community modifi cation and Pollution. Global change was of fourth
priority followed by Freshwater shortage.
Owing to the severe environmental and socio-economic impacts across
much of Indonesian Seas, scoring highly in all three sub-systems, and
the major transboundary infl uence of the live food fi sh and aquarium
trades which promote the use of destructive fi shing practices,
particularly poison fi shing using cyanide, Unsustainable exploitation
of fi sh and other living resources was prioritised for further analysis.
Potentially strong linkages were identifi ed among all major concerns.
Global change eff ects on Freshwater shortage are likely to be
manifested through changes in the frequency and intensity of ENSO
events. During the 1990s, ENSO caused water shortages in some parts
of the region and fl ooding in others, and future predicted increases
in ENSO are likely to have major environmental and socio-economic
impact, particularly given that the human population is expected to
double by 2035. The eff ects of global change on habitats are predicted
to be manifested through both freshwater shortages (drought and
associated forest fi res) and fl ooding, particularly in lowland stream,
river, marshland and riparian communities. Potentially severe global
change eff ects are also expected for coral reef habitats, through
the synergistic eff ects of changes in ocean alkalinity aff ecting reef
calcifi cation processes and through elevated SSTs causing widespread
coral bleaching and death (Hoegh-Guldberg 1999, Kleypas et al. 1999,
Leclercq et al. 2000, 2002, Reynaud et al. 2003). There are also expected
to be severe consequences from complex linkages between Habitat
and community modifi cation and Unsustainable exploitation of fi sh and
other living resources and Pollution and Unsustainable exploitation of
fi sh and other living resources.
ASSESSMENT
61
Causal chain analysis
This section aims to identify the root causes of the environmental
System description
and socio-economic impacts resulting from those issues and
concerns that were prioritised during the assessment, so that
The key aspects of the system are described in detail in the Regional
appropriate policy interventions can be developed and focused
defi nition and Assessment (Habitat and community modifi cation and
where they will yield the greatest benefi ts for the region. In order
Unsustainable exploitation of fi sh and other living resource) sections.
to achieve this aim, the analysis involves a step-by-step process
The coral reef fi shery resources of Indonesian Seas, as with much of
that identifi es the most important causal links between the
South East Asia in general, have been heavily targeted by the live fi sh
environmental and socio-economic impacts, their immediate
food trade since the early 1990s, to supply primarily Chinese markets
causes, the human activities and economic sectors responsible
in Hong Kong, Shanghai, Taipei and other major cities. A secondary
and, fi nally, the root causes that determine the behaviour of those
fi shery to supply ornamental species for the global aquarium trade has
sectors. The GIWA Causal chain analysis also recognises that,
also targeted these areas. The ornamental and aquarium trade is an
within each region, there is often enormous variation in capacity
international, multi-million dollar industry with 36% of the global trade
and great social, cultural, political and environmental diversity.
coming from South East Asia (UNEP/WCMC 2004).
In order to ensure that the fi nal outcomes of the GIWA are viable
options for future remediation, the Causal chain analyses of the
The live food fi sh and ornamental aquarium fi sheries in the region and
GIWA adopt relatively simple and practical analytical models and
elsewhere are destructive because of the widespread use of sodium
focus on specifi c sites within the region. For further details, please
cyanide and/or potassium cyanide and/or various other soluble plant-
refer to the chapter describing the GIWA methodology.
derived poisons to narcotise the fi sh. In Indonesia, cyanide is widely
used to capture both live reef food fi sh and aquarium fi sh. Weber
The Causal chain analysis for Indonesian Seas is focused on Unsustainable
(1998) assessed the status of some 200 fi sheries around the world and
exploitation of fi sh and other living resources, and the issue destructive
concluded that the live reef fi shery of South East Asia is one of the most
fi shing practices. This concern and issue was chosen as it has severe
threatened fi sheries on the planet.
environmental and socio-economic impacts across much of Indonesian
Seas, scoring highly in all three GIWA sub-systems (Sunda, Wallacea and
The poisons used to capture the fi sh have the detrimental side-eff ect
Sahul). Within the context of destructive fi shing, one method; poison
of also poisoning and usually killing the non-target, sessile, sedentary
fi shing to supply the live food fi sh and aquarium trades, is of particular
and site-attached reef species in the vicinity, most notably the corals
future concern. It has major transboundary implications, both in terms
(Johannes & Riepen 1995). This has caused loss of considerable coral
of target species populations and replenishment, and in terms of the
cover in many areas of Indonesian Seas and elsewhere in the greater
driving forces, and is thus the main focus of the following causal chain
South East Asian region, with secondary and tertiary eff ects on the
analysis. The other major immediate causes of destructive fi shing;
structure and function of the associated coral reef communities.
blast fi shing, muro-ami and inappropriate trawling, are not explicitly
considered in this causal chain, although many of the immediate,
There has been rapid expansion of the live fi sh trade in Indonesian Seas
intermediate and root causes are similar.
over the past two decades, since concerns were fi rst raised in the early
62
GIWA REGIONAL ASSESSMENT 57 INDONESIAN SEAS
1990s (see Johannes & Riepen 1995 for initial review and Pratt 1996). The
is complex. Involving several tiers of trade, the characteristics vary...
offi
cial export information demonstrates that exports from South East
and have changed over time. Although the fi shery began with foreign
Asia increased from some 400 tonnes in 1989 to more than 5 000 tonnes
vessels and crew, there was a rapid turnover to local operations...
in 1995. However, by 1996 there was a 22% decline in recorded exports,
Exporters found it cheaper to employ locals."
suggesting overfi shing (Bentley 1999). Of the total exports, Indonesia
accounted for some 60% from 1990-1995.
The mode of export has also changed and diversifi ed in recent years,
from various forms of ship-based transport to the more widespread use
History of the Indonesian fi shery is traced back to the late 1970s and
of airfreight, with exports by air from Indonesia rising from 5% to 40%
early 1980s, when reefs of western provinces (Sunda) were targeted.
from 1991 to 1995 (Bentley 1999, Cesar et al. 2000).
As these reefs were progressively overexploited, the rich resources of
eastern Indonesian reefs (Wallacea and Sahul) were targeted and by
The causal chain for the issue of destructive fi shing/poison fi shing
1993 accounted for more than 75% of all recorded exports (Bentley
shares many similarities across the three Indonesian Seas sub-systems,
1999). Refl ecting the regional reduction in exports in 1996, exports
as indeed with neighbouring regions of Sulu-Celebes (Sulawesi) Sea
from eastern Indonesia dropped by more than 450 tonnes that year.
and South China Sea.
For example, Johannes and Riepen (1995) wrote: "...the information...
paints an alarming picture of the extent and impact of the trade...the
volumes of fi sh being traded are a poor indicator of the magnitude of
the trade's environmental impact...because of the extensive collateral
Causal chain analysis
environmental destruction the trade is causing".
The Causal chain analysis was founded in the extensive background
The full extent of poison fi shing in Indonesian Seas is unknown
knowledge and publications of the GIWA Task team and additional
(Johannes & Riepen 1995, Burke et al. 2002), because it targets some
information provided by various government agencies, academic
of the most isolated coral reefs where little if any scientifi c work has
institutions, NGOs and other agencies, as cited herein (also see
been conducted. However, in conducting a detailed threat analysis of
Annexes VII and VIII). Nonetheless, some large gaps in information
destructive fi shing in South East Asia, Burke et al. (2002) identifi ed many
remain. In particular, there is a serious lack of long-term socio-
of the reef areas of Sulawesi (Wallacea), off shore areas of the Jawa Sea
economic data on human use patterns. Figure 15 illustrates the
and Sumatra (Sunda) and areas off Papua (Sahul) as all facing the highest
causal links for destructive fishing practices in the Indonesian Seas
level of threat. As noted by Bentley (1999): "The live food reef fi sh trade...
region.
Impacts
Issues
Immediate causes
Sectors/Activities
Root causes
Environmental:
Poison fishing
Fishing
Destructive fishing
Knowledge
Depletion and local
practices
- Lack of education and awareness
extinctions of species
Death of corals and other
species
Technological
Habitat destruction
- Easy access (or readily available)
to
material
Socio-economic:
Conflicts among resource
Governance
users and stakeholders
- Inadequate policy/management
- Low enforcement of legislation and
Development of large
corruption
holding pens in many
harbours
throughout
Indonesia
Economic
Reduced subsistence food
- Market demand
supply
Loss of employment/
livelihood
Loss of food sources
Demographic
Reduced earnings
- Poverty and population
Inter-generational equity
issues
Human health impacts
Figure 15 Causal chain diagram illustrating the causal links for destructive fi shing practices.
CAUSAL CHAIN ANALYSIS
63
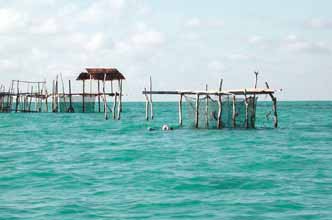
Environmental impacts
Immediate causes
Depletion and local extinctions of targeted and non-targeted
Poison fi shing
species;
The topical application of the poison; various forms of cyanide and
Death of corals and other sessile, sedentary and site-attached
other poisons, usually by surface-supplied ´hookah divers´ using
species, with concomitant changes in community structure;
easily prepared `squirt bottles' (usually old detergent bottles or similar)
Loss of coral cover, with eff ects on the structure and function of the
directly in the vicinity of the target species allows for ease of collection.
associated coral reef communities.
The poisons are cheap to purchase and widely available; so this is not
limiting the spreading of the fi shery.
Socio-economic impacts
Confl icts among resource users and other stakeholders and foreign
The divers often work at night, when most species of target fi sh are
vessels involved in the live reef fi sh export trade;
more easily collected, systematically removing fi sh (either food fi sh or
Development of large holding pens in many harbours throughout
ornamental aquarium species) along entire reef slopes. Concurrently,
Indonesia (Figure 16);
the input of hundreds of tonnes of cyanide and other poisons per year
Reduced subsistence food supply through reduced Catch Per Unit
to Indonesia's coral reef communities, particularly targeting the larger
Eff ort (CPUE) to small-scale local village fi shermen;
brood-stock and spawning aggregations of reef-associated fi shes, has
Loss of employment/livelihood among local village fi shermen;
had disastrous consequences both for the populations of the target
Loss of food sources (e.g. sources of protein) in parts of
species themselves, and for the incident reef communities. The removal
Indonesia;
of brood-stock and targeted collection of spawning aggregations has
Reduced earnings in one area by destruction of juveniles and brood
resulted in broad-scale depletion of reproductive stocks and likely
stock in other areas;
major decline in reproductive output and recruitment back to the
Inter-generational equity issues (access to resources) among poor
fi sheries. This is now beginning to be evidenced in the reduction in
local fi sher families;
large fi shes and relatively high number of small-size fi shes being sold
Human health impacts, particularly to divers.
at local markets.
On the one hand, the live food fi sh and aquarium trades have become
highly organised over the decade since the early 1990s, with large
operations of up to 20 `hookah divers' with air supplied from the
surface working together in dories operating from larger vessels to
supply the lucrative Chinese and developing global markets. On the
other hand, small-scale village operators also deplete their local reefs,
either to supply visiting buyers or to support their own or other villagers'
aquaculture activities, particularly for reef groupers (Serranidae). Thus,
there are both highly commercial and `subsistence' aspects to the
trade.
Root causes
Figure 16 Live fi shholding pens, Anambas & Natuna Archipelago,
The current harvesting practice of the trade is unsustainable (Johannes &
Indonesia.
Riepen 1995, Burke et al. 2002). Poison fi shing remains the predominant
(Photo: J.L.N. Sivasothi, Reefbase)
technique for reef fi sh capture in Indonesian Seas. The economic
benefi ts for the fi shers themselves are minimal, with the greatest profi t
There is strong and unequivocal evidence for all of the above
margins limited to the middle men and restaurant points of sale (e.g.
indicators in the ecological data and in socio-economic assessments
in Hong Kong). The live reef food fi sh trade (particularly in China) and
conducted as part of various MPA and coral reef management projects
ornamental aquarium trade (global) are lucrative industries where reef
(e.g. Komodo National Park, Bunaken National Park, COREMAP project
food fi sh can fetch prices of up to 100 USD/kg and ornamental species
(see also Annexes VII, VIII).
(e.g. reef angel fi sh) more than 100 USD per pair. For the very rarest
of ornamental species, prices in the thousands of USD have been
64
GIWA REGIONAL ASSESSMENT 57 INDONESIAN SEAS
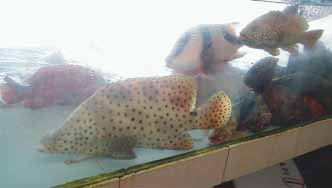
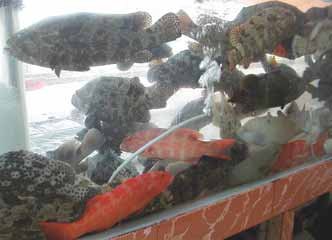
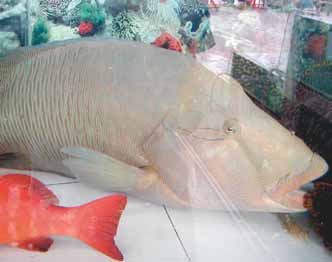
charged (DeVantier pers. comm.). Between 1996 and 1999, the share
of `if not me then someone else will do it' has led to the `Tragedy of the
of the United States ornamental fi sh market coming from South East
Commons' situation common and almost axiomatic in many fi sheries
Asia increased from 67-78% (US Fish & Wildlife Custom declarations
worldwide.
unpubl. data).
Technological
Knowledge
Easy access to (or readily available) material
Lack of education and awareness
The ready availability of the poisons (e.g. from electro-plating industry)
Destructive poison fi shers often have little education and lack awareness
has contributed to their widespread use. Training has also been
and appreciation of the environment. Many fi shermen in Indonesia have
provided to locals by the exporters in some areas.
only rudimentary education and little to no basic understanding of
the ecology of the fi shes or indeed coral reefs generally. Because of
Economic
their poverty, the fi shermen have little option than to participate in
Market demand
the fi shery when off ered comparatively lucrative returns for their eff ort.
The almost insatiable market demand for live seafood, particularly from
Moreover, there is a widely held misconception amongst fi shers that the
China and from Chinese people in other areas, has created a class of
use of destructive fi shing is better because it yields a bigger catch for
willing fi shers who will use any fi shing methods to achieve goals of
the least eff ort. The coincident widespread lack of awareness about the
maximum yield at the minimal eff ort. Both the commercial (export)
destructive aspects of the fi shery, combined with the typical viewpoint
and local (grow-out for mariculture) ends of the live fi sh market off er
comparatively lucrative rewards for eff ort, relative to hook-and-line and
trap fi shing (the other main modes of supplying live fi sh) (Bentley 1999).
This demand is largely focused on a few groups of reef fi shes. Notable
are the food fi sh groupers Serranidae (Figure 17), especially various
species of Coral cods (Epinephelis spp. and Cephalopholis spp.), Coral
trout (Plectropomus spp.) and the Barramundi cod (Cromileptes altivelis)
(Figure 18), snappers (Lutjanidae) and emperor bream (Lethrinidae)
and the labrid Maori wrasse (Chelinus undulates) (Figure 19). The
ornamental aquarium trade tends to target the gaudy site-attached
or home-ranging fi sh species, particularly the angelfi shes, tangs,
anemone (clown) fi shes and butterfl y fi shes. The lack of accountability
and responsibility, both among fi shers themselves and in some cases
Figure 17 Live reef fi sh, including large groupers Epinephelis and
Plectropomus spp. for sale in restaurants, Hong Kong.
(Photo: C. Cheung)
Figure 18 Live reef fi sh, including Barramundi cod Cromileptes
Figure 19 Live reef fi sh, including Maori wrasse Chelinus
altivelis for sale in restaurants, Hong Kong.
undulatus for sale in restaurants, Hong Kong.
(Photo: C. Cheung)
(Photo: C. Cheung)
CAUSAL CHAIN ANALYSIS
65
at the point of sale and the absence of any eff ective education and
These are strong driving forces behind most negative environmental
awareness campaigns or surveillance and enforcement, exacerbates
and socio-economic impacts of fi sheries in the region. The dependence
the situation.
of most of the coastal people on their fi sheries resources, for their
subsistence on the one hand and for hard currency on the other, is
Governance
so strong that most resources will be extracted unless alternative
Inadequate policy/management
livelihoods and other concerted long-term interventions, at the scale
The administrative structure has traditionally been cumbersome,
of the region, are implemented, far beyond those that are already
divisive and top heavy. Until very recently (e.g. Butarbutar et al. 1999),
occurring.
power has rested almost exclusively with a multitude of central
government agencies with provincial, regional and village levels
Providing alternative livelihoods for poor coastal people can be diffi
cult,
poorly equipped to take on any signifi cant responsibility, being little
as they need to be convinced that they would get a better deal with a
recognised in the legislative process. Legislation and regulation has
new initiative. An example of this is poison fi shing, whereby the fi shers
traditionally favoured exploitation of coastal and marine resources
need to be convinced that: (i) a new (less destructive) method will
rather than conservation (Annexes III-IV). Additionally, there are
yield the same if not better catch; and/or (ii) removal of unsustainable
inadequate resources and capacity to develop policy and legislation
numbers of fi sh, including brood-stock, will cause collapse of the fi shery,
more suited to addressing the identifi ed impacts or to eff ectively
threatening both their own and their childrens' future livelihoods.
execute relevant existing legislation.
Recent attempts at developing alternative livelihoods, including some
These diffi
culties are exacerbated by the civil strife that has developed
forms of ecologically-sustainable mariculture of species where all life-
in some parts of Indonesia, particularly since the 1990s, and also by
cycle stages have been `closed' to exclude the need for wild-capture,
the three-tiered government system. National, provincial and local
and where food is sourced non-destructively (e.g. not trash fi sh from
government levels are not well integrated in many areas in terms of
benthic trawling), are proving successful on small-scale trials (e.g. Hon
making best use of the existing legislation. As a general rule, even where
Mun MPA, Nha Trang, Vietnam, in GIWA region 54 South China Sea).
legislation is in place at provincial and local levels, surveillance and
enforcement agencies have little or no capacity to implement it, except
in a few small MPAs receiving both government and NGO support (e.g.
Komodo National Park, Bunaken National Park) (Annexes VII and VIII).
Conclusions
Low enforcement of legislation and corruption
In summary, constraints which have retarded Indonesia's coastal and
The lack of capacity in enforcing legislation has contributed to the
marine management include (Hopley & Suharsono 2000):
establishment and continued increase in destructive fi shing (e.g.
Lack of integration both vertically between diff erent tiers of
Susiloweti 1998). This is exacerbated by widespread corruption and the
government and horizontally between a wide array of agencies;
fact that many destructive fi shing activities are carried out in remote
Lack of a conservation ethic and political will;
places, whereas enforcement capability is largely restricted to the few
Social and cultural constraints resulting from low levels of awareness,
well-managed MPAs (e.g. Komodo, Bunaken National Parks).
education, community participation in the management process,
and high levels of poverty which limit the alternatives to activities
Demographic
such as destructive fi shing;
Poverty and population growth
The weaknesses of the marine protected area system;
The coastal fi shing communities of Indonesia, as indeed throughout
Insuffi
cient scientifi c, social and cultural data for eff ective
much of South East Asia, are often characterised by large families, high
management and lack of access to the data which is available;
populations and extreme poverty. Coastal communities in general are
Insuffi
cient human resources leading to lack of implementation of
the poorest in Indonesia. With low incomes, lack of access to credit, a
laws, regulations and management plans.
lack of opportunity for alternative incomes and a general lack of social
infrastructures, these communities contribute to the environmental
Destructive fi shing, and particularly poison fi shing to supply the highly
decline, and through their subsistence activities are pushing many coastal
lucrative international live fi sh food trade and ornamental aquarium
resources beyond their sustainable limits (Hopley & Suharsono 2000).
trade, is an increasing problem (Pratt 1996, Barber & Pratt 1997) that
66
GIWA REGIONAL ASSESSMENT 57 INDONESIAN SEAS
impacts all three sub-systems, both in terms of fi sheries and habitat loss.
The most signifi cant root causes are the interactions among population
growth, poverty and market trends, notably the insatiable international
demand for live seafood. Population growth is exacerbating
unemployment and poverty, which are placing greater pressure on
stocks of fi sh and other living resources. Lack of enforcement of laws
governing destructive fi shing, abetted through corruption within
enforcement agencies and some government offi
cials, allows the
illegal fi shing practices to fl ourish. Economics and market trends drive
the unsustainable use of resources and also infl uence corruption and
the illegal practices.
Key government departments, including the enforcement agencies,
are hampered by a lack of qualifi ed and experienced staff , and also by
funding shortfalls and cutbacks in part related to currency depreciation
and shifts in government spending. Despite a recent trend towards
decentralisation in governance, there remains insuffi
cient capacity for
eff ective stewardship and control of the renewable resources. What
is currently lacking is coordination and capacity to apply the existing
legislation, particularly at local government levels, and to review and
amend the legislation to improve its functionality, particularly cross-
sectorally and at provincial and local levels.
CAUSAL CHAIN ANALYSIS
67
Policy options
This section aims to identify feasible policy options that target
Management is, in accordance with national policies and objectives:
key components identifi ed in the Causal chain analysis in order
To raise income and standard of living of small-scale fi shermen and
to minimise future impacts on the transboundary aquatic
fi sh farmers;
environment. Recommended policy options were identifi ed
To increase productivity of fi shing eff ort and to boost national fi sh
through a pragmatic process that evaluated a wide range of
production;
potential policy options proposed by regional experts and
To
increase
fi
sh
consumption;
key political actors according to a number of criteria that were
To increase export of fi sh products;
appropriate for the institutional context, such as political
To have better control of the utilisation and management of fi sh
and social acceptability, costs and benefi ts and capacity for
resources.
implementation. The policy options presented in the report
require additional detailed analysis that is beyond the scope
However, these objectives are not necessarily the most appropriate
of the GIWA and, as a consequence, they are not formal
for either long-term ecological and economic sustainability or
recommendations to governments but rather contributions to
conservation of habitats, as demonstrated by a recent analysis by The
broader policy processes in the region.
Nature Conservancy presented in Annex VII.
Important policy issues
There are already severe environmental and socio-economic
impacts from unsustainable exploitation of fi sh, and particularly
Definition of the problem
destructive fi shing, in the region as a whole.
The environmental and socio-economic impacts are expected to
The GIWA region Indonesian Seas is at the centre of the world's
continue to worsen over the next 20 years, except in the few well-
marine biodiversity, supports a rapidly growing coastal population,
managed MPAs (e.g. Komodo National Park, Bunaken National Park),
and has rapidly deteriorating marine ecosystems with the
where strong surveillance, enforcement, education and alternative
likely imminent collapse of many of its coral reef and pelagic
income generation programmes are already being implemented.
fi sh populations. As detailed in the Assessment section above,
The human population is growing rapidly, with widespread religious
destructive fi shing contributes to overexploitation as well as habitat
and cultural traditions fostering large family sizes, exacerbated by
loss and modifi cation (McManus et al. 1997). The two major forms
inadequate policy focus towards developing and implementing
of destructive fi shing in the Indonesian Seas region, poison and
population stabilisation strategies.
blast fi shing, are already illegal, with the overall management of fi sh
There are more than 16 million fi shermen in the region and many
stocks overseen by the Directorate General of Fisheries under the
coastal people rely on subsistence level fi shing for survival.
Ministry of Fisheries and Marine Aff airs (Kahn & Fauzi 2001) (see also
There is widespread continued use of inappropriate (destructive)
Annexes III-V).
fi shing methods and clear evidence of impending collapse in the
ecological sustainability of the reef fi sheries sub-sector.
68
GIWA REGIONAL ASSESSMENT 57 INDONESIAN SEAS
Most of the target reef fi sh populations are transboundary,
Construction of the policy
occurring on reefs throughout the central and western Indo-Pacifi c,
options
many of which have also already been severely overexploited,
leading to major reductions in eff ective population sizes and overall
At present, policy and legislation are neither suffi
ciently well developed
reproductive output and local extinctions.
nor integrated to facilitate implementation of the most urgent remedial
As elsewhere, the political situation is focused strongly on the
measures, particularly in relation to co-management of renewable
short-term (5 year cycles) rather than on developing longer term
marine resources and protected areas. Addressing the synergistic
strategies.
impacts of population growth, political instability and widespread
Recent political instability, fuelled in part by religious confl icts
poverty (Djohani 1998, 1999) among coastal populations in an
and separatist movements, with related civil strife and increased
integrated way (Kusumaatmadja 1999) is at the core of developing
poverty levels, has further reduced the institutional capacity to
successful policy options (McManus 1988, Chua 1989, Chua & Garces
address destructive fi shing in particular and environmental issues
1994) and implementing interventions to address the developing
more generally.
fi sheries crisis.
At present, environmental concerns are of less importance than
development pressures, some of which are explicit government
Towards this goal, the Directorate General of Fisheries of the Ministry of
policy (e.g. expansion of fi sheries, Annex VII), and many of which
Marine Aff airs and Fisheries (PKA) has recently implemented a project
are counter-productive to ecological and socio-economic
"Study on Fisheries Development Policy Formulation", under the Japan
sustainability.
Bank for International Cooperation (JBIC Loan No. IP-403). The goal was
There are major opportunities for improved understanding of the
to formulate a new policy for Indonesian fi sheries based on principles
real status and future potential of the fi sheries in government,
of sustainability, taking into account the needs of the poor as well as
particularly in relation to long-term ecological and economic
to implement the Precautionary Approach to Management and the
sustainability.
FAO Code of Conduct for Responsible Fisheries, to which the country
There is an urgent need to better integrate fi shery-related sectors
subscribes (Pet pers. comm.). The project listed the following policy
in policy, with linkages among food security - poverty - natural
recommendation to the Government of Indonesia: "Create, build and
resources - environment pressures - market forces and governance,
arouse awareness to change the perception and mindset of the people
with major opportunities for improvement in the political situation
to stop romanticizing that the country's seas have over-abundant or
and from private sector and national/international NGOs.
overfl owing resources, in particular fi sheries resources".
Most forms of destructive fi shing are already illegal in national and
provincial legislation but are not adequately enforced, including
The project also provides the following policy advice on marine
some corruption across the various enforcement and legislative
protected areas (MPAs): "It is defi nitively in the country's economic
agencies.
and environmental interests to set aside at least 10% of its 81 000 km
Contributing to the illegal practices, most national and provincial
coastline and 5.8 million km2 marine territory as marine protected area
laws and regulations are either not known or not well accepted by
to conserve and protect its remaining rich marine bio-diversity. There
local populations.
are clear benefi ts to be gained from investment establishing more
There is an urgent need to strengthen local levels of governance
marine protected areas in Indonesian waters, not only as a tool to
and policing, particularly in relation to implementation of the
manage and conserve the fi sheries and its rich genetic resources but
existing provincial and national legislation addressing destructive
also equally for mariculture as a source of seed and broodstock".
fi shing.
As with other nations in the region, a `critical mass' of expertise and
In light of the above, recommended policy options from the present
frameworks for change are developing, involving government and
GIWA analysis, from the broad-scale to the fi ne-scale, for the supply-side
NGOs, academia and the private sector.
of the issue within Indonesian Seas, include:
Local to large-scale interventions by government and NGOs (e.g.
Improved integration of local - provincial - national laws and
WWF, TNC, IUCN) have the potential to slow the rate of deterioration
regulations, to maximise eff ectiveness of the legislative instruments
signifi cantly, provided these receive adequate political, fi scal and
to control destructive fi shing at local - national levels, and to better
logistic support.
encompass all sectors and meet obligations under international
conventions and treaties.
POLICY OPTIONS
69
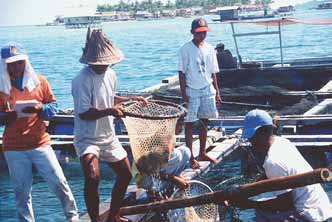
aquarium fi sh industries themselves in the management process e.g.
with strategies like the international Marine Aquarium Council (MAC)
certifi cation-accreditation system (MAC 2004).
The United Nations Environment Programme's World Conservation
Monitoring Centre (UNEP/WCMC) has conducted the fi rst detailed
global assessment of the state of the marine aquarium trade in its report
"From Ocean to Aquarium: The Global Trade in Marine Ornamentals"
(Wabnitz et al. 2003). The report analyses data provided by exporters
and importers from around the world who are working with the MAC
and WCMC to ensure accurate information on the trade is available. In
the accompanying UNEP press release, UNEP Executive Director Klaus
Figure 20 Collecting
fi sh from holding cages for live fi sh market,
Toepfer noted that the collection of tropical fi sh fuels an important,
Kapoposang Island, Sulawesi.
and mostly legitimate, industry, and highlighted the fact that the global
(Photo: J. Oliver, Reefbase)
trade in marine species has great potential as a source of desperately
needed income for local fi shing communities. UNEP/WCMC Director
Much-improved surveillance, enforcement and eff ective policing of
Mark Collins also noted that with eff ective management, the aquarium
laws to reduce the illegal fi shing practices, including development
industry could support long-term conservation and sustainable use of
and eff ective implementation of export quotas, catch and fi sh size
coral reefs in regions where other options for generating revenue are
limits.
limited.
Ongoing and expanded community education programmes.
Improved incomes for fi
shermen through generation of
Most recently, the Indonesian Ministry of Marine Aff airs and Fisheries
ecologically viable alternative/additional income (e.g. well planned
signed a memorandum of understanding (MoU) with the MAC in July
and ecologically-sustainable mariculture).
2003, formalising the strong government support for the MAC's work in
Development of alternative legal supply lines for live fi sh, particularly
Indonesia. At the fi eld level, progress towards MAC Certifi cation is being
through mariculture, with increased supply of such maricultured
made. The recent MoU regarding collection and export of ornamental
species to supplement reductions in wild-caught stocks.
aquarium fi sh can also provide a useful model for the live food fi sh
Expand research and development to `close' the reproductive
industry. The industry, when well managed and with the destructive
cycles of the key mariculture species in captivity, and to develop
fi shing elements controlled, has great potential as an ecologically
ecologically sustainable food sources for mariculture species, with
sustainable and economically viable industry for the region and indeed
opportunities for increased regional collaboration.
for the region as a whole.
Major expansion of the MPA network, with improved management,
including major focus on community co-management, with
Without such measures, the `business as usual' scenario will result in
development of `no-take' zones, and protection of spawning
the continued local extinctions of the target aquarium and food fi sh
aggregation sites.
species from much of their distribution ranges, perhaps surviving
in small numbers in the few eff ectively-managed reserves. These
National surveillance strategies, with participation from all levels of
small populations themselves will be at high risk of extinction from
government, NGOs and local communities may be the best way of
catastrophic events. Indeed, several of the most sought after food fi sh
bridging the gaps between formulation, legislation and enforcement
species (e.g. Napoleon wrasse Chelinus undulatus) are already considered
of regulations. This may be best focused on the ports themselves,
as `vulnerable' in much of their distribution ranges. This major depletion
where large holding pens for live reef fi sh are often established and
in target species abundance will be accompanied by the continued
where initial catch quotas and fi sh size limits can be enforced at the
widespread collateral damage to incident reef communities from the
initial points of sale and export.
application of poisons. Such a scenario is of no long-term benefi t to the
fi shers themselves, and will ultimately cause total collapse of the wild-
Recommended policy options for the demand-side of the issue, mostly
stock live food fi shery.
outside Indonesian Seas, include engagement of the live food and
70
GIWA REGIONAL ASSESSMENT 57 INDONESIAN SEAS
On the positive side, there are many national, regional and international
head (maori) wrasse from the egg commercially in order to reduce
"players" actively pursuing sustainable development initiatives, and
the demand for wild-caught fi sh. (Some progress).
best use of this developing network should be made during future
Where logistics permit, set up cyanide detection laboratories (in
policy implementation. Government projects such as COREMAP and
import destinations such as Hong Kong as well as source countries)
MCREP and NGO programmes such as the Wallacea Bioregion (WWF),
in order to monitor live reef food fi sh and marine aquarium fi sh
Komodo National Park Management Plan (TNC 2000) and other projects
operations, as pioneered in the Philippines. (Little if any progress).
provide useful models for future improvements in fi sheries and habitat
Support research on the eff ects of cyanide on corals and coral
protection.
reef communities to get a better idea of their vulnerability and the
magnitude of the clear-cutting eff ect. (Little published to date).
Because of the major international driving force of market demand
Carry out research to improve non-destructive methods of catching
for live reef fi sh, mostly by Chinese consumers of food fi sh and more
species targeted by the trade. (Signifi cant progress, particularly in
widespread aquarists, policy issues also have a major transboundary
relation to aquarium trade).
aspect. This is focused, in the case of live food fi sh, on the major
Work multi-laterally with the governments of Indonesia, Thailand,
consumer cities of Asia, notably Hong Kong, Shanghai, Taipei and
Philippines, Vietnam, Malaysia and China to ban the use of cyanide
Singapore, and to a lesser extent most cities with signifi cant Chinese
in the electro-plating industry and thus reduce its availability, as has
populations. For aquarium fi sh, the market is extremely broad and
already been done elsewhere. (Little progress).
diff use across the developed world. Thus, policy options also need to
address the demand side of the poison fi shing issue.
In the years since Johannes' recommendations, some progress has
been made. However, many of the recommendations remain key to
addressing the issue. Considerable capacity building is still required,
both in policy development and on-site in education and awareness,
Identification of
surveillance, policing and other interventions. These measures
recommended policy options
must be accompanied by alternative income generation strategies
for the fi shers themselves. In these regards, there has been recent
A wealth of information has been developed since the mid-1990s detailing
convergence in views among scientists and resource managers on
the various policy options and remedial/mitigatory measures that could
the crucial importance of MPAs and MPA network strategies as tools
be adopted in relation to poison fi shing (see e.g. Johannes & Riepen 1995,
for sustainable fi sheries management and resource protection (Box 11
Pratt 1996, Bentley 1999, Cesar et al. 2000, and the journal "SPC Live Reef
and Annexes VII and VIII).
Fish Information Bulletin" for details). Johannes (1996) made eight key
recommendations in this respect, some of which are now beginning to
Box 11 Benefi ts of a well managed Marine Protected Area in
Komodo National Park.
be implemented, and all of which are worth reiterating here:
The major conclusion on the current status of Indonesia's fisheries sector is that a
shift in objectives of fisheries management should occur. To assure that maximum
benefits accrue from the fisheries, the objectives must change from increasing
Convince government regulatory agencies that the live fi sh trade is
landings to assuring sustainable exploitation and survival of the resources. More
a distinctive form of fi shery requiring special controls. (Signifi cant
investments are needed to produce more fish. But such investments must not
expand fishing capacity but increase the capacity to manage the remaining
progress has been made).
fisheries resources. Today, protective management of Indonesian fisheries is no
longer a matter of choice. Protective management through implementation of a
Provide villagers with the incentive to protect their marine
network of marine protected areas (MPAs) is inevitable if the remaining fisheries
are to be sustained for the present and future generations. While MPAs are often
resources by giving them the legal right to exclude outsiders from
designed to provide for a range of uses, it is extremely important to reserve an
their fi shing grounds - or where that right already exists, provide
adequate area in "no-take zones" providing full protection to the resources. Only
such fully protected MPAs can offer the full range of benefits including protecting
stronger government backing. Train, deputise and support village
biodiversity, enhancing fisheries, boosting tourism, providing economic
opportunities and reducing conflict. Successful reserves require a great deal of
fi shermen as fi sh wardens. (Some progress, notably in community-
effort to establish followed by long-term commitment from stakeholders and
decision makers to maintain effective protection. This can only be achieved
based MPAs).
by designing and implementing effective co-management structures with the
capacity to process essential inputs from stakeholders depending on the survival
Ban the possession of dynamite on boats and the use of cyanide
of the resources. The development of innovative co-management structures
as Papua New Guinea has don. (Some progress - blast and poison
is essential to ensure the highest quality staff involved in management and
protection of the resources. Rather than administrative commitments to marine
fi shing are now illegal but rarely enforced).
protected areas, the single most important factor underlying whether or not a
MPA will be successful and beneficial is the presence of a dedicated individual or
Commission a study to determine the kinds of research and
group of individuals to carry it forward.
development needed to raise selected grouper species and hump-
(Source: Pet pers. comm. also see Pet & Djohani 1996)
POLICY OPTIONS
71
Policy recommendation
Cheung et al. (2002) provide a comprehensive list of Priority Actions for
Networks of well-designed and well-managed MPAs should form the
success, reiterated here:
core of the fi sheries management (and marine conservation) strategies.
Update and complete the national inventory of all existing and
There is extreme urgency for the development of a functional MPA
proposed MPAs and protected areas and verify their offi
cial and
network and an immediate need for the establishment of substantial
management status.
`no-take' replenishment zones, with the development of policy and
Review the designation of existing MPAs, and revise these to
legal frameworks that will facilitate the process. As noted above, the
accommodate traditional uses and sustainable development where
benefi ts from an MPA to fi sheries are through two key biophysical
appropriate.
processes:
Defi ne clear boundaries in the establishment of new MPAs and
Spillover: the export of adults and juveniles of target species to the
revise boundaries and zonation of existing MPAs where necessary
fi shery;
(also see Annex VIII). Manage adjacent and linked MPAs as one and
Larval export: the distribution of propagules of the target species
emphasise buff er zone planning and management.
into settlement areas, from where they will eventually recruit into
Considering the vulnerability of MPAs to external infl uences
the fi shery.
(including terrigenous processes and hydrological forces that may
carry pollutants from outside), employ integrated coastal zone
The third key benefi t to be derived from fi sheries sanctuaries is
management, incorporating integrated buff er zones linking land
`enhanced fi sheries stability' (Pet pers. comm.). Sanctuaries provide
and sea, and improve communication and cooperation between
the basis for a more precautionary management strategy for fi sheries.
authorities responsible for land and sea.
Switch the emphasis on small, isolated, highly protected MPAs to a
The successful establishment and eff ective management of a functional
system of MPAs allowing multiple-use principles and networking.
MPA network off ering best returns to fi sheries will require improved
Conduct strategic assessment of manpower requirements during
integration among government departments, international donor
the planning and management of individual MPAs and the MPA
agencies and NGOs. Better allocation and use of government funds
system.
and continuing international donor assistance are urgently required
Develop unifi ed survey and monitoring procedures, mapping, GIS
in the short-term. Continuation, expansion and better integration of
and database systems within the Directorate General for Forestry
the various local, provincial, national and international programmes
Protection and Nature Conservation (PKA) to facilitate overall
identifi ed herein will help to ameliorate the severe environmental and
planning of, and exchange within, the MPA system.
socio-economic impacts from destructive fi shing and other forms of
Strengthen NGO capabilities in community conservation
unsustainable exploitation of Indonesian Seas.
programmes.
Consider the need for more, and more eff ective, marine protected
This will also require a high degree of local intervention and community-
areas where these are least represented, especially in the centre
based support, including application and local enforcement of the no-
of coral reef diversity in the world (East Sulawesi), and also the
take replenishment areas and protection of fi sh spawning aggregation
Indonesian waters between east and west Malaysia, where
sites, and also reliable stock assessment and monitoring. These
destructive fi shing is also high and the Strait of Malacca.
need to be founded in the `ecosystem approach', with an improved
Continue to pursue the goal of PHPA (PKA) to establish a
understanding of the population biology of the target species,
30 million ha network of marine protected areas.
synecology and issues of ecological scale and connectivity in relation
Other priority action points as identifi ed in UN (2002).
to replenishment, including:
Catch
volumes
and
CPUE;
In light of all of the above, two major foci for action are apparent:
Traditional knowledge (e.g. locations of spawning aggregation
The
urgent
need
for
eff ective management of the existing MPA
sites of major commercial species), for development of protection
network (also see Annexes VII-IX).
measures;
Careful planning and continued support for expansion of the
Natural changes in diversity, distribution and abundance of major
network in terms of integration, particularly of cluster and
commercial species, in relation to seasonality eff ects, predator-prey
transboundary MPAs in Indonesia and with neighbouring nations
relationships, and recruitment fl uctuations.
in the region and particularly in relation to the increasing eff ects of
global change (also see Annex X).
72
GIWA REGIONAL ASSESSMENT 57 INDONESIAN SEAS
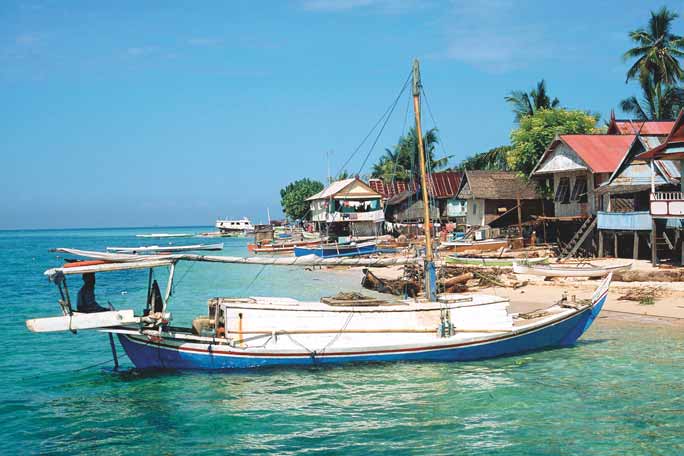
Figure 21 Local boat, Kaposang Island, Sulawesi.
(Photo: J. Oliver, Reefbase)
Performance of the chosen
modest increases in funding would directly increase the ability of
option
protected areas to minimise destructive fi shing, restore harvested
species and protect tropical biodiversity.
Effectiveness
The chosen option has had demonstrable success in several major MPAs
If management of the existing MPAs can be improved markedly, as
where support across the diff erent levels (international - local) has been
recommended herein, there already exists a well distributed network
developed, notably Komodo National Park and Bunaken National Park
covering all major IUCN biogeographic divisions except Division 1,
(see Annex VIII). However, other MPAs have been far less successful
with more MPAs in the larger and more complex Divisions II and III,
(e.g. Kepuluan Seribu National Park, Jawa Sea) (Brown 1986, Hutomo et
and some concentration in Jawa (Cheung et al. 2002). Furthermore,
al. 1993, Alder 1996, DeVantier et al. 1999), and overall eff ectiveness of
with future gazettal and eff ective management of the proposed MPAs
the policy option is thus rated as medium (also see Chua 1989, Chua &
(see also Assessment, Habitat and community modifi cation), the major
Garces 1994, Crooks & Foley 1995). Levels of environmental and socio-
biogeographic gap (west Sumatra) will be fi lled.
economic impact are expected to increase in most of the region to
2020, despite present and planned interventions, including protected
Importantly, at least 10 of Indonesia's MPAs are rated as regionally
areas and improved surveillance and enforcement. Eff ectiveness can be
or globally signifi cant (Cheung et al. 2002) providing strong support
improved markedly with more equitable use of funds and continuing
for continued international assistance in developing eff ective
donor, government and NGO support. Eff ectiveness correlates with basic
management.
management activities such as enforcement, boundary demarcation,
and direct compensation to local communities, suggesting that even
POLICY OPTIONS
73
Efficiency
insuffi
cient biodiversity and fi sheries assessments and monitoring
The effi
ciency is rated as medium to high, because of the clearly
undertaken to date. There remain serious defi ciencies in capacity in
prioritised objectives and goals and the development of transparent
`on the ground' implementation, including unresolved diffi
culties in
systems for implementation, but with major remaining impediments of
eff ective surveillance and policing (see Annexes IX and X), providing
corruption across all levels from local to national, and unresolved political
challenges for implementation, and at present, levels of funding for
instability (e.g. separatist movements) in parts of the region. Clearly,
these initiatives are not assured. For the successful implementation of
effi
ciency is linked closely with eff ectiveness, and thorough evaluation
eff ective management, the key root causes of overpopulation, poverty
of effi
ciency will require expansion of future policy assessments beyond
and market demand, compounded here by diff erences in cultural -
standard cost-benefi t analysis, particularly considering the impact of
religious beliefs, need to be addressed.
social capital on the costs of managing fi sheries.
As Rudd et al. (2003) conclude: "In the short term, the amount of social
capital that communities possess and the capacity of the state to
support the rights of individuals and communities will aff ect the relative
effi
ciency of marine reserves. Reserves may be the most effi
cient policy
option when both community and state capacity is high, but may not
be when one and/or the other is weak. In the longer term, the level
of social capital that a society possesses and the level of uncertainty
in ecological and social systems will also impact the appropriate level
of devolution or decentralisation of fi sheries governance. Determining
the proper balance of the state and the community in tropical fi sheries
governance will require broad comparative studies of marine reserves
and alternative policy tools".
Equity
Equity is rated as medium to high, with increasing stakeholder
involvement and major education and awareness campaigns
occurring. The special circumstances of local subsistence fi shers are
now beginning to be addressed explicitly in MPAs.
Political feasibility
Political feasibility is rated as low to medium, with unresolved gaps
in jurisdiction among the various government levels placing serious
impediments on resolution of some of the key environmental and
socio-economic issues in MPAs (also see Crooks & Foley 1995).
Current decentralisation policies have yet to prove to be eff ective in
empowering local government authorities.
Implementation capacity
The implementation capacity is rated as low to medium, with signifi cant
capacity-building required among government, NGO and community
groups for eff ecting change, but with considerable international
donor support and some excellent models (see Annex VIII). There
is also increasing recognition among the communities themselves
that interventions are crucial to their longer term sustainability.
However, Indonesian Seas are very large and poorly known, with
74
GIWA REGIONAL ASSESSMENT 57 INDONESIAN SEAS
Conclusions and recommendations
At present, severe environmental concerns facing GIWA region 57
Komodo National Park), where strong surveillance, enforcement,
Indonesian Seas include most of those considered by GIWA; Freshwater
education/awareness and AIG programmes are already being
shortage, Pollution, Habitat and community modifi
cation and
implemented.
Unsustainable exploitation of fi sh and other living resources. These
There may be some stabilisation and improvement in the socio-
concerns are also having severe socio-economic impacts in large parts
economic indicators.
of the region. Thus, the overall present situation and future prognosis
There is a pressing need to better integrate international water-
for Indonesian Seas is that:
related sectors in policy, with linkages among food security,
poverty, natural resources, environment pressures, market forces
The human population is growing rapidly, with an expected
and governance.
300 million people by 2020, most in Sunda - with widespread
It may be possible to slow down the rate of increase of impacts
religious and cultural traditions fostering large family sizes,
although at present environmental concerns are of less importance
exacerbated by inadequate policy focus towards developing and
than development pressures, many of which have inappropriate
implementing population stabilisation strategies.
environmental eff ects.
Millions of coastal people are living near or below the poverty level
There are major opportunities for improvement in the political
and rely on subsistence level fi shing for survival.
situation and from private sector and national/international
There is widespread continued use of inappropriate technologies
NGOs.
and clear evidence of impending collapse in ecological
Local to large-scale interventions by government and NGOs (e.g.
sustainability.
MCREP, COREMAP, WWF Wallacea Bioregion programme, TNC
Most national and provincial laws and regulations are either not
Komodo programme and others) have the potential to slow the rate
known or not well accepted by local populations, with signifi cant
of deterioration signifi cantly, provided these continue to receive
inter-provincial diff
erences in the application of national
adequate political, fi scal and logistic support.
legislation.
A `critical mass' of expertise and frameworks for change are
There are also signifi cant diff erences in international waters concerns
developing, involving science, policy, people, private sector and
among diff erent areas, requiring defi nition and assessment of three
government.
GIWA sub-systems: Sunda, Wallacea and Sahu.
There is misallocation of signifi cant amounts of local and
There are already severe environmental and socio-economic
international funds, with major opportunities for better allocation
impacts within these sub-systems, with Sunda being worst
and use.
aff ected, Wallacea being intermediately aff ected and Sahul being
The rapidly changing global situation will continue to cause
least aff ected.
changes in international funding priorities.
There is inadequate enforcement of the relevant regulations, including
There is a pressing need for better allocation of local funds and
corruption across the various enforcement and legislative agencies.
continued international donor funds to alleviate the present
Most of the environmental impacts are expected to worsen over
situation and to work towards improving future scenarios.
the next 20 years, other than in the few well-managed MPAs (e.g.
CONCLUSIONS AND RECOMMENDATIONS
75
The Indonesian Seas region, with its neighbouring Sulu-Sulawesi Sea
and South China Sea, lies at the centre of the world's marine biodiversity,
supports a rapidly growing, generally poor, human population and
has rapidly deteriorating riverine, coastal and marine ecosystems with
possible collapse of many of its international water resources.
Indonesian Seas are of central global importance in terms of
International Waters, global climate (ENSO) and Biodiversity, and
these three universal attributes are under extreme threat, as posed by
the complex combination of socio-political factors identifi ed above.
Addressing the severe impacts and threats through the identifi ed
policy options will require real commitment from much of civil society,
and place major responsibilities on governments, non-governmental
organisations, educational institutions and the private sector. The
challenge of gathering the cooperation necessary for the sustainable
development of this critical region is great, but not insurmountable
(PEMSEA 2002). In recognition of this, the GIWA Task team suggests
that the Indonesian Seas Region, with its neighbours Sulu-Celebes
(Sulawesi) Seas and South China Sea, be aff orded the highest priority
by the Global Environment Facility.
76
GIWA REGIONAL ASSESSMENT 57 INDONESIAN SEAS
References
Abram, N., Gagan, M.K., McCulloch, M.T., Chappell, J. and Hantoro, W.S.
Atmadja, W.S. and Soerojo. (1994). Mangrove status of Indonesia. In:
(2003). Coral death during the 1997 Indian Ocean dipole linked to
Wilkinson, C., Sudara, S. and Ming, C.L. (eds.) Proceedings of the
Indonesian wildfi res. Science 301: 952-954.
Third ASEAN-Australia Symposium on Living Coastal Resources:
Agardy, T.S. (1997). Marine Protected Areas and Ocean Conservation.
Status Reviews 1: 201-2. Chulalongkorn University, Bangkok,
p 155-188 In: Francour, P., Harmelin, J.-G., Pollard, D. and Sartoretto, S.
Thailand, 16-20 May 1994. Australian Institute of Marine Science,
(eds.) (2001). A review of marine protected areas in the northwestern
Townsville, Australia.
Mediterranean region: siting, usage, zonation and management.
Atmadja, W., and Man, A. (1994). Threats and pressures on mangroves
Aquatic Conservation: Marine and Freshwater Ecosystems 11.
and current management practices. p 62-70 In: Wilkinson, C.R. (ed.).
Academic Press, London, UK.
Living coastal resources of South-east Asia: Status and Management.
Alder, J. (1996). Have tropical marine protected areas worked? An initial
Report of the Consultative forum third ASEAN-Australia Symposium
analysis of their success. Coastal Management 24: 97-114.
on Living Coastal Resources. Chulalongkorn University Bangkok,
APEX (2004). Indonesia Oceanic Cetaceans Program. Retrieved Sept. 2003
Thailand. Australian Institute of Marine Science.
from: http://www.apex-environmental.com/IOCPImpacts.html
Barber, C.V. and Pratt, V.R. (1997). Sullied Seas: Strategies for Combating
Armstrong, C. and Reithe, S. (2001). Marine reserves will they
cyanide fi shing in South-east Asia and beyond. World Resources
accomplish more with management costs? A comment to
Institute and International Marinelife Alliance Washington D.C, US.
Hannesson's (1998) paper. p. 13-18 In: Sumaila, U.R. and Alder, J.
Beattie, A., Sumaila, U.R., Christensen, V. and Pauly, D. (2001). Marine
(eds.) Economics of Marine Protected Areas. Papers, Discussions
protected areas in the North Sea: A preliminary bioeconomic
and Issues: A Conference held at the UBC Fisheries Centre July 2000.
evaluation using Ecoseed, a new game theory tool for use with
The Fisheries Centre, University of British Columbia, Vancouver,
the ecosystem simulation ECOPATH with ECOSIM. p 32-42 In:
Canada.
Sumaila U.R., and Alder J. (eds.) Economics of Marine Protected
Ascher, W. (1993). Political economy and problematic forestry policies
Areas. Papers, Discussions and Issues: A Conference held at the
in Indonesia: obstacles to incorporating sound economics and
UBC Fisheries Centre July 2000. The Fisheries Centre, University of
science. Duke University Center for Tropical Conservation.
British Columbia, Vancouver, Canada.
Atmadja, W.S. and Soerojo (1984). Mangrove status of Indonesia.
Bentley, N. (1999). Fishing for solutions: Can the live trade in wild
Volume 1:p 201-207. In: Wilkinson, C., Sudara, S. and Ming, C.L. (eds.)
groupers and wrasses from South-east Asia be managed? TRAFFIC
Proceedings of the Third ASEAN-Australia Symposium on Living
Southeast Asia, Petaling Jaya, Malaysia.
Coastal Resources. Chulalongkorn University, Bangkok, Thailand,
Bleakley, C. and Wells, S. (eds). (1995). East Asian Seas, In: Kelleher, G.,
16-20 May 1994. Australian Institute of Marine Science, Townsville,
Bleakley, C. and Wells, S. (eds). A Global Representative System of
Australia.
Marine Protected Areas, Vol. III. World Bank, Washington, D.C., US.
Brown, B.E. (ed.) (1986). Human Induced Damage to Coral Reefs. UNESCO
Reports in Marine Science 40. UNESCO, Paris, France.
Brown, B.E. (1997). Coral Bleaching: Causes and consequences. Coral
Reefs 16(Supplement 1):S129-S138.
REFERENCES
77
Brown, B.E. and Suharsono (1990). Damage and recovery of coral reefs
Chou, L.M. (1997). South-east Asia as the global center of marine
aff ected by El Nińo related seawater warming in the Thousand
biodiversity. Tropical Coasts 4:4-8.
Islands, Indonesia. Coral Reefs 8:163-170.
Chou, L.M. (2000). South-east Asian reefs status update: Cambodia,
Bruner, A.G., Gullison, R.E., Rice, R.E. and da Fonseca, G.A.B. (2001).
Indonesia, Malaysia, Philippines, Singapore, Thailand and Vietnam.
Eff ectiveness of parks in protecting tropical biodiversity. Science
p 117-129 In: Wilkinson, C.R. (ed.) Status of Coral Reefs of the World:
291:125-128.
2000. Australian Institute of Marine Science, Townsville, Australia.
Bryant, D., Burke, L., McManus, J., Spalding, M. (1998). Reefs at Risk. A map
Chou, L.M., Wilkinson, C., Gomez, E., and Suraphol, S. (1994). Status
based indicator of threats to the world's coral reefs. WRI, ICLARM,
of coral reefs in the ASEAN region. p 8- 17 In: Wilkinson, C.R.
WCMC and UNEP, Washington D.C.
(ed.). Living coastal resources of South-east Asia: Status and
Burke, L, Selig, E. and Spalding, M. (2002). Reefs at Risk in South-east Asia.
Management. Report of the Consultative forum third ASEAN-
World Resources Institute.
Australia Symposium on Living Coastal Resources. Chulalongkorn
Bustaman, S., Edrus, I.N., Syam, A.R. and La Sui. (1994). Status of coral
University Bangkok, Thailand. May 1994. Australian Institute of
reef fi shes in Maluku. Volume 2:p 237-243 In: Wilkinson, C., Sudara,
Marine Science, Townsville, Australia.
S. and Ming, C.L. (eds.) Proceedings of the Third ASEAN-Australia
Chua, T.E. (1989). Will coastal area management programmes work in
Symposium on Living Coastal Resources. Chulalongkorn University,
South-east Asia? p 231-240 In: Chua, T.E. and Pauly, D. (eds). Coastal
Bangkok, Thailand, 16-20 May 1994. Australian Institute of Marine
area management in South-east Asia: Policies, Management
Science, Townsville, Australia.
Strategies and Case studies. Association of South-east Asian
Butarbutar, M., Idris, I., Putra, S. and Siry, H.Y. (1999). The decentralisation
Nations/United States Coastal Resources Management project.
of integrated coastal and marine resource management. p 37-40 In:
Conference Proceedings 2.
Rais, J., Dutton, I.M., Pantimena, L., Plouff e, J., and Dahuri, R. (eds.)
Chua, T.E. and Garces, L.R. (1994). Marine living resources management in
Integrated Coastal and Marine Resource Management Proceedings
the ASEAN region: lessons learned and the integrated management
of International Symposium, Malang.
approach. Hydrobiologia 285: 257-270.
Carlton, J.T. (1998). Apostrophe to the Ocean. Conservation Biology 12:
Chua, T.E., Paw, J.N., and Tech, E. (1989). Coastal Aquaculture
1165-1167.
development in ASEAN: the need for planning and environmental
Cesar, H. (1996). Economic Analysis of Indonesia Coral Reefs. World Bank,
management. p 57-70 In: Chua, T.E. and Pauly, D. (eds). Coastal Area
Washington, DC.
Management in South-east Asia: Policies, Management Strategies
Cesar, H. (1998). Indonesian coral reefs: a precious but threatened
and Case Studies. Association of South-east Asian Nations/United
resource. p 163-171 In: Hatziolas, M.E., Hooten, A.J. and Foder, M.
States Coastal Resources Management Project Conference
(eds) Coral Reefs: Challenges and Opportunities for Sustainable
Proceedings 2.
Management. Proceedings of the 5th World Bank Conference
COREMAP (1996). COREMAP Preparation Document. Australian Marine
ofEnvironment and Social Sustainable Development, Washington
Science and Technology Ldt.
DC, US.
COREMAP (1997). COREMAP Project Preparation Document T.A. 2535-
Cesar, H., Warren, K.A., Sadovy, Y., Lau, P., Meijer, S., and van Ierland, E.
Indonesia.
(2000). Marine market transformation of the live reef fi sh food trade
COREMAP (1998). AusAid COREMAP Project Activities, Indonesia.
in South-east Asia. p 137-157 In: Cesar (ed.). Collected Essays on the
Cox, R.J. (1999). Managing sea level rise and climatic change in the
Economics of Coral Reefs. CORDIO, Department of Biology and
coastal zone. p 249-259 In: Rais, J., Dutton, I.M., Pantimena, L., Plouff e,
Environmental Sciences, Kalmar University, Sweden.
J., and Dahuri, R. (eds.) Integrated Coastal and Marine Resource
Cheung, C.P.S., Alino, P.M., Uychiaoco, A.J., and Arceo, H.O. (2002).
Management Proceedings of International Symposium, Malang.
Marine Protected Areas in South-east Asia. ASEAN Regional Centre
Crooks, R. and Foley, S. (1995). Review of environmental assessment
for Biodiversity Conservation, Department of Environment and
and management experience in Indonesia. The World Bank
Natural Resources.
Environmental Management Series, Paper No. 025.
Chia, L.S., Kirkman, H. (2000). Overview of land-based sources and
Dahuri, R. (1999). Coastal zone management in Indonesia: issues and
activities aff ecting the marine environment in the East Asian Seas.
approaches. p 60-72 In: Rais, J., Dutton, I.M., Pantimena, L., Plouff e,
UNEP/GPA Co-ordination Offi
ce and EAS/RCU. Regional Seas Report
J., and Dahuri, R. (eds.) Integrated Coastal and Marine Resource
and Studies Series 173. United Nations Environment Programm,
Management Proceedings of International Symposium, Malang.
Nairobi, Kenya.
78
GIWA REGIONAL ASSESSMENT 57 INDONESIAN SEAS
Dahuri, R. and Dutton, I. (2000). Integrated coastal and marine
Djohani, R., Smith, A., Pet, J. and Mous, P.J. (1998). Maluku Conservation
management enters a new era in Indonesia. Integrated Coastal
and Natural Resources Management Project (MACONAR). Coastal
Zone Management 1: 11-16.
and Marine Component Preparation Mission. Report from The
Dalzell, P., and Pauly, D. (1990). Assessment of the fi sh resources of south-
Nature Conservancy Coastal and Marine Program, Indonesia.
east Asia, with emphasis on the Banda and Arafura Seas, Indonesia.
Dight, I., Kenchington, R. and Baldwin, J. (eds.) (1999). Proceedings
Proc. Snellius-II Symp., Neth J. Sea Res. 26.
of the International Tropical Marine Ecosystems Management
Daws, G. and Fujita, M. (1999). Archipelago The Islands of Indonesia. The
Symposium. November 1998. Great Barrier Reef Marine Park
Nature Conservancy and University of California Press, Berkeley.
Authority, Townsville, Australia.
DeVantier, LM, Suharsono, Budiyanto, A, Tuti, J, Imanto, P, Ledesma,
Done, T.J. (1999). Coral community adaptability to environmental
R. (1999). Status of the coral communities of Pulau Seribu, Java
change at the scales of regions, reefs, and reef zones. American
Sea, Indonesia. p 1-24 In: Soemodihardjo, S. (ed.) Contending with
Zoologist 39:66-79.
Global Change Study No. 10 Proceedings: Coral Reef Evaluation
Done, T. (2001). Scientifi c Principles for Establishing MPAs to Alleviate
Workshop Pulau Seribu, Jakarta, Indonesia. UNESCO/Indonesian
Coral Bleaching and Promote Recovery. In: Salm, R.V. and Coles, S.L.
Institute of Sciences.
(eds.) Coral Bleaching and Marine Protected Areas. Proceedings
DGWRD (1993a). Twenty-fi ve years water resources development in
of the Workshop on Mitigating Coral Bleaching Impact Through
Indonesia (1969-1993). Ministry of Public Works, Directorate General
MPA Design, Bishop Museum, Honolulu, Hawaii, 29-31 May 2001.
of Water Resources Development.
Asia Pacifi c Coastal Marine Program Report No. 0102. The Nature
DGWRD (1993b). The study for formulation of irrigation development
Conservancy, Honolulu, Hawaii, US.
program in the Republic of Indonesia. Nippon Koei Co., Ltd.
Done, T.J., DeVantier, L.M., Turak, E. (1997). Coral communities of Gebe
Ministry of Public Works. Directorate General of Water Resources
and Gag Islands, Eastern Indonesia: Eff ects of turbid run-off on coral
Development.
reefs. Final Report to NSR Environmental Consultants. Australian
DGWRD (1993c). Recapitulasi Inventarisasi Daerah Irigasi Seluruh
Institute of Marine Science, Townsville, Australia.
Indonesia. Ministry of Public Works, Directorate General of Water
Douglas, I. (1978). The impact of urbanisation on fl uvial geomorphology
Resources Development.
in the humid tropics. International Journal of Tropical Ecology and
DGWRD (1995a). Proceeding Lokakarya Pengembangan dan
Geography 2:229-242.
Pengelolaan Terpadu Sumberdaya Air Jabotabek. Ministry of Public
Douglas, I. and Spencer, T. (1985). Environmental Change and Tropical
Works, Directorate General of Water Resources Development
Geomorphology. George Allen and Union, London, UK.
DGWRD (1995b). Bendungan Besar di Indonesia. Ministry of Public
Dutrieux, E. (1991). Study of the ecological functioning of the Mahakam
Works, Directorate General of Water Resources Development in
Delta (East Kalimantan, Indonesia). Estuarine, Coastal and Shelf
association with Agency for Research and Development, Research
Science 32:415-420.
Institute for Water Resources Development.
Edinger, E.N., Jompa, J., Limmon, G.V., Widjatmoko, W. and Risk, M.J.
DGWRD (1996). Program Pembangunan Pengairan t.A. 1997/1998 dan
(1998). Reef degradation and coral biodiversity in Indonesia: land-
Mid Term Review Pelita VI. Ministry of Public Works, Directorate
based pollution, destructive fi shing practices and changes over
General of Water Resources Development.
time. Marine Pollution Bulletin 36:617-630.
Djohani, R. (1998). Abatement of destructive fi shing practices in
Erdmann, M.V., and Caldwell, R.L. (1997). Stomatopod crustaceans as bio-
Indonesia: who will pay? p 25-29 In: Hatziolos, M.E., Hooten, A.J.
indicators of marine pollution stress on coral reefs. Proceedings of
and Fodor, M. (eds.) Coral Reefs: Challenges and Opportunities
the 8th International Coral Reef Symposium 2:1521-1526.
for Sustainable Management. Proceedings of the 5th World Bank
Erdmann, M.V. (2000). Leave Indonesia's fi sheries to Indonesians!
Conference of Environment and Social Sustainable Developmnet.
Corrupt foreign fi shing fl eets are depriving locals of food. Inside
Washington DC, US.
Indonesia, No. 63 Jul-Sept. Retrieved Sept. 2003 from: http://
Djohani, R. (1999). Marine national parks economic assets to Indonesia.
www.insideindonesia.org/edit63/erdmann1.htm
Coastal and Marine Resources. The Economy of the Future, Jakarta,
Erdmann, M.V., and Merrill, P. (2003). Multiple-use Zoning in Marine
April, 1999.
Protected Areas: Bunaken National Park case study (Indonesia).
Proceedings Second International Tropical Marine Ecosystems
Management Symposium, Manila, Philippines, April, 2003.
REFERENCES
79
Erdmann, M.V., and Toengkagie, A. (2003). The Bunaken National Park
GEF/UNDP/IMO (1997). Pollution Prevention and Management in
Joint Patrol System: Lessons Learned from a Multistakeholder
the East Asian Seas - a Paradigm Shift in Concept, Approach
Enforcement Initiative. Proceedings Second International Tropical
and Methodology. Regional Programme for the Prevention and
Marine Ecosystems Management Symposium, Manila, Philippines,
Management of Marine Pollution in the East Asian Seas, PEMSEA.
April, 2003.
Gillett, R. (1996). Marine fi sheries resources and management in
Erdmann, M.V., Merrill, P.R., Mongdong, M., Wowiling, M., Pangalila,
Indonesia with emphasis on the extended economic zone.
R., and Arsyad, I. (2003a). The Bunaken National Marine Park Co-
Workshop Presentation Paper 1, Workshop on Strengthening
Management Initiative. Proceedings Second International Tropical
Marine Resource Development in Indonesia, TCP/INS/4553.
Marine Ecosystems Management Symposium, Manila, Philippines,
Gillett, R. (2000). FAO Technical Cooperation Programme. Assistance in
April, 2003.
marine fi sheries legislation - Indonesia. Report reference TCP/INS/
Erdmann, M.V., Merrill, P.R., and Arsyad, I. (2003b). Developing a
8922. FAO, Rome. 98 p.
Decentralized User Fee System for Sustainable Conservation
Glynn, P.W. (1996). Coral Reef Bleaching: facts, hypotheses and
Financing of Bunaken National Marine Park. Proceedings Second
implications. Global Change Biology 2:495-509.
International Tropical Marine Ecosystems Management Symposium,
Goreau, T.J., McClanahan, T., Hayes, R., and Strong, A.E. (2000).
Manila, Philippines, April, 2003.
Conservation of Coral Reefs after the 1998 global bleaching event.
Etkin, D.S. (1997). Oil spill in East Asia: Over 220 million gallons spilled
Conservation Biology 14:5-15.
since 1965. Oil Spill Intelligence Report.
Hayden, B.P., Ray, G.C. and Dolan, R. (1984). Classifi cation of Coastal and
ESCAP (1995). Guidebook to water resources, use and management
Marine Environments. Environmental Conservation 11:199-207.
in Asia and the Pacifi c. Volume 1: Water resources and water use.
Herriman, M. and Tsamenyi, M. (1999). The 1997 Australia-Indonesia
Water resources series No. 74. United Nations Economic and Social
maritime boundary treaty: a secure legal regime for off shore
Commission for Asia and the Pacifi c.
resource development? In: Rais, J., Dutton, I.M., Pantimena, L.,
FAO (1992). Action programme on water and sustainable agriculture
Plouff e, J., and Dahuri, R. (eds.) Integrated Coastal and Marine
development in Indonesia. Executive summary. United Nations
Resource Management Proceedings of International Symposium,
Food and Agriculture Organization, Rome, Italy.
Malang.
FAO (1998). FAO concerned about severe declines in shark stocks
Hettige, H., Huq, M., Pargal, S., and Wheeler, D. (1996). Determinants of
international plan of action calls for sustainable management.
pollution abatement in developing countries: Evidence from South
FAO Press Release 98/61. United Nations Food and Agriculture
and South-east Asia. World Development 24(12):1891-1904.
Organization, Rome, Italy.
Hodgson, G. and Dixon, J.A. (1992). Sedimentation damage to marine
FAO (2000). Fishery Country Profi le, Indonesia. Retrieved Aug. 2003 from:
resources: Environmental and economic analysis. In: Marsh, B.J.
http://www.fao.org/fi /fcp/FICP_IDN_E.asp
(ed.) Resources and environment in Asia's marine sector. Taylor
FAO, UNDP & UNEP (1994). Land degradation in South Asia: its severity,
and Francis, Washington, US.
causes and eff ects upon the people. World Soil Resources Report
Hoegh-Guldberg, O. (1999). Climate change, coral bleaching and the
No. 78. United Nations Food and Agriculture Organization, Rome,
future of the world's coral reefs. Marine and Freshwater Research
Italy.
50:839-866.
FAO AQUASTAT (2003). United Nations Food and Agricultural
Holmes, N. (1999). Aiming at a moving target : the problem of managing
Organization, Database. Retrieved August 2003 from: http:
coastal habitats while the climatic baseline is changing. In: Rais,
//www.fao.org/waicent/faoinfo/agricult//AGL/AGLW/aquastat/
J., Dutton, I.M., Pantimena, L., Plouff e, J., and Dahuri, R. (eds.)
dbase/index.stm
Integrated Coastal and Marine Resource Management Proceedings
Fox, H.E, Mous, P.J., Muljadi, A., Purwanto, and Pet, J.S. (2003). Enhancing
of International Symposium, Malang.
Reef Recovery in Komodo National Park, Indonesia: Coral Reef
Hopley, D. (1997). Coral reef islands - implications of more modest
Rehabilitation at Ecologically Signifi cant Scales. Report from The
global change predictions. Recent Advances in Marine Science
Nature Conservancy South-east Asia Center for Marine Protected
and Technology 96 PACON96:249-258.
Areas, Sanur, Bali, Indonesia.
Hopley, D. (1999a). Geological and geomorphological input into tropical
coastal management with special reference to Balikpapan Bay, East
Kalimantan. Proyek Pesisir, TE-99/01-E.
80
GIWA REGIONAL ASSESSMENT 57 INDONESIAN SEAS
Hopley, D. (1999b). Assessment of the Environmental Status and
Jezeph, D. (1992). National water policy. Food and Agricultural
Prospects of Aquaculture in the Mahakam Delta, East Kalimantan,
Organization of the United Nations, Rome, Italy.
Indonesia. Unpublished Report for Total Indonesia.
Johannes, R.E. (ed.) (1996). SPC Live Reef Fish Information Bulletin 1. The
Hopley D. (1999c). Land-use Planning in the Mahakam Delta, East
Secretariat of Pacifi c Communities, Coastal Fisheries Programme.
Kalimantan, Indonesia. Unpublished Report for Total Indonesia.
Johannes, R.E. (1998). Tropical marine reserves should encompass
Hopley, D. (1999d). Global climate change and coral reef management.
spawning aggregation sites. Parks 8 No. 2: 53-54.
p 235-248 In: Rais, J., Dutton, I.M., Pantimena, L., Plouff e, J.,
Johannes, R.E., and Djohani, R. (1997). Reducing the incidence of the
and Dahuri, R. (eds.) Integrated Coastal and Marine Resource
bends in Indonesian fi shing villages: education may not be enough.
Management Proceedings of International Symposium, Malang.
SPC Live Reef Fish Information Bulletin 2. The Secretariat of Pacifi c
Hopley D. (2001). Aquaculture in the Mahakam Delta, East Kalimantan,
Communities, Coastal Fisheries Programme.
Indonesia. Advances in Marine Science and Technology 2000, Proc.
Johannes, R.E. and Riepen, M. (1995). Environmental, Economic, and
PACON 2000.
Social Implications of the Live Reef Fish Trade in Asia and the
Hopley, D. and Suharsono. (2000). The Status of Coral Reefs in Eastern
Western Pacifi c. Report for the Nature Conservancy and South
Indonesia. Australian Institute of Marine Science, Townsville,
Pacifi c Forum Fisheries Agency.
Australia.
Kadri, A.H., Mokhtar, M.B., Awaluddin, A. B. and S. Mustafa. (1999).
Husar, S.L. (1978). Mammalian Species. Dugon dugon. The American
Borneo's Marine Ecosystem and the Greenhouse Risk Factor: A
Society of Mammalogists 88:1-7.
National Perspective. p 438-441. In: Sherman, R. K. and Tang, Q.
Hutomo, M., Uktolseya, H., Sloan, N.A., Abdullah, A., Djohani, R., Alder,
(eds.) Large Marine Ecosystems of the Pacifi c Cambridge. MA:
J., Halim, M.H. and Sutardjo (1993). Marine conservation areas in
Blackwell Science.
Indonesia: Two case studies of Kepulauan Seribu, Java and Bunaken,
Kahn, B. and Fauzi, A. (2001). Fisheries in the Sulu Sulawesi Seas -
Sulawesi. UNEP-COBSEA/MOSTE Workshop EAS25: Case Studies in
Indonesian Country Report. Assessment of the state of biophysical,
Planning and Management of Marine Protected Areas/Parks/
socio-economic, and institutional aspects of coastal and pelagic
Reserves. Penang, Malaysia.
fi sheries in the Indonesian part of the Sulu-Sulawesi Seas. WWF
Intergovernmental Panel on Climate Change (IPCC) (1996). Climate
Sulu-Sulawesi Marine Ecoregion Fisheries Project.
Change 1995. Impacts, Adaptations and Mitigation of Climate
Kahn, B. and Pet, J. (2003). Long-term visual and acoustic cetacean
Change: Scientifi c and Technical Analyses. Working Group 2,
surveys in Komodo National Park, Indonesia 1999-2001:
Second Assessment Report, IPCC, 879pp.
Management implications for large migratory marine life. In:
IPCC (2001). Climate Change 2001: Contribution of Working Group III to
Proceedings and Publications of the World Congress on Aquatic
the Third Assessment Report of the Intergovernmental Panel on
Protected Areas 2002. Australian Society for Fish Biology.
Climate Change. Cambridge Unitversity Press, UK.
Kelly, S., MacDiarmid, A.B., Scott, D., and Babcock, R. (2001). The value
Jeyaseelan, M.J.P. (1988) Manual of Fish Eggs and Larvae from Asian
of a spill-over fi shery for spiny lobsters around a marine reserve in
Mangrove Waters. UNESCO Publishing, Mayenne, France.
northern New Zealand. p 99-113 In: Sumaila, U.R. and Alder, J. (eds.)
Jompa, J. (1996). Monitoring and Assessment of Coral Reefs in
Economics of Marine Protected Areas. Papers, Discussions and
Spermonde Archipelago, South Sulawesi, Indonesia. Unpublished
Issues: A Conference held at the UBC Fisheries Centre July 2000.
M.Sc. thesis, McMaster University, CanadaJacinto, G.S., P.M.
The Fisheries Centre, University of British Columbia, Vancouver,
Alińo, C.L. Villanoy, L.Talaue-McManus and Gomez, E.D. (2000).
Canada.
The Philippines. In: Sheppard CRC. Seas at the Millenium: An
Kelly, S., Scott, D. and MacDiarmid, A.B. (2002). The value of a spillover
Environmental Evaluation. Volume II Regional Chapters: The Indian
fi shery for spiny lobsters around a marine reserve in Northern New
Ocean to the Pacifi c. Pergamon Press (Elsevier).
Zealand. Coastal Management 30:153-166.
Jackson, J.B.C., Kirby, M.X., Berger, W.H., Bjorndal, K.A., Botsford, L.W.,
Kench, P.S. and Cowell, P.J. (2002). Variations in sediment production
Bourque, B.J., Bradbury, R.H., Cooke, R., Erlandson, J., Estes, J.A.,
and implications for atoll island stability under rising sea level.
Hughes, T.P., Kidwell, S., Lange, C.B., Lenihan, H.S., Pandolfi , J.H.,
Proceedings of the 9th International Coral Reef Symposium 2:
Peterson, C.H., Steneck, R.S., Tegner, M.J., Warner, R.R. (2001).
1181-1186.
Historical Overfi
shing and the Recent Collapse of Coastal
Kleypas, J.A., Buddemeier, R.W., Archer, D., Gattuso, J-P., Langdon, C.,
Ecosystems. Science 293: 629-638
and Opdyke, B.N. (1999). Geochemical consequences of increased
atmospheric carbon dioxide on coral reefs. Science 284:118-120.
REFERENCES
81
KLH (1992). Indonesian Country Study on Biological Diversity. UNEP,
McManus, J.W., Reyes, R.B. and Nańola, C.L. (1997). Eff ects of some
Indonesian Ministry for Population and Environment.
destructive fi shing practices on coral cover and potential rates of
Kusumaatmadja, S. (1999). The challenge of Eastern Indonesian
recovery. Environmental Management 12(1):69-78.
development through integrated coastal and marine resource
McNeely, J.A., Thorsell, J.W., and Ceballos-Lascuráin, H. (1994). Guidelines:
management. p 12-13 In: Rais, J., Dutton, I.M., Pantimena, L., Plouff e,
Development of national parks and protected areas for tourism, 2nd
J., and Dahuri, R. (eds.) Integrated Coastal and Marine Resource
Edition. World Tourism Organization, United Nations Environment
Management Prococeedings International Symposium, Malang.
Programme and World Conservation Union.
Large Marine Ecosystems (2004). LME: Indonesian Seas. Retrieved Nov. 2004
Ministry of Marine Aff airs and Fisheries (2002). Partnership/Initiative
from: http://www.seaaroundus.org/lme/SummaryInfo.aspx?LME=38#
under World Summit on Sustainable Development, presented at
Leclercq, N., Gattuso, J.-P. and Jaubert, J. (2000). CO partial pressure
PrepCom IV, Bali Indonesia, May 24-June 7, 2002.
2
controls the calcifi cation rate of a coral community. Global Change
Moosa, M.K. (1999). The extent of knowledge about marine biodiversity
Biology 6(3):329-334.
in Indonesia. In Rais, J., Dutton, I.M., Pantimena, L., Plouff e, J.,
Leclercq, N., Gattuso, J.-P. and Jaubert, J. (2002). Primary production,
and Dahuri, R. (eds) Integrated Coastal and Marine Resource
respiration, and calcifi cation of a coral reef mesocosm under
Management Proc. Inter. Symp. Malang, 1998, 126-153.
increased CO partial pressure. Limnology and Oceanography
Moosa, M. K. (ed.) (2002). Proceedings of the 9th International Coral Reef
2
47(2):558-564.
Symposium. Bali, Indonesia: Research andDevelopment Centre for
Llewellyn, G. (1998). Why preserve biodiversity? Building an economic case
Oceanology.
for preserving coral reefs. Journal of Coastal Development 1: 319-328.
Morgan, J. (1989). Large marine ecosystems in the Pacifi c Ocean. p 377-
Llewellyn, G. (1999). Review of existing laws and policies relating to
394. In: Sherman, K., Alexander, L.M. and Gold, B.D. (eds.) Biomass
migratory marine species conservation and commercial and coastal
Yields and Geography of Large Marine Ecosystems. AAAS Selected
fi sheries. WWF Unpublished Paper.
Symposium 111. Westview Press. Boulder CO.
Llewellyn, G. (In press). History of Conservation Planning in Wallacea.
MPP-EAS (1998). Marine pollution management in the Malacca/
WWF Unpublished paper.
Singapore Straits: Lessons learned. MPP-EAS/Info99/195, GEF/UNDP/
Llewellyn, G. and Azhar, I. (1998). Science for management of coral reef
IMO Regional Programme for the Prevention and Management of
resources: an Indonesian perspective. Unpublished paper.
Marine Pollution in the East Asian Seas. Quezon City, Philippines.
LME (2003). Large Marine Ecosystems of the World. LME# 38 Indonesian
Msiska, O.V., Jiddawi, N. and Sumaila, U.R. (2001). The potential role of
Sea. Retrieved Augist 2003 from: http://www.edc.uri.edu/lme/text/
marine reserves in selected countries in East and Southern Africa.
indonesian-sea.htm
p 121-130. In: Sumaila, U.R. and Alder, J. (eds.) Economics of Marine
MAC (2004). MAC Certifi ed Industry Operators. Marine Aquarium
Protected Areas. Papers, Discussions and Issues: A Conference held
Council. Retrieved Sept. 2003 from: http://aquariumcouncil.org/
at the UBC Fisheries Centre July 2000. Published by The Fisheries
subpage.asp?page=130§ion=3
Centre, University of British Columbia, Vancouver, Canada.
MacKinnon, K., Hatta, G., Halim, H. and Mangalik, A. (1996). The Ecology
National Research Council (2001). Committee on the Evaluation, Design,
of Kalimantan. Periplus Editions.
and Monitoring of Marine Reserves and Protected Areas in the
Maclean, J.L. (1989). An overview of Pyrodinium red tides in the western
United States. Marine Protected Areas. Tools for sustaining ocean
Pacifi c. p 1-8 In: Hallegraeff , G.M. and Maclean, J.L. (eds.) Biology,
ecosystems. National Academy Press, Washington, D.C.
epidemiology and management of Pyrodinium red tides. ICLARM
NOAA (1991). Report of the ad hoc Committee on Large Marine
Conf. Proc. 21: Fisheries Deapartment, Ministry of Development,
Ecosystems. NOAA Technical Memorandum NMFS-F/NEC-92.
Brunei Darussalam, and International Centre of Living Aquatic
ORNL (2003). Landscan 2002. Oak Ridge National Laboratory. Retrieved
Management, Manila, Philippines.
November 2003 from: http://www.ornl.gov/gist
Marsden, B. (1998). The analysis of aquaculture in the coastal areas
Pacifi c Consultants International (2001). Study on Fisheries Development
of Lampung, evolution, status and potential. Proyek Pesisir
Policy Formulation. Volume I. White Paper. Report by Pacifi c
Publications TE-99/06.
Consultants International under Jakarta Fishing Port/Market
McManus, J.W. (1988). Coral reefs of the ASEAN region: status and
Development Project (Phase IV: JBIC Loan No. IP-403).
management. Ambio 17(3):189-199.
82
GIWA REGIONAL ASSESSMENT 57 INDONESIAN SEAS
Pargal, S., Hettige, H., Singh, M., and Wheeler, D. (1997). Formal and
Pet-Soede, L., Cesar, H.S.J., and Pet, J. (1999b). An economic analysis of
informal regulation of industrial pollution: Comparative Evidence
blast fi shing on Indonesian coral reefs. Environmental Conservation
from Indonesia and the US. PRD Working Paper No. 1797 World Bank
26:83-93.
Policy Research Working Paper Series.
Phipps, C.V.G., and Roberts, H.H. (1988). Seismic characteristics and
Pauly, D. (1989). Fisheries resources management in south-east Asia:
accretion history of Halimeda bioherms on Kalukalukuang Bank,
Why bother? p 1-9 In: Chua, T.E. and Pauly, D. (eds.) Coastal area
eastern Java Sea (Indonesia). Coral Reefs 6:149-159.
management in South-east Asia: Policies, management strategies
PHKA (2002). Technical Guidance on Zonation of Indonesia's Marine
and case studies. Proceedings of the ASEAN/US Policy Workshop on
National Park System (In Indonesian; Pedoman Penataan Zona
Coastal Area Management Johore Bahru, Malaysia. 25-27 October
Taman Nasional Perairan Laut). Jakarta, Indonesia.
1988.
Polunin, N.V.C. (1983). The marine resources of Indonesia. Oceanography
Pauly, D., Saeger, J., and Prein, M. (1998). Malthus und die Kuestenfi scherei
and Marine Biology Annual Review 21:455-531.
der Tropen: eine philippinische Fallstudie. Entwicklung und
Pratt, V.R. (1996). The growing threat of cyanide fi shing in the Asia
Ländlicher Raum 32(2):17-20. (In German)
Pacifi c Region, and the emerging strategies to combat it. Coastal
Pauly, D., Christensen, V., Guénette, S., Pitcher, T.J., Sumaila, S.R., Walters,
Management in Tropical Asia 5:9-11
C.J., Watson, R. and Zeller, D. (2002). Towards sustainability in world
Priyono, B.E. and Sumiono, B. (1997). The marine fi sheries of Indonesia, with
fi sheries. Nature 418:689-696.
emphasis on the coastal demersal stocks of the Sunda Shelf. p 38-46
Pearce, F. (2000). Tails of woe. New Scientist November 11.
In: Silvestre, G. and Pauly, D. (eds.) Status and Management of Tropical
PEMSEA (2002). Draft Sustainable Development Strategy for the Seas of
Coastal Fisheries in Asia. ICLARM Conference Proceedings 53.
East Asia. GEF/UNDP/IMO Regional Programme on Partnerships in
Reynaud S., Leclercq N., Romaine-Lioud S., Ferrier-Pagčs C., Jaubert J. and
Environmental Management for the Seas of East Asia.
Gattuso J.-P. (2003). Interacting eff ects of CO partial pressure and
2
Perrin, W.F., Reeves, R.R., Dolar, M.L.L., Jeff erson, T.A., Marsh, H., Wang
temperature on photosynthesis and calcifi cation in a scleractinian
J.Y., and Estacion, J. (eds). (2002). Report of the Second Workshop
coral. Global Change Biology 9(11):1660-1668.
on the Biology and Conservation of small Cetaceans and Dugongs
Roberts, H.H., Phipps, C.V.G. and Eff endi, L. (1987). Halimeda bioherms
of SE Asia. Silliman University, Dumaguete City, Philippines 24-26
of the eastern Java Sea, Indonesia. Geology 15:371-374.
July, 2002.
Roberts, C.M. and Hawkins, J.P. (2000). Fully-protected marine reserves:
Pet, J. (1997). Destructive fi shing methods in and around Komodo
A guide. WWF in Washington DC USA, University of York, York, UK.
National Park. SPC Live Reef Fish Bulletin 2:20-24.
Roberts, C.M., Bohnsack, J.A., Gell F., Hawkins, J.P. and Goodridge, R.
Pet, J. (1999). Marine resource utilization in Komodo National Park,
(2001). Eff ects on marine reserves on adjacent fi sheries. Science
Monitoring Report, 1997-98. The Nature Conservancy.
294:1920-1923.
Pet, J. and Djohani, R. (1996). A framework for management of the
Roberts, C.M., and Sargant, H. (2001). Estimating the fi shery benefi ts
marine resources of Komodo National Park and surrounding marine
of fully-protected marine reserves: why habitat and behaviour are
areas in Eastern Indonesia. The Nature Conservancy.
important. p 171-182 In: Sumaila, U.R. and Alder, J. (eds.) Economics
Pet, J. and Djohani, R. (1998). Combating destructive fi shing practices
of Marine Protected Areas. Papers, Discussions and Issues:
in KNP: ban the hookah compressor. SPC Live Reef Fish Bulletin 4:
Conference of the UBC Fisheries Centre, July 2000. The Fisheries
17-28.
Centre, University of British Columbia, Vancouver, Canada.
Pet, J. and Pet-Soede, L. (1999). A note on cyanide fi shing in Indonesia.
Roberts, C.M., Colin, J.M., Veron, J.E.N., Hawkins, J.P., Allen, G.R., McAllister,
SPC Live Reef Fish Bulletin 5:21-22.
D.E., Mittermeier, C.G., Svhueller, F.W., Spalding, M., Wells, F., Vynne,
Pet-Soede, L. (2000). Options for Co-management of an Indonesian
C. and Werner, T.B. (2002). Marine biodiversity hotspots and
Coastal Fishery. Wageningen University, Netherlands.
conservation priorities for tropical reefs. Science 295:1280-1284.
Pet-Soede, L. and Erdmann, M. (1999). An overview and comparison
Rodwell, L.D., Barbier, E.B., Roberts, C.M. and McClanahan, T.R. (2001). A
of destructive fi shing practices in Indonesia. SPC Live Reef Fish
bioeconomic analysis of tropical marine reserve-fi shery linkages:
Bulletin 4:28-36.
Mombasa Marine National Park. p 183-197.In: Sumaila U.R. and Alder
Pet-Soede, L., Cesar, H.S.J., and Pet, J. (1999a). Short sharp shock the
J. (eds.) Economics of Marine Protected Areas. Papers, Discussions
economics of blast fi shing in Indonesia. Reef Encounter 26:9-10.
and Issues: Conference of the UBC Fisheries Centre, July 2000.
The Fisheries Centre, University of British Columbia, Vancouver,
Canada.
REFERENCES
83
Rossiter, W.W. (2002). Fisheries conservation crisis in Indonesia. Massive
Salm, R.V., Smith, S.E. and Llewellyn, G. (2001). Mitigating the impact of
destruction of marine mammals, sea turtles and fi sh reported
coral bleaching through marine protected area design. p 81-88 In:
from trap nets in pelagic migratory channel. Cetacean Society
Schuttenberg, H.Z. (ed.) Coral Bleaching: Causes, Consequences
International.
and Response. Selected papers presented at the 9th International
Rudd, M.A., Danylchuk, A.J., Gore, S.A. and Tupper, M.H. (2001). Are
Coral Reef Symposium on Coral Bleaching: Assessing and Linking
marine protected areas in the Turks and Caicos Islands Ecologically
Ecological and Socioeconomic Impacts, Future Trends and
or Economically Valuable. p 198-211 In: Sumaila, U.R. and Alder, J.
Mitigation Planning. Coastal Management Report No. 2230, Coastal
(eds.) Economics of Marine Protected Areas. Papers, Discussions
Resources Center, University of Rhode Island.
and Issues: Conference of the UBC Fisheries Centre, July 2000.
Sanchirico, J.N. and Wilen J.E. (2001). The impacts of marine reserves
The Fisheries Centre, University of British Columbia, Vancouver,
on limited entry fi sheries. p 13-18 In: Sumaila, U.R. and Alder, J.
Canada.
(eds.) Economics of Marine Protected Areas. Papers, Discussions
Rudd, M.A. and Tupper, M.H. (2002). The impact of Nassau grouper size
and Issues: Conference of the UBC Fisheries Centre, July 2000.
and abundance on scuba diver site selection and MPA economics.
The Fisheries Centre, University of British Columbia, Vancouver,
Coastal Management 30:133-151
Canada.
Rudd, M.A., Tupper, M.H., Folmer, H., and van Kooten, G.C. (2003). Policy
Sardjono, I. (1980). Trawlers banned in Indonesia. ICLARM Newsletter
analysis for tropical marine reserves: challenges and directions. Fish
3(4):3.
and Fisheries 4(1):65.
Sharma, C. (2000). Skirting the ban. Illegal trawling takes a heavy toll on
Ruitenbeek H.J. (2001). An economic analysis of the spawning
fi shing communities in North Sumatra. Yemaya 3:4-10.
aggregation function in Komodo National Park, Indonesia. SPC
Soegiarto, A. and Polunin, N. (1981). The marine environment of
Live Reef Fish Bulletin 9.
Indonesia. Report prepared for the Government of Indonesia.
Russ, G. (1985). Eff ects of protective management on coral reef fi shes
IUCN/WWF.
in the central Philippines. Proceedings 5th International Coral Reef
Soehartono, T. (1994). Marine Turtle Conservation in Indonesia. In:
Congress 4:219-224.
Proceedings of the First SEAN Symposium-Workshop on Marine
Russ, G. and Alcala, A. (1996a). Marine reserves: rates and patterns
Turtle Conservation, Manila, Philippines, 1993. WWF and USAID in
of recovery and decline in abundance of large predatory fi sh.
cooperation with PCP-PAWB-DENR and MTF.
Ecological Applications 6:947-961.
Soemodihardjo, S. (ed.) (1999). Contending with Global Change Study
Russ, G. and Alcala, A. (1996b). Do marine reserves export adult fi sh
No. 10 Proceedings: Coral Reef Evaluation Workshop Pulau Seribu,
biomass? Evidence from Apo Island, central Philippines. Marine
Jakarta, Indonesia. UNESCO/Indonesian Ministry of Sciences.
Ecology Progress Series 132:1-9.
Soenarno, I. (1995). Irrigation management transfer in Indonesia. p 89-
Salm, R.V. (1984). Ecological boundaries for coral reef reserves: Principles
98 In: International Irrigation Management Institute. Conference on
and guidelines. Environmental Conservation 11(1):7-13.
Irrigation Management Transfer in Asia, in Bangkok and Chiang Mai,
Salm, R.V. (2002). How can the global problem of climate related
25-29 September 1995.
coral bleaching be addressed locally in MPAs? Preparing Marine
Spalding, M., Ravilious, C. and Green, E.P. (2001). World Atlas of Coral
Protected Areas to Survive Global Change. Additional Guidelines
Reefs. United Nations Environment Programme World Conservation
to Address Coral Bleaching. International Union for Conservation
Monitoring Centre.
of Nature and Natural Resources.
Statistik Indonesia. (1996). Central bureau of statistics, statistical
Salm, R.V. and Halim, I.M. (1984). Marine Conservation Data Atlas.
evaluation and report division.
Indonesia. IUCN/WWF Project 3108.
Suharsono (1997). Coral bleaching in Indonesia. p 517-520 In: Tomascik,
Salm, R.V., Clarke, J.R., and Siirila, E. (2000). Marine and Coastal Protected
T., Mah, A.J., Nontji, A., and Moosa, M.K. (1997). The Ecology of the
Areas: A Guide for Planners and Managers. IUCN. Washington DC, US.
Indonesian Seas. Periplus Editions.
Salm, R.V. and S.L. Coles (eds.) (2001). Coral Bleaching and Marine
Suharsono (1999). Bleaching event followed by mass mortality of corals
Protected Areas. Proceedings of the Workshop on Mitigating Coral
in 1998 in Indonesian waters. Proceedings of the 9th JSPS Joint
Bleaching Impact Through MPA Design, Bishop Museum, Honolulu,
Seminar on Marine Fisheries Sciences 179-187.
Hawaii, 29-31 May 2001. Asia Pacifi c Coastal Marine Program Report
Susiloweti, I. (1998). Fisheries regulation and enforcement in Indonesia,
No. 0102, The Nature Conservancy, Honolulu, Hawaii, US.
Malaysia and the Philippines. Journal of Coastal Development
1:275-281.
84
GIWA REGIONAL ASSESSMENT 57 INDONESIAN SEAS
Tanzer J. (1998). Fisheries in the Great Barrier Reef Marine Park - seeking
Wabnitz, C., Taylor, M., Green, E., Razak, T. (2003). From Ocean to
the balance. Parks 8(2):41-46.
Aquarium: The Global Trade in Marine Ornamentals. UNEP/WCMC
TNC (The Nature Conservancy) (2000). Coastal and Marine Conservation
Cambridge, UK.
Center Indonesia Program Portfolio. The Nature Conservancy
Wallace, C.C. and Wolstenholme, J. (1998). Revision of the coral genus
publications.
Acropora (Scleractinia: Astrocoeniina: Acroporidae) in Indonesia.
Talaue-McManus, L. (2000). Transboundary Diagnostic Analysis for the
Zoological Journal of the Linnean Society 123:199-384.
South China Sea. EAS/RCU Technical Report Series No. 14. UNEP,
Watson, R. and Pauly, D. (2001). Systematic distortions in world fi sheries
Bangkok, Thailand.
catch trends. Nature 414:536-538.
Timmermann, A., Oberhuber, J., Bacher, A., Esch, M., Latif, M. & Roeckner,
Weber, M.L. (1998). A Global Assessment of Major Fisheries at Risk,
E. 1999. Increased El Nińo frequency in a climate model forced by
Relevant Management Regimes, and Non-governmental
future greenhouse warming. Nature 398:694-697.
Organizations. Prepared for the Pew Charitable Trusts.
Tomascik, T., van Woesik, R. and Mah, A.J. (1996). Rapid colonisation
West, J.M. (2001). Environmental Determinants of Resistance to Coral
of a recent lava fl ow following a volcanic eruption, Banda Islands,
Bleaching: Implications for Management of Marine Protected Areas.
Indonesia. Coral Reefs 15:169-175.
p 40-52 In: Salm, R.V. and Coles, S.L. (eds.) Coral Bleaching and Marine
Tomascik, T., Mah, A.J., Nontji, A., and Moosa, M.K. (1997). The Ecology of
Protected Areas. Proceedings of the Workshop on Mitigating Coral
the Indonesian Seas. Periplus Editions.
Bleaching Impact Through MPA Design, Bishop Museum, Honolulu,
Turner, R.K., and Adger, W.N. (1996). Coastal Zone Resources Assessment
Hawaii, 29-31 May 2001. Asia Pacifi c Coastal Marine Program Report
Guidelines. Land-Ocean Interactions in the Coastal Zone Reports
No. 0102. The Nature Conservancy, Honolulu, Hawaii, US.
and Studies No. 4, IGBP/LOICZ, Texel, The Netherlands.
West, J.M, and Salm, R.V. (2003). Resistance and resilience to
UN (2002). Johannesburg Summit (2002) Indonesia Country Profi le.
coral bleaching: Implications for coral reef conservation and
United Nations Department of Economic and Social Aff airs. Division
management. Conservation Biology 17:956-967.
for Sustainable Development. Retrieved Sept. 2003 from: http://
Westmacott, S., Teleki, K., Wells, S., and West, J. (2000). Management
www.un.org/esa/agenda21/natlinfo/wssd/indonesia.pdf
of bleached and severely damaged coral reefs. IUCN, Gland,
UNDP (1991). Regional Programme for the Prevention and Management
Switzerland.
of Marine Pollution in the East Asian Seas. United Nations
Widiadana, R.A. (2002). Businessmen urged to exploit RI's eastern waters.
Development Programme.
The Jakarta Post, July 18.
UNEP-WCMC (2003). From Ocean to Aquarium: The Global Trade in
Wilkinson, C.R. (ed.) (1994). Living Coastal Resources of Southeast
Marine Ornamnetals. UNEP World Conservation Monitoring Centre.
Asia: Status and Management. Report of the Consultative Forum,
Cambridge, UK.
3rd ASEAN-Australia Symposium on Living Coastal Resources,
UNEP/WCMC (2004). CITES Trade Database. United Nations Environment
Chulalongkorn University, Bangkok, Thailand, May 1994. Australian
Programme/World Conservation Monitoring Center.
Institute of Marine Science, Townsville, Australia.
UNESCO (1995). Proceedings of the Coral Reef Evaluation Workshop,
Wilkinson, C.R. (1996). Global change and coral reefs: impacts on
Pulau Seribu, 11-20 September 1995. Study No. 10. UNESCO Jakarta
reefs economics and human cultures. Global Change Biology
Offi
ce.
2:547-558.
van Woesik, R. (2004). Comment on "Coral Reef Death During the Indian
Wilkinson, C.R. (ed.) (1998). Status of Coral Reefs of the World: 1998.
Ocean Dipole Linked to Indonesian Wildfi res". Science 293:1297.
Australian Institute of Marine Science.
Venema, S.C. (ed.) (1996). Report on the Indonesia/FAO/DANIDA
Wilkinson, C.R. (1999). Global and local threats to coral reef functioning
Workshop on the assessment of the potential of the marine fi shery
and existence: review and predictions. Marine and Freshwater
resources of Indonesia. GCP/INT/575/DEN. FAO fi sheries Technical
Research 50:867-878.
paper 338. Food and Agricultural Organization of the United
Wilkinson, C.R. (ed.) (2000). Status of Coral Reefs of the World: 2000.
Nations, Rome, Italy.
Australian Institute of Marine Science.
Veron, J.E.N. (1995). Corals in space and time: biogeography and
Wilkinson, C.R. (ed.) (2002). Status of Coral Reefs of the World: 2002.
evolution of the Scleractinia. UNSW Press, Sydney.
Australian Institute of Marine Science.
Veron, J.E.N. (2000). Corals of the World. 3 Volumes. Australian Institute
of Marine Science, Townsville, Australia.
REFERENCES
85
Wilkinson, C.R., Linden, O., Cesar, H, Hodgson, G., Rubens, J. and Strong,
Personal communication
A.E. (1999). Ecological and socioeconomic impacts of the 1998 coral
Chua T. E. (Partnership in Environmental Management for the Seas of
mortality in the Indian Ocean: An ENSO Impact and a warning of
East Asia PEMSEA))
future change? Ambio: 28:188-196.
DeVantier, L. (International Marine Project Activities Centre and CRC Reef
Williams M.J. (1998). Fisheries and marine protected areas. Parks
Research Centre, Townsville, Australia)
8:2:41-46.
Djohani,R. (The Nature Conservancy Coastal and Marine Program
World Bank (1999). World Development Report 1998/99. The
Indonesia Denpasar, Indonesia)
International Bank for Reconstruction and Development/The
Erdmann, M. (Bunaken National Park, Manado, Indonesia)
World Bank, Washington DC, USA. Retrieved Aug. 2003 from: http/
Hopley D. (Townsville, Australia)
/:www.worldbank.org/nipr/wdi98/index.html
Jones, S. (NSR Environmental consultants)
World Bank (2003). Gender Stats Database on Gender Statistics.
Kahn, B. (APEX International)
Retrieved Aug. 2003 from: http//:www.devdata.worldbank.org/
Kartawinata, K. (Bulungan Research Forest, East Kalimantan, Indonesia
external/CPProfi le.asp
Mous, P. (The Nature Conservancy Coastal and Marine Program
WRI (2000). World Resources 2000-2001. Table BI.2. Globally Threatened
Indonesia, Denpasar, Indonesia)
Species: Mammals, Birds and Reptiles. Retrieved Sept. 2003 from:
Miclat, E. (World Wide Fund for Nature WWF)
http://www.wri.org
Pet, J. (Programme Manager, South East Asia Center for Marine
WWF Indonesia. (2000). Turning the Tide Marine Conservation in the
Protected Areas SEACMPA The Nature Conservancy Indonesia,
Wallacea Bioregion. WWF publ.
Sanur, Bali, Indonesia
Zijlstra, J.J. and Baars,M.A. 1990. Productivity and fi sheries potential of
Putra, K. (Ministry of Marine Aff airs and Fisheries (DKP), and James Cook
the Banda Sea ecosystem. p 54-65 In: Sherman, K. and Alexander,
University of North Queensland, Australia)
L.M. and Gold, B.D. (eds.) Large Marine Ecosystems-Patterns,
Suharsono (Indonesian ministry of Sciences (P3O-LIPI), Jakarta,
Processes, and Yields. AAAS Selected Symposium, American
Indonesia)
Association for the Advancement of Science Publ. No. 90-305,
Turak, E. (Environmental Protection Agency, Australia)
Washington, DC.
Veron, J.E.N. (Australian Institute of Marine Science AIMS)
86
GIWA REGIONAL ASSESSMENT 57 INDONESIAN SEAS
Annexes
Annex I
List of contributing authors and organisations involved
Name
Institutional affiliation
Country
Field of work
Dr. Achmad Abdullah(deceased)
Conservation and Marine National Parks, Ministry of Marine Affairs and Fisheries, Jakarta
Indonesia
Natural resources management and protected areas policy
Directorate for Marine and Coastal Degradation Control, Environment Impact Management
Ms. Heni Augustina
Indonesia
Coastal and marine pollution, health and EIA policy
Agency, (BAPEDAL), Jakarta
Ms. Winny Astuty
11 March University Solo, Indonesia and James Cook University of North Queensland
Australia
Tropical natural resources management
Dr. Imam Bachtiar
Biology Department, FKIP, Universitas Mataram, Lombok
Indonesia
Coral reef ecosystems, global change and fisheries
Mr. David Bizot
East Asian Seas Regional Coordinating Unit (UNEP EAS/RCU), Bangkok
Thailand
Coastal and marine environmental management policy
Terrestrial and marine protected areas - assessment, planning,
Ms. Catherine Cheung
C.R.E.S.T.
Australia
management and policy
Dr. Lyndon DeVantier
International Marine Project Activities Centre and CRC Reef Research Centre, Townsville
Australia
Coral reef ecosystems and marine protected areas
Marine protected areas and fisheries - assessment, planning,
Ms. Rili Djohani
The Nature Conservancy Coastal and Marine Program Indonesia, Denpasar, Bali
Indonesia
management and policy
Marine protected areas assessment, planning, management
Dr. Ian Dutton
The Nature Conservancy Coastal and Marine Program Indonesia, Jakarta
Indonesia
and policy
Ms. Dyah Ernawati
11 March University Solo, Indonesia and James Cook University of North Queensland
Australia
Tropical natural resources management
Marine protected areas and coral reef biodiversity - assessment,
Dr. Mark Erdmann
Natural Resources Management (USAID), Bunaken National Park, Manado, North Sulawesi
Indonesia
planning, management and policy
Dr. Stefano Fazi
UNESCO, Jakarta
Indonesia
Natural resources management and protected areas
Dr. Jamal Jompa
University, Makassar, Sulawesi
Indonesia
Coral reef ecosystems and fisheries
Dr. Benjamin Kahn
APEX Environmental
Australia
Cetacean biology and ecology
Mr. Maarten Kuijper
UNESCO IOC/WESPAC Secretariat, Bangkok
Thailand
Tropical natural resources management and protected areas
Mr. Mirza Kusrini
Bogor Agriculture University, Indonesia and James Cook University of North Queensland
Australia
Tropical forests and natural resources management
Dr. David Lawrence
International Marine Project Activities Centre, Townsville
Australia
Natural resources management and socio-economics
Mr. Semuel Littik
UNPATTI- Ambon, Indonesia and James Cook University of North Queensland
Australia
Tropical natural resources management
Dr. Jacobus Mosse
James Cook University of North Queensland
Australia
Fisheries and tropical natural resources management
Dr. Peter J. Mous
The Nature Conservancy Coastal and Marine Program Indonesia, Denpasar, Bali
Indonesia
Tropical marine resources management and protected areas
South East Asia Center for Marine Protected Areas (SEACMPA) The Nature Conservancy Indonesia,
Tropical natural resources management, fisheries and protected
Dr.Ir. Jos S. Pet
Indonesia
Sanur, Bali
areas
Fisheries, tropical natural resources management and protected
Dr. Lida Pet-Soede
WWF Indonesia - Wallacea Program
Indonesia
areas
Coastal and Marine Environmental Management Policy, The State Ministry for Environment,
Dr. Srihartiningsih Purnomohadi
Indonesia
Coastal and marine environmental policy socio-economics
Jakarta
Mr. Ketut Sarjana Putra
WWF Indonesia-Wallacea Bioregion Programme, Denpasar, Bali
Indonesia
Coastal and marine environmental management
ANNEXES
87
Departemen Kelautan dan Perikanan/Ministry of Marine Affairs and Fisheries (DKP), and James
Coastal and marine environmental management, socio-economics
Dr. Sapta Putra
Australia
Cook University of North Queensland
and policy
Departemen Kelautan dan Perikanan/ Ministry of Marine Affairs and Fisheries (DKP) Jakarta,
Mr. Fayakun Satria
Australia
Fisheries assessment, policy, resource economics
Indonesia and James Cook University of North Queensland
Tropical natural resources management, coral reefs and global
Ms. Heidi Schuttenberg
East Asian Seas Regional Coordinating Unit (UNEP EAS/RCU), Bangkok
Thailand
change
Dr. David Souter
GIWA Core Team, Kalmar University
Sweden
Coral reef ecosystems and tropical natural resources management
Prof. Robin South
International Ocean Institute Regional Centre for Australia and the Western Pacific, Townsville
Australia
Coral reef ecosystems and tropical natural resources management
Dr. Posa Skelton
International Ocean Institute Regional Centre for Australia and the Western Pacific, Townsville
Australia
Coral reef ecosystems and tropical natural resources management
Dr. Jan Steffan
UNESCO, Jakarta
Indonesia
Tropical natural resources management, planning and policy
Dr. Suharsono
Indonesian ministry of Sciences (P3O-LIPI), Jakarta
Indonesia
Coral reef ecosystems biodiversity, status and global change
GEF/UNDP/IMO Regional Programme on Partnerships in Environmental Management for the Seas
Coastal and marine environmental management planning,
Dr. Chua Thia-Eng
Philippines
of East Asia (PEMSEA), Quezon City, Manila
socio-economics and policy
Tropical marine ecosystems assessment, monitoring,
Dr. Clive Wilkinson
International Marine Projects Activities Centre and CRC Reef Research Centre, Townsville
Australia
management and policy
Mr. Windarti
Riau University-Pekanbaru and James Cook University of North Queensland
Australia
Natural resources management
Ms. Nuning S Wirjoatmodjo
UNESCO, Jakarta
Indonesia
Coastal and marine environmental management and planning
Coastal and marine environmental management and planning
Mr. Simon Woodley
CRC Reef Research Centre, Townsville,
Australia
resource economics
88
GIWA REGIONAL ASSESSMENT 57 INDONESIAN SEAS
Annex
Anne I
x I
I
Detai
Deta l
i ed sc
l
or
ed sco i
r n
i g ta
n
bles
g ta
: Sunda
I: Freshwater shortage
II: Pollution
Weight
Weight
Environmental
Environmental
Environmental issues
Score
Weight %
averaged
Environmental issues
Score
Weight %
averaged
concern
concern
score
score
1. Modification of stream flow
2
N/A
Freshwater shortage
3
4. Microbiological
3
N/A
Pollution
3
2. Pollution of existing supplies
3
N/A
5. Eutrophication
2
N/A
3. Changes in the water table
3
N/A
6. Chemical
3
N/A
7. Suspended solids
3
N/A
Criteria for Economic impacts
Raw score
Score
Weight %
8. Solid wastes
3
N/A
Size of economic or public sectors
Very small
Very large
3
N/A
affected
0 1 2 3
9. Thermal
1
N/A
Degree of impact (cost, output changes
Minimum
Severe
3
N/A
etc.)
0 1 2 3
10. Radionuclide
0
N/A
Occasion/Short
Continuous
Frequency/Duration
3
N/A
0 1 2 3
11. Spills
2
N/A
Weight average score for Economic impacts
3
Criteria for Health impacts
Raw score
Score
Weight %
Criteria for Economic impacts
Raw score
Score
Weight %
Very small
Very large
Number of people affected
3
N/A
Size of economic or public sectors
Very small
Very large
0 1 2 3
3
N/A
affected
0 1 2 3
Minimum
Severe
Degree of severity
3
N/A
Degree of impact (cost, output changes
Minimum
Severe
0 1 2 3
3
N/A
etc.)
0 1 2 3
Occasion/Short
Continuous
Frequency/Duration
3
N/A
Occasion/Short
Continuous
0 1 2 3
Frequency/Duration
3
N/A
0 1 2 3
Weight average score for Health impacts
3
Weight average score for Economic impacts
3
Criteria for Other social and
Raw score
Score
Weight %
community impacts
Criteria for Health impacts
Raw score
Score
Weight %
Number and/or size of community
Very small
Very large
3
N/A
Very small
Very large
affected
0 1 2 3
Number of people affected
3
N/A
0 1 2 3
Minimum
Severe
Degree of severity
3
N/A
Minimum
Severe
0 1 2 3
Degree of severity
3
N/A
0 1 2 3
Occasion/Short
Continuous
Frequency/Duration
3
N/A
Occasion/Short
Continuous
0 1 2 3
Frequency/Duration
3
N/A
0 1 2 3
Weight average score for Other social and community impacts
3
Weight average score for Health impacts
3
Note: N/A = Not applied
Criteria for Other social and
Raw score
Score
Weight %
community impacts
Number and/or size of community
Very small
Very large
3
N/A
affected
0 1 2 3
Minimum
Severe
Degree of severity
3
N/A
0 1 2 3
Occasion/Short
Continuous
Frequency/Duration
3
N/A
0 1 2 3
Weight average score for Other social and community impacts
3
Note: N/A = Not applied
ANNEXES
89
III: Habitat and community modification
IV: Unsustainable exploitation of fish and other
living resources
Weight
Weight
Environmental
Environmental
Environmental issues
Score
Weight %
averaged
Environmental issues
Score
Weight %
averaged
concern
concern
score
score
Habitat and community
12. Loss of ecosystems
3
N/A
3
Unsustainable
modification
14. Overexploitation
3
N/A
3
exploitation of fish
13.Modification of ecosystems or
15. Excessive by-catch and
3
N/A
ecotones, including community
discards
3
N/A
structure and/or species
composition
16. Destructive fishing practices
3
N/A
17. Decreased viability of stock
3
N/A
through pollution and disease
Criteria for Economic impacts
Raw score
Score
Weight %
18. Impact on biological and
3
N/A
genetic diversity
Size of economic or public sectors
Very small
Very large
3
N/A
affected
0 1 2 3
Degree of impact (cost, output changes
Minimum
Severe
3
N/A
etc.)
0 1 2 3
Criteria for Economic impacts
Raw score
Score
Weight %
Occasion/Short
Continuous
Frequency/Duration
3
N/A
0 1 2 3
Size of economic or public sectors
Very small
Very large
3
N/A
affected
0 1 2 3
Weight average score for Economic impacts
3
Degree of impact (cost, output changes
Minimum
Severe
3
N/A
etc.)
0 1 2 3
Criteria for Health impacts
Raw score
Score
Weight %
Occasion/Short
Continuous
Frequency/Duration
3
N/A
0 1 2 3
Very small
Very large
Number of people affected
1
N/A
0 1 2 3
Weight average score for Economic impacts
3
Minimum
Severe
Degree of severity
3
N/A
0 1 2 3
Criteria for Health impacts
Raw score
Score
Weight %
Occasion/Short
Continuous
Frequency/Duration
2
N/A
0 1 2 3
Very small
Very large
Number of people affected
2
N/A
0 1 2 3
Weight average score for Health impacts
2
Minimum
Severe
Degree of severity
1
N/A
0 1 2 3
Criteria for Other social and
Raw score
Score
Weight %
Occasion/Short
Continuous
community impacts
Frequency/Duration
2
N/A
0 1 2 3
Number and/or size of community
Very small
Very large
3
N/A
affected
0 1 2 3
Weight average score for Health impacts
2
Minimum
Severe
Degree of severity
3
N/A
Criteria for Other social and
0 1 2 3
Raw score
Score
Weight %
community impacts
Occasion/Short
Continuous
Frequency/Duration
3
N/A
0 1 2 3
Number and/or size of community
Very small
Very large
3
N/A
affected
0 1 2 3
Weight average score for Other social and community impacts
3
Minimum
Severe
Degree of severity
3
N/A
0 1 2 3
Note: N/A = Not applied
Occasion/Short
Continuous
Frequency/Duration
3
N/A
0 1 2 3
Weight average score for Other social and community impacts
3
Note: N/A = Not applied
90
GIWA REGIONAL ASSESSMENT 57 INDONESIAN SEAS
V: Global change
Weight
Environmental
Environmental issues
Score
Weight %
averaged
concern
score
19. Changes in the hydrological
2
N/A
Global change
1
cycle
20. Sea level change
1
N/A
21. Increased UV-B radiation as a
0
N/A
result of ozone depletion
22. Changes in ocean CO 2
0
N/A
source/sink function
23. Increase in sea surface
2
N/A
temperature
Criteria for Economic impacts
Raw score
Score
Weight %
Size of economic or public sectors
Very small
Very large
1
N/A
affected
0 1 2 3
Degree of impact (cost, output changes
Minimum
Severe
2
N/A
etc.)
0 1 2 3
Occasion/Short
Continuous
Frequency/Duration
1
N/A
0 1 2 3
Weight average score for Economic impacts
1
Criteria for Health impacts
Raw score
Score
Weight %
Very small
Very large
Number of people affected
0
N/A
0 1 2 3
Minimum
Severe
Degree of severity
0
N/A
0 1 2 3
Occasion/Short
Continuous
Frequency/Duration
0
N/A
0 1 2 3
Weight average score for Health impacts
0
Criteria for Other social and
Raw score
Score
Weight %
community impacts
Number and/or size of community
Very small
Very large
1
N/A
affected
0 1 2 3
Minimum
Severe
Degree of severity
0
N/A
0 1 2 3
Occasion/Short
Continuous
Frequency/Duration
1
N/A
0 1 2 3
Weight average score for Other social and community impacts
1
Note: N/A = Not applied
Comparative environmental and socio-economic impacts of each GIWA concern
Types of impacts
Environmental score
Economic score
Human health score
Social and community score
Overall
Concern
Rank
score
Present (a)
Future (b)
Present (c)
Future (d)
Present (e)
Future (f)
Present (g)
Future (h)
Freshwater shortage
3
3
3
3
3
2
3
2
2.8
2
Pollution
3
3
3
3
3
3
3
3
3.0
1
Habitat and community
3
3
3
3
2
2
3
3
2.8
3
modification
Unsustainable exploitation of fish
3
3
3
3
2
1
3
3
2.6
4
and other living resources
Global change
1
2
1
1
0
1
1
2
1.1
5
ANNEXES
91
Annex II
Detailed scoring tables: Wallacea
I: Freshwater shortage
II: Pollution
Weight
Weight
Environmental
Environmental
Environmental issues
Score
Weight %
averaged
Environmental issues
Score
Weight %
averaged
concern
concern
score
score
1. Modification of stream flow
2
N/A
Freshwater shortage
2
4. Microbiological
1
N/A
Pollution
1
2. Pollution of existing supplies
2
N/A
5. Eutrophication
1
N/A
3. Changes in the water table
3
N/A
6. Chemical
1
N/A
7. Suspended solids
2
N/A
Criteria for Economic impacts
Raw score
Score
Weight %
8. Solid wastes
2
N/A
Size of economic or public sectors
Very small
Very large
3
N/A
affected
0 1 2 3
9. Thermal
0
N/A
Degree of impact (cost, output changes
Minimum
Severe
3
N/A
etc.)
0 1 2 3
10. Radionuclide
0
N/A
Occasion/Short
Continuous
Frequency/Duration
3
N/A
0 1 2 3
11. Spills
2
N/A
Weight average score for Economic impacts
3
Criteria for Health impacts
Raw score
Score
Weight %
Criteria for Economic impacts
Raw score
Score
Weight %
Very small
Very large
Number of people affected
2
N/A
Size of economic or public sectors
Very small
Very large
0 1 2 3
3
N/A
affected
0 1 2 3
Minimum
Severe
Degree of severity
2
N/A
Degree of impact (cost, output changes
Minimum
Severe
0 1 2 3
3
N/A
etc.)
0 1 2 3
Occasion/Short
Continuous
Frequency/Duration
3
N/A
Occasion/Short
Continuous
0 1 2 3
Frequency/Duration
3
N/A
0 1 2 3
Weight average score for Health impacts
2
Weight average score for Economic impacts
3
Criteria for Other social and
Raw score
Score
Weight %
community impacts
Criteria for Health impacts
Raw score
Score
Weight %
Number and/or size of community
Very small
Very large
2
N/A
Very small
Very large
affected
0 1 2 3
Number of people affected
2
N/A
0 1 2 3
Minimum
Severe
Degree of severity
2
N/A
Minimum
Severe
0 1 2 3
Degree of severity
1
N/A
0 1 2 3
Occasion/Short
Continuous
Frequency/Duration
3
N/A
Occasion/Short
Continuous
0 1 2 3
Frequency/Duration
2
N/A
0 1 2 3
Weight average score for Other social and community impacts
2
Weight average score for Health impacts
2
Note: N/A = Not applied
Criteria for Other social and
Raw score
Score
Weight %
community impacts
Number and/or size of community
Very small
Very large
1
N/A
affected
0 1 2 3
Minimum
Severe
Degree of severity
1
N/A
0 1 2 3
Occasion/Short
Continuous
Frequency/Duration
1
N/A
0 1 2 3
Weight average score for Other social and community impacts
1
Note: N/A = Not applied
92
GIWA REGIONAL ASSESSMENT 57 INDONESIAN SEAS
III: Habitat and community modification
IV: Unsustainable exploitation of fish and other
living resources
Weight
Weight
Environmental
Environmental
Environmental issues
Score
Weight %
averaged
Environmental issues
Score
Weight %
averaged
concern
concern
score
score
Habitat and community
Unsustainable
12. Loss of ecosystems
2
N/A
3
14. Overexploitation
3
N/A
3
modification
exploitation of fish
13.Modification of ecosystems or
15. Excessive by-catch and
3
N/A
ecotones, including community
discards
3
N/A
structure and/or species
composition
16. Destructive fishing practices
3
N/A
17. Decreased viability of stock
1
N/A
through pollution and disease
Criteria for Economic impacts
Raw score
Score
Weight %
18. Impact on biological and
1
N/A
genetic diversity
Size of economic or public sectors
Very small
Very large
3
N/A
affected
0 1 2 3
Degree of impact (cost, output changes
Minimum
Severe
3
N/A
etc.)
0 1 2 3
Criteria for Economic impacts
Raw score
Score
Weight %
Occasion/Short
Continuous
Frequency/Duration
3
N/A
0 1 2 3
Size of economic or public sectors
Very small
Very large
3
N/A
affected
0 1 2 3
Weight average score for Economic impacts
3
Degree of impact (cost, output changes
Minimum
Severe
3
N/A
etc.)
0 1 2 3
Criteria for Health impacts
Raw score
Score
Weight %
Occasion/Short
Continuous
Frequency/Duration
3
N/A
0 1 2 3
Very small
Very large
Number of people affected
1
N/A
0 1 2 3
Weight average score for Economic impacts
3
Minimum
Severe
Degree of severity
2
N/A
0 1 2 3
Criteria for Health impacts
Raw score
Score
Weight %
Occasion/Short
Continuous
Frequency/Duration
3
N/A
0 1 2 3
Very small
Very large
Number of people affected
1
N/A
0 1 2 3
Weight average score for Health impacts
2
Minimum
Severe
Degree of severity
1
N/A
0 1 2 3
Criteria for Other social and
Raw score
Score
Weight %
Occasion/Short
Continuous
community impacts
Frequency/Duration
1
N/A
0 1 2 3
Number and/or size of community
Very small
Very large
3
N/A
affected
0 1 2 3
Weight average score for Health impacts
1
Minimum
Severe
Degree of severity
3
N/A
Criteria for Other social and
0 1 2 3
Raw score
Score
Weight %
community impacts
Occasion/Short
Continuous
Frequency/Duration
3
N/A
0 1 2 3
Number and/or size of community
Very small
Very large
3
N/A
affected
0 1 2 3
Weight average score for Other social and community impacts
3
Minimum
Severe
Degree of severity
3
N/A
0 1 2 3
Note: N/A = Not applied
Occasion/Short
Continuous
Frequency/Duration
3
N/A
0 1 2 3
Weight average score for Other social and community impacts
3
Note: N/A = Not applied
ANNEXES
93
V: Global change
Weight
Environmental
Environmental issues
Score
Weight %
averaged
concern
score
19. Changes in the hydrological
2
N/A
Global change
1
cycle
20. Sea level change
1
N/A
21. Increased UV-B radiation as a
0
N/A
result of ozone depletion
22. Changes in ocean CO 2
0
N/A
source/sink function
23. Increase in sea surface
2
N/A
temperature
Criteria for Economic impacts
Raw score
Score
Weight %
Size of economic or public sectors
Very small
Very large
0
N/A
affected
0 1 2 3
Degree of impact (cost, output changes
Minimum
Severe
0
N/A
etc.)
0 1 2 3
Occasion/Short
Continuous
Frequency/Duration
0
N/A
0 1 2 3
Weight average score for Economic impacts
0
Criteria for Health impacts
Raw score
Score
Weight %
Very small
Very large
Number of people affected
0
N/A
0 1 2 3
Minimum
Severe
Degree of severity
0
N/A
0 1 2 3
Occasion/Short
Continuous
Frequency/Duration
0
N/A
0 1 2 3
Weight average score for Health impacts
0
Criteria for Other social and
Raw score
Score
Weight %
community impacts
Number and/or size of community
Very small
Very large
0
N/A
affected
0 1 2 3
Minimum
Severe
Degree of severity
0
N/A
0 1 2 3
Occasion/Short
Continuous
Frequency/Duration
0
N/A
0 1 2 3
Weight average score for Other social and community impacts
0
Note: N/A = Not applied
Comparative environmental and socio-economic impacts of each GIWA concern
Types of impacts
Environmental score
Economic score
Human health score
Social and community score
Overall
Concern
Rank
score
Present (a)
Future (b)
Present (c)
Future (d)
Present (e)
Future (f)
Present (g)
Future (h)
Freshwater shortage
2
3
3
3
2
2
2
2
2.4
3
Pollution
1
2
3
2
2
2
1
1
1.8
4
Habitat and community
3
3
3
3
2
1
3
3
2.6
1
modification
Unsustainable exploitation of fish
3
3
1
3
1
1
3
3
2.3
2
and other living resources
Global change
1
2
0
2
0
1
0
1
0.9
5
94
GIWA REGIONAL ASSESSMENT 57 INDONESIAN SEAS
Annex II
Detailed scoring tables: Sahul
I: Freshwater shortage
II: Pollution
Weight
Weight
Environmental
Environmental
Environmental issues
Score
Weight %
averaged
Environmental issues
Score
Weight %
averaged
concern
concern
score
score
1. Modification of stream flow
2
N/A
Freshwater shortage
1
4. Microbiological
1
N/A
Pollution
1
2. Pollution of existing supplies
1
N/A
5. Eutrophication
0
N/A
3. Changes in the water table
1
N/A
6. Chemical
1
N/A
7. Suspended solids
1
N/A
Criteria for Economic impacts
Raw score
Score
Weight %
8. Solid wastes
1
N/A
Size of economic or public sectors
Very small
Very large
1
N/A
affected
0 1 2 3
9. Thermal
0
N/A
Degree of impact (cost, output changes
Minimum
Severe
1
N/A
etc.)
0 1 2 3
10. Radionuclide
0
N/A
Occasion/Short
Continuous
Frequency/Duration
1
N/A
0 1 2 3
11. Spills
1
N/A
Weight average score for Economic impacts
1
Criteria for Health impacts
Raw score
Score
Weight %
Criteria for Economic impacts
Raw score
Score
Weight %
Very small
Very large
Number of people affected
1
N/A
Size of economic or public sectors
Very small
Very large
0 1 2 3
1
N/A
affected
0 1 2 3
Minimum
Severe
Degree of severity
1
N/A
Degree of impact (cost, output changes
Minimum
Severe
0 1 2 3
1
N/A
etc.)
0 1 2 3
Occasion/Short
Continuous
Frequency/Duration
1
N/A
Occasion/Short
Continuous
0 1 2 3
Frequency/Duration
1
N/A
0 1 2 3
Weight average score for Health impacts
1
Weight average score for Economic impacts
1
Criteria for Other social and
Raw score
Score
Weight %
community impacts
Criteria for Health impacts
Raw score
Score
Weight %
Number and/or size of community
Very small
Very large
1
N/A
Very small
Very large
affected
0 1 2 3
Number of people affected
1
N/A
0 1 2 3
Minimum
Severe
Degree of severity
1
N/A
Minimum
Severe
0 1 2 3
Degree of severity
1
N/A
0 1 2 3
Occasion/Short
Continuous
Frequency/Duration
1
N/A
Occasion/Short
Continuous
0 1 2 3
Frequency/Duration
1
N/A
0 1 2 3
Weight average score for Other social and community impacts
1
Weight average score for Health impacts
1
Note: N/A = Not applied
Criteria for Other social and
Raw score
Score
Weight %
community impacts
Number and/or size of community
Very small
Very large
1
N/A
affected
0 1 2 3
Minimum
Severe
Degree of severity
1
N/A
0 1 2 3
Occasion/Short
Continuous
Frequency/Duration
1
N/A
0 1 2 3
Weight average score for Other social and community impacts
1
Note: N/A = Not applied
ANNEXES
95
III: Habitat and community modification
IV: Unsustainable exploitation of fish and other
living resources
Weight
Weight
Environmental
Environmental
Environmental issues
Score
Weight %
averaged
Environmental issues
Score
Weight %
averaged
concern
concern
score
score
Habitat and community
Unsustainable
12. Loss of ecosystems
1
N/A
2
14. Overexploitation
3
N/A
2
modification
exploitation of fish
13.Modification of ecosystems or
15. Excessive by-catch and
3
N/A
ecotones, including community
discards
2
N/A
structure and/or species
composition
16. Destructive fishing practices
3
N/A
17. Decreased viability of stock
0
N/A
through pollution and disease
Criteria for Economic impacts
Raw score
Score
Weight %
18. Impact on biological and
1
N/A
genetic diversity
Size of economic or public sectors
Very small
Very large
1
N/A
affected
0 1 2 3
Degree of impact (cost, output changes
Minimum
Severe
1
N/A
etc.)
0 1 2 3
Criteria for Economic impacts
Raw score
Score
Weight %
Occasion/Short
Continuous
Frequency/Duration
1
N/A
0 1 2 3
Size of economic or public sectors
Very small
Very large
2
N/A
affected
0 1 2 3
Weight average score for Economic impacts
1
Degree of impact (cost, output changes
Minimum
Severe
2
N/A
etc.)
0 1 2 3
Criteria for Health impacts
Raw score
Score
Weight %
Occasion/Short
Continuous
Frequency/Duration
2
N/A
0 1 2 3
Very small
Very large
Number of people affected
1
N/A
0 1 2 3
Weight average score for Economic impacts
2
Minimum
Severe
Degree of severity
1
N/A
0 1 2 3
Criteria for Health impacts
Raw score
Score
Weight %
Occasion/Short
Continuous
Frequency/Duration
1
N/A
0 1 2 3
Very small
Very large
Number of people affected
1
N/A
0 1 2 3
Weight average score for Health impacts
1
Minimum
Severe
Degree of severity
1
N/A
0 1 2 3
Criteria for Other social and
Raw score
Score
Weight %
Occasion/Short
Continuous
community impacts
Frequency/Duration
1
N/A
0 1 2 3
Number and/or size of community
Very small
Very large
1
N/A
affected
0 1 2 3
Weight average score for Health impacts
1
Minimum
Severe
Degree of severity
1
N/A
Criteria for Other social and
0 1 2 3
Raw score
Score
Weight %
community impacts
Occasion/Short
Continuous
Frequency/Duration
1
N/A
0 1 2 3
Number and/or size of community
Very small
Very large
3
N/A
affected
0 1 2 3
Weight average score for Other social and community impacts
1
Minimum
Severe
Degree of severity
3
N/A
0 1 2 3
Note: N/A = Not applied
Occasion/Short
Continuous
Frequency/Duration
3
N/A
0 1 2 3
Weight average score for Other social and community impacts
3
Note: N/A = Not applied
96
GIWA REGIONAL ASSESSMENT 57 INDONESIAN SEAS
V: Global change
Weight
Environmental
Environmental issues
Score
Weight %
averaged
concern
score
19. Changes in the hydrological
2
N/A
Global change
1
cycle
20. Sea level change
0
N/A
21. Increased UV-B radiation as a
0
N/A
result of ozone depletion
22. Changes in ocean CO 2
0
N/A
source/sink function
23. Increase in sea surface
1
N/A
temperature
Criteria for Economic impacts
Raw score
Score
Weight %
Size of economic or public sectors
Very small
Very large
0
N/A
affected
0 1 2 3
Degree of impact (cost, output changes
Minimum
Severe
0
N/A
etc.)
0 1 2 3
Occasion/Short
Continuous
Frequency/Duration
0
N/A
0 1 2 3
Weight average score for Economic impacts
0
Criteria for Health impacts
Raw score
Score
Weight %
Very small
Very large
Number of people affected
0
N/A
0 1 2 3
Minimum
Severe
Degree of severity
0
N/A
0 1 2 3
Occasion/Short
Continuous
Frequency/Duration
0
N/A
0 1 2 3
Weight average score for Health impacts
0
Criteria for Other social and
Raw score
Score
Weight %
community impacts
Number and/or size of community
Very small
Very large
1
N/A
affected
0 1 2 3
Minimum
Severe
Degree of severity
0
N/A
0 1 2 3
Occasion/Short
Continuous
Frequency/Duration
1
N/A
0 1 2 3
Weight average score for Other social and community impacts
1
Note: N/A = Not applied
Types of impacts
Environmental score
Economic score
Human health score
Social and community score
Overall
Concern
Rank
score
Present (a)
Future (b)
Present (c)
Future (d)
Present (e)
Future (f)
Present (g)
Future (h)
Freshwater shortage
1
1
1
1
1
1
1
1
1.0
4
Pollution
1
2
1
2
1
1
1
1
1.3
3
Habitat and community
2
2
1
1
1
1
1
1
1.3
2
modification
Unsustainable exploitation of fish
2
3
2
2
1
1
3
3
2.1
1
and other living resources
Global change
1
2
0
1
0
1
1
1
0.9
5
ANNEXES
97
Annex III
catalyst, coordinator, facilitater and mobiliser of resources. It puts
List of important water-related particular emphasis on building partnerships with regional and regional
programmes and assessments
intergovernmental fora, other UN agencies, national governments,
NGOs, the private sector, academic and research institutions, and civil
society, and the media.
Major intergovernmental agreements and
actorsin the Indonesian Seas region
East Asian Seas Regional Coordinating Unit (EASRCU)
UN Economic and Social Commission for Asia and the Pacifi c
Information on the UNEP East Asian Seas Programme can be found
(ESCAP)
on the web site of the Coordinating Unit, which is located with ROAP.
Within the Water Resources Programme under its Environment and
The Unit is the coordinating body for the East Asian Seas Action Plan
Natural Resources Development Division, the UN ESCAP organises
(see below).
seminars and workshops on various issues relating to water resources,
including: Water resources assessment; Integrated water resources
Financial institutions
development and management; Protection of water resources,
Asian Development Bank (ADB)
water quality and aquatic ecosystems; River basin development
The Asian Development Bank, a multilateral development fi nance
and management; Promotion of infrastructure development and
institution, was founded in 1966 by 31 member governments to
investment for drinking water supply and sanitation; Water pricing and
promote the social and economic progress of the Asia-Pacifi c region.
promotion of private investment in the water sector; Water demand
It now has 58 member countries - 42 from within the region and 16
management, water saving and economic use of water; and Mitigation
non-regional. ADB gives special attention to the needs of the smaller
of water-related natural disasters, particularly fl ood loss reduction.
or less-developed countries, and to regional, subregional, and national
projects and programmes. Promoting sustainable development and
Association of South East Asian Nations (ASEAN)
environmental protection is a key strategic development objective of
ASEAN was established in 1967 and has ten member countries: Brunei,
the Bank. (See also about environment.) To fulfi l this objective, the Bank
Cambodia, Indonesia, Laos, Malaysia, Myanmar, Philippines, Singapore,
(i) reviews the environmental impacts of its projects, programmes, and
Thailand and Viet Nam. The ASEAN Declaration states that the aims and
policies; (ii) encourages DMC governments and executing agencies to
purposes of the Association are: to accelerate the economic growth,
incorporate environmental protection measures in their project design
social progress and cultural development in the region through
and implementation procedures, and provides technical assistance for
joint endeavours in the spirit of equality and partnership in order to
this purpose; (iii) promotes projects and programmes that will protect,
strengthen the foundation for a prosperous and peaceful community
rehabilitate, and enhance the environment and the quality of life; and
of South-east Asian nations, and to promote regional peace and stability
(iv) trains Bank and DMC staff in, and provides documentation on,
through abiding respect for justice and the rule of law in the relationship
environmental aspects of economic development. The Asian Development
among countries in the region and adherence to the principles of
Fund (ADF) is the concessional lending window of the Bank.
the United Nations Charter. In 1995, the ASEAN Heads of States and
Government re-affi
rmed that "Cooperative peace and shared prosperity
Action programmes, strategies and research
shall be the fundamental goals of ASEAN." See also ASEAN work on
ASEAN Strategic Plan of Action on the Environment
water conservation (incl. ANWRA) and seas and marine environment;
The Strategic Plan of Action on the Environment for 1994-1998 has the
ASEAN Network of Water Resources Agencies (ANWRA); the Strategic
following fi ve objectives:
Plan of Action for the Environment (see below), adopted by the
1. To respond to specifi c recommendations of Agenda 21 requiring
ASEAN Ministers of Environment; ASEAN 1997 Jakarta Declaration on
priority action in ASEAN;
Environment and Development.
2. To introduce policy measures and promote institutional
development that encourage the integration of environmental
UNEP Regional Offi
ce for Asia and the Pacifi c (ROAP)
factors in all developmental processes both at the national and
Working closely with the Division of Regional Cooperation and
regional levels;
Representation in UNEP's Nairobi-based headquarters, the Regional
3. To establish long term goals on environmental quality and work
Offi
ce for Asia and the Pacifi c (ROAP) looks to adopt global
towards harmonised environmental quality standards for the
environmental policy to regional priorities and needs. It acts as a
ASEAN region;
98
GIWA REGIONAL ASSESSMENT 57 INDONESIAN SEAS
4. To harmonise policy directions and enhance operational and
more information on the Black Sea, Wider Caribbean, Mediterranean,
technical cooperation on environmental matters, and undertake
East Asian Seas, South Asian Seas, Eastern Africa, Kuwait Region, North
joint actions to address common environmental problems;
West Pacifi c, Red Sea And Gulf of Aden, South East Pacifi c, North East
5. To study the implications of AFTA on the environment and take
Pacifi c, South Pacifi c, Upper South West Atlantic, and West and Central
steps to integrate sound trade policies with sound environmental
Africa. The UNEP Regional Seas web site also contains information on
policies.
What's at stake, Major threats, and Actions.
Despite the impacts of the recent economic crisis on the natural
East Asian Seas Action Plan
resources and environmental conditions, the ASEAN Environment
On the initiative of the fi ve States of the East Asian region - Indonesia,
Ministers at their Fifth Informal Meeting in April 2000 discussed the
Malaysia, Philippines, Singapore and Thailand - the Governing Council
importance of keeping their commitment to environmental protection
of UNEP in 1977 decided that "steps are urgently needed to formulate
and sustainable development. Hence, to move forward towards the
and establish a scientifi c programme involving research, prevention
future goals and directions that the ASEAN leaders expressed in
and control of marine pollution and monitoring " for a regional action
ASEAN Vision 2020 and the Hanoi Plan of Action (adopted in 1997 and
plan in East Asia. An Action Plan for the Protection and Sustainable
1998 respectively) the Ministers adopted the ASEAN Strategic Plan of
Development of the Marine Environment and Coastal Areas of the East
Action on the Environment (SPAE) for 1999-2004. It consists of the key
Asian Region was adopted in 1981, with a decision making body, the
activities to be implemented by ASOEN (ASEAN Senior Offi
cials on the
Coordinating Body on the Seas of East Asia (COBSEA). A revised Action
Environment) and its subsidiary bodies over the next fi ve years, including
Plan and a Long-term Strategy for the COBSEA for the 1994-2000 period
the areas of coastal and marine environment, nature conservation and
were developed in 1994 and Australia, Cambodia, China, Korea and
biodiversity, multilateral environmental agreements, management of
Vietnam joined the Action Plan. A new East Asian Seas Action Plan -
land and forest fi res and haze, and other environmental activities.
"Leading the EAS Action Plan to the 21st Century" - has been elaborated
for the period 2000-2009.
Partnership in Environmental Management for the Seas of East
Asia (PEMSEA)
State of the regional environment
A GEF project, focusing on "building partnerships within and among
GEO 2000 State of the Environment: Asia and the Pacifi c
governments of the region, as well as across public and private sectors
Global Enviroment Outlook 2000. GEO is a global environmental
of the economy. The goal is to reduce or remove barriers to eff ective
assessment process, the GEO Process, that is cross-sectoral and
environmental management, including inadequate or inappropriate
participatory. It incorporates regional views and perceptions, and
policies, disparate institutional and technical capabilities and limited
builds consensus on priority issues and actions through dialogue
investment in environmental facilities and services". PEMSEA is "based
among policy-makers and scientists at regional and global levels. GEO
on two management frameworks developed and tested in an earlier
outputs, in printed and electronic formats, including the GEO Report
GEF Project: Integrated coastal management, addressing land-water
series. This series makes periodic reviews of the state of the world's
interactions and the impacts of human activity in coastal areas; and
environment, and provides guidance for decision-making processes
risk assessment/risk management, applying to subregional sea areas
such as the formulation of environmental policies, action planning and
and the impacts of human activities on marine ecosystems.
resource allocation. Other outputs include technical reports, a web site
and a publication for young people.
UNEP Regional Seas Programme
The Regional Seas Programme was initiated in 1974 as a global
GEF Projects in the region:
programme implemented through regional components. The Regional
Projects under implementation
Seas Programme is UNEP's main framework in the fi eld of the coastal
Building Partnerships for the Environmental Protection and
and marine environment. It includes 14 regions and three partner seas,
Management of the East Asian Seas
involves more than 140 coastal states, and focuses on sustainable
The objective of the project is to assist the riparian countries of the
development of coastal and marine areas. Each regional action plan
East Asian Seas to collectively protect and manage their heavily
is formulated according to the needs and priorities of the region as
stressed coastal and marine environments through intergovernmental
perceived by the Governments concerned. Regional conventions are
and intersectoral partnerships. These countries include the Republic
in place for several areas. See a map of all regional seas, and go to
of Korea which for the fi rst time is a GEF recipient. Building upon
ANNEXES
99
the methodologies, approaches, typologies, networks and lessons
FishBase contains full information on 23 500 species. ICLARM has also
learned from the pilot phase, the project would enhance and
developed similar systems on coral reefs and their resources (ReefBase)
complement national and international eff orts by removing or
and management of fi sh stocks in Asia (TrawlBase).
lowering critical barriers regarding policy, investment, capacity, which
are having negative eff ects on the management of the coastal/marine
International Coral Reef Initiative (ICRI)
environment in the region. Together with several waterbody-based
An environmental partnership that brings stakeholders together
projects in the area, these projects constitute GEF's programmatic
with the objective of sustainable use and conservation of coral reefs
approach to these coastal and marine waters with globally signifi cant
for future generations. ICRI is an informal mechanism that allows
ecosystems that are experiencing severe degradation.
representatives of over 80 developing countries with coral reefs to
sit in equal partnership with major donor countries and development
Prevention and Management of Marine Pollution in the East
banks, international environmental and development agencies,
Asian Seas
scientifi c associations, the private sector and NGOs to decide on the
Development of policies and plans to control marine pollution from
best strategies to conserve the world's coral reef resources.
land-based and sea-based sources, upgrading of national and regional
infrastructures and technical skills, and establishment of fi nancing
Coral Health and Monitoring Programme (NOOA)
instruments for project sustainability. Project will include selection
The mission of the NOOA Coral Health and Monitoring Program is
of demonstration sites, establishment of regional monitoring and
to provide services to help improve and sustain coral reef health
information network, and involvement of regional association of marine
throughout the world. Long term goals: Establish an international
legal experts to improve capacity to implement relevant conventions.
network of coral reef researchers for the purpose of sharing knowledge
and information on coral health and monitoring. Provide near real-time
World Bank/GEF/Biodiversity.
data products derived from satellite images and monitoring stations at
Coral Reef Rehabilitation and Management Project (COREMAP),
coral reef areas. Provide a data repository for historical data collected
Indonesia
from coral reef areas. Add to the general fund of coral reef knowledge.
Supported by a multi-donor group, COREMAP will establish a coral
See also Global Coral Reef Monitoring Network (GCRMN).
reef management system in priority areas in 5 eastern Indonesian
provinces. Strengthen coral reef management through improving
The Indonesian Seas - a Large Marine Ecosystem (LME)
management capacity and inter-agency coordination; capacity-
A Large Marine Ecosystem (LME) is a "region of ocean space encompassing
building to prepare and implement strategies, plans and policies
coastal areas from river basins and estuaries to the seaward boundary of
targetting coral reef rehabilitation and management; establishing
continental shelves and the seaward margins of coastal current systems.
coral reef management and information networks; increasing public
It is a relatively large region characterised by distinct bathymetry,
awareness and participation in coral reef management. The PDF phase
hydrography, productivity, and trophically dependent populations."
is supporting the regional task forces preparing the project, and social
See also Rhode Island University map of LMEs.
assessments at priority sites.
Recent international meetings relevant to marine
Other actors, initiatives and resources
conservation and integrated coastal management
International Centre for Living Aquatic Resources Management
(information courtesy of Stacey A. Tighe, Senior Technical Advisor
(ICLARM)
Proyek Pesisir)
An international research organisation "devoted to improving the
productivity, management and conservation of aquatic resources
World Commission on Protected Areas (Bangkok, May 9-11, 2002),
for the benefi t of users and consumers in developing countries".
Coastal Zone Asia-Pacifi c (Bangkok, May 12-16, 2002)
ICLARM is one of the research centres of CGIAR, Consultative Group
National Coastal Conference (KONAS III) (Bali, May 20-24)
on International Agricultural Research. ICLARM, in collaboration with
World Summit on Sustainable Development (Bali, May 27-June 7)
the the Food and Agriculture Organization of the United Nations (FAO)
and other partners, and with support from the European Commission,
The Nature Conservancy (TNC), the Worldwide Fund for Nature (WWF),
has developed FishBase, a global information system on fi shes for
and the U.S. Agency for International Development (through its Natural
research scientists, fi sheries managers, zoologists and many more.
Resources Management Project and Proyek Pesisir) are collaborating
100
GIWA REGIONAL ASSESSMENT 57 INDONESIAN SEAS
and joining their eff orts with their Indonesian partners to maximise
several of their counterparts to attend and present papers at KONAS
the benefi ts and impacts for marine conservation derived from the
III. In addition, just prior to the Conference, there will be two half-day
conferences above. Indonesia has an excellent opportunity to make
symposiums for national and regional decision-makers attending the
major advances in its strategic planning and capabilities in marine
Conference: one on Marine Protected Areas Science and Strategies,
conservation and integrated coastal management by using the synergy
and the second on the new Coastal Zone Law under development.
and momentum of these four international conferences to focus attention
The objective of this half-day MPA symposium will be: to present the
on and support for evolving Indonesia's policies on these issues.
latest information on the science, economics and policies of MPAs to
the audience of coastal decision-makers; to present a request from the
World Commission on Protected Areas
WCPA for Indonesia to participate in a regional MPA network; and to
The objective of this meeting is to discuss the design and coordination
present a Call to Action by the government lead agencies (Forestry,
of a regional network of marine protected areas (defi ned here as any
DKP) to expand and revise the national MPA strategy. Proyek Pesisir will
offi
cially designated marine area in which resource use is limited by
be providing the venue for both Symposiums, WWF and NRM will be
specifi c regulations) for South-east Asia. Experts from the region will
moderating the meeting, TNC and Proyek Pesisir will be supporting
share information on the economics, ecology, management, design and
speakers as a joint co-hosting. An output from the MPA Symposium
enforcement of MPAs and develop recommendations for a regional
will be a briefi ng document based on the presentations and discussions
MPA network. In support of MPAs in Indonesia, TNC will be supporting
developed by the team. An additional event at KONAS will be the
an environmental policy expert to participate and to then present the
selection and announcement of Indonesia's new ICM logo, developed
outcomes of the state-of-the-art of MPA design at a Pre-KONAS III
by an inter-agency and NGO team with support from Proyek Pesisir.
Symposium on MPAs, as well as the presence of their staff who chairs
the WPCA/Asia team WWF is supporting the writing of a technical
World Summit on Sustainable Development-Prep Comm:
paper to summarise the most current knowledge on the economics of
This event is a preparatory meeting for the World Summit on
MPAs NRM/EPIQ Program is supporting their coral reef expert to attend,
Sustainable Development (WSSD or Rio Plus 10) to be held in South
present the economic paper and work with the Indonesian team, Proyek
Africa in September this year. Environmental Ministers from around the
Pesisir is supporting an Indonesian marine resource economist from IPB
world will be attending to discuss the text and policies to be fi nalised
to attend the meeting, learn the newest information on economics,
at Rio Plus 10. For this event, TNC will be supporting two initiatives that
and report back at the Pre-KONAS III Symposium. In addition, they are
will be announced by DKP, a National Marine Whale Sanctuary proposal
supporting two of their technical experts and four technical experts
and the String of Pearls MPA programme. The MPA briefi ng document
from the Ministry of Marine Aff airs and Fisheries (DKP) to participate in
from the Pre-KONAS Symposium will be available for distribution, and
the conference for Indonesia.
the ICM Logo and Campaign can be presented and launched as well.
WWF and ICRAN are presenting a coral reef exhibit in connection with
Coastal Zone Asia-Pacifi c:
the WSSD. Minister Rokhmin Dahuri of the Ministry of Marine Aff airs and
The objective of this fi rst regional coastal meeting is to share information
Fisheries will be hosting an event at their exhibit. There he has indicated
and to develop research and policy priorities for the regional scale
that he will make a pledge for Coral Reef MPAs, and announce a Whales
issues. Approximately 250 coastal professionals from the region will
Sanctuary and IUU on marine resources exploitation in Indonesia.
attend. In support of Indonesia's new marine ministry, approximately
15 technical experts from DPK, including the Minister will be supported
Existing research programmes for marine
by Proyek Pesisir to attend. The DKP and Proyek Pesisir team of four staff
mammals and dugong
and three regional counterparts will work with a facilitator to capture
(excerpted from Perrin et al. 2002)
the information presented and its relevance to DKP and Indonesia's
programmes. Five presentations from the team will be made at CZAP.
Prior to 1997, only a limited number of scientifi c studies had been
conducted on marine mammals in Indonesian waters. Ecological
National Coastal Conference (KONAS III) and Pre-Conference
aspects such as species-specifi c habitat preferences in Indonesia were
Symposiums
(and still are) largely unknown.
The objective of the KONAS 4-day Conference is to share information
on new developments in coastal zone management. All of the partners
Surveys of the critically endangered Irrawaddy dolphin, or pesut,
(CI, TNC, WWF, NRM/EPIQ Project and Proyek Pesisir) will be supporting
population of the Mahakam River in East Kalimantan are ongoing
ANNEXES
101
(Doc. 12; Kreb 2002). The focus is to obtain data on the distribution,
Indonesia's island passages as migratory corridors and improve the
abundance and ecology of this declining population and to develop
management of large migratory marine animals. Kahn reported that
a conservation programme for Indonesia's sole freshwater dolphin
additional research is being conducted on spinner dolphins along
population. Kreb (2002) estimated total abundance in the Mahakam
north coast of Bali.
during 1999--2000 at only 35-42 dolphins.
Results of completed research in east Kalimantan, Sulawesi and Nusa
In recent years, visual and acoustic cetacean surveys and ecological
Tengarra have been disseminated to various stakeholders, ranging from
studies on oceanic cetaceans have been periodically conducted in
local fi shermen and coastal communities to the central government
eastern Indonesian waters. Research areas since 1997 have included
in Jakarta, where cetaceans are increasingly considered as a national
North Sulawesi and the Sangihe-Talaud Archipelago 1997 (Kahn
marine conservation priority. Progress has been made on capacity
1999, Kahn 2001), as well as Komodo National Park since 1999 (Kahn
building and making educational materials available, including
et al. 2000, Pet and Yeager 2000, Kahn and Pet 2001) and the eastern
brochures on species, cetacean ecology, fi sheries interactions, marine
Flores to western Alor region, including the islands of Adonara, Solor,
mammal stranding and rescues.
Lembata, Pantar and Alor since 2001 (Kahn 2002c). For each area, surveys
have been conducted at least annually and often seasonally during
inter-monsoon periods. The surveys focus on the following cetacean
management and conservation priorities in eastern Indonesia:
1. Identify which species are present in the research area and adjacent
waters and provide data on relative abundance, seasonality, habitat
use, migratory passages of regional importance, tourism potential
and environmental impacts.
2. Integrate survey outcomes with other marine conservation actions
such as the establishment of additional Marine Protected Areas.
3. Initiate ecology-focused research on priority cetacean species using
photographic, genetic and telemetric techniques.
4. Involve government, industry and community stakeholders in
cetacean monitoring and outreach programmes.
Indonesia is located in an equatorial region where natural inter-oceanic
exchange of marine fl ora and fauna occurs. Cetacean movements
between the tropical Pacifi c and Indian Oceans can occur through
the passages between the Lesser Sunda Islands (Nusa Tengarra) which
span over 900 km between the Sunda and Sahul shelves. The routes
of whales entering or leaving the Indian Ocean from or to the Pacifi c
Ocean lie exclusively in Indonesian seas. The ecological signifi cance
of these passages remains poorly understood, yet their importance as
migration corridors has been established (PHPA 1984, Kahn and Pet
2001, Kahn 2002b).
Cetaceans that use these passages for local or long-range movements
are vulnerable to directed catches, habitat destruction, subsurface noise
disturbances (e.g., reef bombing), entanglement in fi shing gear, marine
pollution and overfi shing of marine resources (Hofman 1995; Fair and
Becker 2000). Most, if not all, of these phenomena occur in the waters
of Indonesia and would aff ect both resident populations and transient
populations. On-going research is intended to assess the role of eastern
102
GIWA REGIONAL ASSESSMENT 57 INDONESIAN SEAS
Annex IV
1992: (Act No. 24) Spatial Planning Act;
List of conventions and specific
1997: (Act No. 23) The Management of the Living Environment;
laws that affect water use
1999: (Act No. 22) Decentralisation of authority from central
government to provincial and district governments;
1999: Creation of the Ministry of Marine Aff airs and Fisheries.
Key international conventions and treaties
Indonesia is signatory to several international conventions and has
Some important changes have taken place in the new Reformasi era. In
enacted various national laws and regulations that are relevant to
1992 the Spatial Use Management Law provided for provincial and local
water-related issues in the region:
government to regulate the use of coastal and marine areas. However, it
United Nations Convention on the Law of the Sea (UNCLOS);
was only in 1999 that powers and fi nancial support were delegated to
International Convention on the Protection of Pollution from Ships
provincial and local governments. At the end of 1999 a new Ministry of
(MARPOL);
Marine Exploration and Fisheries was established. These new initiatives
United Nations Convention on Conservation on Biological Diversity
should create the long awaited vertical and horizontal integration of
(CBD);
Indonesia's coastal and marine management, which has been so lacking
Convention on International Trade in Endangered Species (CITES);
in the past (Hopley & Suharsono 2000).
Ramsar
wetlands
convention;
United Nations Framework Convention on Climate Change
The State Ministry for Environment (LH), as the national coordinating
(UNFCCC);
agency for environmental management and policy formulation,
World
Heritage
Convention.
is committed to integrating environmental concerns into coastal
management (Sloan & Sugandhy 1994). LH has been assigned the
Indonesia has sovereign rights to the 12 nautical mile limit and has also
following specifi c responsibilities:
declared a 200-mile Exclusive Economic Zone. Indonesia unilaterally
To enhance the capability of marine and coastal zone management
uses the `Archipelagic Doctrine' to defi ne its territorial waters. Several
in order to achieve the optimal, eff ective use of marine and coastal
government sectors concerned with use of natural resources have
resources.
proposed policies or legislation relevant to obligations under the various
To design a policy and planning framework as a basis for marine
International Conventions. However, it is apparent that despite the
and coastal zone management activities which have a strategic
ratifi cations, there has been little progress to date in implementation
role in national and regional development. The management
and the resolution of related problems. This has been attributed to the
structure should focus on the integration of an institution for the
lack of action by the various governments in addressing their obligations
coordination and synchronisation of the sustainable use of marine
under the Conventions. A recently developed `Environmental Strategy
natural resources.
for the Seas of East Asia' provides many pertinent recommendations and
solutions to these problems (Chua Thia-Eng, PEMSEA pers. comm.).
The action plan for achieving this, Program Laut Lestari, (Sustainable
Marine Program) began in 1992 to stimulate implementation of
Key national legislation
integrated and sustainable marine resource use. The foci of this action
Environmental legislation in Indonesia (from Cheung et al. 2002)
plan are the 27 provincial administrations, each of which have coastal
1932 & 1941: Colonial Nature Protection Ordinances;
zone resources for which they are responsible.
1945:
Constitution;
1949:
Independence;
Water resources legislation (from FAO Aquastat)
1971: Establishment of the Directorate of Nature Conservation and
The 1945 constitution declared national water and land resources
Wildlife;
to be controlled by the State and that they should be utilised in an
1980: Trawling Ban (Sardjono 1980);
equitable manner for the benefi t of the people. The responsibilities for
1982: Basic Environmental Law;
the development and management of water resources and irrigation
1985: Directorate General for Fisheries Law No. 9 (Ban on blast
schemes are specifi ed in laws, presidential instructions and government
fi shing);
regulations. The most important are:
1990: Conservation of Living Natural Resources and their Ecosystems
Presidential Instruction No. 1 (1969), on the management of
Act;
irrigation water and maintenance of irrigation networks;
ANNEXES
103
Law on water resources development No. 11 (1974);
and the continued directed takes of small cetaceans in eastern Indonesia
Government regulations on: benefi
ciaries contribution for
and elsewhere, nor does it recognise the numerous environmental threats
maintenance cost of water resources facilities No. 6 (1981);
faced by cetaceans and dugongs in Indonesia's waters or recognise
Water management No. 6 (1982);
important international conventions and specifi c management needs for
Irrigation, No. 23 (1982);
endangered and vulnerable marine mammal species and populations.
Rivers (1991) and swamps (1991);
In addition, laws relating to marine mammals are confused by secondary
Decree of the Minister of Mining and Energy concerning
fi sheries laws, some of which classify marine mammals as fi sh and seek to
underground water resources management (1983).
promote and regulate fi sh harvest. In some regions the protected status of
cetaceans and dugongs is unknown or ignored. Habitat destruction and
Numerous institutions are presently involved in water resources
directed catches of small cetaceans especially are widespread.
management. Their tasks and responsibilities are clearly stated in
national legislation:
To address these issues, a recent discussion paper has been produced
The Ministry of Public Works, with its Directorate General of Water
at the request of the Ministry of Marine Aff airs and Fisheries to outline
Resources Development, is responsible for planning, design,
the possible establishment of a marine mammal `no-take zone'. This
construction, equipment, O&M, and guidance in water resources
marine mammal sanctuary, referred to a "Protected Marine Mammal
development;
Fisheries Area" would extend throughout Indonesia's national waters
The Ministry of Forestry is responsible for catchment area
and economic exclusion zone (EEZ). It would prohibit commercial and
development;
scientifi c takes of marine mammals and strengthen specifi c fi sheries
The
Ministry
of
Environment
is
responsible
for
environmental regulations that benefi t to marine mammals (Kahn 2002a). Importantly
quality development and management;
it would a) integrate the existing laws within a unifi ed marine mammal
The Environmental Impact Management Agency is responsible for
conservation strategy, b) identify and address the current gaps in
environmental impact control.
legislation and legal prescriptions, c) provide a clear management tool
for the strategy's implementation on the ground, and d) incorporate
Legislation relevant to marine mammals (from Perrin et al. 2002).
both major environmental threats and international treaties relevant to
All land and water natural resources are controlled by the state, in
(migratory) marine mammal management.
accordance with Article 33(3) of the 1945 Constitution. The state (the
central government) thus has responsibility for protecting species. The
Both the Ministry of Forestry and Ministry of Fisheries and Marine Aff airs
National House of Representatives - Dewan Perwakilan Rakyat (DPR) - has
have initiated programmes to improve marine mammal management
enacted several laws (undang-undang) that relate, either specifi cally or
and conservation at both national and site-specifi c levels. A national
generally, to the protection of marine mammals. Taken together, these
strategy for the conservation of migratory marine life was completed in
laws (1) confi rm state authority and responsibility for management of
2001 and includes descriptions of marine mammals and management
living marine resources, including marine mammals, and their habitats;
recommendations (DKP/IPB 2001).
and (2) establish a loose and amorphous legal framework through which
living marine resources, including marine mammals, are to be protected
Marine mammal conservation and management issues are increasingly
and conserved for their intrinsic value and for benefi t of Indonesians,
being considered in protected areas such as Bunaken Marine Park and
present and future; and (3) can provide specifi c protections for certain
Komodo National Park. In the latter, extensions to the Park's boundaries
marine mammals that are listed as endangered or threatened.
and additional buff er zones have been adopted by the management
authorities and will be incorporated into a 25-year management plan, in
Several national laws include references to the fact that marine mammals
order to protect sensitive marine areas, such as migration corridors, for
are protected throughout Indonesian waters. Nevertheless, the legal
cetaceans (Pet and Yeager 2000). Needed conservation actions have been
status of cetaceans and the dugong in Indonesian waters is unclear.
identifi ed for the critically endangered pesut population of the Mahakam
Existing legislation is inadequate in several respects, not least of which is
River in East Kalimantan (Doc. 12). Strong and continued government
that it lacks implementation and enforcement mechanisms. Laws relating
commitment to implementation is urgently needed to avoid extirpation
to marine mammals are vague, with few specifi c requirements. Terms such
of this population in the near future. The eff ective implementation of
as `protection' are not well defi ned, and the protected status does not
these government and non-government marine mammal conservation
address the traditional (sperm) whaling activities in Lamalera, Lembata
initiatives will greatly improve the status of Indonesia's marine mammals.
104
GIWA REGIONAL ASSESSMENT 57 INDONESIAN SEAS
Ministry/Agency
Major function and responsibility in coastal resource management
Relevant legislation
List of ministries or central agencies and their function in coastal resource management *
Coordination and policy for all sectoral and regional planning and development, formulation of 5-year development plan
Spatial Act No. 24/1992
National Development Planning Board (BAPPENAS)
(Repelita) and 25 year development plan (GBHN), and international coastal projects.
Presidential Decree No. 80/1967
National coordination of coastal environment policy and to ensure all development programmes comply with environmental
State Ministry of Environment (SME)
Environmental Act No. 23/1997
management policy.
Environmental Impact Management Agency
Coordinating environmental impact assessment, controlling pollution and coastal resource degradation.
Environmental Act No. 23/1997
(BAPPEDAL)
Ministry of Home Affairs, Regional Development
Supervise provincial and local government agencies to manage their coastal resources in a sustainable manner, and to develop
Local Govt Act No. 22/1999
(BANGDA)
self-reliance groups at the villages.
To administer and manage fishery development, including aquaculture, processing fishing boat permits, leasing marine water
Ministry of Marine Exploration and Fisheries
Fishery Act No. 9/1985
for mariculture.
Ministry of Tourism
To facilitate marine eco-tourism development.
Tourism Act No. 9/1990
To manage marine conservation areas, mangroves, wetlands and marine parks, through Directorate General Forest Protection
Forestry Act No. 5/1967
Ministry of Forestry
and Nature Conservation PHPA
Biodiversity Conser Act No. 5/1994
Mining Act No. 11/1967
Ministry of Mining and Energy
To regulate oil and gas exploration and production, other mineral mining, and power stations on the coast.
Oil and Gas Act No. 8/1973
Ministry of Industry and Trade,
To administer industrial development in coastal areas, processing permit for industry.
Industrial Act No. 5/1984
Ministry of Communication
To supervise the management of ports, harbours, shipping, navigational aids and safety; and oil spill contingency plans.
Shipping Act No. 21/1992
Ministry of Housing and Area Development
To coordinate and implement coastal engineering, erosion control and coastal infrastructure.
Ministry of Defence and Security,
National and regional security, hydrographic mapping.
National Defense Act No. 20/1982
State Ministry of Research and Technology (BPPT)
To test and apply the innovation and new technology on coastal resources development.
National Coordinating Agency for Surveys and
To coordinate survey and mapping of coastal areas and marine waters.
Mapping (BAKOSURTANAL)
Indonesian Institute of Science (LIPI)
To carry out marine research and provide scientific advice to other agencies.
State Ministry for Investment
To promote and facilitate local and foreign investment.
Presidential Decree No. 77/1996
National Maritime Council
To coordinate all marine and coastal related activities and overcome institutional barriers.
revised to 1999
List of provincial government agencies and their function in coastal resource management
Coordination of all regional planning, formulation of 5-year regional development plan (Repelitada) and 25 year regional
Spatial Act No. 24/1992
Regional Development Planning Board (BAPPEDA I)
development plan (Pola Dasar), to coordinate provincial coastal resources management
Presidential Decree No. 77/1980
Regional Environmental Management Agency
Coordinating environmental impact assessment, controlling pollution and coastal resource degradation at provincial level
Environmental Act No. 23/1997
Community Group Development Office
Supervise local government agencies to develop self-reliance groups at the village level.
Autonomy Act No. 22/1999
Fishery Agency
To administer fishery development, and to supervise fishers organisations
Fishery Act No. 9/1985
Tourism Agency
To facilitate marine eco-tourism development, to provide recommendations for investment
Tourism Act No. 9/1990
Forestry Agency
To manage soil conservation areas and reforestation of degraded forest.
Forestry Act No. 5/1967
Mining Act No. 11/1967
Mining Agency
To regulate oil and gas exploration and production, other mineral mining, and power stations on the coast.
Industry and Trade Agency
To promote industrial development and recommend permits for industrial development.
Industrial Act No. 5/1984
Public Work Agency
To implement coastal engineering devt. and coastal infrastructure.
Regional Investment Board
To promote and facilitate local and foreign investment to its province
List of local government agencies and their function in coastal resource management
Coordination for all local planning, formulation of 5-year regional development plan (Repelitada) and 25 year regional
Spatial Act No. 24/1992
Local Development Planning Board (BAPPEDA II)
development plan (Pola Dasar), to coordinate district/city coastal resources management
Presidential Decree No. 77/1980
Community Group Development Office
Supervise local government agencies to develop self-reliance groups at the village level.
Village Govt Act No. 5/1979
Fishery Agency
To administer fishery development, and to supervise of fishers organisations
Fishery Act No. 9/1985
Tourism Agency
To facilitate marine eco-tourism development, to provide recommendations for investment
Tourism Act No. 9/1990
Forest and Conservation Agency
To manage soil conservation programme on critical farm lands
Forestry Act No. 5/1967
Mining Agency
To regulate oil and gas exploration and production, other mineral mining, and power stations on the coast.
Mining Act No. 11/1967
Industry and Trade Agency
To promote industrial development and recommend permits for industrial development.
Industrial Act No. 5/1984
Public Work Agency
To implement coastal engineering development, and coastal infrastructure.
Note: * These do not take into account the formation of the New Ministry of Maritime Exploration and Fisheries
ANNEXES
105
Hopley & Suharsono (2000) provide a comprehensive overview of
Legislative framework
legislation and coordination, with many pertinent recommendations
Structure and jurisdiction
relevant to the present analysis, as reproduced below:
The Terrestrial Waters Law No4 (1960) defi ned Indonesia's marine sector
and adopted the archipelagic waters concept. However, as the result
BAPPEDA is responsible for the coordination and formulation of
of Chapter 18 of the 1945 Constitution, until 1960 local not national
planning for natural resource management and economic, social
government had jurisdiction from low water mark to 3 nautical miles.
and cultural development. For example, in recent years 10 BAPPEDAS
In 1960 the government issued the Maritime Act No4 (1960), which
have formulated provincial strategic plans for integrated coastal
was revised in 1996 to No6 (1996) (Undang Undang Pokok Perairan
management within the Marine Resources, Evaluation and Planning
Indonesia), which declares that all coastal and marine resources are
Project (MREP).
under the central government's jurisdiction, thus overriding all local
government jurisdiction.
In summary, national agencies represent legislation relating to
their sector, the provinces apply to laws locally. Complexities and
Current Indonesian environmental legislation began in 1982 with
overlapping interests are evident in all areas and determine a highly
Law No4 (1982) "Basic Provisions for The Management of the Living
sectoral rather than integrated approach to coastal management in
Environment". Sustainable environmental use, ecosystem maintenance
Indonesia. The relationship between local and national agencies with
and provisions for controlling environmental impacts and pollution
regional offi
ces has been described as one of "legal and administrative
are linked with human welfare in this law (Sloan and Sugandhy 1984).
ambiguity" (Morfi t 1986) and intergovernment agency confl ict is the
However, this is only one level in a very complex hierarchical legal
norm rather than the exception. This produces vagueness and the
system consisting of:
avoidance of coming to grips with crucial policy issues. Lack of clear
The basic constitution;
boundaries of responsibility leads to lack of communication. "Informal
General assembly decrees;
discussions are the norm and they are mediated by a wide range of
Laws and acts;
personal relationships and connections that underline the formal
Government
regulations;
government structure" (Llewellyn 1998).
Presidential
decrees;
Ministerial
decrees;
Without high political and bureaucratic support for implementation,
Provincial government regulations;
conservation policies have been unlikely to lead to practical results
District or city regulations.
under this form of institutional culture.
Structure of Department of Marine Exploration and Fisheries
The New Ministry for Maritime Exploration and Fisheries
These are operated within a framework of long term development
Since the initial commissioning of this review a most important
periods (PJPT) of 25 years, which are broken into 5-year plans (Repelita).
development has taken place, the full signifi cance for which has yet
In addition, Indonesia has recognised its obligations under several
to be determined. In the 1999 government of President Abdurrahman
international conditions.
Wahid is a new Ministry of Maritime Exploration and Fisheries specifi cally
concerned with the defi nition and development of marine and coastal
International obligations
resources, particularly fi sheries (Dahuri & Dutton 2000). The basic structure
Indonesia cooperates in international marine and coastal environmental
of this Ministry is seen in fi gure 7.1. The Minister is a former Minister of the
initiatives that, in part, shape the nations coastal management (Sloan
Environment Sarwono Kusumaatmadja who has stated commitments
and Sugandhy 1994, Hildreth 1999). These are at global (e.g. UNCLOS),
to integrated coastal zone management (Kusumaatmadja 1999 a) and
regional (e.g. APEC) and South-east Asian subregional (e.g. ASEAN) levels.
cooperative management (Kusumaatmadja 1999 b). Within the Ministry
In 1985 Indonesia ratifi ed the United National Convention on Law of the
is the Directorate General of Coastal, Beaches and Small Island Aff airs led by
Sea of 1982. It supports the 1992 UN Conference on Environment and
Dr. Rokhmin Dahuri, formerly Director of the Centre for Coastal and Marine
Development (UNCED) action programme of Agenda 21. Collaboration
Resource Studies at Bogor Agricultural University, who's concerns for the
with other Pacifi c and Asian countries on marine resources and
coast and coral reefs in particular are well known (e.g. Dahuri 1999). The
conservation is undertaken through Asia-Pacifi c Economic Cooperation
opportunity for integrating and simplifying Indonesia's coastal and marine
and in the ASEAN organisation Indonesia has been active in multinational
management appears greater than at any time in the past.
marine issues such as oil pollution since the 1970s.
106
GIWA REGIONAL ASSESSMENT 57 INDONESIAN SEAS
Some of indonesia's international obligations.
resources, but it was disbanded in 1999. Recently the Ministry of Justice
Title
Date
Significant aspect
and Law submitted a Coastal Marine Resource Use Bill to the House
Pollution from land-based sources
of Representatives and the Director General Regional Development
Pollution from seabed activities subject to national jurisdiction
proposed a Presidential Decree to give clear jurisdiction to the Provincial
Pollution from activities in the area
UNCLOS
1982
Pollution from vessels
Governments for the management of their own resources. However, the
Pollution from or through the atmosphere
Coastal zone management
Director General Sea Communication and D.G. Fisheries have refused
1969
Civil Law Liability
to devolve some of their jurisdiction to the provinces. Nonetheless in
IMO Conventions (Marine
1971
International Fund System
Pollution)
1999, legislation was passed (Autonomy Laws No 22/99 and No 25/99)
1989
Toxic and hazardous disposal
Emission
which fi nally give jurisdiction to the Provincial governments and give
Greenhouse gases
UN Framework Convention on
fi nancial support for implementation.
Climate system
climate change
Adverse effects
1992
Regional economic integration
In a follow up to the 1992 UNCED conference in Rio de Janeiro, the
Conservation
UN Convention on Biodiversity
Sustainable use
Indonesian government worked with the United Nations Development
Fair and equitable sharing of the benefits
Program to formulate a national Agenda 21 strategy. This was launched
Natural resources utilisation, management and planning,
ASEAN Treaty
1985
including pollution control and EIA
in March 1997 (Min. for Environment/UNDP 1997) and is described as
1977
Regional agreement on civil and public liability
Tripartite Agreement
a "one policy package" to make sustainable development, with an
1992
Regional revolving fund system
environmental perspective, a reality in Indonesia (Dutton 1999 a).
Mining Law
1974
Pollution from sea-bed activities
Chapter 18 deals specifi cally with "Integrated Management and
Navigation Law
1992
Pollution from vessels
Sustainable Development of Coastal and Marine Areas" and has 7
Water Pollution Control
1990
Pollution from land-based sources
Regulation
programmes:
Air Pollution Control
1974
Pollution from or through the atmosphere
Integrated Planning and Resource Development in Coastal Zones;
Regulation
Monitoring and Protecting Coastal and Marine Environments;
National legislation
Sustainable Utilisation of Marine Resources;
The basic Law No4 (1982) gave rise in 1986 to the environmental impact
Enriching and Empowering Coastal Communities;
assessment process (Analysis Mengenai Dampak Lingkungan, AMDAL)
Sustainable Development of Small Islands;
which was revised in 1993. Environmental impacts in development
Monitoring Security of the Exclusive Economic Zone;
planning are supposed to be on a site-specifi c basis and in 1990 the
Managing the Impacts of Climate Change and Tidal Waves.
Environmental Impact Management Agency (BAPEDAL) was created
within the Ministry of the Environment. However, specifi c guidelines
A basis for action was outlined within Repelita VII (1998-2003) and for
for marine and coastal AMDAL were not formulated.
the period 2003 to 2020. It remains to be seen how far these laudable
programmes will be carried out and to what extent the tangled
Recognising the need, to conserve all diverse and interconnected
jurisdictional responsibilities of central and provincial governments
ecosystems, Law No5 (1990) "Conservation of Living Natural Resources
will become untangled. However, the opportunity is there especially
and their Ecosystems" fi rmly links sustainable resource use with
with the formation of the new Ministry of Maritime Exploration and
ecosystem integrity. In 1992 all legislation relating to management
Fisheries the full mandate for which has yet to be determined (Dahuri
of air, land and sea in a spatial context was integrated into "Spatial
and Dutton 2000).
Use Management" Law No24 (1992). The inclusion of marine space in
Article 9 recognises the importance of coastal waters and the use of
Local government legislation
coastal resources. It also provides an opportunity for provincial and local
Although Provincial Governments operate within the national
government to regulate the use of coastal and marine areas. However,
environmental legislative framework, they are responsible for managing
there were no further regulations to support Local Governments to
resources and enforcing regulations within their region. They can
take these steps.
modify regulations to fi t local conditions, providing the modifi cations
are complementary with prevailing legislation. For example, with
In 1996 the government issued Presidential Decree No77/1996 to form
no national legislation dealing with coral reefs in 1987 the South
a National Marine Council (Sitepu 1999). Its function was to coordinate
Sulawesi government independently issued a Government Decree
strategic policy on the over-use and conservation of coastal marine
No7/1987 for the protection of coral reefs along the South Sulawesi
ANNEXES
107
Coastline. However, as noted above, the Spatial Use Planning Law No5
Clarifi
es administrative boundaries and jurisdictional issues
of 1992, passed responsibility for the Sea Space on to the Provincial
pertaining to resource management;
Governments. This process of devolvement has been slow, not least
Alleviates
international
budgets
for
ICZM;
because marine charts of suitable scale have not been available (Sloan
Coordinates foreign aid programmes that support ICZM.
and Sugandhy 1994). Only in May 1999 did the House of Representatives
pass the Autonomy Law No22/1999 which declares that Provincial
The next task is to coordinate this with the mandate of the new Ministry
Governments have jurisdiction out to 12 nm from low water mark, and
for Maritime Exploration and Fisheries.
district and city governments have responsibility to 4 nm. It is supported
by the fi scal law No 25/99 which may allow implementation.
Issues related to fi shing
Policies related to fi shing are particularly complex and illustrate the
This latter decision is important because in the past most villages
problems of fragmented responsibility. Whilst the mangroves which
assumed they had control of their near-shore resources, a situation
provide the nursery grounds for many fi sh species, and their harvest, are
which has led to ambiguity and confl ict. For example, if a private
part of the responsibility of the Forestry Ministry, fi shing per se comes
investor has wanted to develop a resort within a coastal village with
under Agriculture. Conservation as a whole is in Forestry. However, the
off -shore diving areas, their permit from the central government has
laws and regulations, which include inter alia protection for all 6 species
overridden the traditional rights of the villagers. Further, since the local
of turtles occurring in Indonesian waters (the green turtle has not had
governments (provincial and district) have had no clear authority, they
full protection), all marine mammals and 16 marine invertebrates (Sloan
have been reluctant to provide adequate staff , facilities or budget to
and Sugandhy 1994), are rarely fully implemented. In some cases, the
implement coastal management requirements.
law is just ignored, in others loopholes are easily found. For example,
it is legal to use cyanide as an anaesthetic for live fi sh transport which
Some specific issues
makes it nearly impossible to prosecute vessels with cyanide on board
Coordination
or even with cyanide tainted fi sh (Erdmann 1999). Compliance and
The problems of lack of both vertical and horizontal integration in
regulation are the main problems (Susilowati 1998). In Komodo National
Indonesia's coastal management jurisdiction and agencies have been
Park The Nature Conservancy believes that rather than revision of the
noted in almost every review available on the subject (see for example
law, regulation at the level of the fi shing gear (for example banning the
Suharsono 1999 b, Hildreth 1999, Black and Wiryawan 1998, Sloan and
hookah and restricting mesh sizes) would be more eff ective. They also
Sugandhy 1994). This has led to weak governance, lack of consultation
believe that exclusive rights of access to local populations in National
with stakeholders and made the implementation of integrated coastal
Parks would also lead to better compliance and more eff ective
zone management incorporating both land and sea, an impossible task.
awareness of requirements. One of the problems of fi shing on Eastern
Indonesia's reefs is that many fi shermen responsible for overfi shing
The absence of a strong unifying arrangement has even led to
and destructive fi shing practices travel from other provinces and may
recommendations for institutional change ahead of technical
be completely unaware of local provincial requirements. For example,
innovation (e.g. Sloan and Sugandhy 1994). One suggestion has been
in Komodo National Park only 21% of the fi shing eff ect is from local
the formation of a super agency absorbing the coastal mandates of
fi shermen, 36% from communities surrounding the Park, 29% from East
existing agencies. Sloan and Sugandhy (1994), however, regard this as
Sumbawa and 14% from outside the region (Pet & Djohani 1998).
too daunting a task and believe that it goes against the Indonesian
culture of decision making based on deliberation and consensus.
Tenure
Hildreth (1999), also called for a national framework for integrated
Secure marine tenure is regarded as essential for eff ective environmental
coastal zone management using a coordinating council for relevant
management at the local level as it creates a recognisable core of
agencies rather than the formation of a new agency. This may be the
stakeholders whose legitimate interests lie in the continuing care and
direction being taken for, as Buturbutar et al. (1999) report, the Director
management of valuable resources (Fox 1995). However, Fox believes
General, Regional Development has implemented a development
that nowhere in Eastern Indonesia does local marine tenure exist in a
strategy which:
secure enough fashion to sustain local resources.
Emphasises local administrative institutions;
Focuses on devolving offi
cials who have marine science
In some areas such as the Maluku coast of Minahasa, North Sulawesi,
backgrounds;
where the pressure on fi shing resources is not critical there may be
108
GIWA REGIONAL ASSESSMENT 57 INDONESIAN SEAS
relatively open access to local fi shers. Elsewhere in Eastern Indonesia,
Implementation
particularly in Maluku, traditional marine tenure (Hak Ulayat Laut or
The multitude of laws and regulations related to the management of
petuanan) may be quite strong regardless of national or provincial
coastal and marine resources in Indonesia is greatly hindered by the
legislation (Malik et al. 1999). The systems vary from simple tenure of fi sh
fact that they are not generally enforced (Djohani 1999). In part this is
traps to more complex systems of tenure over specifi c sea areas known
due to a lack of awareness of such requirements at the village level and
as labuhan (Fox 1995). Tenure rights may be vested in quasi corporate
to ambiguity in the wording of much of the legislation (Llewellyn &
bodies or adat groups (families, clans) which are not recognised in
Azhar 1998). However, there is also a lack of capacity and political will:
provincial or national legal systems.
"the general sentiment still holds among Indonesian politicians that
conservation is only desirable if it can demonstrate economic benefi ts"
Some attempts have been made to reassign such traditional rights
(Llewellyn & Azhar (1998).
to the village but generally this has not been upheld in the courts.
Poaching of local resources by mobile fi shing groups and resulting
As Thorburn (1998) has maintained for the Kei Islands, Malaku, erratic
confl ict remains a problem.
and uneven enforcement of regulations, combined with collusion and
self-interest on the part of various parties, threaten both the resouces
Traditional management (Sasi)
and the institutions that have succesfully and sustainably managed
While customary laws (hukum adat) and communal property rights
them in the past.
(hak ulayat/hak petuanan) are not mentioned in Indonesia's fi sheries
management statutes, they are actually accounted for in management
Recommendations
decisions under these statutes (Hildreth 1999). The exercise of such
Appropriate and understandable legislation
customary rights can be a key factor in the eff ectiveness of marine
There is a great need to simplify existing regulations, to produce
protected areas and reserves in Indonesia. The local people should play
compatibility at all levels of government and eradicate all
an integral part in reef conservation, since it is they who are dealing with
ambiguity.
the day to day management of the marine environment and have a deep
Coral reefs should be clearly identifi ed in national legislation as
knowledge of and affi
nity with the sea (Djohani 1998). Djohani sees
being an important target for conservation.
their stewardship as an evolving form of traditional management with
Clear linkages should be provided between national, provincial
even the much maligned Bajau people becoming important managers
and local legislation with further reinforcement of the Spatial Use
as they settle into more permanent coastal villages. For example, a
Planning Laws of 1992/1999 giving great control to provincial and
boundary system for fi shing grounds among the Bajau communities
local governments.
of the Togian Islands has been developed and Djohani advocates
Local customs and traditions which have encouraged sustainable
the employment of Bajau people as national park rangers who are
use in the past should be encouraged and where possible
responsible for the monitoring and enforcement of protected areas.
formalised into the legal system.
Traditional tenure should be recognised and exclusive local rights
However, Pet (pers.comm 1999) believes that: "traditional community-
of access to control and marine resources become more formalised
based management is only feasible under conditions such as clear
thus reducing the amount of nomadic type fi shing currently
physical boundaries of fi shing grounds, sedentary fi sh stocks (low
responsible for much of the damage to remote Eastern Indonesian
mobility of resource), cohesive communities and use of simple gear.
reefs.
These conditions were generally met in traditional coral reef fi sheries by
New regulations need to be established which combat destructive
small communities in Eastern Indonesia, where traditional management
fi shing practices and other damaging activities such as coral
institutions have evolved. However traditional forms of community-
mining. It has been suggested (e.g. Pet & Djohani 1998) that
based management in coral reef fi sheries are becoming less and less
measures such as banning the use of cyanide completely, making
feasible in Indonesia. This is the result of decreasing cohesiveness
materials for bombs (such as underwater fuses) more diffi
cult to
of coastal communities through expansion of markets (no longer
obtain or banning the use of hookah compressors may be more
subsistence), increasing population density, increasing consumer
eff ective than more general legislation.
aspirations, mixing of ethnic groups through migration and intruding
Laws and regulations need to be fully implemented with political
private enterprise".
and economic support which will allow eff ective monitoring of
activities.
ANNEXES
109
A fully integrated coastal management structure
Eff ective coastal management requires a higher level of appreciation
of the environment and conservation. Whilst this may be slowly
happening through education and international contact, it may be
accelerated through some of the economic measures outlined in
10.2.5.
Coordination needs to be both vertical (National, Provincial and
Local levels) and horizontal between agencies.
Strong support is needed for the new Ministry for Marine
Exploration and Fisheries so that it can give the lead in the
integrating process.
Many of the problems facing Indonesia's coral reefs result from what
is happening on the adjacent land. Catchment management needs
to be part of coastal management eff orts.
Where possible traditional management such as Sasi should be
incorporated into coastal and marine care at the village level.
Recognition should be given to the great variety of environments,
social and economic systems in Indonesia which allows for diff erent
methods of local scale management.
The private sector, such as tourist resorts, dive operators etc. should
be encouraged to play a more proactive role in management.
Stakeholders should be involved in all stages of planning and
implementation of coastal and marine resource management.
Management plans should go through the full management
cycle i.e. monitoring of the implementation stage should allow for
assessment of the eff ectiveness of management processes and lead
to review and revision.
110
GIWA REGIONAL ASSESSMENT 57 INDONESIAN SEAS
Annex V
Fish and fisheries
The large marine ecosystem of There are major seasonal variations in fi sh abundance (Zijlstra and
Indonesian Seas
Baars, 1990). During upwelling connected to the south-east monsoon
in August, fi sh stocks and the general productivity of the ecosystem
are enhanced. The changing conditions infl uence phytoplankton and
(Source: Dalzell & Pauly 1990, GEF/UNDP/IMO 1997, Kadri et al. 1999,
zooplankton species composition. Fish species harvested in this LME
Moore In press, Morgan 1989, NOAA. 1991, UNESCO, 1995,
are giant gouramy, common carp, milk fi sh, tilapia, tuna, skipjack tuna,
Zijlstra et al. 1990 )
barramundi, anchovy, travelly, mackerel, garfi sh, shrimp, thumb nail
(parrotfi sh), octopus, squid, crab, and lobster. Black marlin is a highly
Brief description
mobile species, fi shed recreationally. The coral reef environment
The Indonesian Sea Large Marine Ecosystem is a tropical LME of about
harbors all kinds of reef fi sh. Indonesian waters are known worldwide
400 000 km2. The Indonesian Sea extends from east to west across
for their ornamental fi sh species exported to the United States, Japan
a distance of 5 000 km. It contains the Banda and Aru basins and is
and Germany. These include the clownfi sh (Amphiprion), damselfi sh
separated from the Arafura Sea by a series of islands. Geologically, it lies
(Dascyllus), and wrasse (Coris gaimardi). Tortoises and turtles, as well as
at the confl uence of three tectonic plates: the Eurasian Plate, the Indo-
exotic species of crabs and mollusks living both in salt and fresh water,
Australian Plate and the Pacifi c Plate. There are active volcanoes and
are found in this LME. Pearl oysters grow in the waters of the eastern
earthquake occurrences. The Indonesian archipelago stands between
Indonesian Sea. Harmful fi shing practices that can impact endangered
the Pacifi c and Indian Oceans and the LME is heavily infl uenced by
sea turtles occur in the course of commercial shrimp harvesting.
annual and interannual variations in surface temperature due to a
Artisanal methods and aquaculture appear to have less harmful
monsoonal system. It has strong tidal currents, and the pattern of
eff ects. The Central Research Institute for Fisheries (CRIFI) is under the
surface currents varies during the south-east and northwest monsoon.
Indonesian Ministry of Agriculture. The University of British Columbia
This marine region is a "heat engine" of global atmospheric circulation,
Fisheries Center has detailed catch statistics for this LME.
with complex ocean-atmospheric dynamics. The warm ocean and its
links to the atmosphere create the El Nińo Southern Oscillation (ENSO)
Pollution and ecosystem health
phenomenon. The infl uence of El Nińo, La Nina and the Australian and
Indonesia, the most extensive archipelago in the world, has thousands
Asian monsoons contribute to the unique climate conditions in this
of kilometres of coastline bordering this LME. Not much is known
region, an object of global climatology research.
about the status of the ecosystem in regards to pollution or coastal
habitat alteration. One issue is heavy fi shing. Urban expansion and
Productivity
industrialisation have resulted in water pollution from industrial wastes,
The Indonesian Sea LME is considered a Class II, moderately high
sewage problems, and air pollution. Oil spills, slowly degrading toxic
(150-300 gC/m2-yr) productivity, ecosystem based on SeaWiFS global
wastes from chemical and non-chemical industries, agricultural runoff
primary productivity estimates. The Banda Sea, and the Aru Basin in
and the dumping of materials such as metals threaten inland and
particular, are areas of extensive upwelling, relating to the monsoonal
coastal waters. Toxic materials settle into sea-fl oor sediments where
system. For locations of upwelling during both monsoons (see
they accumulate as hazards to living organisms that feed on bottom
Zijlstra and Baars 1990). Strong ocean mixing infl uences sea surface
mud. Long-lasting chemicals may enter the food web and contaminate
temperature and nutrient concentrations. The links of tides to regional
fi sh and shellfi sh. There are threats to the reefs and mangroves. For
climate are being investigated. The Indonesian Through-fl ow is the
information on ozone depletion and the greenhouse risk, see Kadri et
exchange of ocean water between the Pacifi c and Indian Oceans. It
al. 1999.
is thought to be infl uenced by, and may infl uence in turn, ENSO. The
Indonesian Through-fl ow exports warm, relatively fresh (low salinity)
Socio-economics
thermocline water from the North Pacifi c, providing a major freshwater
People of diff erent ethnicities, religions and languages border the LME.
source for the Indian Ocean. Current research attempts to relate seasonal
Economic development and a tremendous growth in population have
cycles of primary and secondary marine productivity to the Through-
taken place in this extremely coastal country with thousands of islands
fl ow, to winds, and to tidal currents. Pelagic fi sh resources appear to be
scattered across a huge area. The climatic fl uctuations within the Asian-
signifi cantly higher during periods of seasonal upwelling.
Australian monsoon region have important implications for the society
and the economy. Indonesian waters play a major role, providing food
ANNEXES
111
resources for millions of people, as well as a mode of transportation
and area of exploration and production of minerals and natural
gas. The coastline areas are sites for industrial and other economic
activities. Ports of importance are Ujung Pandang, Kalianget, Surabaya,
Jakarta, Arjuna, Cirebon, Tegal and Semarang. Tourism is an important
economic activity. UNESCO is funding projects on the socio-economic
development of communities.
Governance
The LME is governed by Indonesia and by the recently independent state
of East Timor. When Indonesia obtained its independence it enacted
laws to govern the seas in accordance with its unique geographic
structure as an archipelagic state. In Law of the Sea negotiations it has
balanced the need to allow freedom of trade and international passage
through straits with the need to protect its thousands of kilometres of
coasts from potential pollution threats. The Indonesian government has
declared its commitment to sustainable development in the oceans by
ratifying a number of conventions and formulating programmes and
projects that aim to defend and conserve the environment, taking
into account the needs of the next generation. It has established
national marine parks at Laut Banda (1977), Bunaken (1991), and Taluk
Cendrawa (1990). Endangered species needing protection are the giant
clam, the hawksbill turtle, the green turtle, and dugongs. Indonesia is
party to conventions on Biodiversity, Climate Change, Desertifi cation,
Endangered Species, Hazardous Wastes, Law of the Sea, Nuclear Test
Ban, Ozone Layer Protection, Ship Pollution, Tropical Timber 83, Tropical
Timber 94, and Wetlands.
112
GIWA REGIONAL ASSESSMENT 57 INDONESIAN SEAS
Annex VI
Criteria for scoring environmental impacts
Issue 23: Changes in ocean surface temperature
This refers to the impact on populations, species, and communities from changes in Sea Surface Temperature as a result of global change.
Score 0 = No known impact
No measurable or assessed effects of SST increase.
Slight impact is determined when one or more of the following criteria are met or exceeded:
Score 1 = Slight
Measured assessed effects of SST are causing a behavioral change in some species without affecting the viability of the population
Moderate impact is determined when one or more of the following criteria are met or exceeded:
Score 2 = Moderate
Community structure is measurably altered as a consequence of changes in SST.
Populations are declining.
Severe impact is determined when one or more of the following criteria are met or exceeded:
Score 3 = Severe
Measured/assessed effects of changed SST are leading to massive loss of communities or a change in biological diversity.
ANNEXES
113
Annex VII
In the mid-nineties, reef fi sh in Eastern Indonesia still seemed to off er
Marine protected areas and
scope for further development, but scientists already warned about the
benefits to the fishery
danger of overfi shing (note that the trade in live reef fi sh was not yet
receiving much attention): However, it is necessary to be cautious with
rapid developments of such fi sheries. The fi sh population in unfi shed
(Compiled by Dr. Jos Pet and Dr. Peter J. Mous, The Nature Conservancy
areas consist of old to very old fi sh, which take a long time to replace.
- Indonesia Coastal and Marine Program. Comments and additions in
A very steep drop in catch rates will be experienced once more vessels
italics, text that is quoted in normal type.)
enter into the fi shery and when many boats enter at the same time
irreparable damage can be done. (Source: Venema 1996)
Marine Protected Area
Geographic area with discrete boundaries that has been designated to
Already in the mid-nineties, there was a call for a change in the objective
enhance the conservation of marine resources. This includes MPA-wide
in fi shery management: The major conclusion of this study is that a
restrictions on some activities such as oil and gas mining and the use of
shift of objectives of fi sheries management should occur. To assure
zones such as fi shery and ecological reserves to provide higher levels of
that maximum benefi ts accrue from the fi sheries, the objectives must
protection. (Source: National Research Council 2001)
change from increasing landings to assuring sustainable exploitation.
(Source Gillet 1996).
Overfi shing
Fishing with an eff ort (number of boats, nets, fi shing days, etc.) that
The tragedy is, that Indonesian government offi
cials misinterpret the
results in a catch volume which is actually lower than could be sustained
conclusions from fi shery scientists on the Maxiumum Sustainable Yield.
at a lower fi shing eff ort. If a stock is overfi shed, reduction of the fi shing
Whereas fi shery scientists state that the current state of the fi shery is
eff ort will result in stabilisation of the catch at a level that is higher
at 60% of the Maxiumum Sustainable Yield because the fi shing eff ort
than in the overfi shed situation, preceded by a short-term drop in the
is too high, many policy makers think that the fi shery can be further
catch.
optimised by increasing the eff ort. (Source: Undated leafl et from the
Research Centre of Marine Technology, Ministry of Marine Aff airs and
Indonesian context - policies in relation to
Fisheries)
fishery development and marine conservation
Already in the mid-nineties, fi shery statistics that were available were
Whereas the concept of Maximum Sustainable Yield is widely used
either unreliable or they suggested that many of the fi sh populations
in Indonesia, even a basic understanding of the rationale behind the
were over-fi shed,. ... it may be high time to switch attention (from
concept is lacking with policy makers. Fishery scientists fall short in
fi nding new resources) to management of existing fi sheries, in order
explaining the uncertainties, applicability and the take-home message
to prevent overfi shing ... in the light of the overall uncertainty no
in their reports. The following are excerpts from the recommendations
further investment or eff ort increase in any shrimp fi shery should be
in a recent FAO report: (a) A major problem is the working concept that
considered ... It is very clear that the 1991 estimates for small pelagic
the diff erence between present fi sh catches and the potential yield
fi sh are unfounded and overoptimistic and that any plan based on
represents a surplus which is available for harvesting by additional
those estimates should be shelved... the Workshop had come to the
fi shing eff ort. (b) Although the concept of MSY is widely used in
conclusion that it is not prudent at this stage to stimulate a further
Indonesia, as the fi sheries develop and eff ort increases, the MSY concept
expansion of any tuna fl eet ... The present knowledge of fi sheries
becomes less relevant and information from the fi shery assumes a
resources in areas designated for development in Eastern Indonesia is
greater importance in determining any remaining potential. (c) Those
so scanty that any development at this stage includes a very large risk
individuals that make the resource estimates should also take on the
factor .. the shrimp resources in the Arafura Sea are over-exploited. It
responsibility of conveying to the users of the information an idea of
is suggested that eff ort should be reduced to about 50% of the eff ort
how accurate the information is. (Source: Gillet 2000).
in 1993 to keep the catch around the Maximum Sustainable Yield. ... it
appears that in several sub-areas the present landings are lower than the
The Indonesia/FAO/DANIDA Workshop (Venema 1996) and the DGF/
peak landings, which might indicate overfi shing ... it appears that there
FAO Workshop on Strengthening Marine Resource Management (Gillet
are seven (of the 11) coastal areas where the six selected small species
1996) found that the system which is presently used to calculate the
groups are already over-exploited (Source: Venema 1996).
Optimum Eff ort in terms of numbers of licences (= number of active
114
GIWA REGIONAL ASSESSMENT 57 INDONESIAN SEAS
vessels per year) is incorrect and the expected eff ects are alarming to
In this juncture, I would like to re-emphasise our desire to strengthen
say the least. (Source: Djohani et al. 1998).
our capability and policy instruments and law enforcement against
IUU fi shing.. (Source: offi
cial transcript of the keynote speech by the
A challenge for eff ective fi shery management is that policy makers
Minister for Marine Aff airs and Fisheries at the International Seminar on
still perceive Illegal Unreported and Unregulated Fishing (there is
Sustainable Development in the EEZ and the EEZ as an Institutional for
even an acronym for this, IUUF) as the main concern, rather than
Cooperation or Confl ict. Denpasar, Bali, June 4, 2002).
overexploitation by `legal' fi shers. There is a strong focus within the
Ministry of Marine Aff airs and Fisheries to deal with this problem,
A recent address by the President of Indonesia shows that the
whereas the establishment of Marine Protected Areas is not on the
Government of Indonesia seeks to expand the fi shery in Indonesia's
political agenda. For example, the Ministry did not even propose a
seas: President Megawati Soekarnoputri, while expressing concern
single project in support Marine Protected Areas in its project portfolio
about the environment, called on local businessmen to make more
presented at PrepCom IV. Hence, there is a niche for a conservation
of Eastern Indonesia's waters, home to an abundance of fi sh and other
alliance to carry the concept of Marine Protected Areas forward (Source:
marine life. "Most businessmen have been reluctant to open new
Ministry of Marine Aff airs and Fisheres 2002).
ventures in this unexplored and rich marine resource area because they
consider it technically and economically unfeasible," said the President,
Although overfi shing is mentioned as a real problem in general terms,
during the opening ceremony of a three-day conference, exhibition
one does get the impression that the main agenda remains to expand
on Indonesian livestock and fi sh at Nusa Dua resort complex on
the fi shery, in combination with curbing illegal fi shing and making
Wednesday. Participating in the conference and expo were delegates
the domestic fi shery more capital-intensive. It is also noteworthy
and fi shing companies from 22 foreign countries, including Australia,
that the Government of Indonesia formulates clear benchmarks for
the United States, Germany and France. "We now have to start thinking
development of the fi shery, whereas there is nothing concrete on
about how to wisely explore our rich and diverse marine resources, as
conservation and how sustainability is being ensured. The following is
well as to boost agriculture," she said. (Source: Widiadana 2002).
an excerpt from a speech by the Minister of Marine Aff airs and Fisheries:
(Indonesia's) contribution of (the) fi sheries sector to the national GDP
In a recent report to the Ministry of Marine Aff airs and Fisheries, again
is only about 2%. ... although the total length of the coastal line in
the need for better management rather than further expansion was
South Korea and Japan is only 2 731 and 34 386 km respectively, the
noted. ... more investments are needed to produce more fi sh. But such
contribution of the fi sheries sector to the national GDP already fetch 37
investments must not expand fi shing capacity but to complement and
and 54 percent respectively. Likewise, although the total length of the
supplement eff ort to manage the remaining fi sheries resources. (Source:
coastal line in Thailand is only about 2 600 km, but they manage to tap
Pacifi c Consultants International 2001).
more then 5 billion US$ of foreign-exchange earnings from fi sheries
export annually. For these obvious reasons, the Indonesian Government
A recent report to the Ministry of Marine Aff airs and Fisheries listed the
has decided to launch an integrated fi sheries management programme
following policy recommendation: Create, build and arouse awareness to
to optimise the use of fi sheries resources on a sustainable basis. Under
change the perception and mindset of the people to stop romanticising
this scheme, the contribution of fi sheries export to the foreign-
that the country's seas have over-abundant or overfl owing resources, in
exchange earnings is projected to reach 5 billion dollars and the share
particular fi sheries resources. (Source: Pacifi c Consultants International
of the fi sheries sector to the national GDP is expected to reach 5%. One
2001. Study on Fisheries Development Policy Formulation. Volume I.
of the main constraints to achieve the above objectives is the fact that
White Paper. Report by Pacifi c Consultants International under Jakarta
artisanal fi shermen, characterised by small scale, low capital and labor
Fishing Port / Market Development Project (Phase IV: JBIC Loan No. IP-
intensive in nature, mostly dominate the Indonesian fi sheries. ... The
403). 234 p. + Annexes).
widespread increase of Illegal unreported and unregulated fi shing has
also been incriminated for the severe damage of fi sheries resources in
It is not clear how the Government of Indonesia translates the advice
the Indonesian waters as well as excessive loss of revenue. We need
off ered through costly consultancies into management action, given
to work together to strengthen our capacity building and technical
the ubiquitous call for reduction of the fi shery among experts and the
know-how. I would like to take this opportunity to seek the indulgence
equally ubiquitous call for intensifi cation of the fi shery among policy
and cooperation of all stakeholders to assist Indonesia to overcome
makers. Even consultants seem to have concerns about this issue, see
and gradually minimise llegal unreported and unregulated fi shing.
the appeal at the end of the following excerpt from a recent 3-volume
ANNEXES
115
report commissioned by the Ministry of Marine Aff airs and Fisheries
as a guardian of the fi sheries resources to prevent overexploitation.
to Pacifi c Consultants International: ... the former Directorate General
If the staff of DGF are largely preoccupied with increasing fi sheries
of Fisheries, now restructured into the Directorate General of Capture
production, there appears to be no government agency which has as
Fisheries and Directorate General of Culture Fisheries, had tasked a
its major concern the protection of fi sheries resources. (Source: Gillett
project, Study on Fisheries Development Policy Formulation, as an
2000).
integral part of the Jakarta Fishing Port/ Market Development Policy
Formulation, as an integral part of the Jakarta Fishing Port/Market
In principle, the objectives, policies and activities of the Ministry of
Development Project Phase IV under the Japan Bank for International
Marine Aff airs and Fisheries are compatible with the development of a
Cooperation (JBIC Loan No. IP-403) to evolve and formulate a new and
network of Marine Protected Areas. Objectives: (1) optimisation of the
bold policy for Indonesian fi sheries and aquaculture based on the
catch to increase welfare of the Indonesian people; (2) conservation
principles of equity and sustainability, taking into account the needs
of fi shery resources. Policies: (1) Control of fi shing activities, (2)
of the vulnerable poor as well as to implement the Precautionary
Development of aquaculture, (3) Improvement of quality. Control
Approach to Management and the Code of Conduct for Responsible
of fi shing activities is to take place through re-registration of fi shing
Fisheries, to which the country subscribes.... Today, management
licenses and development of surveillance and law-enforcement
of Indonesian fi sheries is no longer a matter of choice. There is no
capabilities. (Source: Undated leafl et from Ministry of Marine Aff airs
choice. Management is inevitable if the remaining fi sheries is to be
and Fisheries).
sustained for the present and future generations. With fi sheries facing
certain depletion and imminent collapse, not only in Indonesia but
A recent report to the Ministry of Marine Aff airs and Fisheries says the
also throughout the world a continuing emphasis on uncontrolled
following on Marine Protected Areas: .. it is defi nitively in the country's
or unmanaged development and expanded production as had been
economic and environmental interests to set aside at least 10% of its
pursued in the country over the last 30 years is clearly ill advised.
81 000 km coastline and 5.8 million km2 marine territory as marine
To check further uncontrolled expansion and reverse overfi shing, a
sanctuary or marine protected area and marine park to conserve and
diff erent set of fresh policies and strategies is needed. .. The country and
protect its remaining rich marine bio-diversity .. There are clear benefi ts
its policy-makers and planners, as also its fi sheries managers and fi shers
to be gained from investment in identifying, declaring and establishing
must rid themselves of their mental trap that every available resource
more marine protected areas in Indonesian waters, not only as a tool to
in the country is still underutilised and huge potentials remain for its
manage and conserve the fi sheries and its rich genetic resources but
expanded exploitation and production. In a country as vast as Indonesia
also equally for aquaculture, in particular mariculture or sea farming as a
is and with over 200 million people and with a structurally-centralised
source of seed and broodstock (Source: Pacifi c Consultants International
governance system concentrated in Jakarta and Jawa, it cannot be that
2001. Study on Fisheries Development Policy Formulation. Volume I.
its natural resources are still underutilised. For Indonesian fi sheries and
White Paper. Report by Pacifi c Consultants International under Jakarta
its future sustainable development, we would like that our Study be
Fishing Port / Market Development Project (Phase IV: JBIC Loan No. IP-
on the list of `must read' report for as many Indonesians as possible,
403). 234 p. + Annexes).
especially those responsible for making policies, which provide the
broad thrusts and direction, goals, signals, incentives, nuances and its
Global context Marine Protected Areas and
wherewithals on how these remaining resources are used for nation
fishery management
building. (Source: Pacifi c Consultants International 2001. Study on
On the limits to exploitation of the seas: ... the philosophy expressed by
Fisheries Development Policy Formulation. Volume II. Review and
Hugo Grotius, a Dutchman in the 1600s, that the sea could not be
Analysis of Policies and Performances and Recommendations. Report
harmed by human deeds and therefore needed no protection. His
by Pacifi c Consultants International under Jakarta Fishing Port / Market
thinking established the principle of "freedom of the seas", a concept
Development Project (Phase IV: JBIC Loan No. IP-403).
that continues to infl uence ocean policy despite clear evidence that
human impacts such as overfi shing, habitat destruction, drainage of
In a report prepared by the Food and Agricultural Organization of the
wetlands and pollution threaten the long-term productivity of the
United Nations, the danger of the government focusing on increasing
seas. (Source: Committee on the Evaluation, Design, and Monitoring
production is highlighted: Both individuals and the private sector can
of Marine Reserves and Protected Areas in the United States, National
and do carry out action leading to increased production from fi sheries
Research Council 2001. Marine Protected Areas. Tools for sustaining
resources. However in many respects only the government can serve
ocean ecosystems. National Academy Press, Washington, D.C. 272 p.)
116
GIWA REGIONAL ASSESSMENT 57 INDONESIAN SEAS
What is common to the greatest number (of people) gets the least
will be eff ective tools for addressing conservation needs as part of
amount of care. Men pay most attention to what is their own: they
integrated coastal and marine area management. (Source: Committee
care less for what is common; or, at any rate, they care for it only to
on the Evaluation, Design, and Monitoring of Marine Reserves and
the extent to which each is individually concerned. (Source: Aristotle
Protected Areas in the United States, National Research Council 2001.
(384-322 BC), Politics , Ideal States in Theory, Chapter III, §4. In: E. Barker
Marine Protected Areas. Tools for sustaining ocean ecosystems. National
(1958). The Politics of Aristotle. Oxford University Press, London, Oxford,
Academy Press, Washington, D.C. 272 p.).
New York. 411 p.).
Even at a global level, it seems that fi shery statistics should be interpreted
Overfi shing is not a recent phenomenon. Ecological extinction caused
with extreme care: ... we show that misreporting by countries with
by overfi shing precedes all other pervasive human disturbance to
large fi sheries, combined with the large and widely fl uctuating
coastal ecosystems, including pollution, degradation of water quality,
catch of species such as the Peruvian anchoveta, can cause globally
and anthropogenic climate change. Historical abundances of large
spurious trends. Such trends infl uence unwise investment decisions
consumer species were fantastically large in comparison with recent
by fi rms in the fi shing sector and by banks, and prevent the eff ective
observations. Paleoecological, archaeological, and historical data show
global management of international fi sheries. (Source: Watson & Pauly
that time lags of decades to centuries occurred between the onset of
2001).
overfi shing and consequent changes in ecological communities,
because unfi shed species of similar trophic level assumed the
Given the uncertainty in fi shery statistics and the status of fi sh
ecological roles of overfi shed species until they too were overfi shed
stocks, MPAs may provide a last line of defense against overfi shing.
or died of epidemic diseases related to overcrowding. (Source: Jeremy
It is important to consider the FAO code of conduct for responsible
B. C. Jackson, Michael X. Kirby, Wolfgang H. Berger, Karen A. Bjorndal,
fi sheries in this light.. States and subregional and regional fi sheries
Louis W. Botsford, Bruce J. Bourque, Roger H. Bradbury, Richard Cooke,
management organisations should apply a precautionary approach
Jon Erlandson, James A. Estes, Terence P. Hughes, Susan Kidwell, Carina
widely to conservation, management and exploitation of living
B. Lange, Hunter S. Lenihan, John M. Pandolfi , Charles H. Peterson,
aquatic resources in order to protect them and preserve the aquatic
Robert S. Steneck, Mia J. Tegner, Robert R. Warner (2001). Historical
environment, taking account of the best scientifi c evidence available.
Overfi shing and the Recent Collapse of Coastal Ecosystems. Science
The absence of adequate scientifi c information should not be used as
293. p. 629 638).
a reason for postponing or failing to take measures to conserve target
species, associated or dependent species and non-target species and
. . our relative inexperience in using marine reserves to manage living
their environment. (Source: Article 6, General Principles of the FAO code
resources should not serve as an argument against their use. Rather,
of conduct, accessed at http://www.fao.org/fi /agreem/codecond/
it argues that implementation of reserves should be incremental and
fi conde.asp#6 on July 17, 2002).
adaptive, through the design of areas that will not only conserve marine
resources, but also will help us learn how to manage marine species
Worldwide, the marine area that is currently being protected is extremely
more eff ectively. The dual realities that the Earth's resources are limited
small. At the moment MPAs cover less than half of a percent of the
and that demands made on marine resources are increasing, will
world's oceans, few protect very much and 71% appear to have no
require some compromise among users to secure greater benefi ts for
active management. (Source: Roberts &. Hawkins 2000)
the community as a whole. Properly designed and managed marine
reserves and protected areas off er the potential for minimising short-
Marine reserves and protected areas have received inadequate attention
term sacrifi ce by current users of the sea and maximising the long-term
from fi sheries managers in the region, at least they do not feature clearly
health and productivity of the marine environment. (Source: Committee
in formal arrangements. (Source: Msiska et al. 2001).
on the Evaluation, Design, and Monitoring of Marine Reserves and
Protected Areas in the United States, National Research Council 2001.
Fully protected reserves in a nutshell. (1) Fully-protected reserves
Marine Protected Areas. Tools for sustaining ocean ecosystems. National
enhance the production of off spring which can restock fi shing grounds.
Academy Press, Washington, D.C. 272 p.).
(2) Fully-protected reserves allow spillover of adults and juveniles into
fi shing grounds. (3) Fully-protected reserves provide a refuge for
Based on evidence from existing marine area closures in both
vulnerable species. (4) Fully-protected reserves prevent habitat damage.
temperate and tropical regions, marine reserves and protected areas
(5) Fully-protected reserves promote development of natural biological
ANNEXES
117
communities which are diff erent from communities in fi shing grounds.
removes larger individuals, giving smaller, less fertile individuals a
(6) Fully-protected reserves facilitate recovery from catastrophic human
selective advantage (Source: MPA News, Vol. 4, No. 1, p. 4).
and natural disturbances. (Source: Roberts &. Hawkins 2000).
The conservation argument for marine reserves is predictable and
There is compelling, irrefutable evidence that protecting areas from
undeniable; the fi sheries and other socioeconomic benefi ts will be
fi shing leads to rapid increases in abundance, average body size, and
bonuses (Source: Bill Ballantine, Leigh Marine Laboratory, University
biomass of exploited species. It also leads to increased diversity of
of Auckland, New Zealand. In: MPA News, Vol. 4, No. 1, p. 5. MPA
species and recovery of habitats from fi shing disturbance. Reserves are
Perspective: MPAs Improve General Management, While Marine
often portrayed as working only on coral reefs. In fact, they have been
Reserves Ensure Conservation).
successful in a wide range of habitats in environments ranging from
tropical to cool temperate zones. Reserves are a valuable tool globally.
The Australians have begun to set up networks of MPAs in advance of
(Source: Roberts &. Hawkins 2000).
defi nitive quantitative evidence that they benefi t fi sheries - the obvious
conservation benefi ts are seem as suffi
cient and I agree with that. I think
There is now compelling scientifi c evidence that marine reserves
US policy us going the same way. (Source: Dr Tony Pitcher, Professor of
conserve both biodiversity and fi sheries, and could help to replenish
Fisheries, Director University of British Columbia Fisheries Centre, in an
the seas, says a scientifi c consensus statement signed by 150 of the
e-mail communication dated July 16 2002).
world's leading marine scientists. (Source: press release dated February
2001 from the annual American Association for the Advancement of
Within 5 years of creation, a network of fi ve small reserves in St Lucia
Science (AAAS) meeting).
increased adjacent catches of artisanal fi sheries by between 46 and 90%.
In Florida, reserve zones in the Merritt Island National Wildlife Refuge
`I am very proud of the role of the industry and the part I have played
have supplied increasing numbers of world record-sized fi sh to adjacent
in promoting a no-take reserve for Florida's Dry Tortugas' Tony
recreational fi sheries since the 1970s. (Source: Roberts et al. 2001).
Iarocci, Commercial fi sherman, USA. `But most fi sherman respect the
reserve because they believe, in time, it will bring benefi ts to them'.
Our fi ndings indicate that in 5 years, reserves have led to improvement
Commercial fi sherman, St Lucia, Caribbean. `We need to try something
in the Soufričre Marine Management Area (Saint Lucia) fi shery, despite
diff erent. No-take marine reserves could be the answer' Commercial
the 35% decrease in area of fi shing grounds. There were more fi sh in the
fi sherman, Cornwall, UK, `It's asking a lot to close areas to fi shing when
sea, and evidence for little initial impact of reserves on total catches in
communities need to fi sh to survive, but it may be the only hope we
the fi rst year of implementation, together with constant fi shing eff ort
have to replenish reefs that have been overfi shed for so many years'.
since protection began, indicates a greater weight of total landings.
Commercial fi sherman, Philippines. (Source: WWF Leafl et. Marine
Interviews with local fi shers (conducted in Creole via an interpreter)
Reserves: Like Money in the Bank!)
showed that most felt better off with reserves than without. Younger
fi shers were especially positive about the benefi ts. (Source: Roberts et
Major Recommendation: Marine protected areas (MPAs) have the
al. 2001).
potential to play a much bigger role in the successful management
and sustainable use of fi sheries resources on coral reefs and associated
We fi nd that reserve creation can produce win-win situations where
ecosystems. In particular, participatory development of no-take
aggregate biomass and the common license (lease) price increase.
zones and protection of essential fi sheries habitat in the context of
(Source: Sanchirico & Wilen 2001).
an ecosystem management approach should be encouraged, where
appropriate, at both the community level and for larger areas. (Source:
On eff ectiveness of terrestrial Parks: We found that the majority of parks
Dight et al. 1999).
are successful at stopping land clearing, and to a lesser degree eff ective
at mitigating logging, hunting, fi re, and grazing. Park eff ectiveness
The designation of no-take marine reserves may be necessary for
correlates with basic management activities such as enforcement,
sustaining fi shery yields over the long term, due to their ability to
boundary demarcation, and direct compensation to local communities,
preserve genetic variation in the expression of fi sh size and growth rates,
suggesting that even modest increases in funding would directly
according to a study published in the 5 July 2002 issue of the journal
increase the ability of parks to protect tropical biodiversity. (Source:
Science. This is because in exploited situations, the fi shery selectively
Bruner et al. 2001).
118
GIWA REGIONAL ASSESSMENT 57 INDONESIAN SEAS
On eff ectiveness of terrestrial Parks: The fi ndings of this study suggest
especially of vulnerable and threatened species, excess capacity in some
three basic conclusions. First, the claim that the majority of parks
fi sheries, and the need for increased surveillance and enforcement.
in tropical countries are "paper parks"-- i.e., parks in name only--is
(Source: Tanzer 1998).
not substantiated. Tropical parks have been surprisingly eff ective at
protecting the ecosystems and species within their borders in the
Some scientists think that Marine Protected Areas are not a universal
context of chronic underfunding and signifi cant land-use pressure. They
panacea for fi sheries conservation problems, but there seems to
have been especially eff ective in preventing land clearing, arguably the
be agreement that coral reef fi sheries are especially suitable for
most serious threat to biodiversity. Second, despite their successes, there
management by establishing MPAs. For marine ecosystems that are
is a clear need to increase support for parks to improve eff ectiveness
more or less well defi ned spatially, such as coral reefs, protecting areas
against all threats, perhaps especially against hunting. Finally, these
of manageable size appears to off er good potential for protection of
fi ndings suggest that parks should remain a central component of
fi sheries resources. (Source: Williams 1998). (Note that recent legislative
conservation strategies. Both creating new parks and addressing the
changes in 2004 to the GBRMP have increased the size of no-take areas
tractable problem of making existing parks perform better will make
substantially).
a signifi cant contribution to long-term biodiversity conservation in the
tropics. (Source: Bruner A.G., Gullison R.E., Rice R.E. & da Fonseca G.A.B.
Migratory behaviour does not preclude reserves from benefi ting a
2001. Eff ectiveness of parks in protecting tropical biodiversity. Science
species, but it demands that we apply diff erent principles in designing
291. p. 125-128. Note that hunting is the terrestrial analogue to fi shing).
them. (Source: Roberts & Sargant 2001).
To restore fi sh populations and protect ecosystems, fi shery managers
On the effi
ciency of MPAs as a fi shery management tool as compared to
should develop policies aimed toward substantially reducing fi shing,
quota regulations. We show that it is possible that the use of MPAs of
says Sustaining Marine Fisheries, a new report by a committee of the
certain sizes can be a more advantageous management tool than
National Research Council. Management plans should include not
traditional quotas. (Source: Armstrong & Reithe 2001).
only commercial fi shing but also recreational and subsistence fi shing.
More coastal and ocean areas should be designated as protected,
Many reef fi sh aggregate at certain sites for spawning. MPAs can help to
where fi shing would not be permitted. In addition, managers should
protect these spawning aggregation sites that are extremely vulnerable
consider taking action such as assigning exclusive fi shing rights
to subsistence or commercial fi shing. ... the presence of an important
to individuals or communities, to discourage overfi shing. (Source:
spawning aggregation site would in some cases be justifi cation in itself
The National Academies, http://www4.nas.edu/news.nsf/isbn/
for the establishment of a marine reserve ... no-fi shing zones should
0309055261?OpenDocument, accessed on July 17, 2002).
be established over spawning aggregation sites in large, multiple-use
marine protected areas. (Source: Johannes R.E. 1998. Tropical marine
Marine protected areas are most eff ective when they are established
reserves should encompass spawning aggregation sites. Parks Vol. 8
where vulnerable species usually live, breed, or feed, the committee
No. 2, p. 53-54).
said. Creating these areas has quickly restored populations of fi sh,
snails, and crabs, reduced pollution, and provided habitats for other
On the economic benefi t of protecting grouper spawning aggregation
marine organisms in some regions, including the Florida Keys, the
sites. The implications of these results for management authorities are
Philippine Islands, and the coast of Japan. Less than a quarter of 1
signifi cant. First, they provide an economic rationale for aggressively
percent of coastal sea areas are designated as marine protected areas.
protecting known and potential spawning aggregation sites. Second,
To ensure the greatest benefi t to depleted fi sh stocks, many more
at KNP, the value of such aggregation sites is equal in economic
protected areas should be set aside that are or once were active,
signifi cance to the recreational value of the park as a whole. Finally,
productive fi shing areas, the committee said. Moreover, fi shermen
overall protection eff orts are consistent with protecting a regional
should be involved in planning and designating protected areas.
demersal fi shery on which many households living outside of the park
(Source: The National Academies, http://www4.nas.edu/news.nsf/
depend. (Source: Ruitenbeek 2001).
isbn/0309055261?OpenDocument, accessed on July 17, 2002).
On benefi ts of MPAs for tourism. Signifi cant benefi ts have become evident
On the Great Barrier Reef Marine Park, a multiple-use area of 88 679 km2
in several places where the coral reefs have been protected including
with a 16 398 km2 no-take area: ... identifi ed concerns include bycatch,
the following sites: the Netherlands Antilles (Bonaire Marine Park),
ANNEXES
119
where diving tourism increased; the Seychelles (Ste. Anne National
the North Sea, placed along the southern and eastern coasts. (Source:
Marine Park), where the park is used by both residents and tourists
Beattie et al. 2001).
for swimming, sailing, snorkelling, diving and glass-bottom boat
excursions; Fiji (Tai Island), where subsistence catches have increased,
On a study on a fi shery of spiny lobster. The results of this study indicate
tourist activity has expanded and the holders of traditional fi shing
that opposition to marine reserves by the lobster fi shing industry based
rights are involved in resort management and boat hire; Cozumel
on the assumption that the removing spatial access to fi shing grounds
Island (Mexican Caribbean) where increasing numbers of foreign and
will lead to a reduction in catch rates, may be unfounded. (Source: Kelly
national tourists are coming to observe the coral-dwelling fi sh; and
et al. 2001).
Kenya (Malindi/Watamu National Parks and Reserves, where tourism
generates revenues through gate, guide and camping fees, rental of
. . spillover from marine reserves may under certain circumstances greatly
boats and equipment and hotel expenses. It also has indirect benefi ts
reduce the long-term losses of local fi shers after the establishment of a
through the creation of jobs in hotels and for guides and boatmen.
marine protected area. (Source: Kelly et al. 2002).
(Source: McNeely et al. 1994)
On the importance of network reserves: (a) Isolated reserves have many
Our results suggest that accounting for the non-consumptive economic
benefi ts but will only be able to protect a limited fraction of marine
value of increased Nassau grouper abundance and size may have a
biodiversity. (b) Large number of marine species have open water
large impact on the economic viability of ecologically functional MPAs.
dispersal phases and can potentially be transported long distances
(Source: Rudd et al. 2001).
from where they were spawned. (c) Individual reserves may be able
to sustain self-recruiting populations of species that disperse short
Market shares increased signifi cantly for (dive) sites with increased
distances, but networks will be necessary to protect many of the species
Nassau groupers abundance and mean size. (Source: Rudd & Tupper
that disperse long-distances (d) Reserves in networks need to be close
2002).
enough for protected populations to interact through dispersal, ideally
being closer together than a few tens of kilometres. (Source: Roberts
Published data on how much of the sea should be protected from fi shing. If
& Hawkins 2000).
the objective is risk minimisation: (a) reserves of 31-70% of the fi shing
grounds, (b) more than 40% of the management area, (c) so large, that
On the importance of dedicated staff : `rather than administrative
the exploited population is at 75% of their unexploited size, (d) reserves
commitments to marine protected areas and strong capacities for
of 20 and 30% of the management area guaranteed persistence of an
managing marine areas, the single most important factor underlying
initially heavily exploited stock for 20 and 100 years respectively, (e)
whether or not a MPA will be successful and benefi cial is the presence
so large, that the fi sh population is above 20% of their unexploited
of a dedicated individual or group of individuals to carry it forward'
size, (f) so large, that the population is above 70% of the unexploited
(Source: Agardy 1997, Roberts & Hawkins 2000).
population size, (g) so large, that the population is above 40% of the
unexploited population size, (h) 30 50% of the management area, (i)
between 20-40% of the management area. . If the objective is yield
maximisation, the area mostly depends on the fi shing eff ort in adjacent
fi shing grounds, but for must fi sheries, the reserve area is between 8%
for light exploitation levels and 80% for intensive fi sheries (averaging
30-40%, results from 13 studies). (Source: Roberts & Hawkins 2000).
The optimal area of the marine reserve is found to be between 15% and
25% (of the fi shing grounds) ... if the fi shing intensity in the adjacent
fi shery does not exceed 40% of the exploitable biomass. (Source:
Rodwell et al. 2001).
Under policy options that included ecological considerations,
maximum benefi ts were derived from an MPA that covered 25-40% of
120
GIWA REGIONAL ASSESSMENT 57 INDONESIAN SEAS
Annex VIII
and Proyek Pesisir, where specifi c areas are chosen for intensive
programmes are in eff ect unoffi
cial declarations of protection.
Models for development of a
COREMAP sites of Eastern Indonesia are listed in Table 6.3. Proyek Pesisir
fully integrated PA network in
(Coastal Resources Management Project of Rhode Island University,
Indonesian Seas
funded by USAID) has sites in East Kalimantan (Balikpapan) and in North
Sulawesi where 3 small villages in the Minahasa Regency (Blongko,
Status and future of MPAs in Eastern Indonesia
Talise and Bentenan/Tumbak) have been selected for projects which
(from Hopley and Suharsono 2000):
will upgrade coastal resources (Malik and Kusen, 1999). One result has
been the formation of a 6 ha marine sanctuary near Blongko, containing
Indonesia has fallen well short of its targeted 30 million ha of MPAs
mangroves and coral reefs (Fraser et al, 1998 b).
by 2000. Moreover, the present network does not conform to the
principles laid out in the 1984 "National Marine Protected Areas System".
Another example is Conservation International's programme in the
Exploitation of marine resources has continued to have higher priority
Togian Islands (Surjadi and Supriatna, 1999). In partnership with
than conservation and the MPA network has developed haphazardly.
Indonesian NGO YABSHI, C.I. has formed Konsorsium Togean with the
goal of developing integrated marine and terrestrial protected areas in
Management eff ectiveness is also variable. It appears to be at its most
the Togians in which local communities, local government and other
eff ective in both planning and implementation where international
stakeholders can achieve consensus upon the designation, delineation
NGOs and agencies are involved. Prime examples include the work
and management of the area.
of The Nature Conservancy in Komodo National Park and Operation
Wallacea in Wakatobi, but many smaller agencies have and still are
Although Chapter 18 of Indonesia National Strategy for Sustainable
contributing to the eff ectiveness of the MPA system. Major problems,
Development (Agenda 21) in 1997 produced the specifi c aim to
which will be discussed in more detail in Section 9 include:
"establish new marine parks and marine reserve areas and improve
Lack
of
facilities
for
management;
existing marine parks and reserves to protect critical habitats and
Lack
of
funds;
coastal eco-systems such as coral reefs, mangroves and seagrass beds
Political and legal support to enforce regulation;
from further degradation", as Djohani (1999) has noted in the current
Lack of trained personnel who can appreciate the scientifi c
economic and political crisis, it is not realistic to expect the government
principles.
to expand its system of marine protected areas. The long term will
may be there and the establishment of the new Ministry of Maritime
Lack of eff ectiveness can be illustrated by the fact that of all the Marine
Exploration in the government of President Abdurrahman Wahid, in
Protected Areas in Indonesia, only in Komodo and Bunaken have
which there is a specifi c division for coasts and small islands, appears
destructive fi shing practices almost been eliminated. Many large and
promising. In the meantime the importance of NGO activities, usually
probably important regions remain without signifi cant areas set aside
with both provincial and central government support, cannot be
for conservation, and elsewhere, for example throughout Maluku areas
overstressed.
set aside are probably too small to be fully eff ective. Strategic areas
in which gaps are particularly obvious are the Halmahera region and
Key recommendations
adjacent waters linking New Guinea to the node of high diversity of
(from Hopley and Suharsono 2000).
the Banda Sea, and the islands off the east coast of Central Sulawesi,
especially the Togians and the Kepelauan Banggai. The 1997 PHPA
A Strategically Planned Network of Marine Protected Areas
map of protected areas indicates that the Togians are a proposed area,
Indonesia needs to reexamine the reports of the 1980s to produce an
though government action does not as yet appear to have been taken.
integrated system of marine protected areas which is appropriate to
PHPA has also undertaken surveys to assess the possibility of declaring
the needs of biodiversity conservation and sustainable use of natural
the Sembilan Islands off the east coast of South Sulawesi, a marine
resources. It should be representative of the major biogeographic
conservation area.
regions of Indonesia and the variety of ecological niches. It should
also take into account patterns of coral reproduction and larval
Notably, many initiatives for conservation areas are coming from NGO
recruitment so that natural replenishment of communities and
sources. Programmes being implemented, for example by COREMAP
species stocks in nearby exploited areas can take place.
ANNEXES
121
The original target of 30 million ha of marine protected areas should
Government investment and regulation is necessary in ventures
be resurrected.
such as pelagic fi shing and aquaculture to ensure that they are both
Using the most recent research results the minimum size of marine
economically and environmentally sustainable.
protected areas, buff er zones and other special use areas should
International aid and development agencies including the World
be determined for and applied to existing and proposed marine
Bank and Asian Development Bank should continue to ensure
protected areas.
that investment in coastal and marine located projects entails
Management plans should be drawn up and implemented for
environmental responsibility.
all marine protected areas with suffi
cient political and economic
support including trained personnel, facilities and budgets for
Appropriately Trained Management Personnel
management.
Continuation of training programmes for scientists and managers
Management should entail regular monitoring, and enforcement
both within Indonesia and overseas should be encouraged.
of laws and regulations.
Development of networks of organisations, especially marine
oriented university departments should be encouraged so that
Information for Management
resources and experiences can be shared.
Scientifi cally based management has to be encouraged through
Consideration should be given to changing present career paths of
the provision of data appropriate to management purposes.
trained personnel (increased salary, status) to retain them in their
Much data is already collected in Indonesia but by a variety of
area of speciality for a longer period.
agencies. Some uniformity is required in the collection of the data
There is a need to increase the awareness of the value of fi eld data
so that results from diff erent areas are comparable.
collection.
Methods for monitoring the status of coral reefs may be improved,
Diff erent training or education given through bilateral programmes
or at the very least, the data which is already collected subjected
and aid agencies should be complementary and reinforce existing
to more sophisticated analysis.
skills rather than being discrete programmes.
Accessibility of the data needs improving so that it is available to
There is a need for a more equable distribution of trained personnel
all levels of management. This may involve an improved national
across the whole of Indonesia.
data base system.
Priority for information gathering should be in existing and
Fully Informed and Involved Stakeholders
proposed marine protected areas.
Stakeholders should be involved at all stages of coastal and marine
Specifi c targets for further information should include the
resource management.
basic distribution of coral reefs and related ecosystems, further
Village level extension programmes using appropriate media
taxonomic information to fully describe the biodiversity of Eastern
should be available in all areas.
Indonesia, giving increased priority to the collection of data on
School curricula should include environmental programmes
environmental variables and most importantly gathering data
Models for education and extension should be taken from existing
which will allow scientifi cally based fi sheries stock assessment.
NGO programmes.
More social and economic data is also required by management.
The coastal mapping programme at 1:50 000 scale needs to be
Marine Protected Area Case Study:
completed as soon as possible.
Bunaken National Park, N Sulawesi, Indonesia
The continuing development of Bunaken NP provides important lessons
The Eff ective Use of Economic Tools in Management
for implementation of the recommended policy option in several key
To date development economics have been partly responsible for
areas. For example, improved management capacity is crucial for overall
the decline in Indonesia's coral reefs. In any evaluation of coastal
success. Management of Bunaken NP has recently been reviewed and
and marine resources the total value of the environment including
provides several useful case-studies.
use and non-use values should be determined.
In banning activities such as destructive fi shing practices, the
Improving the Capacity of the Management Advisory Board
economic eff ects on fi shermen and their families needs to be
(from `Natural Resources Management Program Headline News' Issue 17,
acknowledged and alternative sources of income sought in
2002, information courtesy of Nancy Dahl-Tacconi and Mark Erdmann)
enterprises such as tourism, aquaculture or pelagic fi sheries.
In late December 2000, the North Sulawesi government passed
122
GIWA REGIONAL ASSESSMENT 57 INDONESIAN SEAS
a Governor's Decree (SK Gubernor No 233/200) mandating the
Co-management
formation of the Bunaken National Park Management Advisory Board
(from `Natural Resources Management Program Headline News Issue
(BNPMAB). The main purposes of the board are to manage the new
30, 2001):
entrance-fee system of the Bunaken National Park; to assist the Balai
Taman Nasional Bunaken in developing, coordinating and funding
"One of the most important initiatives has been the establishment of the
conservation programmes; to facilitate and encourage community
Dewan Pengelolaan Taman Nasional Bunaken/DPTNB (Bunaken National
awareness and participation in the park management activities;
Park Management Board), whose primary functions are to coordinate
and to instill sense of ownership by the local communities. The
the policies and activities of all stakeholders with jurisdiction within
board was created with 15 equal seats, including seven government
the park and to plan and fi nance several conservation programmes at
representatives and eight non-government representatives. This is
BNP, such as, a patrol system and a trash management system. In order
an innovative system for managing and coordinating activities in a
to achieve these functions most eff ectively, the DPTNB is comprised of
national park in Indonesia and the region. If successful, it will provide a
representatives from all major stakeholders in the park, including the
best-practices example for coordinated multi-stakeholder marine park
local community, tourism sector, Balai Taman Nasional Bunaken (BTNB),
management in Indonesia and South-east Asia. The board was granted
environmental NGOs, universities, North Sulawesi province, Manado city
a two-year trial period, which will conclude in December this year.
and Minahasa regency government institutions. The DPTNB is the fi rst
of its kind in Indonesia, and is considered a two-year pilot project by
Long standing management challenges for Bunaken National Park
the Ministry of Forestry.
include cultural confl icts and mistrust amongst local stakeholders and
managers; damaging fi shing and land-use practices; rapid and poorly
Besides the DPTNB, a number of organisations are now helping with
planned coastal development; unethical business and political practices;
management issues in TNB. The Forum Masyarakat Peduli Taman
corrupt law enforcement systems; and unorganised management
Nasional Bunaken (FMPTNB) was established in October 2000 as a
strategies. Since the boards inception, management processes have
means of connecting and representing the management aspirations
become more transparent and participatory, and management outputs
of the approximately 30 000 residents of TNB. With three districts
have increased dramatically. Despite the initial successes of the board
(north, south and surrounding islands) and representatives in all 21
and the new entrance-fee system, many management challenges
villages within the park, the FMPTNB is slowly becoming an eff ective
remain. The current evaluation of the board will contribute signifi cantly
voice for the community in the management of TNB. Additionally,
to its capacity and potential for improving management processes,
several environmental NGOs, including Yayasan Kelola, Forum Petuan
coordinating management and conservation activities in the park and
Ketoupan, Yayasan Kendage URuata, WWF, and Yayasan Suara Nurani
raising stakeholder awareness and participation in management.
are working within the park on a range of environmental issues.
Within the tourism sector, the North Sulawesi Watersports Association
Codifi cation of the roles and responsibilities of the Park Management
(NSWA) and Himpunan Pengelola Wisata Lokal Bunaken represent dive
Advisory Board with regard to conservation of Bunaken National Park
operators and cottage owners who are concerned about management
is an essential Best Practice to eff ective decentralised co-management.
of TNB. The increasing cooperation within and between these groups
The document, Basic Regulations for the Bunaken National Park
is supporting the concept of a keluarga besar Taman Nasional Bunaken
Management Advisory Board clarifi es this eff ort. While it guides the
yang mendukung pengelolaan dan pemanfaatan sumber daya alam
day-to-day functioning of the Park Management Advisory Board, it
yang berkelanjutan. (Bunaken National Park big family that supports
is also of value to others exploring decentralised co-management of
sustainable natural resources management and utilisation).
protected areas in Indonesia (R. Merrill pers. comm.).
Another exciting development for the management of Bunaken has
As with most Protected Areas in the Sulu-Celebes (Sulawesi) Sea, Bunaken
been the introduction of a revolutionary new entrance fee system
NP is a multiple-use MPA, with diff erent zones allowing and regulating
- the fi rst in Indonesia. Unlike other national park entrance fees in
diff erent levels of exploitation and conservation. Initial diffi
culties in
Indonesia (where all money collected goes into the National Treasury),
management arose from the initially complex zoning scheme, with a
80% of the Bunaken entrance fees are managed by the DPTNB to fund
major revision recently undertaken. The rezoning provides useful lessons
conservation programmes in the park. Since April 2001, over 8000 local
for policy implementation in the region (see Case Study).
and international tourists have paid the entrance fee, amounting to over
Rp 360 million in income for conservation programmes. The DPTNB has
ANNEXES
123
also received grants from WWF-Indonesia and USAID to help fi nance
Components of the Co-Management Initiative
its conservation programmes. An example of an important programme
Participatory zonation revision of BNP: NRM is assisting the BNP Offi
ce
currently being managed by the DPTNB is a joint patrol system. The
(BTNB) to work with the two primary park user groups (local villagers
patrol system is currently based on Bunaken Island and includes
and the marine tourism sector) to revise the park's zonation system,
jagawana BTNB (rangers), SATPOLAIRUD, and community members
realising that a well-designed, easy to understand and thoroughly
who can be on a 24-hour patrol per day. This patrol system successfully
socialised zonation system is the foundation for eff ective management
apprehended more than seven groups of cyanide and bomb fi shers
of the park.
who were operating illegally in the park. The patrol team also regularly
conducts sweeping operations to ensure that all visitors have paid their
Improved villager involvement in BNP management decisions through
entrance fees.
institutional development of the BNP Concerned Citizen's Forum
(FMPTNB). The FMPTNB is now active in all 22 villages in BNP and serves to
Until now, much of focus of these programmes has been on Bunaken
represent the aspirations of ~30 000 villagers in management decisions,
and the surrounding islands of Manado Tua, Mantehaga, Siladen and
as well as serving to socialise management policy to its constituents.
Nain. However, the DPTNB realises that it is extremely important to
also include the northern and southern mainland sections of the park,
Fostering private sector involvement in BNP management: NRM provides
including Tiwohu, Tongkeina, Meras, Molas, Teling, Kumu, Poopoh,
technical assistance to the North Sulawesi Watersports Association
Pinasingkulan, RapRap, Sondaken, Popareng dan Wowontulap". (Mark V.
(NSWA) and actively fosters the involvement of other private sector
Erdmann, Marine Protected Areas Advisor, NRM/EPIQ Sulawesi Utara,
groups (cottage owners, traditional fi shers' association, and charter
boat operators) in BNP management. Facilitation of multistakeholder
Co-Management Initiative
co-management of BNP via institutional development of the BNP
(from Erdmann et al. 2003a)
Management Advisory Board (DPTNB). NRM provides development
Since 1998, USAID's Natural Resources Management Program (NRM)
support to the executive secretariat of the DPTNB, which consists
has been working actively to implement a co-management initiative
of representatives from national, provincial and local government
in the park. Prior to this initiative, the management of BNP was
agencies, village stakeholders, the private tourism sector, academia,
centralistic and legally under the authority of the Ministry of Forestry's
and environmental NGO's. The "crown jewel" of the Bunaken co-
Bunaken National Park Offi
ce (BTNB). Local park users (particularly the
management initiative, the DPTNB represents a drastic departure
fi sherfolk and the dive tourism industry) were not eff ectively involved
from the traditional Indonesian model of top-down management of
in park management, and local government agencies were highly
MPAs, and strives to make decentralised, participatory, transparent and
resentful of the management authority vested in the BTNB. Funding
accountable MPA management a reality.
for conservation and management activities in the park was minimal,
the enforcement system ineff ectual, and the park zonation system was
Development of a portfolio of sustainable conservation fi nancing
largely misunderstood and ignored by the local populace. In most
mechanisms for BNP: A ground-breaking decentralised park entrance
respects, Bunaken National Park qualifi ed as a "paper park".
fee system has now placed the DPTNB on the road to fi nancial self-
reliance. Other components in the developing fi nancing portfolio
Objective of Initiative
include an international volunteers system to lower management
The goal of the Bunaken National Park co-management initiative is to
costs, diversifi ed government agency support, in-kind support from
develop an eff ective and sustainably-fi nanced Indonesian model of
the local dive tourism sector, national and international grant support,
multistakeholder co-management of a national marine park which will
visitor center merchandising and a possible endowment fund.
thereby serve as a marine protected area (MPA) center of excellence
for Indonesia and SE Asia. The key to achieving this goal has been a
Development of an eff ective 24-hour patrol system for BNP: An experimental
massive socialisation eff ort to draw the various stakeholders from the
joint patrol system involving park rangers, water police offi
cers and local
park (including 30 000 villagers, an active marine tourism industry,
villagers has proven highly eff ective in decreasing destructive fi shing
local conservation NGO's, academia, and three tiers of government
practices in the park.
agencies) into a single "community" with a strong sense of awareness
and ownership of the valuable but threatened marine resources in the
Institutionalisation of a scientifi c monitoring programme to monitor eff ects
park.
of management activities on park resources: In conjunction with WWF
124
GIWA REGIONAL ASSESSMENT 57 INDONESIAN SEAS
Wallacea, NRM is supporting park stakeholders in monitoring coral
It is necessary to balance ecological values with socio-economic
condition (using manta tows and line intercept transects) and reef fi sh
values to generate essential stakeholder political support for
stocks (visual census of select reef species and monitoring of grouper
conservation of protected areas in regions with population pressures
and Napoleon wrasse spawning aggregation sites).
and/or priorities on economic growth and development.
Building informed participation is a long-term process, requiring
Select accomplishments to date
extensive capacity building and facilitation. Villagers, government
Participatory zonation revision completed for Bunaken, Manado
and non-government stakeholders with long-term involvement in
Tua, Mantehage and Siladen Islands and ongoing in 14 remaining
conservation management provide more innovative solutions and
villages.
productive support for conservation management.
Institutionalisation of the 15 seat multistakeholder BNP Management
Park managers and the rangers tasked with fi eld management of
Board (DPTNB) and the 22 village BNP Concerned Citizen's Forum
the park commonly lack the community facilitation skills critical
(FMPTNB) and widespread socialisation of these two institutions.
to ensuring broad stakeholder support and understanding of park
Strong participation of private sector in management via the
management objectives. Training in facilitation skills for these park
NSWA, which has instituted a programme of "3 E's" (employment,
management personnel is an essential capacity-building measure
education and enforcement) within the park.
before co-management can be eff ectively implemented.
Development of a decentralised park entrance fee system
Co-management starts with the development of constituency-based
whereby 80% of the revenues are earmarked for BNP management
partnerships, and then evolves to true co-management when the
programmes. The system succeeded in raising 42 000 USD in its fi rst
constituency-based partnerships then start working with each other.
year of operation (2001) and 109 000 USD in 2002, and is eventually
The evolution to co-management results in collaboration among
targeting up to 250 000 USD/year.
often competing constituencies. Strong constituency partnerships
Implementation of a joint patrol system that includes villagers and
provide a solid foundation for co-management.
that has virtually eradicated blast and cyanide fi shing from the park
Community conservation campaigns through schools, mosques
and greatly limited illegal coral mining and mangrove cutting.
and churches can build eff ective local support for and pride in
Multimedia park socialisation campaign to instill a sense of
conservation initiatives. People will support conservation of their
BNP community using posters, zonation calendars, townhall
environment if they take pride in it. Of course, pride alone will not
meetings, community information billboards, a 30 base station
achieve conservation. Also important are economic incentives and
VHF community radio network, local television shows and local,
enforcement of rules and regulations.
national and international newspaper and magazine articles.
Decentralisation
of
conservation
management
works
when
roles
Sharing of lessons learned from Bunaken with MPA managers from
and responsibilities are clear, and when there is a shared vision of
Bali Barat NP, Komodo NP, Wakatobi NP, Cenderawasih NP, Berau
goals and objectives. Decentralisation does not work when there is
Islands and Tomini Bay in Indonesia and Hon Mun Marine Reserve
competition over management authority or signifi cant divergence
in Vietnam.
in goals and objectives. Decentralisation also stimulates stronger
Recorded an 11% increase in live coral cover in a one and a half
grass-roots democracy and principles of good governance.
year period on the reefs which have already completed zonation
Co-management requires active involvement of all relevant
revision and are protected by patrol system.
stakeholders. This is site-specifi c in nature. In Bunaken it includes dive
Selection as the Asian MPA ecotourism demonstration site for the
operators, communities, diff erent levels of government, universities
International Coral Reef Action Network (ICRAN).
and NGOs. Co-management must be inclusive, and must provide for
reasonably equal voices for relevant stakeholder groups.
Selected lessons learned
The composition of multistakeholder co-management boards
Over the past fi ve years, a number of important lessons have been
is absolutely critical to their success. The optimal ratio of
learned in attempts to strengthen decentralised co-management of
governmental to non-governmental representatives and those
Bunaken National Park. While it is beyond the scope of this executive
advocating diff erent functions of the protected area (economic
summary to discuss these in detail, we list the most important of
development, conservation, sustainable resource use) will vary
these lessons learned in the hopes that they may be of interest to
from site to site, but will have profound consequences for the
other tropical MPA managers currently utilising or considering a co-
eff ectiveness of these multistakeholder boards. There must be a
management approach:
balance between the competing interests represented, and this
ANNEXES
125
will not always entail equal numerical representation; in many cases
providing guidance on how to adapt interventions if they are
the stakeholder group(s) that are the most hesitant to advocate
not working well. This includes the use of both ecological as
strong positions may require a larger allocation of seats on a multi-
well as socio-economic indicators in an integrated management
stakeholder board to achieve truly equal representation.
eff ectiveness monitoring system
Community stakeholders support patrol and enforcement
Multiple-use MPA zonation plans are valuable management tools
programmes, as they are directly linked to increased livelihoods.
for mitigating confl ict among stakeholders and balancing eff ective
Many illegal activities within protected areas come from outsiders.
conservation with sustainable development in developing country
Communities with a stake in conservation management or
MPAs with large population pressures. These plans are most eff ective
sustainable utilisation of park resources have a strong and rational
if based upon a combination of scientifi c/ecological considerations
interest in seeing rules and regulations enforced so natural
and input from a range of primary user groups who have received
resources are sustained.
facilitation in understanding and accepting compromise.
"Alternative livelihood programmes" aimed at stakeholders
Zonation schemes should use a minimal number of zone types, with
currently involved in destructive activities in the coastal zone are
names that clearly indicate their purpose, explicit rules for allowed
ineff ective and largely rejected by local communities. Community
and disallowed activities, and clearly demarcated borders that utilise
conservation/improvement programmes should focus on
natural or otherwise well-known landmarks whenever possible.
rewarding those that have chosen sustainable livelihoods, while
The use of focal interest group meetings instead of relying only
those that persevere with destructive activities should be dealt with
on large village meetings is essential for ensuring broad-based
by a strong enforcement system.
community participation and equitable decision making. This
Local self-fi nancing mechanisms are key to providing local
ensures the involvement of many of the more marginalised or
stakeholders with the fuel to manage local conservation
traditionally quiet community members.
interventions. Decentralised co-management requires the capacity
Representation of larger groups (villages, the private sector, etc)
to generate and then manage fi nances locally.
in marine resource management decision-making is a new and
Development-oriented stakeholders, particularly from government,
poorly-understood concept in Indonesia. The individuals chosen
support conservation when it can be linked to regional economic
to represent larger groups often neglect their responsibility to
development. Conservation of protected areas is better described
communicate actively with their constituents, while constituent
within the context or regional economic development than
groups often resent those chosen to represent them. This
altruism.
democratic principle needs continuous facilitation.
Involvement of the private sector in co-management of MPAs
Decentralised co-management supports the principles of good
can be highly benefi cial. Once potential business competitors
governance. Although it must be carefully managed (and well-
focus upon the benefi ts of cooperating to protect the resources
designed at the outset in order to prevent dominance by any
in the MPA upon which their income depends, they become one
one stakeholder group), one of the greatest strengths of the co-
of the strongest proponents of good management and bring
management approach is in utilising the diverse interests and
considerable fi nancial and human resources to the table.
motivations of various stakeholder groups to prevent corruption,
Tourists are willing to pay reasonably high entrance fees as
collusion or nepotism.
long as they see their money is resulting in visible conservation
Establishment of a sense of pride and ownership of local
management. Willingness-to-pay for eff ective conservation
marine resources is a key step in generating strong support for
management is high, but can only be sustained when tourists see
conservation measures. Even in the absence of traditional or
results from their payments.
legal marine tenure systems (where communities directly own
Funding for conservation management needs to be diverse. Reliance
resources), ownership of the management of those resources
on a single source like user fees is dangerous. This is demonstrated
engenders strong conservation support.
by the sudden drop-off in revenues from the Bunaken entrance
Human resource development and institutional strengthening is
fee system after September 11 and the Bali Bombing. Long-term
best achieved through long-term, learning-by-doing mentoring
sustainability requires signifi cant fi nancial diversifi cation.
processes rather than short-term, highly specifi c technical training
Monitoring and evaluation are key to ensuring on-going success
programmes. Technical training can meet specifi c needs, but
of conservation management interventions. This is important for
broad-based capacity building for conservation is best achieved
convincing stakeholders that interventions are working and/or
through long-term, medium-input mentoring.
126
GIWA REGIONAL ASSESSMENT 57 INDONESIAN SEAS
More information on the Bunaken National Park co-management
Bunaken zonation experience. These include:
initiative can be found at www.bunaken.or.id and www.bunake.info.
Multiple-use MPA zonation plans are an incredibly valuable
management tool for mitigating confl ict among stakeholders
Revised zoning
(eg, tourism operators and local fi shers) and balancing eff ective
(from Erdmann and Merrill 2003)
conservation with sustainable development in developing country
Clearly a balance between inputs from science and stakeholder
MPAs with large population pressures. These plans are most eff ective
participation is necessary in producing a functional and enforceable
if based upon a combination of scientifi c/ecological considerations
multiple-use zonation plan. One additional element of the Bunaken
and input from a range of primary user groups who have received
zonation revision process that is strongly in need of improvement is
facilitation in understanding and accepting compromise.
the involvement of local park managers and/or rangers in the zonation
Zonation schemes should use a minimal number of zone types,
facilitation process. Unfortunately, the participatory zonation process
with names that clearly indicate their purpose, explicit rules for
relies strongly upon excellent facilitation skills that are generally lacking
allowed and disallowed activities, and clearly demarcated borders
in park management staff ; training opportunities to acquire these skills
that utilise natural or otherwise well-known landmarks whenever
are also noticeably absent. It is highly likely that this situation is endemic
possible.
to developing country MPAs, and conservation and development aid
The process of creating a multiple use zonation plan (including
organisations interested in promoting eff ective MPAs should pay
wide stakeholder participation, facilitated compromise between
particular notice to this widespread need for better community
groups, and widespread socialisation of the eventual zonation
facilitation skills in park managers...
plan) is as important as the actual details of the eventual zonation
system in terms of building support for and compliance with the
The actual siting of individual zones was based upon a combination of
system. However, an adequately participatory process is often long
scientifi c and stakeholder input and a commitment to include at least 20%
(measured in years) and requires signifi cant fi nancial commitments
of each island's reef area in "no-take" zones where fi shing is not allowed (in
and excellent facilitation skills on behalf of the implementing
accordance with the US Coral Reef Initiative and a number of other MPA
agency(s).
design guidance papers). Both the strict conservation and tourism use
While stakeholder participation is essential, there is no one single
zones are "no-take", and were sited to include known reef fi sh spawning
best participatory approach to involving stakeholder groups in
aggregation sites, unique reef features and long-established dive sites.
zonation plan development. The best participatory approach is one
Village fi shers were persuaded to agree to these 20% closures using careful
that has been carefully crafted to achieve maximum stakeholder
explanations of the fi sheries enhancing benefi ts of no-take zones.
involvement and acceptance based upon knowledge of the social
dynamics of the individual user group targeted (which is often best
To date (2002), these revised zonation plans have been extremely
gained from direct feedback from members of that group).
successful in terms of compliance and the overarching objective of
Widespread socialisation of zonation schemes using a variety of
allowing multiple uses of this highly valuable national asset while
media is absolutely essential to their success, but is not suffi
cient
preventing stakeholder confl ict. The resource base has also shown
to ensure compliance. A strong enforcement system is critical to an
marked improvements; on Bunaken Island alone, the reefs have shown
eff ective multiple-use zonation system.
an incredible 11.3% increase in live coral cover and signifi cant increases
A system which utilises relatively large contiguous zones rather
in size and abundance of commercially valuable fi sh species in the
than a series of many small zones is both easier to enforce and, in
two years since the zonation plan was agreed upon (Erdmann, unpub.
the case of no-take zones, likely provides greater conservation and
data). This success has encouraged Indonesia's Department of Nature
fi shery benefi ts.
Conservation to use the Bunaken experience as a basis for their new
The zonation process is best viewed as an iterative process that
national technical guidance paper on MPA zonation (PHKA, 2002)" (also
needs evaluation and revision on a regular basis.
see Usher and Merrill 2000, PHKA 2002 and Annex X).
Surveillance and enforcement
Lessons learned from the rezoning
(from Erdmann & Toengkagie 2003)
(from Erdmann and Merrill 2003).
Additional diffi
culties associated with surveillance and enforcement
A number of useful lessons learned that may have wider applicability
were addressed in early 2001, when the Bunaken National Park
(especially to developing country tropical MPAs) can be drawn from the
Management Advisory Board (DPTNB) initiated a joint patrol system
ANNEXES
127
that placed community members side-by-side with professional
manner) allowing them to quickly and eff ectively target those
enforcement offi
cers, to increase eff ectiveness of the patrol system (
activities/user groups that cause most damage to the reefs,
from Erdmann and Toengkagie 2003).
and allowing them to resolve resource use confl icts in a more
consensual manner than rangers or police might.
Forty fi ve villagers, 16 park rangers and 5 water police offi
cers constitute
Alternative employment for fi shers who would otherwise depend
the core of this multistakeholder patrol system, which is focused upon
on reef resources.
4 primary activities: 24 hour routine waterborne patrols, entrance fee
Extraordinarily
eff ective socialisation of the conservation and
enforcement, socialisation of the park's rules to villagers and visitors, and
sustainable use goals of the park - village patrol team members
routine beach cleanups. While the involvement of civilians in patrols has
"socialise" the park even during their free time when interacting
been at times controversial and posed a number of unique challenges,
with other villagers on a social basis.
the joint patrol system has proven a tremendous improvement to the
previous system and has resulted in a dramatic decrease in destructive
Involvement of a range of stakeholders (eg, rangers, police, and villagers
resource uses such as blast and cyanide fi shing, mangrove cutting and
from several villages) in joint patrol teams can greatly decrease the
endangered wildlife capture (also see Annex X).
likelihood of corruption, collusion or confl icts of interest in dealing with
violations committed by friends and family members. When developing
The increased patrolling and stepped-up enforcement has led to a
an MPA multistakeholder patrol system that involves local community
signifi cant reduction in illegal fi shing activities within the boundaries of
members, equal representation of all villages (and cultures/religions)
the National Park. Live coral cover has increased by more than 11% over
within the MPA is an important precursor to acceptance and success
the past two years (to 2002). Park communities are enjoying community
of the patrols. Most MPA stakeholders (villagers, tourism operators,
development support from conservation revenues. This success is only
and others) support rules and regulations as long as they are clear and
possible through the commitment of Park Management Advisory
equitably enforced. Clear rules are easily understood and clearly posted.
Board members to good governance principles of transparency and
Equitable enforcement means that all those that break the rules are
accountability.
treated the same way.
Lessons learned from a multistakeholder enforcement initiative
Community stakeholders support patrol and enforcement programmes,
While the adaptive management process for the Bunaken joint patrol
as they are directly linked to increased livelihoods. Many illegal activities
system is ongoing, already there have been a number of important
within protected areas come from outsiders. Communities with a stake
lessons learned that may prove useful to MPA managers considering the
in conservation management or sustainable utilisation of park resources
involvement of community members in joint patrol systems. Among
have a strong and rational interest in seeing rules and regulations
the more important are: Involvement of villagers in a joint patrol system
enforced so natural resources are sustained. The overwhelming
has associated costs and benefi ts, but benefi ts generally far outweigh
majority of villagers in BNP has voiced support for a strong patrol
the costs (see also Crawford et al. in press, Espeut, these proceedings).
system, and actively assist the system as "reef watchers" using the
park-wide VHF radio system. Park managers and the rangers tasked
Costs include
with fi eld management of the park commonly lack the community
Village patrol members require signifi cant initial training.
facilitation skills critical to ensuring broad stakeholder support and
Village patrol members have no authority to arrest or carry weapons.
understanding of park management objectives. Training in facilitation
Social jealousies can arise from villagers not involved in patrol system.
skills for these park management personnel is an essential capacity-
Occasional confl icts of interest arise when violations are committed
building measure.
by friends or family members.
When building a multistakeholder patrol system, it is imperative to
Benefi ts include
appoint a strong leader who respects the other stakeholder groups
Villagers are on the scene 24 hours/day, and have a vested interest
but maintains a clear vision for the overall patrol team. This lesson was
in protecting "their" reefs for the future use of their children and
abundantly clear when comparing the northern and southern patrol
grandchildren.
teams; the northern patrol team, while receiving the larger amount of
Village patrol members have intimate knowledge of local reefs and
funding and facilities, was continuously hampered by poor leadership
the people exploiting them (both sustainably and in a destructive
from the fi eld coordinator leading to infi ghting and less than optimal
128
GIWA REGIONAL ASSESSMENT 57 INDONESIAN SEAS
performance. By comparison, the southern team, while operating on a
no indication that these costs will decrease in the future. Unfortunately,
smaller budget in an area with more hardened bomb fi shermen, was
even though broad socialisation of park rules has resulted in increased
highly successful, in large part due to an excellent fi eld coordinator
compliance, the economic incentive to illegally extract resources in the
from the BTNB who maintained and nurtured the enthusiasm and
park only increases over time (as resources are overexploited outside
commitment of the village patrol members.
of the park) necessitating a continuously vigilant patrol system. BNP
experienced this fi rsthand in January 2003, when a temporary work
It is extremely important to declare and treat marine resource crimes
strike by village patrol members resulted in an immediate spike in
as serious off enses, and to apply enforcement evenly across all levels of
blasting and cyaniding activities within the park in the space of two
society (including villagers, tourists, outside military/police/government
weeks!
offi
cials, etc). Public support for patrols will rapidly decline if powerful
individuals are given "special treatment".
Development and Results of Bunaken Entrance Fee System
(2001-2002)
Indonesian courts typically treat destructive fi shing and other
(from Erdmann et al. 2003b)
marine resource crimes as light off enses. Education of all levels of the
Since 2000, USAID's Natural Resources Management Program has been
enforcement/prosecution system is required to provide understanding
assisting the multistakeholder Bunaken National Park Management
that marine resource crimes rob future generations of their livelihoods
Advisory Board in developing a model entrance fee system under
and must be punished severely. Enforcement is a continuous, ongoing
special "pilot project" status granted by the Indonesian national
need there will always be individuals ready to engage in illegal (and
government. Based upon the highly successful Bonaire Marine Park
profi table) activities if enforcement activities are decreased below
entrance fee system, the Bunaken system successfully raised nearly
eff ective levels....
42 000 USD in its fi rst year of operation in 2001. With the strong support
of the local tourism sector, the fee for international tourists was doubled
Since its inception, the joint patrol system has consistently ranked
in 2002, raising ~110 000 USD from over 8 000 international and 17 000
the most expensive programme in the DPTNB annual budget. In
Indonesian visitors. Revenues from the fee system now fund a park-wide
2001, the patrol system recorded 222 164 725 Rp (~22 500 USD) in
joint ranger/police/villager patrol system, environmental education
operational costs (including salaries for village patrol members and
programmes, and village-level conservation and development
bonuses for rangers/police, as well as fuel, equipment maintenance,
programmes.
criminal investigation and court costs, and training), plus an additional
9 000 USD in equipment procurement (2 wooden boats with
In its inaugural year, the BNP entrance fee system was quite successful,
outboard engines). In 2002, with both northern and southern patrols
with total entrance fee receipts of 418 187 500 Rp (~42 000 USD)
operational for the entire calendar year, overall operational costs
recorded during the period of 15 March-31 December 2001. These
totalled 531 000 000 Rp (~59 000 USD), plus an additional 29 000 USD
fees were collected from a total of 15 055 visitors to the park (including
in equipment procurement (VHF radio system, 2 engines and 1 boat).
5 183 foreign guests, 8 387 adult Indonesians and 1 485 Indonesian
The 2003 DPTNB annual budget includes 673 000 000 Rp (~76 500 USD)
students). Taking into account the late start of the entrance fee system
for patrol operational costs plus an additional 22 000 USD in equipment
and the eff ects of the 11 September 2001 terrorist attacks on tourism,
procurement (polyethylene hull speedboats with environmentally-
the overall visitation for the park for 2001 was projected at the level of
friendly four-stroke engines). For all three years, operational costs
25 000 visitors (15 000 Indonesians and 10 000 foreigners). Although
were funded by entrance fee receipts and two grants from WWF-
they represented only 34% of visitor numbers, international guests
Wallacea, while equipment procurement was funded by USAID's NRM
generated almost 95% of the entrance fee receipts. In total, 37 countries
programme. While it is envisioned that equipment costs should be
were represented in the entrance fee database, with the top country
minimal in the foreseeable future, operational costs are projected to
of origin being the UK, followed closely by the USA, Italy, Holland, and
stabilise at the 2003 level. Using this projection, the BNP joint patrol
Germany. A second tier was comprised of Singapore, Japan, France,
system costs approximately 0.85 USD/ha/year.
Taiwan, Hongkong, Switzerland, and Spain.
It is important to note that while the overall percentage of the DPTNB
Of the revenue collected, 20% was distributed to the various levels of
budget devoted to the patrol system has dropped from over 50% in
government as per provincial law. Approximately 50% of the proceeds
2001 to roughly 15% in 2003, the costs have actually risen and there is
were used to fund the joint ranger/police/villager patrol system for BNP,
ANNEXES
129
Table 1 Entrance Fee Schedule for Bunaken National Park as
of the Taiwanese and the signifi cant drop in American visitors can be
prescribed by North Sulawesi Provincial Law No. 9/2002.
attributed to the introduction of direct international fl ights to Manado
Researcher and Commercial Filmmaker fees are charged in addition to applicable visitor fee.
from Taiwan in early 2002 and the American reluctance to travel
Residents of the 22 villages in the park and their Indonesian house guests are exempt from
paying the visitor fee, while researchers from local provincial universities and institutions are
internationally in the wake of the 11 September 2001 terrorist attacks.
exempt from the researcher fee.
Indonesian
International
Fee Category
(Rp)
(Rp)
As with the 2001 revenues, 20% were allocated to national, provincial
Visitor
and local governments, with an additional 40% of the revenues spent on
Yearly tag
No Data
150 000
support for the joint patrol system. New in 2002 was an expenditure of
Daily ticket
2 500
50 000
over 30% of total revenues on village-level conservation and development
Student/child
1 000
No Data
programmes (including a 30-station park-wide VHF radio system, beach
Researcher
cleanups, construction of public toilet and water facilities and paved
1-7 days
45 000
100 000
footpaths, and mangrove rehabilitation programmes). Additional
8-30 days
75 000
200 000
expenditures for 2002 included support for a nascent biological
1-6 months
125 000
400 000
monitoring programme and villager environmental education-
.5-1 year
200 000
600 000
>1 year
250 000
800 000
A key factor in the continued success of the BNP entrance fee system
Commercial Filmmaker
has been continuous engagement with all levels of the tourism sector to
Documentary film
2 000 000
3 000 000
obtain feedback and adapt the system to any perceived shortcomings.
Documentary video
500 000
1 000 000
One clear requirement from the tourism community has been the need
for continuous socialisation of the fee system and full transparency
while another 10% was used to purchase and install village information
regarding results. The BNPMAB regularly updates FAQ sheets and
billboards in all 30 settlements within the park. The remaining 20% was
posts the results of the entrance fee system (monthly revenues and
set aside for use in the following year's BNPMAB budget.
expenditures, etc) on websites, bulletin boards throughout the park,
and via email lists. Brief updates on entrance fee results are also
Based upon the overall success of the fee system in 2001 and broad
submitted to international dive and nature magazines. Another key area
support from the tourism industry, the annual fee for international
of improvement suggested by the tourism industry (and highlighted
visitors was doubled in 2002, becoming 150 000 Rp (~17 USD). It is
by the detailed statistics collected by the entrance fee system) was
interesting to note that such a rapid raise in the fee is quite unusual
a new focus on meeting the demands of local Indonesian tourists.
for most MPAs and underlines the importance of working closely with
During the fi rst year of the entrance fee system, the BNPMAB focused
the tourism sector; De Meyer and Simal (these proceedings) report
on foreign divers and snorkellers as primary customers, devoting most
that Bonaire tour operators have resisted a fee raise for over a decade.
management eff orts towards improving patrols and other activities to
Additionally, a one-day ticket (50 000 Rp) for international guests was
maintain and improve the quality of the reefs. However, it soon became
introduced at the request of the local cottage owners (see below).
evident that local tourists are far more numerous, and that they have
Despite a drastic decrease in international visitors following the Bali
quite diff erent demands for a "quality MPA experience": clean beaches
bombing incident on 12 October 2002, the BNPMAB managed to record
and public picnic and toilet facilities with reef quality being largely
total yearly receipts of 983 750 500 Rp (~110 000 USD). These revenues
irrelevant! More recently, the large increase in day-tripping Taiwanese
were generated from a total of 25 697 paying guests, composed of
snorkel tourists has required yet another management paradigm
approximately 2/3 local Indonesian guests and 1/3 international visitors.
shift; unlike BNP's "normal" clientele of relatively experienced (and
Of the 17 435 Indonesian guests, most were adult guests (14 525),
environmentally-enlightened) divers, this type of tourist requires
while 2 910 students also were recorded. By contrast, a total of 8 262
specifi c education and patrol programmes to prevent reef trampling.
international guests were recorded from 48 countries. Most of these
With both of these situations, close monitoring of entrance fee data
international guests (5 294) purchased one-year waterproof entrance
combined with continuous engagement with the tourism community
tags, while an additional 2 968 visitors purchased single-day entrance
has allowed adaptive management changes.
tickets. Taiwan, Italy and the United Kingdom were the top three
countries of origin for international visitors to BNP during 2002, with
Yet another improvement to the fee system suggested by the tourism
1 431, 1 075, and 793 guests, respectively. The notable predominance
sector was the provision for an incentive system for tag sales to
130
GIWA REGIONAL ASSESSMENT 57 INDONESIAN SEAS
further prod uncooperative operators to participate willingly. Under
At the same time, the BNPMAB is also working to further diversify the
this agreement, a 5% "commission" (7 500 Rp/tag) is off ered by the
BNP funding portfolio to prevent overdependence on the entrance fee
BNPMAB on all entrance tag sales. However, to promote institutional
system (which is subject to potentially large disturbances to international
strengthening of the tourism sector and better cooperation, this
tourism). Specifi c targets include an international volunteers system to
incentive is not paid directly to individual tourism operators, but rather
lower management costs, diversifi ed government agency support,
to the trade association of their choice (including the NSWA, the local
in-kind support from the local dive tourism sector, and national and
cottage-owner association, the charter boat association, and the travel
international grant support. Two additional sources of funding that are
agents' association). Moreover, the commission is only paid on yearly
currently under development include visitor center merchandising and
entrance tags, in order to encourage operators to sell the tags instead
a possible endowment fund. Finally, BNP has been selected as one of
of one-day tickets. This system has also improved compliance and
four MPAs to participate in a pilot study to develop business plans for
cooperation, and allowed some interesting initiatives to develop; the
Asian MPAs under the auspices of the World Commission on Protected
NSWA uses the proceeds of these commissions to fund a scholarship
Areas South East Asia Marine (WCPA SEA Marine) working group. With
fund for local high school students from within the park, and the
these initiatives well underway, the BNPMAB is targeting fi nancial
cottage owner association uses their commissions to fund weekly
sustainability by 2005.
beach cleanups by local villagers.
A fi nal improvement suggested by the tourism community was
the introduction of an entrance tag design contest open to all
guests visiting the park. For the fi rst two years, the tag design was
decided internally within the BNPMAB. While the tag designs were
enthusiastically received and the tags have in fact become a collector's
item (the BNPMAB received several requests from abroad to purchase
tags without visiting the park!), members of NSWA suggested that
a tag design contest would only further promote the entrance fee
system. The 2003 tag design contest was announced in June 2002,
with a deadline of October 2002 to provide ample time to select and
print the winning tag design by December 2002. Participants were
allowed to submit up to three photographs or graphic designs each
for consideration, with the winning prize being a return airfare from
Singapore to Manado (donated by SilkAir) and a 5 day all-inclusive
diving package at one of 6 participating dive resorts. Importantly, any
submitted photos or designs become the non-exclusive property of the
BNPMAB for use in printed conservation materials (posters, brochures,
and calendars) for the park. The contest has proven very popular and
is now in its second year.
Future plans
In the long run, the BNPMAB is targeting up to 250 000 USD a year from
the entrance fee system. The projected increase in revenues is assumed
to come from a combination of increased visitor numbers and eventual
fee raises (both for local and international visitors). At the same time,
NRM is now working with the BNPMAB and the tourism sector to set
visitor carrying capacity limits and legislate these limits to prevent the
onset of mass tourism. Increased user fees will likely be one tool that will
be used in the future to limit visitor numbers to a sustainable level.
ANNEXES
131
Annex IX
formulating this country's future MPA network strategy. The current
Small versus large PAs in
focus on small community reserves is certainly important and should
tropical developing nations
continue to be encouraged - but not to the exclusion of large reserves.
These large MPAs, while often presenting a much more complex
management situation, are an essential component of Indonesia's
(From Natural Resources Program Headline News Issue 35, November
marine conservation eff orts.
2001, courtesy M. Erdmann, Bunaken National Park).
Considerable recent debate has centred on the relative merits and
drawbacks of small (less than 2 hectare) community-based MPAs
versus large (tens to hundreds of thousands of hectares), often centrally-
managed MPAs - the marine equivalent of the well-known SLOSS
(Single Large Or Several Small) debate in terrestrial conservation circles.
This debate has particular relevance to Indonesia and the region as a
whole at this time, when several large institutions appear to be favoring
the small community marine reserve approach based upon an apparent
belief that large MPAs are much more diffi
cult to manage and often
face signifi cant public opposition. A good case study for Indonesia is
the Philippines, where there are reportedly almost 100 small municipal
MPAs and relatively few larger MPAs (with Tubbataha being a notable
example). Indeed, the increasing prevalence of Philippines fi sh poachers
in Indonesian waters suggests that the Philippines MPA strategy has not
been altogether eff ective!
Several Philippines representatives at the UNEP-sponsored Workshop
on Networking of MPAs in the East Asian Seas held in Kota Kinabalu,
Malaysia from 8-12 October 2001 argued strongly for the small
community reserve approach, citing the strong community support
that is often achieved and the resulting effi
cacy of management. On
the other hand, many marine scientists present at the meeting pointed
out that current ecological theory on reef organism life histories and
recruitment dynamics suggest that such small reserves, even if relatively
high in number, cannot maintain viable populations of many important
reef species. While small community reserves are an excellent MPA
marketing tool to increase village awareness and participation in marine
conservation and possibly to increase local fi sh catches, networks of
large reserves (on the scale of tens of thousands of hectares) are critical
for the survival of rare, widely-spaced or highly mobile reef species.
A commonly-cited example are groupers (fi sh), which can travel up
to 10km or more to spawn in large aggregation sites. Without large
reserves that include the entire home range of such groupers (including
the spawning aggregation sites), there can be no eff ective protection
of grouper stocks.
It would seem appropriate that the debate raised at the Kota Kinabalu
workshop should be revisited in Indonesia for the purpose of
132
GIWA REGIONAL ASSESSMENT 57 INDONESIAN SEAS
Annex X
communities with a high probability of resistance and resilience to such
Selection of coral reef marine
unmanageable events as mass bleaching, aff ord them high levels of
protected areas
protection, and incorporate these into larger management areas that
include as many reef types and habitats as possible.
(Courtesy of Rod Salm, The Nature Conservancy).
Second principle: Replication of MPAs along prevailing, larvae-
carrying currents (corridors of connectivity) will greatly increase the
"Although existing MPA selection criteria and design principles do not
probability of survival for multiple reef communities and their prospects
defi ne specifi c management measures to address emerging global
for reciprocal replenishment. Threats to coral reefs are unprecedented
threats such as climate related coral bleaching, they retain defi nite value.
in their severity and extent, and it is not altogether predictable where
They help to defi ne conservation objectives and targets, beginning
and when global events will strike. Replication of MPAs and connectivity
the process to identify the threats to these, along with their sources or
among them will help some reef communities to escape major impact,
root causes, and to determine management strategies to address the
aid in the recovery of damaged areas down-current, and increase
threats. These criteria and principles provide the focus for coral reef
the prospects for reef survival at current levels of biodiversity. Thus
conservation planning and along with various approaches, such as
replication of sites and connectivity among reefs (as expressed through
community participation, co-management, and the like provide the
larval dispersal along currents and through species movements) should
core strategies for eff ective MPA establishment.
also be applied to the selection of sites.
MPA selection criteria do not adequately address survivability. In fact,
Third principle: MPAs should be selected to represent the full national
tourism and fi sheries have usually determined the selection of smaller
or regional range of coral reefs, and should include other functionally
MPAs or the diff erent zones within larger ones. Tourism and fi sheries
linked habitats such as seabed, seagrass, mangrove, and coastal and
are important sources of revenue and livelihood in most developing
riparian areas. Patterns of climate-related bleaching and mortality are
countries and so are given high priority. More often than not, MPA
neither fully understood nor predictable. But it is known that pockets of
selection is frequently determined by opportunity (strong local
resistance to bleaching are distributed among reef types and diff erent
community and/or government support) or crisis (a high level of threat
parts of the same reefs. It is also known that the reef ecosystem extends
to a site that is considered important for any reason), which is how tourism
beyond the physical reef framework to include a range of habitats
and fi sheries often lead the process. Opportunities and crises are likely to
that are linked by physical and ecological processes, including the
arise at intervals, but one needs to get ahead of them if MPA selection is
transport of nutrients by currents or daily feeding migrations of reef
to proceed in a planned and orderly fashion. In this context, it is important
species. These processes help to maintain coral reef communities in a
that we move fast to secure adequate levels of protection for coral areas
"healthy" state. Thus protection of a range of diff erent reef communities
that are both resistant and resilient to mass bleaching, perhaps one of the
and linked habitats will increase the prospects that some will survive
greatest emerging threats of this century faced by coral reefs.
bleaching. Furthermore, maintenance of unimpeded reef processes will
enhance the prospects of rapid recovery in areas that suff er diff erent
In addition to the usual criteria for selection of coral reef MPAs , here
levels of mortality.
are some additional principles and criteria for coral reef MPAs under an
entirely new category: survivability.
The coral reef marine protected areas site
selection process
Additional principles for the selection of coral
The objective relating to the fi rst selection principle above is: to identify
reef marine protected areas
and adequately protect reefs or parts of reefs that reliably have one or
First principle: The survival prospects of coral reef communities in
more environmental factors present that: have a signifi cant positive
the face of large scale climate related events, such as their resistance
eff ect on coral reef resistance and resilience to climate related bleaching
and resilience to bleaching, should receive serious consideration in the
and enhance recovery of aff ected areas; and are suffi
ciently reliable and
selection and design of MPAs. Unless MPAs are designed and managed
persistent through time in their presence and eff ect. These sites should
specifi cally to survive massive climate-related bleaching and mortality,
be the essential foundation for a network of coral reef MPAs that is
coral reef communities in even the most eff ectively managed sites
designed to conserve representative biodiversity.
may be susceptible to such events. Thus we need to identify coral reef
ANNEXES
133
The objective relating to the second selection principle above is: to
Supplementary data will need to be collated from the literature,
identify and adequately protect reefs and reef complexes that are linked
fi eld surveys, interviews, and any other sources to help identify other
by prevailing currents, larval dispersal where this can be demonstrated,
values (e.g., endangered species habitat, fi sh spawning aggregations
and species migrations. These sites should be the essential building
and nurseries, suitability for tourism, and so on depending on
blocks of a network of coral reef MPAs.
identifi ed local or national priorities), levels and types of use, types
and severity of threats, relevant oceanographic data, administrative
The objective relating to the third selection principle above is: to
districts, and locations of existing or proposed MPAs.
identify and adequately protect reefs of diff erent morphology, species
composition, and environmental conditions along with the adjacent
This procedure will produce a list of candidate sites with high survival
habitats that are linked through physical or ecological processes.
prospects and the currents will indicate likely seasonal connectivity
These areas and their surrounds should be listed as candidate sites
among them. Adding other values, levels of use, and degree of
for establishment as MPAs. The resistant coral communities should
threat will help the selection of the most viable sites for conservation
be considered for zoning as strict reserves under the highest levels of
investment.
protection. The resilient coral communities and adjacent linked habitats
should be zoned as strict reserves under high levels of management to
Applying MPA selection criteria
enable control of all direct and upstream sources of threat.
To cope with global threats and the unprecedented fi shery and
other pressures on coral reefs, there is little doubt that the world
Deciding priorities
will need to go further if we expect reefs to survive. We will need
The four basic steps followed in systematic selection of MPAs (Salm et
to protect areas that we know have a high probability of surviving a
al. 2000) can be easily adapted to apply specifi cally to coral reefs. These
mass bleaching event. Furthermore, we will need to acknowledge the
steps include the collection, analysis and synthesis of data leading to the
greatly diminished relevance of urgency, opportunity, and political or
identifi cation of candidate sites, followed by the application of criteria
popular pressure, which in the past have often made the fi rst areas for
to select specifi c sites for protection.
protection so obvious that there has been no need or opportunity to
apply criteria at any stage.
A simple low cost option for data collection is described below:
Identify areas with high cover of old corals: at the simplest level, and
For the purposes of biodiversity conservation, criteria that favor survival
in the absence of any other information, undertake fi eld surveys
are of critical importance. Criteria stressing naturalness, uniqueness,
to identify those places where corals survived an earlier known
and habitat or species diversity are complementary, as they lead to
bleaching event. Having survived one major bleaching event, these
the selection of sites with maintenance of biodiversity, safeguarding
sites are more likely to survive a future one and should be listed
of ecological processes, and species replenishment as the primary
as candidate sites. Presence of high cover of old corals could also
management objectives.
indicate areas where coral communities are at low risk of exposure
to bleaching because of their location and prevailing climate
The thoughtful identifi cation and application of selection criteria will
and oceanographic conditions. These should also be considered
help to clarify the goals of MPA networks and their component sites.
candidate sites.
This also helps to ensure representation of all interests and priorities
In the absence of any capacity, time or resources to undertake a
in the MPA networks. Ultimately, MPA networks should aim to include
formal oceanographic analysis, refer to existing atlases or texts that
the full range of coral reef types and biodiversity, be interconnected by
could supply information on sea surface temperatures (SSTs), current
larvae-carrying currents, and include other functionally linked habitats,
strengths, presence of upwelling sites, exposure of corals at low
whether contiguous or geographically separated.
tides, and coral communities in or near estuaries, bays and lagoons
with predictably turbid waters. Oceanographers, dive operators,
The assumption that corals which have survived a previous known
researchers and fi sheries colleagues may be able to assist.
bleaching event have a high probability of surviving a future one is a
Consult atlases, nautical almanacs, oceanographic texts, and
useful shortcut to identify MPA sites that are likely to survive bleaching
oceanographers to produce maps in greatest possible detail of local
events. These sites can be identifi ed by the presence of living coral
inshore as well as off shore currents and combine these with data on
colonies covering a range of sizes, including large old ones.
fi sh movements obtained from fi sheries authorities and reports.
134
GIWA REGIONAL ASSESSMENT 57 INDONESIAN SEAS
Criteria for the selection of coral reef marine
High live coral cover
protected areas
Factors that favor survival of at least some coral communities
Stable
salinity
regime
Criteria
Large area with wide depth range and habitat variability
Social acceptance, public health, recreation, culture, aesthetics, conflicts
Low risk of exposure to climate related temperature stress at the
Social
of interest, safety, accessibility, research and education, public awareness,
conflict and compatibility, benchmark
location (high latitude)
Importance to species, importance to fisheries, nature of threats, economic
Economic
benefits, tourism
Resilience to coral bleaching as manifested by the reliable presence of one or
Biodiversity, naturalness, dependency, representativeness, uniqueness,
Ecological
integrity, productivity, vulnerability, spawning aggregations
more of the following environmental factors that may promote recovery:
Regional
Regional significance, subregional significance
Factors that indicate strong recovery potential
Pragmatic (these are
Urgency, size, degree of threat, effectiveness, opportunism, availability,
Strong
coral
recruitment
weighted heavily):
restorability, enforceability
(Source: Salm et al. 2000)
Presence and abundance of coral recruits
This section lists the proposed new survivability criteria for coral reef
Recruitment
success
MPAs. Existing criteria are summarised in the table above below, but are
Factors that increase coral larval transport to the site
not described in detail in this report.
Strategic location that will maximise both strong and reliable
recruitment of all species present, whether from other reefs or
Examples of MPA selection criteria
from within the same reef complex
Survivability Criteria:Long term survival prospects of coral reef
Direct current links with neighboring reefs and the strong likelihood
communities in the face of climate-related bleaching can be enhanced
that a proportion of the propagules will eff ectively seed other areas
by the presence of any of the following environmental factors acting
Replication of sites along prevailing currents to insure against the
together or in isolation.
risk of no meaningful recovery after a large-scale event eliminates
essentially all corals and/or other taxa.
Resistance to coral bleaching as manifested by the reliable presence
Factors that prepare the substrate for successful coral larval
of one or more of the following factors that are not shut down during
recruitment
bleaching events:
Diversity and abundance of diff erent coral reef taxa, especially high
Factors that promote water mixing
herbivore densities, and representative community structure.
Proximity to deep water and regular exchange with cooler oceanic
Low abundance of coral feeders, bioeroders and disease.
water
Good potential for recovery because eff ective management regime
Localised upwelling of cool water
in place.
Permanent strong currents (tidal, ocean, eddies, gyres)
Resilience of mangroves to sea level rise as manifested by extensive
Factors that screen corals from damaging radiation
salt fl ats along the inland border of the mangrove and onto which
Deep shade from high land profi le
the trees can expand as sea level rises.
Shading of some coral assemblages by complex reef structure,
multilayered coral communities, or steep slopes
Design principles for coral reef marine protected
Orientation relative to the sun (north facing slopes in northern
areas
hemisphere, south facing in southern hemisphere)
This section is intended to help coral reef MPA planners and managers
Presence of consistently turbid water
to select reef components for protection and draw protected area
Factors that indicate potential pre-adaptation to temperature and
boundaries.
other stresses
Frequent exposure of corals at low tides
Design principles
Highly variable seawater temperature regime (pond eff ect in
Resistance to bleaching (coral colonies don't bleach or bleach but don't
shallow back-reef lagoons)
die) may vary among diff erent parts of a reef. Reef communities with high
History of corals surviving climate related bleaching events
resistance to bleaching should be aff orded highest levels of protection
High diversity and abundance of coral reef species
and should be buff ered within larger management areas. These resistant
Wide range of coral colony size and diversity in diff erent reef zones,
communities play a critical role in reef survival by providing the larvae to
including centuries old colonies
recruit to and enable recovery of aff ected (Salm et al. 2001, West 2001).
ANNEXES
135
Resilience to bleaching (coral colonies bleach and partially or entirely
include multiple samples of protected resistant and resilient coral reef
die but the coral community recovers rapidly to its former state) also
communities.
varies among diff erent parts of a reef and among diff erent reefs in the
same complex. Reefs or their components that demonstrate resilience
Coral reef users, like traditional fi shers, dive operators, and other user
to bleaching need to be included in zones of high levels of protection
groups, should be assisted to understand the principles of coral
and should be managed to maintain conditions that facilitate successful
resistance and resilience to bleaching and should participate early
coral recruitment and recovery. These resilient areas may support
in coral reef MPA selection and design. This will help to ensure clear
diff erent and complementary elements of biodiversity and will likely
understanding of the concept of reef survivability, strong grassroots
play important roles in conservation.
support for conservation at the site, and eff ective partnership in
management where appropriate.
Connectivity within reefs is an important determinant of MPA zone and
boundary locations. Strict protection zones that include areas of high
Design process
resistance to bleaching should be positioned upcurrent of sites with
Site conservation planning is well designed for localized threat abatement
lower resistance to facilitate their recovery by larval recruitment.
and may even help to anticipate some potential stresses linked to
distant sources (like sedimentation from a proposed development
Connectivity among reefs is an important determinant of MPA network
linked to deforestation in a watershed, as one example). However, "site"
design. A network of MPAs linked by prevailing currents to each other
conservation planning is linked through its title and intent to a "site:"
will facilitate the recovery of damaged areas and the maintenance of
targets at the site, stresses at the site, sources linked to those stresses
biodiversity through larval exchange.
at the site, and management strategies for their control or abatement.
Global, largely unmanageable stresses do not fi t easily into this approach
The reef ecosystem extends beyond its physical boundary to include
and are better addressed through strategies for mitigation.
the neighboring habitats with which it interacts, especially seagrass
beds and back-reef lagoons, which provide important fi sh nurseries.
We can go about this mitigation process by doing what we should
All these linked habitats need to be considered and managed as parts
always do for MPA management planning in coral reef areas through
of a single functional unit.
the threat abatement process, but would add an extra dimension
planning for survivability in the face of emerging threats. We would start
Coral reefs are linked intimately by dynamic processes (currents, rivers,
by identifying areas with resistance to bleaching and would give these
and species movements) to distant areas and may be infl uenced by
high levels of protection along with the more usual range of critical
the activities there. These activities require some form of control if reef
habitats like spawning aggregations, nesting islands (for seabirds),
communities in a protected area are to survive.
beaches (for turtles), nurseries (for fi shes), and so on. Also, to enhance
the recovery of areas aff ected by bleaching, we should position resistant
At a critical minimum reef size, the diversity of coral, and presumably of
sites upcurrent of both resilient areas and others that succumb to
other reef organisms, begins to decrease (Salm 1984). The core area of
bleaching and die. By reducing or eliminating threats in areas prone to
a protected coral reef, including its component resistant and resilient
bleaching, we can provide conditions favoring larval recruitment and
communities, should be as large as possible to preserve high diversity
recovery of coral communities.
of reef biota. Based on the results of the only study of its kind, the
critical minimum size for resilient coral reef communities to enable
In addition, we need to establish ecologically sound boundaries for
them to be self-replenishing for all corals is estimated as 450 hectares
MPAs and their included zones. To determine these boundaries, we
(Salm 1984). However, it is feasible that clusters of smaller and highly
need to answer two basic questions (Salm et al. 2000): which habitats
interconnected areas may serve the same purpose. The minimum size
should be included in the MPA and its component zones of diff erent
for MPAs will need to be much larger to sustain viable populations of
uses and management focus and how large should the MPA and each
large predatory fi shes.
of its zones be?
Replication of protected resistant and resilient coral communities at
Which habitats?
multiple sites increases the probability that some will survive bleaching
To help preserve the full range of coral reef biodiversity, a MPA should
to help the recovery of aff ected areas. MPAs should be designed to
contain many diff erent reef zones and habitats for a steady and varied
136
GIWA REGIONAL ASSESSMENT 57 INDONESIAN SEAS
supply of larvae to replenish naturally damaged areas and to replace
They are also important nurseries for fi shes. Corals in naturally turbid
dead or emigrated organisms. These habitats should span a broad
deeper lagoons also show higher resistance to bleaching than the same
range of depths, exposures to prevailing winds and currents, and
species in clear waters over barrier reefs.
distances from shore. This is particularly important to ensure that some
coral communities survive bleaching and provide a source of larvae to
Seagrass beds and sand fl ats. Seagrass beds and sand fl ats surrounding
settle and help reestablish portions of the reefs that die off .
coral reefs are important feeding grounds for nocturnal feeding fi shes,
such as snappers and grunts, which shelter on reefs by day. When they
In practice, three categories of habitats should be considered for
return to the reef, these fi shes deposit nutrients in the form of feces that
inclusion in coral reef MPAs: coral habitats, contiguous habitats (i.e.,
are introduced to the reef food web and contribute to the growth and
submerged, intertidal, or above water), and distant linked habitats.
recovery of reef communities.
Although the latter two categories may not be physically part of the
reef community, they are linked closely through function.
Mangroves. The generally turbid waters and shading eff ect of
mangroves may also reduce the susceptibility of corals there to
Coral habitats
bleaching. Mangroves also provide nurseries for juveniles of certain
Diff erent reef types, depths and zones within reefs are characterised
reef fi shes (e.g., butterfl yfi shes, parrotfi shes, and snappers). Where
by diff erent coral communities and diff erent responses to temperature
they are close enough to reefs, mangroves provide feeding grounds
stress and bleaching. There are corals in shallow lagoons, reef fl ats and
to fi shes that shelter on the reefs. They also introduce fi xed nitrogen
reef crests, and others that are found down the reef slope, some of which
and organic detritus into the trophic system of reefs, as do reef fl ats
only occur deeper than about 20 meters. Dominant corals and coral
and seagrass beds.
diversity diff er in each assemblage; for example, sheltered reefs may have
dense overlapping colonies of staghorn coral (Acropora) or large whorls
Beaches and dunes. Coastlines are dynamic zones. Disturbances to them
of leafy corals (Montipora, Pachyseris, Echinopora) that are scenic, but
may cause beach erosion and alteration of the natural cycle of accretion
have few species. Such reefs may be valuable for tourism, but are less so
and erosion of sand along the shore, increase turbidity of inshore waters,
for conserving a representative range of biodiversity. They also tend to
or even smother living reefs with excessive sediment. This is especially
bleach readily and die. It is important to identify all reef types and, as far
true of sand cays, which have been known to move across reefs and
as possible, the diff erent coral communities within them, and to include
smother corals.
multiple examples of each in the protected area where possible.
Linked habitats
Contiguous habitats
Sources of stress to coral communities that are not easily identifi ed
Examples of the following habitats should be deliberately identifi ed and
discernible may be diffi
cult to control, such as deforestation and
protected within MPA boundaries.
development in a watershed. While watersheds are not obvious or
easy candidates to include in coral reef MPAs, they may be connected
Reef fl ats. Corals on reef fl ats and upper reef crests that are exposed at
to reefs by streams and coastal currents and damaging activities there
low tides often exhibit high levels of resistance to bleaching and will
will need to be controlled by a reefs to ridges approach to MPA planning
be important providers of larvae that may settle in dead areas and aid
or complementary coastal zone management approaches.
their recovery. Also, these reef fl ats often provide vital nurseries for reef
fi shes that will move onto the reef and help reestablish communities
How large?
aff ected by bleaching. Nitrogen and organic material produced on the
In theory, we know that we could help prevent loss of species within an
reef fl ats or transported from there in the form of feces of herbivorous
MPA if we maintained a balance between the rate of species loss and
fi shes and other organisms all contribute valuable nutrients to the reef
the immigration rate of replacement species. If the balance is tipped in
community and aid in its functioning and recovery.
favor of extinction by damage and death of corals on the target and
up-current source reefs, the protected area will lose species. There are
Back-reef lagoons. Coral assemblages in back-reef lagoons, especially
many natural stresses such as tropical storms, from which reefs recover
shallow lagoons behind fringing reefs, are routinely exposed to wide
naturally with time. Human activities increase the burden of stress
temperature fl uctuations (pond eff ect) and consequently may exhibit
and may prevent normal recovery by increasing the extinction rate
some acclimatisation to temperature stress and resistance to bleaching.
or decreasing the immigration rate. Coral bleaching has increased the
ANNEXES
137
stakes it challenges us to take immediate action based on our best
to fi sheries, preserving biological diversity, or protecting endangered
information and to refi ne our management focus as the science and
species or the breeding stock of other valuable species. But primary
experience improve. In the meantime, we need to take a precautionary
importance should be given to survivability and the subsidiary
approach and create larger more viable MPAs to safeguard our global
objectives worked into this. Objectives are the basis of design, so take
coral reef biodiversity and resources.
care to defi ne and obtain wide consensus on these and to include
survivability among them.
To maintain the balance between immigration and extinction rates we
need to ensure a steady source of recruits (eggs, larvae, and juveniles)
Management guidelines for coral reef protected
to replenish stressed areas. Large reefs may be self-replenishing. They
areas
manage to achieve this because their large size allows portions of
This section is intended to assist coral reef MPA managers develop and
damaged reefs to be replenished by recruits from undamaged parts of
implement a series of management actions that focus on enhancing
the same reef. Such large reefs are mosaics of communities in diff erent
coral reef survivability in the face of climate-related coral bleaching and
stages of recovery and development.
mortality. As there will be much overlap between management of reefs
for survival from bleaching and from other factors, the following actions
On balance, fewer large coral reef MPAs are to be favored over a greater
are intended to supplement, not replace, the usual suite of coral reef
number of smaller ones. However, there could be distinct advantages of
management activities that managers would implement in MPAs.
having clusters of small, strictly protected areas established to protect
pockets of high resistance and resilience to bleaching (and other
It is more usual for management actions in MPAs to be defi ned by
valuable assets, such as fi sh spawning aggregation sites), if these are
a site conservation planning approach that leads through problem
embedded in a larger management area.
identifi cation to threat abatement: specifi c (usually immediately
obvious) impacts on the conservation targets are identifi ed and
The optimal size of a coral reef MPA is designed around a strictly
management actions identifi ed to resolve these at the MPA site.
protected zone or core or collection of these, each of which
The focus of such an approach on coral reefs generally would be to
encompasses suffi
cient target coral area to be self-replenishing for
identify areas of dead or damaged reef or depleted species, determine
all species. This focus on replenishment is particularly important if
the causes of the damage or depletion and their sources, and design a
preserving biological diversity is the principal management objective,
course of action to address these sources of impact. For example, coral
but may seem less important for other objectives - for example,
breakage might be the consequence of anchors (the cause) associated
maintaining the area's value for recreation, tourism, research, education,
with the tourism industry (the source). The remedial management
and spawning of specifi c fi shes. However, coral bleaching has shown
measures might call for placement of moorings, reef closures to
us that replenishment is an important consideration for reef survival,
facilitate recovery, and a range of regulations and awareness materials
irrespective of the management objective. Bleaching shows no regard
to support these actions.
for MPA zones, boundaries, regulations, or management eff orts, unless
these are designed to meet the survivability requirements.
In another example, reduced grouper populations may be the result of
fi shing of spawning aggregations (the cause) to supply the live reef food
Determining the critical minimum size of coral reef communities for these
fi sh industry (the source). This could require protection measures at the
to be self-replenishing is still very imprecise science. However, if urgency
spawning aggregation sites linked to local and national level government
or lack of funds and suitable personnel prevent studies from beginning
regulations and international codes of conduct and tracking to monitor
immediately, core areas should include about 450 ha of bleaching
the trade. These are admittedly simplifi ed examples, but are included to
resistant coral areas, if possible, until the estimate can be verifi ed by
make the point that management in both cases is linked directly to site-
studies (Salm 1984, Salm et al. 2000). Also, the core should be expanded
based threat abatement, which is our usual practice.
so that it encompasses as diverse as possible a range of reef habitats. A
single reef is preferable, but a cluster of small reefs will probably be equally
In addition to the basic elements of design introduced above, managers
eff ective when these are managed as an integrated unit.
can take some specifi c actions to help strengthen the resilience of the
coral communities in MPAs by helping to (a) ensure the survival of
The design team should choose carefully from the many objectives for
bleaching resistant coral communities, and (b) enhance recovery of
protecting coral reefs - providing for recreational activities, contributing
bleaching susceptible ones.
138
GIWA REGIONAL ASSESSMENT 57 INDONESIAN SEAS
The following recommended actions contain some direct management
certain potentially damaging activities after a bleaching event to
interventions that may be controversial in some cases because they
enable rapid recovery.
require manipulation of natural systems. Managers should use their own
judgement in deciding what they can and cannot do as guided by their
Enhancing recovery
organisational policies.
Conduct regular surveys for coral predators such as predatory
molluscs (e.g., Drupella) and echinoderms (e.g., Acanthaster)
Protecting bleaching resistant communities
and remove these on sight from the strictly protected bleaching
Survey MPAs and their adjacent areas for the presence of
resistant zones and adjacent, managed, susceptible areas.
environmental factors that cause bleaching resistance and identify
Implement regular surveys of sea urchins, such as Diadema, which
coral communities protected by them (see Survivability Criteria).
can occur in large infestations and inhibit growth of coral recruits.
For resistant coral communities inside established MPAs, consider
Control harvest of herbivorous fi shes in recovery sites to enable
securing high levels of protection for them by revision of zone
them to graze down algae that overgrow and exclude coral recruits
boundaries or establishment of special zones to encompass these
from establishing themselves.
sites.
For resistant coral communities outside established MPAs, consider
extending MPA boundaries to incorporate these sites if feasible or
References
the creation of new MPAs to include them.
Brown, B.E. 1997. Coral Bleaching: Causes and consequences. Coral
Reefs, 16 Suppl.: S129-S138.
Tracking bleaching
Buddemeier, R.W. 1993. Corals, climate and conservation. Proc. 7th Inter.
Revise monitoring programmes or design new ones to enable
Coral Reef Symp., 1: 3-10.
recording of the response to bleaching events of as great as
Done, T. 2001. Scientifi c Principles for Establishing MPAs to Alleviate
possible a selection of diff erent coral communities.
Coral Bleaching and Promote Recovery. Pp. XX-XX in R.V. Salm and
Track the bleaching widely throughout the MPA to identify areas
S.L. Coles (eds). Op cit.
that either do not bleach or do bleach, but suff er minimal mortality
Glynn, P.W. 1996. Coral Reef Bleaching: facts, hypotheses and
these are the resistant sites that should be strictly protected.
implications. Global Change Biology, 2: 495-509.
Goreau, T.J., McClanahan, T., Hayes, R., and Strong, A.E. 2000.
Preventing damage
Conservation of Coral Reefs after the 1998 global bleaching event.
Prohibit all forms of extractive use (other than specifi c management
Conservation Biology, 14: 5-15.
related removal of damaging species) in the protected, bleaching
Hoegh-Guldberg, O. 1999. Climate change, coral bleaching and the
resistant sites.
future of the world's coral reefs. Marine and Freshwater Research,
Control visitor access to protected, bleaching resistant sites through
50: 839-866.
either total exclusion or carefully controlled access.
Hoegh-Guldberg, O., and Jones, R. 1999. Photo-inhibition and
photoprotection in symbiotic dinofl agellates from reef-building
For carefully controlled access to bleaching resistant sites in MPAs:
corals. Marine Ecology Progress Series, 183: 73-86.
Prohibit anchoring, install moorings, and require boats to attach to
Salm, R.V. 1984. Ecological boundaries for coral reef reserves: Principles
these;
and guidelines. Environ. Conserv. 11(1): 7-13.
In channels through reefs and along walls, consider permitting drift
Salm, R.V. 2002. Preparing Marine Protected Areas to Survive Global
diving as a means to avoid contact with corals;
Change. Additional Guidelines to Address Coral Bleaching. IUCN-
Control numbers of visitors and link access to payment of premium
WCPA website adress
access fees to help compensate for the higher management cost of
Salm R.V., Clarke J.R., and E. Siirila. 2000. Marine and Coastal Protected
these areas;
Areas: A Guide for Planners and Managers. IUCN. Washington DC,
Require accreditation of operators before issuing them special
USA: 371 pp.
licenses to access resistant sites;
Salm, R.V. and S.L. Coles (eds). 2001. Coral Bleaching and Marine
Implement regular monitoring for visitor damage and close down
Protected Areas. Proceedings of the Workshop on Mitigating Coral
access for two-year recovery period if damage is detected.
Bleaching Impact Through MPA Design, Bishop Museum, Honolulu,
For bleaching susceptible sites, consider closure or exclusion of
Hawaii, 29-31 May 2001. Asia Pacifi c Coastal Marine Program Report
ANNEXES
139
# 0102, The Nature Conservancy, Honolulu, Hawaii, U.S.A: 118 pp.
(document available from: www.conserveonline.org)
Salm, R.V., S.E. Smith and G Llewellyn. 2001. Mitigating the impact of
coral bleaching through marine protected area design. Pp. 81-88
in Schuttenberg, H.Z. (ed.). Coral Bleaching: Causes, Consequences
and Response. Selected papers presented at the 9th International
Coral Reef Symposium on "Coral Bleaching: Assessing and Linking
Ecological and Socioeconomic Impacts, Future Trends and
Mitigation Planning." Coastal Management Report #2230, Coastal
Resources Center, University of Rhode Island: 102 pp.
West, J.M. 2001. Environmental Determinants of Resistance to Coral
Bleaching: Implications for Management of Marine Protected Areas.
Pp. 40-52 in R.V. Salm and S.L. Coles (eds). Op. cit.
Westmacott, S., Teleki, K., Wells, S., and West, J. 2000. Management
of bleached and severely damaged coral reefs. IUCN, Gland,
Switzerland: 36 pp.
Wilkinson, C.R. 1996. Global change and coral reefs: impacts on reefs
economics and human cultures. Global Change Bioogy 2: 547-
558.
Wilkinson, C.R. 1999. Global and local threats to coral reef functioning
and existence: review and predictions. Marine and Freshwater
Research, 50: 867-878.
Wilkinson, C. (ed.). 2000. Status of Coral Reefs of the World: 2000.
Australian Institute of Marine Science, Queensland, Australia: 363
pp.
140
GIWA REGIONAL ASSESSMENT 57 INDONESIAN SEAS
The Global International
Waters Assessment
This report presents the results of the Global International Waters
Adequately managing the world's aquatic resources for the benefi t of
Assessment (GIWA) of the transboundary waters of the Indonesian
all is, for a variety of reasons, a very complex task. The liquid state of
Seas. This and the subsequent chapter off er a background that
the most of the world's water means that, without the construction
describes the impetus behind the establishment of GIWA, its
of reservoirs, dams and canals it is free to fl ow wherever the laws of
objectives and how the GIWA was implemented.
nature dictate. Water is, therefore, a vector transporting not only a
wide variety of valuable resources but also problems from one area
to another. The effl
uents emanating from environmentally destructive
activities in upstream drainage areas are propagated downstream
The need for a global
and can aff ect other areas considerable distances away. In the case of
international waters
transboundary river basins, such as the Nile, Amazon and Niger, the
assessment
impacts are transported across national borders and can be observed
in the numerous countries situated within their catchments. In the case
of large oceanic currents, the impacts can even be propagated between
Globally, people are becoming increasingly aware of the degradation of
continents (AMAP 1998). Therefore, the inextricable linkages within
the world's water bodies. Disasters from fl oods and droughts, frequently
and between both freshwater and marine environments dictates that
reported in the media, are considered to be linked with ongoing global
management of aquatic resources ought to be implemented through
climate change (IPCC 2001), accidents involving large ships pollute public
a drainage basin approach.
beaches and threaten marine life and almost every commercial fi sh stock
is exploited beyond sustainable limits - it is estimated that the global
In addition, there is growing appreciation of the incongruence
stocks of large predatory fi sh have declined to less that 10% of pre-
between the transboundary nature of many aquatic resources and the
industrial fi shing levels (Myers & Worm 2003). Further, more than 1 billion
traditional introspective nationally focused approaches to managing
people worldwide lack access to safe drinking water and 2 billion people
those resources. Water, unlike laws and management plans, does not
lack proper sanitation which causes approximately 4 billion cases of
respect national borders and, as a consequence, if future management
diarrhoea each year and results in the death of 2.2 million people, mostly
of water and aquatic resources is to be successful, then a shift in focus
children younger than fi ve (WHO-UNICEF 2002). Moreover, freshwater
towards international cooperation and intergovernmental agreements
and marine habitats are destroyed by infrastructure developments,
is required (UN 1972). Furthermore, the complexity of managing the
dams, roads, ports and human settlements (Brinson & Malvárez 2002,
world's water resources is exacerbated by the dependence of a great
Kennish 2002). As a consequence, there is growing public concern
variety of domestic and industrial activities on those resources. As a
regarding the declining quality and quantity of the world's aquatic
consequence, cross-sectoral multidisciplinary approaches that integrate
resources because of human activities, which has resulted in mounting
environmental, socio-economic and development aspects into
pressure on governments and decision makers to institute new and
management must be adopted. Unfortunately however, the scientifi c
innovative policies to manage those resources in a sustainable way
information or capacity within each discipline is often not available or
ensuring their availability for future generations.
is inadequately translated for use by managers, decision makers and
GLOBAL INTERNATIONAL WATERS ASSESSMENT
i
policy developers. These inadequacies constitute a serious impediment
The Global Environment Facility (GEF)
to the implementation of urgently needed innovative policies.
The Global Environment Facility forges international co-operation and fi nances actions to address
six critical threats to the global environment: biodiversity loss, climate change, degradation of
international waters, ozone depletion, land degradation, and persistent organic pollutants (POPs).
Continual assessment of the prevailing and future threats to aquatic
The overall strategic thrust of GEF-funded international waters activities is to meet the incremental
ecosystems and their implications for human populations is essential if
costs of: (a) assisting groups of countries to better understand the environmental concerns of
their international waters and work collaboratively to address them; (b) building the capacity
governments and decision makers are going to be able to make strategic
of existing institutions to utilise a more comprehensive approach for addressing transboundary
policy and management decisions that promote the sustainable use of
water-related environmental concerns; and (c) implementing measures that address the priority
transboundary environmental concerns. The goal is to assist countries to utilise the full range of
those resources and respond to the growing concerns of the general
technical, economic, fi nancial, regulatory, and institutional measures needed to operationalise
public. Although many assessments of aquatic resources are being
sustainable development strategies for international waters.
conducted by local, national, regional and international bodies, past
United Nations Environment Programme (UNEP)
assessments have often concentrated on specifi c themes, such as
United Nations Environment Programme, established in 1972, is the voice for the environment
biodiversity or persistent toxic substances, or have focused only on
within the United Nations system. The mission of UNEP is to provide leadership and encourage
partnership in caring for the environment by inspiring, informing, and enabling nations and
marine or freshwaters. A globally coherent, drainage basin based
peoples to improve their quality of life without compromising that of future generations.
assessment that embraces the inextricable links between transboundary
UNEP work encompasses:
freshwater and marine systems, and between environmental and
Assessing global, regional and national environmental conditions and trends;
Developing international and national environmental instruments;
societal issues, has never been conducted previously.
Strengthening institutions for the wise management of the environment;
Facilitating the transfer of knowledge and technology for sustainable development;
Encouraging new partnerships and mind-sets within civil society and the private sector.
International call for action
University of Kalmar
University of Kalmar hosts the GIWA Co-ordination Offi ce and provides scientifi c advice and
administrative and technical assistance to GIWA. University of Kalmar is situated on the coast of
The need for a holistic assessment of transboundary waters in order to
the Baltic Sea. The city has a long tradition of higher education; teachers and marine offi cers have
been educated in Kalmar since the middle of the 19th century. Today, natural science is a priority
respond to growing public concerns and provide advice to governments
area which gives Kalmar a unique educational and research profi le compared with other smaller
universities in Sweden. Of particular relevance for GIWA is the established research in aquatic and
and decision makers regarding the management of aquatic resources
environmental science. Issues linked to the concept of sustainable development are implemented
was recognised by several international bodies focusing on the global
by the research programme Natural Resources Management and Agenda 21 Research School.
environment. In particular, the Global Environment Facility (GEF)
Since its establishment GIWA has grown to become an integral part of University activities.
The GIWA Co-ordination offi ce and GIWA Core team are located at the Kalmarsund Laboratory, the
observed that the International Waters (IW) component of the GEF
university centre for water-related research. Senior scientists appointed by the University are actively
suff ered from the lack of a global assessment which made it diffi
cult
involved in the GIWA peer-review and steering groups. As a result of the cooperation the University
can offer courses and seminars related to GIWA objectives and international water issues.
to prioritise international water projects, particularly considering
the inadequate understanding of the nature and root causes of
environmental problems. In 1996, at its fourth meeting in Nairobi, the
causes of degradation of the transboundary aquatic environment and
GEF Scientifi c and Technical Advisory Panel (STAP), noted that: "Lack of
options for addressing them. These pro cesses led to the development
an International Waters Assessment comparable with that of the IPCC, the
of the Global International Waters Assessment (GIWA) that would be
Global Biodiversity Assessment, and the Stratospheric Ozone Assessment,
implemented by the United Nations Environment Programme (UNEP) in
was a unique and serious impediment to the implementation of the
conjunction with the University of Kalmar, Sweden, on behalf of the GEF.
International Waters Component of the GEF".
The GIWA was inaugurated in Kalmar in October 1999 by the Executive
Director of UNEP, Dr. Klaus Töpfer, and the late Swedish Minister of the
The urgent need for an assessment of the causes of environmental
Environment, Kjell Larsson. On this occasion Dr. Töpfer stated: "GIWA
degradation was also highlighted at the UN Special Session on
is the framework of UNEP´s global water assessment strategy and will
the Environment (UNGASS) in 1997, where commitments were
enable us to record and report on critical water resources for the planet for
made regarding the work of the UN Commission on Sustainable
consideration of sustainable development management practices as part of
Development (UNCSD) on freshwater in 1998 and seas in 1999. Also in
our responsibilities under Agenda 21 agreements of the Rio conference".
1997, two international Declarations, the Potomac Declaration: Towards
enhanced ocean security into the third millennium, and the Stockholm
The importance of the GIWA has been further underpinned by the UN
Statement on inter action of land activities, freshwater and enclosed
Millennium Development Goals adopted by the UN General Assembly
seas, specifi cally emphasised the need for an investigation of the root
in 2000 and the Declaration from the World Summit on Sustainable
ii
REGIONAL ASSESSMENTS
Development in 2002. The development goals aimed to halve the
International waters and transboundary issues
proportion of people without access to safe drinking water and basic
The term "international waters", as used for the purposes of the GEF Operational Strategy,
sanitation by the year 2015 (United Nations Millennium Declaration
includes the oceans, large marine ecosystems, enclosed or semi-enclosed seas and estuaries, as
well as rivers, lakes, groundwater systems, and wetlands with transboundary drainage basins
2000). The WSSD also calls for integrated management of land, water and
or common borders. The water-related ecosystems associated with these waters are considered
living resources (WSSD 2002) and, by 2010, the Reykjavik Declaration on
integral parts of the systems.
The term "transboundary issues" is used to describe the threats to the aquatic environment
Responsible Fisheries in the Marine Ecosystem should be implemented
linked to globalisation, international trade, demographic changes and technological advancement,
by all countries that are party to the declaration (FAO 2001).
threats that are additional to those created through transboundary movement of water. Single
country policies and actions are inadequate in order to cope with these challenges and this makes
them transboundary in nature.
The international waters area includes numerous international conventions, treaties, and
agreements. The architecture of marine agreements is especially complex, and a large number
The conceptual framework
of bilateral and multilateral agreements exist for transboundary freshwater basins. Related
conventions and agreements in other areas increase the complexity. These initiatives provide
and objectives
a new opportunity for cooperating nations to link many different programmes and instruments
into regional comprehensive approaches to address international waters.
Considering the general decline in the condition of the world's aquatic
the large-scale deforestation of mangroves for ponds (Primavera 1997).
resources and the internationally recognised need for a globally
Within the GIWA, these "non-hydrological" factors constitute as large
coherent assessment of transboundary waters, the primary objectives
a transboundary infl uence as more traditionally recognised problems,
of the GIWA are:
such as the construction of dams that regulate the fl ow of water into
To provide a prioritising mechanism that allows the GEF to focus
a neighbouring country, and are considered equally important. In
their resources so that they are used in the most cost eff ective
addition, the GIWA recognises the importance of hydrological units that
manner to achieve signifi cant environmental benefi ts, at national,
would not normally be considered transboundary but exert a signifi cant
regional and global levels; and
infl uence on transboundary waters, such as the Yangtze River in China
To highlight areas in which governments can develop and
which discharges into the East China Sea (Daoji & Daler 2004) and the
implement strategic policies to reduce environmental degradation
Volga River in Russia which is largely responsible for the condition of
and improve the management of aquatic resources.
the Caspian Sea (Barannik et al. 2004). Furthermore, the GIWA is a truly
regional assessment that has incorporated data from a wide range of
In order to meet these objectives and address some of the current
sources and included expert knowledge and information from a wide
inadequacies in international aquatic resources management, the GIWA
range of sectors and from each country in the region. Therefore, the
has incorporated four essential elements into its design:
transboundary concept adopted by the GIWA extends to include
A broad transboundary approach that generates a truly regional
impacts caused by globalisation, international trade, demographic
perspective through the incorporation of expertise and existing
changes and technological advances and recognises the need for
information from all nations in the region and the assessment of
international cooperation to address them.
all factors that infl uence the aquatic resources of the region;
A drainage basin approach integrating freshwater and marine
systems;
A multidisciplinary approach integrating environmental and socio-
The organisational structure and
economic information and expertise; and
implementation of the GIWA
A coherent assessment that enables global comparison of the
results.
The scale of the assessment
Initially, the scope of the GIWA was confi ned to transboundary waters
The GIWA builds on previous assessments implemented within the GEF
in areas that included countries eligible to receive funds from the GEF.
International Waters portfolio but has developed and adopted a broader
However, it was recognised that a truly global perspective would only
defi nition of transboundary waters to include factors that infl uence the
be achieved if industrialised, GEF-ineligible regions of the world were
quality and quantity of global aquatic resources. For example, due to
also assessed. Financial resources to assess the GEF-eligible countries
globalisation and international trade, the market for penaeid shrimps
were obtained primarily from the GEF (68%), the Swedish International
has widened and the prices soared. This, in turn, has encouraged
Development Cooperation Agency (Sida) (18%), and the Finnish
entrepreneurs in South East Asia to expand aquaculture resulting in
Department for International Development Cooperation (FINNIDA)
GLOBAL INTERNATIONAL WATERS ASSESSMENT
iii
1
15
11
16
14
12
28
10
13
17
25
29
9
18
30
19
23
22
8
7
31
6
20
24
26
35
33
2
34
27
5
21
50
32
51
36
37
41
52
4
49
53
43
65
55
48
54
3
42
56
46
62
47
40b
40a
57
62
45b
39
59
45a
58
60
64
44
61
38
63
66
1 Arctic
12 Norwegian
Sea
(LME)
24 Aral
Sea
36 East-China
Sea
(LME)
46
Somali Coastal Current (LME)
58
North Australian Shelf (LME)
2
Gulf of Mexico (LME)
13 Faroe
plateau
25
Gulf of Alaska (LME)
37
Hawaiian Archipelago (LME)
47
East African Rift Valley Lakes
59 Coral
Sea
Basin
3
Caribbean Sea (LME)
14
Iceland Shelf (LME)
26 California
Current
(LME)
38
Patagonian Shelf (LME)
48
Gulf of Aden
60
Great Barrier Reef (LME)
4 Caribbean
Islands
15 East
Greenland
Shelf
(LME)
27
Gulf of California (LME)
39
Brazil Current (LME)
49 Red
Sea
(LME)
61 Great
Australian
Bight
5
Southeast Shelf (LME)
16
West Greenland Shelf (LME)
28
East Bering Sea (LME)
40a Brazilian Northeast (LME)
50 The
Gulf
62
Small Island States
6
Northeast Shelf (LME)
17 Baltic
Sea
(LME)
29
West Bering Sea (LME)
40b Amazon
51 Jordan
63 Tasman
Sea
7
Scotian Shelf (LME)
18 North
Sea
(LME)
30
Sea of Okhotsk (LME)
41
Canary Current (LME)
52 Arabian
Sea
(LME)
64 Humboldt
Current
(LME)
8
Gulf of St Lawrence
19
Celtic-Biscay Shelf (LME)
31
Oyashio Current (LME)
42
Guinea Current (LME)
53
Bay of Bengal S.E.
65 Eastern
Equatorial
Pacific
9
Newfoundland Shelf (LME)
20 Iberian
Coastal
(LME)
32 Kuroshio
Current
(LME)
43 Lake
Chad
54 South
China
Sea
(LME)
66 Antarctic
(LME)
10
Baffin Bay, Labrador Sea,
21 Mediterranean
Sea
(LME)
33
Sea of Japan/East Sea (LME)
44
Benguela Current (LME)
55 Mekong
River
Canadian Archipelago
22 Black
Sea
(LME)
34 Yellow
Sea
(LME)
45a Agulhas Current (LME)
56 Sulu-Celebes
Sea
(LME)
11 Barents
Sea
(LME)
23 Caspian
Sea
35 Bohai
Sea
45b Indian Ocean Islands
57 Indonesian
Seas
(LME)
Figure 1
The 66 transboundary regions assessed within the GIWA project.
(10%). Other contributions were made by Kalmar Municipality, the
Considering the objectives of the GIWA and the elements incorporated
University of Kalmar and the Norwegian Government. The assessment of
into its design, a new methodology for the implementation of the
regions ineligible for GEF funds was conducted by various international
assessment was developed during the initial phase of the project. The
and national organisations as in-kind contributions to the GIWA.
methodology focuses on fi ve major environmental concerns which
constitute the foundation of the GIWA assessment; Freshwater shortage,
In order to be consistent with the transboundary nature of many of the
Pollution, Habitat and community modifi cation, Overexploitation of fi sh
world's aquatic resources and the focus of the GIWA, the geographical
and other living resources, and Global change. The GIWA methodology
units being assessed have been designed according to the watersheds
is outlined in the following chapter.
of discrete hydrographic systems rather than political borders (Figure 1).
The geographic units of the assessment were determined during the
The global network
preparatory phase of the project and resulted in the division of the
In each of the 66 regions, the assessment is conducted by a team of
world into 66 regions defi ned by the entire area of one or more
local experts that is headed by a Focal Point (Figure 2). The Focal Point
catchments areas that drains into a single designated marine system.
can be an individual, institution or organisation that has been selected
These marine systems often correspond to Large Marine Ecosystems
on the basis of their scientifi c reputation and experience implementing
(LMEs) (Sherman 1994, IOC 2002).
international assessment projects. The Focal Point is responsible
for assembling members of the team and ensuring that it has the
Large Marine Ecocsystems (LMEs)
necessary expertise and experience in a variety of environmental
Large Marine Ecosystems (LMEs) are regions of ocean space encompassing coastal areas from river
and socio-economic disciplines to successfully conduct the regional
basins and estuaries to the seaward boundaries of continental shelves and the outer margin of the
major current systems. They are relatively large regions on the order of 200 000 km2 or greater,
assessment. The selection of team members is one of the most critical
characterised by distinct: (1) bathymetry, (2) hydrography, (3) productivity, and (4) trophically
elements for the success of GIWA and, in order to ensure that the
dependent populations.
most relevant information is incorporated into the assessment, team
The Large Marine Ecosystems strategy is a global effort for the assessment and management
of international coastal waters. It developed in direct response to a declaration at the 1992
members were selected from a wide variety of institutions such as
Rio Summit. As part of the strategy, the World Conservation Union (IUCN) and National Oceanic
and Atmospheric Administration (NOAA) have joined in an action program to assist developing
universities, research institutes, government agencies, and the private
countries in planning and implementing an ecosystem-based strategy that is focused on LMEs as
sector. In addition, in order to ensure that the assessment produces a
the principal assessment and management units for coastal ocean resources. The LME concept is
also adopted by GEF that recommends the use of LMEs and their contributing freshwater basins
truly regional perspective, the teams should include representatives
as the geographic area for integrating changes in sectoral economic activities.
from each country that shares the region.
iv
REGIONAL ASSESSMENTS
The GIWA is comprised of a logical sequence of four integrated
components. The fi rst stage of the GIWA is called Scaling and is a
Steering Group
process by which the geographic area examined in the assessment is
defi ned and all the transboundary waters within that area are identifi ed.
GIWA Partners
IGOs, NGOs,
Core
Thematic
Once the geographic scale of the assessment has been defi ned, the
Scientific institutions,
Team
Task Teams
private sector, etc
assessment teams conduct a process known as Scoping in which the
66 Regional
magnitude of environmental and associated socio-economic impacts
Focal Points
of Freshwater shortage, Pollution, Habitat and community modifi cation,
and Teams
Unsustainable exploitation of fi sh and other living resources, and Global
Figure 2
The organisation of the GIWA project.
change is assessed in order to identify and prioritise the concerns
that require the most urgent intervention. The assessment of these
predefi ned concerns incorporates the best available information and
In total, more than 1 000 experts have contributed to the implementation
the knowledge and experience of the multidisciplinary, multi-national
of the GIWA illustrating that the GIWA is a participatory exercise that
assessment teams formed in each region. Once the priority concerns
relies on regional expertise. This participatory approach is essential
have been identifi ed, the root causes of these concerns are identifi ed
because it instils a sense of local ownership of the project, which
during the third component of the GIWA, Causal chain analysis. The root
ensures the credibility of the fi ndings and moreover, it has created a
causes are determined through a sequential process that identifi es, in
global network of experts and institutions that can collaborate and
turn, the most signifi cant immediate causes followed by the economic
exchange experiences and expertise to help mitigate the continued
sectors that are primarily responsible for the immediate causes and
degradation of the world's aquatic resources.
fi nally, the societal root causes. At each stage in the Causal chain
analysis, the most signifi cant contributors are identifi ed through an
analysis of the best available information which is augmented by the
expertise of the assessment team. The fi nal component of the GIWA is
GIWA Regional reports
the development of Policy options that focus on mitigating the impacts
of the root causes identifi ed by the Causal chain analysis.
The GIWA was established in response to growing concern among the
general public regarding the quality of the world's aquatic resources
The results of the GIWA assessment in each region are reported in
and the recognition of governments and the international community
regional reports that are published by UNEP. These reports are designed
concerning the absence of a globally coherent international waters
to provide a brief physical and socio-economic description of the
assessment. However, because a holistic, region-by-region, assessment
most important features of the region against which the results of the
of the condition of the world's transboundary water resources had never
assessment can be cast. The remaining sections of the report present
been undertaken, a methodology guiding the implementation of such
the results of each stage of the assessment in an easily digestible form.
an assessment did not exist. Therefore, in order to implement the GIWA,
Each regional report is reviewed by at least two independent external
a new methodology that adopted a multidisciplinary, multi-sectoral,
reviewers in order to ensure the scientifi c validity and applicability of
multi-national approach was developed and is now available for the
each report. The 66 regional assessments of the GIWA will serve UNEP
implementation of future international assessments of aquatic resources.
as an essential complement to the UNEP Water Policy and Strategy and
UNEP's activities in the hydrosphere.
UNEP Water Policy and Strategy
The primary goals of the UNEP water policy and strategy are:
(a) Achieving greater global understanding of freshwater, coastal and marine environments by
Global International Waters Assessment
conducting environmental assessments in priority areas;
(b) Raising awareness of the importance and consequences of unsustainable water use;
(c) Supporting the efforts of Governments in the preparation and implementation of integrated
management of freshwater systems and their related coastal and marine environments;
(d) Providing support for the preparation of integrated management plans and programmes for
aquatic environmental hot spots, based on the assessment results;
(e) Promoting the application by stakeholders of precautionary, preventive and anticipatory
approaches.
GLOBAL INTERNATIONAL WATERS ASSESSMENT
v
References:
AMAP (1998). Assessment Report: Arctic Pollution Issues. Arctic
Monitoring and Assessment Programme (AMAP), Oslo, Norway.
Barannik, V., Borysova, O. and Stolberg, F. (2004). The Caspian Sea Region:
Environmental Change. Ambio, 33:45-51.
Brinson, M.M. and Malvárez, A.I. (2002). Temperate freshwater wetlands:
types, status, and threats. Environmental Conservation, 29:115-133.
Daoji, L. and Daler, D. (2004). Ocean Pollution from Land-based Sources:
East China Sea, China. Ambio, 33:98-106.
FAO (2001). Reykjavik conference on responsible fi sheries in the marine
ecosystem. Iceland, 1-4 October 2001.
IOC (2002). IOC-IUCN-NOAA Consultative Meeting on Large Marine
Ecosystems (LMEs). Fourth Session, 8-9 January 2002, Paris,
France.
IPCC (2001). Climate Change 2001: The Scientifi c Basis. Contribution
of Working Group I to the Third Assessment Report of the
Intergovernmental Panel on Climate Change. In: Houghton,
J.T., Ding, Y., Griggs, D.J., Noguer, M., van der Linden, P.J., Dai, X.,
Maskell, K. and Johnson, C.A. (eds). Cambridge University Press,
Cambridge, United Kingdom and New York, NY, USA.
Kennish, M.J. (2002). Environmental threats and environmental future of
estuaries. Environmental Conservation, 29:78-107.
Myers, R.A. and Worm, B. (2003). Rapid worldwide depletion of predatory
fi sh communities. Nature, 423:280-283.
Primavera, J.H. (1997) Socio-economic impacts of shrimp culture.
Aquaculture Research, 28:815-827.
Sherman, K. (1994). Sustainability, biomass yields, and health of coastal
ecosystems: an ecological perspective. Marine Ecology Progress
Series, 112:277-301.
United Nations conference on the human environment (1972). Report
available on-line at http://www.unep.org
United Nations Millennium Declaration (2000). The Millennium
Assembly of the United Nations, New York.
WHO-UNICEF (2002). Global Water Supply and Sanitation Assessment:
2000 Report.
WSSD (2002). World Summit on Sustainable Development.
Johannesburg Summit 2002. Key Outcomes of the Summit,
UN Department of Public Information, New York.
vi
REGIONAL ASSESSMENTS
The GIWA methodology
The specifi c objectives of the GIWA were to conduct a holistic and globally
The assessment integrates environmental and socio-economic data
comparable assessment of the world's transboundary aquatic resources
from each country in the region to determine the severity of the
that incorporated both environmental and socio-economic factors
impacts of each of the fi ve concerns and their constituent issues on
and recognised the inextricable links between freshwater and marine
the entire region. The integration of this information was facilitated by
environments, in order to enable the GEF to focus their resources and to
implementing the assessment during two participatory workshops
provide guidance and advice to governments and decision makers. The
that typically involved 10 to 15 environmental and socio-economic
coalition of all these elements into a single coherent methodology that
experts from each country in the region. During these workshops, the
produces an assessment that achieves each of these objectives had not
regional teams performed preliminary analyses based on the collective
previously been done and posed a signifi cant challenge.
knowledge and experience of these local experts. The results of these
analyses were substantiated with the best available information to be
The integration of each of these elements into the GIWA methodology
presented in a regional report.
was achieved through an iterative process guided by a specially
Table 1 Pre-defi ned GIWA concerns and their constituent issues
convened Methods task team that was comprised of a number of
addressed within the assessment.
international assessment and water experts. Before the fi nal version
of the methodology was adopted, preliminary versions underwent
Environmental issues
Major concerns
an extensive external peer review and were subjected to preliminary
1. Modification of stream flow
testing in selected regions. Advice obtained from the Methods task
2. Pollution of existing supplies
I Freshwater shortage
3. Changes in the water table
team and other international experts and the lessons learnt from
preliminary testing were incorporated into the fi nal version that was
4. Microbiological
5. Eutrophication
used to conduct each of the GIWA regional assessments.
6. Chemical
7. Suspended
solids
II Pollution
8. Solid
wastes
Considering the enormous diff erences between regions in terms of the
9. Thermal
10. Radionuclide
quality, quantity and availability of data, socio-economic setting and
11. Spills
environmental conditions, the achievement of global comparability
12. Loss of ecosystems
required an innovative approach. This was facilitated by focusing
III Habitat and community
13. Modification of ecosystems or ecotones, including community
modification
structure and/or species composition
the assessment on the impacts of fi ve pre-defi ned concerns namely;
Freshwater shortage, Pollution, Habitat and community modifi cation,
14. Overexploitation
15. Excessive by-catch and discards
IV Unsustainable
Unsustainable exploitation of fi sh and other living resources and Global
16. Destructive fishing practices
exploitation of fish and
change, in transboundary waters. Considering the diverse range of
17. Decreased viability of stock through pollution and disease
other living resources
18. Impact on biological and genetic diversity
elements encompassed by each concern, assessing the magnitude of
19. Changes in hydrological cycle
the impacts caused by these concerns was facilitated by evaluating the
20. Sea level change
V Global change
impacts of 22 specifi c issues that were grouped within these concerns
21. Increased uv-b radiation as a result of ozone depletion
22. Changes in ocean CO source/sink function
(see Table 1).
2
THE GIWA METHODOLOGY
vii

political boundaries but were instead, generally defi ned by a large but
T
r
ansboundar
The GIWA approach
discrete drainage basin that also included the coastal marine waters into
which the basin discharges. In many cases, the marine areas examined
1
Scaling
st
W
orkshop
Detailed
during the assessment coincided with the Large Marine Ecosystems
y
D
(LMEs) defi ned by the US National Atmospheric and Oceanographic
iagnostic
A
ssessment
Scoping
Administration (NOAA). As a consequence, scaling should be a
relatively straight-forward task that involves the inspection of the
Analy
boundaries that were proposed for the region during the preparatory
Causal Chain
2
sis
nd
Analysis
phase of GIWA to ensure that they are appropriate and that there are
W
orkshop
no important overlaps or gaps with neighbouring regions. When the
Policy Option
proposed boundaries were found to be inadequate, the boundaries of
Analysis
the region were revised according to the recommendations of experts
from both within the region and from adjacent regions so as to ensure
that any changes did not result in the exclusion of areas from the GIWA.
Once the regional boundary was defi ned, regional teams identifi ed all
SAP
the transboundary elements of the aquatic environment within the
SAP
region and determined if these elements could be assessed as a single
Figure 1
Illustration of the relationship between the GIWA
coherent aquatic system or if there were two or more independent
approach and other projects implemented within the
systems that should be assessed separately.
GEF International Waters (IW) portfolio.
The GIWA is a logical contiguous process that defi nes the geographic
Scoping Assessing the GIWA concerns
region to be assessed, identifi es and prioritises particularly problems
Scoping is an assessment of the severity of environmental and socio-
based on the magnitude of their impacts on the environment and
economic impacts caused by each of the fi ve pre-defi ned GIWA concerns
human societies in the region, determines the root causes of those
and their constituent issues (Table 1). It is not designed to provide an
problems and, fi nally, assesses various policy options that addresses
exhaustive review of water-related problems that exist within each region,
those root causes in order to reverse negative trends in the condition
but rather it is a mechanism to identify the most urgent problems in the
of the aquatic environment. These four steps, referred to as Scaling,
region and prioritise those for remedial actions. The priorities determined
Scoping, Causal chain analysis and Policy options analysis, are
by Scoping are therefore one of the main outputs of the GIWA project.
summarised below and are described in their entirety in two volumes:
GIWA Methodology Stage 1: Scaling and Scoping; and GIWA Methodology:
Focusing the assessment on pre-defi ned concerns and issues ensured
Detailed Assessment, Causal Chain Analysis and Policy Options Analysis.
the comparability of the results between diff erent regions. In addition, to
Generally, the components of the GIWA methodology are aligned
ensure the long-term applicability of the options that are developed to
with the framework adopted by the GEF for Transboundary Diagnostic
mitigate these problems, Scoping not only assesses the current impacts
Analyses (TDAs) and Strategic Action Programmes (SAPs) (Figure 1) and
of these concerns and issues but also the probable future impacts
assume a broad spectrum of transboundary infl uences in addition to
according to the "most likely scenario" which considered demographic,
those associated with the physical movement of water across national
economic, technological and other relevant changes that will potentially
borders.
infl uence the aquatic environment within the region by 2020.
Scaling Defining the geographic extent
The magnitude of the impacts caused by each issue on the
of the region
environment and socio-economic indicators was assessed over the
Scaling is the fi rst stage of the assessment and is the process by which
entire region using the best available information from a wide range of
the geographic scale of the assessment is defi ned. In order to facilitate
sources and the knowledge and experience of the each of the experts
the implementation of the GIWA, the globe was divided during the
comprising the regional team. In order to enhance the comparability
design phase of the project into 66 contiguous regions. Considering the
of the assessment between diff erent regions and remove biases
transboundary nature of many aquatic resources and the transboundary
in the assessment caused by diff erent perceptions of and ways to
focus of the GIWA, the boundaries of the regions did not comply with
communicate the severity of impacts caused by particular issues, the
viii
REGIONAL ASSESSMENTS
results were distilled and reported as standardised scores according to
Table 2
Example of environmental impact assessment of
Freshwater shortage.
the following four point scale:
Weight
0 = no known impact
Environmental
Environmental issues
Score
Weight %
averaged
concerns
1 = slight impact
score
2
=
moderate
impact
1. Modification of stream flow
1
20
Freshwater shortage
1.50
3 = severe impact
2. Pollution of existing supplies
2
50
The attributes of each score for each issue were described by a detailed
3. Changes in the water table
1
30
set of pre-defi ned criteria that were used to guide experts in reporting
Table 3
Example of Health impacts assessment linked to one of
the results of the assessment. For example, the criterion for assigning
the GIWA concerns.
a score of 3 to the issue Loss of ecosystems or ecotones is: "Permanent
Criteria for Health impacts
Raw score
Score
Weight %
destruction of at least one habitat is occurring such as to have reduced their
Very small
Very large
surface area by >30% during the last 2-3 decades". The full list of criteria is
Number of people affected
2
50
0 1 2 3
presented at the end of the chapter, Table 5a-e. Although the scoring
Minimum
Severe
Degree of severity
2
30
0 1 2 3
inevitably includes an arbitrary component, the use of predefi ned
Occasion/Short
Continuous
Frequency/Duration
2
20
0 1 2 3
criteria facilitates comparison of impacts on a global scale and also
Weight average score for Health impacts
2
encouraged consensus of opinion among experts.
The trade-off associated with assessing the impacts of each concern
After all 22 issues and associated socio-economic impacts have
and their constituent issues at the scale of the entire region is that spatial
been scored, weighted and averaged, the magnitude of likely future
resolution was sometimes low. Although the assessment provides a
changes in the environmental and socio-economic impacts of each
score indicating the severity of impacts of a particular issue or concern
of the fi ve concerns on the entire region is assessed according to the
on the entire region, it does not mean that the entire region suff ers
most likely scenario which describes the demographic, economic,
the impacts of that problem. For example, eutrophication could be
technological and other relevant changes that might infl uence the
identifi ed as a severe problem in a region, but this does not imply that all
aquatic environment within the region by 2020.
waters in the region suff er from severe eutrophication. It simply means
that when the degree of eutrophication, the size of the area aff ected,
In order to prioritise among GIWA concerns within the region and
the socio-economic impacts and the number of people aff ected is
identify those that will be subjected to causal chain and policy options
considered, the magnitude of the overall impacts meets the criteria
analysis in the subsequent stages of the GIWA, the present and future
defi ning a severe problem and that a regional action should be initiated
scores of the environmental and socio-economic impacts of each
in order to mitigate the impacts of the problem.
concern are tabulated and an overall score calculated. In the example
presented in Table 4, the scoping assessment indicated that concern III,
When each issue has been scored, it was weighted according to the relative
Habitat and community modifi cation, was the priority concern in this
contribution it made to the overall environmental impacts of the concern
region. The outcome of this mathematic process was reconciled against
and a weighted average score for each of the fi ve concerns was calculated
the knowledge of experts and the best available information in order
(Table 2). Of course, if each issue was deemed to make equal contributions,
to ensure the validity of the conclusion.
then the score describing the overall impacts of the concern was simply the
arithmetic mean of the scores allocated to each issue within the concern.
In some cases however, this process and the subsequent participatory
In addition, the socio-economic impacts of each of the fi ve major
discussion did not yield consensus among the regional experts
concerns were assessed for the entire region. The socio-economic
regarding the ranking of priorities. As a consequence, further analysis
impacts were grouped into three categories; Economic impacts,
was required. In such cases, expert teams continued by assessing the
Health impacts and Other social and community impacts (Table 3). For
relative importance of present and potential future impacts and assign
each category, an evaluation of the size, degree and frequency of the
weights to each. Afterwards, the teams assign weights indicating the
impact was performed and, once completed, a weighted average score
relative contribution made by environmental and socio-economic
describing the overall socio-economic impacts of each concern was
factors to the overall impacts of the concern. The weighted average
calculated in the same manner as the overall environmental score.
score for each concern is then recalculated taking into account
THE GIWA METHODOLOGY
ix
Table 4
Example of comparative environmental and socio-economic impacts of each major concern, presently and likely in year 2020.
Types of impacts
Environmental score
Economic score
Human health score
Social and community score
Concern
Overall score
Present (a)
Future (b)
Present (c)
Future (d)
Present (e)
Future (f)
Present (g)
Future (h)
Freshwater shortage
1.3
2.3
2.7
2.8
2.6
3.0
1.8
2.2
2.3
Pollution
1.5
2.0
2.0
2.3
1.8
2.3
2.0
2.3
2.0
Habitat and community
2.0
3.0
2.4
3.0
2.4
2.8
2.3
2.7
2.6
modification
Unsustainable exploitation of fish
1.8
2.2
2.0
2.1
2.0
2.1
2.4
2.5
2.1
and other living resources
Global change
0.8
1.0
1.5
1.7
1.5
1.5
1.0
1.0
1.2
the relative contributions of both present and future impacts and
should be regarded as a framework to guide the analysis, rather than
environmental and socio-economic factors. The outcome of these
as a set of detailed instructions. Secondly, in an ideal setting, a causal
additional analyses was subjected to further discussion to identify
chain would be produced by a multidisciplinary group of specialists
overall priorities for the region.
that would statistically examine each successive cause and study its
links to the problem and to other causes. However, this approach (even
Finally, the assessment recognises that each of the fi ve GIWA concerns
if feasible) would use far more resources and time than those available
are not discrete but often interact. For example, pollution can destroy
to GIWA1. For this reason, it has been necessary to develop a relatively
aquatic habitats that are essential for fi sh reproduction which, in turn,
simple and practical analytical model for gathering information to
can cause declines in fi sh stocks and subsequent overexploitation. Once
assemble meaningful causal chains.
teams have ranked each of the concerns and determined the priorities
for the region, the links between the concerns are highlighted in order
Conceptual model
to identify places where strategic interventions could be applied to
A causal chain is a series of statements that link the causes of a problem
yield the greatest benefi ts for the environment and human societies
with its eff ects. Recognising the great diversity of local settings and the
in the region.
resulting diffi
culty in developing broadly applicable policy strategies,
the GIWA CCA focuses on a particular system and then only on those
Causal chain analysis
issues that were prioritised during the scoping assessment. The
Causal Chain Analysis (CCA) traces the cause-eff ect pathways from the
starting point of a particular causal chain is one of the issues selected
socio-economic and environmental impacts back to their root causes.
during the Scaling and Scoping stages and its related environmental
The GIWA CCA aims to identify the most important causes of each
and socio-economic impacts. The next element in the GIWA chain is
concern prioritised during the scoping assessment in order to direct
the immediate cause; defi ned as the physical, biological or chemical
policy measures at the most appropriate target in order to prevent
variable that produces the GIWA issue. For example, for the issue of
further degradation of the regional aquatic environment.
eutrophication the immediate causes may be, inter alia:
Enhanced nutrient inputs;
Root causes are not always easy to identify because they are often
Increased
recycling/mobilisation;
spatially or temporally separated from the actual problems they
Trapping of nutrients (e.g. in river impoundments);
cause. The GIWA CCA was developed to help identify and understand
Run-off and stormwaters
the root causes of environmental and socio-economic problems
in international waters and is conducted by identifying the human
Once the relevant immediate cause(s) for the particular system has
activities that cause the problem and then the factors that determine
(have) been identifi ed, the sectors of human activity that contribute
the ways in which these activities are undertaken. However, because
most signifi cantly to the immediate cause have to be determined.
there is no universal theory describing how root causes interact to
Assuming that the most important immediate cause in our example
create natural resource management problems and due to the great
had been increased nutrient concentrations, then it is logical that the
variation of local circumstances under which the methodology will
most likely sources of those nutrients would be the agricultural, urban
be applied, the GIWA CCA is not a rigidly structured assessment but
or industrial sectors. After identifying the sectors that are primarily
1 This does not mean that the methodology ignores statistical or quantitative studies; as has already been pointed out, the available evidence that justifies the assumption of causal links should
be provided in the assessment.
x
REGIONAL ASSESSMENTS
responsible for the immediate causes, the root causes acting on those
The policy options recommended by the GIWA are only contributions
sectors must be determined. For example, if agriculture was found to
to the larger policy process and, as such, the GIWA methodology
be primarily responsible for the increased nutrient concentrations, the
developed to test the performance of various options under the
root causes could potentially be:
diff erent circumstances has been kept simple and broadly applicable.
Economic (e.g. subsidies to fertilisers and agricultural products);
Legal (e.g. inadequate regulation);
Global International Waters Assessment
Failures in governance (e.g. poor enforcement); or
Technology or knowledge related (e.g. lack of aff ordable substitutes
for fertilisers or lack of knowledge as to their application).
Once the most relevant root causes have been identifi ed, an
explanation, which includes available data and information, of how
they are responsible for the primary environmental and socio-economic
problems in the region should be provided.
Policy option analysis
Despite considerable eff ort of many Governments and other
organisations to address transboundary water problems, the evidence
indicates that there is still much to be done in this endeavour. An
important characteristic of GIWA's Policy Option Analysis (POA) is that
its recommendations are fi rmly based on a better understanding of
the root causes of the problems. Freshwater scarcity, water pollution,
overexploitation of living resources and habitat destruction are very
complex phenomena. Policy options that are grounded on a better
understanding of these phenomena will contribute to create more
eff ective societal responses to the extremely complex water related
transboundary problems. The core of POA in the assessment consists
of two tasks:
Construct policy options
Policy options are simply diff erent courses of action, which are not
always mutually exclusive, to solve or mitigate environmental and
socio-economic problems in the region. Although a multitude of
diff erent policy options could be constructed to address each root
cause identifi ed in the CCA, only those few policy options that have
the greatest likelihood of success were analysed in the GIWA.
Select and apply the criteria on which the policy options will be
evaluated
Although there are many criteria that could be used to evaluate any
policy option, GIWA focuses on:
Eff ectiveness (certainty of result)
Effi
ciency (maximisation of net benefi ts)
Equity (fairness of distributional impacts)
Practical
criteria
(political
acceptability,
implementation
feasibility).
THE GIWA METHODOLOGY
xi
Table 5a: Scoring criteria for environmental impacts of Freshwater shortage
Issue
Score 0 = no known impact
Score 1 = slight impact
Score 2 = moderate impact
Score 3 = severe impact
Issue 1: Modification
No evidence of modification of stream
There is a measurably changing trend in
Significant downward or upward trend
Annual discharge of a river altered by more
of stream flow
flow.
annual river discharge at gauging stations
(more than 20% of the long term mean) in
than 50% of long term mean; or
"An increase or decrease
in a major river or tributary (basin >
annual discharges in a major river or tributary Loss of >50% of riparian or deltaic
in the discharge of
40 000 km2); or
draining a basin of >250 000 km2; or
wetlands over a period of not less than
streams and rivers
There is a measurable decrease in the area
Loss of >20% of flood plain or deltaic
40 years (through causes other than
as a result of human
of wetlands (other than as a consequence
wetlands through causes other than
conversion or artificial embankment); or
interventions on a local/
of conversion or embankment
conversion or artificial embankments; or
Significant increased siltation or erosion
regional scale (see Issue
construction); or
Significant loss of riparian vegetation (e.g.
due to changing in flow regime (other than
19 for flow alterations
There is a measurable change in the
trees, flood plain vegetation); or
normal fluctuations in flood plain rivers);
resulting from global
interannual mean salinity of estuaries or
Significant saline intrusion into previously
or
change) over the last 3-4
coastal lagoons and/or change in the mean
freshwater rivers or lagoons.
Loss of one or more anadromous or
decades."
position of estuarine salt wedge or mixing
catadromous fish species for reasons
zone; or
other than physical barriers to migration,
Change in the occurrence of exceptional
pollution or overfishing.
discharges (e.g. due to upstream
damming.
Issue 2: Pollution of
No evidence of pollution of surface and
Any monitored water in the region does
Water supplies does not meet WHO or
River draining more than 10% of the basin
existing supplies
ground waters.
not meet WHO or national drinking water
national drinking water standards in more
have suffered polysaprobic conditions, no
"Pollution of surface
criteria, other than for natural reasons; or
than 30% of the region; or
longer support fish, or have suffered severe
and ground fresh waters
There have been reports of one or more
There are one or more reports of fish kills
oxygen depletion
supplies as a result of
fish kills in the system due to pollution
due to pollution in any river draining a
Severe pollution of other sources of
point or diffuse sources"
within the past five years.
basin of >250 000 km2 .
freshwater (e.g. groundwater)
Issue 3: Changes in
No evidence that abstraction of water from Several wells have been deepened because Clear evidence of declining base flow in
Aquifers are suffering salinisation over
the water table
aquifers exceeds natural replenishment.
of excessive aquifer draw-down; or
rivers in semi-arid areas; or
regional scale; or
"Changes in aquifers
Several springs have dried up; or
Loss of plant species in the past decade,
Perennial springs have dried up over
as a direct or indirect
Several wells show some salinisation.
that depend on the presence of ground
regionally significant areas; or
consequence of human
water; or
Some aquifers have become exhausted
activity"
Wells have been deepened over areas of
hundreds of km2;or
Salinisation over significant areas of the
region.
Table 5b: Scoring criteria for environmental impacts of Pollution
Issue
Score 0 = no known impact
Score 1 = slight impact
Score 2 = moderate impact
Score 3 = severe impact
Issue 4:
Normal incidence of bacterial related
There is minor increase in incidence of
Public health authorities aware of marked
There are large closure areas or very
Microbiological
gastroenteric disorders in fisheries product
bacterial related gastroenteric disorders
increase in the incidence of bacterial
restrictive advisories affecting the
pollution
consumers and no fisheries closures or
in fisheries product consumers but no
related gastroenteric disorders in fisheries
marketability of fisheries products; or
"The adverse effects of
advisories.
fisheries closures or advisories.
product consumers; or
There exists widespread public or tourist
microbial constituents of
There are limited area closures or
awareness of hazards resulting in
human sewage released
advisories reducing the exploitation or
major reductions in the exploitation or
to water bodies."
marketability of fisheries products.
marketability of fisheries products.
Issue 5:
No visible effects on the abundance and
Increased abundance of epiphytic algae; or
Increased filamentous algal production
High frequency (>1 event per year), or
Eutrophication
distributions of natural living resource
A statistically significant trend in
resulting in algal mats; or
intensity, or large areas of periodic hypoxic
"Artificially enhanced
distributions in the area; and
decreased water transparency associated
Medium frequency (up to once per year)
conditions, or high frequencies of fish and
primary productivity in
No increased frequency of hypoxia1 or
with algal production as compared with
of large-scale hypoxia and/or fish and
zoobenthos mortality events or harmful
receiving water basins
fish mortality events or harmful algal
long-term (>20 year) data sets; or
zoobenthos mortality events and/or
algal blooms; or
related to the increased
blooms associated with enhanced primary
Measurable shallowing of the depth range
harmful algal blooms.
Significant changes in the littoral
availability or supply
production; and
of macrophytes.
community; or
of nutrients, including
No evidence of periodically reduced
Presence of hydrogen sulphide in
cultural eutrophication
dissolved oxygen or fish and zoobenthos
historically well oxygenated areas.
in lakes."
mortality; and
No evident abnormality in the frequency of
algal blooms.
xii
REGIONAL ASSESSMENTS
Issue 6: Chemical
No known or historical levels of chemical
Some chemical contaminants are
Some chemical contaminants are above
Chemical contaminants are above
pollution
contaminants except background levels of
detectable but below threshold limits
threshold limits defined for the country or
threshold limits defined for the country or
"The adverse effects of
naturally occurring substances; and
defined for the country or region; or
region; or
region; and
chemical contaminants
No fisheries closures or advisories due to
Restricted area advisories regarding
Large area advisories by public health
Public health and public awareness of
released to standing or
chemical pollution; and
chemical contamination of fisheries
authorities concerning fisheries product
fisheries contamination problems with
marine water bodies
No incidence of fisheries product tainting;
products.
contamination but without associated
associated reductions in the marketability
as a result of human
and
catch restrictions or closures; or
of such products either through the
activities. Chemical
No unusual fish mortality events.
If there is no available data use the following
High mortalities of aquatic species near
imposition of limited advisories or by area
contaminants are
criteria:
outfalls.
closures of fisheries; or
here defined as
If there is no available data use the following
Some use of pesticides in small areas; or
Large-scale mortalities of aquatic species.
compounds that are
criteria:
Presence of small sources of dioxins or
If there is no available data use the following
toxic or persistent or
No use of pesticides; and
furans (e.g., small incineration plants or
criteria:
If there is no available data use the following
bioaccumulating."
No sources of dioxins and furans; and
bleached kraft/pulp mills using chlorine);
Large-scale use of pesticides in agriculture
criteria:
No regional use of PCBs; and
or
and forestry; or
Indications of health effects resulting
No bleached kraft pulp mills using chlorine Some previous and existing use of PCBs
Presence of major sources of dioxins or
from use of pesticides; or
bleaching; and
and limited amounts of PCB-containing
furans such as large municipal or industrial Known emissions of dioxins or furans from
No use or sources of other contaminants.
wastes but not in amounts invoking local
incinerators or large bleached kraft pulp
incinerators or chlorine bleaching of pulp;
concerns; or
mills; or
or
Presence of other contaminants.
Considerable quantities of waste PCBs in
Known contamination of the environment
the area with inadequate regulation or has
or foodstuffs by PCBs; or
invoked some public concerns; or
Known contamination of the environment
Presence of considerable quantities of
or foodstuffs by other contaminants.
other contaminants.
Issue 7: Suspended
No visible reduction in water transparency; Evidently increased or reduced turbidity
Markedly increased or reduced turbidity
Major changes in turbidity over wide or
solids
and
in streams and/or receiving riverine and
in small areas of streams and/or receiving
ecologically significant areas resulting
"The adverse effects of
No evidence of turbidity plumes or
marine environments but without major
riverine and marine environments; or
in markedly changed biodiversity or
modified rates of release
increased siltation; and
changes in associated sedimentation or
Extensive evidence of changes in
mortality in benthic species due to
of suspended particulate No evidence of progressive riverbank,
erosion rates, mortality or diversity of flora
sedimentation or erosion rates; or
excessive sedimentation with or without
matter to water bodies
beach, other coastal or deltaic erosion.
and fauna; or
Changes in benthic or pelagic biodiversity
concomitant changes in the nature of
resulting from human
Some evidence of changes in benthic or
in areas due to sediment blanketing or
deposited sediments (i.e., grain-size
activities"
pelagic biodiversity in some areas due
increased turbidity.
composition/redox); or
to sediment blanketing or increased
Major change in pelagic biodiversity or
turbidity.
mortality due to excessive turbidity.
Issue 8: Solid wastes
No noticeable interference with trawling
Some evidence of marine-derived litter on
Widespread litter on beaches giving rise to
Incidence of litter on beaches sufficient
"Adverse effects
activities; and
beaches; or
public concerns regarding the recreational
to deter the public from recreational
associated with the
No noticeable interference with the
Occasional recovery of solid wastes
use of beaches; or
activities; or
introduction of solid
recreational use of beaches due to litter;
through trawling activities; but
High frequencies of benthic litter recovery
Trawling activities untenable because of
waste materials into
and
Without noticeable interference with
and interference with trawling activities;
benthic litter and gear entanglement; or
water bodies or their
No reported entanglement of aquatic
trawling and recreational activities in
or
Widespread entanglement and/or
environs."
organisms with debris.
coastal areas.
Frequent reports of entanglement/
suffocation of aquatic species by litter.
suffocation of species by litter.
Issue 9: Thermal
No thermal discharges or evidence of
Presence of thermal discharges but
Presence of thermal discharges with large
Presence of thermal discharges with large
"The adverse effects
thermal effluent effects.
without noticeable effects beyond
mixing zones having reduced productivity
mixing zones with associated mortalities,
of the release of
the mixing zone and no significant
or altered biodiversity; or
substantially reduced productivity or
aqueous effluents at
interference with migration of species.
Evidence of reduced migration of species
noticeable changes in biodiversity; or
temperatures exceeding
due to thermal plume.
Marked reduction in the migration of
ambient temperature
species due to thermal plumes.
in the receiving water
body."
Issue 10: Radionuclide No radionuclide discharges or nuclear
Minor releases or fallout of radionuclides
Minor releases or fallout of radionuclides
Substantial releases or fallout of
"The adverse effects of
activities in the region.
but with well regulated or well-managed
under poorly regulated conditions that do
radionuclides resulting in excessive
the release of radioactive
conditions complying with the Basic Safety
not provide an adequate basis for public
exposures to humans or animals in relation
contaminants and
Standards.
health assurance or the protection of
to those recommended under the Basic
wastes into the aquatic
aquatic organisms but without situations
Safety Standards; or
environment from
or levels likely to warrant large scale
Some indication of situations or exposures
human activities."
intervention by a national or international
warranting intervention by a national or
authority.
international authority.
Issue 11: Spills
No evidence of present or previous spills of
Some evidence of minor spills of hazardous Evidence of widespread contamination
Widespread contamination by hazardous
"The adverse effects
hazardous material; or
materials in small areas with insignificant
by hazardous or aesthetically displeasing
or aesthetically displeasing materials
of accidental episodic
No evidence of increased aquatic or avian
small-scale adverse effects one aquatic or
materials assumed to be from spillage
from frequent spills resulting in major
releases of contaminants
species mortality due to spills.
avian species.
(e.g. oil slicks) but with limited evidence of
interference with aquatic resource
and materials to the
widespread adverse effects on resources or
exploitation or coastal recreational
aquatic environment
amenities; or
amenities; or
as a result of human
Some evidence of aquatic or avian species
Significant mortality of aquatic or avian
activities."
mortality through increased presence of
species as evidenced by large numbers of
contaminated or poisoned carcasses on
contaminated carcasses on beaches.
beaches.
THE GIWA METHODOLOGY
xiii
Table 5c: Scoring criteria for environmental impacts of Habitat and community modification
Issue
Score 0 = no known impact
Score 1 = slight impact
Score 2 = moderate impact
Score 3 = severe impact
Issue 12: Loss of ecosystems or
There is no evidence of loss of
There are indications of fragmentation Permanent destruction of at least one
Permanent destruction of at least one
ecotones
ecosystems or habitats.
of at least one of the habitats.
habitat is occurring such as to have
habitat is occurring such as to have
"The complete destruction of aquatic
reduced their surface area by up to 30
reduced their surface area by >30%
habitats. For the purpose of GIWA
% during the last 2-3 decades.
during the last 2-3 decades.
methodology, recent loss will be
measured as a loss of pre-defined
habitats over the last 2-3 decades."
Issue 13: Modification of
No evidence of change in species
Evidence of change in species
Evidence of change in species
Evidence of change in species
ecosystems or ecotones, including
complement due to species extinction
complement due to species extinction
complement due to species extinction
complement due to species extinction
community structure and/or species
or introduction; and
or introduction
or introduction; and
or introduction; and
composition
No changing in ecosystem function
Evidence of change in population
Evidence of change in population
"Modification of pre-defined habitats
and services.
structure or change in functional group
structure or change in functional group
in terms of extinction of native species,
composition or structure
composition or structure; and
occurrence of introduced species and
Evidence of change in ecosystem
changing in ecosystem function and
services2.
services over the last 2-3 decades."
2 Constanza, R. et al. (1997). The value of the world ecosystem services and natural capital, Nature 387:253-260.
Table 5d: Scoring criteria for environmental impacts of Unsustainable exploitation of fish and other
living resources
Issue
Score 0 = no known impact
Score 1 = slight impact
Score 2 = moderate impact
Score 3 = severe impact
Issue 14: Overexploitation
No harvesting exists catching fish
Commercial harvesting exists but there One stock is exploited beyond MSY
More than one stock is exploited
"The capture of fish, shellfish or marine
(with commercial gear for sale or
is no evidence of over-exploitation.
(maximum sustainable yield) or is
beyond MSY or is outside safe
invertebrates at a level that exceeds the
subsistence).
outside safe biological limits.
biological limits.
maximum sustainable yield of the stock."
Issue 15: Excessive by-catch and
Current harvesting practices show no
Up to 30% of the fisheries yield (by
30-60% of the fisheries yield consists
Over 60% of the fisheries yield is
discards
evidence of excessive by-catch and/or
weight) consists of by-catch and/or
of by-catch and/or discards.
by-catch and/or discards; or
"By-catch refers to the incidental capture
discards.
discards.
Noticeable incidence of capture of
of fish or other animals that are not the
endangered species.
target of the fisheries. Discards refers
to dead fish or other animals that are
returned to the sea."
Issue 16: Destructive fishing
No evidence of habitat destruction due Habitat destruction resulting in
Habitat destruction resulting in
Habitat destruction resulting in
practices
to fisheries practices.
changes in distribution of fish or
moderate reduction of stocks or
complete collapse of a stock or far
"Fishing practices that are deemed to
shellfish stocks; or
moderate changes of the environment;
reaching changes in the environment;
produce significant harm to marine,
Trawling of any one area of the seabed
or
or
lacustrine or coastal habitats and
is occurring less than once per year.
Trawling of any one area of the seabed
Trawling of any one area of the seabed
communities."
is occurring 1-10 times per year; or
is occurring more than 10 times per
Incidental use of explosives or poisons
year; or
for fishing.
Widespread use of explosives or
poisons for fishing.
Issue 17: Decreased viability of
No evidence of increased incidence of
Increased reports of diseases without
Declining populations of one or more
Collapse of stocks as a result of
stocks through contamination and
fish or shellfish diseases.
major impacts on the stock.
species as a result of diseases or
diseases or contamination.
disease
contamination.
"Contamination or diseases of feral (wild)
stocks of fish or invertebrates that are a
direct or indirect consequence of human
action."
Issue 18: Impact on biological and
No evidence of deliberate or accidental Alien species introduced intentionally
Measurable decline in the population
Extinction of native species or local
genetic diversity
introductions of alien species; and
or accidentally without major changes
of native species or local stocks as a
stocks as a result of introductions
"Changes in genetic and species diversity No evidence of deliberate or accidental
in the community structure; or
result of introductions (intentional or
(intentional or accidental); or
of aquatic environments resulting from
introductions of alien stocks; and
Alien stocks introduced intentionally
accidental); or
Major changes (>20%) in the genetic
the introduction of alien or genetically
No evidence of deliberate or accidental
or accidentally without major changes
Some changes in the genetic
composition of stocks (e.g. as a result
modified species as an intentional or
introductions of genetically modified
in the community structure; or
composition of stocks (e.g. as a result
of escapes from aquaculture replacing
unintentional result of human activities
species.
Genetically modified species
of escapes from aquaculture replacing
the wild stock).
including aquaculture and restocking."
introduced intentionally or
the wild stock).
accidentally without major changes in
the community structure.
xiv
REGIONAL ASSESSMENTS
Table 5e: Scoring criteria for environmental impacts of Global change
Issue
Score 0 = no known impact
Score 1 = slight impact
Score 2 = moderate impact
Score 3 = severe impact
Issue 19: Changes in hydrological
No evidence of changes in hydrological Change in hydrological cycles due
Significant trend in changing
Loss of an entire habitat through
cycle and ocean circulation
cycle and ocean/coastal current due to
to global change causing changes
terrestrial or sea ice cover (by
desiccation or submergence as a result
"Changes in the local/regional water
global change.
in the distribution and density of
comparison with a long-term time
of global change; or
balance and changes in ocean and coastal
riparian terrestrial or aquatic plants
series) without major downstream
Change in the tree or lichen lines; or
circulation or current regime over the
without influencing overall levels of
effects on river/ocean circulation or
Major impacts on habitats or
last 2-3 decades arising from the wider
productivity; or
biological diversity; or
biodiversity as the result of increasing
problem of global change including
Some evidence of changes in ocean
Extreme events such as flood and
frequency of extreme events; or
ENSO."
or coastal currents due to global
drought are increasing; or
Changing in ocean or coastal currents
change but without a strong effect on
Aquatic productivity has been altered
or upwelling regimes such that plant
ecosystem diversity or productivity.
as a result of global phenomena such
or animal populations are unable to
as ENSO events.
recover to their historical or stable
levels; or
Significant changes in thermohaline
circulation.
Issue 20: Sea level change
No evidence of sea level change.
Some evidences of sea level change
Changed pattern of coastal erosion due Major loss of coastal land areas due to
"Changes in the last 2-3 decades in the
without major loss of populations of
to sea level rise has became evident; or
sea-level change or sea-level induced
annual/seasonal mean sea level as a
organisms.
Increase in coastal flooding events
erosion; or
result of global change."
partly attributed to sea-level rise
Major loss of coastal or intertidal
or changing prevailing atmospheric
populations due to sea-level change or
forcing such as atmospheric pressure
sea level induced erosion.
or wind field (other than storm
surges).
Issue 21: Increased UV-B radiation as No evidence of increasing effects
Some measurable effects of UV/B
Aquatic community structure is
Measured/assessed effects of UV/B
a result of ozone depletion
of UV/B radiation on marine or
radiation on behavior or appearance of
measurably altered as a consequence
irradiation are leading to massive loss
"Increased UV-B flux as a result polar
freshwater organisms.
some aquatic species without affecting
of UV/B radiation; or
of aquatic communities or a significant
ozone depletion over the last 2-3
the viability of the population.
One or more aquatic populations are
change in biological diversity.
decades."
declining.
Issue 22: Changes in ocean CO
No measurable or assessed changes
Some reasonable suspicions that
Some evidences that the impacts
Evidences that the changes in
2
source/sink function
in CO source/sink function of aquatic
current global change is impacting the
of global change have altered the
source/sink function of the aquatic
2
"Changes in the capacity of aquatic
system.
aquatic system sufficiently to alter its
source/sink function for CO of aquatic
systems in the region are sufficient to
2
systems, ocean as well as freshwater, to
source/sink function for CO .
systems in the region by at least 10%.
cause measurable change in global CO
2
2
generate or absorb atmospheric CO as a
balance.
2
direct or indirect consequence of global
change over the last 2-3 decades."
THE GIWA METHODOLOGY
xv