


MA
A P : G
ND S IW
UB A R
SY E
S G
T IO
EM NS
S
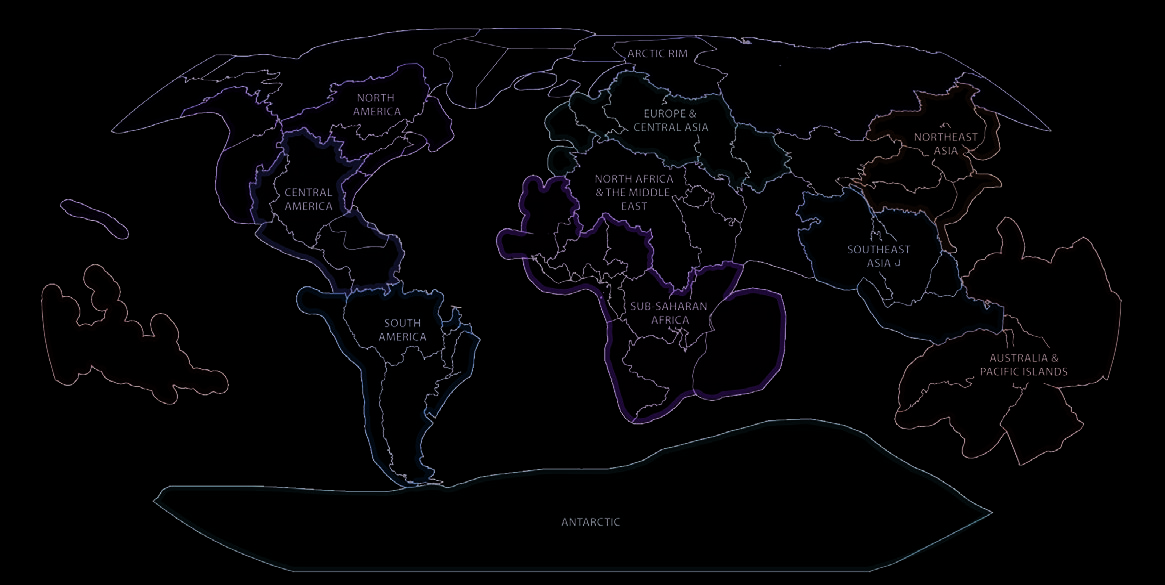
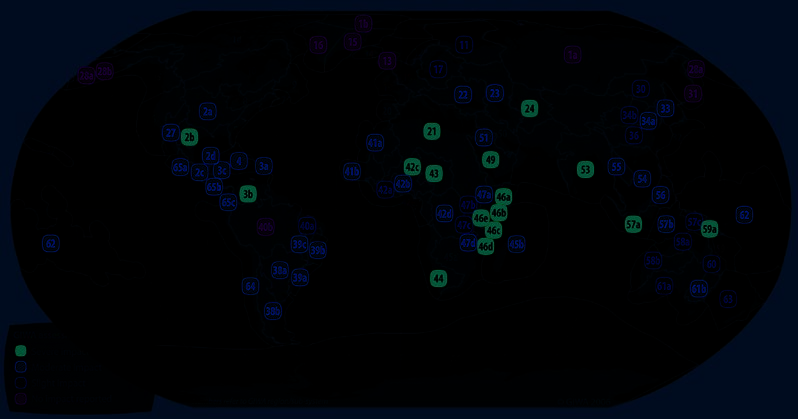
GIWA MEGA REGIONS
GLOBAL INTERNATIONAL
WATERS ASSESSMENT
AREA SHADING BY MEGA REGION
Arctic Rim
27 Gulf of California*
Northeast Asia
1a Russian Arctic*
65a Eastern Equatorial Pacific (Southwest Mexico)*
30 Sea of Okhotsk*
1b Arctic Greenland*
65b Eastern Equatorial Pacific (Central Equatorial Pacific)*
31 Oyashio Current*
1c Arctic European/Atlantic
65c Eastern Equatorial Pacific (Pacific Colombian)*
32 Kuroshio Current
1d Arctic North American
33 Sea of Japan*
11 Barents Sea*
34a Yel ow Sea (Yel ow Sea)*
12 Norwegian Sea
South America
34b Yel ow Sea (Bohai Sea)*
13 Faroe Plateau*
38a Patagonian Shelf (La Plata River Basin)*
36 East China Sea*
14 Iceland Shelf
38b Patagonian Shelf (South Atlantic Drainage System)*
15 East Greenland Shelf*
39a Brazil Current (South/Southeast Atlantic Basins)*
16 West Greenland Shelf*
39b Brazil Current (East Atlantic Basins)*
28a Bering Sea (West Bering Sea)*
39c Brazil Current (Săo Francisco River Basin)*
Southeast Asia
28b Bering Sea (East Bering Sea)*
40a Northeast Brazil Shelf*
40b Amazon*
53 Bay of Bengal*
64 Humboldt Current*
54 South China Sea*
Europe & Central Asia
55 Mekong River*
56 Sulu-Celebes Sea*
17 Baltic Sea*
57a Indonesian Seas (Sunda)*
18 North Sea
Sub-Saharan Africa
57b Indonesian Seas (Wal acea)*
19 Celtic-Biscay Shelf
41a Canary Current (North)*
57c Indonesian Seas (Sahul)*
20 Iberian Coastal Sea
41b Canary Current (South)*
22 Black Sea*
42a Guinea Current (Comoe Basin)*
23 Caspian Sea*
42b Guinea Current (Volta Basin)*
Australia & Pacific Islands
24 Aral Sea*
42c Guinea Current (Niger Basin)*
42d Guinea Current (Congo Basin)*
58a North Australian Shelf (Wet Tropics)*
42e Guinea Current LME*
58b North Australian Shelf (Dry Tropics)*
North America
43 Lake Chad*
59a Coral Sea Basin (South PNG and Papua)*
59b Coral Sea Basin (Coral Sea)*
5
Southeast Shelf
44 Benguela Current*
60 Great Barrier Reef*
6 Northeast Shelf
45a Agulhas Current
45b Indian Ocean Islands*
61a Great Australian Bight*
InCthealrenngesa tto
7
Scotian Shelf
61b Great Australian Bight (Muray Darling Basin)*
8 Gulf of St Lawrence
46a Somali Coastal Current (Juba/Shebel e)*
62 Pacific Islands*
9 Newfoundland Shelf
46b Somali Coastal Current (Tana/Athi/Sabaki)*
63 Tasman Sea*
10 Baffin Bay, Labrador Sea, Canadian Archipelago
46c Somali Coastal Current (Wami/Ruvu/Pangani)*
25 Gulf of Alaska
46d Somali Coastal Current (Rufiji/Ruvuma)*
26 California Current
46e Somali Coastal Current (Lake Jipe/Chala)*
Antarctic
37 Hawai an Archipelago
47a East African Rift Val ey Lakes (Lake Turkana)*
66 Antarctic
Regional Asiso
ess n
me a
ntsl W
in a Gl a
ob t
al e
Perrss
pective
47b East African Rift Val ey Lakes (Lake Victoria)*
47c East African Rift Val ey Lakes (Lake Tanganyika)*
Central America
47d East African Rift Val ey Lakes (Lake Malawi)*
2a Gulf of Mexico (Mississippi River)*
2b Gulf of Mexico (Rio Grande/Rio Bravo)*
2c Gulf of Mexico (Usumacinta/Grijalva)*
North Africa & Middle East
2d Gulf of Mexico (Rio Hondo/Chetumal Bay)*
21 North Africa and Nile River Basin
3a Caribbean Sea (Small Islands)*
49 Red Sea and Gulf of Aden
3b Caribbean Sea (Orinoco/Magdalena/Catatumbo)*
50 Euphrates and Tigris River Basin
3c Caribbean Sea (Central America/Mexico)*
51 Jordan*
4 Caribbean Islands*
52 Arabian Sea
THE GIWA FINAL REPORT
* Assessed by GIWA.

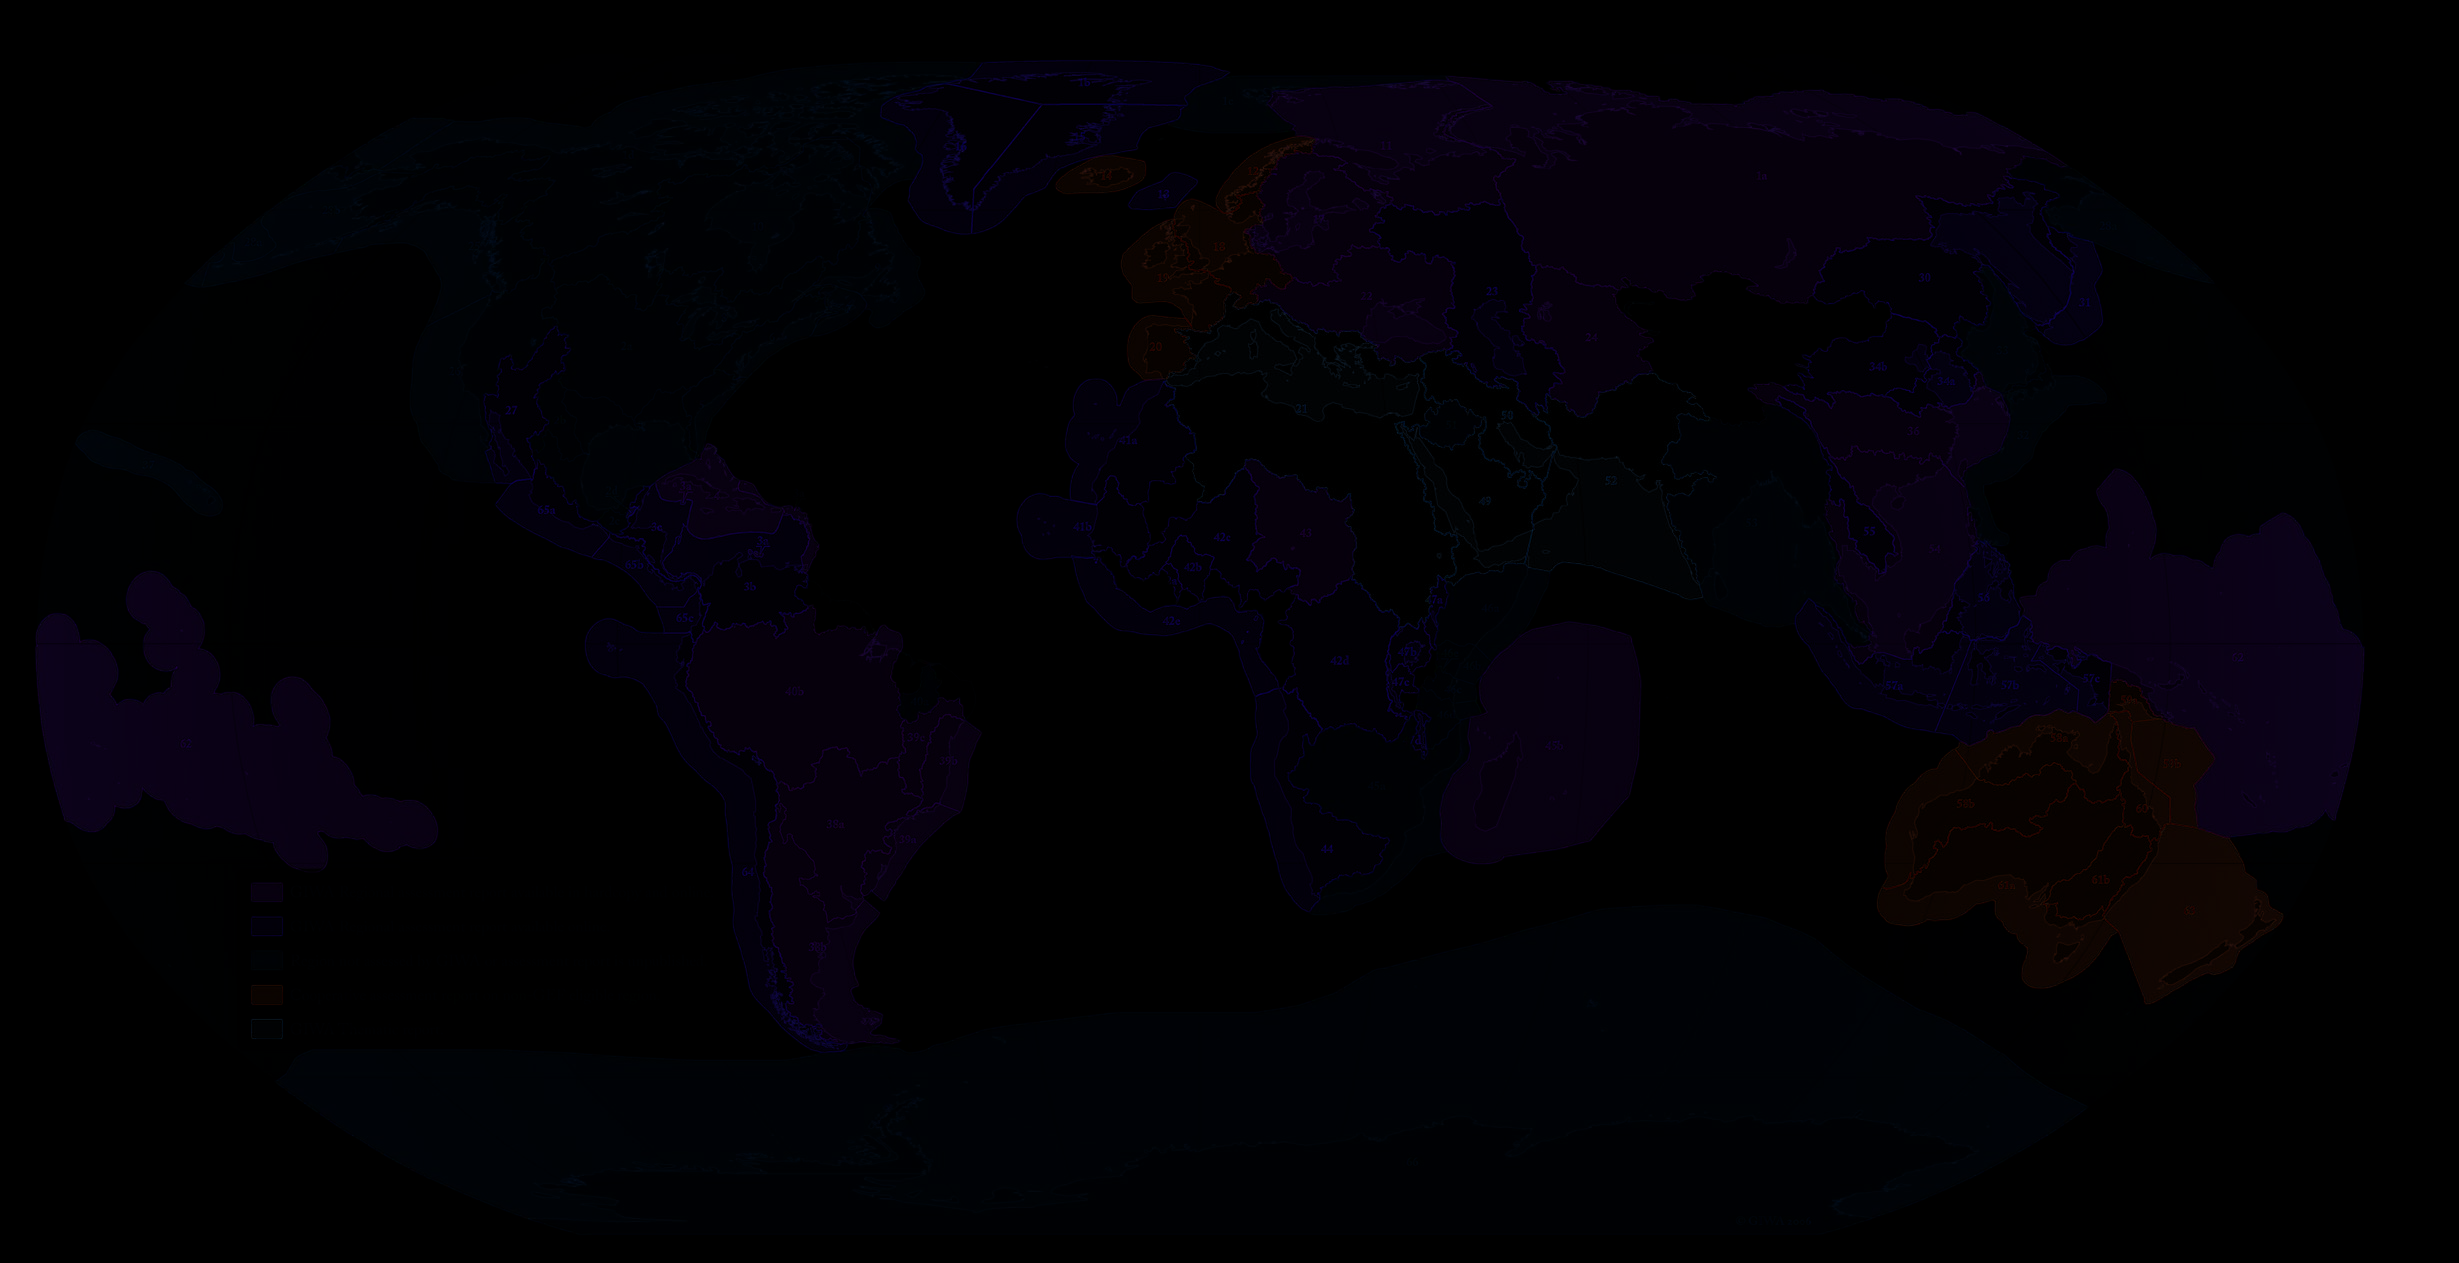
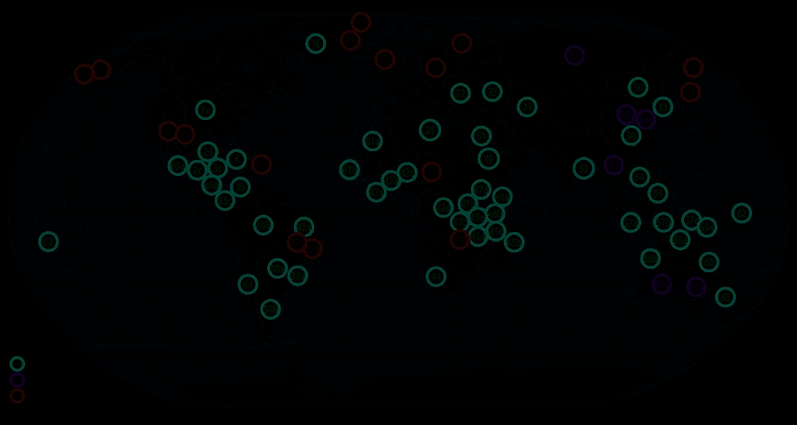
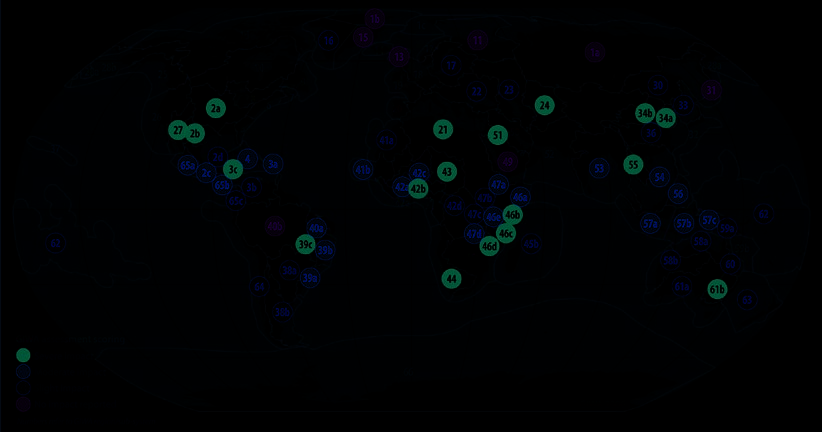
GIWA REGIONS AND SUBSYSTEMS
1a Russian Arctic
10 Baffin Bay, Labrador Sea, Canadian Archipelago 27 Gulf of California
40b Amazon
47a East African Rift Val ey Lakes (Lake Turkana)
59a Coral Sea Basin (South PNG and Papua)
1b Arctic Greenland
11 Barents Sea
28a Bering Sea (West Bering Sea)
41a Canary Current (North)
47b East African Rift Val ey Lakes (Lake Victoria)
59b Coral Sea Basin (Coral Sea)
1c Arctic European/Atlantic
12 Norwegian Sea
28b Bering Sea (East Bering Sea)
41b Canary Current (South)
47c East African Rift Val ey Lakes (Lake Tanganyika) 60 Great Barrier Reef
1d Arctic North American
13 Faroe Plateau
30 Sea of Okhotsk
42a Guinea Current (Comoe Basin)
47d East African Rift Val ey Lakes (Lake Malawi)
61a Great Australian Bight
2a Gulf of Mexico (Mississippi River)
14 Iceland Shelf
31 Oyashio Current
42b Guinea Current (Volta Basin)
49 Red Sea and Gulf of Aden
61b Great Australian Bight (Muray Darling Basin)
2b Gulf of Mexico (Rio Grande/Rio Bravo)
15 East Greenland Shelf
32 Kuroshio Current
42c Guinea Current (Niger Basin)
50 e Gulf
62 Pacific Islands
2c Gulf of Mexico (Usumacinta/Grijalva)
16 West Greenland Shelf
33 Sea of Japan
42d Guinea Current (Congo Basin)
51 Jordan
63 Tasman Sea
2d Gulf of Mexico (Rio Hondo/Chetumal Bay)
17 Baltic Sea
34a Yel ow Sea (Yel ow Sea)
42e Guinea Current LME
52 Arabian Sea
64 Humboldt Current
3a Caribbean Sea (Small Islands)
18 North Sea
34b Yel ow Sea (Bohai Sea)
43 Lake Chad
53 Bay of Bengal
65a Eastern Equatorial Pacific (Southwest Mexico)
3b Caribbean Sea (Orinoco/Magdalena/Catatumbo) 19 Celtic-Biscay Shelf
36 East China Sea
44 Benguela Current
54 South China Sea
65b Eastern Equatorial Pacific (Central Equatorial Pacific)
3c Caribbean Sea (Central America/Mexico)
20 Iberian Coastal Sea
37 Hawai an Archipelago
45a Agulhas Current
55 Mekong River
65c Eastern Equatorial Pacific (Pacific Colombian)
4 Caribbean Islands
21 North Africa and Nile River Basin
38a Patagonian Shelf (La Plata River Basin)
45b Indian Ocean Islands
56 Sulu-Celebes Sea
66 Antarctic
5 Southeast Shelf
22 Black Sea
38b Patagonian Shelf (South Atlantic Drainage System) 46a Somali Coastal Current (Juba/Shebel e)
57a Indonesian Seas (Sunda)
6 Northeast Shelf
23 Caspian Sea
39a Brazil Current (South/Southeast Atlantic Basins) 46b Somali Coastal Current (Tana/Athi/Sabaki)
57b Indonesian Seas (Wal acea)
7 Scotian Shelf
24 Aral Sea
39b Brazil Current (East Atlantic Basins)
46c Somali Coastal Current (Wami/Ruvu/Pangani)
57c Indonesian Seas (Sahul)
8 Gulf of St Lawrence
25 Gulf of Alaska
39c Brazil Current (Săo Francisco River Basin)
46d Somali Coastal Current (Rufiji/Ruvuma)
58a North Australian Shelf (Wet Tropics)
9 Newfoundland Shelf
26 California Current
40a Northeast Brazil Shelf
46e Somali Coastal Current (Lake Jipe/Chala)
58b North Australian Shelf (Dry Tropics)
GLOBAL INTERNATIONAL
WATERS ASSESSMENT
InCthealenges to
Re r
gi n
onaa
l t
Asiso
ess n
me a
ntsl W
in a Gl a
ob t
al e
P r
erss
pective
THE GIWA FINAL REPORT

CONTENTS
3
Global International Waters Assessment
Chal enges to International Waters Regional Assessments in a Global Perspective
Published by the United Nations Environment Programme in collaboration with
GEF, the University of Kalmar and the Municipality of Kalmar, Sweden, and the
Governments of Sweden, Finland, and Norway.
© 2006 United Nations Environment Programme
ISBN 91-89584-47-3
UNEP/GCSS.IX/INF/9
To obtain copies of this publication or further information, please contact:
Division of Early Warning and Assessment
United Nations Environment Programme
PO Box 30552
Nairobi 00100, Kenya
Tel: +254 20 762-4299
Fax: +254 20 762-4269
Email: dewainfo@unep.org
is publication may be reproduced in whole or in part and in any form for educational
or non-profit purposes without special permission from the copyright holder, provided
acknowledgement of the source is made. No use of this publication may be made for
resale or for any other commercial purpose whatsoever without prior permission in
writing from the United Nations Environment Programme. Applications for such
permission, with a statement of the purpose and extent of the reproduction, should be
addressed to the Director, DCPI, UNEP, P.O. Box 30552, Nairobi, Kenya.
CITATION
When citing this report, please use:
UNEP, 2006. Chal enges to International Waters Regional Assessments in a Global
Perspective. United Nations Environment Programme, Nairobi, Kenya.
DISCLAIMER
e views expressed in this publication are those of the authors and do not necessarily
reflect those of UNEP. e designations employed and the presentations do no imply
the expressions of any opinion whatsoever on the part of UNEP or cooperating agencies
concerning the legal status of any country, territory, city or areas or its authority, or
concerning the delimitation of its frontiers or boundaries.
is publication has been peer-reviewed and the information herein is believed to be
reliable, but the publisher does not warrant its completeness or accuracy.
Printed and bound in Kalmar, Sweden by Sunds Tryck Öland AB.
Printed on recycled paper.

CONTENTS
3
Contents
PREFACE . . . . . . . . . . . . . . . . . . . . . . . . . . . . . . . . . . . . . . . . . . . . . . . . . . . . . . . . . . . . . . . . 5
EXECUTIVE SUMMARY . . . . . . . . . . . . . . . . . . . . . . . . . . . . . . . . . . . . . . . . . . . . . . . . . . . 7
ACKNOWLEDGEMENTS . . . . . . . . . . . . . . . . . . . . . . . . . . . . . . . . . . . . . . . . . . . . . . . . . 13
INTRODUCTION . . . . . . . . . . . . . . . . . . . . . . . . . . . . . . . . . . . . . . . . . . . . . . . . . . . . . . . . 15
FRESHWATER SHORTAGE . . . . . . . . . . . . . . . . . . . . . . . . . . . . . . . . . . . . . . . . . . . . . . . 18
Environmental and socio-economic impacts. . . . . . . . . . . . . . . . . . . . . . . . . . . . . . . . . . . . . . . . . . . . . . . . . . . . . . . . . . . . . . . . 20
Root causes . . . . . . . . . . . . . . . . . . . . . . . . . . . . . . . . . . . . . . . . . . . . . . . . . . . . . . . . . . . . . . . . . . . . . . . . . . . . . . . . . . . . . . . . . . . . 29
Policy relevant conclusions. . . . . . . . . . . . . . . . . . . . . . . . . . . . . . . . . . . . . . . . . . . . . . . . . . . . . . . . . . . . . . . . . . . . . . . . . . . . . . . 33
POLLUTION . . . . . . . . . . . . . . . . . . . . . . . . . . . . . . . . . . . . . . . . . . . . . . . . . . . . . . . . . . . . 36
Environmental and socio-economic impacts . . . . . . . . . . . . . . . . . . . . . . . . . . . . . . . . . . . . . . . . . . . . . . . . . . . . . . . . . . . . . . . 40
Root causes . . . . . . . . . . . . . . . . . . . . . . . . . . . . . . . . . . . . . . . . . . . . . . . . . . . . . . . . . . . . . . . . . . . . . . . . . . . . . . . . . . . . . . . . . . . . 47
Policy relevant conclusions. . . . . . . . . . . . . . . . . . . . . . . . . . . . . . . . . . . . . . . . . . . . . . . . . . . . . . . . . . . . . . . . . . . . . . . . . . . . . . . 51
OVERFISHING AND OTHER THREATS TO AQUATIC LIVING RESOURCES . . . . 54
Environmental and socio-economic impacts. . . . . . . . . . . . . . . . . . . . . . . . . . . . . . . . . . . . . . . . . . . . . . . . . . . . . . . . . . . . . . . . 58
Root causes . . . . . . . . . . . . . . . . . . . . . . . . . . . . . . . . . . . . . . . . . . . . . . . . . . . . . . . . . . . . . . . . . . . . . . . . . . . . . . . . . . . . . . . . . . . . 63
Policy relevant conclusions. . . . . . . . . . . . . . . . . . . . . . . . . . . . . . . . . . . . . . . . . . . . . . . . . . . . . . . . . . . . . . . . . . . . . . . . . . . . . . . 67
HABITAT AND COMMUNITY MODIFICATION . . . . . . . . . . . . . . . . . . . . . . . . . . . . . 70
Environmental and socio-economic impacts. . . . . . . . . . . . . . . . . . . . . . . . . . . . . . . . . . . . . . . . . . . . . . . . . . . . . . . . . . . . . . . . 73
Root causes . . . . . . . . . . . . . . . . . . . . . . . . . . . . . . . . . . . . . . . . . . . . . . . . . . . . . . . . . . . . . . . . . . . . . . . . . . . . . . . . . . . . . . . . . . . . 80
Policy relevant conclusions. . . . . . . . . . . . . . . . . . . . . . . . . . . . . . . . . . . . . . . . . . . . . . . . . . . . . . . . . . . . . . . . . . . . . . . . . . . . . . . 82
CONCLUSIONS . . . . . . . . . . . . . . . . . . . . . . . . . . . . . . . . . . . . . . . . . . . . . . . . . . . . . . . . . 86
REFERENCES . . . . . . . . . . . . . . . . . . . . . . . . . . . . . . . . . . . . . . . . . . . . . . . . . . . . . . . . . . . 92
ACRONYMS . . . . . . . . . . . . . . . . . . . . . . . . . . . . . . . . . . . . . . . . . . . . . . . . . . . . . . . . . . . . 93
ANNEXES . . . . . . . . . . . . . . . . . . . . . . . . . . . . . . . . . . . . . . . . . . . . . . . . . . . . . . . . . . . . . . 94
Annex I: Global International Waters As es ment Origin, objectives, workplan, teams and products . . . . . . . . . . . . . . 95
Annex II: GIWA methodology . . . . . . . . . . . . . . . . . . . . . . . . . . . . . . . . . . . . . . . . . . . . . . . . . . . . . . . . . . . . . . . . . . . . . . . . . 103
Annex III: GIWA's key: Causal chain and policy options analysis in a theoretical perspective . . . . . . . . . . . . . . . . . . . . 113
Annex IV: Matrix of GIWA Concerns . . . . . . . . . . . . . . . . . . . . . . . . . . . . . . . . . . . . . . . . . . . . . . . . . . . . . . . . . . . . . . . . . . . 121


PREFACE
5

PREFACE
5
Preface
Clean water and the many products and services of aquatic
Sound scientific assessments of the current state of all
ecosystems are necessities for human welfare. Water connects
freshwater and coastal marine resources and their aquatic
human societies and ecological systems by providing food
ecosystems;
and energy. e hydrological cycle maintains the health and
Informed dialogue between governments, stakeholders
stimulates the productivity and diversity of all ecosystems.
and experts, based on the assessments;
Wherever rivers, lakes and aquifers, as well as coastal
Technological support and capacity enhancement; and
current systems and marine fish stocks, are shared by two or
Adequate financing for projects and programmes related
more nations, these transboundary resources are interlinked
to water resources and aquatic ecosystems.
by a complex web of environmental, political, economic and
security interdependencies. roughout history, while water
In recognition of these needs, UNEP has implemented the
has general y been shared peaceful y, competition for scarce
Global International Waters Assessment (GIWA) project,
water resources can invoke conflict between nations sharing
funded by the Global Environment Facility (GEF) and by
international waters. Today, global trade, migration and tour-
national donors, in particular Nordic countries. GIWA is a
ism, as well as global climate change, have created worldwide holistic and global y comparable assessment of the world's
dimensions to many water related issues.
transboundary waters, based on the recognition that inextri-
Over the past 20 years, the international community
cable links exist between the freshwater and coastal marine
has increasingly recognised and asserted the urgent need for
environment. GIWA integrates environmental and socio-
concerted actions to reverse the negative societal trends that
economic information to determine the impacts of a broad
adversely affect the world's aquatic systems and to achieve
range of influences on the world's aquatic environment. A
sustainability in the use of water resources.
global perspective of the world's transboundary waters was
Short-term commercial interests are often prioritised
achieved by conducting regional assessments in many of the
over long-term sustainable development. is is due to the
major international drainage basins and marine shelf eco-
false assumption that environmental protection and sus-
systems. e project focused on developing regions, regions
tainability can only be achieved at the expense of economic
with economies in transition and smal island states eligible
development and social wel -being. On the contrary, by in-
for funding by the GEF. GIWA identifies the priority concerns
vesting in environmental improvements significant economic
of each region, determines their societal root causes and, in
returns can be achieved through, for example, increased
most regions, considers options to resolve or mitigate these
ecosystem and resource productivity, improvements in public
causes.
health and poverty al eviation. Sustainable development is
In addition to GIWA regional assessment reports, the
only possible by enhancing environmental management.
project developed a new assessment methodology and ad-
Achieving sustainability in international waters re-
opted a bottom-up approach involving multidisciplinary
quires the development and implementation of practical
regional teams. About 1 500 experts from around the world
policies within an ecosystem-based management framework,
conducted the assessments in col aboration with the GIWA
including the fol owing components:
Core team, hosted by the University of Kalmar, Sweden. e
Political and societal commitments to tackle water-related
GIWA approach can serve as a platform for further assess-
chal enges in a concerted and cooperative manner;
ments and for the surveil ance of aquatic systems.


CHALLENGES TO INTERNATIONAL WATERS: REGIONAL ASSESSMENTS IN A GLOBAL PERSPECTIVE
6
is GIWA Final Report provides a global synthesis of the methodology and its theoretical background. It also acknowl-
GIWA regional assessments. e multitude of aquatic trans-
edges the regional teams, focal points and core team who have
boundary environmental problems are discussed under the
contributed considerable effort towards this global assessment.
concerns of freshwater shortage, pol ution, overfishing and
Policy makers at al levels of government, global and re-
habitat modification. e report summarises the current and
gional non-governmental organisations, and other stakeholders
predicts the future state of transboundary water resources and
involved in the use, development and management of trans-
associated aquatic ecosystems, the societal root causes and
boundary water basins and their aquatic resources wil find the
driving forces that engender adverse environmental pressures,
results of this global synthesis invaluable.
and the causal relationships that underpin the deterioration of
It is my hope that "Chal enges to International Waters
aquatic environments and their resources. e report identifies
Regional Assessments in a Global Perspective" wil assist in
gaps in knowledge and presents conclusions relevant to the sus-
the development of a roadmap to environmental sustainability
tainable management of transboundary waters. is final re-
and wil inspire actions necessary to overcome the global chal-
port of the GIWA project, includes annexes describing the GIWA
lenges to aquatic resources and ecosystems.
Klaus Toepfer
United Nations Under-Secretary General and
Executive Director, United Nations Environment Programme

EXECUTIVE SUMMARY
7
Executive summary
e Global International Waters Assessment (GIWA) project
Pol ution
is a holistic and global y comparable assessment of trans-
Transboundary pol ution has a moderate or severe impact in
boundary aquatic resources in the majority of the world's
more GIWA regions than any other concern, and also has by
international river basins and their adjacent seas, particularly
far the gravest impact on human health. Pol ution is mainly
in developing regions. A bottom-up and multidisciplinary
concentrated in inland and nearshore systems. e most criti-
approach was adopted that involved nearly 1 500 natural and
cal transboundary pol ution issue is suspended solids, causing
social scientists from around the world. e GIWA project
the greatest impact in Latin America, Southeast Asia and
provides strategic guidance to the Global Environment Facil-
Sub-Saharan Africa. Large-scale land-use changes, including
ity (GEF) by identifying priorities for remedial and mitigatory
infrastructure development, deforestation and agriculture,
actions in international waters.
have increased the sediment load of international waters.
e present Final Report presents the major results and
Eutrophication has its most severe transboundary im-
findings of the GIWA regional assessments.
pacts in Europe & Central Asia and Northeast Asia. Ag-
On a global scale, GIWA has confirmed that pressures
ricultural run-off was identified as the primary cause, but
from human activities have weakened the ability of aquatic
the tremendous growth of aquaculture in several East Asian
ecosystems to perform essential functions, which is compro-
regions has also become a factor. Oxygen-depleted zones, an
mising human wel -being and sustainable development. e
extreme result of eutrophication, are now present not only in
complex interactions between mankind and aquatic resources enclosed seas, such as the Baltic Sea and the Black Sea, but
were studied within four specific major concerns: freshwa-
also in large coastal areas which have international y impor-
ter shortage, pol ution, overfishing and habitat modification.
tant fisheries. Global y, harmful algal blooms are consider-
Global change is considered as a fifth concern which over-
ably more widespread and frequent than they were a decade
arches the other four. It is clear that the five GIWA trans-
ago, a situation that is expected to further deteriorate by 2020
boundary concerns are serious worldwide problems that are
due to the increased application of agricultural fertilizers, es-
expected to increase in severity by 2020.
pecial y in Asia and Africa.
TABLE 1. TOP PRIORITY FOR THE GIWA CONCERNS BY MEGA REGION
North Africa
Australia &
Mega region
Arctic Rim
Europe &
Central
South
Sub-Saharan
Northeast
Southeast
Central Asia
America
America
Africa
& Middle
Pacific
East
Asia
Asia
Islands
Number of regions and
sub-systems assessed
Freshwater shortage
Pol ution
Overfishing and other threats to
aquatic living resources
Habitat and community
modification
Global change


CHALLENGES TO INTERNATIONAL WATERS: REGIONAL ASSESSMENTS IN A GLOBAL PERSPECTIVE
8
EXECUTIVE SUMMARY
9
Microbial pol ution is of particular concern in the
Salinisation was revealed by the regional assessments
freshwater ecosystems of tropical developing countries, but
to be more widespread and severe than is general y perceived.
is also widespread in Large Marine Ecosystems (LMEs) with
Reduced stream flow, inappropriate irrigation practices and
densely populated coasts. Microbial pol ution is projected to
overabstraction of groundwater have increased the salinity
increase due to population growth and urbanisation outpac-
of freshwater throughout the world. As a result, agricultural
ing the provision of sewage treatment facilities.
land is becoming too saline to support important crops, and
Chemical pol ution is also an issue of global impor-
salinisation has made many aquifers unsuitable as a source of
tance, inflicting moderate to severe impacts in more than half water for drinking and certain economic purposes.
of the regions assessed.
In arid and semi-arid areas, water shortages are pre-
Overal , pol ution is slight to moderate in most of the
dicted to be the most significant constraint for socio-eco-
LMEs, with severe pol ution limited to localised hotspots
nomic development. Global climate change will only exacer-
usual y found in close proximity to point sources of pol-
bate this problem. e most frequent socio-economic impacts
lution, such as sewage and industrial effluent outfal s and
resulting from freshwater shortages are the displacement of
river mouths, as well as in areas with limited water circula-
people, declines in fisheries production and reduced supply of
tion, such as semi-enclosed bays. Sea-based pol ution is most
potable water.
prevalent in LMEs with a high concentration of oil and gas
e progress being made to meet the Mil ennium De-
industries, and shipping activities.
velopment Goal (MDG) of halving the proportion of people
without access to safe drinking water and basic sanitation by
Freshwater shortage
2015 is a critical freshwater indicator. With 83 of the world's
e overabstraction of water resources is resulting in the dry-
population having access to safe water, the international
ing up of rivers, lakes and aquifers, leading to water shortages community, overal , is on track to meet the drinking water
in many GIWA regions. For Sub-Saharan Africa, it is un-
goal, with East Asia making the greatest progress. e MDG
doubtedly the top priority.
sanitation target is less likely to be achieved, with Sub-Saha-
In arid regions, in particular, water diversions lead to
ran Africa and South Asia making the least progress.
significant reductions in crucial low flow periods. e regula-
tion of stream flow by reservoirs changes natural water re-
Overfishing and other threats to aquatic living resources
gimes. In many GIWA regions these changes adversely affect
Overexploitation of living resources was assessed as severe in
the productivity of downstream wetland ecosystems and sub-
more GIWA regions than any other GIWA issue. On a trans-
sequently the provision of their goods and services. e re-
boundary scale, large commercial fishing fleets are the major
duction in water inflow to enclosed water bodies can dramat-
contributors to the problem, exploiting specific transbound-
ical y alter their ecosystems. For example, in the Aral Sea/24, ary straddling and migratory stocks. However, the majority
water abstraction has reduced the volume of the sea by 60.
of fisheries in LMEs assessed by GIWA, especial y in the trop-
e overexploitation of water resources and changes in
ics, are artisanal. ey mostly operate on a geographical y re-
river basin hydrodynamics are largely attributed to the agri-
stricted scale, overexploiting many easily accessible nearshore
cultural sector, principal y as a result of water impoundment
species. A common environmental impact from overfishing
by dams and groundwater abstraction for irrigation, defores-
is `fishing down the food web', whereby fishers exhaust large
tation and drainage of wetlands to expand agricultural areas
predator populations, distorting the food web and forcing
and inappropriate agricultural land-use practices. About 70
fishers to target smal er, less valuable species.
of all abstracted water is utilised by irrigated agriculture, and
e environmental impacts of destructive fishing prac-
since many developing countries expect agriculture to be the
tices, including blast and poison fishing as well as bottom
main sector driving economic growth, water scarcity is likely
trawling in sensitive areas, are severe in most parts of the
to become an even greater problem in the future. Regions ex-
world. e issue of excessive by-catch and discards is most
periencing freshwater scarcity often also face severe pol ution, critical in Southeast Asia and South America. Discards rep-
further intensifying water stress.
resent an extraordinary waste of protein resources, with up to
90 of catches taken by shrimp trawlers thrown overboard.


CHALLENGES TO INTERNATIONAL WATERS: REGIONAL ASSESSMENTS IN A GLOBAL PERSPECTIVE
8
EXECUTIVE SUMMARY
9
With more than 200 mil ion people relying on fisher-
invasive species are the other major modifiers of freshwa-
ies for their livelihood and over 1 bil ion people depending on ter habitats. Alien species are known to have impacted the
fisheries for their protein supply, the world cannot achieve the structure of both marine and freshwater communities in
MDG of hunger eradication without improving fisheries man-
almost half of the GIWA regions, but many more remain un-
agement. Inadequate fisheries statistics hamper reliable stock
detected.
assessments and prevent effective fisheries management, par-
In Southeast Asia, coral reefs have been seriously
ticularly in developing regions. e socio-economic impacts
degraded by destructive fishing practices and coastal land
of fisheries mismanagement are dramatic. e overexploi-
reclamation. Mangrove forests are threatened by increased
tation of artisanal fisheries has the most detrimental social
demand for timber, coastal development and aquaculture in
impacts, as the communities that depend on these fisheries
Central America (the Caribbean), South America, Southeast
frequently have no alternative livelihoods, and malnutrition
Asia and Sub-Saharan Africa. e rate of mangrove destruc-
often fol ows.
tion exceeds even that of tropical rainforests.
Aquaculture, which has been expanding rapidly for
Modification of habitats is particularly severe in tropi-
more than a decade, will supply an ever-increasing share of
cal LMEs, especial y in Central America, East Africa and
the global fish market. e question remains whether aqua-
Southeast Asia. Direct conversion of habitats for urban and
culture will be undertaken in a sustainable manner. e GIWA industrial development, mariculture, dredging, unsustain-
assessments from Southeast Asia indicate otherwise; hun-
able harvesting, poor land use practices in adjacent drainage
dreds of thousands of hectares of mangrove forest have been
basins, and pol ution are among the major causes of coastal
converted to fishponds since 1990.
and marine habitat modification. Transboundary effects are
Overexploitation of fish is general y expected to inten-
not uncommon, particularly if the habitats are nursery and
sify as a result of human population growth and an increasing spawning grounds for commercial y important migratory
demand for seafood, coupled with a continued lack of imple-
fishes, marine mammals and birds.
mentation and enforcement of regulations. On the other
Focusing on the critical tropical habitat of coral reefs,
hand, the situation in some regions studied by GIWA, par-
the GIWA regional assessments found degradation in all the
ticularly in Northeast Asia and Central America, is expected
tropical LMEs. Climate change, particularly increasing sea
to improve by 2020 due to the development and adoption of
surface temperatures causing coral bleaching, has emerged as
more sustainable fisheries practices.
potential y the greatest single threat to coral reefs.
Habitat and community modification was most fre-
Habitat and community modification
quently identified as the priority concern in Northeast Asia
e world's aquatic habitats have been extensively modified,
and South America. Socio-economic impacts included loss
particularly on land, with a consequential reduction in bio-
of fisheries and tourism revenues, greater unemployment,
diversity and an alteration of community structures in many
and the costs of mitigation and treatment actions, e.g. water
regions throughout the world. Hydropower, drinking water,
treatment and control of invasive species.
irrigation and flood mitigation are the major benefits of dams
and other structures that modify stream flow. is water in-
Linkages between the GIWA concerns
frastructure, however, is the single largest driver of habitat
including global change
modification in the world's rivers and a major factor affecting e GIWA regional reports frequently note the negative syner-
lake habitats. For example, in the Euphrates and Tigris River gies between the concerns, including global change. Consid-
Basin/50 more than 50 of the Mesopotamian wetlands have
ering the close links between many of the GIWA issues, habi-
dried out as a result of upstream water impoundment. e
tat and community modification could often be considered a
damming of rivers can also decrease sediment transport to
`downstream' consequence of the impacts of the other GIWA
estuaries, leading to additional coastal erosion and reduced
concerns. Frequently, freshwater habitats are radical y altered
productivity in marine ecosystems.
by changes in stream flow and nutrient transport resulting
Land-use change (mainly the conversion of forests
from the construction of dams and other structures. In ma-
and wetlands to agricultural land) and the introduction of
rine areas, overfishing has changed food webs and destructive


CHALLENGES TO INTERNATIONAL WATERS: REGIONAL ASSESSMENTS IN A GLOBAL PERSPECTIVE
10
EXECUTIVE SUMMARY
11
fishing has destroyed coastal habitats of high productivity
bination with inadequate water and wastewater infrastruc-
and biodiversity. Pol ution, mainly from agricultural run-off,
ture, often leads to water shortages. From a consumption
industrial effluents and domestic wastes, impacts both fresh-
perspective, rising income levels are expected to increase fish
water and marine systems.
consumption at nearly twice the rate of population growth in
Linkages are present in most regions and aquatic sys-
Asia.
tems. In Lake Victoria the introduction of Nile perch (Lates
niloticus), in combination with eutrophication and unsustain-
Agricultural development and economic growth
able fishing, has led to the extinction of several hundred spe-
GIWA regional teams identified expansion in the agricultural
cies of cichlid fish, the largest recorded vertebrate extinction.
sector, and in particular irrigation, as the most significant
On a broader scale, suspended solids, eutrophication, over-
cause of the transboundary concerns of freshwater shortage,
exploitation and destructive fishing practices are degrading
pol ution, overfishing and habitat modification. e environ-
seagrasses and coral habitats in tropical marine regions. e
mental impacts associated with agriculture include eutrophi-
socio-economic impacts from these negative synergies often
cation stimulated by fertilizer run-off, suspended solids from
spiral into increasing local poverty, declining health stan-
increased erosion fol owing forest colonisation, and stream
dards and growing conflict.
flow modification to provide water for irrigation. Global y,
Recent mass coral bleaching events related to the El
there has been an increased demand for agricultural products
Nińo Southern Oscil ation are the most dramatic example
and a trend towards more water-intensive food, such as meat
of climate change affecting a specific type of ecosystem on
rather than vegetables, and fruits rather than cereals. Many
a global scale. In future climate change scenarios, highly
developing countries also see the development of agriculture
productive fisheries associated with climate mode-driven
as the main engine for economic growth.
upwel ing are at serious risk. At the regional level, freshwa-
With nearly one-third of agricultural water used to
ter availability wil be affected by climate-induced changes
produce export crops, trade is a critical factor. Several GIWA
to precipitation patterns, increasing in some regions, such as regional reports from Sub-Saharan Africa note that trade
Southeast Asia, and decreasing in others, such as the sub-
has increased the production of water-demanding crops,
tropics. Higher temperatures wil result in greater evapora-
putting additional stress on water resources and the environ-
tion rates, thus threatening freshwater supplies and trig-
ment.
gering additional droughts in arid and semi-arid regions.
It is clear that irrigation wil continue to expand, under-
Furthermore, climate change is expected to intensify the
scoring the need to increase efficiencies in water use and de-
effects of pol ution, including an increase in the size and
velop new approaches to demand management. e concept of
duration of oxygen-depleted zones. Rising sea levels are an-
virtual water may be an important tool for understanding and
ticipated to increase saline intrusion in coastal aquifers and
mitigating the impact of trade on water resources.
cause saltwater to reach further upstream in rivers. ese
Water management policies have traditional y fo-
expected changes are driven by major alterations in the
cused on water supply and ignored demand management.
global hydrological cycle, and may have severe impacts on
e freshwater shortages experienced in rapidly developing
human wel -being. While few GIWA regional teams identi-
regions, such as Southeast Asia, il ustrate the need to prevent
fied global change as their top priority at present, the major-
water demand from growing in lockstep with economic de-
ity predicted that this concern would become more serious
velopment.
by 2020.
Lack of knowledge and public awarenes
Root causes
Detailed knowledge of resource stocks and yields, as well as
Population growth
demand patterns, is often deficient, particularly in develop-
Population growth is an important root cause of all water-
ing countries. Aquifers represent the largest information
related concerns. e world's growing population is increas-
gap, which is an increasingly significant hindrance for effec-
ing water stress. In Africa, for example, even though water
tive water management given the growing dependence on
consumption per capita is low, population growth, in com-
groundwater.


CHALLENGES TO INTERNATIONAL WATERS: REGIONAL ASSESSMENTS IN A GLOBAL PERSPECTIVE
10
EXECUTIVE SUMMARY
11
e dynamics of fish populations, especial y in devel-
these fishers frequently adopt destructive fishing practices,
oping countries, are frequently unknown. In the industrial
putting further pressure on beleaguered fisheries, and ul-
fisheries sector, inaccurate information, in combination with
timately reducing household income, nutrition and health
political and societal pressure to maintain fishing effort, has
levels.
led to overexploitation and the col apse of many fisheries.
Public awareness of environmental problems is rather
Policy failures
rudimentary at all levels of society in most developing regions Policy failures commonly result from the inability of institu-
as well as in many developed countries. Education and con-
tions to perform three key functions: (i) recognise signals
sumer information are required everywhere, from rural to
of a problem and agree on its nature; (i ) reach agreements
urban communities and from primary schools to universities.
that balance the interests of stakeholders both within and in
e GIWA regional teams also highlighted the need for far
other countries; and (i i) implement and enforce these agree-
broader multi-disciplinary, institutional and public/private
ments.
sector communication in the management of international
e first function is hindered by knowledge deficiencies
waters. e strengthening of professional capacity is impor-
regarding aquatic resources and a lack of public awareness of
tant, not only for research and teaching but also for policy
their impact on aquatic ecosystems. Common indicators are
making and management.
needed to monitor the state of ecosystems and their interac-
tions with human activities. International cooperation is con-
Market failures
strained in many regions by the fact that politicians and other
roughout the world, most production inputs are under-
leaders do not even recognise aquatic systems and resources
priced compared with their full social and environmental
as being transboundary.
costs. An egregious example is blast fishing, where the in-
Even when reliable information is available, environ-
vestment of one dol ar for dynamite can generate an imme-
mental considerations or broad stakeholder involvement are
diate 200-fold return for the local fishermen, but leaves a
often disregarded in the decision-making process. Institu-
devastated reef that takes 50 years to recover. While devel-
tions responsible for specific sectors, such as fisheries, ag-
oped countries have made some progress in reducing input
riculture or transportation, general y dismiss concerns that
subsidies, both developed and developing countries still com-
transcend their limited sectoral goals.
monly offer large subsidies on, for example, electricity, fuel,
Within most parts of the world, regional initiatives
pesticides, fisheries and infrastructure. Political will to reduce aimed at improving environmental management have been
inappropriate subsidies often fails in the face of potential job
developed. ese include the ratification of a number of in-
losses, lobbying by industry, and corruption.
ternational environmental conventions and the adoption of
Historical y, water was regarded as an infinite and free
several non-binding frameworks. However, implementa-
resource; consequently, water is commonly underpriced in
tion and enforcement of agreements frequently fail due to:
many GIWA regions, particularly in the agricultural sector,
(i) weak human and financial resources; (i ) a lack of political
encouraging waste and discouraging infrastructure invest-
commitment; (i i) weak institutional frameworks; (iv) inad-
ment. Ecosystem goods and services are insufficiently valu-
equate information; (v) corruption; and, to a lesser extent, (vi)
ated or considered when formulating development strategies.
inappropriate regulations.
Many regional reports note that a key to improving manage-
Given the difficulty in reaching and implementing
ment is to stop focusing only on the direct economic benefits
agreements at the national level it is not surprising that ef-
of engineered structures, and to evaluate their long-term en-
forts to establish transboundary policies, let alone manage-
vironmental, economic and social benefits and costs.
ment, remains an elusive goal in most regions. Weak inter-
It is the very nature of common pool resources, such
national and regional commissions are testament to this fact,
as the fisheries, that it is difficult to exclude newcomers, who
but there are success stories in both developed and developing
have no knowledge of the resource they seek to exploit. A vi-
regions, notably in fishery regulations and in water manage-
cious spiral can begin, where increasing numbers of fishers
ment in several major river systems.
chase smal er fish populations. To boost their meagre catches,

CHALLENGES TO INTERNATIONAL WATERS: REGIONAL ASSESSMENTS IN A GLOBAL PERSPECTIVE
12
Response options
need to be implemented gradual y, but these changes will
e United Nations Convention on the Law of the Non-
vary widely on a regional rather than on a national scale. To
navigational Uses of International Watercourses provides
implement such policies it is necessary to raise both public
a framework for intergovernmental river basin agreements.
and political awareness of the importance of addressing water
Although there have been positive developments in recent
concerns and the associated socio-economic impacts. Such
decades, only one third of the world's transboundary basins
initiatives must be based on sound knowledge and multidis-
have established treaties, basin commissions or other forms
ciplinary efforts, like GIWA, where the natural and the social
of cooperative management frameworks. Even where inter-
sciences are united in a joint endeavour.
governmental agreements exist, they seldom address today's
In the marine environment, the fishing industry over-
chal enges to water management.
exploits the majority of living resources and degrades marine
Policy options cannot be confined to actions that target habitats, resulting in a loss of biodiversity and changes in
natural and physical processes but should consider the human community structure. Given the inability of past responses
dimensions of water use as wel . Policy measures must there-
to halt the degradation of marine ecosystems, the concept of
fore be formulated to address the local situation. At the same
ecosystem-based management is increasingly adopted for the
time, it remains important to develop broad themes for devis-
management of LMEs with support from the GEF. Ecosystem-
ing policies and basin-wide management for the sustainable
based management requires the implementation of a com-
use of transboundary rivers.
bination of measures, including precautionary catch regula-
First and foremost, it is necessary to reduce the impacts tions, the introduction of sustainable rather than destructive
of water scarcity and habitat degradation by developing inter-
fishing methods, the reduction of fishing effort and the re-
national governance frameworks for equitable water al oca-
form of subsidies. Marine parks and zones which temporarily
tion in accordance with the above-mentioned Convention.
close or restrict access to fishers and other marine activities
Disputes and conflicts over water use can only be resolved
can protect sensitive habitats.
through common strategies and commitments between up-
Many of the GIWA regional teams have recognised that
stream and downstream countries. An integrated approach
ecosystem-based management, including integrated coastal
linking water management to land management and eco-
zone management, is an effective policy response for halt-
nomic management is also needed.
ing or reversing the degradation of large marine and limnic
Improved policies and pricing, particularly for achiev-
ecosystems.
ing increased user efficiency and socio-economic benefits,

ACKNOWLEDGEMENTS
13
Acknowledgements
is publication would have been impossible without the hard work and unwavering ded-
ication of a large number of scientists and experts in the GIWA network. Over 1 500 ex-
perts around the world have contributed most of the data and analyses in the regional and
thematic assessments which were used as a basis for producing this final report of GIWA.
is publication has gone through a lengthy drafting period. UNEP would like to ac-
knowledge the fol owing persons who have contributed to the production of this report
(in alphabetical order):
Juan Carlos Belausteguigoitia
Sanna Mels
Kristin Bertilius
David Moffat
Pierre Blime
Joakim Palmqvist
Dag Daler
Elina Rautalahti-Miettinen
Matthew Fortnam
George Roman
Rasmus Göransson
Pinya Sarasas
Pertti Heinonen
David Souter
Gotthilf Hempel
Johannes Wolpert
Olof Lindén
Ul a Li Zweifel
Marianne Lindström
A special acknowledgement is also extended to reviewers for their constructive comments
and feedbacks (in alphabetical order):
David Aubrey
Mogens Dyhr-Nielsen
Sara Gräslund
Pertti Heinonen
Hans Olav Ibrekk
Lea Kauppi
Norman Lee
For a comprehensive list of individuals who have been involved in various aspects of the
GIWA project, see Annex I.


KIUNGA NATIONAL MARINE RESERVE, KENYA
INTRODUCTION
15
(PHOTO: G. HEMPEL)

INTRODUCTION
15
Introduction
Only a small proportion of global freshwater can be used by
effects are interlinked and can be traced back to a number of
humans for drinking, sanitation, agriculture and industry,
common root causes.
as well as by the inland fisheries and aquaculture. e living
e Global Environment Facility (GEF) has been estab-
resources exploited by marine fisheries and mariculture are
lished to inter alia "contribute primarily as a catalyst to the
predominantly restricted to the relatively narrow and shal-
implementation of a more comprehensive, ecosystem-based
low fringes of oceans. e various human activities increas-
approach to managing international waters and their drain-
ingly compete for limited aquatic resources. e growth of
age basins as a means to achieve global environmental ben-
human populations and their economies, urbanisation and
efits".
the globalisation of trade, in combination with global climate
e absence of a worldwide comprehensive and inte-
change, will further increase this pressure.
grated transboundary waters assessment has hampered the
Water and its resources are exploited at differing in-
efforts of the GEF to meet its objective and to identify priority
tensities and for various purposes in different parts of the
regions and issues for international support. us, the GEF
world. Consequently, the impact of aquatic concerns, includ-
commissioned UNEP to implement the Global International
ing freshwater shortage, pollution, habitat and community
Waters Assessment (GIWA) project in order to develop a stra-
modification, and overfishing, vary in severity and extent.
tegic framework that may be used by the GEF and its partners
ese concerns were traditional y assessed either on a na-
to identify priorities for remedial and mitigatory actions in
tional scale, individual y on a global scale, or for a specific
international waters. See Annex I-III for further information
water body.
on the GIWA project.
Many freshwater and coastal ecosystems are interna-
e GIWA project was executed by UNEP in partnership
tional; 263 river basins cross or delimit national borders, con-
with the Government of Sweden, through the Swedish Inter-
veying about 60 of the world's freshwater flow and draining national Development Cooperation (SIDA). e Government
more than half the Earth's land area. Most Large Marine
of Finland later became a partner to the project. In 1999,
Ecosystems (LMEs) and large groundwater aquifers are shared they established the GIWA Core team at Kalmar University,
by two or more countries. Downstream consequences of
Sweden.
human activities can occur in regions some distance from the
GIWA focused on transboundary water issues in devel-
source of the problem. In order to address these water issues,
oping regions. However, in order to provide a more global
they must be assessed from an international (or transbound-
coverage, comparable information was col ated from regions
ary) perspective.
containing developed countries that are not eligible for GEF
Over the past decade, the international community has
interventions.
increasingly acknowledged the need for a global approach to
GIWA adopted a bottom-up approach involving regional
assessing transboundary aquatic resources and has recog-
experts. ey evaluated the severity of transboundary eco-
nised the importance of water for sustainable development.
logical and societal impacts and their causes in international
While aquatic environmental concerns are global issues, they
waters on a regional scale. e root causes, including global
are usual y addressed on a regional scale, i.e. for each water
trends, policy, legislation, governance, institutional capacity
system. Within the region, a holistic approach to assessment
and knowledge, were analysed by the experts. Final y, policy
and management is required, as all aquatic concerns and their relevant conclusions were drawn from the assessments.


CHALLENGES TO INTERNATIONAL WATERS: REGIONAL ASSESSMENTS IN A GLOBAL PERSPECTIVE
16
INTRODUCTION
17
e GIWA project provides strategic information that
4. Habitat and community modification
can assist in meeting the Mil ennium Development Goals
5. Global change
(MDGs), particularly for the eradication of hunger (Goal 1)
and increased access to safe drinking water (Goal 7).
Global change largely causes impacts by affecting the
four other concerns and many regional teams were unable to
Project design
assess it due to a lack of data. Consequently, global change is
e transboundary regional approach to assessing global
integrated into the discussions on the other concerns in this
problems constitutes the backbone of GIWA. e inland water
report.
systems and shelf seas of the world were divided into 66
e GIWA methodology is comprised of four major steps
transboundary geographical regions, 41 of which are GEF-eli-
(for further information and discussion on the GIWA meth-
gible. Each region comprises one or more international river
odology see Annex II, and for its theoretical background,
basin and usual y an adjacent LME. A few regions are land-
Annex III):
locked, such as Lake Chad/43. Several regions were divided
Scaling defines the geographic boundaries of the GIWA
into sub-systems, which were assessed individual y (see map
region, which are general y demarcated by a large drainage
on the inside of the front cover). e high seas were not as-
basin and its adjacent marine areas. e boundaries of the
sessed by GIWA.
marine parts of the GIWA regions often correspond with those
e assessments were conducted by 1 500 scientists and
of LMEs.
administrative and managerial experts, who were organised
Scoping assesses and scores the severity of present and
into regional teams led by a focal point from the region. e
predicted environmental and socio-economic impacts caused
multidisciplinary teams included representatives from each
by each of the GIWA concerns.
country in the region. e Core team was responsible for
Causal chain analysis traces the cause and effect path-
overall project management, methodology development, the
ways from the socio-economic and environmental impacts
coordination of the regional teams, and peer review and pub-
back to their root causes.
lication. e Core team, in cooperation with external experts,
Wherever possible, the causal chain analysis was fol-
also produced this GIWA Final Report.
lowed by policy option analysis which outlined potential
courses of action that aim to mitigate or resolve environmen-
The GIWA assessment methodology
tal and socio-economic problems in the region.
Global y comparable results were achieved by a common
e GIWA provides baseline information at the regional
and consistent methodology applied by all of the regional
level which will facilitate the preparation of Transbound-
teams. e GIWA methodology provides criteria for assess-
ary Diagnostic Analysis (TDAs) and Strategic Action Pro-
ing water-related environmental concerns, and for identifying grammes initiated by GEF. At the same time, many GIWA re-
their immediate and root causes and potential policy options
gional assessments have benefited from completed TDAs.
(see Annex II and III). Regional experts assessed and com-
pared the severity of impacts from a regional perspective. e The GIWA approach
methodology was not developed for inter-regional compari-
Although GIWA is not the only assessment of the world's
sons of environmental quantitative data, such as pol utant
aquatic systems and resources, it has taken an original ap-
concentrations or loss of mangroves. Instead, the GIWA deter-
proach that will benefit a wide range of stakeholders. e
mines regional priorities and al ows a relative comparison of
number and diversity of regional experts, and the peer review
multiple impacts.
process, has ensured transparency in the regional assess-
e numerous and complex transboundary water-re-
ments. GIWA uses a holistic and ecosystem-orientated ap-
lated environmental problems were grouped into five major
proach to assess the environmental and socio-economic im-
concerns:
pacts, and root causes behind environmental problems.
1. Freshwater shortage
Traditional y, global assessments adopt a top-down
2. Pol ution
approach; led by small teams of international experts with
3. Overfishing and other threats to aquatic living resources
relatively limited inputs from local stakeholders. GIWA has


CHALLENGES TO INTERNATIONAL WATERS: REGIONAL ASSESSMENTS IN A GLOBAL PERSPECTIVE
16
INTRODUCTION
17
taken the opposite approach, with local experts leading each
The GIWA Final Report
regional assessment, thus building strong local ownership
is report provides a synoptic review of the most important
of the GIWA regional reports. By facilitating international
information from the regional reports. It is a technical rather
cooperation and fostering trust among scientists and policy
than a comprehensive scientific publication. Prime references
makers from neighbouring countries, GIWA has strengthened
can be found in the regional reports, which are referenced in
national assessment capacity and provided the basis for long-
this report by GIWA region (name fol owed by number, e.g.
term col aboration in developing regions.
Mekong River/55).
roughout the process of undertaking the regional as-
sessments and preparing the regional reports, the training of
e book:
many young scientists served to strengthen scientific capacity summarises the major transboundary concerns and their
in specific regions. GIWA not only assessed the available policy
impacts;
relevant information, but also identified key knowledge gaps
assesses the root causes of the impacts; and
that need to be addressed.
provides policy relevant conclusions.
In addition to their own knowledge, the regional ex-
perts drew, to varying extents, from complementary assess-
e GIWA scoring matrices in Annex IV present the scoring
ments and initiatives, including: the UN World Water De-
results of the five concerns for each region and sub-system.
velopment Report; the Mil ennium Ecosystem Assessment;
e severity of the GIWA concerns and issues are expressed
the Mil ennium Development Goals; the UN Commission on using the terms `severe', `moderate', `slight' and `no reported
Sustainable Development; Food and Agriculture Organiza-
impact', which are described in Annex II. `Environmental
tion assessments; and national studies. ere is considerable
impacts' represent the average weighted score for the environ-
overlap in membership of the various assessment groups and
mental issues associated with the concern. `Overall impacts'
in the data sources used.
refers to the concern's final score including environmental,
e GIWA methodology brought together natural and
socio-economic and the anticipated future impacts. e pre-
social scientists and resource managers, often for the first
dicted trends of the environmental impacts are represented by
time, to participate in the workshops, conduct the assessment arrows in the overall impacts column.
and compile the regional report.
For various reasons, some regional reports have not
Each GIWA regional assessment fol owed the same pro-
been published and were therefore unavailable during the
cess. Training courses for the regional teams ensured that
drafting of the Final Report. Many GEF non-eligible regions
they all possessed a common understanding of the GIWA
were not assessed, mainly in Europe and North America.
methodology.
Some areas of the Middle East and Southern Asia are also
e regional assessments are the primary outputs of
unrepresented. ose gaps may give a misleading impres-
the GIWA project. Fifty-five regional assessments have been
sion that there are no transboundary water problems in these
completed, forty of which include GEF-eligible countries. e
regions.
present status of the GIWA regional reports is presented on the
is synthesis of all concerns, their issues and impacts
map inside the front cover. e reports are also available on
provides a global perspective on their relative importance.
the GIWA website (www.giwa.net).
Readers are encouraged to consult the regional reports for
GIWA has been the largest global assessment of eco-
more information about the examples contained in this re-
system-wide water issues from a transboundary perspective,
port. e Annexes provide additional information on the
linking international river basins to their adjacent LMEs. It
GIWA project and methodology.
was designed to provide policy makers and managers with
the information they need to improve transboundary re-
sources management.

IN THE BARREN DESERT OF WADI RUM CROPS ARE
GROWN ON CIRCULAR IRRIGATED PATCHES OF LAND.
(PHOTO: CORBIS)

Today, freshwater is
used unsustainably
FRESHWATER
in the majority of
the regions studied
SHORTAGE
by GIWA. In two-
thirds of the regions, water is predicted to become scarcer by 2020
due to demand continuing to grow in paral el with increased
agricultural production, and population and economic growth.
Global climate change will exacerbate this situation. On a
global scale, the most widespread and adverse transboundary
consequences result from the modification of stream flow by
dams, reservoirs and river diversions, as well as by land-use
changes in the catchment area. Downstream ecosystems and
riparian communities are severely impacted by changes to the
flow regime of international rivers. Inappropriate subsidies
encourage inefficient water use, such as the growing of water-
intensive crops in water scarce regions.
e growing recognition that entire river basins, estuaries and
coastal areas are single planning units has led to a paradigm
shift of water management towards more integrated approaches.
Demand management was identified as an effective alternative
to building new reservoirs and deeper wel s. ere is a need to
move away from focusing exclusively on the direct economic
benefits of engineered structures to understanding their actual
environmental and socio-economic costs.


CHALLENGES TO INTERNATIONAL WATERS: REGIONAL ASSESSMENTS IN A GLOBAL PERSPECTIVE
20
FRESHWATER SHORTAGE
21
Freshwater is a highly valuable resource for a large
BOX 1. TRANSBOUNDARY FRESHWATER RESOURCES
number of competing demands, including drink-
ing water, irrigation, hydroelectricity, waste disposal,
Approximately 60 of global freshwater flows and 50 of the Earth's land sur-
industrial processes, transport and recreation, as wel
face is located within the 263 international river basins.
as ecosystem functions and services. Prior to the 20th
More than 40 of the world's population live within international river basins.
century, human demand for water was relatively smal
Many of the world's largest lakes are transboundary, such as the Caspian Sea,
compared to availability in most parts of the world.
Aral Sea, Lake Chad, Dead Sea, Lake Tanganyika, Lake Victoria and the Great
Water demand dramatical y increased as a consequence
Lakes of North America.
of population and income growth, and the expansion
Transboundary groundwater systems of global significance include the Guarani
of industry and irrigated agriculture, so that demand
aquifer in South America, Chad Formation and Nubian Sandstone aquifer in
now exceeds supply in many developed and develop-
North Africa, and Gangetic Plain Quaternary aquifer in Asia.
ing countries. Today, freshwater scarcity affects more
More than 400 international treaties or agreements related to shared water
than a bil ion people and the integrity of many of the
resources have been signed since 1820, excluding agreements on navigation,
world's ecosystems. e achievement of many of the UN
fisheries, or the demarcation of borders. However, 60 of international basins
Mil ennium Development Goals (MDGs) wil depend
do not have any cooperative management framework.
on the improved management of freshwater resources.
(SOURCE: UNEP 2002)
One goal focuses specifical y on reducing the propor-
tion of people without sustainable access to safe drink-
Overextraction of aquifers is becoming severe in many
ing water and basic sanitation by 50. Managing water in
areas that depend heavily on irrigated agriculture or are
transboundary river basins poses great chal enges and requires
densely populated. e extraction of fossil water from
comprehensive solutions that take into account the needs of
deep aquifers is unsustainable as they will not be refil ed
both upstream and downstream countries (Box 1).
on human time scales. Knowledge of aquifers is insuffi-
e GIWA methodology (see Annex II) provides a
cient and further studies are needed in order to compre-
framework for evaluating three critical freshwater trans-
hensively assess transboundary aquifers.
boundary issues: (i) modification of stream flow; (i ) pol ution Agricultural land is becoming too saline to support
of existing supplies; and (i i) changes in the water table. e
important crops, the salinity of aquifers is too high for
results of the GIWA assessment for freshwater shortage are
human use, and saline waters encroach further up rivers
summarised in the global matrix in Annex III.
during dry seasons.
Land-use changes, including deforestation and the culti-
Global situation and trends
vation of wetlands, affect the water budget, thus causing
Freshwater shortage was assessed as the priority trans-
floods or droughts in many regions.
boundary concern in more GIWA regions/sub-systems than
e majority of GIWA regional teams predict that envi-
any other GIWA concern. Many of these regions are arid
ronmental problems related to freshwater shortages will
and either renowned drought-prone basins in Africa or
increase by 2020.
subject to long-term unsustainable water management.
More than half of the regions/sub-systems considered
the overall environmental and socio-economic impacts of
freshwater shortages to be moderate or severe (Figure 1).
ENVIRONMENTAL AND
Impacts of the modification of stream flow caused by
SOCIOECONOMIC IMPACTS
dams or river diversions were more widespread and severe
than those caused by the pol ution of existing supplies or
Modification of stream flow
changes in the water table.
Nineteen GIWA regional teams identified the modification of
Water withdrawals by irrigated agriculture were identi-
stream flow as having severe impacts, particularly in Sub-Sa-
fied by the GIWA regional teams as causing the most se-
haran Africa, North Africa, Northeast Asia, Central America
vere environmental and socio-economic impacts.
and Europe & Central Asia (Figure 3). Table 2 summarises


CHALLENGES TO INTERNATIONAL WATERS: REGIONAL ASSESSMENTS IN A GLOBAL PERSPECTIVE
20
FRESHWATER SHORTAGE
21
FIGURE 1. OVERALL ENVIRONMENTAL AND SOCIO-ECONOMIC IMPACTS OF FRESHWATER SHORTAGE
FIGURE 2. FUTURE ENVIRONMENTAL TRENDS OF FRESHWATER SHORTAGE
the environmental and associated socio-economic impacts as-
Dams change flow patterns by storing water in res-
sessed by GIWA for a selection of transboundary river basins.
ervoirs during the wet season and releasing part of it dur-
Changes in the flow regime were principal y attributed
ing the dry season. e biodiversity of riparian and aquatic
to the development of large dams (e.g. the Colorado River,
habitats changes in response to the alteration of the flow
Figure 4). River diversions, inter-basin transfers and other
regime. Dams can also obstruct migration routes and re-
structures designed to supply water and energy also modify
duce fish spawning habitat. For example, dams on the Volga
stream flow.
River (Caspian Sea/23) have reduced the spawning habitat of


CHALLENGES TO INTERNATIONAL WATERS: REGIONAL ASSESSMENTS IN A GLOBAL PERSPECTIVE
22
FRESHWATER SHORTAGE
23
FIGURE 3. IMPACTS OF MODIFICATION OF STREAM FLOW
Caspian sturgeon, and these fish are now predominantly re-
the storage capacity of reservoirs, thus intensifying competi-
cruited in hatcheries.
tion over water supplies (Agulhas Current/45a). In the Niger
Fragmentation of rivers results in the trapping of sedi-
River (Guinea Current/42c), sedimentation in upstream res-
ments in reservoirs which can lead to downstream ecological
ervoirs causes coastal erosion and reduces nearshore produc-
changes and erosion in floodplains, deltas, estuaries and the
tivity as fewer sediments and nutrients reach the coast.
coastal zone. Land use changes, particularly deforestation,
In addition to fragmentation and changed flow re-
modify sedimentation and flooding regimes. e accumula-
gimes, evaporation and water consumption have signifi-
tion of sediments behind dams can affect downstream natu-
cant consequences for downstream ecosystems and societies.
ral resources and associated livelihoods, and may impede the
Global y, irrigated agriculture accounts for around 70 of
efficiency of dam infrastructure and reduce the storage capac-
freshwater withdrawals, fol owed by industry (21) and do-
ity of reservoirs. For example, in the Save River in Zimba-
mestic uses (10). Not all water withdrawals are `consumed',
bwe, soil erosion and sedimentation has significantly reduced
as return flows re-enter the hydrological system downstream.
Irrigated agriculture, however, returns only 30 of its water
withdrawals, while industrial and domestic users return
85-90 (FAO 2002). In Namibia's Eastern National Water
Carrier canal, more than 70 of the water is lost through
evaporation (Benguela Current/44). Freshwater shortage in
the Benguela Current region il ustrates the problems faced by
arid coastal environments worldwide (Box 2).
Loss of freshwater inflow to enclosed water bodies has
resulted in dramatic changes to many ecosystems, notably the
shrinking of the Aral Sea/24 and the Dead Sea (Jordan/51)
(Box 3). In the inland areas of the Canary Current/41 region,
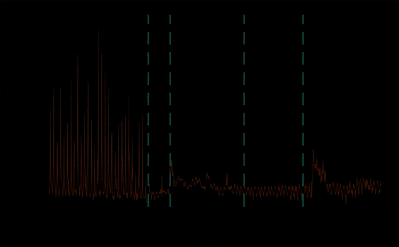
FIGURE 4. FLOW OF THE COLORADO RIVER BELOW THE
the Volta River Basin (Guinea Current/42b) and the Lake
HOOVER DAM 1905-2003
(SOURCE: USBR 2002)
Chad/43 Basin, reduced rainfal over the last few decades


CHALLENGES TO INTERNATIONAL WATERS: REGIONAL ASSESSMENTS IN A GLOBAL PERSPECTIVE
22
FRESHWATER SHORTAGE
23
TABLE 2. IMPACTS OF MODIFICATION OF STREAM FLOW IDENTIFIED IN GIWA REGIONS
GIWA region River basin or
hydrological system
Environmental impacts
Social, economic and health impacts
Decreased sediment transport to the coast
Lack of potable water
Gulf of
Erosion of the Colorado River Delta
Loss of crops
California Colorado River
Loss of wetlands
Loss of fisheries
Loss of endemic plants
Loss of traditional livelihoods
b Gulf of
Rio Grande/Rio Bravo,
Mexico
river and estuary
Increased salinity of estuarine habitats
Impacts on coastal fisheries
Conflicts over water resources
Yalu River, Huai River,
Reduction in water flow
a Yel ow Sea Yongsan River, Taedong Pol ution degrading nearby habitats and leading to annual mass fish kil s
Interruptions in water supply
River, Imjin River, Han
Pol ution of water supplies
Increase in infectious diseases
River, Kum River
Salinisation of coastal aquifers
Displacement of people
c Brazil
Săo Francisco, river and
Decreased sediment transport to the coast and coastal erosion
Loss of traditional livelihoods
Current
estuary
Reduced primary productivity
Reduced availability of fish
Navigation impediments
Loss of farmland and infrastructure
b Guinea
Reduced agricultural output
Current
Volta River
Decreased sediment transport to the coast and erosion
Displacement of people
Loss of marine biodiversity
Increased water-related diseases
Loss of traditional sites
Komadugu-Yobe River
Basin
Loss of floodplain ecosystems and wetlands
Reduced productivity of farmland
Degradation of grazing lands
Reduced availability of fish
Chari-Logone River
Acute freshwater shortage
Basin
Loss of floodplain ecosystems and wetlands
Lake Chad
Food insecurity in downstream areas
Increased water-related diseases
Shrinking of Lake Chad
Upstream/downstream conflicts
Lake Chad
Loss of plant species
Political disputes
Decreased fish stocks and diversity
Displacement of people
Increased vulnerability to flooding
Benguela
Increased water-related diseases
Current
Orange-Vaal River Basin Changed hydrological regime
Displacement of people
Disruption of family and community structures
d Somali
Displacement of people
Coastal
Rufiji/Ruvuma River
Changed flow and flood patterns
Malnutrition during periods of relocation
Current
Basin
Increased salinity in the Rufiji Delta
Social conflicts
Deteriorating human health
Amu Darya River,
Shrinking of the Aral Sea
International disputes
Aral Sea
Syr Darya River,
Fish extinctions
Loss of agricultural productivity
Aral Sea
Salinisation of soil and water resources
Loss of fisheries
Displacement of people
Jordan
Jordan River, Dead Sea
Shrinking of the Dead Sea
Lack of potable water
Salinisation of water resources
Increased water-related diseases
NOTE: THE TABLE PRESENTS A SELECTION OF REGIONS WHERE THE GIWA ISSUE MODIFICATION OF STREAM FLOW HAS BEEN ASSESSED AS SEVERE.
BOX 2. DESERTS BEHIND THE SEA: FRESHWATER SHORTAGE IN THE BENGUELA CURRENT REGION
In GIWA region 44, the land areas adjacent to the Benguela Current are
severely modified stream flow and subsequently the aquatic ecosys-
arid or semi-arid, with rainfall dropping below 50 mm in coastal Na-
tems of the region. Pollution from a variety of sources also threatens
mibia and parts of Angola. Evaporation rates exceed mean annual run-
the ecological integrity of freshwater systems. Furthermore, there is
off in most of the region. Standing water is limited, and few permanent
growing concern regarding the presence of aquatic alien species and
rivers enter the Benguela Current. Freshwater systems of transbound-
the overabstraction of aquifers which have slow replenishment rates.
ary significance include the Cunene and the Orange-Vaal systems.
The region's freshwater resources are unsustainably exploited due to
The GIWA regional team considered the anthropogenic impacts on
a number of anthropogenic factors, including: population growth,
water resources and associated social and economic processes to be
particularly in dry, coastal urban areas; irrigated agriculture, which is
severe. The natural aridity, coupled with highly variable rainfall and
inappropriate and wastes large quantities of water; and increased de-
the geographic disparity between water availability and the distribu-
mand from the expanding industrial and mining sectors.
tion of human settlements and activities, has led to the construction
Although there are existing measures to address freshwater short-
of many dams and inter-basin water transfer schemes. The Orange-
age in the region, the situation is likely to further deteriorate due to
Vaal Basin is considered to be the most modified river system in
increasing demand for water and decreased supply resulting from
southern Africa, with annual flow data indicating a 50 reduction in
predicted changes in rainfall patterns.
flow since 1935. Overabstraction of water for agriculture, industry and
urban supply has placed enormous stress on water resources, and
(SOURCE: BENGUELA CURRENT/44)


CHALLENGES TO INTERNATIONAL WATERS: REGIONAL ASSESSMENTS IN A GLOBAL PERSPECTIVE
24
FRESHWATER SHORTAGE
25
BOX 3. SHRINKING LAKES: CASE OF THE DEAD SEA
In 1933, freshwater inputs to the Dead Sea averaged 1.37 kmł. Since then, the overexploitation of water resources and the construction of dams
and canals in the catchment area have reduced the annual flow to less than 0.2 kmł. Discharges by the Jordan River comprise of mostly poor
quality irrigation return flows, inter-catchment run-off and discharges from saline springs.
The surface area of the Dead Sea has reduced by over one-third, and its water level has dropped by over 20 m and continues to fall by up to 1 m
per year. Groundwater extraction for development activities has lowered the water table in surrounding areas, leading to land subsidence.
(SOURCE: JORDAN/51)
1975
1987
2001
(PHOTO: IMAGE PROCESSING, UNEP/GRID-GENEVA 2002)
BOX 4. IMPACTS OF CLIMATE CHANGE ON FRESHWATER RESOURCES
Predicted climate change, including changes
Lakes are particularly vulnerable to cli-
teau which is only about 2 m above mean
to temperatures, weather systems, and sea
mate change due to their dependence
sea level. As the sea rises, many communi-
level, will alter the global hydrological cycle.
on climatic variables, such as precipita-
ties will be displaced and economic activ-
Impacts on freshwater resources that can be
tion, evaporation, wind conditions and
ity, which is concentrated on the coast,
confidently predicted include:
ice formation. Enclosed river basins with
will be disrupted. The loss of beaches
no outflow are most sensitive to climate
will have a significant impact on regional
In river basins strongly influenced by snow
changes, including the Caspian Sea/23,
tourism. Water shortages resulting from
or glacier melting, peak stream flows will
Aral Sea/24, Lake Chad/43, Lake Balkhash
saline intrusion in aquifers will require the
occur earlier in the year, winter run-off will
(Aral Sea/24) and Lake Titicaca (Humboldt
importation of water or desalination, both
increase, summer run-off will decrease,
Current/64).
expensive alternatives.
and flooding events will become more
intense. These changes are already occur-
Sea level rise will cause greater saline intru-
While many water-scarce regions in the
ring in several drainage basins in Eastern
sion in coastal aquifers. Low-lying islands
sub-tropics will have decreased water
Europe, Central Asia, Canada and Califor-
are particularly vulnerable, with the mean
availability, other regions will have greater
nia.
global sea level predicted to increase by
precipitation, including Southeast Asia. In
0.09 to 0.88 m by 2100 compared with
many regions, climate change is predicted
In arid or semi-arid regions, small changes
1990. In the Pacific Islands/62, global warm-
to increase the pressure on water re-
in precipitation can significantly affect
ing is expected to: increase the salinisation
sources, particularly for irrigated agricul-
run-off. Even if precipitation rates do not
of the limited groundwater supplies; cause
ture. Africa appears to be the most vulner-
change, higher temperatures would in-
human migration due to the inundation of
able to the impacts of climate change on
crease evaporation rates, reduce stream
coastal areas; and increase the frequency
water supplies due to widespread poverty,
flow and cause additional droughts. This
of storm surges and cyclonic events result-
recurrent droughts and the dependence
has serious implications for areas like the
ing in property and infrastructure damage.
on rain-fed agriculture.
Volta Basin, where a large volume of water
is lost through evaporation from reser-
(SOURCE: IN ADDITION TO THE GIWA REPORTS
The small islands of the Indian Ocean
voirs; in Burkina Faso, almost 85 of the
Islands/45b region are preparing for the
MENTIONED, THIS BOX INCLUDES INFORMATION
total volume of most reservoirs is lost by
impacts of climate change. The majority
FROM ARNELL ET AL. 2001)
evaporation (Guinea Current/42b).
of the population inhabits the coastal pla-


CHALLENGES TO INTERNATIONAL WATERS: REGIONAL ASSESSMENTS IN A GLOBAL PERSPECTIVE
24
FRESHWATER SHORTAGE
25
has magnified the effects of water withdrawals for irrigation
and water diversion schemes. Discharges by the Chari-Lo-
gone River, which is the major inflow for Lake Chad, have
decreased by 55 over the last 40 years. In the future, global
warming wil increase evaporation rates and pose a consider-
able threat to the supply of freshwater in many regions (Box 4).
Loss of freshwater inputs to coastal ecosystems has also
severe transboundary impacts in many areas. As a conse-
quence of upstream water withdrawals, the Berg River estu-
ary in South Africa experiences intrusions of high salinity
waters which affect many species of fish, benthic inverte-
brates and birds (Benguela Current/44). In the Rio Grande/
Rio Bravo Basin (Gulf of Mexico/2b), irrigation diverts
nearly 90 of the Rio Grande's average annual flow which
has adversely affected many estuarine species, including com-
mercial y important fish and shel fish. is region, which has
low precipitation rates, is therefore extremely vulnerable to
drought.
e reduction of water downstream can have substan-
tial socio-economic impacts, including the displacement of
people due to a loss of traditional livelihoods, declines in
fisheries production, a loss of water supply, health impacts
FIGURE 5 THE HOOVER DAM ON THE COLORADO RIVER,
USA.
related to schistosomiasis and other water-borne diseases, and
the provocation of conflicts over water al ocation (Table 2).
Prolonged water shortages can provoke conflict be-
Many of these issues are exemplified in the Ganges-Brahma-
tween water users and force the population to adapt, as ob-
putra River system (Bay of Bengal/53). Bangladesh receives
served in the Lake Chad/43 region. In the Komadugu-Yobe
90 of its stream flow from its upstream neighbours; India,
Basin, disputes were provoked as a result of upstream Nige-
Nepal and Bhutan. More than 30 dams, barrages and river
rian states al ocating insufficient water to the downstream ri-
diversions have been constructed upstream, reducing dry sea-
parian states of Borno and Yobe, and Niger. Many fishermen
son flows in Bangladesh by up to 60. Additional dams in
in the basin have tried to compensate for declining fish pro-
Bangladesh also contribute to the problem. e consequences duction caused by the contracting lake by turning to farming
are manifold: acute water shortages; loss of inland fisheries;
the fertile soils left by the receding lake.
salinisation and reduced productivity of agricultural lands;
In tropical regions, particularly in Africa, reservoir de-
the encroachment of sea water further upriver in the dry
velopment often leads to a greater prevalence of water-related
season; and loss of goods and services provided by mangrove
diseases, including malaria, yel ow fever, guinea worm and
forests. e livelihood and nutritional levels of nearly 30 mil-
schistosomiasis. e latter almost always increases dramati-
lion people in Bangladesh have been adversely affected as a
cal y as reservoirs facilitate the transmission of the disease
result of stream flow modification. e water-sharing treaties from snails to humans. e construction of the Akosombo
signed in 1996 between India and Nepal, and Bangladesh and Dam on the Volta River in Ghana increased the proportion
India have reduced, to a degree, the severity of the impacts,
of schistosomiasis infected children from 5 to 90 (Guinea
particularly on the downstream population in Bangladesh.
Current/42b). Even in temperate regions, water-borne dis-
However, the recently proposed `river linking' project is ex-
eases are correlated with the level of access to safe water and
pected to transfer a significant proportion of the flows from
sanitation. In the Caspian Sea/23, 30 to 70 of all il nesses
the Ganges-Brahmaputra-Meghna River system to other riv-
in the region are attributable to the quality and availability of
ers in India.
drinking water.


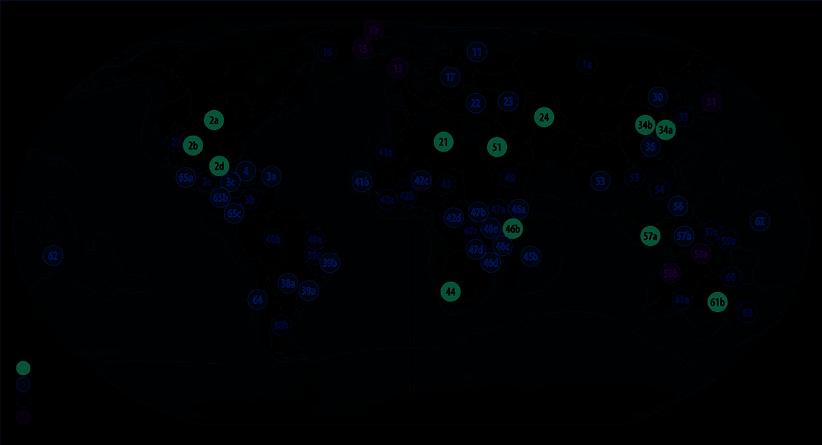
CHALLENGES TO INTERNATIONAL WATERS: REGIONAL ASSESSMENTS IN A GLOBAL PERSPECTIVE
26
FRESHWATER SHORTAGE
27
Pol ution of freshwater supplies
Sea and the col apse of its fisheries (see the chapter on habitat
Pol ution reduces the availability of water for human use.
and community modification).
Chemical pol utants, microbial contamination, increased
e Vaal River, a tributary of the Orange River in
concentrations of organic matter and elevated nitrates in
South Africa, is severely pol uted by microbes, nutrients,
drinking water can result in health problems, higher water
chemicals and acid mine drainage from agricultural, urban
treatment costs and freshwater shortages. Overal , pol u-
and industrial return flows (Benguela Current/44). Average
tion of freshwater supplies was assessed as severe in 12 and as
salinity at the Vaal Barrage has more than tripled since the
moderate in a further 30 of the transboundary river basins as-
1930s. As a result, water at several locations has become un-
sessed by GIWA (Figure 6). For a holistic assessment of trans-
suitable for human use and Rift Val ey fever and sheep blind-
boundary pol ution refer to the chapter on pol ution.
ness is prevalent along the Vaal River.
In the Aral Sea/24 region, a considerable proportion
In addition to the economic costs of water-borne il -
of available water resources consist of return waters from ir-
nesses, many GIWA reports note that water pol ution incurs
rigated cotton plantations that are heavily contaminated with significant direct economic costs, from accessing ever-deeper
agro-chemicals. Approximately 15 of surface water sup-
groundwater and improving water treatment facilities, to
plies in the Aral Sea Basin are pol uted, severely affecting
consumers paying more to buy water from private suppliers.
the human and ecological functions of many reservoirs. In
In the Patagonian Shelf/38 region, contaminated
addition to persistent organic pol utants, 60 mil ion tonnes of groundwater and a lower water table have increased water
salt are carried by the rivers annual y, causing concentrations
treatment costs and required the exploitation of alternative
in the delta to exceed 2 g/l. is situation has caused severe
sources of water. e loss of surface and groundwater sources
human health problems. As the Aral Sea recedes, it leaves
for large cities, such as Săo Paulo and Buenos Aires, affects
behind chemical pesticides and natural salts which are blown mil ions of people and disrupts crucial industries. Addition-
into noxious dust storms, seriously affecting the health of the
al y, the exploitation of fluoride and arsenic contaminated
local people. Pol ution puts further pressure on communi-
groundwater can lead to poisoning. For example, 80 mil ion
ties already burdened by water shortages and the loss of large
of the Bangladesh population live in arsenic-contaminated
areas of valuable ecosystems, as well as the retreat of the Aral areas (Bay of Bengal/53).
FIGURE 6. IMPACTS OF POLLUTION ON TRANSBOUNDARY FRESHWATER SUPPLIES


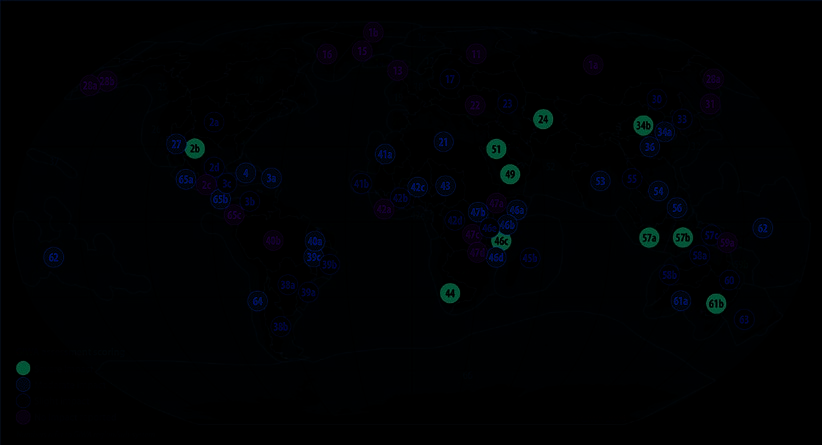
CHALLENGES TO INTERNATIONAL WATERS: REGIONAL ASSESSMENTS IN A GLOBAL PERSPECTIVE
26
FRESHWATER SHORTAGE
27
In the Colorado River (Gulf of California/27), the eco-
proximately 40 mil ion ha of farmland. In Namibia, particu-
nomic impacts of freshwater shortages are substantial. Saline
larly in the vicinity of the Karstveld aquifer, the water table
waters require expensive purification systems (demineralisa-
has dropped several metres (Benguela Current/44).
tion, softening, etc.) that have direct economic impacts on
Over the past 25 years the water table in the Volta River
industrial, residential and agricultural water users in both
Basin (Guinea Current/42b) has significantly lowered, 60-
Mexico and California.
80 of which is attributed to excessive pumping from aqui-
fers for irrigation, domestic water supply and other urban
Changes in the water table
requirements. e lower water table leads to a scarcity of
Most of the world's available freshwater is found in the
potable water, forcing inhabitants to use surface water which
water-saturated zones of the lithosphere. ese groundwater
may be pol uted or infected.
systems supply drinking water to more than 2 bil ion people
Water withdrawals from coastal aquifers can lead to
and provide irrigation water which is used to generate nearly
seawater intrusion, causing irreversible salinisation. is is a
40 of global food production (WMO 1997). Despite their
growing concern in many smal island developing states (SIDS)
global significance, there is a dearth of knowledge regarding
of the South Pacific and Caribbean. In the Pacific Islands/
aquifers, especial y in developing countries.
62 region, subterranean lenses of freshwater are the primary
When water withdrawals from an aquifer system ex-
sources of drinking water for many smal islands, particularly
ceed the long-term rate of replenishment, water tables lower
atol s. Burgeoning human populations are placing extreme
and water resources are said to be `mined'. is is a com-
pressure on this limited resource, often resulting in drinking
mon problem in many regions on all continents that have low water shortages. ese problems are often exacerbated by di-
rainfall and rely on groundwater for irrigated agriculture and
lapidated pipes and storage facilities. Suva, the capital of Fiji, is
domestic uses (Figure 7). In the Jordan/51 region, the major-
experiencing increasing disruptions to its municipal water sup-
ity of aquifers are overexploited and often saline; water tables
plies, partly due to the failure of old piping systems, but also
have fal en as rapidly as 0.6 m/year in the Azraq basin. Inef-
because of the rapidly increasing population.
ficient irrigation practices can lead to waterlogging and the
e Caribbean Islands/4 also depend on groundwater
salinisation of soils and aquifers. is has already affected ap-
as a source of potable water. However, groundwater resources
FIGURE 7. IMPACTS FROM CHANGES IN THE WATER TABLE ON TRANSBOUNDARY AQUIFERS


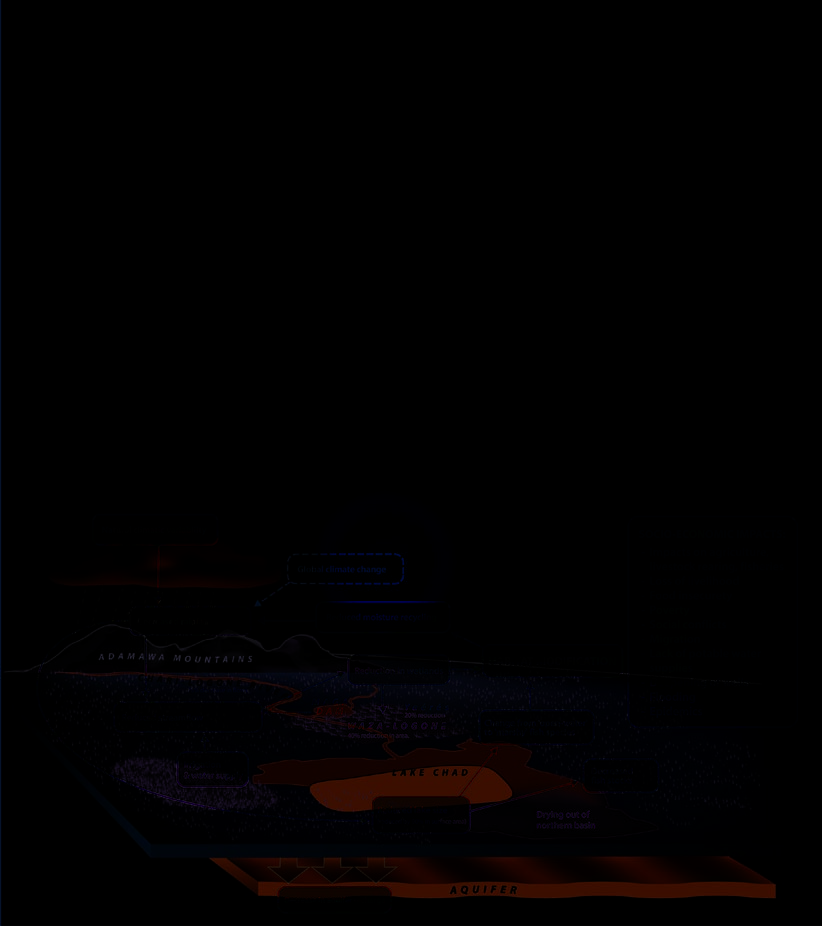
CHALLENGES TO INTERNATIONAL WATERS: REGIONAL ASSESSMENTS IN A GLOBAL PERSPECTIVE
28
FRESHWATER SHORTAGE 29
are being eroded by saltwater intrusion resulting from sea
regions with intense groundwater abstraction for irrigation or
level rise and overuse of groundwater reservoirs. In some ag-
the cultivation of marshes and swamps.
ricultural regions of Cuba, saltwater intrusions into aquifers
e interactions between freshwater shortage and the
extend up to 30 km inland.
other GIWA concerns are highlighted in the case of Lake
Saline intrusion in coastal aquifers is also a serious
Chad (Box 5).
problem in the East China Sea/36 region and other coastal
BOX 5. INTERACTIONS BETWEEN FRESHWATER SHORTAGE AND THE OTHER GIWA CONCERNS: CASE OF LAKE CHAD
There are strong inter-linkages between
Over the last 30 years, numerous dams and
former flooded pastures have lost their pe-
freshwater exploitation and the other GIWA
irrigation projects were developed in the
rennial grass cover, leaving only degraded
concerns, as illustrated in the Lake Chad/43
Chari-Logone and Komadugu-Yobe river ba-
grasslands. This has encouraged herders to
Basin. The water resources of the Basin are
sins, particularly in Nigeria and, to a lesser ex-
shift from grazing animals to browsing ani-
shared primarily by Cameroon, Chad, Niger
tent, Cameroon. Over the same time period,
mals which reduce woody vegetation cover.
and Nigeria.
the Sahel has experienced a dramatic and
The dramatic shrinking of Lake Chad has
sustained decline in rainfall.
changed the fish community structure from
Lake Chad shrunk by 90 and
open water species to wetland species,
severe reductions in stream
and reduced fisheries productivity. In the
flow from the droughts, as
Waza-Logone floodplains, fish yields have
well as the development proj-
declined by 90. The reduction in fisheries
ects, have severely modified
production and the decline in the fertil-
many aquatic habitats, par-
ity of agricultural land have contributed to
ticularly the lake, wetland and
regional poverty and food insecurity. Many
floodplain ecosystems.
households have been forced to migrate to
Previously, high-quality
other regions or to urban slums. Freshwa-
floodplain pastures sustained
ter shortages in the Lake Chad Basin have
livestock rearing during the
resulted in severe ecosystem degradation
dry season; the third largest
and compromised human well-being and
source of household income
economic development.
in the basin. Most of the
(SOURCE: LAKE CHAD/43)


CHALLENGES TO INTERNATIONAL WATERS: REGIONAL ASSESSMENTS IN A GLOBAL PERSPECTIVE
28
FRESHWATER SHORTAGE 29
ROOT CAUSES
Demographic and economic trends
e most important trends affecting the level of freshwater
GIWA regional teams conducted 17 causal chain and policy
usage are (i) population growth and urbanisation; (i ) agricul-
option analyses related to freshwater shortage. e modifica-
tural demand; (i i) hydropower demand; and (iv) industrial
tion of stream flow caused the most severe environmental and demand and trade.
socio-economic impacts of the three freshwater issues, and
was predominantly chosen as the target for the causal chain
Population growth and urbanisation
analysis (Table 3 and 4). Agriculture, especial y irrigation,
Population growth is one of the main drivers of freshwater
was the sector most responsible for all three freshwater issues.
demand. Most projections estimate that the world popula-
is section examines four intertwining categories of
tion wil stabilise at between 8 and 9.5 bil ion people by around
root causes of freshwater shortage: (i) demographic and eco-
2050 and that most of this growth wil take place in the devel-
nomic development trends; (i ) market failures; (i i) policy
oping world (UNDP 2004). Population growth not only triggers
failures; and (iv) knowledge gaps and lack of public engage-
direct domestic water consumption but also the consumption
ment.
of agricultural, industrial and other products, and energy use.
e population of the world has tripled in the last century, but
global water use has increased six-fold (WWC 2000).
TABLE 3. IMMEDIATE CAUSES OF FRESHWATER SHORTAGE
Targeted issues *
Modification of stream flow
Pol ution of existing
supplies
Changes in the water table
Immediate causes
Main sectors involved
Immediate Main sectors
causes
involved
Immediate causes
Main sectors
involved
a
i
n
f
a
l
l
r
o
t
e
c
t
i
o
n
)
f
f
l
u
e
n
t
s
r r
l
o
w
s
s
e
l
o
w
s
r
e
a
t
m
e
n
t
,
o
f
f
o
m
e
s
t
i
c
l
o
w o
r
o
d
u
c
t
i
o
n
f
l
o
o
d p
o
i
n
t e
o
d
i
f
i
c
a
t
i
o
n
i
v
e
r
s
i
o
n
a
n
d u
i
r
r
i
g
a
t
e
d
)
u
n-
i
r
r
i
g
a
t
e
d
)
a
i
n
f
a
l
e
t
u
r
n f
e
a
k f
e
d
i
m
e
n
t l
o
a
d
n l
u
p
p
l
y
o
n-p
n
d
/
o
r d
e
t
u
r
n f
x
t
r
a
c
t
i
o
n
e
c
h
a
r
g
e
u
p
p
l
y
n
d n
a
s
t
e
w
a
t
e
r t
l
o
w m
GIWA region
y
d
r
o
p
o
w
e
r p
I
n
c
r
e
a
s
e
d d
R
e
d
u
c
e
d r
D
e
f
o
r
e
s
t
a
t
i
o
n
C
h
a
n
g
e
d r
C
h
a
n
g
e
d p
I
n
c
r
e
a
s
e
d s
C
h
a
n
g
e
s i
A
g
r
i
c
u
l
t
u
r
e (
H
I
n
d
u
s
t
r
y
D
o
m
e
s
t
i
c s
I
n
f
r
a
s
t
r
u
c
t
u
r
e (
F
o
r
e
s
t
r
y
P
o
i
n
t a
P
o
o
r w agricultural r Agriculture Industry a Changed r patterns Excessive e Reduced r Stream f Agriculture ( Domestic s
b Rio Grande/Rio Bravo (Gulf of Mexico)
Aral Sea
Colorado River (Gulf of California)
Yel ow Sea
a Souss Aquifer (Canary Current North)
b Senegal River basin (Canary Current South)
b Volta Basin (Guinea Current)
Lake Chad
Orange-Vaal River Basin (Benguela Current)
b Tana/Ahti/Sabaki (Somali Coastal Current)
d Rufiji/Ruvuma(Somali Coastal Current)
Jordan
a South PNG and Papua (Coral Sea Basin)
Pacific Islands
b Central Equatorial Pacific (Eastern Equatorial
Pacific)
NOTE: THE TABLE PRESENTS A SELECTION OF GIWA REGIONS WHERE THE REGIONAL TEAM HAS CONDUCTED A CAUSAL CHAIN ANALYSIS ON THE GIWA CONCERN
FRESHWATER SHORTAGE. * WHEN ONLY ONE SECTOR IS LISTED, IT IS RESPONSIBLE FOR MORE THAN 50 OF THE IMPACT ON THE TARGETED ISSUE.


CHALLENGES TO INTERNATIONAL WATERS: REGIONAL ASSESSMENTS IN A GLOBAL PERSPECTIVE
30
FRESHWATER SHORTAGE
31
Higher incomes stimulate greater consumption of
BOX 6. EXPORTING GROUNDWATER: CASE OF THE
goods and services, the production of which requires water.
SOUSS-MASSA RIVER BASIN
Income levels are rising in many countries, particularly in
China and India, in paral el with economic growth. Decou-
The Souss-Massa River Basin in Morocco covers an area of 27 000 km˛.
Although the basin lies within only one country, much of its water
pling income growth from water consumption is one of the
is used to produce high value export crops, and such consumption
greatest chal enges to water management.
patterns illustrate the concept of virtual water discussed in Box 7.
Urbanisation is another demographic trend resulting in
Intensive irrigation development to supply the vegetable and citrus
greater water use. e proportion of the world's population
fruit export industry, in combination with urban, tourism and industrial
residing in cities was only 14 in the early 1900s and still only
growth, led to chronic water scarcity in this arid to semi-arid region.
29 in the 1950s. Since then, the urban population has grown
The Souss and Massa rivers are the primary sources of surface water
rapidly, and more than 60 of people are expected to live in
in the Basin. Available surface water normally ranges from 341 to
cities by 2030 (UNDP 2004). Urbanisation has had two critical
635 million mł annually, but can be as low as 35 million mł in dry years.
impacts on transboundary freshwater use. Firstly, many cities
Groundwater is obtained from two major aquifers:
divert enormous volumes of surface water or overexploit aqui-
The Souss aquifer, which covers 4 150 km˛ and has an estimated
fers. Secondly, untreated or inadequately treated sewage from
capacity of 30 billion mł.
these cities is a major source of pol ution.
The Chtoukas aquifer, which covers 940 km˛ and has an estimated
Along the Rio Grande/Rio Bravo border between
capacity of 1 billion mł.
Mexico and the United States, population growth and the
expansion of industrial and agricultural activities has led to
The causal chain analysis undertaken by the regional team identified
that the following root causes resulted in the lowering of the water
unsustainable water use (Rio Grande/Rio Bravo (Gulf of
table in the Souss-Massa Basin:
Mexico/2b) . A major study in 2002 predicted that the total
population of the Las Cruces/El Paso/Juarez region could
Inefficient irrigation systems and inappropriate well-digging
techniques: flood irrigation still supports nearly 50 of irrigated land.
leap from 2 mil ion to 6 mil ion by 2025. Such growth would
put great stress on the region's water resources. Even today,
Population growth and increasing personal consumption levels:
the major cities rely on deep wel s to abstract water from
the population of the basin is expected to almost double by 2020
aquifers. e discharge of inadequately treated wastewater in
compared with 1994; and domestic water use per capita is expected
to increase from 75 to over 120 litres per day by 2020.
Mexico and non-point pol ution sources on both sides of the
border further degrades the region's limited water resources.
Socio-cultural constraints: water was traditionally considered a
public and free resource, which has led to water being heavily
Agricultural demand and trade
subsidised and used wastefully.
A growing population consumes more food which, in turn,
Poor governance and enforcement of water regulations: top-down
requires larger volumes of water. Irrigation-based agriculture
decision-making and weak institutional capacity have hampered
has contributed 80 of the increases in food production since
local participation in the decision-making process and constrained
the 1960s. In most areas, the diversion of rivers and increased
regulatory enforcement.
water storage capacity has facilitated irrigation development.
However, there is hope for the future, as Morocco has radically changed
In a few areas, including parts of South Asia, groundwater
its water policies. The 1995 water law is based on the principles of
extraction makes irrigation possible. In the drought-prone
Integrated Water Resources Management (IWRM), and emphasises
Canary Current region/41, irrigated agriculture consumes
basin-wide water management. The government is also encouraging
the use of micro-irrigation and other efficient irrigation methods.
close to 80 of water withdrawals (Box 6).
Advanced irrigation systems are now commonly used in greenhouses
Irrigation water is often used extremely inefficiently.
for export crops. Other improved practices, such as integrated pest
For example, in the arid Senegal River Basin, less than 50
management, are also becoming more common. The water law
of the water is used productively, particularly in rice and mar-
needs to be fully implemented, so that traditional and modern water
ket gardening crop fields. Many farmers do not recognise the
harvesting systems are considered in future plans for drainage basin
economic cost of wasting water or lack the capital to install
and water resources development.
appropriate irrigation systems.
(SOURCE: CANARY CURRENT/41)


CHALLENGES TO INTERNATIONAL WATERS: REGIONAL ASSESSMENTS IN A GLOBAL PERSPECTIVE
30
FRESHWATER SHORTAGE
31
water-intensive goods. On the other hand, the increased price
BOX 7. THE CONCEPT OF VIRTUAL WATER
of export crops fol owing trade liberalisation can lead to the
Producing goods and services requires water: virtual water is a term
expansion of water-demanding agricultural activities. In Mo-
recently developed to describe the water used to produce agricultural
rocco, for example, water abstraction to irrigate export crops
or industrial products. It is an important concept for calculating the
has increased foreign exchange but at the cost of lowering
total water consumption of a country, or its water footprint, which is
equal to total domestic use, plus virtual water imports, minus virtual
the water table of the Souss Aquifer (Canary Current/41). A
water exports.
similar problem is reported in the Rufiji-Ruvuma sub-system
in East Africa.
Trade in virtual water has increased steadily over the last 40 years:
e concept of virtual water is proving useful in under-
about 15 of water used worldwide for export is virtual water. The
global virtual water trade is estimated to be more than 1 000 kmł an-
standing the volume of water implicitly traded via goods or
nual y, 67 of which is from crops, 23 from livestock and 10 from
services (Box 7).
industrial products.
Hydropower demand
Virtual water trade not only generates water savings for importing
countries, but also global real water savings from differentials in water
Hydropower accounts for almost 20 of worldwide electricity
productivity, which may amount to 385 bil ion mł for food trade alone.
production, and there is potential for further growth, espe-
cial y in developing countries.
SOURCES: (DE FRAITURE ET AL. 2004, ZIMMER & RENAULT 2004)
Although hydropower has been at the centre of success-
ful regional and national development projects, many of these
e Aral Sea/24 region needs to modernise its irriga-
projects have resulted in unnecessarily high environmental,
tion systems and practices, which were inherited from the
social and economic costs. Downstream countries and their
Soviet era. e GIWA regional team identified critical obsta-
ecosystems are the most impacted by the associated water
cles to improving water management, including:
flow changes. Of all the GIWA regions that conducted a causal
Absence of inter-state agreements, which are necessary
chain analysis related to the modification of stream flow, Aral
given the transboundary nature of the major drainage ba-
Sea/24, Gulf of California/27, North Canary Current/41a,
sins;
Guinea Current/42 and Somali Coastal Current/46 identi-
Continuation of centralised planning and regulation of
fied hydropower and irrigation as main sectors responsible
water resources;
for increased diversion of freshwater resources. In the Somali
Poor condition of irrigation systems;
Coastal Current/46 region, less than 50 of the potential
Smal holder farms cannot introduce modern large-scale
hydropower is harnessed, yet the downstream impacts of hy-
water saving technologies.
dropower developments on freshwater availability are already
apparent.
Environmental problems from irrigation are not limited to
e potential for hydropower development has only just
developing countries. In the Australian Bight & Muray Dar-
begun to be utilised in many developing regions. In the Me-
ling Basin (Great Australian Bight/61), more than a century
kong River/55 Basin, only 11 hydropower facilities have been
of agricultural development has required the construction of
constructed, representing 5 of potential development. An
more than 4 000 dams and weirs. Up to 80 of water flow
additional 250 000 GWh per year could be exploited, mainly
has been diverted, primarily for agriculture, resulting in the
in the Yunnan Province of China, Lao PDR and Cambo-
extensive alteration of riverine ecology. Irrigation has also
dia, to meet surging electricity demand in Southeast Asia and
changed the water table and caused the widespread salinisa-
China. Many of the probable environmental and social costs
tion of groundwater, which has degraded cropland, damaged
from future hydropower projects could be avoided if improved
infrastructure and caused widespread loss of wetlands and
practices and designs were adopted, taking into account the
biodiversity.
recommendations by the World Commission on Dams.
Trade poses both risks and opportunities for trans-
boundary water resources. It can promote more efficient use
of water by encouraging water abundant regions to produce


CHALLENGES TO INTERNATIONAL WATERS: REGIONAL ASSESSMENTS IN A GLOBAL PERSPECTIVE
32
FRESHWATER SHORTAGE
33
Market failures
out 75 of the world's water subsidies, amounting to 45 bil-
Market mechanisms do not automatical y lead to the sustain-
lion USD annual y (Pearce 2002). Irrigation farmers are the
able use of water resources. Two market failures are particu-
main recipients and in many GIWA regions in the southern
larly notable for transboundary issues. Firstly, preventing
hemisphere they are not charged for this water. Subsidised
users from accessing water resources through institutional
irrigation water is a problem in the majority of the GIWA
and physical means is difficult, resulting in overuse and
causal chain analyses of freshwater shortage, including the
under-investment. Secondly, water consumption by upstream
Aral Sea/24, Gulf of California/27, Canary Current/41, Lake
users reduces the quantity and sometimes the quality of water Chad/43 and Benguela Current/44.
for downstream users.
Water subsidies al ow farmers to grow water-intensive
In the Lake Chad/43 region, there is little evidence that crops, like alfalfa, citrus or rice, in water scarce regions, and
the large irrigation and water development projects in Nigeria gives them no incentive to invest in water saving devices and
provide any net economic benefits. In fact, it is likely that the new technologies. Furthermore, irrigation subsidies also tend
projects have generated negative returns because of the large
to favour wealthier rather than poorer farmers and consumers.
capital costs and the extensive loss of environmental goods
Water is greatly underpriced in the Yel ow Sea/34 re-
and services previously provided by downstream wetlands.
gion. In China, industrial water use is 5 to 10 times less ef-
It is estimated that the decline in the wetlands represent an
ficient than in industrialised countries, and only 25-30 of
economic cost to the downstream communities of approxi-
irrigation water is effectively utilised, resulting in an annual
mately 9 mil ion USD (discussed in Box 5).
loss of 2.5 mil ion tonnes of grain. e GIWA regional team
e prices consumers from industrialised countries pay
noted that market-based pricing of water would help increase
for crops imported from the southern hemisphere do not in-
efficiency and encourage the use of new technologies.
clude the actual costs of excessive water use.
Irrigation water charges in the Souss-Massa Basin
(Canary Current/41) are averaging only one-tenth of urban
Policy failures
water charges and generating revenues less than 10 of the
Policy interventions frequently create or aggravate environ-
actual cost of the water. is policy encourages farmers to
mental problems, such as establishing inappropriate subsidies
waste water and generates insufficient funds to upgrade irri-
that encourage the overexploitation of water. e subsidies
gation systems. e government's recent pricing reforms aim
and trade distortions of the United States and EU severely im- to gradual y increase water irrigation prices, but at a rate too
pact agriculture and the water economy of developing coun-
slow to achieve any short-term results.
tries. e failure of governments to take action can also affect
Efforts to privatise water supply and wastewater treat-
international waters. For example, in the Yel ow Sea/34 region ment in developing countries has proved chal enging as local
investment in pol ution prevention and wastewater treatment,
users often strongly resist price increases (which reduce sub-
and stronger enforcement of regulations may have averted
sidies).
some of the social and economic costs caused by pol ution.
Additional agricultural subsidies, especial y for energy,
Policies implemented by governments in the Aral Sea/
fertilizers and pesticides, also have considerable impacts on
24 Basin failed to reduce water withdrawals for cotton farms,
water use. ese subsidies are especial y high in developed
causing the Aral Sea to shrink to a fraction of its former size.
countries, averaging 335 bil ion USD annual y in the late
e policy failures include: (i) inadequate use of scientific
1990s, compared with 65 bil ion USD in non-OECD countries
information in the decision-making process; (i ) the lack of a
(Pearce 2002). Energy subsidies for extracting water from
clearly formulated legal framework; (i i) water prices that do
aquifers have resulted in lower water tables in several regions,
not reflect the full costs of water use; and (iv) the absence of a such as the Bay of Bengal/53, Gulf of Mexico/2 and Gulf of
regional water strategy.
California/27.
Inappropriate economic incentives
Knowledge gaps and lack of public engagement
Prices, subsidies and taxes often inadvertently discourage ef-
Knowledge gaps regarding freshwater resources have been
ficient water use. Governments in developing countries give
identified by many GIWA regional teams. A strong knowl-


CHALLENGES TO INTERNATIONAL WATERS: REGIONAL ASSESSMENTS IN A GLOBAL PERSPECTIVE
32
FRESHWATER SHORTAGE
33
edge base is essential for understanding the nature of water
tion, greater pol ution and global climate change may cause
resources and human needs and for identifying priorities for
extreme water scarcity. In many parts of the world, a shortage
policy makers to address. Unfortunately, a lack of techni-
of clean water is predicted to be the most serious threat to fu-
cal and financial resources, and fragmented organisations are
ture socio-economic development.
considerable obstacles to building a knowledge base, espe-
e apparent difficulties in managing freshwater re-
cial y in developing countries.
sources have led to the development of a framework: In-
Information on transboundary aquifers is particularly
tegrated Water Resources Management (IWRM). Accord-
deficient. In reflection of this substantial knowledge gap,
ing to the Global Water Partnership (GWP 2000), IWRM is
GIWA regional teams often assessed changes in the water table "a process that promotes the coordinated development and
only by using indirect indicators, such as the construction of
management of water, land and related resources in order to
deeper wel s and the degradation of subsurface water quality.
maximise the resultant economic and social welfare in an
Many hydrogeologists and international organisations have
equitable manner without compromising the sustainability
acknowledged that the lack of information on transboundary
of vital ecosystems". Sustainable development is impossible
aquifers is a major impediment to water resources manage-
without better environmental management, particularly of
ment. It has led to the establishment of the International
freshwater resources. ere are widespread demands for the
Shared Aquifer Resource Management (ISARM) project in
decoupling of environmental pressure from economic growth.
2000, with the support of UNESCO, IAH, FAO and UNECE.
is is crucial considering the likelihood of rapid economic
Information needs to be communicated to stakeholders, growth in developing countries with large populations. More
including local communities. e Pacific Island/62 regional
efficient infrastructure should be developed to facilitate the
experts recognised the need to increase public awareness of
sustainable use of water resources. Solutions must improve
water use issues and of the impact of poor land management.
environmental quality whilst maintaining human welfare and
Similarly, Senegalese communities downstream of sugar pro-
economic development.
cessors are poorly informed of the dangers posed by the con-
e paradigm shift of water management towards inte-
tamination of their water supply (Canary Current/41).
grated approaches is closely linked with the recognition that
ose excluded from participating in the decision-mak-
entire river basins and their estuaries and adjacent coastal
ing process are often the most affected by unsustainable water areas are single planning units. ere is also a greater appre-
management, e.g. the Senegalese communities discussed
ciation for demand-side management, rather than increasing
above. Stakeholder participation is not only a matter of eq-
supply by building new infrastructure. It complements the
uity; it also has implications for policy efficiency, implemen-
move away from focusing exclusively on the direct economic
tation effectiveness and the longevity of an initiative. e
benefits of engineered structures to understanding their full
major irrigation projects in the Lake Chad/43 Basin, in both
environmental, economic and social effects. Inappropri-
Cameroon and Nigeria, are classic examples of failed stake-
ate subsidies which benefit a minority of water users are also
holder engagement. In both countries, consultation was lim-
slowly giving way to water prices that reflect the actual costs.
ited to government officials with project proponents ignoring
floodplain communities, which ultimately were the most af-
Demand management
fected by the projects (the impacts are described in Box 5).
Demand management aims to change the way people and in-
stitutions use water in order to improve efficiency and reduce
the need for expensive infrastructure development. e GIWA
regional teams identified demand management as an alterna-
POLICY RELEVANT CONCLUSIONS tive or complement to the conventional approach of increas-
ing supply by expanding infrastructure.
e GIWA regional teams predicted that freshwater shortage
e GIWA experts who prepared the Guinea Current/42
will increase in severity in over two-thirds of the GIWA fresh-
regional report stressed the importance of demand manage-
water systems by 2020. In the arid and semi-arid GIWA re-
ment. Specific actions recommended for the urban water
gions, the accumulative impact of increased water consump-
sector included: (i) minimising distribution losses; (i ) en-


CHALLENGES TO INTERNATIONAL WATERS: REGIONAL ASSESSMENTS IN A GLOBAL PERSPECTIVE
34
FRESHWATER SHORTAGE
35
couraging industries to introduce water saving technologies
tional campaigns for "turning the desert green" by irrigation
and practices; and (i i) optimising reservoir management.
have largely proved unsustainable.
eir counterparts in the Central Equatorial Pacific (Eastern
GIWA regional experts also suggested subsidies that en-
Equatorial Pacific/65b) recommended implementing water
courage the adoption of environmental y friendly practices.
reuse practices and providing users with guidance for opti-
e Gulf of Mexico/2 regional team recommended introduc-
mising their water use. In the Benguela Current/4, the three
ing eco-payments, in which wetland owners are paid for the
national governments have historical y impounded water as a
wastewater treatment services provided by their wetlands.
means to control the highly variable supply, but only recently
Subsidies to implement water conservation measures were
have they begun to manage water demand.
recommended for farmers in locations as diverse as north-
e provision of appropriate economic incentives,
ern Nigeria and Southwest United States (Lake Chad/43 and
mainly through the reformulation of subsidies, is a funda-
Gulf of California/27).
mental component of any effective demand management
programme. Although subsidy reforms are plausible, they
International cooperation
are difficult to implement political y. Whilst many regional
Upstream and downstream countries may have different, but
reports discuss the need to reduce water subsidies, concrete
legitimate, interests regarding water use and management
examples remain rare. Hungary successful y rol ed back do-
which can potential y lead to conflict. e international com-
mestic water subsidies in the 1990s, which reduced household munity has devised principles for the use of water in order to
water consumption by around 50 (Black Sea/22). Demand
avoid such conflicts. ese principles are proclaimed in the
management in agriculture means the replacement of water-
UN Convention on the Law of the Non-Navigational Uses of
intensive crops, like citrus fruits and bananas, by less water
International Watercourses (1977) and the UNECE Convention
demanding crops or grassland, despite reduced revenues. Na-
on the Protection and Use of Transboundary Watercourses
and International Lakes (1992). However, the practicality of
TABLE 4. POTENTIAL POLICY INSTRUMENTS RELATED TO FRESHWATER SHORTAGE
Contributing
Potential policy instruments
sector
Underlying root causes
Short-term
Long-term
Modification of stream flow
Inter-state cooperation
Inadequate integration of environmental
considerations
Adoption of modern water saving technologies
Development of normative concepts and
Grant subsidies for implementing water
Lack of clear water strategy
legislation
Agriculture
conservation measures
Unclear legal framework
Implementation of appropriate water-economising Institutionalise water market
Inadequate planning of water usage
technologies
Encourage public participation in the planning
Inadequate incentives
Campaigns to raise public awareness
and implementation of development activities
Insufficient land use management
Improved land use and management practices
Common pool resources
International legal agreements
Energy
Monitoring and treatment facilities for
Inadequate implementation of improved
Enhancement of enforcement mechanisms
production
technology
rehabilitation of water quality
Convert electricity subsidies
Improved efficiency of dams and stream flow
Ineffective promotion of compliance
Promote energy-saving technology
Regional international cooperation agreements
Domestic water Rapid population growth
Initiate shared management of water resources
Integrated management
supply
Migration
Set up viable networks for information col ection
Strengthen family planning programmes
Lack of land use planning
Development of land use plans
Pol ution of existing supplies
Inadequate laws and enforcement for mining
Industry
activities and industrial waste management
Encourage the use of green production technology Enhancement of laws and enforcement
mechanisms
Insufficient investment in wastewater treatment
Public awareness campaign programmes
Agriculture
Lack of public awareness
Adoption of regulations and enforcement
Legal framework to control use of pesticides and
Lack of regulation for exploitation of aquifers
mechanisms
fertilisers
Changes in the water table
Integrated catchment and coastal management
Agriculture
Insufficient management of groundwater use
Salinity targets
Increased cooperation between government and
non-governmental organisations
NOTE: THE TABLE PRESENTS ROOT CAUSES AND POTENTIAL POLICY INSTRUMENTS IDENTIFIED BY GIWA REGIONAL TEAMS.


CHALLENGES TO INTERNATIONAL WATERS: REGIONAL ASSESSMENTS IN A GLOBAL PERSPECTIVE
34
FRESHWATER SHORTAGE
35
these conventions has been limited by their vague and some-
Equatorial Pacific/65b) and the Pacific Islands/62, recognised
times contradictory language and the lack of proper enforce-
the need for education to change the behaviour of producers,
ment mechanisms. Consequently, the impact they have made particularly farmers, and domestic water consumers. Final y,
on international water management has not met expectations. agreements must consider the specific and evolving cultural,
e Atlas of International Freshwater Agreements (UNEP
political, economic and hydrological conditions of riparian
2002) notes that "the presence or absence of institutions [such states.
as treaties] has proven to be one of the most important factors
International conflicts over water are becoming more
influencing co-riparian water relations, exceeding such tradi-
common. Disputes over access to rivers and inland seas are
tional y cited variables as climate, water availability, popu-
occurring in Africa, Central and South Asia, and the Middle
lation density, political orientation, and levels of economic
East. For example, conflict has been provoked by development
development."
projects reducing the flow of the Jordan/51 River by 90.
Despite the complexity of transboundary river basin
management and the potential conflicts of interest, countries
Freshwater policy and global climate change
that share international waters are general y keen to cooper-
Farsighted international and national freshwater policies need
ate and often maintain productive relationships. is is dem-
to account for global climate change in addition to the direct
onstrated in many GIWA regions, including the Black Sea/22,
human root causes of freshwater related problems. Global
Gulf of California/27, Amazon/40b, Canary Current/41 and
climate change will have varying impacts in different parts of
Benguela Current/44.
the world, effecting vegetation and agriculture by tempera-
At the international level, there is a need for a har-
ture increases and shifts in the distribution and severity of
monised strategy for the implementation of conventions and
droughts, precipitation and natural disasters, e.g. flooding.
declarations related to water. e GIWA regional assessments
Global warming will also cause sea levels to rise. Changes in
confirm the need for greater cooperation between riparian
freshwater availability will be one of the most serious conse-
countries. A cooperative management framework is absent in
quences of global climate change (see Box 4), which is pre-
60 of international basins, and in many GIWA regions water
dicted to gain momentum unless drastic measures are taken
al ocation agreements do not exist or have not been imple-
to reduce greenhouse gas emissions. e Kyoto Protocol is a
mented. In the Lake Chad/43 Basin the regional experts
step in the right direction.
recommended the creation of a water al ocation agreement,
Water management must adapt to the effects of climate
which would provide a legal framework for the equitable
change by adopting a holistic approach to managing ecosys-
sharing of the Basin's water resources. Over 80 of interna-
tems on a regional basis. Several GIWA teams advocated an
tional agreements involve only two countries, even though
integrated approach to regional freshwater management.
other countries may also share the river basin (UNEP 2002).
Successful agreements not only al ocate water but ad-
Capacity building for sustainable freshwater
dress a wide range of other issues, such as hydropower, tour-
management
ism and regional development. A fair distribution of benefits
A new generation of scientists and managers is needed to
is more likely to result in a win-win agreement, whereas fo-
address freshwater shortages and the other water problems.
cusing solely on water volume can stall negotiations because
To develop and implement integrated concepts, natural and
the water received by one country equals the water loss of its
social scientists, and policy makers, need to cooperate lo-
neighbour. e Pacific Islands/62 experts explicitly note that
cal y and regional y. Existing expertise has to be enhanced
all stakeholder groups, in addition to the environment, must
and coordinated. However, in most parts of the world there
benefit from new water resources strategies in order for them
are insufficient human resources. According to the GIWA as-
to succeed.
sessments, scientific and technical capacity regarding water
e mechanisms to promote participation, compliance,
research and management needs strengthening. Training pro-
enforcement and conflict resolution are especial y important.
grammes should instil an understanding and appreciation of
In addition to crucial monitoring and enforcement efforts,
the complex interactions between freshwater shortage, climate
GIWA regions, such as the Central Equatorial Pacific (Eastern change, pol ution, overfishing, and habitat modification.


CHALLENGES TO INTERNATIONAL WATERS: REGIONAL ASSESSMENTS IN A GLOBAL PERSPECTIVE
36
37
CHEMICAL OUTFLOW PIPE, NEW ZEALAND.
(SOURCE: K.ADAM/UNEP/STILL PICTURES)
36
37


CHALLENGES TO INTERNATIONAL WATERS: REGIONAL ASSESSMENTS IN A GLOBAL PERSPECTIVE
36
37
36
37
Ocean currents and rivers transport various pol utants over large
distances with transboundary consequences. Complex synergies
between the various contaminants can increase the overall
environmental impact. Global y, the severity of the various pol utants
varies considerably. Suspended matter, resulting mainly from
deforestation and agricultural
activity, has degraded
aquatic ecosystems the most
POLLUTION
extensively, particularly in
the tropics and subtropics.
While eutrophication is widespread in temperate regions, hotspots of
microbial pol ution are extensive in Central America, North Africa &
Middle East and Europe & Central Asia. Solid wastes are dumped into
rivers, lakes, coastal waters and the high seas throughout the world, but
are particularly prevalent in Sub-Saharan Africa. Chemical pol ution,
originating predominantly from agricultural run-off and industrial
and domestic effluents, is severe in several regions. At a mega-regional
level, oil spil s and radio-nuclides were not considered to cause severe
transboundary impacts.
e root causes of pol ution are again agricultural development,
population growth, urbanization and industrialization, as well
as market and policy failures. In most regions it is not the lack
of regulations but their weak enforcement that hinders progress.
Appropriate economic incentives and greater public awareness are
therefore required.


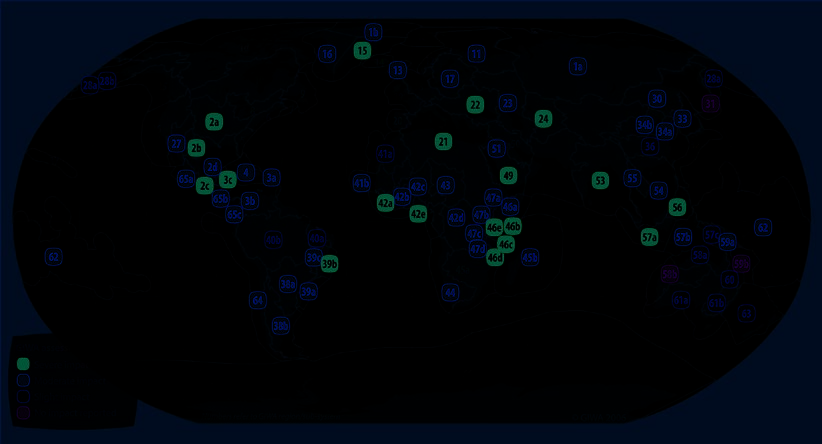
CHALLENGES TO INTERNATIONAL WATERS: REGIONAL ASSESSMENTS IN A GLOBAL PERSPECTIVE
38
POLLUTION 39
e GIWA focuses on eight critical transboundary pol ution
BOX 8. TRANSBOUNDARY POLLUTION
issues (see Annex II):
(i) suspended solids; (i ) eutrophication; (i i) microbial
All pollutants can be transported through the aquatic environment
pol ution; (iv) solid wastes; (v) chemical pol ution; (vi)
and atmosphere, and many accumulate in downstream water
oil spil s; (vi ) radionuclides; and (vi i) thermal pol ution. is
bodies and their biota. The probability that pollution will cause
last issue is not discussed further in this report as it was gen-
transboundary impacts depends on the location of its source in re-
lation to national boundaries, as well as the time it takes for a given
eral y not considered to be a transboundary issue.
pollutant to degrade. In general, microbial pollution is primarily a
Pol ution is often transboundary as hydrological in-
local problem, whereas suspended solids, hydrocarbons and nu-
terlinkages between river basins, marine ecosystems and the
trients pose a risk over larger spatial areas. The risk of transbound-
atmosphere result in effects far from the source of emissions
ary impacts tends to be highest for persistent organic pollutants
(Box 8). is global synopsis provides a broad overview of
(POPs), particularly substances that readily migrate between water
transboundary pol ution based on the GIWA regional reports.
and air (such as DDT and mercury). Although other persistent pol-
Many of the reports assess pol ution impacts on smal er geo-
lutants, such as PCBs and heavy metals (e.g. cadmium), are less
graphic scales and should be consulted for more detailed in-
mobile, they also have transboundary aspects. As pollution tran-
scends national boundaries, international cooperation is required
formation.
to reduce human and environmental health risks.
Global situation and trends
Transboundary pol ution is the top priority concern in a
coral reefs, seagrasses and riverine habitats in one fifth of
quarter of all GIWA regional reports, and a further third
the GIWA regions/sub-systems, including the Caribbean
of the regional teams ranked it as the second most serious
Sea/3, Brazil Current/39 and East African Rift Val ey
concern.
Lakes/47, and all regions in Southeast Asia.
Pol ution has a severe overall impact in more regions than
Microbial pol ution, primarily from untreated or inad-
any other concern (Figure 8).
equately treated human and livestock sewage, is a severe
Suspended solids, which have increased mainly as a result
health issue in many parts of Sub-Saharan Africa, South-
of deforestation and agricultural practices, severely affect
east and Northeast Asia, and Central and South America.
FIGURE 8. OVERALL ENVIRONMENTAL AND SOCIO-ECONOMIC IMPACTS OF POLLUTION


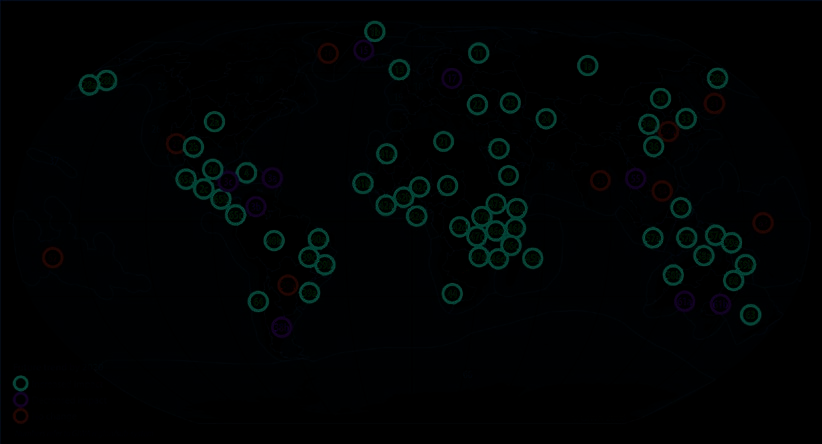
CHALLENGES TO INTERNATIONAL WATERS: REGIONAL ASSESSMENTS IN A GLOBAL PERSPECTIVE
38
POLLUTION 39
FIGURE 9. FUTURE ENVIRONMENTAL TRENDS FOR POLLUTION
Eutrophication is prevalent in many of the lakes, rivers
ENVIRONMENTAL AND
and semi-enclosed seas of Europe & Central Asia and
SOCIOECONOMIC IMPACTS
Sub-Saharan Africa. Evidence from Northeast Asia and
the Gulf of Mexico indicates that eutrophication is an
emerging problem in open coastal marine environments.
Suspended solids
e dumping of solid wastes is a priority issue in many
More than half of the GIWA regional teams identified sus-
rivers and coastal areas of Sub-Saharan Africa, in Small
pended solids as having severe or moderate impacts, concen-
Island Developing States (SIDS), parts of the Indonesian
trated particularly in tropical regions (Figure 10). Increased
Seas/57 and along stretches of the Rio Grande (Gulf of
erosion and sediment mobilisation, caused by agricultural
Mexico/2b).
practices, deforestation and construction, is resulting in
Chemical pol ution is a transboundary issue at several
higher concentrations of suspended solids. Conversely, river
hotspots in Central America, West Africa, South Asia,
diversion and damming often results in reduced sediment
and Southeast Asia, as well as the Jordan River/51, Aral
transport. Excessive suspended solids increase turbidity and
Sea/24 and the Arctic Rim.
siltation, while reduced sediment yields may lead to coastal
e impact of oil spil s was assessed as severe in the Ca-
erosion and lower primary productivity as nutrients are often
ribbean Sea/3, Niger Basin/42c and Benguela Current/44.
bound to suspended solids. e same water body may expe-
By 2020, the environmental impacts of pol ution are pre-
rience environmental impacts from both increased and de-
dicted to increase in severity in over three-quarters of
creased suspended solids, but in different locations.
GIWA regions/sub-systems, making this the most negative
Sediments can smother coral reefs, seagrass beds and
future outlook for any of the GIWA concerns (Figure 9).
riverine gravel beds that are important spawning habitats for
fish. A high concentration of suspended solids also tends to
decrease the productivity of an ecosystem by reducing the
penetration of sunlight through the water column, particu-
larly affecting benthic ecosystems. Increased sediment trans-


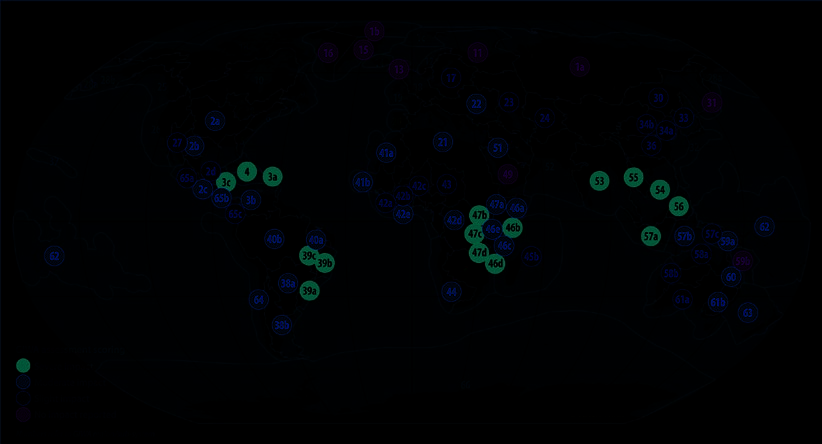
CHALLENGES TO INTERNATIONAL WATERS: REGIONAL ASSESSMENTS IN A GLOBAL PERSPECTIVE
40
POLLUTION 41
FIGURE 10. IMPACTS OF SUSPENDED SOLIDS
port related to intensive deforestation can change down-
agriculture and mining has increased riverbed and coastal
stream floodplains and river deltas, thus impacting flora and
zone siltation, which is impeding navigation along the heav-
fauna.
ily transited Săo Francisco River. Erosion from land-use
e Brazil Current/39 region il ustrates both the com-
changes in Paraná state (Brazil) has increased river turbid-
plexity and the potential severity of the impacts of increased
ity considerably, resulting in higher water treatment costs for
suspended sediments. e deforestation of large areas for
over 200 cities. e diversion and damming of waterways has
FIGURE 11. RUN-OFF FROM BAUXITE MINING IN JAMAICA
(PHOTO: CORBIS)


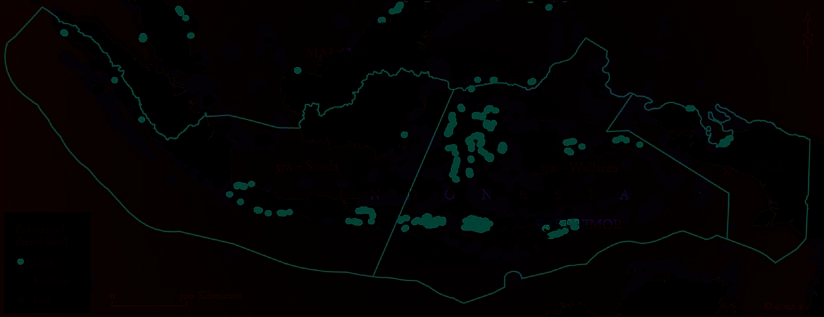
CHALLENGES TO INTERNATIONAL WATERS: REGIONAL ASSESSMENTS IN A GLOBAL PERSPECTIVE
40
POLLUTION 41
trapped sediments in reservoirs, which has negatively affected
the sediment erosion-accretion dynamics of most rivers in the
eastern part of the region. Extensive erosion of the coastline
resulting from reduced sediment accretion is destroying the
fringes of mangrove forests and dunes.
In the Caribbean, deforestation, inappropriate manage-
ment of agricultural land, mining and urbanisation have in-
creased erosion rates and resulted in greater sediment loads in
streams, rivers and coastal waters (Figure 11). Deforestation
to clear land for agriculture is considered the most signifi-
cant cause of erosion, particularly in Jamaica and Haiti. e
prevalence of suspended sediments has decreased biodiver-
sity, severely degrading shal ow coastal waters. For example,
increased sedimentation and turbidity have adversely affected
coral reefs by reducing light penetration necessary for photo-
synthesis, as well as scouring and smothering corals. Greater
FIGURE 12. DEFORESTATION ON JAWA, OCTOBER 2002
turbidity in coastal waters and elevated algal cover on reefs
ISLANDS OF FOREST APPEAR GREEN AGAINST THE PALER LANDSCAPE. IN
NEARLY EVERY PATCH ACTIVE FIRES CAN BE SEEN (RED DOTS).
is attributed to nutrient enrichment and sedimentation from
(PHOTO: NASA)
coastal development, particularly in Puerto Rico and the Ba-
hamas.
and nutrient loads have transformed significant stretches of
Large quantities of sediment enter Lake Tanganyika
Lake Tanganyika's shoreline from rocky substrates to mixed
(East African Rift Val ey Lakes/47) as a result of increased
or sandy substrates.
erosion caused by land-use changes in its catchment. Sat-
In the Indonesian Seas/57 region, the limited size
el ite images revealed that, as early as 1991, 40-60 of the
of river catchments and high rates of deforestation leads
original forest cover in the Lake's central basin and almost
to extensive sediment run-off (Figure 12). In the Java Sea,
100 in the northern basin had been cleared. Increased ero-
enormous quantities of sediment are discharged into coastal
sion resulting from the same pattern of converting forests to
waters, carrying particle-bound nutrients which stimulate
farms has also affected Lake Malawi. e loss of soil not only widespread eutrophication. Figure 13 shows reefs at risk due
threatens agricultural production for rural communities but
to sedimentation in the region. Sedimentation has been det-
negatively impacts water quality. e increasing sediment
rimental to tourism, the artisanal fisheries and aquaculture.
FIGURE 13. CORAL REEFS AT RISK FROM SEDIMENTATION IN THE INDONESIAN SEAS REGION
(SOURCE: BURKE ET AL. 2002)


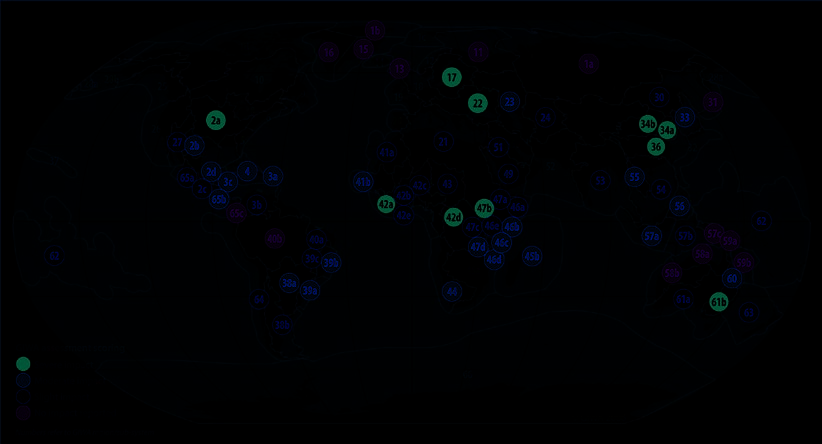
CHALLENGES TO INTERNATIONAL WATERS: REGIONAL ASSESSMENTS IN A GLOBAL PERSPECTIVE
42
POLLUTION 43
FIGURE 14. IMPACTS OF EUTROPHICATION
Eutrophication
Elevated concentrations of nitrogen and phosphorus in
BOX 9. THREATS FROM HYPOXIC ZONES
aquatic systems has resulted from the increased application
Hypoxia occurs when the decomposition of organic matter causes
of fertilizers, the discharge of industrial and domestic waste,
the concentration of dissolved oxygen to fall below 2 ml/l. As a
animal production, the combustion of fossil fuels and nutri-
result, aquatic organisms are deprived of oxygen and many die.
ent mobilisation due to land clearing. ese additional nutri-
Several GIWA regional assessments reported dead zones consist-
ents stimulate algal growth and alter the balance between the
ing of hundreds or even thousands of square kilometres of hypoxic
water. They have become increasingly common in the world's
production and decomposition of organic matter, leading to
lakes, estuaries and coastal zones, with serious impacts on local
eutrophication in many parts of the world (Figure 14).
fisheries, biodiversity and ecosystem functions. Extensive dead
e proliferation of fast-growing algae increases fish
zones have been observed for many years in the Baltic Sea/17, Black
stocks in the short-term but decreases species diversity. Oxy-
Sea/22 and Gulf of Mexico/2.
gen concentrations are depleted when large volumes of or-
The GIWA assessment has compiled information on dead zones in
ganic matter decompose, causing the widespread degradation
the Southern Hemisphere, including several lagoons in the Brazil
of aquatic habitats. Eutrophication can generate large hy-
Current/39 region, coastal locations in the Humboldt Current/64
poxic zones, a phenomenon which is increasing in frequency
region, and in the Yangtze River estuary located in the East China
and severity on a global scale (Box 9). A number of GIWA
Sea/36 region.
regional teams have noted that hypoxic zones and harmful
algal blooms (HABs) are the most visible ecosystem reactions
trophic level of the food web, comparable to the concept of
to eutrophication (e.g. Black Sea/22, Gulf of Mexico/2, Baltic `fishing down the food web' (see the chapter on overfishing
Sea/17, Brazil Current/39 and Pacific Islands/62). More subtle and other threats to living resources).
changes include shifts in the food web, resulting in changes
e transboundary inland and semi-enclosed seas of
to phytoplankton, zooplankton and benthic communities, as
Europe are significantly affected by land-based pol utants,
well as fish populations. e initial increase in primary and
especial y nutrients from excessive fertilizer application in
secondary production often leads to a decline in the mean
their catchments, which tend to accumulate in the waters and


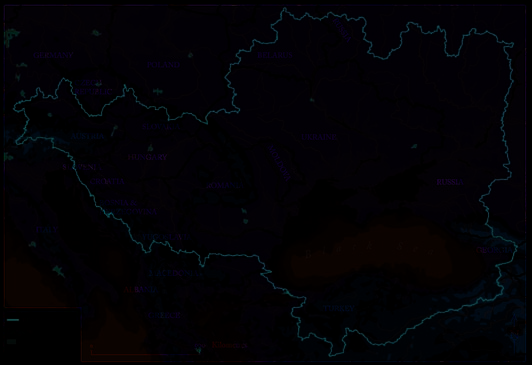
CHALLENGES TO INTERNATIONAL WATERS: REGIONAL ASSESSMENTS IN A GLOBAL PERSPECTIVE
42
POLLUTION 43
sediments due to limited water exchange. In the Baltic and
fishes. Wetlands in the Congo River Basin are also suffering
Black Seas, the increased frequency of algal blooms fol owed
from eutrophication, which is attributed to the flat morphol-
by extended hypoxic events has affected the ecosystems of the ogy of the coastal plains and the discharge of insufficiently
region (Box 10).
treated wastewater from the many cities in the Basin (Guinea
e GIWA assessments highlighted the widespread
Current/42d).
transboundary effects of eutrophication in freshwater sys-
Although the extent of eutrophication in coastal ma-
tems. is is evident in lakes, such as Lake Victoria, where
rine areas is largely restricted to estuaries and inner shelf
eutrophication combined with overfishing and the intro-
areas, its expansion into open marine areas, such as the Gulf
duction of alien species has altered the Lake's ecosystem
of Mexico/2, is recognised as a future threat. Higher water
and consequently decreased the variety of endemic cichlid
BOX 10. EUTROPHICATION: CASE OF THE BLACK SEA
The Black Sea is one of the world's largest
20th century. Today, nearly 650 000 tonnes
via ship ballasts, have proliferated at the
inland seas, with twenty-three countries
of nitrogen and more than 50 000 tonnes
detriment of native species (see Box 26 in the
partially or completely contained within its
of phosphorus enter the Black Sea annu-
chapter on overfishing).
catchment area. Three of the four largest riv-
ally. Communities in the basin discharge
The degradation of the Black Sea has re-
ers in Europe flow into the Black Sea, namely,
2 500 million mł of wastewater every year,
sulted in substantial economic costs. For
the Danube, Dnipro and Don, and more than
much of it untreated.
example, tourism revenues have declined by
160 million people live in its catchment area.
The high nutrient loads have resulted in
an estimated 360 million USD annually, and
In the past 30 years, human activity has
extensive eutrophication in the northwest
coastal communities lose 120 million USD
transformed the Black Sea from a diverse
of the Black Sea, the Azov Sea and the lower
every year from reduced fishing yields.
ecosystem supporting varied marine life to a
sections of the Danube and Dnipro rivers. In
The countries surrounding the Black Sea in-
eutrophic plankton-based system. Eutrophi-
2000, a hypoxic area of 14 000 km˛ covered
creasingly recognise the need to cooperate
cation was identified by the GIWA regional
shallow parts of the Black Sea in addition
in addressing pollution. National water poli-
team as the most critical environmental
to the permanently hypoxic deep waters of
cies are being adapted to conform to the EU
issue, primarily caused by excessive nutrient
the Black Sea basin. Harmful phytoplankton
Water Framework Directive. This will create
loading from agricultural run-off (80) and
blooms and toxic red tides have become a
greater harmonisation and integration re-
sewage discharges (15). The application of
regular occurrence in the last 25 years. While
garding environmental protection and water
fertilizers in the Black Sea drainage basin in-
native species diversity has been reduced by
management, and ultimately, improve the
creased rapidly during the second half of the
eutrophication, invasive species, introduced
environmental conditions of the Black Sea.
Despite this progress, eutrophication and
harmful algal blooms are expected to in-
crease in prevalence and severity by 2020.
Although additional sewage treatment fa-
cilities are planned, the region will still lack
the capacity to treat increasing quantities of
wastewater. Improvements in agricultural
practices owing to the adoption of EU envi-
ronmental policies will reduce nutrient load-
ing in the Danube River Basin. On the other
hand, greater fertilizer application in Russia,
Belarus and the Ukraine will increase nutri-
ent loads discharged by the Don and Dnipro
rivers. This differing outlook for the region's
various river basins highlights the need to
adopt integrated transnational approaches
to rehabilitate the entire Black Sea.
(SOURCE: BLACK SEA/22)


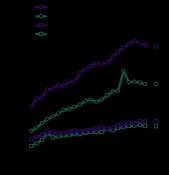

CHALLENGES TO INTERNATIONAL WATERS: REGIONAL ASSESSMENTS IN A GLOBAL PERSPECTIVE
44
POLLUTION 45
temperatures resulting from climate change may exacerbate
BOX 11. HARMFUL ALGAL BLOOMS: CASE OF THE EAST
eutrophication.
CHINA SEA
e Humboldt Current/64 region, shared by Chile,
Ecuador and Peru, produces more than 20 of the world's
Between 1993 and 2003, the
number of harmful algal
total fisheries output. e numerous fish processing plants,
blooms (HABs) in the East
which discharge their wastes directly into the ocean, are a
China Sea have increased
major source of nutrient enrichment in coastal waters. is
from 10 to 86 events per
causes eutrophication and hypoxia in semi-enclosed bays,
year and they cover an area
particularly in Peru, which are also susceptible to toxic algal
of up to 13 000 km˛. The
blooms. e growing aquaculture sector is another important
blooms have caused the
source of nutrients for eutrophication. e amount of waste
mortality of fish and ben-
produced by Chilean salmon farms is comparable to that
thic animals, resulting in considerable environmental and socio-
economic costs. The blooms mostly occur in the inner shelf of the
generated by a city of over 2 mil ion inhabitants. For more
Yangtze (Changjiang) River. This has been attributed to a 250 in-
information on the fisheries and aquaculture industry, see the
crease in fertilizer application in the catchment area, particularly in
chapter on overfishing and other threats to living resources.
the upstream and coastal provinces of Anhui and Jiangsu.
Eutrophication favours the development of HABs, in-
(SOURCE: EAST CHINA SEA/36)
cluding red tides. Red tide events, original y referring to red-
dish-coloured algal blooms, is now a term used to character-
ise the explosive growth of toxin-producing microbes that
can cause disease or mortality in fish, wildlife and consumers
of contaminated shel fish. In eutrophic freshwater systems,
blooms of cyanobacteria and other potential y harmful algae
are common. For example, hepatotoxins released by algal
blooms in eutrophic reservoirs of Brazil have poisoned hun-
dreds of people. In the Yel ow and East China Seas, increases
in the frequency, extent and duration of HABs since the 1970s
e Sea of Japan/33, which is bordered by China, Japan,
are correlated with increased use of fertilizers (Box 11). Even
North and South Korea and Russia, is also experiencing
if HABs are confined to relatively restricted areas, they are
harmful effects from eutrophication, including a decline in
often transboundary in nature as the nutrient source is from
the aesthetic value of lakes and reservoirs, reduced drinking
another country and/or the contaminated shel fish are ex-
water quality and HABs. Although al the countries in the re-
ported. Furthermore, HAB organisms are transported over
gion recognise that inadequate treatment of human waste and
long distances by shipping traffic.
agricultural run-off are the major causes of eutrophication,
Eutrophication has been a contributing factor in reduc-
the developing countries cannot afford secondary and teritary
ing fisheries production. In the Yel ow Sea/34, for example,
treatment that is necessary to reduce the nutrient and organic
it has caused drastic declines in catches of penaeid shrimps
loads of rivers, lakes and the sea.
(Penaeus spp.) and scal ops (Pecten spp.). In many parts of
Sub-Saharan Africa, including the Comoe River, Niger
Microbial pol ution
Delta and East African Rift Val ey Lakes, eutrophication of
In many GIWA regions, inadequately treated human sewage is
rivers and lakes has contributed to the "explosion" of aquatic
the major source of microbial pathogenic pol ution. Improved
weeds, particularly Water hyacinth (Eichhornia cras ipes).
sanitation is one of the fundamental Mil ennium Develop-
ese weeds have clogged waterways, disrupted navigation
ment Goals (MDGs), which is discussed further in the chapter
routes, reduced hydroelectric power generation and increased
on freshwater shortage. Animal wastes are also an impor-
water treatment costs. e GEF, UNDP and the World Bank
tant contributor, especial y near large industrial farms such
are funding projects to control invasive aquatic weeds in Lake as those located around the Upper Uruguay River in Brazil
Victoria and the Comoe Basin.
(Patagonian Shelf/38). e contamination of public water


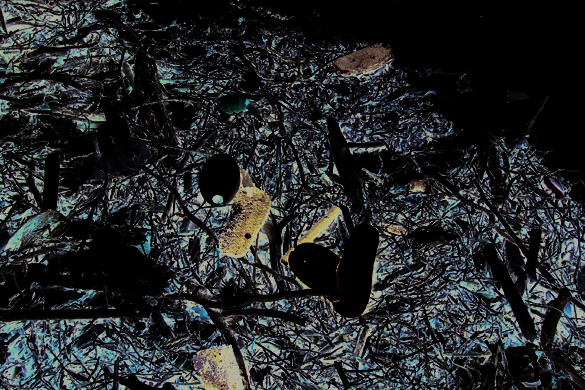
CHALLENGES TO INTERNATIONAL WATERS: REGIONAL ASSESSMENTS IN A GLOBAL PERSPECTIVE
44
POLLUTION 45
supplies or bathing waters by infectious pathogens creates se-
rious health problems, particularly in low-income areas with
inadequate drinking water treatment, sanitation facilities or
drainage basin protection. Pathogens can accumulate in fil-
ter-feeding mol uscs and other seafood, posing health risks to
human consumers.
Microbial pol ution is normal y localised, but its root
causes and consequences can be transboundary. According to
the GIWA regional teams, many international freshwater sys-
tems suffer from severe microbial pol ution. Marine micro-
bial pol ution was assessed as severe in the Gulf of Mexico/2,
Caribbean Small Islands/3a, Comoe Basin (Guinea Current/
42a), Indonesian Seas/57a and the Eastern Equatorial Pacific/
65c. e high bacterial counts recorded in many bays of the
Small Islands/3a were attributed to failed septic systems,
inadequate or lacking wastewater treatment and discharges
from vessels, including cruise liners. In Indonesia, all major
FIGURE 15. SOLID WASTE ON BEACH, GRAND COMORES
(PHOTO: R. PAYET)
rivers in Jawa and Sumatra, as well as coastal areas in the
Jawa Sea, have elevated coliform concentrations, and conse-
problem as rivers and ocean currents transport land-based
quently the incidence of bacterial gastro-enteric disorders has and ship-borne wastes across vast distances. Improperly dis-
recently increased due to the consumption of contaminated
posed solid wastes provide breeding environments for vermin,
fisheries products.
which may, in turn, become disease vectors. GIWA regional
e aquaculture industry in many developing regions,
teams determined that solid wastes are a common problem
such as the Bay of Bengal/53, Humboldt Current/64 and
in the majority of GIWA regions, but are particularly severe in
South China Sea/54, has been adversely affected by trans-
many regions of Africa, the Pacific Islands/62 and on Sunda
boundary microbial pol ution as the contamination of sea-
in the Indonesian Seas/57 region.
food has resulted in reduced exports.
Solid waste is the most severe pol ution issue for the
Microbial pol ution is extensive in the Humboldt
Indian Ocean Islands/45b. At least 2.8 mil ion tonnes of solid
Current/64 region, with high coliform concentrations re-
waste is generated annual y in the region, of which only 30
corded along the entire Southeast Pacific coastline. Over 80 is col ected routinely. In addition to impacting coastal and
of wastewater from Peru, Ecuador and Chile is discharged
marine ecosystems, solid wastes also affect local tourism,
without treatment. Diarrhoea, caused by poor sanitation
damage fishing nets and jeopardise the safety and livelihood
conditions, is mainly responsible for the high rates of child
of fishers and recreational boaters. Solid wastes, especial y
mortality and morbidity in Ecuador and Peru. Municipal
containers, provide a habitat for mosquitoes, and have sub-
wastewater treatment is also inadequate in the Patagonian
sequently increased the prevalence of malaria in Madagascar
Shelf/38 region. e coastal states of Brazil, Argentina and
and Comoros.
Uruguay only have the capacity to treat 20-30 of their efflu-
In the Caribbean Islands/4 region, a large proportion
ent. Intensive poultry and swine breeding facilities in Brazil
of marine debris originates from shipping traffic. In addition
also contribute large quantities of microbial pol utants to the
to local y produced solid waste, an estimated 700 000 tonnes
Uruguay River Basin.
of solid waste is generated annual y by the 35 mil ion tour-
ists who visit the Caribbean, many on cruise liners. e ports
Solid wastes
in the region lack waste col ection facilities and many ships
Solid wastes, such as fishnets, and plastics and rubbish from
dump their waste at sea. e large quantity of marine debris
households and industry, are a major aesthetic nuisance and
deposited on beaches impacts tourism, the cornerstone of the
can harm fish and other wildlife. ey are a transboundary
region's economy.


CHALLENGES TO INTERNATIONAL WATERS: REGIONAL ASSESSMENTS IN A GLOBAL PERSPECTIVE
46
POLLUTION 47
Chemical pol ution
Islands/4 region is often higher downstream from agricul-
In the GIWA methodology (see Annex II), chemical pol ution
tural areas known to use pesticides. In Jamaica, for example,
refers primarily to persistent organic pol utants (POPs) (e.g.
an increase in fish mortality in coastal areas occurs seasonal y
PCBs, dioxins, furans, DDT and toxaphene) and heavy met-
when pesticides are applied to coffee plantations.
als (e.g. mercury and cadmium). ese toxic chemicals are
ubiquitous as they travel long distances dissolved in water,
Oil Spil s
adhered to sediments, transported by air or transferred in the Oil tankers, vessel accidents, coastal oil refineries and pipe-
food chain, but usual y only in small concentrations. How-
lines are all potential sources of spil s which can cause sig-
ever, there are chemical pol ution hotspots which pose sig-
nificant, although mostly short-term, impacts on the envi-
nificant health risks to humans and wildlife. Although chem-
ronment. Lakes and semi-enclosed seas, such as the Black
ical pol ution was considered severe in only nine regions, in a
Sea/22, Caspian Sea/23, and Baltic Sea/17, are particularly
further 35 the impacts were assessed as moderate.
vulnerable to the impacts of oil spil s due to limited or no
In the Arctic, the presence of persistent pol utants
water exchange.
transported by the atmosphere and currents is a major con-
e impact of oil spil s was assessed as severe in most of
cern. Marine organisms, and consequently food, obtain POPs
the transboundary waters of the Caribbean Sea/3, Niger Basin
from the surrounding environment and indirectly through
(Guinea Current/42c) and Benguela Current/44. In the future,
biomagnification in marine food webs, resulting in consump-
oils spil s are most likely in areas already intensely exploited for
tion restrictions for specific species. Exposure to POPs in
oil and around oil fields currently under development.
some Greenland districts is among the highest ever mea-
Nearly 5 000 oil spil s in the Niger River delta were re-
sured. Neurobehavioural effects from POP exposure have been ported between 1976 and 1996, releasing nearly 375 000 tonnes
observed in children in some areas of the Arctic.
of oil in total. is has resulted in groundwater contamination
One of the most heavily pol uted river systems in the
and a loss of biodiversity in the vicinity of oil instal ations. Oil
world is the Ganges-Brahmaputra, where chemical and mi-
crobial pol ution is prolific. e concentrations of several
chemical contaminants, including chromium, cadmium,
mercury and lead, exceed health standards by between 10 and
100 times in both India and Bangladesh. e Ganges River
is a major recipient of industrial waste from Indian factories.
Downstream in Bangladesh, about 6 000 large- and me-
dium-scale industries and another 24 000 smal -scale indus-
tries also discharge their waste directly into the river.
In Central America, pesticides applied to sugar cane,
banana and coffee plantations have caused human mutations,
miscarriages and sterility in local populations. Pesticide con-
tamination is also partly responsible for reduced fish stocks
in the Nicoya Gulf of Costa Rica. An ongoing GEF/UNEP
project addresses these problems by reducing the use of agri-
cultural pesticides in Colombia, Costa Rica and Nicaragua.
In the adjacent Small Islands of the Caribbean Sea region,
agriculture is also the primary sector causing water pol ution,
mainly through agro-chemical leaching, direct agro-chemi-
cal influx from aerial spraying and improper disposal of solid
wastes. is situation is exacerbated by the increasing use of
low-lying wetlands for rice cultivation, which requires heavy
pesticide use. Fish mortality in the neighbouring Caribbean


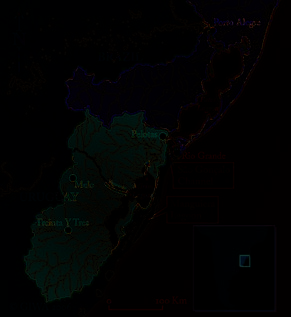
CHALLENGES TO INTERNATIONAL WATERS: REGIONAL ASSESSMENTS IN A GLOBAL PERSPECTIVE
46
POLLUTION 47
BOX 12. POLLUTION SYNERGIES AND INTERACTIONS: CASE OF THE PATOS/MIRIM LAGOON SYSTEM
Pollution is often just one of several human
Patos/Mirim Lagoon system, located on the
ment has resulted in greater sedimentation,
stressors affecting an ecosystem. An ex-
border between Brazil and Uruguay. The
increased dredging to maintain navigation
ample of a transboundary system affected
lagoon system includes extensive estuarine
routes, reduced tourism and increased water
by multiple anthropogenic activities is the
habitats that in the past provided Brazil with
treatment costs. It has also invoked conflict
over 25 of its fish catches.
over water quality between Uruguay and
Brazil. The increased water turbidity has
Over the last 30 years, rice cultivation
decreased primary productivity, which com-
has become the principal agricultural
bined with overfishing and pollution has
activity and now uses 97 of the water
reduced fish stocks.
withdrawn from the Mirim Lagoon. In
addition, large amounts of biocides and
The Patos/Mirim Lagoon system is an all too
fertilizers are applied to the rice pad-
common example of synergies between
dies. The contaminated run-off pollutes
multiple stressors where the combined
water supplies and increases water
impacts are greater than the sum of the im-
treatment costs. The Patos Lagoon is
pacts from individual stressors. In this case,
further polluted by the discharge of do-
as in many others, pollution often drives
mestic sewage and industrial effluents.
other environmental changes, such as habi-
tat modification.
Deforestation to clear land for agricul-
tural expansion and urban develop-
(SOURCE: BRAZIL CURRENT/39)
spil s frequently occur in the Russian Arctic/1a and the Sea
Radionuclides
of Okhotsk/30 due to the use of antiquated equipment. Every
e transboundary impact of radionuclides was assessed as
year, about 300 spil s are official y recorded
severe in only two GIWA regions: the Pacific Islands/62 and
in western Siberia, but the actual figure
the Benguela Current/44. In the Pacific Islands/62, there is
could be significantly higher. e degrada-
concern over recent nuclear weapons testing by France on
tion and dissipation of hydrocarbons tends
Muroroa and past tests by the United States on the Marshall
to be slowed by low temperatures, so Sibe-
Islands. In the Benguela Current/44 region, uranium mining
ria and other cold regions, such as the Bar-
may have contaminated freshwater ecosystems in East Rand,
ents Sea and the rest of the Russian Arctic,
South Africa. e large amount of radioactive waste and the
face disproportionately higher impacts from numerous nuclear submarine bases in areas of Russia border-
oil spil s.
ing the Barents Sea and the Arctic Seas also require careful
Emergency response and clean-up
management.
operations for large oil spil s are extremely
costly. In the Caribbean Islands/4, the spill e interactions between the various pol utants and the other
off San Juan, Puerto Rico in 1994 (Fig-
GIWA concerns are highlighted in the case of Patos/Mirim
ure 16) required more than 1 000 workers
Lagoon system (Box 12).
and more than 87 mil ion USD for clean-
up operations. Surveys carried out in Cuba,
Puerto Rico and the Dominican Republic
showed that tourism revenues have been
ROOT CAUSES
reduced due to the pol ution of beaches by
marine debris and tar bal s.
A causal chain analysis for pol ution was conducted for
22 GIWA regions (Tables 5 and 6). Eutrophication, chemical
FIGURE 16. OIL SPILL CAUSED BY THE
BARGE MORRIS J. BERMAN OFF SAN JUAN, pol ution and suspended solids were the issues most fre-
PUERTO RICO 1994
(PHOTO: NOAA)
quently targeted for analysis.


CHALLENGES TO INTERNATIONAL WATERS: REGIONAL ASSESSMENTS IN A GLOBAL PERSPECTIVE
48
POLLUTION 49
TABLE 5. IMMEDIATE CAUSES OF THE GIWA CONCERN POLLUTION
Targeted issues
Suspended
solids
Eutrophication
Microbiological
pol ution
Chemical pol ution
Oil
spil s
Immediate causes
s
e
r
s
s
e
n
p
u
t
s
o
f
f
o
f
f
o
f
f
e
f
i
n
i
n
g
u
n-
n
e
r
g
y
f
f
l
u
e
n
t
o
m
e
s
t
i
c
u
n-
o
m
e
s
t
i
c
e
a
c
h u
i
n
i
n
g
u
n-
n
d e
n
d d
n
d d
t
m
o
s
p
h
e
r
i
c
r
o
m b hips
n
d m
a
n
d
f
i
l
s
t
m
o
s
p
h
e
r
i
c i
i
s
c
h
a
r
g
e
s
r
u
i
s
e s
x
t
r
a
c
t
i
o
n
, r
r
a
n
s
p
o
r
t
GIWA region
a
s
t
e d
D
e
f
o
r
e
s
t
a
t
i
o
n
A
g
r
i
c
u
l
t
u
r
a
l l
a
n
d u
A
g
r
i
c
u
l
t
u
r
a
l r
T
r
a
n
s
p
o
r
t a
s
e
c
t
o
r a
A
q
u
a
c
u
l
t
u
r
e e
I
n
d
u
s
t
r
i
a
l a
d
i
s
c
h
a
r
g
e
D
e
f
o
r
e
s
t
a
t
i
o
n
A
g
r
i
c
u
l
t
u
r
a
l r
I
n
d
u
s
t
r
i
a
l a
d
i
s
c
h
a
r
g
e
s
D
i
s
c
a
r
d
s f
a
n
d c
L
o
n
g
-
r
a
n
g
e a
t
r
a
n
s
p
o
r
t
I
n
d
u
s
t
r
y a
d
i
s
c
h
a
r
g
e
s
W
A
g
r
i
c
u
l
t
u
r
a
l r
L
e
a
k
i
n
g l
O
i
l e and t
a Russian Arctic
a Mississippi River (Gulf of Mexico)
Caribbean Islands
Barents Sea
Faroe Islands
East Greenland Sea
Baltic Sea
Black Sea
Sea of Okhotsk
Sea of Japan
East China Sea
a Mirim Lagoon (Brazil Current)
b Doce River Basin (Brazil Current)
a Comoe Basin (Guinea Current)
e Guinea Current LME (Guinea Current)
b Lake Victoria (East African Rift Val ey Lakes)
Humboldt Current
a Southwest Mexico (Eastern Equatorial Pacific)
NOTE: THE TABLE PRESENTS A SELECTION OF GIWA REGIONS WHERE THE REGIONAL TEAM HAS CONDUCTED A CAUSAL CHAIN ANALYSIS ON THE FIVE MOST FREQUENTLY
ANALYSED ISSUES OF THE GIWA CONCERN POLLUTION.
is section groups the root causes of pol ution into
In the Humboldt Current/64 region, the urban popula-
three broad and interlinked categories: (i) demographic and
tion has increased rapidly and now accounts for 74 of the
economic trends; (i ) market failures; and (i i) policy failures.
total population of 41 mil ion. Migration to urban areas was
Demographic and economic trends
Water consumption and wastewater generation in-
creases in paral el with population growth and ur-
banisation. Many GIWA regional assessments found
that urban wastewater treatment coverage has failed to
increase at the same rate as urban growth in develop-
ing regions (Figure 17). Untreated urban wastewater
was identified as a major source of microbial pol u-
tion and nutrients in Lake Victoria. Other regional
teams that highlighted discharges from urban areas as
an important source of pol utants include the Hum-
boldt Current/64, Eastern Equatorial Pacific/65, Indian
Ocean Islands/45b, Guinea Current/42, East China Sea/
FIGURE 17. PROPORTION OF TREATED URBAN WASTEWATER IN
36 and Black Sea/22.
DIFFERENT CONTINENTS OF THE WORLD
(SOURCE: WHO/UNICEF 2000)


CHALLENGES TO INTERNATIONAL WATERS: REGIONAL ASSESSMENTS IN A GLOBAL PERSPECTIVE
48
POLLUTION 49
TABLE 6. POTENTIAL POLICY INSTRUMENTS RELATED TO THE GIWA CONCERN POLLUTION
Contributing
Potential policy instruments
sector
Underlying root causes
Short-term
Long-term
Eutrophication
Redesign agricultural subsidies to foster efficient use of
Encourage alternative fertilizing techniques
Subsidies for chemical fertilizers
Agriculture
inputs
Encourage R&D for bio-fertilizers
Lack of awareness and training of farmers on
the use of fertilizers
Information campaigns
Establish riparian buffer zones
Promote the adoption of effective bio-substitutes
Eco-payments for natural filtering habitats
Limited funding for treatment infrastructure
Urban sewage
Provide additional infrastructure and complementary
Integrate sewage infrastructure in future
Lack of incentives to operate existing
infrastructure
technology to treat wastewater
development
Lack of appropriate technology for treatment
Introduce effluent charges
Industry
of industrial waste
Provide additional infrastructure and cost-effective
Introduce clean industrial technologies
Lack of regulation, compliance and
enforcement
technologies.
Chemical pol ution
Regulate and enforce
Integrate the cleaning of industrial effluents
Industry and Lack of regulations and enforcement
Introduce effluent charges
into sector planning
mining
regarding industrial leaks and discharges
Provide necessary infrastructure
Initiate participatory measures
Absence or lack of treatment infrastructure
Introduce assurance bonds
Introduce cost-effective clean technologies
Introduce financial incentives for clean operating industries
Limited awareness of how to use chemicals
Information campaigns
Agriculture
appropriately
Promote the adoption of effective bio-substitutes
Encourage R&D for bio-fertilizers
Lack of resources for supervision and control
Redesign agricultural subsidies to foster efficient use of
Promote alternative agricultural practices
of chemical inputs
inputs
Suspended solids
Forestry,
Improve watershed planning and management
Coordinate stakeholders in participatory
coastal
Improve regulations and enforcement
process
development, Lack of land use planning and governance
Provide cost-effective filtering infrastructure
Upgrade governance.
mining
Establish eco-payments to improve land use
Establish eco-label ing
Mobilise resources to enforce existing regulations
Solid waste
Revise regulations
Lack of col ection and disposal infrastructure
General public
Apply fines
Low awareness of impacts
Awareness campaigns
Participatory measures
Low compliance with regulations
"Deposit-refund" measures for selected items
Industries,
Lack of regulations
Review regulations
Provide waste treatment and recycling
municipalities, Low compliance and enforcement
Provide designed disposal areas and infrastructure
infrastructure
transportation Limited capital and technology
Enforce via fines
Information campaigns
Oil spil s
Oil
Lack of compliance with IMO rules
Build reception facilities
exploitation,
Lack of cleaning and waste infrastructure
Regulate and enforce standards for
Strengthen compliance and enforcement with IMO rules
transportation, Lack of contingency planning at regional level
refineries
Foster regional dialogue and spill preparation
infrastructure Lack of enforcement capabilities at national
Improve accident response and clean-up
level
Improve surveil ance and traffic monitoring
Microbiological pol ution
Limited resources for treatment
Provide and sustain infrastructure, technology and
Integrate sewage infrastructure in future
Urban sewage Lack of incentives to operate existing
infrastructure
manpower
urban development
Include treatment costs in price of water
Promote use of treated water
Lack of local regulations and compliance
NOTE: THE TABLE PRESENTS ROOT CAUSES AND POTENTIAL POLICY INSTRUMENTS IDENTIFIED BY GIWA REGIONAL TEAMS.
triggered by low agricultural productivity and profitability,
chain analysis related to eutrophication (Table 6). e use of
violence in the countryside and open access to urban lands.
fertilizers has dramatical y increased global food production,
ese new and, in most cases, informal settlements create a
but it is the main source of nitrate pol ution, with up to 80
tremendous demand for sanitation, health care and other ser-
of the nitrogen fertilizer resulting in environmental contami-
vices, which governments find hard to meet. e discharge of nation rather than improving yields. e quantity of fertilizer
untreated wastewater from these settlements has deteriorated
nutrients entering the environment is closely connected to the
the coastal waters.
extent appropriate technologies have been employed in agri-
Agriculture was identified as the major cause of nutrient cultural production. Agriculture is also a source of phosphate
enrichment in nearly al GIWA regions that conducted a causal
pol ution and persistent organic pol utants, such as pesticides.


CHALLENGES TO INTERNATIONAL WATERS: REGIONAL ASSESSMENTS IN A GLOBAL PERSPECTIVE
50
POLLUTION
51
Industrial effluents, particularly in developing coun-
holders both within and across countries; and (i i) implement
tries, are usual y discharged directly into water bodies and
and enforce these agreements.
can pol ute large volumes of water and infiltrate aquifers.
A scientifical y reliable understanding of an environ-
In western South America, like in many developing regions
mental problem is insufficient to trigger mitigatory actions.
worldwide, effluent treatment is frequently inadequate in the
For example, despite acknowledging the negative affects of
mining, petrochemical, fishmeal and cannery industries. In-
deforestation on aquatic ecosystems and subsequently human
dustrial pol ution can be transported in the atmosphere for
wel -being, governments rarely take action to control forestry.
thousands of kilometres before being deposited. Emissions
When formulating policies, governments commonly
from Europe, Asia and North America are the major sources
disregard environmental and stakeholder concerns. In the
of chemical contamination in the Arctic. Reducing these
Aral Sea/24 Basin, the centralised planning policies of the
sources requires significant international effort to control
former Soviet Union subsidised agricultural inputs in order
emissions and to enforce existing agreements.
to increase cotton production, which led to excessive fertil-
izer application. e governments also failed to deter cot-
Market failures
ton farmers from withdrawing excessive quantities of water.
Transboundary pol ution is rarely caused deliberately by
Consequently, the Aral Sea shrank to a fraction of its former
individuals or organisations, but is usual y the result of neg-
size and the coastal zones of Kazakhstan and Uzbekistan are
ligence or actions taken to protect private interests, such as
heavily pol uted.
avoiding financial costs for waste treatment. e social and
Agreed goals and actions that address transbound-
environmental costs of pol ution caused by production pro-
ary issues are often inadequately implemented and/or en-
cesses are not included in the price of products.
forced. Sea-borne pol ution is still extensive in the Caribbean
In the Caribbean Islands/4 region, waste treatment is
Islands/4 region despite the adoption of the International
costly for cruise line operators and there is an absence of eco-
Convention for the Prevention of Marine Pol ution from
nomic incentives to discourage them from dumping wastes at Ships (MARPOL). Enforcement of MARPOL is the responsibil-
sea. e countries of the region are reluctant to penalise these ity of national governments, but they lack the capacity and
pol uters due to their dependence on foreign exchange from
the political will to fulfil their obligations. Ships can there-
tourism.
fore avoid compliance with the regulations.
In the Baltic Sea/17 region, consumer prices for water
Chile, Ecuador and Peru are faced with an urban
and water treatment vary considerably between the ripar-
waste crisis because waste treatment is already subsidised to
ian countries. Ideal y, prices should include indirect costs to
such an extent that they cannot afford to extend or upgrade
ensure sufficient investment in wastewater treatment and to
the treatment infrastructure. ere is an absence of an in-
minimise pol ution. However, in the Baltic region, even the
centive framework, which could include clean technology
direct costs related to water services are only ful y recov-
subsidies and regulatory enforcement. In Chile, industries
ered in Finland and Sweden. In Denmark and Germany, the
have stepped forward to partial y address this policy failure
degree of cost recovery is high, whereas in Estonia, Latvia,
through industry self-regulation.
Lithuania, Russia and Poland, it remains low. It is anticipated
e implementation of a bilateral integrated manage-
that new legislation in these countries will gradual y lead to
ment plan for the Mirim Lagoon Basin failed due, partly,
the full recovery of costs for water services.
to a lack of harmonisation between the legal instruments of
Brazil and Uruguay. With both countries finding it difficult
Policy failures
to obtain national agreement on pol ution management, it
e GIWA regional teams stressed the importance of policy-
is not surprising that the bilateral agreement was difficult to
driven root causes of transboundary pol ution. Policy failures
implement. Furthermore, State agencies charged with pol u-
commonly result from the inability of institutions to perform
tion management lack autonomy and the capacity to control
three key functions:
pol ution in the lagoon.
(i) identify the indicators of a problem and agree on its na-
In the former Soviet states, governments and inter-
ture; (i ) reach agreements that balance the interests of stake-
national agencies pursued decentralisation before establish-


CHALLENGES TO INTERNATIONAL WATERS: REGIONAL ASSESSMENTS IN A GLOBAL PERSPECTIVE
50
POLLUTION
51
BOX 13. POLLUTION AND POLICY FAILURE: CASE OF THE AMUR RIVER BASIN
The Amur River is one of the largest rivers in
The GIWA regional team identified the main
ernmental agreements for the management
Asia, with a catchment area of 2 million km˛.
root causes of eutrophication to be inad-
and protection of the Amur River.
The basin has a population of 75 million; over
equate water management policies and a
To address these policy failures, the GIWA
90 live in China. Three other countries also
lack of long-term and inter-sectoral plan-
regional team recommended adopting
share the river basin; Russia, Mongolia and
ning. In addition, they noted that short-term
Integrated Water Resources Management
North Korea.
economic interests have taken priority over
(IWRM) principles. Their recommendations
sustainable development. More specifically,
The quality of surface water in the Amur
include:
insufficient revenues are generated from
River Basin ranges from pure in the upstream
Creation of an intergovernmental agree-
water due to low taxation and underpric-
mountainous regions to highly contami-
ment on the use and protection of the
ing which prevents the adequate financing
nated in the downstream urban areas. Ag-
Amur River Basin's water resources;
of water monitoring and water treatment
ricultural run-off and sewage from urban
Establishment of a basin commission to
facilities. National water laws are also absent
areas contribute excessive quantities of
oversee the agreement and to report and
or inadequate, and institutional capacity is
nutrients and organic matter to the rivers.
monitor progress;
weak and undermined by corruption, result-
Consequently, a considerable portion of the
Revision of national water laws based on
ing in ineffective enforcement. With such
population is forced to consume polluted
IWRM principles;
weak national frameworks, it is not surpris-
surface water, which has resulted in a high
Implementation of appropriate water pricing.
ing that there are no basin-wide intergov-
prevalence of water-borne illnesses.
(SOURCE: SEA OF OKHOTSK/30)
ing legal frameworks for environmental management and
gen from fossil fuel combustion, and, potential y, as a result
building institutional capacity. In the Black Sea, the re-
of global warming. However, many technical and political
peated amendment of water laws and regulations has made
options are available to reduce fertilizer use, decrease nutrient
long-term planning difficult and discouraged investment in
run-off, encourage sustainable aquaculture and enhance sew-
infrastructure. Under decentralisation, new water and sewage age treatment.
facility ownership structures have made services more unreli-
Similarly, suspended solids will continue to be a wide-
able and impaired water resources management. Box 13 out-
spread problem. e implementation of afforestation schemes
lines the policy failures behind pol ution in the Amur River
and the adoption of sustainable agricultural and land use
Basin.
policies can reduce erosion in the catchment area.
Microbial pol ution related to sewage is also projected
to increase due to population growth and urbanisation, par-
ticularly in Asia, Africa and Latin America. is trend may
POLICY RELEVANT CONCLUSIONS be averted by investing in sewage treatment facilities, indus-
tries adopting cleaner technologies and by strengthening the
Population growth, urbanisation, industrialisation and ag-
institutions responsible for waste management.
ricultural development will increase pol ution loads in the
Pol ution in international waters can be reduced, as
international waters of more than three-quarters of the GIWA
demonstrated by the substantial reduction in hazardous sub-
regions by 2020. Nevertheless, interventions by governments, stances and microbial pol ution in the Baltic Sea/17. Accord-
communities, industries and NGOs can reduce or control pol-
ing to UNEP's Global Environmental Monitoring System
lution, depending on political wil , available financial re-
(GEMS), other successful examples include reductions in or-
sources and technological developments.
ganic loading in Europe and Australia, lower phosphate lev-
Eutrophication is likely to intensify in many regions,
els in North America and Europe, and reduced nitrate levels
primarily in response to the increased application of fertil-
in the Danube Basin. e GIWA regional teams emphasised
izers, especial y in Asia and Africa. It will also increase in
that to address transboundary pol ution, governments must
prevalence due to the growth in the aquaculture industry, in-
recognise the need for action, increase stakeholder partici-
creasing quantities of human sewage, the generation of nitro-
pation, provide appropriate incentives, improve regulations,


CHALLENGES TO INTERNATIONAL WATERS: REGIONAL ASSESSMENTS IN A GLOBAL PERSPECTIVE
52
POLLUTION 53
BOX 14. LACK OF INTERNATIONAL ENFORCEMENT: CASE OF THE CASPIAN SEA
Agricultural run-off is one of the main sources of pollution in the
Caspian Sea, with pesticides causing the most severe impacts.
Chemical pollution hotspots are located in the dense agricul-
tural areas of Iran's river deltas. Agricultural activities and asso-
ciated pollution are also prominent in the Ural, Volga and Kura
river basins, with the Volga thought to contribute the majority of
the total pollution load into the Caspian Sea.
While DDT was prohibited in 1970 in the Soviet states, the GIWA
regional team reported that supplies are still readily available.
Small-scale farmers have become dependent on pesticides,
including DDT, to maintain production on infertile arable land.
They have little understanding of the ecological consequences
of pesticide use. Clearly, enforcement of the 30-year-old DDT
ban must be strengthened, which requires building capacity in
the institutions responsible for enforcement. One approach is
to improve regional control functions and to give local officials
adequate authority and resources to prohibit and seize local
supplies and sales. The enforcement of the ban is expected to
be highly feasible and effective as DDT is easily identified and
confiscated.
(SOURCE: CASPIAN SEA/23)
and cooperate with other nations sharing an international
As discussed in Box 14, DDT is widely used in the Caspian
water. In many regions, capacity building is required to bet-
Sea/23 region despite being prohibited by governmental regu-
ter monitor and enforce regulations related to transboundary
lations.
aquatic pol ution.
In the Humboldt Current/64 region, many pol ution
Table 6 summarises the root causes behind pol ution
related laws are obsolete, whilst others are inappropriate or
and potential policy instruments identified by the GIWA re-
have weak sanctions that do not motivate violators to improve
gional teams. It also lists other instruments that have been
their practices. e various national and local institutions
successful y used by international and national programmes.
often have overlapping responsibilities concerning environ-
mental management. is has often impeded the enforce-
Regulations
ment of regulations. Global quality systems and certification
Regulations are the most common instruments used to ad-
(e.g. ISO, clean production, organic production) can comple-
dress water pol ution due to their simplicity and ability to
ment regulations, but general y receive inadequate govern-
satisfy the interests of both the authorities and the private
mental support.
sector. Conditions that favour the use of regulations include:
Unacceptably high economic and/or environmental costs
Economic incentives and public engagement
resulting from even minor contamination;
Economic incentives can be highly effective in changing be-
A small number of pol uters;
havioural patterns. e Benguela Current LME project uses
e existence of a more environmental y friendly and eco-
economic incentives to promote environmental y friendly
nomical y viable technology.
technologies and practices, phase-out subsidies and introduce
user fees. Table 7 il ustrates the main economic policy instru-
e GIWA regional reports note that regulators are often un-
ments for addressing water pol ution, with examples from
wil ing or do not have the resources to enforce regulations.
GIWA regions.


CHALLENGES TO INTERNATIONAL WATERS: REGIONAL ASSESSMENTS IN A GLOBAL PERSPECTIVE
52
POLLUTION 53
TABLE 7. ECONOMIC INCENTIVES AND DISINCENTIVES
TABLE 8. DIRECT GOVERNMENT INSTRUMENTS FOR
FOR ADDRESSING WATER POLLUTION WITH
ADDRESSING WATER POLLUTION WITH
EXAMPLES FROM GIWA REGIONS
EXAMPLES FROM GIWA REGIONS
Instrument
Examples
Instrument
Examples
Strengthening institutions responsible for enforcement of
Reduced
Reduced subsidies for fertilizers and pesticides
maritime regulations (Caribbean Islands/)
subsidies or
Reduced taxes on waste separation and treatment technologies
surcharges (taxes)
Information system on water resources in the Madeira River
(Indian Ocean Islands/b)
Basin (Amazon Basin/b)
Understanding
Training and environmental education programmes (Amazon
Subsidies to promote natural buffer zones to capture nutrients
pol ution problems Basin/b)
from agricultural run-off
and developing
Develop national/regional HAB contingency plans (Comoe
Tax reductions on less harmful pesticides (Caspian Sea/)
solutions
Basin (Guinea Current/a)
Develop coordinated river and coastal management (Guinea
Targeted
Subsidies provided to the municipality to commence a waste
Current LME (Guinea Current/e)
subsidies
col ection service, and to the private sector to facilitate
investment in waste minimisation/treatment (Indian Ocean
Establish a water quality and aquatic environment institutional
Islands/b)
network (Guinea Current LME (Guinea Current/e)
Tax incentives to encourage the use of recycled products (Indian
Municipal water treatment plants
Ocean Islands/b)
Improve design and maintenance of purification systems
(Guinea Current LME (Guinea Current/e)
Levy water effluent charges based on the amount of pol utants
Infrastructure
Provide sufficient waste receiving and treatment infrastructure
at ports (Amazon Basin/b, Caribbean Islands/)
Tax the disposal of industrial solid wastes (Indian Ocean
Al ocate funding for solid waste management (Indian Ocean
User charges
Islands/b)
Islands/b)
Taxes and fines on oil pol ution (Caspian Sea/)
Develop protected areas that serve as buffer zones
Establish market-based fees and charges (Volta Basin (Guinea
Current/b)
Reach agreement among governments for the creation of
Protection
special protection areas (Small Islands (Carribean Sea/a)
Strengthen national policies, regulations and law enforcement
Deposit refund
Consumers pay a refundable deposit for plastic bottles, batteries,
for protection of water resources (Jordan/)
systems
etc. (Indian Ocean Islands/b)
Reach agreement on common environmental standards (Small
Islands (Caribbean Sea/a), Sea of Japan/, and Humboldt
Current/)
Performance
Users of hazardous pol utants post a refundable bond to cover
bonds
potential environmental damage
Integrate sector policies with environmental policy proposed by
Transboundary
the various international conventions (Baltic Sea/)
agreements
Develop comprehensive water policies and institutions for
transboundary river basins and coastal zones (widespread,
Insurance
The price for insuring potential y damaging activities depends
including Small Islands (Caribbean Sea/a), Baltic Sea/,
markets
on the expected loss. Insurance companies may also ask their
clients to use certain technologies or fol ow certain procedures
Uruguay River Basin (Patagonian Shelf/), Brazil Current/,
Amazon Basin/b, Volta Basin (Guinea Current/b), Guinea
Current LME (Guinea Current/e) and Jordan/)
Many GIWA regional teams emphasise the importance
water quality. As a result, nearly all of the beaches along the
of stakeholder engagement for addressing complex trans-
southeastern coast of the Baltic Sea that were closed in the
boundary issues.
late 1980s were re-opened in the mid-1990s. Initiatives often
involve the construction of infrastructure and the creation of
Direct government investment
protected areas. Governments, however, often cannot afford
Government investment can be effective in reducing pol-
to make the investments or are unable to charge users for the
lution. For example, the construction of wastewater treat-
services. e main governmental instruments for addressing
ment plants in the Baltic Sea/17 region has improved coastal
transboundary water pol ution are presented in Table 8.

COD CATCHES ON A FISHING BOAT OFF
THE LOFOTEN ISLANDS, NORWAY
(PHOTO: GETTY IMAGES)
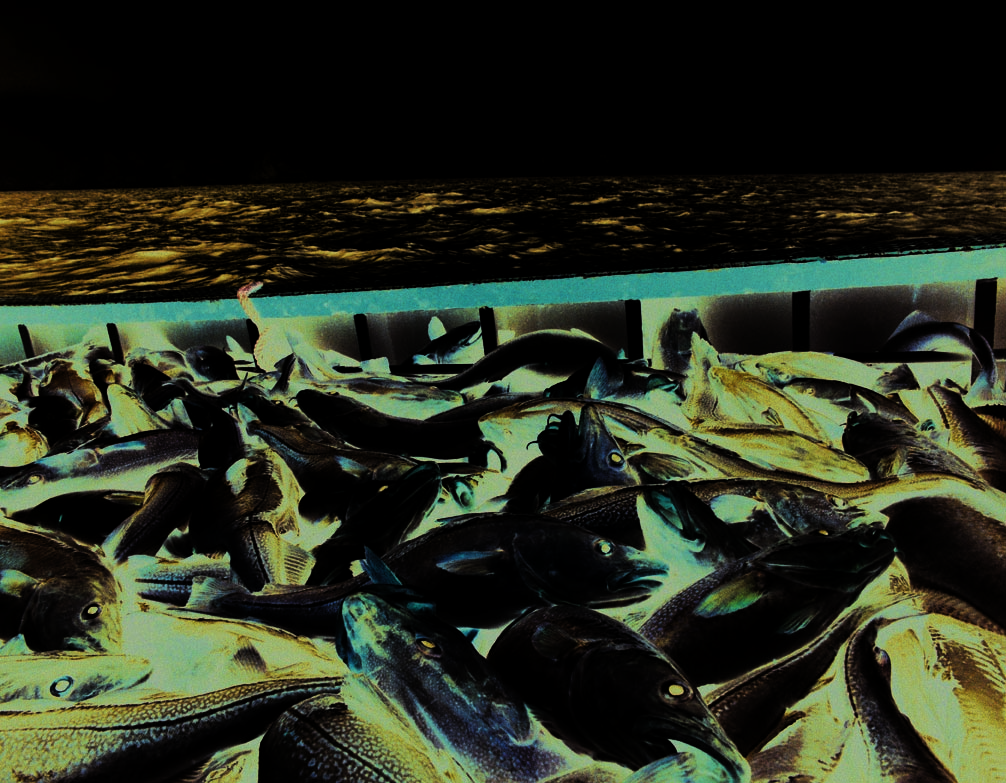
e international
community
OVERFISHING
cannot achieve
AND OTHER THREATS TO
the Mil ennium
AQUATIC LIVING RESOURCES
Development
Goal of hunger eradication without improving fisheries
management. Almost two-thirds of the GIWA regional teams
predicted that the effects of unsustainable fishing practices would
increase in severity in their region by 2020. Overfishing was
identified as the priority concern in many parts of East Asia and
Australia & the Pacific Islands. Virtual y all of the mega-regions
determined that the overexploitation of fish and other aquatic
living resources, and the use of destructive fishing practices are
major concerns. By contrast, excessive by-catch and discards were
only determined to be critical at the mega-regional level in South
America and Southeast Asia. Excessive fishing effort and the
employment of destructive fishing practices are attributed to a
complex web of root causes, including the common pool nature of
fisheries resources, poverty, insufficient knowledge regarding the
status of the fisheries, inappropriate subsidies, a lack of appropriate
incentives and weak enforcement of fisheries regulations.


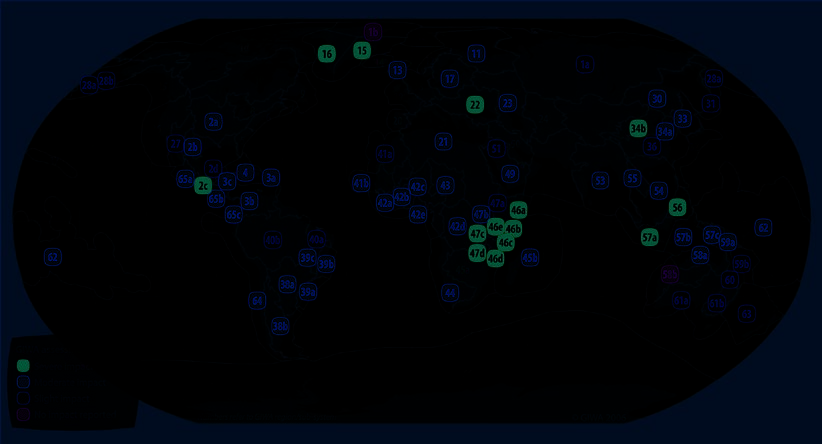
CHALLENGES TO INTERNATIONAL WATERS: REGIONAL ASSESSMENTS IN A GLOBAL PERSPECTIVE
56
OVERFISHING AND OTHER THREATS TO AQUATIC LIVING RESOURCES
57
Today, the fisheries industry employs
Global situation and trends
BOX 15. TRANSBOUNDARY FISHERIES
over 200 mil ion people and exploits
Overfishing and other threats to
virtual y al international waters. e
GIWA uses the following characteristics to
aquatic living resources were as-
achievement of the Mil ennium Devel-
define international fisheries:
sessed as the priority concern in
opment Goal (MDG) to eradicate hunger
River basins, lakes, and marine ecosystems
over one-fifth of the GIWA regions/
wil be partly dependent on the ability
that are divided by political borders which
do not match the distribution and migra-
sub-systems.
of the fisheries and their ecosystems
tory patterns of fish stocks;
Almost 60 of the GIWA regional
to supply animal protein to the popu-
Fleets operating in the Exclusive Economic
teams assessed overexploitation
lations of most developing countries.
Zone (EEZ) of foreign countries;
as severe. In nearly every lake and
However, there is widespread concern
Two or more countries disputing the loca-
Large Marine Ecosystem (LME) as-
over the sustainability of the fisheries.
tion of their respective EEZs;
sessed by GIWA, several fish stocks
e Food and Agriculture Organization
Consumers buying fish caught in another
are overexploited.
reports that 52 of the world's marine
country's EEZ;
Overfishing is primarily caused by
fish stocks are ful y exploited, 16 are
Fleets fishing on the high seas, which are
the excessive fishing effort of indus-
overexploited and 7 are depleted (FAO
international commons (the high seas
trial fishing fleets, but smal -scale
2005). Furthermore, many of the eco-
were not assessed by GIWA).
fishers also overexploit nearshore
systems that support critical fisheries are
fish stocks.
degraded.
Excessive by-catch and discards exacerbate overfishing
GIWA assessed the sustainability of international fisher-
and can threaten endangered species; trawling fisheries
ies (Box 15) by targeting the fol owing issues: (i) overexploi-
in the North Atlantic and in numerous tropical regions
tation; (i ) excessive by-catch and discards; (i i) destructive
typical y have significant by-catch.
fishing practices; (iv) decreased viability of stocks through
In three-quarters of GIWA regions/sub-systems, destruc-
pol ution and disease; and (v) impact on biological and ge-
tive fishing practices are degrading habitats and commu-
netic diversity.
nities that support fisheries.
FIGURE 18. OVERALL ENVIRONMENTAL AND SOCIO-ECONOMIC IMPACTS OF OVERFISHING AND OTHER THREATS TO
AQUATIC LIVING RESOURCES


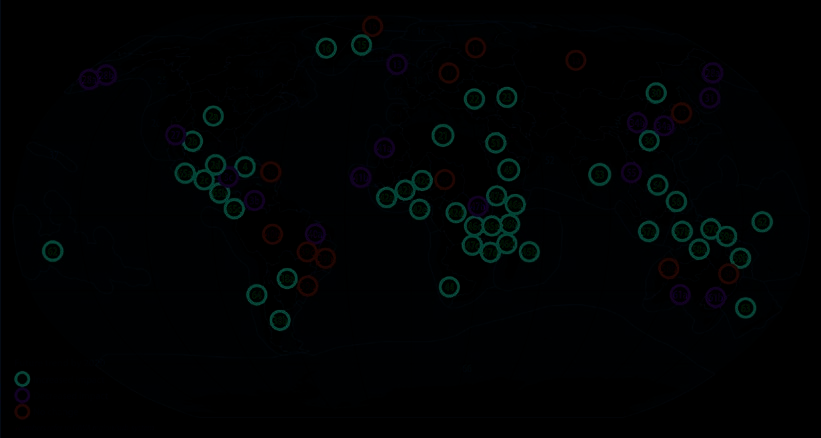
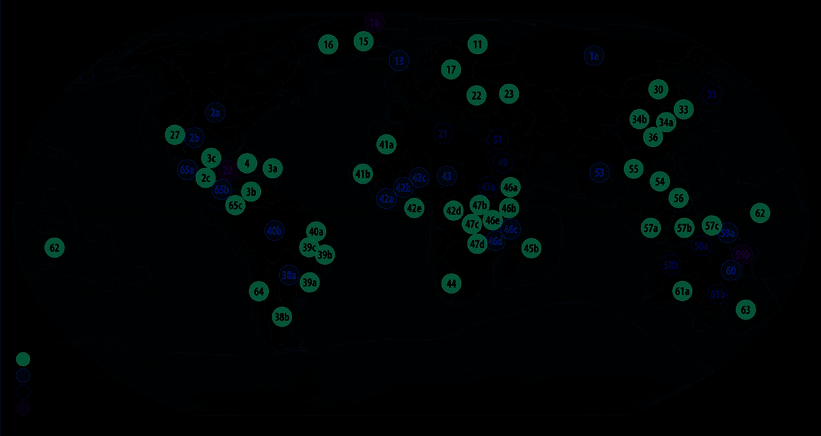
CHALLENGES TO INTERNATIONAL WATERS: REGIONAL ASSESSMENTS IN A GLOBAL PERSPECTIVE
56
OVERFISHING AND OTHER THREATS TO AQUATIC LIVING RESOURCES
57
FIGURE 19. FUTURE ENVIRONMENTAL TRENDS OF OVERFISHING AND OTHER THREATS TO AQUATIC LIVING RESOURCES
FIGURE 20. IMPACTS OF OVEREXPLOITATION OF FISH
Aquaculture is the fastest growing animal-based food-
to aquatic living resources would increase in severity, the
producing sector, particularly in developing countries.
situation in over 20 of GIWA regions/sub-systems is ex-
However, the widespread environmental and social
pected to improve by 2020 fol owing the adoption of sus-
drawbacks of the industry need to be addressed.
tainable management practices (Figure 19).
Although the majority of the GIWA regional teams pre-
dicted that the impact of overfishing and other threats


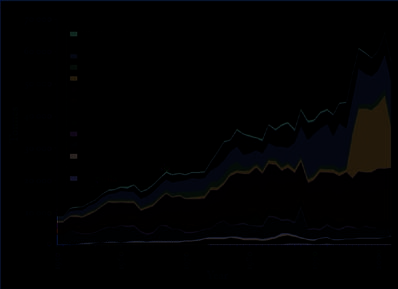
CHALLENGES TO INTERNATIONAL WATERS: REGIONAL ASSESSMENTS IN A GLOBAL PERSPECTIVE
58
OVERFISHING AND OTHER THREATS TO AQUATIC LIVING RESOURCES
59
ENVIRONMENTAL AND
SOCIOECONOMIC IMPACTS
Overexploitation
Overexploitation occurs when fish and other living resources
are caught at a rate which exceeds the maximum harvest
that al ows the population to be maintained by reproduction.
Overexploitation of fish was assessed as severe in more re-
gions than any other environmental issue evaluated by GIWA.
It is a geographical y widespread problem, affecting most
LMEs and many lakes, including the East African Rift Val ey
Lakes/47b,c,d.
Overexploitation firstly affects large, slow-growing
FIGURE 21. TOTAL CAPTURE OF FISH, CRUSTACEANS AND
predatory fish, such as cod, halibut and grouper, and high-
MOLLUSKS IN THE CARIBBEAN SEA/SMALL
ISLANDS SUB-SYSTEM
value invertebrates, such as shrimp, lobster and large shel -
(SOURCE: FAO FISHSTAT 2003)
fish. In many GIWA regions the depletion of large predators
has led to `fishing down the food web', whereby the aver-
ity, such as in the major upwel ing areas of the Benguela
age catch composition is gradual y replaced by short-lived,
Current/44, Canary Current/41 and Humboldt Current/64
fast-growing, plankton-eating fish and invertebrates at lower
(Box 16).
trophic levels, as the predatory fish populations succumb to
e affect of overfishing on the trophic structure of
intensive fishing effort (Pauly et al. 1998). e Argentinean
fish communities is exemplified in the Barents Sea/11. In the
hake (Merluc ius hubbsi), for example, was the species prin-
1980s, overfishing and natural fluctuations drastical y de-
cipal y targeted in the South Atlantic Drainage System (Pa-
pleted Capelin (Mallotus villosus) stocks. Cod (Gadus morhua),
tagonian Shelf/38b). After years of overfishing, hake stocks
the most commercial y important fish in the Barents Sea,
final y col apsed in 1997, whilst stocks of the short-lived and
preys mainly on Capelin. e subsequent lack of prey and
fast-growing Anchoita (Engraulis anchoita) tripled over the
continued overfishing of cod itself reduced the cod spawning
same period. e col apse caused extensive unemployment in
stock biomass, and catches declined to 20 of their highest
the fishing industry, severely impacted fish processing plants
levels. Although cod stocks were restored during the early
and reduced export revenues.
In the Caribbean Small Islands region (Caribbean
BOX 16. CLIMATE VARIABILITY AND FISHERIES:
Sea/3a), fisheries production escalated to unsustainable levels,
THE EL NIŃO SOUTHERN OSCILLATION (ENSO)
from 9 000 tonnes in 1950 to 60 000 tonnes in 2000 (Fig-
Fish biomass and catches are strongly linked to climatic variability,
ure 21). Many commercial species are currently at risk as a
particularly in high latitude and upwelling Large Marine Ecosys-
result of overexploitation and a loss of critical habitats for fish
tems (LMEs).
and shel fish reproduction, such as mangroves, seagrass beds
and reefs.
Many studies have explored the relationship between fisheries,
climate, and climate modes. The latter are dynamic patterns of
It is often difficult to determine the degree to which
climate variability, such as the El Nińo Southern Oscillation (ENSO).
fish stocks are depleted as a result of overexploitation or cli-
ENSO dominates the inter-annual climatic variability of the south-
matic variability. For example, the cod stocks of the Green-
ern Pacific Ocean and influences global climate. Several ecosys-
land Seas are sensitive to changes in water temperature,
tem responses to the ENSO affect the fisheries. In the Humboldt
and have subsequently declined over the last 30 years (East
Current/64 LME, cold nutrient-rich upwelling ceases in El Nińo
Greenland Shelf/15 and West Greenland Shelf/16). Accord-
years. The consequences are dramatic, including reduced primary
ing to Sherman (2003), climate is the key control ing factor
production, the collapse of the anchovy fisheries and the migra-
of fishing yields in about half of the world's LME
tion of jack mackerel (Trachurus murphyi) to inshore waters where
s. However,
they are subjected to high predation.
overexploitation exacerbates the effects of climate variabil-


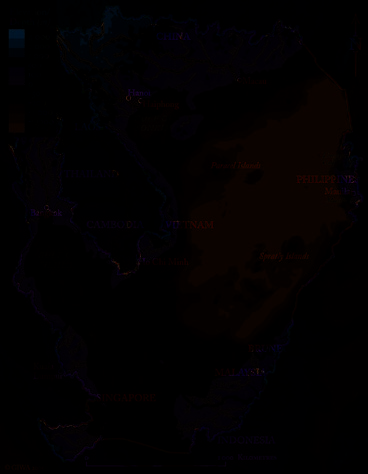
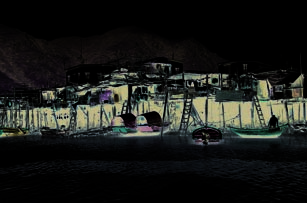

CHALLENGES TO INTERNATIONAL WATERS: REGIONAL ASSESSMENTS IN A GLOBAL PERSPECTIVE
58
OVERFISHING AND OTHER THREATS TO AQUATIC LIVING RESOURCES
59
BOX 17. SOCIO-ECONOMIC IMPACTS OF THE UNSUSTAINABLE EXPLOITATION OF FISH: CASE OF THE SOUTH CHINA SEA
The GIWA assessment of the South China Sea/54, which includes the
EEZs of nine countries, highlights the range and severity of the socio-
economic effects of overfishing. Throughout the region, the reduction
and collapse of the fisheries has led to a widespread loss of income and
employment.
In many areas, particularly around the Philippines and Indonesia, fish are
mostly exported causing local fish consumption to decline by a third.
This has contributed to the malnutrition of many children. In coastal
communities, alternative livelihoods are rarely available. Injuries and
deaths from blast fishing and diving are common. Conflicts provoked as
a result of declining fish stocks are frequent among local fishing groups,
and with foreign fishers.
It is estimated that fishing effort will need to drop by 50 to restore many fisheries to sustainable levels, particularly near urban areas. The
major deficit in wild-caught fish production is expected to lead to increased aquaculture to meet growing demand (see Box 18).
(SOURCE: SOUTH CHINA SEA/54)
to mid-1990s, intense fishing during the late 1990s depleted
as in many SIDS and other regions dependent on coastal
stocks again. At the end of the 1980s, 75 000 people were
resources, the fisheries are critical for economic develop-
employed in the fisheries sector in northwest Russia, but this
ment, tourism and food security. e exploitation of living
figure had dropped to only 30 000 a decade later. Coastal set-
resources for export results in local communities losing their
tlements experienced food insecurity, further unemployment
best source of protein. e decline in the nutritional value of
and reduced income in other sectors of the regional economy. the local diet leads to protein deficiency.
Nearshore stocks are also increasingly overexploited by
e effects of destructive fishing practices and overfish-
artisanal fishers. e number of artisanal fishermen in India
ing are also evident in many freshwater systems. Fish account
is unsustainable, having increased by 300 over the past
for 25-40 of total animal protein supply in the Lake Tang-
20 years (Bay of Bengal/57). Artisanal fishing communities
anyika Basin. Rapid population growth and poor manage-
are particularly vulnerable to the impacts of overfishing. In
ment of the resource has reduced per capita fish consump-
the Guinea Current/42 region, 60 of landings are made by
tion in Malawi by over 40, leading to malnutrition in some
artisanal fishers, and since a downturn in fisheries produc-
areas. Destructive fishing activities and overfishing put a
tion, unemployment has increased and conflict has been pro-
substantial proportion of those employed in Lake Malawi's
voked between artisanal fishers and commercial trawlers. In
commercial fisheries (nearly 290 000) at risk. In Lake Tan-
the adjacent Canary Current/41 region, overfishing has led to ganyika, overfishing and destructive fishing practices have
80 unemployment in the Senegalese fisheries sector.
led to large-scale unemployment fol owing the col apse of
Overexploitation of living resources affects many sec-
Burundi's industrial fishing fleet in the early 1990s.
tors of the economy. In the Bahamas (Caribbean Islands/4),


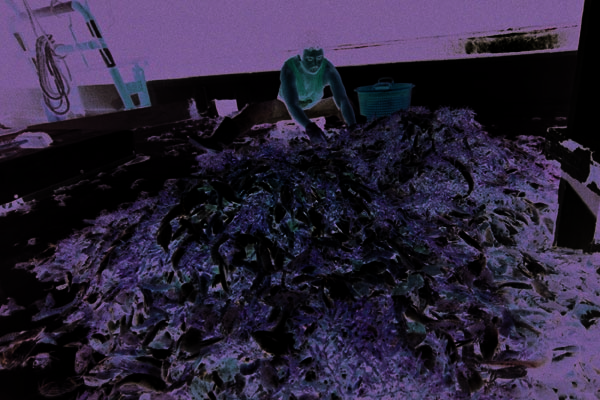
CHALLENGES TO INTERNATIONAL WATERS: REGIONAL ASSESSMENTS IN A GLOBAL PERSPECTIVE
60
OVERFISHING AND OTHER THREATS TO AQUATIC LIVING RESOURCES
61
Excessive by-catch and discards
Discards also create major transboundary problems if
By-catch refers to the incidental capture of non-target fish,
the discards from one fishery include species which are valu-
invertebrates, marine mammals, sea turtles, and seabirds, as
able to another. For example, foreign fishers dominate off-
well as under-sized specimens of target species. But discards
shore fishing in the Somali Coastal Current/46 region, and
refer to undesired by-catch thrown overboard; the survival
discard significant amounts of edible by-catch. When rotting
rate of most species discarded is extremely low. In many of
fish carcasses are carried shoreward, local fishermen complain
the regions assessed by GIWA, excessive by-catch accompany
that foreigners are destroying their fisheries.
overexploitation.
By-catch changes the age structure of fish populations,
Destructive fishing practices
disrupts food webs and threatens endangered species. In the
Destructive fishing methods, including bottom trawling,
transboundary waters of many tropical and subtropical GIWA
blast fishing, fishing with poisons, muro-ami nets, and sev-
regions, by-catch, particularly from shrimp trawling (see fig-
eral other local y employed fishing methods, significantly
ure 22), was assessed as having severe environmental impacts.
degrade aquatic habitats. Almost three-quarters of GIWA re-
In the Somali Coastal Current and South African waters, the
gional teams reported that destructive fishing practices cause
ratio of prawns to by-catch is 1:7 and 1:4 for trawlers, respec-
moderate to severe impacts (Figure 23).
tively. By-catch of endangered species is also a concern, partic-
Although bottom trawling was original y developed
ularly in the Pacific Islands/62 and Somali Coastal Current/46. for use in deepwater in the North Atlantic, it is now also em-
By-catch and discards can have serious socio-economic
ployed when fishing shal ow seagrass beds in tropical regions,
implications. In the Sea of Okhotsk/30, fleets discarded large causing extensive damage. However, deepwater and hard
quantities of juvenile pol ock during the 1990s, which desta-
seabed bottom trawling is also highly destructive to benthic
bilised the age structure of the stock. e volume of pol ock
habitats and communities. In the Gulf of California/27, the
catches have subsequently declined by one-third over the last
recurrent use of trawling nets has severely altered the compo-
10 years. In 2000, fishing companies lost revenues in excess of sition of benthic communities.
100 mil ion USD.
Blast or bomb fishing, which uses smal explosives to
kil or stun fish, is predominantly used in tropical regions
where it destroys the structure of coral reefs and can sub-
sequently cause the collapse of reef fisheries. Poison fish-
ing with toxic chemicals, such as bleach and cyanide, is also
highly destructive to coral reefs. e GIWA assessment found
blast and poison fishing to be major problems throughout
Southeast Asia, as wel as in the Brazil Current/39, Ca-
ribbean Sea/3 and Somali Coastal Current/46. Cyanide is
widely used in the live reef food fishery and the ornamental
aquarium fishery in East Africa, East Asia and Southeast
Asia. Destructive fishing practices are the greatest threat
to the reefs of the Sulu-Celebes Sea/56 region. While the
short-term benefits to fishermen are high, often returning
15-40 USD for a 1-2 USD investment, the social and envi-
ronmental costs are considerable. Blast fishing is expected to
cost Indonesia at least 3 bil ion USD over the next 20 years,
and cyanide use a further 50 mil ion USD. A sustainable
hook and line fishery, in contrast, could create net benefits of
FIGURE 22. BY-CATCH FROM SHRIMP TRAWLING IN THE
320 mil ion USD. In some regions, human consumption of
GULF OF MEXICO
(PHOTO: MINDEN PICTURES)
poisoned fish has led to hospitalisation, and even death.


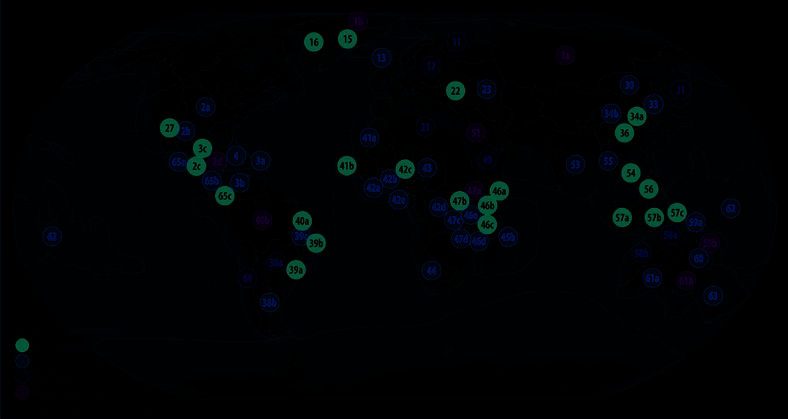
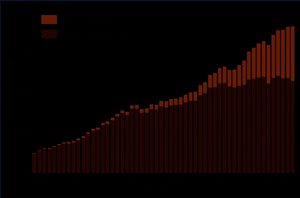
CHALLENGES TO INTERNATIONAL WATERS: REGIONAL ASSESSMENTS IN A GLOBAL PERSPECTIVE
60
OVERFISHING AND OTHER THREATS TO AQUATIC LIVING RESOURCES
61
FIGURE 23. IMPACTS OF DESTRUCTIVE FISHING PRACTICES
Decreased viability and biodiversity
Aquaculture or restocking programmes that introduce
impacts of aquaculture
alien species or genetical y modified organisms can affect the
Bacterial or viral diseases can spread from aquaculture stocks biological diversity and structure of ecosystems, as observed
and decrease the viability of wild commercial stocks. e in-
in several regions in Central America and South East Asia.
troduction of disease through shrimp aquaculture in North
In the Philippines and Vietnam, introduced species have ex-
Sumatra has resulted in the col apse of wild shrimp stocks.
tirpated native species. Box 18 discusses the characteristics
In the Humboldt Current/64, outbreaks of disease in shrimp
and impacts of the aquaculture industry.
farms have cost 600 mil ion USD annual y, excluding the
subsequent economic impact on wild stocks.
BOX 18. AQUACULTURE INDUSTRY
Aquaculture, both inland and coastal, is one
Exports of aquaculture products provide
clearance of coastal habitats, such as man-
of the fastest growing food producing sec-
substantial foreign exchange for many
groves, and can cause eutrophication and
tors in the world, with the annual growth
coastal states. Unfortunately, this is often
other pollution. Some aquaculture opera-
rate exceeding 9 since 1970. Individuals
earned at high social and environmental
tions have introduced diseases, parasites and
or corporations own aquaculture stocks,
costs. Aquaculture farms often require the
alien species into wild fisheries. Aquaculture
whereas wild fisheries are open access.
can cause the overfishing of wild species as
Aquaculture is playing an increasingly
cultivated predatory fish and shrimp require
important role in meeting the grow-
protein-rich feed. Social repercussions can
ing demand for fish protein in many
include the loss of traditional fisheries, and
tropical and subtropical areas. China
lower standards of living and reduced food
accounts for over 70 of the world's
supply for local fishers and farmers. While
aquaculture production, primarily from
the continued growth of aquaculture is in-
traditional small-scale systems for local
evitable, it will only be sustainable and maxi-
markets. The cultivation of high-value
mise its benefits to society if it is integrated
fish and shrimp by industrial aquacul-
into broader ecosystem-based manage-
GLOBAL FISHERIES CAPTURE AND AQUACULTURE PRODUCTION
ture is growing rapidly.
ment.
1950-2003.
(SOURCE: FAO 2004)


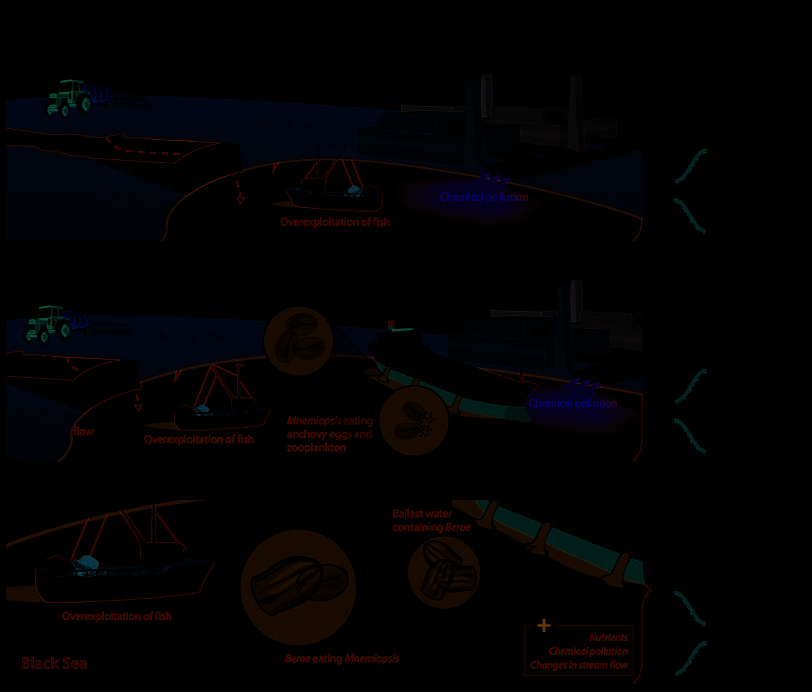
CHALLENGES TO INTERNATIONAL WATERS: REGIONAL ASSESSMENTS IN A GLOBAL PERSPECTIVE
62
OVERFISHING AND OTHER THREATS TO AQUATIC LIVING RESOURCES
63
BOX 19. INTERACTIONS BETWEEN THE FISHERIES AND OTHER GIWA CONCERNS: CASE OF THE BLACK SEA
Over the past 50 years, industrial fishing, pol-
ditional stressors during the 1970s and 1980s
lis encrasicolus), estimated at 534 000 tonnes
lution, habitat modification and the introduc-
included chemical pollution, the alteration of
in 1986, had fallen to only 88 000 tonnes by
tion of species have increased. It is often dif-
the inflowing rivers and continued overex-
1991, resulting in the loss of an estimated
ficult to determine the degree to which each
ploitation of fish populations.
150 000 jobs.
of these inter-related causes affect fish stocks.
In the late 1980s, ship ballast water introduced
By the mid-1990s, the invasion of another
The collapse of the pelagic fisheries of the
the invasive comb jellyfish (Mnemiopsis leidyi).
comb jellyfish (Beroe sp.) somewhat con-
Black Sea provides an illustrative example.
By 1989, they had spread throughout the
trolled the population of Mnemiopsis, allow-
Prior to the 1970s, overfishing depleted the
Black Sea, reaching densities of 1.5-2 kg/m˛.
ing anchovy stocks to partially recover. How-
top predators of the Black Sea which led to
Mnemiopsis voraciously consumed anchovy
ever, they decreased again in the late 1990s,
`fishing down the food web'. Since the 1970s,
eggs and larvae, while eutrophication and
due perhaps to the affects of climate warming
urban and industrial expansion, intensive
intensive fishing of anchovies and other small
on the food web.
fertilizer use and atmospheric deposition
pelagic fish continued, resulting in the col-
(SOURCE: BLACK SEA/22)
resulted in severe eutrophication, hypoxia
lapse of the pelagic fisheries of the Black Sea.
and bottom-up impacts on the food web. Ad-
Total catches of European anchovy (Engrau-


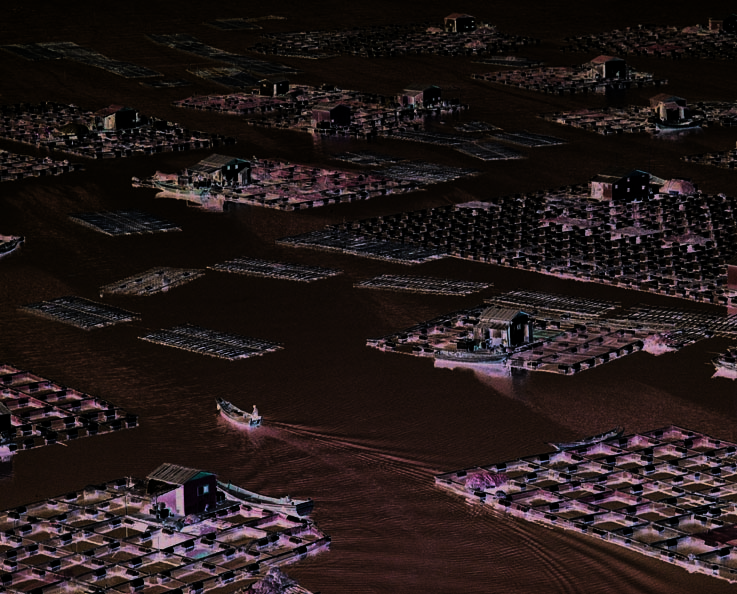
CHALLENGES TO INTERNATIONAL WATERS: REGIONAL ASSESSMENTS IN A GLOBAL PERSPECTIVE
62
OVERFISHING AND OTHER THREATS TO AQUATIC LIVING RESOURCES
63
FIGURE 24. FISH FARM, CHINA.
(PHOTO: STILL PICTURES)
ROOT CAUSES
fisheries resources therefore results in overfishing and a lack
of interest in maintaining fish habitats.
More than 20 GIWA regional teams selected overfishing and
ree forms of property rights have been used to limit
other threats to aquatic living resources as the top priority for access to common pool resources and define rights and re-
their region (Table 9 and 10). Overfishing was predominantly sponsibilities of beneficiaries. However, inadequate enforce-
attributed to excessive fishing effort, often in combination
ment, inappropriate incentives and knowledge deficiencies
with destructive fishing practices. e GIWA regional assess-
regarding the fishery may result in overexploitation despite a
ments confirm that, despite evidence of severely depleted fish
property rights framework.
stocks, governments continue to permit large and efficient
e GIWA regional experts concluded that overfish-
fishing fleets to overexploit fish resources.
ing in the Indonesian Seas/57 region is caused by the lack of
awareness amongst fishers of the impacts of destructive fish-
Common pool resources
ing and having the viewpoint that `if I don't exploit the fish-
e fisheries are common pool resources and are thus difficult eries, someone else wil '. In Lake Victoria (East African Rift
to protect from exploitation. As a result, fishing is frequently
Val ey Lakes/47b), weakly enforced fishing regulations per-
undertaken when alternative employment opportunities are
mit overfishing and the use of destructive fishing practices,
unavailable. Another common pool attribute is that fishing
which has resulted in reduced catch per unit effort.
by one user reduces the size of fish stocks available for others.
In many parts of the world, particularly inland and
Many fish stocks are not "owned" by a single country but are
nearshore fisheries in developing countries, increasing num-
instead fished by several nations. e common pool nature of
bers of artisanal fishers are using destructive fishing methods


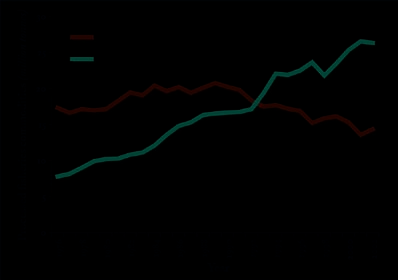
CHALLENGES TO INTERNATIONAL WATERS: REGIONAL ASSESSMENTS IN A GLOBAL PERSPECTIVE
64
OVERFISHING AND OTHER THREATS TO AQUATIC LIVING RESOURCES
65
TABLE 9. IMMEDIATE CAUSES OF OVERFISHING AND OTHER THREATS
GIWA concerns, while others are specifical y rel-
TO AQUATIC LIVING RESOURCES
evant for the fisheries.
Targeted issues
Several GIWA regional teams from dif-
Overexploitation
Destructive fishing
practices
ferent parts of the world identified popula-
Immediate causes
tion growth as one of the main factors driving
f
demand for fish products and subsequently the
n
d
u
o
t
a
s
n
d
r
e
l
a
t
e
d
i
s
h
i
n
g
i
s
h
i
n
g
overexploitation of fish.
f
f
o
r
t a
h
a
n
g
e
s
)
b
o
v
e
i
s
h
i
n
g
h
i
f
t (
f
f
o
r
t a
Rising incomes per capita increase the
a
p
a
c
i
t
y
e
c
r
u
i
t
m
e
n
t o
t
o
c
k
s
a
p
a
c
i
t
y
l
i
m
a
t
i
c c
demand for higher value, more nutritious and
GIWA region
e
s
t
r
u
c
t
i
v
e f
E
x
c
e
s
s
i
v
e e
f
l
e
e
t c
F
i
s
h
i
n
g a
r
e
c
o
m
m
e
n
d
e
d q
P
o
o
r r fish s Improved f technology Poaching Biomass s to c D practices Excessive e fleet c
I
n
a
p
p
r
o
p
r
i
a
t
e f
g
e
a
r
prestigious food, including fish and seafood.
Barents Sea
is is of particular concern in Asia, where
Faroe Plateau
rapid economic growth over the past 30 years
West Greenland Shelf
and the preference of the population for fish
Baltic Sea
Sea of Okhotsk
products has resulted in a doubling of fish con-
Oyashio Current
sumption.
Sea of Japan
With nearly 40 of fish production
Yel ow Sea
traded international y (FAO 2004) and export of
East China Sea
processed fish far greater than domestic con-
Patagonian Shelf
sumption, international market trends often
b Canary Current South
determine the nature of fisheries exploitation
e Guinea Current LME
(Figure 25). An increasing number of fishers
Benguela Current
throughout Asia are using destructive fishing
Somali Coastal Current
methods to meet the growing and lucrative ex-
b Lake Victoria (East
African Rift Val ey Lakes)
port market for live seafood in China and other
South China Sea
parts of Asia (Indonesian Seas/57). Prized reef
Indonesian Seas
fish, like grouper and Napoleon wrasse (Chei-
Humboldt Current
linus undulatus), are driven into corals where
c Pacific Colombia
(Eastern Equatorial Pacific)
divers use cyanide-fil ed bottles to stun the
NOTE: THE TABLE PRESENTS A SELECTION OF GIWA REGIONS WHERE THE REGIONAL TEAM HAS
fish and crowbars to break the coral structure.
CONDUCTED A CAUSAL CHAIN ANALYSIS ON THE TWO MOST FREQUENTLY ANALYSED ISSUES OF THE
GIWA CONCERN OVERFISHING AND OTHER THREATS TO AQUATIC LIVING RESOURCES.
e fish are sold in the live reef fish markets
in an attempt to halt the decline in their catches which, in
turn, reduces fish populations and degrades the habitats which
support the fisheries. In response, fishers increase fishing ef-
fort and adopt further destructive practices. is situation is
prominent in the Somali Coastal Current/46 region, where it
has resulted in the reduction of household income and nutri-
tion levels, and a growing frustration which often escalates
into conflict between artisanal fishers and other stakeholders,
especial y the tourism industry and conservationists.
Global trends
Several global trends are underlying root causes of the over-
exploitation of transboundary fisheries, of which population
FIGURE 25. GLOBAL FISH EXPORTS AND DOMESTIC
growth, urbanisation and trade are common to the other
CONSUMPTION
(SOURCE: FAO 2003)


CHALLENGES TO INTERNATIONAL WATERS: REGIONAL ASSESSMENTS IN A GLOBAL PERSPECTIVE
64
OVERFISHING AND OTHER THREATS TO AQUATIC LIVING RESOURCES
65
tion, mortalities caused by fishing and natural causes, and
catch data. e status of a fishery is difficult to monitor and
assess due to natural and fishing-induced fluctuations in
fish populations, and the influence of pol ution and climate
change. Many regions lack adequate exploitation models and
information on stock dynamics needed to make informed de-
cisions. Several GEF LME projects are addressing this issue by
strengthening national and regional scientific capacity in, for
example, the Benguela Current/44, Guinea Current/42 and
Yel ow Sea/34 regions.
GIWA regional teams recognised that even when accu-
rate data is col ected and analysed, the information is often
FIGURE 26. LIVE FISH FOR SALE IN A RESTAURANT IN
not conveyed to key stakeholders, such as fishers. As a result,
HONG KONG
fishers lack awareness of the impacts of their actions on fish
(PHOTO: C. CHEUNG)
stocks and their subsequent prosperity. is is a major hin-
of China, Singapore and Taiwan, fetching up to 100 USD
drance to the adoption of sustainable fishing practices. e
per kg (Figure 26). e governments of the countries border-
regional reports note that these knowledge deficiencies were
ing the South China Sea/54 publicly exhort their fishermen
caused by the fol owing failures:
to fish disputed waters, which has resulted in a number of
Information is not communicated to fishers and food pro-
conflicts, notably in the waters around the Spratly Islands.
cessors;
Il egal fishing, overfishing, and poaching of rare species are
Information fails to change fishing practices due to un-
common in the South China Sea region.
derstanding difficulties, ignorance and the inability of
International demand for a specific fish has led to over-
individuals or firms to act alone;
exploitation in several GIWA regions, such as the Indonesian
Traditional knowledge is often excluded from research,
Seas/57, Lake Victoria (47b), the Patagonian Shelf/38 and
despite its importance to fisheries management. In some
Sulu-Celebes Sea/56. In the South China Sea/54 region, as
GIWA regions, however, traditional knowledge is being in-
in many other LMEs, trawlers and driftnet operators are often
corporated into management strategies.
foreign. e value-added component of the industry there-
fore benefits countries outside of the region, while the region
In the Indonesian Seas/57 region, for example, many local
suffers from the effects of declining resources and a deterio-
fishermen only have a rudimentary understanding of fish
ration in environmental quality. In order to maintain catch
and coral reef ecology. ey employ destructive rather than
levels, local artisanal and smal -scale commercial fishers are
traditional fishing methods as they yield larger catches for
reverting to the use of blast fishing.
minimal effort and cost, despite the long-term impacts on the
productivity of the fisheries.
Insufficient knowledge
Consumer demand determines the level of pressure on
Insufficient scientific knowledge and a lack of awareness by
fisheries resources. In developing countries, the exhaustion of
fishers and consumers are major obstacles for improving poli-
fish stocks has forced communities to find alternative sources
cies and management, and changing the behaviour of con-
of protein e.g. in the Benguela Current/44, Indonesian Seas/
sumers and producers.
57, South China Sea/54 and Sulu-Celebes Sea/56. In de-
Inadequate statistics hamper fisheries science and man-
veloped countries, on the other hand, consumption of fish
agement, particularly in developing countries. is problem
products has not been control ed by market mechanisms as
was highlighted in all GIWA regions that conducted the causal prices do not reflect scarcity due to a combination of (i) fish-
chain analysis on overfishing and other threats to aquatic liv-
ing subsidies, (i ) access to new fishing grounds in the Indian
ing resources. Fishery management models establish al ow-
Ocean and in African waters, and (i i) a food industry with
able catch quotas based on stock biomass, size/age composi-
influential power.


CHALLENGES TO INTERNATIONAL WATERS: REGIONAL ASSESSMENTS IN A GLOBAL PERSPECTIVE
66
OVERFISHING AND OTHER THREATS TO AQUATIC LIVING RESOURCES 67
Inappropriate subsidies
duced precipitously in the 1990s, which eased fishing pressure
e governments of the world grant subsidies of up to 20 bil-
but caused economic and social problems along the coast.
lion USD annual y (Milazzo 1998), thus maintaining and in-
vesting in the capacity of fishing fleets. erefore, rather than Lack of enforcement
establishing policies to control fishing, many governments
Fishing regulations, such as property rights, quotas, pro-
are actual y promoting overfishing. is was highlighted as a
tected areas and bans on destructive practices, are difficult
problem by GIWA regional teams from the Baltic Sea/17, Bar-
to enforce for any government but are especial y problematic
ents Sea/11, Oyashio Current/31, Pacific Islands/62 and Sea of for many developing countries. Insufficient enforcement was
Japan/33.
identified as a cause of overexploitation in all causal chain
Governments are often reluctant to remove subsidies
analyses conducted (Table 10). e inability of governments
due to lobbying by the fishing industry and in fear of the neg-
in developing countries to enforce regulations in their territo-
ative socio-economic implications for fishing communities.
rial waters is a further incentive for large-scale industrial ves-
Despite severe overfishing, the EU continues to increase fleet
sels to target these waters for il egal fishing (Box 20).
modernisation subsidies, although is now also initiating the
In the Small Islands (Caribbean Sea/3a), the effects of
decommissioning of some vessels. Russian subsidies were re-
overexploitation were assessed as severe, with one-third of
fish species reported as overexploited. Existing regulations,
which are weakly enforced, have failed to
TABLE 10. ROOT CAUSES AND POTENTIAL POLICY INSTRUMENTS RELATED TO
maintain populations of reef fishes and
OVERFISHING AND OTHER THREATS TO AQUATIC LIVING RESOURCES
large groupers and snappers at sustain-
Potential policy instruments
able levels, with overfishing occurring
Contributing Underlying root
sector
causes
Short-term
Long-term
even within national parks.
Environmental management is still
Overexploitation and excessive by-catch and discards
in its infancy in Southeast Asia, with
Individual y transferable quotas
Common pool
Total al owable catch quotas
Marine protected areas
fisheries management less developed
resources
Zoning
Community management
Limitation of size of vessels
than terrestrial environmental manage-
Line and mesh restrictions
ment. e commercial fishing industry
Stock assessments
Insufficient scientific Catch surveys
Long-term monitoring
has considerable governmental influ-
knowledge
Model ing stocks and
programmes
ecosystems
ence, and corruption is a root cause in
Insufficient knowledge Information on gear and
Training in better management of
some countries. In Lake Victoria, the
by fishermen
fishing techniques
stocks
near-col apse of many traditional fisher-
Eco-label ing of fish products
Awareness campaigns for
Fisheries
Insufficient consumer Eco-label ing of aquarium
consumers and the public
ies and declines in Nile perch led to the
knowledge
fishes
Eliminate price distortions
implementation of a number of manage-
Inadequate incentives
Progressive elimination of
Fleet reduction programmes
subsidies
ment measures, including the banning of
leading to fleet
overcapitalisation
Reduce/redesign subsidies
Promote aquaculture
Job conversion stimulus packages
beach seines, undersized mesh nets and
Education and training in
trawlers. However, relevant institutions
Poverty and lack of
Job conversion stimulus
alternatives
packages
alternative activities
Local economic development
lack the capacity to enforce these fisher-
Review regulations
ies regulations effectively, so they are
Lack of regulations,
compliance and
Gear verifications
Capacity building for enforcement
Ban damaging gear
Promote community management
routinely ignored by fishers.
enforcement
Support enforcement
Destructive fishing practices
Poverty
Lack of regulations,
Review regulations
Poverty is a root cause and sometimes
compliance and
Gear verifications
Capacity building/training
enforcement
Ban damaging gear
Promote community management
a consequence of overfishing. Fishing
Fisheries
Support enforcement
communities in several developing re-
Poverty and lack of
alternatives
Subsidise appropriate gear
Alternative livelihood programmes
Local economic development
gions studied by GIWA are particularly
NOTE: THE TABLE PRESENTS ROOT CAUSES AND POTENTIAL POLICY INSTRUMENTS IDENTIFIED BY GIWA
REGIONAL TEAMS.
vulnerable to the depletion of fish stocks


CHALLENGES TO INTERNATIONAL WATERS: REGIONAL ASSESSMENTS IN A GLOBAL PERSPECTIVE
66
OVERFISHING AND OTHER THREATS TO AQUATIC LIVING RESOURCES 67
BOX 20. EXAMPLES OF ILLEGAL FISHING IN THREE GIWA REGIONS
Illegal fishing is a global prob-
enforcement makes the Sulu-
of prosecutions encourages
are estimated to be many times
lem but its impacts are par-
Celebes Sea an easy target for
illegal and unsustainable fish-
greater than legal catches. De-
ticularly severe in Sub-Saharan
illegal commercial fishers. The
ing. Enforcement agencies only
clining living conditions and
Africa, East Asia and Southeast
Indonesian Minister of Environ-
have sufficient funds to inspect
increasing unemployment in the
Asia. The three examples below
ment recently stated that illegal
about 1 of fishing activities. In
1990s led to small-scale poach-
highlight the range and com-
foreign fishing may cost the
Namibia and Angola, anglers are
ing. The impact of which is much
plexity of the issue.
country 4 billion USD. Unfortu-
not even required to purchase
smaller than that of illegal com-
nately, accurate data on legal, let
fishing licenses.
mercial fishing, which is often
Sulu Celebes Sea/56: The marine
alone illegal, fishing is generally
tacitly supported by govern-
fisheries contribute significantly
Caspian Sea/23: Official catches
unavailable.
ments. Enforcement of fish-
to the economies of Southeast
of sturgeon in the Caspian
ing regulations is expected to
Asia. The legal fisheries sector
Benguela Current/44: Although
Sea dropped from a peak of
remain weak due to widespread
accounts for 2 of Indonesia's
recreational fishing along South
22 000 tonnes in the 1970s to
corruption and the high profit
GDP but a significant proportion
Africa's west coast is regulated,
only 1 800 tonnes by the late
margins in the illegal fish trade.
of the total catch is illegal. Weak
weak enforcement and a lack
1990s. However, illegal catches
as they are highly dependent on the fisheries for their sur-
being. Aquaculture will also play a crucial role in boosting
vival and lack alternative livelihood opportunities. e lack
fish production to meet consumer demand but precautionary
of access to credit, alternative employment and social support measures should be undertaken in order to avoid associated
leaves poverty stricken fishers little option but to unsustain-
environmental impacts.
ably exploit dwindling stocks and employ destructive fishing
e severity and extent of overfishing has fostered the
practices to increase catches.
creation of a new ecosystem-based paradigm for fisheries
management which aims to conserve the structure and func-
tions of ecosystems. According to Sherman and Duda (1999),
POLICY RELEVANT
it attempts to minimise the impacts of fishing on non-tar-
get species, physical habitats, inter-species interactions and
CONCLUSIONS
spatial processes. Ecosystem management also coordinates
well with integrated water resource management, which is
Global marine fish catches peaked in the late 1980s and have
discussed in the chapter on freshwater shortage. e ecosys-
since been declining steadily. According to Pauly (2003),
tem approach is increasingly being endorsed by the UN and
global catches are predicted to continue to gradual y decline.
regional and national fishery institutions as a framework for
If current trends persist, many GIWA regions will witness se-
fisheries management and as a means of achieving the fisher-
quential depletion of fish stocks and continued destruction of ies goals of the World Summit on Sustainable Development
habitats.
(WSSD 2002). e GEF LME projects incorporate an ecosys-
e uncertain future of the fisheries depicted by the
tem management approach to improve fisheries management,
GIWA regional assessments could be avoided if the causes of
combat pol ution and habitat degradation, and strengthen
unsustainable exploitation are addressed. Damaging subsi-
governance. Several regions assessed by GIWA have adopted
dies that encourage overfishing must be gradual y curtailed
ecosystem-based management as a goal. e policy instru-
and appropriate legal, regulatory and incentive frameworks
ments discussed in this section are practical ways to introduce
need to be established and enforced. e col ection and dis-
elements of ecosystem-based management into fisheries man-
semination of accurate fisheries information is necessary for
agement (Table 10).
informed decision-making. Marine protected areas should
be adequately enforced and others established. ese actions,
Providing information to stakeholders
adopted within an ecosystem-based management approach,
Accurate data on fish stocks and recruitment is essential for
can provide substantial long-term benefits for human wel -
fisheries management. is information must be dissemi-


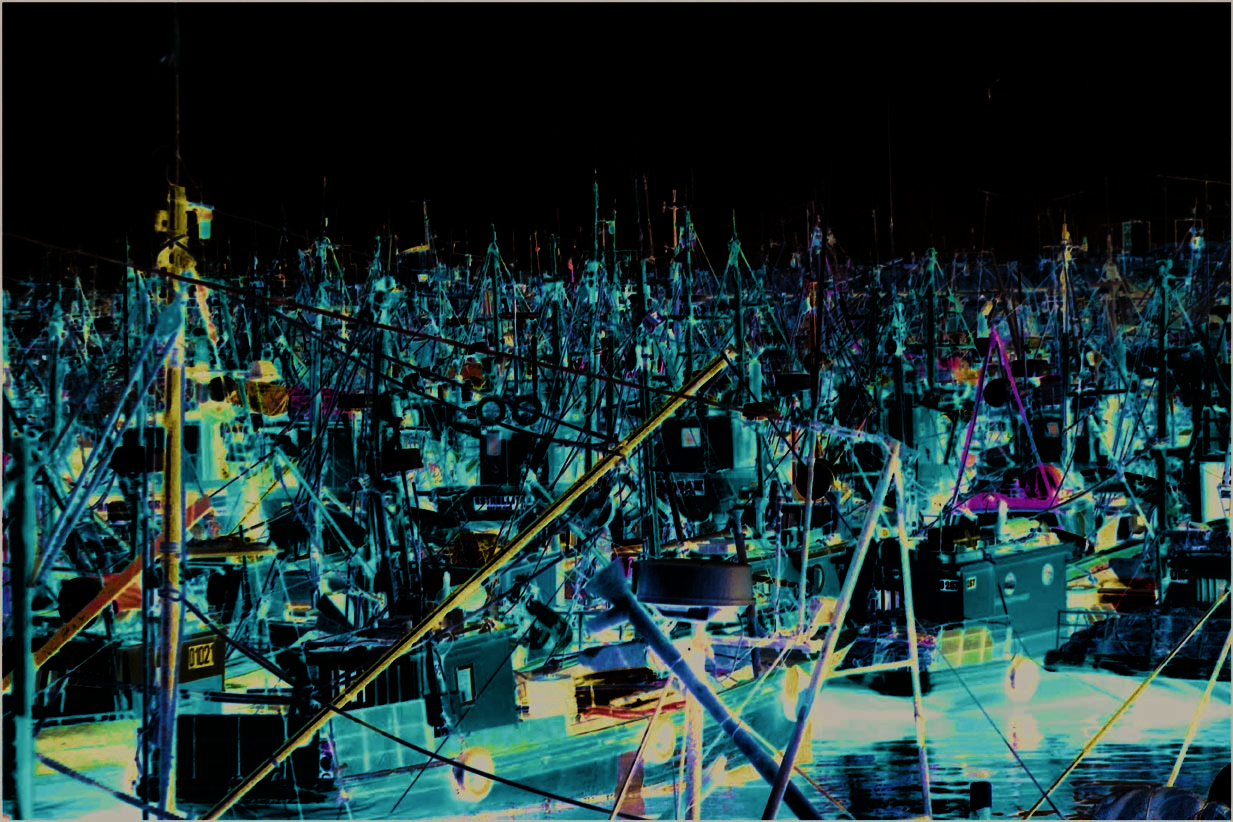
CHALLENGES TO INTERNATIONAL WATERS: REGIONAL ASSESSMENTS IN A GLOBAL PERSPECTIVE
68
OVERFISHING AND OTHER THREATS TO AQUATIC LIVING RESOURCES 69
nated to stakeholders, such as fishers, the food industry, gov-
ernment agencies and consumers. e GIWA regional experts
PART OF THE FISHING FLEET IN MAR
DEL PLATA, ARGENTINA.
who prepared the South China Sea/54 assessment identified
(PHOTO: IBL)
three key information and communication needs: (i) the col-
lection and analysis of accurate fisheries data; (i ) conduct
feasibility assessments prior to exploiting new fish stocks;
and (i i) enhance regional communication regarding fisher-
ies statistics, planning and management. ese requirements
are universal for policy-makers and producers but they are
rarely met. Certification of fish is a relatively new and, as yet,
uncommon approach to enable consumers to purchase fish
caught by sustainable techniques.
Community management is normal y based on restrict-
ing fishing methods, as well as managing the location and
timing of catches. Community-based management was rec-
ommended by many GIWA teams, particularly in Sub-Saharan
Africa and Southeast Asia.
Reform of subsidies and fleet reduction programmes
Until recently, governments have made relatively little effort
to reform subsidies which currently encourage overfishing.
e reduction of subsidies remains a contentious and com-
plicated issue. It often involves joint involvement of national
governments, regional regulatory bodies and the World
Trade Organization (WTO). ere needs to be control ed and
gradual reductions in subsidies backed up with community
support in order to minimise associated social problems. Al-
ternative subsidies may give fishers an incentive to adopt sus-
tainable fishing practices.
e most straightforward measure for relieving fishing
pressure is to reduce the fishing fleet. However, the feasi-
bility of such a measure is dependent on the level of influ-
ence the industry has on regulators and other governmen-
tal institutions. Decommissioning has therefore been more
Quotas and other catch restrictions
effective in the smal -scale fisheries of developing nations
Total Al owable Catch (TAC) quotas, based on the concept of
rather than in reducing industrial fishing fleets of developed
maximum sustainable yield, can be used to reduce fishing ef-
countries. Some EU fleet reduction programmes have ef-
fort. By making the quotas individual y transferable (ITQs),
fectively exported their overcapacity to developing regions.
the efficiency of TAC quotas is improved. e implementation
China, in response to overfishing and agreements with Japan
of TAC quotas can be chal enging, in terms of the initial al-
and South Korea, announced it will reduce its fishing fleet by location of quotas, the level of by-catch, and monitoring and
12 to 220 000 vessels and the number of fishermen by 10
enforcement issues. Precautionary quotas and the closure of
to 2.7 mil ion (Sea of Japan/33). Although these reductions
fisheries for a sufficient period have al owed full recovery of
are encouraging, they are too insignificant to turn the tide of
severely depleted stocks in European and North American
overfishing.
waters (e.g. herring, yel ow flounder and gadoids). Fishing
and processing quotas were also proposed by GIWA regional


CHALLENGES TO INTERNATIONAL WATERS: REGIONAL ASSESSMENTS IN A GLOBAL PERSPECTIVE
68
OVERFISHING AND OTHER THREATS TO AQUATIC LIVING RESOURCES 69
experts for freshwater systems, such as Lake Victoria. e
Zoning and marine parks
precautionary approach is a major step towards achieving
e establishment of protected areas or fishing areas regu-
sustainable fishing but requires comprehensive monitoring,
lated by seasonal and zonal restrictions can al ow the reju-
realistic stock assessments, social and economic support pro-
venation of fish stocks and the protection of target species.
grammes and proper mechanisms to control implementation. Although zoning is general y effective for smal -scale com-
Technological advancements have made fishing more
munity fisheries, it can be difficult to enforce such restrictions
efficient and sometimes more destructive. However, gear
on the industrial fishing industry. e enforcement of marine
restrictions and the promotion of selective technology are
parks is expensive, but the benefits can be significant; fish
measures commonly employed in many GIWA regions and,
catches near the Bamburi Marine Park in Kenya increased
in some cases, are effective in protecting stocks, but they in-
more than two-fold since its designation as a marine park
crease fishing costs.
(Somali Coastal Current/46b).


CHALLENGES TO INTERNATIONAL WATERS: REGIONAL ASSESSMENTS IN A GLOBAL PERSPECTIVE
70
HABITAT AND COMMUNITY MODIFICATION
71
MANGROVE FOREST CONVERTED TO DESERT BY
FARMERS IN ORDER TO PRODUCE CHARCOAL.
71
(PHOTO: M. EDWARDS/STILL PICTURES)


CHALLENGES TO INTERNATIONAL WATERS: REGIONAL ASSESSMENTS IN A GLOBAL PERSPECTIVE
70
HABITAT AND COMMUNITY MODIFICATION
71
71
e GIWA assessment il ustrated that the world's freshwater and
marine habitats have been extensively modified by human activities.
is has resulted in a loss of global biodiversity and led to the
proliferation of invasive species in the coastal and freshwater systems
evaluated by GIWA. Habitat modification is often the consequence
of one or more of
the other GIWA
concerns and issues,
HABITAT AND
such as pol ution,
invasive species,
COMMUNITY
the modification of
stream flow, and
MODIFICATION
overfishing. e
modification of stream flow fol owing the construction of dams and
other water infrastructure, particularly to supply water to irrigated
agriculture, is the major cause of habitat modification in freshwater
systems. In marine systems, however, the fisheries have the greatest
impact on habitats and their biodiversity. e majority of regional
teams predicted that habitats will deteriorate in the future due
to increasing pressure from human activities. Recent mass coral
bleaching events are the single most dramatic example of global
climate change affecting an ecosystem on a global scale.


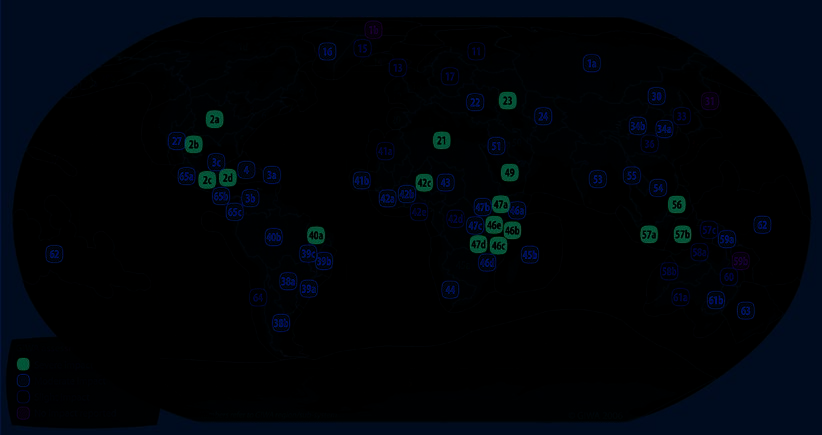
CHALLENGES TO INTERNATIONAL WATERS: REGIONAL ASSESSMENTS IN A GLOBAL PERSPECTIVE
72
HABITAT AND COMMUNITY MODIFICATION
73
GIWA assessed the severity of the environmental and socio-
BOX 21. TRANSBOUNDARY HABITAT AND COMMUNITY
economic impacts of this concern by evaluating two principal
MODIFICATION
issues: loss of aquatic ecosystems and modification of aquatic
ecosystems, including community structure and/or species
Habitat modifications can have impacts on an international scale
in all major aquatic ecosystems. The fragmentation of trans-
composition. is chapter discusses the status of these two
boundary river basins by dams and other structures may cause
issues for each of five major aquatic habitats that are high-
considerable changes to ecosystem functions and services in
lighted in the GIWA regional reports: rivers, lakes, coral reefs,
downstream countries. In lakes and semi-enclosed seas, where
mangroves and seagrasses. Although direct habitat modifica-
water exchange is limited, land-based and upstream sources of
tion is often local in extent, transboundary impacts are not
pollution and eutrophication may alter pelagic and benthic habi-
uncommon (Box 21). e overall results of the GIWA assess-
tats of more than one country. Wetland habitats and communities
ment for habitat and community modification are sum-
are drastically modified as a result of upstream water abstraction,
marised in the matrix in the back of this report.
changes in the flooding regime and pollution.
The degradation of coastal marine habitats often reduces the ex-
Global situation and trends
tent of important nursery and spawning grounds for migratory
fish. Changes to habitats that host unique communities with high
Habitat modification was the top priority issue in over
one-fifth of the GIWA regions and sub-systems.
endemic species diversity will result in a loss of global diversity.
e alteration of the world's freshwater and marine habi-
tats has reduced global biodiversity, changed the struc-
larly in Southeast Asia. ey are extremely vulnerable to
ture of aquatic communities and led to the proliferation
global climate change.
of invasive species on every continent and in all marine
Mangrove forests are severely threatened worldwide as a
waters assessed by GIWA. Almost three-quarters of the
result of the increased demand for timber, construction in
GIWA regions/sub-systems assessed the overall impacts of
coastal areas and aquaculture.
habitat modification to be severe or moderate (Figure 27).
Freshwater habitats, particularly wetlands, are severely
Coral reefs have been seriously degraded by destructive
modified by land-use changes, such as drainage, river le-
fishing practices and coastal land reclamation, particu-
vees and deforestation.
FIGURE 27. OVERALL ENVIRONMENTAL AND SOCIO-ECONOMIC IMPACTS OF HABITAT AND COMMUNITY MODIFICATION


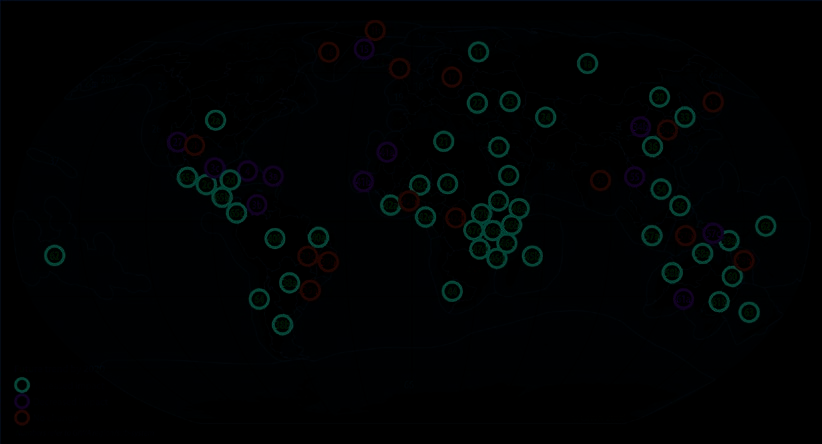
CHALLENGES TO INTERNATIONAL WATERS: REGIONAL ASSESSMENTS IN A GLOBAL PERSPECTIVE
72
HABITAT AND COMMUNITY MODIFICATION
73
FIGURE 28. FUTURE ENVIRONMENTAL TRENDS OF HABITAT AND COMMUNITY MODIFICATION
Regional experts forecasted that in the majority of GIWA
Rivers
regions, habitats will deteriorate in the future. Only a few ere are two principal anthropogenic factors which alter
regions are showing signs of improvement, including a
the habitats of rivers: (i) inputs of pol utants, sediments and
cluster in the Caribbean (Figure 28).
nutrients; and (i ) changes to the flow regime. e former is
discussed in the chapter on pol ution.
e construction of dams and other structures that con-
ENVIRONMENTAL AND SOCIO
trol or divert the flow of water in rivers has yielded consider-
able economic and social benefits throughout the world, in-
ECONOMIC IMPACTS
cluding the generation of hydropower, the provision of water
for drinking and irrigation, and the mitigation of floods.
Freshwater habitats
However, these structures cause massive aquatic habitat and
Freshwater habitats provide invaluable services to mankind,
community modification in the world's river basins (Table 11
but growing demand for freshwater resources and services
and 13). Anthropogenic activities have depreciated the value
by burgeoning human populations is placing an unsustain-
of many habitats for human wel -being, including a decreased
able burden on these habitats. e modification and loss of
capacity to meet basic human needs, such as food and fuel.
biodiversity and/or ecosystems, and the propagation of in-
Impacts of dams arise from either changes in the hy-
vasive species were identified by the GIWA regional teams as
drological regime or the physical barriers imposed by dams
the most frequent transboundary environmental impacts of
(see also the chapter on freshwater shortage). Alterations to
freshwater habitat modification. Wetlands were recognised as flow regimes invariably cause changes to habitats and com-
severely modified ecosystems, the biodiversity of which has
munity structures. e Colorado River Delta, for example,
been impoverished by human activities. e most common
which once covered 780 000 ha and supported between
socio-economic impacts are reduced fisheries revenue, loss of
200 and 400 species of plant, bird and fish, has declined to
employment and increased costs arising from mitigation and
less than 60 000 ha. is has been attributed primarily to the
treatment measures (Table 11, Box 22).
construction of the Hoover and Glen Canyon dams, and the


CHALLENGES TO INTERNATIONAL WATERS: REGIONAL ASSESSMENTS IN A GLOBAL PERSPECTIVE
74
HABITAT AND COMMUNITY MODIFICATION
75
TABLE 11. SEVERE IMPACTS ON FRESHWATER HABITATS AND COMMUNITIES IDENTIFIED IN GIWA REGIONS
Freshwater habitats
Environmental impacts
Socio-economic impacts
f
f
n
d
i
o
d
i
v
e
r
s
i
t
y
p
e
c
i
e
s
n
d
o
s
s o
o
s
t
s
*
a
s
i
c ater)
f b
e
d
i
m
e
n
t
a
-
o
p
u
l
a
t
i
o
n o
o
u
r
i
s
m
,
n
d a l
e
e
t b
o
s
s o
h
e p
n
d
/
o
r s
n
v
a
s
i
v
e s
n t
e
v
e
n
u
e a
r
o
m t
o m lean w
n
d l
f i
r
e
a
t
m
e
n
t c
p
e
c
i
e
s
t
o
c
k
s
a
l
u
e
s
e
.
g
. c
r
o
s
i
o
n a
e
c
l
i
n
e i
n
d t
c
o
s
y
s
t
e
m
s
i
s
h s
i
s
h s
i
s
h
e
r
i
e
s r
e
v
e
n
u
e
s f
a
p
a
c
i
t
y t
l
o
o
m
s
m
p
l
o
y
m
e
n
t a
r
a
d
i
t
i
o
n
a
l l
i
v
e
l
i
h
o
o
d a
e
e
d
s (
Freshwater
a
t
t
e
r
n
s
n
d d
f t
o
d
i
f
i
c
a
t
i
o
n a
i
t
i
g
a
t
i
o
n a
GIWA region
habitat affected
M and/or e
C
h
a
n
g
e
d e
t
i
o
n p
E
s
t
a
b
l
i
s
h
m
e
n
t o
L
o
s
s a endemic f Reduced f
A
l
g
a
l b
R
e
d
u
c
e
d f
e
m
p
l
o
y
m
e
n
t
R
e
d
u
c
e
d r
h
i
g
h
e
r e
r
e
c
r
e
a
t
i
o
n
a
l v
M
L
o
s
s o values Reduced c human n
a Mississippi River (Gulf of Mexico)
Riparian wetlands
b Rio Bravo (Gulf of Mexico)
Riparian vegetation,
rivers
Colorado River (Gulf of California)
Wetlands, riparian forests
a Yel ow Sea (Yel ow Sea)
Marshlands, lakes, rivers
b Bohai Sea (Yel ow Sea)
Wetlands, rivers, lakes
a La Plata River Basin (Patagonian Shelf)
Rivers, riparian habitats
a Paranaiba River Basin (Northeast Brazil Shelf) Rivers, lakes
c Niger Basin (Guinea Current)
Rivers, ponds, wetlands
b Canary Current South
Wetlands, lakes
Orange-Vaal River Basin (Benguela Current)
Wetlands, riparian
vegetation, rivers
b Lake Victoria (East African Rift Val ey Lakes) Wetlands, riparian
vegetation, open waters
Jordan
Rivers, wetlands,
Dead Sea
b Muray Darling Basin (Great Australian Bight) River, riparian
vegetation, wetlands
overuse of water by agriculture and urban areas in Arizona,
BOX 22. TRANSBOUNDARY SOCIO-ECONOMIC IMPACTS
OF HABITAT DEGRADATION: CASE OF THE
California and northwestern Mexico (Gulf of California/
YELLOW SEA CATCHMENT AREA
27). In the Volta River Basin (Guinea Current/42b) more
The GIWA assessment of the Yellow Sea region illustrates the
than 650 dams have impounded the Sudano-Sahelian por-
complexity of marine and freshwater habitat modification, and
tion of the Basin, resulting in the loss of wetlands, including
the resulting socio-economic impacts. Over 30 of the freshwa-
marshes and floodplains.
ter wetlands, lakes, rivers and lagoons have disappeared in the
e modification of flow regimes, in conjunction with
last 30 years. Alien species, such as the marine cordgrass (Spartina
deforestation along river banks and poor agricultural prac-
sp.), have replaced endemic species, and new diseases have been
tices in surrounding catchments, has affected sediment trans-
introduced into both the freshwater and marine environment. The
port, erosion rates and nutrient loads in many rivers through-
loss of wetlands in the Huai River Basin has decreased fish catches
and adversely affected cultural heritage sites. The degradation of
out the world. In the Mekong River, this has reduced fish
ecosystems has reduced employment in tourism and aquaculture
abundance and spawning areas, which has been a contribut-
in the basin, and overall employment has fallen by 10 over the
ing factor in forcing Cambodia to shift from exporting to
past decade. Throughout the Yellow Sea region, the production of
importing fish to meet local demand.
aquatic life used in Chinese medicine, such as seahorses, seadrag-
e construction of dams has converted many water
ons and scallops, has decreased by 40 over the same period.
habitats from flowing to static environments which in several
(SOURCE: YELLOW SEA/34)
GIWA regions, for example the Amazon/40b and the Patago-


CHALLENGES TO INTERNATIONAL WATERS: REGIONAL ASSESSMENTS IN A GLOBAL PERSPECTIVE
74
HABITAT AND COMMUNITY MODIFICATION
75
FIGURE 29. ATATURK DAM ON THE EUPHRATES RIVER PROVIDES POWER TO TURKEY.
(PHOTO: CORBIS)
nian Shelf/38, has caused a decline in fish species that inhabit lake habitats are: (i) dams reducing downstream flows; (i )
fast-flowing, rocky-bottom habitats. Dredging for naviga-
river diversions for irrigation and, to a lesser extent, domes-
tion has significantly modified the benthic habitats of rivers
tic and industrial water supply; (i i) drainage basin land-use
in many regions, including the Brazil Current/39. Common
changes; (iv) the introduction of invasive species; (v) overfish-
vegetation types, such as riparian marshes, have been dis-
ing; and (vi) salinisation. Decreases in lake areas have been
placed by aggressive invasive species, such as Water hyacinth
reported in many GIWA regions, including the Aral Sea/24,
(Eichhornia cras ipes) and Hydril a (Hydrilla verticulata).
Caspian Sea/23, East African Rift Val ey Lakes/47, Jordan/51
In the Caspian Sea/23 region, international conflicts
and Lake Chad/43.
have arisen from dam-induced habitat modification affecting
e most spectacular example of lacustrine habitat
the commercial fish stocks of the entire region but only the
modification is the retreat of the Aral Sea/24, which resulted
countries that constructed the dams benefiting from the elec-
from the diversion of water from the Amu Darya and Syr
tricity and water for irrigation.
Darya rivers for irrigation. e surface area of the Aral Sea
While habitat degradation is currently more severe
has been reduced by 50 since the 1950s and the water level
in developing countries, some of the most extensive habitat
has dropped 20 metres. Moreover, the increased salinity of
modification has previously occurred in developed coun-
the sea has transformed it into a biological desert and caused
tries. e midwestern US states have drained the equivalent
the total col apse of the once productive fishery. e health
of 14.1 mil ion ha of wetlands in the Mississippi River Basin
of the region's population has deteriorated and employment
(Gulf of Mexico/2a) over the past 200 years.
opportunities for the former shoreline communities have de-
clined. A similar fate is currently befal ing the Dead Sea (see
Lake habitats
Box 3 in the freshwater shortage chapter).
Lakes are critical reservoirs that store surface water for a
In many transboundary lakes, a reduced influx of water
multitude of essential human uses and services, including
and increasing eutrophication have changed the community
consumption, agriculture and recreation. According to the
structure from open-water systems to marshy habitats, conse-
GIWA regional reports, the most significant factors affecting
quently altering fish assemblages. Lake Chad/43 is one of the


CHALLENGES TO INTERNATIONAL WATERS: REGIONAL ASSESSMENTS IN A GLOBAL PERSPECTIVE
76
HABITAT AND COMMUNITY MODIFICATION
77
world's most dramatic examples of rapidly shrinking open-
and the construction of the Turkwell Dam, which lowered
water areas being replaced by marshy wetlands. An effect of
lake levels, led to the col apse of the Tilapia (Oreochromis spp.)
this change is that the most important commercial fish, which fisheries in the majority of Lake Turkana (East African Rift
were previously open-water species, have been replaced by cat-
Val ey Lakes/47a). e loss of income from the fisheries sec-
fish (Clarias sp.) and other wetland species. In addition, inva-
tor had a severe impact as there are virtual y no other local
sive plants now blanket half the surface of Lake Chad.
employment opportunities.
Lakes are the recipients of sediments originating from
the surrounding drainage basins, which have increased in
Marine habitats
volume as a consequence of land-use changes. For example,
e continued health of coastal ecosystems is essential for
overgrazing and deforestation has intensified sedimentation
human wel -being, as well as for other ecosystem services,
in Lake Malawi, Lake Tanganyika and Lake Turkana. Nu-
including shoreline protection, water quality and biodiver-
trients contained in these sediments have contributed to eu-
sity reservoirs. Unregulated access to coastal ecosystems is
trophication, particularly in Lake Victoria, where anoxic con-
putting these resources at risk (Table 12). e most common
ditions have reduced fish abundance and diversity, especial y
transboundary environmental impacts are modification and/
among endemic cichlid populations. Endemic fish popula-
or loss of biodiversity, and increased sedimentation or ero-
tions were additional y impacted by the introduction of Nile
sion. e most frequent socio-economic impacts are experi-
Perch (East African Rift Val ey Lakes/47).
enced by the fisheries and tourism sectors.
In many international lakes, the impacts of habitat
Coastal lagoons and estuaries, tidal mudflats, and
modification, particularly on fish communities, have been ex-
sandy and rocky shores are particularly affected by pol ution,
acerbated by overexploitation. A combination of overfishing
such as oil spil s, solid waste and eutrophication. e fol ow-
TABLE 12. SEVERE IMPACTS ON MARINE HABITATS AND COMMUNITIES IDENTIFIED IN GIWA REGIONS
Marine habitats
Environmental impacts
Socio-economic impacts
f
n
d
f
r
o
s
s o
f
n
v
a
s
i
v
e
e
v
e
n
u
e
e
v
e
n
u
e
r
o
m
f i estoration)
n
d
/
o
r l
n
v
a
s
i
v
e
r
e
a
t
m
e
n
t
o
n
f
l
i
c
t
s
o
p
u
l
a
t
i
o
n
s a
t
r
u
c
t
u
r
e
s
f i
n
d t
n p
r
a
g
m
e
n
t
a
t
i
o
n o
e
d
i
m
e
n
t
a
t
i
o
n o
a
l
u
e
s
e
r
v
i
c
e
s
o
n
t
r
o
l o
s
e
r c
a
b
i
t
a
t
s
r
o
d
u
c
t
i
v
i
t
y
i
s
h
e
r
i
e
s r
o
u
r
i
s
m r
e
v
e
n
u
e f
o
a
s
t
l
i
n
e r
r
a
d
i
t
i
o
n
a
l
n
d f
m
p
l
o
y
m
e
n
t
m
p
l
o
y
m
e
n
t
; l
o
s
s o
e
.
g
. c
f t
o
d
i
f
i
c
a
t
i
o
n a
i
t
i
g
a
t
i
o
n a
GIWA region
Marine habitats affected
M biodiversity
C
h
a
n
g
e
s i
c
o
m
m
u
n
i
t
y s
I
n
t
r
o
d
u
c
t
i
o
n o
s
p
e
c
i
e
s
L
o
s
s a coastal h Reduced p Increased s erosion Reduced f and e Reduced t and e recreation v Reduced r ecosystem s M costs ( species, c Loss o livelihoods Increased u
a Small Islands (Caribbean Sea) Coral reefs, mangroves, seagrass
beds, sandy shores
a Yel ow Sea (Yel ow Sea)
Salt marshes, estuaries
b Bohai Sea (Yel ow Sea)
Salt marshes, estuaries
a South/Southeast Atlantic
Salt marshes, mangroves, coral
Basins (Brazil Current)
reefs, estuaries
b East Atlantic Basins (Brazil
Current)
Salt marshes, mangroves, coral reefs
a Northeast Brazil Shelf
Mangroves, estuaries, coral reefs
Canary Current
Mangroves
c Comoe Basin (Guinea
Current)
Mangroves, estuaries, lagoons
Benguela Current
Estuaries, sandy foreshores
Bay of Bengal
Mangroves, coral reefs
South China Sea
Mangroves, coral reefs, wetlands,
seagrass areas
Sulu-Celebes Sea
Seagrass beds, muddy and sand-
gravel bottoms, coral reefs
a Sunda (Indonesian Seas)
Mangroves, seagrass beds, muddy
and sand-gravel bottoms, coral reefs
b Wal acea (Indonesian Seas)
Mangroves, coral reefs


CHALLENGES TO INTERNATIONAL WATERS: REGIONAL ASSESSMENTS IN A GLOBAL PERSPECTIVE
76
HABITAT AND COMMUNITY MODIFICATION
77
ing section, however, will concentrate on coral reefs, man-
community dynamics of the reefs. Reefs and their dependent
groves and seagrass beds where human impacts are manifold.
species are also altered by the use of dynamite and narrow
meshed nets.
Coral reefs
Coastal development is a major source of coral reef
e condition of coral reefs varies regional y depending on
degradation. In the Indonesian Seas/57 region, development
the level of human pressure placed on them. Coral reefs in
and expansion of ports has destroyed reefs and associated
more sparsely populated regions of the world, such as the
islands. In addition, the construction of hotels along the fore-
Coral Sea/59, Great Barrier Reef/60 and Pacific Islands/62,
shore adjacent to coral reefs increases the number of people
are general y in good condition. However, in densely popu-
in coastal areas resulting in the accumulation of solid waste,
lated regions and in locations where reefs are easily acces-
eutrophication from the discharge of untreated effluents and
sible, coral reef ecosystems are degraded by overfishing and
physical damage from anchoring and other tourist activities
destructive fishing methods, sedimentation, inappropriate
(Caribbean Sea/3, Caribbean Islands/4) (Box 23).
coastal development and tourism. e reefs of Indonesia pro-
e addition of nutrients within untreated or inad-
vide annual economic benefits of 1.6 bil ion USD, based on
equately treated effluents from coastal cities has caused dra-
their value for food security, employment, tourism, pharma-
matic changes to many coral reefs worldwide. Reefs near
ceutical research and production, and shoreline protection.
urban centres in Brazil exhibit 77 macroalgal cover, com-
However, over the next 20 years, anthropogenic degradation
pared with 41 in less populated areas (Northeast Brazil
of reefs could cost Indonesia around 2.6 bil ion USD (Indo-
Shelf/40a). Poor agricultural practices and deforestation have
nesian Seas/57).
also decreased the extent of coral reefs, especial y near river
Burgeoning coastal populations with few alterna-
mouths where sediments, pesticides and fertilizers smother
tive sources of food or income have led to the widespread
the corals and impede their growth.
overexploitation and degradation of coral reef ecosystems in
Up until 1998, the global agenda to conserve coral reefs
many developing regions. In the Pacific Islands/62 region,
had concentrated on preventing direct anthropogenic im-
the breakdown of traditional community controls on fishing
pacts. However, during the last decade, mass coral bleach-
has led to overfishing near populated areas. Here, as well as
ing events provide tangible evidence of the effect of climate
in most other tropical shal ow water systems, overexploita-
change on aquatic habitats, emerging as potential y the great-
tion has greatly affected fish populations and changed the
est threat to coral reefs (Box 24).
BOX 23. TOURISM AND HABITAT MODIFICATION: CASE OF THE CARIBBEAN
Tourism is a vital industry for the economies of many Caribbean na-
charged by cruise
tions, accounting for one-quarter of GDP and one in every five jobs.
liners and tourist fa-
The Wider Caribbean region attracts 57 of international scuba
cilities, enters coastal
diving tours; generating nearly 900 million USD in 2005. The cruise
waters, further re-
industry also represents a significant proportion of tourism, with
ducing the environ-
14.5 million cruise passengers received by the Caribbean Islands/4
mental quality of the
region in 2000. Employment has subsequently shifted from fishing
Caribbean.
to tourism.
Habitat modifica-
Since the success of the tourism industry is dependent on the beauty
tion reduces income
DIVING BOAT, DIVI FLAMINGO, ANTILLES.
and services of coastal ecosystems, it is vulnerable to environmental
opportunities in the
(PHOTO: J. OLIVER, REEFBASE)
degradation. Reef dive tourism is inadequately managed in the Ca-
tourism sector as fish-
ribbean Islands/4, as in many parts of the world, causing significant
ing, snorkelling and diving become less appealing to tourists. The
anchor and diver damage in intensely visited locations. In the Central
costs can be considerable; 12 million USD of tourism revenue are lost
America/Mexico sub-system (Carribean Sea/3c), hotel construction
annually in the Nicoya Gulf of Costa Rica.
is of particular concern due to the resultant habitat fragmentation.
(SOURCE: SMALL ISLANDS (CARIBBEAN SEA/3A), CENTRAL AMERICA/MEXICO
Land-based sources and ship-borne pollution, including waste dis-
(CARIBBEAN SEA/3C), CARIBBEAN ISLANDS/4)


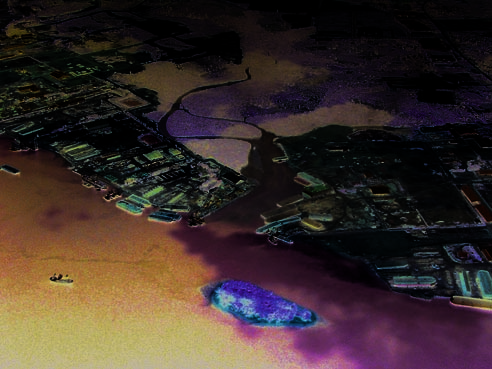

CHALLENGES TO INTERNATIONAL WATERS: REGIONAL ASSESSMENTS IN A GLOBAL PERSPECTIVE
78
HABITAT AND COMMUNITY MODIFICATION 79
BOX 24. CORAL BLEACHING AND THE INFLUENCE OF EL
NIŃO AND GLOBAL CLIMATE CHANGE
Bleaching in corals is a stress response caused by the loss of the
symbiotic dinoflagellates that reside within coral tissue. Although
many factors can cause bleaching in certain localities, only ab-
normal increases in sea temperature over a period of months can
cause coral bleaching on a regional and even global scale. In the
1997/1998 El Nińo event, bleaching caused coral mortality, effec-
tively destroying around 50 of the world's shallow water coral
reefs. The Indian Ocean was particularly affected but extensive
bleaching was also reported in the South China Sea, Sulu-Cele-
bes Seas, the Pacific Islands and throughout the Caribbean. Prior
to coral bleaching in the 1990s, the phenomenon was thought to
be local in extent. Since then, six mass bleaching events have oc-
curred, always coinciding with an El Nińo event. At present, mass
bleaching of corals only occurs if an El Nińo of sufficient strength
prevails for long enough to cause significant increases in sea tem-
perature. However, if global sea temperatures continue to rise as
FIGURE 30. COASTAL DEVELOPMENT NEAR A MANGROVE
predicted and approach the thermal tolerance limit of corals, El
ESTUARY, SINGAPORE.
Nińos of smaller magnitude would be capable of causing mass
(PHOTO: J. OLIVER, REEFBASE)
bleaching. The increasing frequency and severity of mass coral
bleaching events are considered the most significant threat caused
led to the col apse of the shrimp and Jack mackerel fishery
by global climate change to an ecosystem on a global scale.
and a downturn in the freshwater clam industry (Volta Basin
(Guinea Current/42b) . e economic costs can be substan-
tial. For example, in the Indian Ocean Islands/45b, direct
monetary costs from loss of mangrove habitats are 600 USD
per ha, or 204 mil ion USD per year. Similarly, in many re-
gions, rice paddies, and sugar cane and palm plantations have
replaced large areas of mangrove forest.
e growth of coastal towns and cities has destroyed
many mangrove forests (Figure 30). In the Guinea Current/
BLEACHED CORALS IN THE GREAT BARRIER REEF, KEPPEL ISLANDS.
42 region, the expansion of Accra in Ghana has cleared 55
(PHOTO: G. LOTTON, REEFBASE)
of the mangroves and significant areas of marshland in the
surrounding area. e expansion of population centres also
Mangroves
requires infrastructure development, such as roads, ports and
Mangroves are highly productive forest habitats found along
waste disposal sites. In the Philippines, 60-80 of the man-
sheltered tropical coastlines. ey are essential sources of
grove forests have been cleared for port developments. e
wood for firewood and construction, as well as invaluable
reclamation of land for infrastructure development is often
nursery areas for juvenile fish and crustaceans. ey also pro-
most visible in densely populated islands and atol s, where
vide coastal protection and filtration functions.
both space and natural resources are limited. is is demon-
e area of the world's coastline occupied by man-
strated in the Pacific Islands/62, where more than 50 of the
groves is rapidly declining. More than a dozen GIWA regions
region's mangroves have been removed or severely degraded.
reported that unsustainable timber harvesting has degraded
In the Brazil Current/39 region and Caribbean/3&4, the
mangrove ecosystems. In Africa's Volta River Delta, the deg-
construction of tourist hotels and associated facilities, such
radation of mangrove habitats has changed the species com-
as marinas, golf courses and airports, has resulted in the de-
position of 70 of the fish communities since 1969, and has
struction of mangrove habitats.


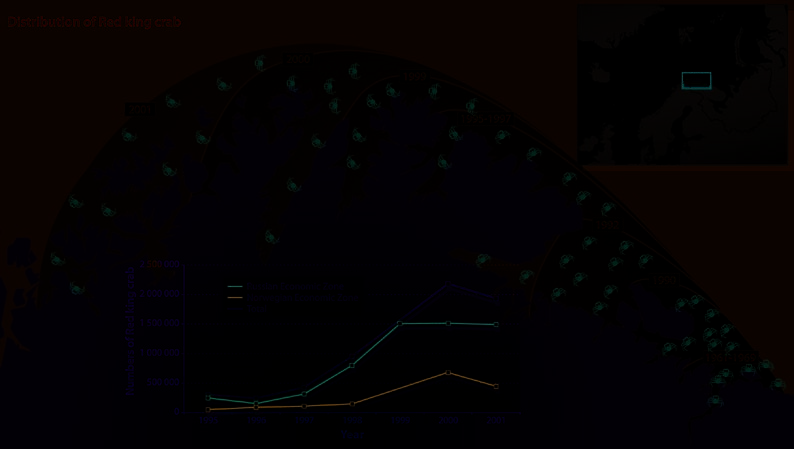

CHALLENGES TO INTERNATIONAL WATERS: REGIONAL ASSESSMENTS IN A GLOBAL PERSPECTIVE
78
HABITAT AND COMMUNITY MODIFICATION 79
BOX 25. TRANBOUNDARY IMPACTS OF INVASIVE SPECIES
In addition to the increase in global maritime
47b,c, South China Sea/54 and Indonesian
traffic and aquaculture, invasive species,
Seas/57a,b. The accidental introduction of
which can be intentionally or accidentally
the Asian mussel (Limnoperna fortunei) into
introduced, are now widely acknowledged
the La Plata River costs nearly 1 million USD
as a critical transboundary problem in both
every day that the Itaipú Dam has to shut-
freshwater and marine habitats. Invasive
down power in order to remove the mussels
species have caused environmental impacts
(Patagonian Shelf/38a).
significantly altered benthic communities.
in almost half of the GIWA regions. A number
In marine habitats, there are a greater num-
In 2002, commercial fishing of the Red king
of initiatives aimed at limiting the introduc-
ber of introduced species but many remain
crab began in Norway, which has increased
tion and extent of invasive species have
undetected. The GIWA regional teams that
employment in the fish processing sector
been developed, including the GEF/IMO/
highlighted marine invasive species as a con-
but at the cost of jobs in factories processing
UNDP Global Ballast Water Management
cern include the Barents Sea/11, Baltic Sea/17,
traditional fish catches. Several other inva-
Programme (GLOBALLAST) and regional
Black Sea/22, Caspian Sea/23, Brazil Current/
sive species in the Barents Sea have caused
activities, such as the GEF-supported UNDP
39, Yellow Sea/34, and Benguela Current/44.
economic losses. In Russia, the introduc-
Caspian Environment Programme.
The impact of invasive species on the ecol-
tion of the Humpback salmon (Oncorhyn-
In freshwater systems, the widespread intro-
ogy of the Black Sea is discussed in Box 19 in
chus gorbuscha), which is less prized than
duction of Tilapia (Oreochromis spp.), Carp
the chapter on overfishing and other threats
the Atlantic salmon (Salmo salar) for sport
(Cyprinus carpio), Nile perch (Lates niloticus)
to aquatic living resources.
and commercial fisheries, has reduced the
and Water hyacinth (Eichhorizia crassipes)
economic and recreational value of many riv-
The Red king crab (Paralithodes camtschati-
has significantly impacted riverine and lake
ers. Parasites and pathogens caused at least
cus) of the Pacific was deliberately introduced
habitats, and has led to the extinction of
500 million USD of damage to the Norwegian
by Russian scientists into the Barents Sea/11.
endemic species in several GIWA regions,
farmed and wild salmon fishery between
Since its introduction, the population of Red
including the Gulf of California/27, Benguela
1985 and 2000.
king crab has increased and spread west-
Current/44, East African Rift Valley Lakes/
wards into Norwegian waters where it has
INCREASED EXTENT OF RED KING CRAB IN THE BARENTS SEA.
(SOURCE: MATISHOV & DENISOV 2000)


CHALLENGES TO INTERNATIONAL WATERS: REGIONAL ASSESSMENTS IN A GLOBAL PERSPECTIVE
80
HABITAT AND COMMUNITY MODIFICATION
81
Aquaculture is probably the greatest single factor be-
quently harms seagrass communities and reduces biodiversity.
hind mangrove deforestation, particularly in South America
In Southeast Asia, trawling in coastal waters also damages
and Southeast Asia (see Box 18). In the Philippines, prawn
seagrass beds (Indonesian Seas/57, Sulu-Celebes Seas/56).
aquaculture occupies an area of 500 000 ha and has reduced
Box 25 discusses the transboundary impacts of invasive
intact mangrove forests by 50. In the 1990s, governments of
species in marine and freshwater habitats.
the Indonesian Seas/57 region al ocated up to 1 mil ion ha of
land, mostly mangrove forests, to the shrimp industry. How-
ever, about 70 of the shrimp farms were abandoned by 2001
because they had become unproductive as a result of aquacul-
ROOT CAUSES
ture pol ution and the creation of acid sulfate soils. Mangrove
conversion throughout Southeast Asia has led to conflict
Habitat and community modification was targeted for causal
between local inhabitants and migrants. e introduction of
chain analysis in 16 GIWA regions/sub-systems (Table 13 and
aquaculture in Brazil has created similar conflicts between
14). e most common immediate causes identified by the
prawn farmers and artisanal fishermen. Brazilian prawn
GIWA regional teams were: (i) pol ution; (i ) invasive spe-
farmers buy or appropriate land, which is usual y public, and
cies; (i i) modification of stream flow; and (iv) overfishing.
close its access to fishermen, many of whom have fished these e principal sectors causing environmental impacts were
areas for many years (Brazil Current/39).
agriculture and the fisheries. Many of the GIWA causal chain
analyses discussed the extent to which the three other GIWA
Seagras es
concerns drive habitat modification. e fol owing section
Seagrass communities are highly productive habitats com-
examines the root causes of habitat degradation.
monly found in shal ow coastal and estuarine waters in many
regions of the world. In addition to providing valuable nurs-
Population and economic growth
ery areas for juvenile fish and crustaceans, seagrass beds are
Demographic change, such as population growth, was iden-
important filters and stabilisers of sediments, particularly in
tified as one of the main root causes in almost every GIWA
regions prone to storms, such as the Pacific Islands/62 and
regional report that focused on habitat modification in the
the Caribbean region/3 & 4. ese services provide consider-
causal chain analysis. Increasing populations exacerbate the
able economic benefits; in the South China Sea/54 region the transboundary impacts and causes of habitat modification. In
value of seagrass beds and coastal swamps is estimated to be
the East China Sea/36 region, for example, thousands of hect-
190 mil ion USD annual y.
ares of shoals have been reclaimed in the Yangtze (Changji-
Seagrass beds are primarily degraded as a result of in-
ang) estuary for the expansion of agriculture and urban areas
creasing concentrations of nutrients and particulate matter
in order to accommodate an increasing population.
in coastal waters. Physical disturbance resulting from the
In the neighbouring South China Sea/54, as in many
increasing use of the coastal zone for transportation, reclama-
other regions, most of the transboundary habitat impacts and
tion and fishing also causes extensive damage.
their immediate causes are exacerbated by population growth
In the Caribbean, land reclamation, and coastal and
and migration, as well as economic and industrial growth.
port construction associated with tourism have caused con-
ese impacts threaten the coastal and marine habitats on
siderable degradation to seagrass communities and reduced
which the population depends.
water clarity as a result of dredging and landfil activities. e
Increased pressure on ecosystems and the consequent
increase in coastal activity, particularly tourism, recreation
modification of habitats are not only a matter of population
and urban development, has resulted in significant impacts
growth. Economic growth and increasing demand for prod-
on seagrass communities due to increased sedimentation and
ucts are also root causes of habitat modification. e econo-
nutrient loads emanating from sewage discharges, and from
mies of many countries in Southeast Asia, especial y China,
physical damage caused by boating, anchoring and other ac-
are growing rapidly. In the Yel ow Sea/34 region, as in other
tivities. Eutrophication, stimulated by elevated nutrient loads,
parts of Asia, higher living standards have increased demand
has increased the turbidity of coastal waters, which subse-
for cultured fish, which has encouraged aquaculture devel-


CHALLENGES TO INTERNATIONAL WATERS: REGIONAL ASSESSMENTS IN A GLOBAL PERSPECTIVE
80
HABITAT AND COMMUNITY MODIFICATION
81
TABLE 13. IMMEDIATE CAUSES OF HABITAT AND COMMUNITY MODIFICATION
Targeted issues
Modification and loss of ecosystems
Immediate causes
Main sectors involved
f
f
r
a
c
t
i
c
e
s
r
b
a
n
r
a
f
f
i
c
l
o
w
r
o
s
i
o
n
p
e
c
i
e
s
e
v
e
l
o
p
m
e
n
t
s
e p
GIWA region
o
d
i
f
i
c
a
t
i
o
n o
v
e
r
e
x
p
l
o
i
t
a
t
i
o
n
i
s
h
a
r
i
t
i
m
e t
i
n
i
n
g
M stream f
L
a
n
d u
C
o
a
s
t
a
l e
S
e
d
i
m
e
n
t
a
t
i
o
n
P
o
l
u
t
i
o
n
I
n
t
r
o
d
u
c
t
i
o
n o
i
n
v
a
s
i
v
e s
O of f Increased u development/expansion
A
g
r
i
c
u
l
t
u
r
e
D
o
m
e
s
t
i
c
F
o
r
e
s
t
r
y
F
i
s
h
e
r
i
e
s
M
C
o
a
s
t
a
l d
M
I
n
d
u
s
t
r
y
E
n
e
r
g
y
a Mississippi River (Gulf of Mexico)
a Small Islands (Caribbean Sea)
b Magdalena Basin (Caribbean Sea)
c Central America/Mexico (Caribbean Sea)
Barents Sea
Caspian Sea
Yel ow Sea
East China Sea
b Buenos Aires Coastal Ecosystem (Patagonian Shelf)
a Paranaiba River Basin (Northeast Brazil Shelf)
b Amazon
c Niger River Basin (Guinea Current)
South China Sea
Sulu-Celebes Sea
NOTE: THE TABLE PRESENTS A SELECTION OF GIWA REGIONS WHERE THE REGIONAL TEAM HAS CONDUCTED A CAUSAL CHAIN ANALYSIS ON THE GIWA CONCERN HABITAT
AND COMMUNITY MODIFICATION.
opment. Fish and seafood consumption has become more
ters. Consequently, farmers have little economic incentive to
fashionable among health-conscious consumers in developed
switch to modern and less damaging substitutes.
countries, further fuel ing aquaculture expansion. Aquacul-
ture has increased pol ution, introduced invasive species and
Policy failures
converted vast areas of wetland and mangrove forest.
In the Niger Basin (Guinea Current/42c) there is little un-
derstanding of the complex human-environment interac-
Market failures
tions, which provides an inadequate basis for sound policy-
Market prices are often not representative of the true value of making. In the Buenos Aires coastal ecosystem (Patagonian
goods and services provided by ecosystems. While the short-
Shelf/38b), statistics for fisheries and other ecosystem-based
term gains from blast fishing may be impressive, consumer
activities are lacking. Furthermore, the datasets of the Ar-
prices do not incorporate the cost of the long-term damage
gentinean provincial and national governments, as well as the
to coral reefs. If fish prices accounted for environmental and
Uruguayan jurisdictions, are incompatible. Scientific experts
social costs, the use of destructive practices would be discour-
in the Caspian Sea/23 region lack the financial and/or techni-
aged.
cal resources to conduct a thorough assessment of living re-
In the Caspian Sea/23 region, high unemployment rates sources. Governments and the fishing industry of the region
have led to increased smal -scale farming along the coast. e also pressurise scientists into adjusting scientific recommen-
new farms, which are located on infertile soils, are dependent dations. Political expediency may help the governments of
on environmental y harmful pesticides that are both readily
the Caspian Sea/23 region to reach agreements, but they are
available and cheap. e prices of pesticides do not account
not founded on sound information nor enforced, which has
for the negative externalities from the run-off of these pol-
resulted in a legacy of policy failures. Given the weak infor-
lutants into the Caspian river basins and adjacent coastal wa-
mation base and lack of coordination between executive and


CHALLENGES TO INTERNATIONAL WATERS: REGIONAL ASSESSMENTS IN A GLOBAL PERSPECTIVE
82
HABITAT AND COMMUNITY MODIFICATION
83
TABLE 14. POTENTIAL POLICY INSTRUMENTS RELATED TO HABITAT AND COMMUNITY MODIFICATION
Potential policy instruments
Contributing
sector
Underlying root causes
Short-term
Long-term
Modification and loss of ecosystems
Improved land use management
Lack of monitoring and enforcement
capacity
Promotion of appropriate technologies
Implement land use planning and management systems
Agriculture
Market-based fees and charges
Increase enforcement
Lack of public awareness
Education
Low-impact rain-fed agriculture
Weak long-term cross-sectoral planning
Capacity building
Encourage the production of appropriate crop varieties
Fragmented land use management
Stakeholder dialogue
Energy
Weak regulations
Improve regulations on dam construction Construct fish migration paths
production
Inadequate institutional capacity
Environmental y friendly farming
Stakeholder dialogue
Inadequate implementation of new
Promotion of appropriate technologies
Improved natural resource management
Industry
technology and infrastructure
Improved stakeholder participation
Pol ution taxes and fines
Lack of habitat protection
Strengthen local control
Integrated, multilateral conservation
Low enforcement capacity
Capacity building
Insufficient enforcement capacity
Improved regulation and enforcement
Improved management of protected areas
Fisheries
Lack of research for making sound policies
Expanded community education
Adoption of regulations at international level
Inadequate implementation of appropriate
programmes
fishing gear
Partnerships
Fol ow recommendations of scientific
organisations
Urbanisation
Urban
Inadequate knowledge of sewage treatment
Strengthen institutions
Improve legal framework
development Inadequate financial capacity to promote
compliance
Increase knowledge
Clear and transparent decision-making
Poverty
Lack of enforcement
Promotion of alternative energy
Coastal
Rapid population growth
technologies to replace wood fuels
Improved control of population growth
development Poverty
Improved the governance framework
Coastal management planning
Institutional weakness
Capacity building in policy formulation
scientific organisations, it is not surprising that Argentina
POLICY RELEVANT
and Uruguay (Patagonian Shelf/38) disagree on crucial as-
CONCLUSIONS
pects of administering shared coastal resources and postpone
difficult management decisions.
Even when information is available to make sustain-
Both freshwater and coastal marine ecosystems are con-
able policy decisions, organisations responsible for formulat-
fronted and continual y degraded by a wide range of pow-
ing policies may not include environmental considerations
erful stressors. In freshwater ecosystems, increasing human
or broad stakeholder involvement in the decision-making
populations will continue to demand additional freshwater
process. Political structures in some Southeast Asian coun-
for drinking, irrigation, hydropower and waste disposal. e
tries are still dominated by hierarchy and patronage, with
introduction of invasive species will also exert greater influ-
democratic decision-making yet to be common practice. is
ences on freshwater ecosystems in the future. e adoption of
governance model has resulted in bureaucratic inaction, the
integrated management and increased public awareness of the
misal ocation of financial resources and a mistrust of govern-
plight of freshwater ecosystems will only partial y reduce the
ment officials. Consequently, it is difficult to obtain local sup- rate of habitat degradation.
port for many governmental management policies and even
e pressures exerted by widespread poverty and popu-
for col ecting accurate statistics.
lation growth are also placing a burden on coastal and ma-


CHALLENGES TO INTERNATIONAL WATERS: REGIONAL ASSESSMENTS IN A GLOBAL PERSPECTIVE
82
HABITAT AND COMMUNITY MODIFICATION
83
rine ecosystems and the resources they provide. Overfishing,
like GIWA can improve the compatibility of different sectoral,
coastal development, sedimentation, pol ution and the expan-
national and regional policies.
sion of aquaculture are some of the factors that will continue
to degrade transboundary coastal ecosystems.
Policy integration
While appropriate legislation is in place in many coun-
e management of aquatic habitats and resources, as well as
tries, a lack of capacity to implement or enforce such legis-
addressing the multitude of causes behind the problems they
lation, particularly in many GEF-eligible regions, will al ow
face, has proven difficult. is has led to the development of
negative habitat and community modification to continue in
an ecosystem-based approach to the management of freshwa-
both types of aquatic system.
ter and marine transboundary waters. One ecosystem-based
GIWA regional teams selected specific policy options
approach that is becoming widely accepted is Integrated
that address habitat modification and promote an ecosystem-
Coastal Zone Management (ICZM). It is analogous to the
based approach (Table 14). eir suggested interventions are
integrated water resource management approach discussed
divided into four groups: (i) building a knowledge base; (i )
in the chapter on freshwater shortage. Many GIWA regional
integrating ecosystem issues into policies; (i i) supporting
teams throughout the tropics recommend pursuing, or are al-
marine protected areas; and (iv) strengthening institutional
ready implementing, ICZM.
capacity. Most successful interventions use multiple instru-
Actions to preserve habitats have traditional y segre-
ments to address different root causes and take into account
gated ecosystems from economic activities by establishing
regional environmental and socio-economic particularities.
protected areas, bans and zoning. However, some of the rich-
est aquatic habitats are located in areas where human activi-
Knowledge base and assessments
ties take place (e.g. fishing in coastal waters). Consequently,
Policy makers require information to evaluate the trade-offs
policy measures that aim for sustainability have become
between policies and to set priorities. Despite having made
essential elements of natural resources management strate-
major progress, we are yet to understand important aspects of gies. One particularly important aspect of policy integration
the interaction between habitats, their organisms and human
is to ensure sectoral government agencies, such as ministries
actions. Furthermore, economic valuation of the goods and
of forestry, energy and roads, incorporate environmental and
services provided by ecosystems is still struggling to gain ac-
social concerns in their decision-making. Most GIWA regional
ceptance as a regular policy tool in most parts of the world.
teams recommended a wider use of economic incentives, such
Given the complexity of transboundary issues, these assess-
as those included in Table 15. ey also stressed the impor-
ments require cooperation between scientists from a range of
tance of enforcing existing regulations.
disciplines. By evaluating impacts and trade-offs, assessments
TABLE 15. POTENTIAL ECONOMIC INCENTIVES TO ADDRESS TRANSBOUNDARY HABITAT AND COMMUNITY MODIFICATION
Instruments
Incentives
Disincentives
Examples of GIWA regions
b South Atlantic Drainage System
Ownership, management, access and use rights over biodiversity
Exclusion from land and biodiversity
(Patagonian Shelf)
Property rights
Joint, col aborative and co-management of biodiversity
Enforcement and penalties for
Barents Sea
Leases, concessions, licenses, permits and franchises for the
unsustainable or il egal biodiversity Yel ow Sea
management, use, harvesting and prospecting of biological resources
use
East China Sea
c Niger Basin (Guinea Current)
Improvement of existing biodiversity markets and prices, and
development of new biodiversity markets and charges, including
Ban on biodiversity impacting
Market and charge
tourist levies, entrance fees, user fees, prospecting fees and royalties
products or markets
b South Atlantic Drainage System
systems
(Patagonian Shelf)
Tradable quotas, permits, rights and licenses
Biodiversity impacting product
c Niger Basin (Guinea Current)
Develop alternative biodiversity markets and products
quotas or limits
Eco-label ing and accreditation of sustainable biodiversity products
Subsidies for biodiversity conserving activities, technologies and
Taxes or surcharges for products
Fiscal instruments
products
which impact biodiversity
Caspian Sea
Tax relief or differential taxes on land uses, technologies and products Differential land use, technology
Credits and offsets for biodiversity conserving activities
and product taxes
Sulu-Celebes Sea
Livelihood support
Improving efficiency, scope and sustainability of biodiversity
Rural development and livelihood
utilisation
diversification and improvement
South China Sea
c Niger Basin (Guinea Current)
(SOURCE: GIWA AND IUCN 2000)


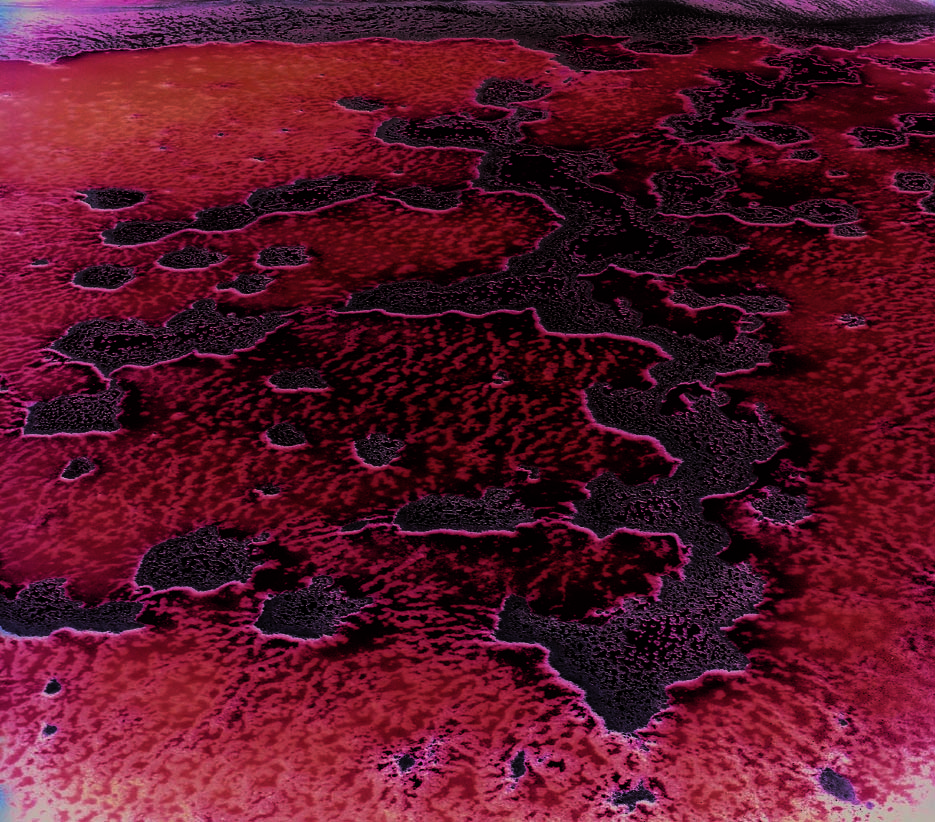
84
CORAL REEF, AUSTRALIA
HABITAT AND COMMUNITY MODIFICATION
85
(PHOTO: EYEQNET)
Marine Protected areas
Even when economic incentives are used to promote conser-
vation, some valuable but fragile habitats may be degraded
if economic activities are not restricted. Marine Protected
Areas (MPAs) can play a major role in conserving marine eco-
systems and maintaining their associated value for human
wel -being. MPAs can range from smal , highly protected
reserves prohibiting all resource extraction, to large reserves
zoned for multiple uses and sustainable development.
Unfortunately, many existing MPAs are only "paper
parks" that fail to meet their objectives. On the other hand,
there are highly successful MPAs, including: the Apo Island
Marine Sanctuary and the Danjugan Island Marine Reserve
in the Philippines; the Kiunga Marine Reserve in Kenya;
the Chumbe Island Marine Park in Tanzania; and the Great
Barrier Reef Marine Park in Australia.
Capacity strengthening
Designing and implementing sustainable use and conserva-
tion policies requires the integration of academic disciplines
and cooperation among specialists and policy-makers. In-
stitutions responsible for managing habitats frequently lack
essential skil s necessary for ecological and economic assess-
ments, management, financial reporting and control, moni-
toring and enforcement.
A lack of financial resources is a constraint for the
conservation of aquatic habitats in many regions. Effective
actions necessary for the management of protected areas and
the enforcement of exclusive economic zones can only be
implemented if financial resources are provided.
Social instruments, many based on stakeholder partici-
pation, were also frequently recommended by GIWA regional
teams. Participation goes beyond consultation; it should em-
power people to make the decisions and manage the resources
on which their livelihoods depend.


84
HABITAT AND COMMUNITY MODIFICATION
85

STAKEHOLDER DISCUSSION IN KIUNGA NATIONAL MARINE RESERVE:
JUNIOR WWF OFFICER IN DIALOUGE WITH SPOKESMAN OF FISHERS.
(PHOTO: G. HEMPEL)

Global y, the unsustainable use of freshwater and overfishing are
the two most severe concerns in transboundary waters worldwide.
Together with global climate change and pol ution, they modify
habitats and result in a loss of biodiversity. ese water-related
problems are amongst the most serious and immediate threats to
humanity.
Although freshwater
and marine issues differ
greatly, they have mostly Conclusions
the same root causes like
poverty and population growth. e pressure on aquatic resources is
increased further by poor governance, and market and policy failures.
More dams, deeper wel s and larger fishing fleets are not the answer;
instead, the world's limited aquatic resources need to be shared and
used wisely. Broad cooperation by a variety of stakeholders is an
essential component of ecosystem-oriented management.
GIWA has focused on the transboundary nature and causes of the major
aquatic concerns affecting Large Marine Ecosystems and international
river basins, and developed potential options to address these concerns.


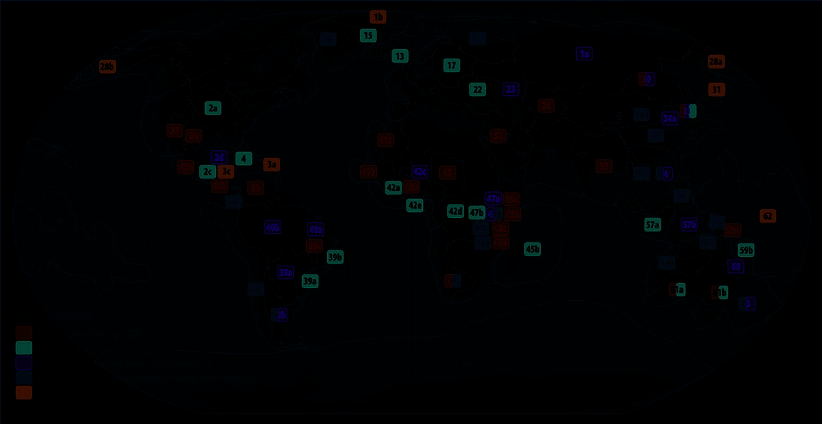
CHALLENGES TO INTERNATIONAL WATERS: REGIONAL ASSESSMENTS IN A GLOBAL PERSPECTIVE
88
CONCLUSIONS 89
A number of globally relevant conclusions can be drawn from
Challenges to international marine systems
the GIWA regional assessments. GIWA has confirmed that trans-
e GIWA regional teams assessed three basic types of fish-
boundary pressures from human activity have weakened the
eries. In the shelf and enclosed seas of polar and temperate
ability of aquatic ecosystems to perform essential functions.
zones, a limited variety of demersal and pelagic fish species are
e continued neglect of ecosystems and the inability to pro-
harvested, most with a lifespan of several years. ese stocks
tect water resources are compromising human well-being and
are extensively overfished, but could be restored by limit-
sustainable development. In general, the concerns are expected ing catches and fishing effort (preferably as a precautionary
to increase in severity over the forthcoming decades, particu-
measure). Climate driven regime shifts often conceal fish-
larly freshwater shortage, pollution, and habitat modification
ery-induced changes to stocks. e side-effects of the fisheries
in developing regions. Furthermore, global climate change will could be minimised by restricting destructive bottom trawl-
exacerbate the situation in many parts of the world.
ing and through the introduction of regulations and selective
Marine and freshwater systems are inextricably linked
technologies to reduce by-catch and discards. In many GIWA
within the global hydrosphere. e transboundary conse-
regions, international agreements and organisations have been
quences of human activities in freshwater systems are also felt
established to improve fisheries management. However, the
in the coastal and marine environment, including changes in
effectiveness of those measures is often hindered by weak en-
salinity and currents, sedimentation, eutrophication and toxic
forcement and a lack of political will in the face of lobbying by
pollution. Although human marine activities affect freshwa-
the fisheries industry.
ter systems less commonly, ocean processes impact coastal and
Upwelling regions, particularly the four large western
even inland environments, and human well-being in various
boundary systems (the Benguela/44, California/26, Canary/41
ways, e.g. by saline intrusion, storm surges and climate induced and Humboldt/64 currents), are amongst the most produc-
impacts.
tive fishing regions in the world. Local and international fish-
GIWA confirmed that overfishing has the most adverse
ing fleets catch mainly small, short-lived pelagic fish. Fishing
transboundary effects on marine ecosystems, while human-in-
management must adapt precautionary regulations in response
duced changes in water flow were considered to have the most to massive climate driven fluctuations in fish stocks in these
severe transboundary impacts on freshwater ecosystems.
regions, for example, during ENSO events. e pelagic fisheries
of upwelling regions have limited side-effects.
FIGURE 31. TOP PRIORITY CONCERNS BY GIWA REGION AND SUB-SYSTEM
NOTE: SEVERAL REGIONS AND SUB-SYSTEMS IDENTIFIED MORE THAN ONE TOP PRIORITY CONCERN.


CHALLENGES TO INTERNATIONAL WATERS: REGIONAL ASSESSMENTS IN A GLOBAL PERSPECTIVE
88
CONCLUSIONS 89
In tropical and subtropical LMEs, small-scale, mostly ar-
Land-use change, including forest colonisation, urbani-
tisanal fisheries exploit nearshore stocks, while industrialised
sation, draining of wetlands and irrigation of dry lands, modi-
fleets, often from overseas, operate offshore. ey harvest a
fies the drainage patterns and groundwater recharge rates of
great variety of fish and other living resources using a broad
international river basins. In many GIWA regions, changes in
range of fishing methods. In many GIWA regions these fisheries the hydrological regime, resulting from both water impound-
have severely depleted stocks which has led to `fishing down
ment and land-use change, have altered evaporation rates, the
the food web', where overfishing causes a trophic shift towards seasonal periodicity of flooding, erosion-accretion dynam-
small, short-lived organisms lower in the food chain.
ics and the water table. ese changes have adversely affected
Ecosystem-based management can be achieved in many
downstream habitats, particularly wetlands, and have subse-
GIWA regions through the adoption of a variety of manage-
quently reduced biodiversity and modified community struc-
ment instruments, including fleet reduction programmes,
tures.
subsidy reforms, improved definition of rights, gear control,
Extensive soil and groundwater salinisation resulting
and closed seasons and areas. ese measures, based on broad
from reduced freshwater availability, inappropriate irrigation
stakeholder involvement, aim to promote sustainability in the
practices and overabstraction of groundwater was reported in
fisheries and to protect marine ecosystems.
many GIWA regions. Toxic and microbial pollution are addi-
Coastal habitats are not only degraded by the fisheries.
tional threats to freshwater systems.
Hypoxic (oxygen-depleted) zones in the marine environment
On a global scale, freshwater shortage is the most severe
were previously restricted to enclosed seas but are now ob-
aquatic concern. On all continents, the inhabitants of des-
served in many coastal areas. Increased quantities of suspend-
ert and semi-arid zones have strayed from their traditional
ed sediment discharged by rivers or originating from coastal
path of sustainable water use and now overexploit their scarce
activities, such as construction and dredging, are degrading
surface and upper groundwater supplies. Inappropriate land-
marine habitats, particularly coral reefs. In addition, nearshore
use management, inefficient use of freshwater by irrigation,
habitats are modified by mariculture, oil and gas activities,
evaporation from reservoirs, and greater water demand fuelled
wind parks and coastal development, including the construc-
by the expansion of agriculture, as well as population and eco-
tion of ports and tourist facilities. Mass coral bleaching, caused nomic growth, have resulted in greater water scarcity and an
by water temperature increases, is considered the greatest
increase in the frequency and duration of droughts. e over-
threat to coral reefs on a global scale.
abstraction of fossil water from deep aquifers is increasingly
e creation of marine protected areas, zoning and bans
common.
can conserve sensitive habitats, such as coral reefs, mangroves
In the majority of arid and semi-arid regions, attempts
and seagrass beds. In areas where human interference is un-
to halt or reverse current degradation trends are constrained
avoidable, policy measures which promote the adoption of sus- by: poverty and slow economic development; deficiencies in
tainable practices were recommended by GIWA regional teams.
the technical, administrative and managerial capacity of insti-
Although the transboundary impacts on marine eco-
tutions responsible for water management; weak national and
systems could be mitigated and controlled by present man-
regional legal frameworks; and a lack of international coop-
agement instruments, political will and institutional capacity
eration. In most GIWA regions, there is a need to increase the
needs strengthening in most GIWA regions.
knowledge base regarding surface and ground water budgets
and for a change in water policy from building new dams and
Challenges to international freshwater systems
deepening wells to conserving water through demand and ef-
e modification of stream flow by water infrastructure was
ficiency management.
the most severe and widespread transboundary impact affect-
In the past, freshwater shortage has not been a concern
ing freshwater ecosystems. Dams fragment rivers and create a
in the humid zones of the higher latitudes and near the equa-
series of lakes and large reservoirs used for a variety of human
tor. Today, water is used unsustainably by large urban agglom-
uses, including drinking water, irrigation and the generation of erates and irrigated agriculture, resulting in water scarcity even
hydroelectricity. Stream flow is also altered by the canalisation
in areas with substantial rainfall.
of meandering rivers to improve navigation.


CHALLENGES TO INTERNATIONAL WATERS: REGIONAL ASSESSMENTS IN A GLOBAL PERSPECTIVE
90
CONCLUSIONS
91
GIWA mega-regional trends
many policy responses need to be initiated by the international
Considerable political and cultural differences exist between
community.
and within the GIWA mega-regions which affect the character-
Pollution and the exploitation of water and aquatic liv-
istics and relevance of the root causes for policy makers. e
ing resources are often sufficiently regulated. However, en-
international waters of Sub-Saharan Africa are among the
forcement and implementation can be weak due to a lack of
most degraded, particularly as a result of freshwater shortage.
awareness at all levels, weak institutions, inadequate technical
Incessant poverty and weak national legal frameworks and
and financial resources, negligence, bureaucracy and corrup-
institutional capacity cause unsustainable development and
tion. ere is insufficient environmental monitoring in both
constrain environmental management. In Southeast Asia, pol-
developing and developed regions. Cooperative efforts for
lution and habitat modification have the most severe impacts.
training and other forms of capacity building are needed on a
Increasing pressure on natural resources resulting from rapid
regional basis, as well as through North-South partnerships.
economic growth is insufficiently controlled by the reform of
e GIWA regional assessments, in accordance with other
relevant policies. In the former Soviet Union, water bodies
recent assessments, found that the complexity and diversity of
were considered inexhaustible and to be infinite receptors of
transboundary systems require the integration of management
waste; a perception that will take a long time to change. De-
across countries, sectors and ecosystems. Ecosystem-based
ficiencies in policy development and widespread corruption
management, including Integrated Coastal Zone Manage-
are impediments to habitat restoration, cleaner water and sus-
ment (ICZM) and Integrated Water Resource Management
tainable fisheries. In South and Central America, the overall
(IWRM), offers the best path for advancing sustainable devel-
environmental status of international waters seems of a higher
opment. An ecosystem-based approach was called for at the
quality than in other mega-regions. Nevertheless, pollution
World Summit on Sustainable Development (WSSD).
and habitat modification are relatively widespread but can be
In contrast to traditional approaches that ignore issues
addressed through long-term natural resource planning, stron-
which transcend limited sectoral interests, ecosystem-based
ger political will and the strengthening of institutions respon-
management offers a framework for changing the practices
sible for environmental management and enforcement.
of economic activities. e fishing industry, for example, has
largely disregarded environmental warnings, opting instead
Cross-cutting root causes and
for the blind hope that natural population recruitment will
management responses
maintain the viability of the fisheries. Ecosystem-based man-
Despite the above noted regional disparities, this global syn-
agement needs to be flexible and adaptive to the dynamic in-
thesis of the regional reports illustrates that the majority of
teractions of ecosystems and societies. e success of GEF LME
the GIWA concerns have the same root causes: global climate
projects has proven that an ecosystem-based approach can be
change, population growth, migration to coastal areas, urbani-
implemented in widely differing regions.
sation, industrialisation, increasing economic pressures on re-
sources, globalisation of trade and markets, and greater demand GIWA, lessons learnt
for water-intensive goods and services. ese cross-cut ing root Lessons can be learnt from the successes and weaknesses of
causes are intrinsic elements of human societies. ey cannot
GIWA. It has been the largest global assessment of a broad array
be resolved by simple policy interventions in the water sector
of ecosystem-wide water issues from a transboundary perspec-
alone but require concerted actions at all levels of national and
tive, holistically assessing international river basins and their
international governance. e failure of global policy measures
adjacent LMEs. GIWA has prioritised and provided informa-
aimed at reducing the rate of global climate change demon-
tion on transboundary aquatic concerns so that regional and
strates the difficulties in addressing these root causes.
international policy makers and managers can better manage
Further root causes, such as market failures, institutional international waters.
weaknesses, knowledge deficiencies, inappropriate subsidies
GIWA's bottom-up approach was the project's greatest
and other unsustainable policy instruments, can be resolved
strength. Regional teams conducted the assessment based on
by concerted action by all stakeholders in a given region. Even
existing regional data and information, and adapted the meth-
beyond regional boundaries. In the present era of globalisation, odology to the local conditions. In many GIWA regions, the


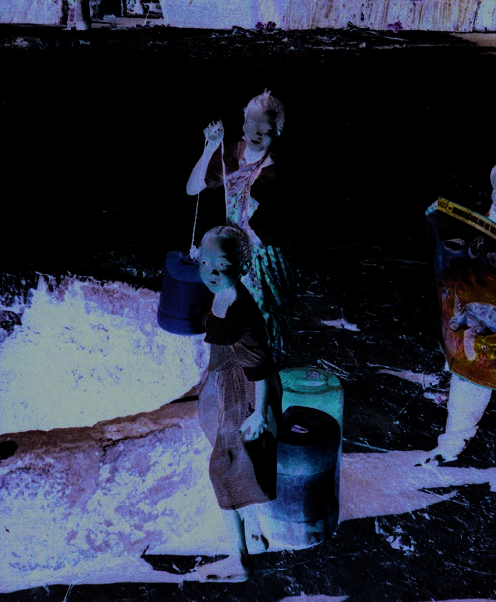
CHALLENGES TO INTERNATIONAL WATERS: REGIONAL ASSESSMENTS IN A GLOBAL PERSPECTIVE
90
CONCLUSIONS
91
assessment process has strengthened communication between
mation availability varied regionally and nationally, especially
social and natural scientists, as well as managers, provid-
between developed and developing regions, which affected the
ing the basis for long-term collaboration. It has also fostered
accuracy and comparability of the results.
transboundary cooperation and new partnerships within the
In future, the methodology should further incorporate
regions and between neighbouring regions. GIWA not only as-
the multitude of interactions between the various concerns
sessed the available policy critical information, but also identi-
and issues. Greater involvement of governments and vari-
fied key knowledge gaps. GIWA's bottom-up approach resulted
ous stakeholder groups would strengthen the causal chain and
in strong local ownership of the GIWA regional reports.
policy options analyses. It is essential to maintain close links
In many regional teams, however, social scientists and
with other assessment projects in order to avoid conflicting
policy specialists were underrepresented and stakeholder in-
approaches and duplication of efforts, particularly in regions
volvement was limited in several policy option analyses. Infor-
where scientific and technical expertise are limited.
(PHOTO: G. HEMPEL)

CHALLENGES TO INTERNATIONAL WATERS: REGIONAL ASSESSMENTS IN A GLOBAL PERSPECTIVE
92
References
A comprehensive list of references can be found in the GIWA regional reports and in AMBIO 33(1-2):1-113, 2004: Trans-
boundary issues in shared waters.
Arnel , N., Liu, C., Compagnucci, R., da Cunha, L., Hanaki, K, Howe,
Pauly, D. (2003). e future for fisheries. Science 302:1359-1361.
C., Mailu, G., Shiklomanov, I., Stakhiv, E., Dol , P., Becker, A.
and Zang, J. (2001). Hydrology and water resources. p 193-227
Pauly, D., Christensen, V., Dalsgaard, J., Froese, R. and Torres, F.
in:Climate Change 2001: Impacts, adaptation and vulnerability.
(1998). Fishing down the marine food webs. Science 279:860-863.
Cambridge University Press, Cambridge, UK.
Pearce, D. (2002). Environmental y harmful subsidies: Barriers to sus-
Burke, L., Selig, E. and Spalding, M. (2002). Reefs at risk in South-
tainable development. University Col ege London and Imperial
east Asia. World Resources Institute, Washington D.C., United
Col ege London, UK.
States.
Sherman, K. (2003). Physical, biological and human forcing of biomass
Costanza, R., d'Arge, R., de Groot, R., Farber, S., Grasso, M., Han-
yields in large marine ecosystems. International Council for the
non, B., Limburg, K., Naeem, S., O'Neil , R.V., Paruelo, J.,
the Exploration of the Sea, ICES CM 2003/P:12, Copenhagen,
Raskin, R.G., Sutton, P. and van den Belt, M. (1997). e value
Denmark.
of the world ecosystem services and natural capital. Nature 387:
Sherman, K. and Duda, A. (1999). An ecosystem approach to global
253-260.
assessment and management of coastal waters. Marine Ecology
de Fraiture, C., Cai, X., Amarasinghe, U., Rosegrant, M. and Molden,
Progress Series 190:271-287.
D. (2004). Does international cereal trade save water? e impact
UNEP (2002). Atlas of international freshwater agreements. United
of virtual water trade on global water use. Comprehensive As-
Nations Environment Programme, Division of Early Warning
sessment Research Report 4. International Water Management
and Assessment - North America. Retrieved May, 2005, from
Institute (IWMI), Comprehensive Assessment Secretariat, Co-
http:/ www.transboundarywaters.orst.edu/publications/atlas/
lombo, Sri Lanka.
UNDP (2004). World population prospects: e 2004 Revision. United
FAO (2002). Crops and drops: making the best use of water for agricul-
Nations Population Division (UNPD) Population Database. Re-
ture. Food and Agricultural Organization of the United Nations,
trieved May 2005 from: http:/ esa.un.org/unpp/
Rome Italy.
USBR (2002). Estimated flows of the Colorado River across the inter-
FAO (2003). FAO Yearbook, Fishery statistics, Commodities 2003, Vol.
national border. United States Bureau of reclamation, Lower
97. Food and Agriculture Organization of the Untied Nations,
Colorado regional office, Boulder City, United States.
Rome, Italy.
WMO (1997). Comprehensive assessment of the freshwater resources of
FAO (2004). e state of world fisheries and aquaculture (SOFIA).
the world. World Meteorological Organization, Geneva, Swit-
Food and Agriculture Organization of the United Nations,
zerland.
Rome, Italy.
World Bank (1997). World Development Report 1997: e state in a
FAO (2005). Review of the state of world marine fishery resources. FAO
changing world. Oxford University Press, New York, United
Fisheries Technical Paper 457. Food and Agriculture Organiza-
States.
tion of the United Nations, Rome, Italy.
World Bank (2003). World Development Report 2003: Sustainable
FAO FISHSTAT (2003). FAO Yearbook 2003, Fishery statistics,
development in a dynamic world transforming institutions,
Commodities 2002, Vol. 95. Retrieved August 2004 from: http:
growth, and quality of life. Oxford University Press, New York,
/ www.fao.org/fi/statist/fisoft/fishplus.asp
United States.
GWP (2000). Integrated Water Resources Management. GWP Tech-
WSSD (2002). Report of World Summit on Sustainable Development.
nical Committee Background Paper 4. Global Water Partner-
Johannesburg, South Africa, 26 August-4 September, 2002. Re-
ship, Stockholm, Sweden.
port A/CONF.199/20, United Nations, New York, United States.
IUCN (2000). Using economic incentives for biodiversity conservation.
WWC (2000). World Water Vision: Results of the gender mainstream-
Emerton, L. (ed).e World Conservation Union, Economics
ing project: e way forward. World Water Vision Unit World
and Biodiversity Programme, Gland, Switzerland.
Water Council, United Nations Educational Social and Cultural
Matishov, G.G. and Denisov, V.V. (2000). Ecosystems and biologi-
Organisation, Paris, France.
cal resources of Russian European Seas on the turn of the 21st
Zimmer, D. and Renault, D. (2004). Virtual water in food produc-
century. Murmansk Marine Biological Institute (MMBI), Mur-
tion and global trade: A review of methodological issues and
mansk, Russia.
preliminary results. Retrieved May, 2005, from: http:/ www.wo
Milazzo, M. (1998). Subsidies in world fisheries: A re-examination.
rldwatercouncil.org/fileadmin/wwc/Programs/Virtual_Water/
World Bank Technical paper No 406, Fisheries series. World
VirtualWater_article_DZDR.pdf
Bank, Washington D.C., United States.

ACRONYMS
93
Acronyms
ACOPS
Advisory Committee on Protection of the Sea
OECD
Organisation for Economic Cooperation and
ANA
Brazilian National Agency of Waters
Development
CAS
Chinese Academy of Sciences
PCB
Polychlorinated Bifenyls
CCA
Causal Chain Analysis
POA
Policy Options Analysis
DDT
Dichloro Diphenyl Trichloroethane
POP
Persistent Organic Pol utant
DEWA
Division of Early Warning and Assessment
SAP
Strategic Action Programme
EEZ
Exclusive Economic Zone
SCOPE
Scientific Committee on Problems of the
Environment
ENSO
El Nińo Southern Oscil ation
SEI
Stockholm Environment Institute
EU
European Union
Sida
Swedish International Development Cooperation
FAO
United Nations Food and Agriculture Organization
Agency
GEF
Global Environment Facility
SIDS
Small Island Developing States
GEMS
Global Environmental Monitoring System
STAP
Scientific Technical Advisory Panel
GESAMP
Joint Group of Experts on the Scientific Aspects of
TAC
Total Al owable Catch
Marine Environmental Protection
TDA
Transboundary Diagnostic Analysis
GIWA
Global International Waters Assessment
UN
United Nations
GLOBALLAST Global Bal ast Water Management Programme
UNCED
United Nations Conference on Environment and
GPA
Global Programme of Action
Development
GWP
Global Water Partnership
UNDP
United Nations Development Programme
HAB
Harmful Algal Bloom
UNECE
United Nations Economic Commission for Europe
IAH
International Association of Hydrogeologists
UNEP
United Nations Environment Programme
ICES
International Council for the Exploration of the Sea
UNESCO
United Nations Educational, Scientific and Cultural
ICZM
Integrated Coastal Zone Management
Organization
IEA
International Energy Agency
UNICEF
United Nations Children's Fund
IPCC
Intergovernmental Panel on Climate Change
UNIDO
United Nations Industrial Development
Organization
ISARM
International Shared Aquifer Resource Management
UNSCD
United Nations Commission on Sustainable
ISO
International Organization for Standardization
Development
ITQ
Individual y Transferable Quota
USBR
United States Bureau of Reclamation
IWRM
Integrated Water Resources Management
USGS
United States Geological Survey
LME
Large Marine Ecosystem
WCD
World Commission on Dams
MARPOL
International Convention for the Prevention of
WHO
World Health Organization
Marine Pol ution from Ships
WMO
World Maritime Organization
MDG
Mil ennium Development Goal
WSSD
World Summit on Sustainable Development
MPA
Marine Protected Area
WTO
World Trade Organization
MSC
Marine Stewardship Council
WWC
World Water Council
NASA
National Aeronautics and Space Administration
NGO
Non-Governmental Organisation
NOAA
National Oceanic and Atmospheric Administration


94 CHALLENGES TO INTERNATIONAL WATERS: REGIONAL ASSESSMENTS IN A GLOBAL PERSPECTIVE
ANNEXES
95
ANNEXES


94
ANNEXES
95
Annex I:
Global International Waters Assessment
Origin, objectives, workplan, teams and products
THE NEED FOR A GLOBAL
the overexploitation of virtual y every commercial fishery.
INTERNATIONAL WATERS
Furthermore, freshwater and marine habitats are directly
ASSESSMENT
modified by urban and infrastructure development. ere is
a growing public awareness and concern regarding the de-
clining quality and quantity of the world's aquatic resources,
Water is a vital life supporting resource, necessary for ag-
resulting in mounting pressure on governments and decision
riculture and other economic purposes, and for generat-
makers to initiate new and innovative approaches to manag-
ing hydropower. Marine and freshwater ecosystems provide
ing these resources in a sustainable manner to ensure their
valuable resources in terms of fish and other aquatic living
availability for future generations.
resources.
e management of the world's aquatic resources for
Global y, anthropogenic activities are degrading the
the mutual benefit of all societies and the environment is an
world's water bodies. Aquatic ecosystems and human wel -
extremely complex task. Without the construction of reser-
being are negatively impacted by dramatic changes in the
voirs, dams and canals, water is free to flow wherever the laws
flow regime of river basins, increasingly severe natural disas-
of nature dictate. Water is therefore a vector transporting
ters, such as floods and droughts, greater pol ution loads, and not only a wide variety of valuable resources but also prob-
lems from one area to another. e effluents emanating from
THE GLOBAL ENVIRONMENT FACILITY (GEF)
environmental y destructive activities in upstream drain-
The Global Environment Facility forges international cooperation
age areas are propagated downstream and can affect areas a
and finances actions to address six critical threats to the global
environment: biodiversity loss, climate change, degradation of
UNITED NATIONS ENVIRONMENT PROGRAMME (UNEP)
international waters, ozone depletion, land degradation, and per-
United Nations Environment Programme, established in 1972, is the
sistent organic pollutants (POPs). The overall strategic thrust of
voice for the environment within the United Nations system. The
GEF-funded international waters activities is to meet the incre-
mission of UNEP is to provide leadership and encourage partner-
mental costs of:
ship in caring for the environment by inspiring, informing, and en-
abling nations and peoples to improve their quality of life without
Assisting groups of countries to better understand the environ-
mental concerns of their international waters and work collab-
compromising that of future generations.
oratively to address them;
UNEP work encompasses:
Building the capacity of existing institutions to utilise a more
Assessing global, regional and national environmental condi-
comprehensive approach for addressing transboundary water-
tions and trends;
related environmental concerns;
Developing international and national environmental instru-
ments;
Implementing measures that address the priority transbound-
Strengthening institutions for the wise management of the envi-
ary environmental concerns.
ronment;
The goal is to assist countries in using the full range of technical,
Facilitating the transfer of knowledge and technology for sus-
economic, financial, regulatory, and institutional measures needed
tainable development;
to operationalise sustainable development strategies for interna-
Encouraging new partnerships and mind-sets within civil soci-
tional waters.
ety and the private sector.


CHALLENGES TO INTERNATIONAL WATERS: REGIONAL ASSESSMENTS IN A GLOBAL PERSPECTIVE
96
ANNEXES 97
plinary approaches that integrate environmental, socio-eco-
UNIVERSITY OF KALMAR
nomic and development aspects into management must be
The University of Kalmar hosts the GIWA Coordination Office and
adopted. Many assessments of aquatic resources are con-
provides scientific advice and administrative and technical assis-
ducted by local, national, regional and international bodies.
tance to GIWA. The University of Kalmar is situated on the coast
ey often concentrate on specific themes, such as biodi-
of the Baltic Sea. The city has a long tradition of higher education;
teachers and marine officers have been educated in Kalmar since
versity or persistent toxic substances, or focus on marine or
the middle of the 19th century. Today, natural science is a priority
freshwater systems separately. A global y coherent assessment
area that gives Kalmar a unique educational and research profile
that embraces the inextricable links between transboundary
compared with other small universities in Sweden. Of particu-
freshwater and marine systems, and between environmental
lar relevance for GIWA is an established research programme in
and societal issues, had never previously been undertaken but
aquatic and environmental science. Issues linked to the concept
was clearly needed.
of sustainable development are implemented by the university's
Natural Resources Management and Agenda 21 Research School.
Since its establishment GIWA has grown to become an integral
part of University activities. The GIWA Coordination Office and
INTERNATIONAL CALL
GIWA Core team are located at the Kalmarsund Laboratory, the
FOR ACTION
university centre for water-related research. Senior scientists ap-
pointed by the University are actively involved in the GIWA peer-
e need for a holistic assessment of transboundary waters
review and steering groups. As a result of this cooperation the Uni-
versity can offer courses and seminars related to GIWA objectives
was acknowledged by several international environmen-
and international water issues.
tal organisations. e Global Environment Facility (GEF)
recognised that its international waters component suffered
considerable distance away from the source. In the case of
due to the lack of a global assessment that could provide a
transboundary river basins, such as the Amazon, Nile and
clear understanding of the nature and root causes of interna-
Niger, the impacts are transported across national borders,
tional water problems, and that could indicate priorities for
thus affecting more than one riparian country. In the case of
project intervention. e urgent need for an assessment of the
large oceanic currents, the impacts can even be propagated
causes of environmental degradation was also highlighted at
between continents. e inextricable linkages
within, and between, freshwater and marine en-
INTERNATIONAL WATERS AND TRANSBOUNDARY ISSUES
vironments requires a drainage basin approach to
The term `international waters', as used
cies and actions inadequately cope with
managing aquatic resources.
for the purposes of the GEF Operational
these transboundary problems.
In addition, there is a growing appreciation
Strategy, includes the oceans, large
The `international waters area' includes
of the incongruence between the transbound-
marine ecosystems, enclosed or semi-
numerous international conventions, trea-
ary nature of many aquatic resources and the
enclosed seas and estuaries, as well as
ties, and agreements. The architecture of
traditional introspective, national y focused ap-
rivers, lakes, groundwater systems, and
marine agreements is especially complex,
proaches to managing these resources. Water, un-
wetlands with transboundary drainage
and a large number of bilateral and multi-
basins or common borders. The water-
like laws and management plans, does not respect
lateral agreements exist for transbound-
related ecosystems associated with these
national borders and, as a consequence, if future
ary freshwater basins. Related conven-
waters are considered integral parts of
management of water and aquatic resources is to
tions and agreements in other areas
the systems.
increase further the complexity. These
be successful, a shift in focus towards interna-
The term `transboundary issues' is used to
initiatives provide a new opportunity for
tional cooperation and intergovernmental agree-
describe the threats to the aquatic envi-
cooperating nations to integrate many
ments is required. Furthermore, the complexity of ronment linked to globalisation, interna-
different programmes and instruments
managing the world's water resources is exacer-
tional trade, demographic changes and
into comprehensive regional approaches
bated by the dependence of a great variety of do-
technological advancement, in addition
in order to address the challenges to in-
mestic and industrial activities on these resources. to those created through transboundary ternational waters.
As a consequence, cross-sectoral, multidisci-
movement of water. Single-country poli-


CHALLENGES TO INTERNATIONAL WATERS: REGIONAL ASSESSMENTS IN A GLOBAL PERSPECTIVE
96
ANNEXES 97
the UN General Assembly Special Session on the Environ-
UNEP WATER POLICY AND STRATEGY
ment in 1997, and demonstrated through commitments by the
UN Commission on Sustainable Development on freshwater
The primary goals of the UNEP water policy and strategy are:
in 1998, and seas in 1999. In 1997, two international declara-
Achieving greater global understanding of freshwater, coastal
tions, the `Potomac Declaration: Towards Enhanced Ocean
and marine environments by conducting environmental as-
Security into the ird Mil ennium,' and the `Stockholm
sessments in priority areas;
Statement on Interaction of Land activities, Freshwater and
Raising awareness of the importance and consequences of un-
Enclosed Seas,' also emphasised the need for an investigation
sustainable water use;
of the root causes of the degradation of the transboundary
Supporting the efforts of governments in the preparation and
aquatic environment and options for addressing them.
implementation of integrated management of freshwater sys-
ese interests final y led to the development of the
tems and their related coastal and marine environments;
Global International Waters Assessment (GIWA) and its in-
Providing support for the preparation of integrated manage-
auguration in 1999. e importance of GIWA was further
ment plans and programmes for aquatic environmental hot-
underscored by the United Nations Mil ennium Declaration
spots, based on the assessment results;
adopted by the UN General Assembly in 2000, and particu-
larly the Plan of Implementation of the World Summit on
Promoting the application by stakeholders of precautionary,
preventive and anticipatory approaches.
Sustainable Development (WSSD) in 2002. e Plan cal s for
inter alia: integrated river basin management and increased
understanding of the long-term sustainability of freshwater,
A broad transboundary approach that provides a truly re-
coastal and marine environments; integrated assessment at
gional perspective by incorporating expertise and existing
the global and regional levels for the conservation and man-
information from all nations in the region, and by assess-
agement of living and non-living marine resources; and the
ing the major factors that influence the aquatic resources
use of environmental impact assessments in decision making
of the region;
processes. e GIWA project was intended to provide infor-
A drainage basin approach integrating freshwater and
mation to support the implementation of such plans.
marine systems;
A multidisciplinary approach integrating environmental
and socio-economic information and expertise; and
CONCEPTUAL FRAMEWORK
A coherent assessment that provides global y comparable
results.
AND OBJECTIVES
GIWA builds on previous assessments implemented within
e primary objectives of GIWA are:
the GEF International Waters portfolio but has developed and
To provide a prioritising mechanism that al ows GEF to
adopted a broader definition of transboundary waters to in-
focus its resources so that they are used in the most cost-
clude factors that influence the quality and quantity of global
effective manner to achieve significant environmental
aquatic resources. GIWA recognises the importance of hydro-
benefits, at national, regional and global levels; and
logical units that would not normal y be considered trans-
To highlight areas in which governments can develop
boundary but exert a significant influence on transboundary
and implement strategic policies to reduce environmental
waters, such as the Yangtze River in China, which discharges
degradation and improve the management of aquatic re-
into the East China Sea, and the Volga River in Russia,
sources.
which is principal y responsible for changes to the Caspian
Sea. Furthermore, GIWA is a regional assessment that has
To meet these objectives and address some of the current in-
incorporated data from a wide range of sources and includes
adequacies of international aquatic resources management,
expert knowledge and information from a variety of sec-
GIWA has incorporated four essential elements into its design:
tors in each country of a region. e transboundary concept
adopted by GIWA includes impacts caused by globalisation,


CHALLENGES TO INTERNATIONAL WATERS: REGIONAL ASSESSMENTS IN A GLOBAL PERSPECTIVE
98
ANNEXES 99
international trade, demographic changes and technological
LARGE MARINE ECOCSYSTEMS
advances, and recognises the need for international coopera-
tion to successful y address these issues.
Large Marine Ecosystems (LMEs) are ocean regions encompass-
ing coastal areas from river basins and estuaries to the seaward
boundaries of continental shelves and the outer margin of the
major current systems. They are relatively large regions on the
SCALE AND METHODOLOGY OF
order of 200 000 km˛ or greater, characterised by distinct: (i) ba-
THE ASSESSMENT
thymetry; (ii) hydrography; (iii) productivity; and (iv) trophically
dependent populations.
The Large Marine Ecosystems strategy is a global effort for the as-
In order to be consistent with the transboundary nature of
sessment and management of international coastal waters. It was
many of the world's aquatic resources and the focus of GIWA,
developed in direct response to a declaration at the 1992 Rio Sum-
the geographical units being assessed have been designed ac-
mit. As part of the strategy, the World Conservation Union (IUCN)
cording to the drainage basins of discrete hydrographic sys-
and National Oceanic and Atmospheric Administration (NOAA)
tems rather than political borders. e geographic units were
have cooperated in an action programme to assist developing
determined during the preparatory phase of the project and
countries in planning and implementing an ecosystem-based
resulted in the division of the world into 66 regions defined
strategy that is focused on LMEs as the principal assessment and
by the entire area of one or more catchments that drain into a
management unit for coastal ocean resources. The LME concept
single designated marine system. ese marine systems often
has also been adopted by GEF, which recommends the use of LMEs
and their contributing freshwater basins as the geographic area for
correspond to Large Marine Ecosystems (LMEs). Some of the
integrating sectoral economic activities.
regions were later reconfigured and divided into sub-systems
which were assessed individual y by separate teams. Not all
GEF-eligible regions, i.e. developing regions and regions with
of the 66 regions were assessed by GIWA. Priority was given to transitional economies.
1a Russian Arctic (4 LMES)
8 Gulf of St Lawrence
17 Baltic Sea (LME)
26 California Current (LME) 38 Patagonian Shelf (LME)
45b Indian Ocean Islands
52 Arabian Sea (LME)
61 Great Australian Bight
1b Arctic Greenland (LME)
9 Newfoundland Shelf (LME) 18 North Sea (LME)
27 Gulf of California (LME)
39 Brazil Current (LME)
46 Somali Coastal
53 Bay of Bengal
62 Pacific Islands
1c Arctic European/Atlantic 10 Baffin Bay, Labrador Sea, 19 Celtic-Biscay Shelf (LME) 28 Bering Sea (LME)
40a Northeast Brazil
Current (LME)
54 South China Sea (2 LMES) 63 Tasman Sea
1d Arctic North American
Canadian Archipelago
20 Iberian Coastal Sea (LME) 30 Sea of Okhotsk (LME)
Shelf (2 LMES)
47 East African Rift
55 Mekong River
64 Humboldt Current (LME)
2 Gulf of Mexico (LME)
11 Barents Sea (LME)
21 North Africa and
31 Oyashio Current (LME)
40b Amazon
Val ey Lakes
56 Sulu-Celebes Sea (LME)
65 Eastern Equatorial
3 Caribbean Sea (LME)
12 Norwegian Sea (LME)
Nile River Basin (LME)
32 Kuroshio Current (LME)
41 Canary Current (LME)
49 Red Sea and
57 Indonesian Seas (LME)
Pacific (LME)
4 Caribbean Islands (LME)
13 Faroe plateau
22 Black Sea (LME)
33 Sea of Japan (LME)
42 Guinea Current (LME)
Gulf of Aden (LME)
58 North Australian
66 Antarctic (LME)
5 Southeast Shelf (LME)
14 Iceland Shelf (LME)
23 Caspian Sea
34 Yel ow Sea (LME)
43 Lake Chad
50 Euphrates and
Shelf (LME)
6 Northeast Shelf (LME)
15 East Greenland Shelf (LME) 24 Aral Sea
36 East China Sea (LME)
44 Benguela Current (LME)
Tigris River Basin
59 Coral Sea Basin
7 Scotian Shelf (LME)
16 West Greenland Shelf (LME) 25 Gulf of Alaska (LME)
37 Hawai an Archipelago (LME) 45a Agulhas Current (LME)
51 Jordan
60 Great Barrier Reef (LME)
FIGURE 1. THE TRANSBOUNDARY REGIONS ASSESSED BY THE GIWA PROJECT


CHALLENGES TO INTERNATIONAL WATERS: REGIONAL ASSESSMENTS IN A GLOBAL PERSPECTIVE
98
ANNEXES 99
In consideration of the objectives of GIWA and the ele-
Region 4. Caribbean Islands
ments incorporated into its design, a innovative methodology Region 11. Barents Sea
for the implementation of the assessment was developed dur-
Region 17. Baltic Sea
ing the initial phase of the project.
Region 23. Caspian Sea
A holistic, region-by-region assessment of the world's
Region 24. Aral Sea
transboundary aquatic resources had never been undertaken
Region 30. Sea of Okhotsk
before and therefore a new methodology was required. A
Region 31. Oyashio Current
multidisciplinary, multi-sectoral, multinational approach was Region 38. Patagonian Shelf
developed. e methodology is now available as a platform
Region 39. Brazil Current
for future international assessments of aquatic resources.
Region 40b. Amazon
e methodology focuses on five major environmen-
Region 43. Lake Chad
tal concerns; freshwater shortage, pol ution, overfishing and
Region 45b. Indian Ocean Islands
other threats to aquatic living resources, habitat and com-
Region 47. East African Rift Val ey Lakes
munity modification, and global change. e root causes,
Region 54. South China Sea
including global trends, policy, legislation, governance, insti-
Region 55. Mekong River
tutional capacity and knowledge, are also analysed. Wherever Region 62. Pacific Islands
possible, the causal chain analysis was fol owed by policy
Region 64. Humboldt Current
option analysis which outlined potential courses of action
Region 65. Eastern Equatorial Pacific
that aim to mitigate or resolve environmental and socio-
economic problems in the region.
Printed thematic reports
For a detailed description of the GIWA methodology,
Region 22. Black Sea. Transboundary waters in the Black Sea
see Annex II.
Danube region; legal and financial implications.
Region 22. Black Sea. Eutrophication in the Black Sea region
impact assessment and causal chain analysis.
GIWA REGIONAL ASSESSMENTS
Published on web
Region 1b. Arctic Greenland
The regional reports
Region 13. Faroe Plateau
e results of the GIWA assessment for each region are pre-
Region 15. East Greenland Shelf
sented in the regional reports. ese reports provide a brief
Region 16. West Greenland Shelf
physical and socio-economic description of the most impor-
Region 27. Gulf of California
tant features of the region. e remaining sections of the re-
Region 36. East China Sea
port present the results of each stage of the assessment. Each
Region 34. Yel ow Sea
regional report is reviewed by at least two external reviewers
Region 41. Canary Current
in order to ensure scientific validity and applicability.
Region 42. Guinea Current
e project has published 23 regional and thematic as-
Region 44. Benguela Current
sessments in printed form (or in preparation for print) and on
Region 56. Sulu-Celebes Sea
the web, and a further 12 are available online at www.giwa.net Region 57. Indonesian Seas
(see list below and the fold-out map inside of the front cover).
To obtain copies of the printed reports, please contact:
Regional reports printed or in preparation for print
Division of Early Warning and Assessment,
Region 1a. Russian Arctic
United Nations Environment Programme,
Region 3a. Caribbean Sea/Small Islands
PO Box 30552, Nairobi 00100, Kenya,
Region 3b/c. Caribbean Sea/Orinoco, Magdalena,
Tel: +254 20 762-4299, Fax: +254 20 762-4269,
Catatumbo/Central America, Mexico
Email: dewainfo@unep.org.


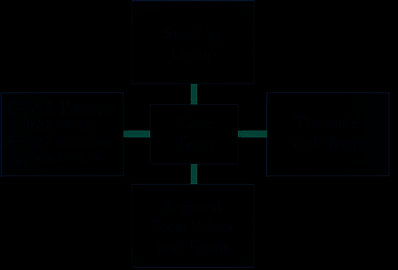
CHALLENGES TO INTERNATIONAL WATERS: REGIONAL ASSESSMENTS IN A GLOBAL PERSPECTIVE
100
ANNEXES 101
The global network
Barents Sea ................... Natalia Golubeva
In each of the GIWA regions, the assessment was conducted
East Greenland Shelf ... Mogens Dyhr-Nielsen
by a team of local experts led by a Focal Point (Figure 2). e West Greenland Shelf.. Mogens Dyhr-Nielsen
Focal Point can be an individual, institution or organisation
Baltic Sea ...................... Ain Lääne
that has been selected on the basis of their scientific reputa-
Black Sea....................... Felix Stolberg, Olena Borysova, Valery Michailov
tion and experience in implementing international assessment Caspian Sea................... Felix Stolberg, Olena Borysova, Rovshan Mahmudov
projects. e Focal Point is responsible for assembling mem-
Aral Sea ........................ Felix Stolberg, Olena Borysova, Igor Severskiy
bers of the team and ensuring that it has the necessary exper-
Gulf of California......... Edgar Arias Patron, Omar Vidal
tise and experience in a variety of environmental and socio-
Bering Sea..................... Suzanne Marcy
economic disciplines. e selection of the team members is
Sea of Okhotsk ............. Arkady V. Alekseev
one of the most critical elements for the success of GIWA. In
Oyashio Current........... Arkady V. Alekseev
order to ensure that the most relevant information is incorpo-
Kuroshio Current ......... Roger Juliano
rated into the assessment, team members were selected from
Sea of Japan................... Arkady V. Alekseev
a variety of institutions, such as universities, research insti-
Yel ow Sea..................... Teng Seng-Keh
tutes, government agencies and the private sector. e teams
East China Sea ............. Jing Zhang
included representatives from each country in the region.
Patagonian Shelf........... Ana Mugetti
Brazil Current............... Marcia Marques
Northeast Brazil Shelf.. Maria Irles de Oliveira Mayorga
Amazon ........................ Ronaldo Borges Barthem
Canary Current ............ Mhammed Tayaa
Guinea Current ............ Jean Folack, Julius Wel ens-Mensah
Lake Chad .................... Johnson A. Oguntola
Benguela Current ......... Kim Prochazka
Agulhas Current........... Chris Magadza
Indian Oceans Islands.. Rolph Antoine Payet
Somali Coastal Current Renison K. Ruwa
East African Rift
Val ey Lakes.................. Eric Odada
Red Sea &
Gulf of Aden................. Habib N. El-Habr, Najah T. Mistafa
FIGURE 2. THE ORGANISATION OF THE GIWA PROJECT
Euphrates and
Tigris River Basin ........ Habib N. El-Habr, Najah T. Mistafa
Jordan............................ Habib N. El-Habr
In total, almost 1 500 experts contributed to the GIWA
Bay of Bengal................ Jayampathy Samarakoon
project, building strong local ownership for the reports and
South China Sea........... Clive Wilkinson, Lyndon DeVantier, Russel Reichelt
creating a global network of experts and institutions that can
Mekong River............... Anond Snidvongs
facilitate the exchange of experiences and expertise.
Sulu-Celebes Sea.......... Clive Wilkinson, Lyndon DeVantier, Russel Reichelt
e regional assessments would have been impossible
Indonesian Seas ............ Clive Wilkinson, Lyndon DeVantier, Russel Reichelt
without the remarkable efforts of all regional task teams.
North Australian Shelf. Clive Wilkinson, Lyndon DeVantier, Russel Reichelt
UNEP appreciates the work and contributions of the teams to
Coral Sea Basin ............ Clive Wilkinson, Lyndon DeVantier, Russel Reichelt
GIWA, particularly the focal points:
Great Barrier Reef........ Clive Wilkinson, Lyndon DeVantier, Russel Reichelt
Great Australian Bight. Clive Wilkinson, Lyndon DeVantier, Russel Reichelt
Russian Arctic .............. Al a Tsyban
Pacific Islands............... Fabián Eguiguren Valdivieso
Arctic Greenland.......... Mogens Dyhr-Nielsen
Tasman Sea................... Clive Wilkinson, Lyndon DeVantier, Russel Reichelt
Gulf of Mexico ............. Alejandro Yáńez-Arancibia
Humboldt Current ....... Ulises Munayl a Alarcón
Caribbean Sea............... Francisco A. Arias-Isaza
Eastern Equatorial
Pacific............................ Ulises Munayl a Alarcón
Caribbean Islands......... Antonio Vil asol Nunez


CHALLENGES TO INTERNATIONAL WATERS: REGIONAL ASSESSMENTS IN A GLOBAL PERSPECTIVE
100
ANNEXES 101
MANAGEMENT OF GIWA
NOAA: Kenneth Sherman.
SCOPE: Gotthilf Hempel who also served as the GIWA Am-
e project was implemented by the United Nations Envi-
bassador.
ronment Programme (UNEP), in col aboration with the Uni-
SEI: Arno Rosemarin.
versity of Kalmar, Sweden, with financial support from GEF
Sida: Kent Blom, Mats Segnestam, Bengt Johansson, Mats
(68), the Swedish International Development Cooperation
Eriksson.
Agency (Sida) (18), the Ministry for Foreign Affairs of Fin-
University of Kalmar: Ĺke Hagström.
land (10), the Norwegian government, the Municipality of
UNDP: Andrew Hudson.
Kalmar, the University of Kalmar and UNEP. e funds were
e World Bank: Inesis Kiskis, Stephen F. Lintner.
mainly used to support assessments of GEF-eligible regions.
WWC: Vanessa Lemaire-Drinkwater.
Assessments of GEF non-eligible regions were conducted by
various international and national organisations as in-kind
During the development of GIWA, a number of experts made
contributions to GIWA.
significant contributions, especial y in the development of its
e GIWA project, managed by the UNEP/GIWA Core
unique methodology. UNEP would like to acknowledge the
team, was comprised of the fol owing staff:
fol owing:
Scientific Director: Dag Daler (2000-2005), Per Wramner
Olena Borysova, John Dixon, Wil iam Hogland, Nor-
(1999-2000).
man Lee, Olof Lindén, Marcia Marques, Laurence Mee,
Coordinator for the Northern Hemisphere: Elina Rautalahti-
Anond Snidvongs, Felix Stolberg, Galina Titova.
Miettinen (2000-2005).
Coordinator for the Southern Hemisphere: Juan Carlos Belau-
A special acknowledgement is extended to the University of
steguigoitia (2002-2005), Nick Mandevil e (1999-2000).
Kalmar, which served as the executing agency, for its out-
Coordinator for Sub-Saharan Africa: Edith Mussukuya (2001-
standing team of hardworking and devoted staff comprising
2004).
of the fol owing individuals:
Officers from the UNEP Headquarters who liaised with
the GIWA core team included Salif Diop, Ahmed Djoghlaf,
Scientific team for the regional reports:
Vladimir Mamaev, John Pernetta, Takehiro Nakamura,
Scientific Advisor: Erik Arrhenius (1999-2001), Olof Lin-
Pinya Sarasas, Dik Tromp, Isabel e Vanderbeck.
dén, who also served as Acting Coordinator for the Southern
e GIWA project was guided by a Steering Group con-
Hemisphere (2000-2001, 2005), Ul a Li Zweifel (2002-2003,
sisting of representatives from the fol owing agencies and
2005).
scientific bodies:
UNEP/DEWA as chair of the Steering Group: Dan
Supporting scientific team
Claasen, Timothy Foresman, Steve Lonergan.
Petre Badulescu (1999-2000), Ye Chun, (2001-2002), Sara
UNEP/DGEF: John Pernetta, Vladimir Mamaev.
Gräslund (2001), Bertil Hägerhäll also served as acting Co-
GEF Secretariat: Alfred M. Duda.
ordinator for the Northern Hemisphere (1999-2000), Linda
GEF/STAP: Angela Wagener, Alexei Maximov.
Holm (2001), Marcia Marques (2000-2004), Göran Rudbäck,
ACOPS: Jubomir Jeftic, Viktor Sebek.
Liaison Officer (1999-2001), Susanna Stymne Airey (2001),
ANA: Jerson Kelman.
Bo Wiman (1999-2000).
CAS: Jing Zhang.
Ministry for Foreign Affairs of Finland: Eero Kontula.
Editorial team for the regional reports:
GESAMP: Stjepan Keckes, Michael E. Huber.
Scientific Editor: Ul a Li Zweifel (2002-2004).
GWP: Kahlid Mohtadul ah, Emilio Gabriel i,
Supporting editors: Kristin Bertilius (2003-2005), Pierre
Erik Skoglund, Björn Guterstam.
Blime (2004), Johanna Egerup (2003-2005), Giovanna
Municipality of Kalmar: Anders Engström, Lars Malmborg. Fistarol Salomon (2004), Matthew Fortnam (2003-2005),
Ministry of the Environment, Norway: Per W. Schive,
Rasmus Göransson (2005), Niklas Holmgren (2003-2005),
Hanne-Grethe Nilsen.
Malin Karlsson (2002-2005), Marianne Lindström (2003-


CHALLENGES TO INTERNATIONAL WATERS: REGIONAL ASSESSMENTS IN A GLOBAL PERSPECTIVE
102
ANNEXES 103
2005), Eva Lövbrand (2002-2003), Najah Mistafa (2002-
Between 2002 and 2005, 10 interns from various parts of the
2005), Sanna Mels (2004-2005), Joakim Palmqvist (2001-
world participated in the GIWA project to learn and gain ex-
2005), George Roman (2004), David Souter (2001-2004),
perience in the field of international waters.
Monique Stolte (2003, 2005).
Special thanks are also given to: the UNEP Col aborating
Information & web team
Centre on Water and Environment for its in-kind contribu-
Ĺse Al berg (2001-2002), Peter Dietrich (2000-2001), Britt
tion to a number of regional assessments and for its staff, in
Hägerhäll (1999-2000), Elisabet Idermark (2002-2005).
particular Per Bögelund-Hansen, Mogens Dyhr-Nielsen and
Niels Ipsen; UNEP Grid Arendal, in particular Hugo Ahle-
Administration team
nius, Lars Kul erud, Philippe Rekacewicz and Svein Tveit-
Elisabeth Andersson (2003-2004), Maria Carlson (2002),
dahl; and to David Aubrey, Mike Bewer, Johan Holmberg,
Niklas Carlsson (2004), Lena Mĺnsson (2000-2005), Caisa
Jeff ornton.
Oskarsson (1999-2005).
University of Kalmar administration & scientific support:
Björn Lange (2002-2005), Ulf Lidman (2002-2005), Bengt
Sedvall (1999-2001).


CHALLENGES TO INTERNATIONAL WATERS: REGIONAL ASSESSMENTS IN A GLOBAL PERSPECTIVE
102
ANNEXES 103
Annex II:
GIWA methodology
e specific objective of GIWA was to conduct a holistic and
Considering the significant regional disparities in terms
global y comparable assessment of the world's transboundary
of the quality, quantity and availability of data, and socio-
aquatic resources. To achieve this, the assessment incorpo-
economic and environmental conditions, an innovative ap-
rated both environmental and socio-economic factors and
proach was required to achieve global comparability. e as-
recognised the inextricable links between freshwater and
sessment focuses on the impacts of five pre-defined concerns
marine environments. GIWA enables GEF to focus its resources in transboundary waters: freshwater shortage, pol ution,
and provide guidance to governments and decision-makers.
habitat and community modification, overfishing and other
e combination of all these elements into a single coherent
threats to aquatic living resources, and global change. ese
methodology had not previously been attempted and there-
encompass a diversity of issues which were grouped under the
fore posed a significant chal enge.
five concerns. In total, the impacts of 22 issues were evalu-
e GIWA methodology was achieved through an inter-
ated (see Table 1).
active process, guided by a Methods Task team comprised of
e assessment integrated environmental and socio-
experts with water, environmental assessment and socio-eco-
economic data from each country in the region to determine
nomic backgrounds. e preliminary versions of the meth-
the severity of the impacts of each of the five concerns and
odology underwent extensive external peer reviews and pre-
their constituent issues. e assessment was implemented
liminary testing in selected regions, the results of which were by conducting two participatory workshops that typical y
incorporated into the final GIWA methodology.
involved 10 to 15 environmental and socio-economic experts
from each country in the region. During these workshops,
TABLE 1. PRE-DEFINED GIWA CONCERNS AND THEIR
the regional teams performed preliminary analyses based on
CONSTITUENT ISSUES ADDRESSED WITHIN THE their col ective knowledge and experience. e results were
ASSESSMENT
substantiated with the best available information, which is
GIWA concerns
Environmental issues
presented in the regional reports.
Modification of stream flow
Freshwater shortage
Pol ution of existing supplies
e GIWA methodology can be divided into four logical
Changes in the water table
steps: i) Scaling defines the geographic extent of the region;
Microbiological
Eutrophication
i ) Scoping identifies and prioritises problems based on the
Chemical
Suspended solids
magnitude of their impacts on the environment and human
Pol ution
Solid wastes
societies in the region; ii ) Causal chain analysis (CCA) de-
Thermal
Radionuclide
termines the root causes of those problems; and iv) Policy
Spil s
options analysis (POA) assesses various policy options that
Overexploitation
Overfishing and other Excessive by-catch and discards
address those root causes in order to reverse negative trends
threats to aquatic
Destructive fishing practices
living resources
Decreased viability of stock through pol ution and disease
in the condition of the aquatic environment. ese four steps
Impact on biological and genetic diversity
are summarised below and are ful y described in two docu-
Habitat and
community
Loss of ecosystems
ments: `GIWA Methodology Stage 1: Scaling and Scoping' and
modification
Modification of ecosystems
`GIWA Methodology: Detailed Assessment, Causal Chain
Changes in hydrological cycle
Sea level change
Analysis and Policy Options Analysis' (Figure 1).
Global change
Increased UV-B radiation as a result of ozone depletion
Changes in ocean CO2 source/sink function


CHALLENGES TO INTERNATIONAL WATERS: REGIONAL ASSESSMENTS IN A GLOBAL PERSPECTIVE
104
ANNEXES 105
e Gulf of Aden/48 and Red Sea/49 were merged into
the Red Sea and Gulf of Aden/49.
Some regional teams decided to undertake separate assess-
ments for transboundary water systems identified within their
region. Often this included assessing the LME separately from
the transboundary river basin. e Guinea Current/42 regional
team, for example, assessed five sub-systems: Comoe Basin/
42a; Volta Basin/42b; Niger Basin/42c; Congo Basin/42d; and
Guinea Current LME/42e. Altogether, assessments were under-
taken in 74 regions and sub-systems.
When analysing the results of the GIWA assessments in
FIGURE 1. THE GIWA ASSESSMENT APPROACH
this global synthesis, the regions were grouped into the fol-
lowing mega-regions: Arctic Rim; Europe & Central Asia;
North America; Central America; South America; Sub-Sa-
Scaling Defining the geographic extent of the region haran Africa; North Africa & the Middle East; Northeast
Scaling defines the geographic scale of the assessment. e
Asia; Southeast Asia; Australia & Pacific Islands; and the
world was divided into 66 contiguous regions that are gen-
Antarctic.
eral y defined by a large but discrete drainage basin and its
adjacent coastal waters, rather than political boundaries. In
Scoping Assessing the GIWA concerns
many cases, the boundaries of the marine areas coincided
Scoping assessed the severity of environmental and socio-
with those of Large Marine Ecosystems (LMEs) as defined by
economic impacts caused by each of the five pre-defined
the US National Oceanic and Atmospheric and Administra-
GIWA concerns and their constituent issues. It is not designed
tion (NOAA). During scaling, the regional teams inspected
to provide an exhaustive review of water-related problems
the boundaries proposed for the region during the prepara-
that exist within each region, but instead identified the most
tory phase of GIWA. If necessary, they revised the boundar-
urgent transboundary problems in the region and prioritised
ies to remove important overlaps or gaps with neighbouring
the most important issues for remedial actions. e priorities
regions. e regional teams identified all the transboundary
determined by Scoping are one of the main outputs of the
elements of the region's aquatic environment and determined
GIWA project.
whether they could be assessed as a single coherent aquatic
Focusing on pre-defined concerns and issues ensures
system or if there were two or more independent systems that comparability between the assessment results of the different
should be assessed separately. Other regional teams decided
regions. e magnitude of the environmental and socio-eco-
to merge their region with an adjacent region. e fol owing
nomic impacts caused by each issue was assessed for the en-
changes were made:
tire region using the best available information obtained from
e Arctic/1 was divided into the Russian Arctic/1a, Arc-
a wide range of sources and the knowledge and experience
tic Greenland/1b, Arctic European/Atlantic/1c and Arctic of the regional experts. In order to increase the global com-
North America/1d.
parability of the results, to remove bias caused by different
e Amazon/40 was divided into the Northeast Brazil
perceptions of the severity of the impacts, and to encourage
Shelf/40a and Amazon/40b.
consensus amongst the team, the issues were evaluated using
e Agulhas Current/45 was divided into Agulhas
a standardised scoring system involving a four-point scale:
Current/45a and Indian Ocean Islands/45b.
0 = no impact reported
e East Bering Sea/28 and West Bering Sea/29 were
1 = slight impact
merged into the Bering Sea/28.
2 = moderate impact
e Yel ow Sea/34 and Bohai Sea/35 became the Yel ow
3 = severe impact
Sea (Yel ow Sea/34a) and Yel ow Sea (Bohai Sea/34b).


CHALLENGES TO INTERNATIONAL WATERS: REGIONAL ASSESSMENTS IN A GLOBAL PERSPECTIVE
104
ANNEXES 105
Each issue was scored according to a detailed set of
TABLE 2. EXAMPLE OF ENVIRONMENTAL IMPACT
pre-defined criteria that are used to guide experts in the as-
ASSESSMENT OF FRESHWATER SHORTAGE
sessment. For example, the criteria for assigning a score of
Weight
Environmental issues
Score Weight Environmental
averaged
3 to the issue `loss of ecosystems or ecotones' is: permanent
concerns
score
destruction of at least one habitat, reducing its surface area
. Modification of stream flow
Freshwater shortage
.
by >30 over the last 2-3 decades. e full list of criteria for
. Pol ution of existing supplies
environmental and socio-economic impacts is presented in
Tables 7-16 at the end of this Annex.
. Changes in the water table
A trade-off associated with assessing the impacts of
TABLE 3. EXAMPLE OF ECONOMIC IMPACT ASSESSMENT
each concern and their constituent issues for an entire region
OF FRESHWATER SHORTAGE
is that spatial resolution was sometimes low. Although the
Criteria for Economic
assessment provides a score indicating the severity of impacts
impacts
Raw score
Score Weight
of a particular issue or concern for an entire region, it does
Size of economic or public Very smal
Very large
sectors affected
not mean that the entire region suffers from the impacts of
Degree of impact (cost,
Minimum
Severe
that problem. For example, eutrophication could be identi-
output changes etc.)
fied as a severe problem in a region, but this does not imply
Frequency/Duration
Occasional/Short
Continuous
that all waters in the region suffer from severe eutrophica-
Weight average score for Economic impacts
tion. It simply means that the degree of eutrophication, the
TABLE 4. EXAMPLE OF HEALTH IMPACT ASSESSMENT OF
FRESHWATER SHORTAGE
size of the area affected, the socio-economic impacts and the
number of people affected are of sufficient overall severity to
Criteria for Health impacts Raw score
Score Weight
meet the criteria defining a severe problem and that regional
Number of people affected Very smal
Very large
actions should be initiated in order to mitigate the impacts of
this problem.
Degree of severity
Minimum
Severe
Once each issue has been scored, it is weighted ac-
Frequency/Duration
Occasional/Short
Continuous
cording to the relative contribution it makes to the overall
Weight average score for Health impacts
environmental impacts of the concern and a weighted average TABLE 5. EXAMPLE OF OTHER SOCIAL AND COMMUNITY
score for each of the five concerns is calculated (Table 2).
IMPACT ASSESSMENT OF FRESHWATER SHORTAGE
e socio-economic impacts are assessed for each con-
Criteria for Other social
cern, not each issue. e socio-economic impacts are grouped
and community impacts
Raw score
Score Weight
Number and/or size of
Very smal
Very large
into three categories; economic impacts, health impacts and
community affected
other social and community impacts (Table 3-5). For each
Degree of severity
Minimum
Severe
category, the size, degree and frequency of the impact is
Frequency/Duration
Occasional/Short
Continuous
evaluated and a weighted average score is calculated for the
Weight average score for Other social and community impacts
overall socio-economic impacts of each concern.
In addition, to ensure the long-term applicability of the
options that were developed to mitigate these aquatic con-
economic impacts of each concern. e prioritised concern
cerns, Scoping not only assessed the current impacts of these
is then analysed further in the CCA and POA. In the example
concerns and issues but also predicted the future impacts ac-
presented in Table 6, the scoping assessment indicated that
cording to the "most likely scenario", which considers demo-
habitat and community modification was the priority concern
graphic, economic, technological and other relevant changes
in this region. e top priority concern(s) identified by the
that will potential y influence the aquatic environment in the
numerical outcome should correspond with the knowledge of
region by 2020.
the experts in the team and should be substantiated with sup-
In order to identify which concern is the top priority
porting information.
for the region, a final overall score is calculated based on the
However, in cases where the numerical results did
present and future scores of the environmental and socio-
not yield consensus among the regional experts in terms of


CHALLENGES TO INTERNATIONAL WATERS: REGIONAL ASSESSMENTS IN A GLOBAL PERSPECTIVE
106
ANNEXES 107
TABLE 6. EXAMPLE OF THE COMPARATIVE ENVIRONMENTAL AND SOCIO-ECONOMIC IMPACTS OF EACH MAJOR CONCERN,
AT PRESENT AND BY 2020
Type of impact
Environmental score
Economic score
Human health score
Social and community score
Concern
Overall score
Present (a)
Future (b)
Present (c)
Future (d)
Present (e)
Future (f)
Present (g)
Future (h)
Freshwater shortage
.
.
.
.
.
.
.
.
.
Pol ution
.
.
.
.
.
.
.
.
.
Overfishing and other threats to
aquatic living resources
.
.
.
.
.
.
.
.
.
Habitat and community
modification
.
.
.
.
.
.
.
.
.
Global change
.
.
.
.
.
.
.
.
.
the ranking of priorities, the team continued by assigning
is conducted by identifying the human activities that cause
weights to the relative importance of present and poten-
the problem and then the factors that determine the ways
tial future impacts. Similarly, the team assigned weights
in which these activities are undertaken. However, because
indicating the relative contribution of environmental and
there is no universal theory describing how root causes in-
socio-economic factors. e team should then recalculate the teract to create natural resource management problems and
weighted average score for each concern taking into account
due to the varying local circumstances, the GIWA CCA is not
both present and future impacts and environmental and
a rigidly structured analysis but rather a guiding framework.
socio-economic factors. e outcomes of these additional
Ideal y, the CCA would be conducted by a multidisciplinary
analyses are then subjected to further discussion to identify
group of specialists that would statistical y examine each suc-
the overall priorities of the region.
cessive cause and study its links to the problem and to other
e assessment recognises that the five GIWA concerns
causes. However, this approach (even if feasible) would use
interact with each other. For example, pol ution can destroy
far more resources and time than those available to GIWA.
aquatic habitats that are essential for fish reproduction, which It was therefore necessary to develop a relatively simple and
in turn can cause a decline in fish stocks and subsequent
practical analytical CCA model.
overexploitation. Once the priority concern for the region is
agreed, the team should highlight the links between the con-
Conceptual model
cerns in order to identify where strategic interventions could
A causal chain is a series of statements that link the causes of
be applied to yield the greatest benefits for the environment
a problem with its effects. Recognising the great diversity of
and human societies in the region.
local settings and the difficulties in developing broadly ap-
plicable policy strategies, the GIWA CCA focuses on a particu-
Causal chain analysis
lar system and the issues that have been prioritised during the
e causal chain analysis (CCA) traces the cause-effect path-
scoping assessment. e prioritised issue and its related envi-
ways of the prioritised transboundary issues; from the socio-
ronmental and socio-economic impacts are the starting point
economic and environmental impacts back to their root
for the CCA. e next element in the chain is the immediate
causes. e CCA aims to identify the most important driv-
cause, defined as the physical, biological or chemical variable
ers of the aquatic concerns, so that they can be targeted by
that produces the GIWA issue. For example, for the issue of
policy measures in order to prevent further degradation of the eutrophication, the immediate causes may include:
region's aquatic environment.
Increased nutrient inputs and concentrations
Root causes are not always easily identifiable because
Trapping of nutrients in stagnant water
they are often separated, spatial y or temporal y, from the
River and stream alterations
actual problems they cause. e GIWA CCA was developed to
Run-off and storm water
help identify and understand the root causes of environmen-
e sectors of human activity that contribute most signifi-
tal and socio-economic problems in international waters and
cantly to the immediate cause are then determined. Assum-


CHALLENGES TO INTERNATIONAL WATERS: REGIONAL ASSESSMENTS IN A GLOBAL PERSPECTIVE
106
ANNEXES 107
ing that the most important immediate cause in the example
methodology, which was developed to test the performance
is increased nutrient concentrations, the most likely source
of various options under various circumstances, was kept sim-
of those nutrients would be from the agricultural, urban or
ple and broadly applicable.
industrial sectors. After identifying the sectors that are pri-
marily responsible for the immediate causes, the root causes
acting on these sectors are established. For example, if agri-
culture is found to be primarily responsible for the increased
GIWA ASSESSMENT CRITERIA
nutrient concentrations, the root causes may be:
FOR SOCIOECONOMIC IMPACTS
Economic (e.g. subsidies for fertilizers and agricultural
products)
Socio-economic impact categories:
Legal (e.g. inadequate regulation)
Economic impacts: e key economic and public service
Failures in governance (e.g. poor enforcement)
sectors that are affected by the degradation of the aquatic
Technology or knowledge-related (e.g. lack of affordable
environment should be identified and their relative im-
substitutes for fertilizers, or lack of knowledge regarding
portance to the regional economy assessed. e degree to
their application)
which the quantity and quality of their output has been
reduced and their costs of operation increased should be
Policy options
similarly assessed. Final y, the frequency and duration of
Despite considerable efforts by many governments and other
the impacts should be determined.
organisations to address transboundary water problems,
Human health impacts: e approximate number and
there is still much to be done. An important characteristic of
types of people affected should be identified, the nature
GIWA'S policy option analysis is that its recommendations are
and degree of severity of the health impacts should be
firmly based on a better understanding of the root causes of
assessed and the frequency and duration of the impacts
the problems. Freshwater scarcity, water pol ution, overfish-
should be determined.
ing, and habitat modification are complex phenomena. e
Other social and community impacts: e number, size
policy options analysis (POA) consists of two tasks:
and principal characteristics (e.g. presence of vulnerable
groups) of the affected communities should be deter-
Construct policy options
mined, as well as the aspects of community life affected.
Policy options are different courses of action that aim to solve
e extent to which community life is affected and the
or mitigate environmental and socio-economic problems
frequency of these impacts should also be assessed.
in the region. Although a variety of policy options could
be constructed to address each root cause identified in the
ree broad criteria are considered when scoring the degree
CCA, only those with the greatest likelihood of success were
of severity (0-3) of the impacts:
analysed by GIWA.
Size of the population or economic and public sectors af-
fected (categorised as: very smal ; smal ; medium; and
Select and apply the criteria against which the policy options will
large).
be evaluated
Degree of severity of the socio-economic impacts experi-
Although there are many criteria that could be used to evalu-
enced (minimum; smal ; moderate; severe).
ate any policy option, GIWA focuses on:
Likely duration of the impacts (ranging from very
Effectiveness (certainty of result);
occasional/very short-term to continuous/long-term).
Efficiency (maximisation of net benefits);
Equity (fairness of distributional impacts);
Practical criteria (political acceptability, implementation
feasibility).
e policy options recommended by GIWA are envisioned as
contributions to a larger policy process. As such, the GIWA


CHALLENGES TO INTERNATIONAL WATERS: REGIONAL ASSESSMENTS IN A GLOBAL PERSPECTIVE
108
ANNEXES 109
TABLE 7. SCORING CRITERIA FOR THE ENVIRONMENTAL IMPACTS OF FRESHWATER SHORTAGE
Issue
Score = no known
impact
Score = slight impact
Score = moderate impact
Score = severe impact
Issue : Modification No evidence of
There is a measurably changing trend in Significant downward or upward trend
Annual discharge of a river altered by
of stream flow
modification of
annual river discharge at gauging
(more than of the long-term mean) in more than of the long-term mean;
"An increase or
stream flow.
stations in a major river or tributary
annual discharges in a major river or
or
decrease in the
(basin > km); or
tributary draining a basin of >
Loss of > of riparian or deltaic
discharge of streams
There is a measurable decrease in the
km; or
wetlands over a period of not less than
and rivers as a result of
area of wetlands (other than as a
Loss of > of flood plain or deltaic
years (through causes other than
human interventions
consequence of conversion or
wetlands through causes other than
conversion or artificial embankment);
on a local/regional
embankment construction); or
conversion or artificial embankments; or or
scale (see Issue for
There is a measurable change in the
Significant loss of riparian vegetation
Significant increased siltation or erosion
flow alterations
interannual mean salinity of estuaries or (e.g. trees, flood plain vegetation); or
due to changes in flow regime (other
resulting from global
coastal lagoons and/or change in the
Significant saline intrusion into
than normal fluctuations in flood plain
change) over the last
mean position of an estuarine salt
previously freshwater rivers or lagoons.
rivers); or
- decades."
wedge or mixing zone; or
Loss of one or more anadromous or
Change in the occurrence of exceptional
catadromous fish species for reasons
discharges (e.g. due to upstream
other than physical barriers to
damming.
migration, pol ution or overfishing.
Issue : Pol ution of
No evidence of
Any monitored water in the region does Water supplies do not meet WHO or
Rivers draining more than of the
existing supplies
pol ution of
not meet WHO or national drinking
national drinking water standards in
basin have suffered polysaprobic
"Pol ution of surface
surface and
water criteria, other than for natural
more than of the region; or
conditions, no longer support fish, or
and ground fresh water groundwaters.
reasons; or
There are one or more reports of fish
have suffered severe oxygen depletion
supplies as a result of
There have been reports of one or more
kil s due to pol ution in any river
Severe pol ution of other sources of
point or diffuse
fish kil s in the system due to pol ution
draining a basin of > km .
freshwater (e.g. groundwater)
sources"
within the past five years.
Issue : Changes in
No evidence that
Several wel s have been deepened
Clear evidence of declining base flow in Aquifers are suffering salinisation over
the water table
abstraction of
because of excessive aquifer draw-down; rivers in semi-arid areas; or
regional scale; or
"Changes in aquifers
water from
or
Loss of plant species in the past decade Perennial springs have dried up over
as a direct or indirect
aquifers exceeds
Several springs have dried up; or
that depend on the presence of
regional y significant areas; or
consequence of human natural
Several wel s show some salinisation.
groundwater; or
Some aquifers have become exhausted
activity"
replenishment.
Wel s have been deepened over areas of
hundreds of km;or
Salinisation over significant areas of the
region.
TABLE 8. SCORING CRITERIA FOR SOCIO-ECONOMIC IMPACTS OF FRESHWATER SHORTAGE
Loss of agricultural uses (crops, livestock, aquaculture)
Reduced availability of fish as food
Increased damage to water-related equipment
Loss of human drinking water supplies
Loss of waste assimilative capacity
Damage to infrastructure
Loss of recreational use or aesthetic values
Increased costs of alternative water supplies
Increased costs of deepening wel s and pumping
Loss of hydroelectric power production
Reduction in future use options
Population migration
Loss of coastal harbours and inland transport
Human health impacts
Transboundary implications
Loss of industrial uses
Reduced agriculture productivity (crops, livestock,
Increased vulnerability to sea level rise
aquaculture)
Increased potential for upstream/downstream conflicts
Increased intake treatment costs
TABLE 9. SCORING CRITERIA FOR ENVIRONMENTAL IMPACTS OF POLLUTION
Issue
Score = no known impact
Score = slight impact
Score = moderate impact
Score = severe impact
Issue : Microbiological Normal incidence of bacterial
There is a minor increase in
Public health authorities aware of
There are large closure areas or very
pol ution
related gastroenteric disorders in
incidence of bacterial related
marked increase in the incidence of restrictive advisories affecting the
"The adverse effects of
fisheries products for consumers
gastroenteric disorders in
bacterial related gastroenteric
marketability of fisheries products;
microbial constituents
and no fisheries closures or
fisheries products for
disorders in fisheries products for
or
of human sewage
advisories.
consumers but no fisheries
consumers; or
There exists widespread public or
released to water
closures or advisories.
There are limited area closures or
tourist awareness of hazards
bodies."
advisories reducing the exploitation resulting in major reductions in the
or marketability of fisheries
exploitation or marketability of
products.
fisheries products.
Issue : Eutrophication No visible effects on the
Increased abundance of
Increased filamentous algal
High frequency (> event per year),
"Artificial y enhanced
abundance and distributions of
epiphytic algae; or
production resulting in algal mats;
or intensity, or large areas of
primary productivity in
natural living resource
A statistical y significant trend
or
periodic hypoxic conditions, or high
receiving water basins
distributions in the area; and
in decreased water
Medium frequency (up to once per
frequencies of fish and zoobenthos
related to the increased No increased frequency of hypoxia
transparency associated with
year) of large-scale hypoxia and/or
mortality events or harmful algal
availability or supply of
or fish mortality events or harmful algal production as compared
fish and zoobenthos mortality
blooms; or
nutrients, including
algal blooms associated with
with long-term (> year) data
events and/or harmful algal
Significant changes in the littoral
cultural eutrophication
enhanced primary production; and
sets; or
blooms.
community; or
in lakes."
No evidence of periodical y
Measurable shal owing of the
Presence of hydrogen sulphide in
reduced dissolved oxygen or fish
depth range of macrophytes.
historical y well oxygenated areas.
and zoobenthos mortality; and
No evident abnormality in the
frequency of algal blooms.


CHALLENGES TO INTERNATIONAL WATERS: REGIONAL ASSESSMENTS IN A GLOBAL PERSPECTIVE
108
ANNEXES 109
Issue : Chemical
No known or historical levels of
Some chemical contaminants
Some chemical contaminants are
Chemical contaminants are above
pol ution
chemical contaminants except
are detectable but below
above threshold limits defined for
threshold limits defined for the
"The adverse effects of
background levels of natural y
threshold limits defined for the the country or region; or
country or region; and
chemical contaminants
occurring substances; and
country or region; or
Large area advisories by public
Public health and public awareness
released to standing or No fisheries closures or advisories Restricted area advisories
health authorities concerning
of fisheries contamination problems
marine water bodies as a due to chemical pol ution; and
regarding chemical contamina-
fisheries product contamination
with associated reductions in the
result of human
No incidence of fisheries product
tion of fisheries products.
but without associated catch
marketability of such products
activities. Chemical
tainting; and
restrictions or closures; or
either through the imposition of
contaminants are here
No unusual fish mortality events.
If there is no available data use
High mortalities of aquatic species
limited advisories or by area
defined as compounds
the fol owing criteria:
near outfal s.
closures of fisheries; or
that are toxic or
If there is no available data use the
Some use of pesticides in small
Large-scale mortalities of aquatic
persistent or bioaccumu-
fol owing criteria:
areas; or
If there is no available data use the
species.
lating."
No use of pesticides; and
Presence of small sources of
fol owing criteria:
No sources of dioxins and furans;
dioxins or furans (e.g. small
Large-scale use of pesticides in
If there is no available data use the
and
incineration plants or bleached
agriculture and forestry; or
fol owing criteria:
No regional use of PCBs; and
kraft/pulp mil s using
Presence of major sources of
Indications of health effects
No bleached kraft pulp mil s using
chlorine); or
dioxins or furans such as large
resulting from use of pesticides; or
chlorine bleaching; and
Some previous and existing use
municipal or industrial incinerators Known emissions of dioxins or
No use or sources of other
of PCBs and limited amounts of
or large bleached kraft pulp mil s;
furans from incinerators or chlorine
contaminants.
PCB-containing wastes but not
or
bleaching of pulp; or
in amounts invoking local
Considerable quantities of waste
Known contamination of the
concerns; or
PCBs in the area with inadequate
environment or foodstuffs by PCBs;
Presence of other contami-
regulation or has invoked some
or
nants.
public concerns; or
Known contamination of the
Presence of considerable quantities
environment or foodstuffs by other
of other contaminants.
contaminants.
Issue : Suspended
No visible reduction in water
Evidently increased or reduced Markedly increased or reduced
Major changes in turbidity over
solids
transparency; and
turbidity in streams and/or
turbidity in small areas of streams
wide or ecological y significant
"The adverse effects of No evidence of turbidity plumes or receiving riverine and marine
and/or receiving riverine and
areas resulting in markedly changed
modified rates of release increased siltation; and
environments but without
marine environments; or
biodiversity or mortality in benthic
of suspended particulate No evidence of progressive
major changes in associated
Extensive evidence of changes in
species due to excessive
matter to water bodies
riverbank, beach, other coastal or
sedimentation or erosion rates,
sedimentation or erosion rates; or
sedimentation with or without
resulting from human
deltaic erosion.
mortality or diversity of flora Changes in benthic or pelagic
concomitant changes in the nature
activities"
and fauna; or
biodiversity in areas due to
of deposited sediments (i.e., grain-
Some evidence of changes in
sediment blanketing or increased
size composition/redox); or
benthic or pelagic biodiversity
turbidity.
Major change in pelagic biodiversity
in some areas due to sediment
or mortality due to excessive
blanketing or increased
turbidity.
turbidity.
Issue : Solid wastes
No noticeable interference with
Some evidence of marine-
Widespread litter on beaches
Incidence of litter on beaches
"Adverse effects
trawling activities; and
derived litter on beaches; or
giving rise to public concerns
sufficient to deter the public from
associated with the
No noticeable interference with
Occasional recovery of solid
regarding the recreational use of
recreational activities; or
introduction of solid
the recreational use of beaches due
wastes through trawling
beaches; or
Trawling activities untenable
waste materials into
to litter; and
activities; but
High frequencies of benthic litter
because of benthic litter and gear
water bodies or their
No reported entanglement of
Without noticeable
recovery and interference with
entanglement; or
environs."
aquatic organisms with debris.
interference with trawling and
trawling activities; or
Widespread entanglement and/or
recreational activities in coastal Frequent reports of entanglement/
suffocation of aquatic species by
areas.
suffocation of species by litter.
litter.
Issue : Thermal
No thermal discharges or evidence Presence of thermal discharges Presence of thermal discharges
Presence of thermal discharges with
"The adverse effects of
of thermal effluent effects.
but without noticeable effects
with large mixing zones having
large mixing zones with associated
the release of aqueous
beyond the mixing zone and
reduced productivity or altered
mortalities, substantial y reduced
effluents at tempera-
no significant interference
biodiversity; or
productivity or noticeable changes
tures exceeding ambient
with migration of species.
Evidence of reduced migration of
in biodiversity; or
temperature in the
species due to thermal plume.
Marked reduction in the migration
receiving water body."
of species due to thermal plumes.
Issue : Radionuclide
No radionuclide discharges or
Minor releases or fal out of
Minor releases or fal out of
Substantial releases or fal out of
"The adverse effects of
nuclear activities in the region.
radionuclides but with well
radionuclides under poorly
radionuclides resulting in excessive
the release of radioactive
regulated or wel -managed
regulated conditions that do not
exposures to humans or animals in
contaminants and
conditions complying with the
provide an adequate basis for public relation to those recommended
wastes into the aquatic
Basic Safety Standards.
health assurance or the protection
under the Basic Safety Standards; or
environment from
of aquatic organisms but without
Some indication of situations or
human activities."
situations or levels likely to warrant exposures warranting intervention
large scale intervention by a
by a national or international
national or international authority.
authority.
Issue : Spil s
No evidence of present or previous Some evidence of minor spil s Evidence of widespread
Widespread contamination by
"The adverse effects of
spil s of hazardous material; or
of hazardous materials in small contamination by hazardous or
hazardous or aesthetical y
accidental episodic
No evidence of increased aquatic
areas with insignificant smal -
aesthetical y displeasing materials
displeasing materials from frequent
releases of contaminants or avian species mortality due to
scale adverse effects one
assumed to be from spil age (e.g.
spil s resulting in major interference
and materials to the
spil s.
aquatic or avian species.
oil slicks) but with limited evidence with aquatic resource exploitation or
aquatic environment as a
of widespread adverse effects on
coastal recreational amenities; or
result of human
resources or amenities; or
Significant mortality of aquatic or
activities."
Some evidence of aquatic or avian
avian species as evidenced by large
species mortality through increased numbers of contaminated carcasses
presence of contaminated or
on beaches.
poisoned carcasses on beaches.


CHALLENGES TO INTERNATIONAL WATERS: REGIONAL ASSESSMENTS IN A GLOBAL PERSPECTIVE
110
ANNEXES 111
TABLE 10. SCORING CRITERIA FOR SOCIO-ECONOMIC IMPACTS OF POLLUTION
Increased risks to human health
Costs of weed control
Increased costs of animal protection (esp.
endangered species)
Increased costs of human health protection
Loss of wildlife sanctuaries
Displacement of valued species
Loss of water supplies (e.g. potable water)
Costs of increased navigational clearance,
navigational surveys or dredging activities
Avoidance of amenities and products due to
Increased costs of water treatment
Increased costs of fish surveil ance in the case of
perceptions of effects of contamination
Costs of preventive medicine
toxin incidence
Costs of public reassurance
Costs of medical treatment
Costs of reduced fish marketability due to
Maintenance of monitoring and radiological
aesthetic perceptions
protection activities for public reassurance
Costs of clean-up
Loss of protected areas
purposes
Loss of tourism or recreational values
Costs of preventive measures (e.g. tanker design/
Reduction in options for other uses of freshwater
construction)
Loss of aesthetic values
Potential for international conflicts
Costs of contingency measures
Loss in fisheries
Loss of reservoir storage capacity
Costs of litigation
Costs of increased fisheries product processing
Damage to equipment (e.g. particle impacts)
Costs of insurance
Change in fisheries value
Increased costs of coastal protection from waves/
Costs of disruption to shipping, marine reserves
Reduced options for aquaculture development
storm surges/erosion
and marine scientific activities during survey and
clean-up of spil s
Risk to aquaculture
Costs of cleaning intakes
Loss of property values
Endangerment of species
TABLE 11. SCORING CRITERIA FOR ENVIRONMENTAL IMPACTS OF OVERFISHING AND OTHER THREATS TO AQUATIC
LIVING RESOURCES
Issue
Score = no known impact
Score = slight impact
Score = moderate impact
Score = severe impact
Issue : Overexploitation
No harvesting of fish with
Commercial harvesting exists
One stock is exploited beyond
More than one stock is
"The capture of fish, shel fish or
commercial gear for sale or
but there is no evidence of
MSY (maximum sustainable
exploited beyond MSY or is
marine invertebrates at a level
subsistence.
overexploitation.
yield) or is outside safe
outside safe biological limits.
that exceeds the maximum
biological limits.
sustainable yield of the stock."
Issue : Excessive by-catch and Current harvesting practices
Up to of the fisheries yield - of the fisheries yield
Over of the fisheries yield
discards
show no evidence of excessive
(by weight) consists of by-catch
consists of by-catch and/or
is by-catch and/or discards; or
"By-catch refers to the incidental
by-catch and/or discards.
and/or discards.
discards.
Noticeable incidence of capture
capture of fish or other animals
of endangered species.
that are not the target of the
fisheries. Discards refers to dead
fish or other animals that are
returned to the sea."
Issue : Destructive fishing
No evidence of habitat
Habitat destruction resulting in Habitat destruction resulting in Habitat destruction resulting in
practices
destruction due to fisheries
changes in distribution of fish
moderate reduction of stocks or
complete col apse of a stock or
"Fishing practices that are
practices.
or shel fish stocks; or
moderate changes of the
far reaching changes in the
deemed to produce significant
Trawling of any one area of the
environment; or
environment; or
harm to marine, lacustrine or
seabed occurs less than once per Trawling of any one area of the Trawling of any one area of the
coastal habitats and communi-
year.
seabed occurs - times per
seabed occurs more than
ties."
year; or
times per year; or
Incidental use of explosives or
Widespread use of explosives or
poisons for fishing.
poisons for fishing.
Issue : Decreased viability of
No evidence of increased
Increased reports of diseases
Declining populations of one or Col apse of stocks as a result of
stocks through contamination and incidence of fish or shel fish
without major impacts on the
more species as a result of
diseases or contamination.
disease
diseases.
stock.
diseases or contamination.
"Contamination or diseases of
feral (wild) stocks of fish or
invertebrates that are a direct or
indirect consequence of human
action."
Issue : Impact on biological and No evidence of deliberate or
Alien species introduced
Measurable decline in the
Extinction of native species or
genetic diversity
accidental introductions of alien intentional y or accidental y
population of native species or
local stocks as a result of
"Changes in genetic and species
species; and
without major changes in the
local stocks as a result of
introductions (intentional or
diversity of aquatic environments No evidence of deliberate or
community structure; or
introductions (intentional or
accidental); or
resulting from the introduction of accidental introductions of alien Alien stocks introduced
accidental); or
Major changes (>) in the
alien or genetical y modified
stocks; and
intentional y or accidental y
Some changes in the genetic
genetic composition of stocks
species as an intentional or
No evidence of deliberate or
without major changes in the
composition of stocks (e.g. as a
(e.g. as a result of escapes from
unintentional result of human
accidental introductions of
community structure; or
result of escapes from
aquaculture replacing the wild
activities including aquaculture
genetical y modified species.
Genetical y modified species
aquaculture replacing the wild
stock).
and restocking."
introduced intentional y or
stock).
accidental y without major
changes in the community
structure.


CHALLENGES TO INTERNATIONAL WATERS: REGIONAL ASSESSMENTS IN A GLOBAL PERSPECTIVE
110
ANNEXES 111
TABLE 12. SCORING CRITERIA FOR SOCIO-ECONOMIC IMPACTS OF OVERFISHING AND OTHER THREATS TO AQUATIC LIVING
RESOURCES
Reduced economic returns
Loss of food sources (e.g. sources of protein) for human
Increased risks of predation, competition and/or
or animal consumption
disease for commercial y valuable species
Loss of employment / livelihood
Reduced earnings in one area by destruction of
Inter-generational equity issues (access to resources)
Potential new employment possibilities
juveniles in other areas (migrating populations)
Possible human health impacts
Improved catch/earnings
Loss of protected species
Conflict between user groups for shared resources
Reduced commercial value resulting from tainting
including space
TABLE 13. SCORING CRITERIA FOR ENVIRONMENTAL IMPACTS OF HABITAT AND COMMUNITY MODIFICATION
Issue
Score = no known impact Score = slight impact
Score = moderate impact
Score = severe impact
Issue : Loss of ecosystems or ecotones There is no evidence of
There are indications of
Permanent destruction of at
Permanent destruction of at
"The complete destruction of aquatic
loss of ecosystems or
fragmentation of at least one of
least one habitat is occurring
least one habitat is occurring
habitats. For the purpose of GIWA
habitats.
the habitats.
such as to have reduced the
such as to have reduced the
methodology, recent loss will be
surface area by up to
surface area by > during the
measured as a loss of pre-defined
during the last - decades.
last - decades.
habitats over the last - decades."
Issue : Modification of ecosystems or No evidence of change in Evidence of change in species
Evidence of change in species
Evidence of change in species
ecotones, including community
species complement due
complement due to species
complement due to species
complement due to species
structure and/or species composition
to species extinction or
extinction or introduction
extinction or introduction; and
extinction or introduction; and
"Modification of pre-defined habitats
introduction; and
Evidence of change in
Evidence of change in
in terms of extinction of native species, No changes in ecosystem
population structure or change
population structure or change
occurrence of introduced species and
function and services.
in functional group composition in functional group composition
changes in ecosystem function and
or structure
or structure; and
services over the last - decades."
Evidence of change in
ecosystem services.
1 CONSTANZA ET AL. (1997).
TABLE 14. SCORING CRITERIA FOR SOCIO-ECONOMIC IMPACTS OF HABITAT AND COMMUNITY MODIFICATION
Reduced capacity to meet basic human needs (food,
Loss of opportunity for investment income and
Costs of responding to risks
fuel) for local populations
foreign exchange from former ecosystem (e.g. loss of
Changes in employment opportunities for local
materials for potential pharmaceutical products)
Intergenerational inequity
populations and associated changes in social
Human conflicts, national and international
Modification or loss of cultural heritage
structures
Loss of aesthetic values / recreational values for local
Loss of educational and scientific values
Costs of control ing invasive species
populations
Increased risks to human population and capital
Costs of restoration of modified ecosystems
Loss of existing income and foreign exchange from
investment
fisheries, tourism, etc.
Loss of land due to loss of physical protection


CHALLENGES TO INTERNATIONAL WATERS: REGIONAL ASSESSMENTS IN A GLOBAL PERSPECTIVE
112
ANNEXES 113
TABLE 15. SCORING CRITERIA FOR ENVIRONMENTAL IMPACTS OF GLOBAL CHANGE
Issue
Score = no known impact
Score = slight impact
Score = moderate impact
Score = severe impact
Issue : Changes in hydrological No evidence of changes in Change in hydrological cycles Significant trend in changing Loss of an entire habitat through
cycle and ocean circulation
hydrological cycle and
due to global change causing
terrestrial or sea ice cover (in
desiccation or submergence as a
"Changes in the local/regional
ocean/coastal current due
changes in the distribution and
comparison with a long-term
result of global change; or
water balance and changes in
to global change.
density of riparian terrestrial or
time series) without major
Change in the tree or lichen lines; or
ocean and coastal circulation or
aquatic plants without
downstream effects on river/
Major impacts on habitats or
current regime over the last -
influencing overall levels of
ocean circulation or biological
biodiversity as the result of
decades arising from the wider
productivity; or
diversity; or
increasing frequency of extreme
problem of global change
Some evidence of changes in
Extreme events such as flood
events; or
including ENSO."
ocean or coastal currents due to
and drought are increasing; or
Changes in ocean or coastal currents
global change but without a
Aquatic productivity has been
or upwel ing regimes such that plant
strong effect on ecosystem
altered as a result of global
or animal populations are unable to
diversity or productivity.
phenomena such as ENSO
recover to their historical or stable
events.
levels; or
Significant changes in thermohaline
circulation.
Issue : Sea level change
No evidence of sea level
Some evidences of sea level
Changed pattern of coastal
Major loss of coastal land areas due
"Changes in the last - decades
change.
change without major loss of
erosion due to sea level rise has
to sea level change or sea level
in the annual/seasonal mean sea
populations of organisms.
became evident; or
induced erosion; or
level as a result of global change."
Increase in coastal flooding
Major loss of coastal or intertidal
events partly attributed to sea-
populations due to sea level change
level rise or changing prevailing or sea level induced erosion.
atmospheric forcing such as
atmospheric pressure or wind
field (other than storm surges).
Issue : Increased UV/B radiation No evidence of increasing Some measurable effects of UV/ Aquatic community structure is Measured/assessed effects of UV/B
as a result of ozone depletion
effects of UV/B radiation on B radiation on behaviour or
measurably altered as a
irradiation are leading to massive
"Increased UV/B flux as a result of
marine or freshwater
appearance of some aquatic
consequence of UV/B radiation;
loss of aquatic communities or a
polar ozone depletion over the
organisms.
species without affecting the
or
significant change in biological
last - decades."
viability of the population.
One or more aquatic
diversity.
populations are declining.
Issue : Changes in ocean CO
No measurable or assessed
Some reasonable suspicions that Some evidence that the impacts
Evidence that the changes in source/
source/sink function
changes in CO
current global change is
of global change have altered
sink function of the aquatic systems
"Changes in the capacity of
source/
sink function of aquatic
impacting the aquatic system
the source/sink function for
in the region are sufficient to cause
aquatic systems, ocean as well as
system.
sufficiently to alter its source/
CO
measurable change in global CO
freshwater, to generate or absorb
sink function for CO
of aquatic systems in the
region by at least .
balance.
atmospheric CO
.
as a direct or
indirect consequence of global
change over the last - decades."
TABLE 16. SCORING CRITERIA FOR SOCIO-ECONOMIC IMPACTS OF GLOBAL CHANGE
Freshwater availability
Human migration
Loss of income and employment
Food security
Damage to human life and property
Loss of property & capital assets
Employment security
Response costs for extreme events
Loss of incomes and foreign exchange from fisheries
Changes in productivity of agriculture, fisheries and
Costs for avoiding navigational hazards
Loss of opportunity for investments (both domestic
forestry
and foreign)
Changes in resources distribution and political
Increased costs of coast protection and emergency
Increased costs of human health care
jurisdiction over them
response/forecast


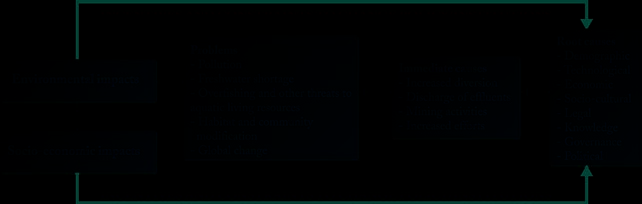
CHALLENGES TO INTERNATIONAL WATERS: REGIONAL ASSESSMENTS IN A GLOBAL PERSPECTIVE
112
ANNEXES 113
Annex III:
GIWA's key: Causal chain and policy
options analysis in a theoretical perspective
GIWA was created "to develop a comprehensive, strategic
iour of those who consume water and water-related resources.
framework for the identification of priorities for remedial and e last group includes general trends and conditions that
mitigatory actions in international waters". Establishing pri-
affect the demand for and supply of water and water-related
orities for actions implies not only an assessment of the sever-
resources. Figure 1 il ustrates the links among immediate
ity of the problems but also an analysis of what can be done
causes, root causes, environmental problems and human wel-
to solve or mitigate these problems. One of the salient char-
fare.
acteristics of the GIWA assessment is that its recommendations
are based on understanding the root causes of the problems.
Policy-related root causes
Freshwater scarcity, water pol ution, unsustainable exploita-
Policy-related root causes refer to the reasons why govern-
tion of living resources and habitat destruction are complex
ment actions (or the lack of them) contribute to increased
phenomena. Policy options that are grounded in a better un-
pressures on aquatic ecosystems. Policy-related root causes
derstanding of these problems will contribute to the creation
attempt to explain two forms of policy failure. e first one
of more effective responses to the extremely complex water-
refers to policy interventions that create or aggravate an en-
related transboundary problems.
ROOT
CAUSES
In order to identify root
causes, GIWA regional
teams conducted causal
chain analyses. A causal
FIGURE 1. THE GIWA CAUSAL CHAIN ANALYSIS
chain is a series of hypotheses that
link a problem with its effects and causes. e GIWA causal
vironmental problem. A public project of low but inflated
chain methodology includes immediate and root causes.
economic return and high (but underestimated or neglected)
Immediate causes are physical, biological or chemical fac-
environmental impacts, and an energy or fuel subsidy to ex-
tors that directly influence the system under analysis. Two
tract groundwater are two examples of this form of policy
examples of immediate causes are increased nutrients (in the
failure. e second form of policy failure refers to the lack of
case of eutrophication) and water diversions (in the case of
interventions when they are needed and could be realised in
freshwater shortage). A root cause operates in an indirect way an efficient, effective and equitable way. What are the causes
by forcing immediate causes to exert a greater pressure on the of these two forms of policy failure?
system. Root causes may be divided into three groups. e
e GIWA regional reports look at failures of government
first group contains the factors that explain policy failures.
policies to perform three essential functions: (i) detecting sig-
e second group encompasses factors that shape the behav-
nals and distributing information; (i ) reaching agreements


CHALLENGES TO INTERNATIONAL WATERS: REGIONAL ASSESSMENTS IN A GLOBAL PERSPECTIVE
114
ANNEXES 115
that balance stakeholder interests; and (i i) implementing, as
most obvious is the international dimension, but balancing
wel as enforcing, these agreements (World Bank 2003). In
the interests of different sectoral users (e.g. agriculture, en-
order to perform these essential functions, governments re-
ergy, industry, fisheries, households, etc.) is also a clear di-
quire enabling legal and organisational frameworks, as wel as mension. Perhaps the most difficult balance is between direct
the ability to mobilise the required financial resources.
use to meet human needs and environmental preservation.
Human uses need to be al ocated in a way that ensures the
Detecting changes
sustainability of ecological and hydrological systems.
e first vital institutional function is the ability to detect
is balancing of interests should be conducted at dif-
signals of changes and trends that affect the status of human
ferent levels. At a project planning level, water infrastruc-
activities and their impact on aquatic ecosystems. Signals
ture projects should contain a complete evaluation of social,
take various forms. In the Volta Basin (Guinea Current
economic and environmental costs and benefits. During the
42/b), in Sub-Saharan Africa, the combination of climatic
al ocation decision making process, the interests of the dif-
changes and increased damming led to a reduction of 30 of
ferent users and the environment should be voiced. In the
the region's headwaters, with an associated reduction of up to course of court processes or private negotiations, information
50 of the stream flow in some catchments, while the water
should be used to establish an understanding of the sufferers
demand increased by 600. e governments of Burkina
of a transboundary pol ution problem and the contributors to
Faso and Ghana failed to take into account this drastic
that problem.
change. In just a few years, water scarcity and misuse of the
remaining supplies had translated into a negative trade bal-
Executing decisions and inducing compliance
ance for agricultural products, farmland loss, as well as the
e execution of policy decisions is essential in order to have
resettlement and migration of a large percentage of the popu-
their intended impact; decision making alone is clearly not
lation. Monitoring the balance of ecosystems between their
enough. Even if a more efficient and equitable legal and or-
status and the human demand for their services, as well as
ganisational framework for water al ocation is adopted, if
detecting signals of such changes and predicting their poten-
there are no incentives for users, or the authorities lack the
tial impact, could have triggered the right policy response at
commitment to penalise or reverse transgressions, the imple-
the right time (World Bank 2003).
mentation of that decision will probably fail. How are policy
decisions implemented and enforced? Much environmental
Providing information
regulation has been `command and control', where govern-
In addition to the col ection and monitoring of key aquatic
ments require or prohibit specific actions or technologies,
ecosystem data, such as stocks, flows and quality, as well as
with potential fines or jail terms for those who do not fol ow
information on all the human-environment mechanisms af-
the rules. If sufficient resources are made available for moni-
fecting them, the proper and timely distribution of informa-
toring and enforcement, command and control approaches
tion to the right stakeholders is essential. is is why local
are effective. But when governments lack the will or resources
assessments are so important. Local assessments al ow insti-
to guard `protected areas', when major environmental dam-
tutional organisations not only to gather knowledge, but also
age comes from hard-to-detect sources, and when there is a
to distribute it to key stakeholders, al owing them in turn
need to encourage innovation in behaviours or technologies
to make wel -informed decisions. In a transboundary water
rather than to require or prohibit familiar ones, command
context, `providing information' also means that governments and control approaches are less effective. Other approaches
need to share data and decisions that will affect their com-
may be more effective. Voluntary approaches and those based
mon aquatic resources.
on information disclosure have only begun to receive the at-
tention they deserve as supplements to other tools. Success
Balancing interests
appears to depend on the existence of incentives that benefit
e failure to balance interests in international waters is a
leaders in volunteering over laggards and on the simultaneous
frequent cause of environmental and socio-economic prob-
use of other strategies, particularly ones that create incentives
lems. e balancing of interests has several dimensions. e


CHALLENGES TO INTERNATIONAL WATERS: REGIONAL ASSESSMENTS IN A GLOBAL PERSPECTIVE
114
ANNEXES 115
for compliance. e difficulties created by sanctioning pose
that govern the use of those resources. In this context, prop-
major problems for international agreements.
erty rights refer to a bundle of entitlements that define the
owner's privileges and limitations on the use of the resource.
Behavioural root causes
Property rights can be vested with different agents, for ex-
Environmental problems in international waters (freshwater
ample, individuals, the state and in groups of people. Each of
shortage, pol ution, overfishing and habitat modification) are,
these has numerous subtypes, and a myriad of hybrids exists
to a great extent, the result of human activities that use natural as wel . Regulations affect people's behaviour by proscribing
resources and produce pol ution. Environmental problems in
certain conduct (as in the case of a mandatory technology) or
international waters are not the result of a conspiracy of any
performance (as in the cases of limits on fish catches or pol u-
specific group, nor are they attributable simply to negligence,
tion effluents). Both laws and regulations are enforced by the
ineptitude or malevolence. ey are the result of ordinary peo-
threats of administrative penalties (fines, loss of licenses, etc.)
ple doing ordinary things; farmers irrigating their lands, fish-
or, in some cases, imprisonment.
ermen catching fish, and households and industry using water.
Problems are aggravated by faulty social coordination mecha-
Education and training
nisms. Users do not take into account the impact that their ac-
Education and training can alter attitudes and beliefs about
tions impose on other people. Water is particularly difficult to
environmental problems. ey shape the behaviour of indi-
manage because al life and al sectors of the economy depend
viduals by increasing their knowledge of a problem, by con-
on water and, because of this, al users are interdependent. is vincing them that the severity of the problem cal s for their
basic fact gives rise to two questions: (i) what are the factors
personal involvement, and by preparing the person to be able
that determine/influence the ways in which people use water
to take specific actions to help mitigate the problem.
and water-related resources?; and (i ) how can user behaviour
that threatens social welfare and environmental sustainabil-
Economic considerations
ity be discouraged, and behaviour that enhances social welfare
Economic considerations (especial y prices and wealth) affect
and environmental sustainability be encouraged? is section
people's production and consumption decisions. Prices play
answers the first question and provides the foundations for the
three critical roles in market economies: (i) they match supply
policy options section to answer the second.
and demand of goods and services (as a commodity becomes
dearer, consumers reduce consumption and producers in-
Culture and sense of community
crease supply); (i ) they al ocate goods and services; and (i i)
Culture and sense of community affect the way people relate
they prevent wasteful use of resources (input prices can have a
to aquatic ecosystems. ere are at least three ways in which
considerable effect on their usage). Unfortunately, in the case
culture impacts this relationship. Firstly, culture can have a
of environmental services, the price system often fails to per-
major impact on economic behaviour through its effect on
form these functions.
work ethics, motivation, and attitudes towards risk, among
other factors. Secondly, culture influences political partici-
Economic pos ibilities
pation. e culture of participation can be essential to the
People's behaviour depends on their economic situation.
management of aquatic ecosystems. Final y, culture moulds
e role of poverty deserves special attention. Establishing
social solidarity and association. Apart from economic and
causal links between poverty and environmental degrada-
political interactions, the preservation and guardianship of
tion is complex and debatable. ere are many examples of
common assets (like community-managed fisheries) is largely poor communities that have managed their resources in a
influenced by what members of a social group may voluntarily sustainable way. e impact of poverty on the environment
do for each other.
ultimately depends on the alternatives that poor people have
to generate income, invest in conservation and procure food,
Laws
water and energy. ese alternatives in turn depend on insti-
e way in which people use natural resources depends on a
tutional factors like the definition of property rights (uncer-
number of issues, but one critical aspect is the property rights tainties of property rights are common among poor farmers


CHALLENGES TO INTERNATIONAL WATERS: REGIONAL ASSESSMENTS IN A GLOBAL PERSPECTIVE
116
ANNEXES 117
and poor fishermen) and access to markets (access to credit
tions that deserve a more detailed assessment which will be
seems particularly important in this context).
transferred to stakeholders so that the options can be further
analysed in the decision-making processes. e analysis sum-
Technology
marises the views of regional experts in different disciplines
Final y, with regard to technology, GIWA case studies have
and is meant to provide policy makers with a practical and
focused on the reasons why environmental y friendly tech-
systematic way to evaluate the pros and cons of different pol-
nologies are not used. Lack of enforcement of environmental
icy instruments. Policy analysis must be tailor-made to suit
regulations is the first, and most obvious, explanation. Insuf-
the particular conditions (environmental, economic, social,
ficient information is another natural explanation. Informa-
political and administrative) of the problem. e GIWA meth-
tion is a public good and, as such, markets will in general
odology is based on a list of tasks and choices designed to
fail to provide it. e way in which sectors are organised may
make the methods and conclusions transparent. Accordingly,
also pose a problem for the efficient diffusion of environ-
each regional team fol owed this approach.
mental y friendly technologies (e.g. fishermen may get their
gear from processing firms or from traders). Uncertainty is
e task list contains the fol owing items:
another potential reason for the slow adoption of environ-
Problem definition;
mental y friendly technologies. Producers and consumers may Assembling evidence and information;
wonder whether new technologies will perform as expected.
Identifying instruments;
Lack of access to credit to finance the acquisition of innova-
Selecting evaluation criteria and evaluating outcomes; and
tive technologies may also play a part, especial y in the case
Selection of actions.
of the poor. Final y, cultural conformity and inertia may also
be part of the explanation for the slow (or non) adoption of
e definition of the problem is the link between the policy
innovative environmental y friendly technologies.
options analysis and the rest of the GIWA methodology. e
scoping phase identifies the priority problem and the causal
General conditions
chain analysis establishes the immediate and root causes.
General conditions include population dynamics (growth,
e problem definition combines the priority problem and its
geographical distribution and migration), economic growth
most important immediate causes. For example, in the case
and natural phenomena (e.g. El Nińo). A larger population
where pol ution results from eutrophication, and run-off from
requires more goods and services, which in turn requires
fertilizers is the only immediate cause, the problem defini-
more water for food, energy and industrial production. Half
tion might be: "there is too much nutrient run-off from fertil-
of the Earth's population lives in coastal areas, and that pro-
izers".
portion is expected to grow. is trend, coupled with urbani-
sation, will exert additional pressure on fragile aquatic eco-
e second task is to assemble evidence and information
systems. Economic growth also affects the demand for goods
about the environmental and the socio-economic context of
and services provided by aquatic ecosystems. Trade, one of
the problem. e information gathered should help answer
the engines of economic growth, poses special chal enges and the fol owing questions:
opportunities for resource management.
Who are the stakeholders and what are their interests?
What is the institutional background for the situation
(laws, regulations, norms, traditions, authorities, etc.)?
What are the roles, responsibilities and capabilities of dif-
POLICY OPTIONS ANALYSIS
ferent authorities (e.g. sub-national and national govern-
ments)?
e last step in identifying "priorities for remedial and miti-
What is the status of the ecosystem and what are the im-
gatory actions in international waters" consists of analysing
portant ecosystem processes for the area of concern?
policy options to address the priority problems. e GIWA
policy analysis is preliminary; it is designed to screen op-


CHALLENGES TO INTERNATIONAL WATERS: REGIONAL ASSESSMENTS IN A GLOBAL PERSPECTIVE
116
ANNEXES 117
e third task is to identify policy instruments. It is useful
existing markets sometimes only target the real problem in
to divide policy instruments into two groups, depending on
an indirect way (e.g. using the markets of agro-chemicals to
whether or not they are aimed at changing human behav-
address pol ution).
iour. e policy instruments aimed at changing human be-
Creating markets can also provide positive incentives
haviour can in turn be divided into the fol owing categories
for people to alter their behaviour in a social y and envi-
(World Bank 1997):
ronmental y positive way. Many environmental goods (or
Using markets;
problems like pol ution) and services do not have their own
Creating markets;
markets. is lack of markets discourages the production of
Using environmental regulations;
environmental services and encourages the creation of envi-
Engaging the public; and
ronmental problems. If the owners of wetlands were paid for
Developing international environmental agreements.
the environmental services that their properties offer, land
use changes would diminish. Similarly, if pol uters had to pay
Using existing markets to provide economic incentives to
for the amount of pol ution they generate, pol ution would
change people's behaviour may be very effective. Unfortu-
decrease. e main categories of instruments that rely on cre-
nately, prices often do not promote sustainable use of natural
ating markets and some examples of their use are shown in
resources, for two reasons. Firstly, certain subsidies lower the
Table 2.
financial cost of overexploiting a natural resource or pol ut-
TABLE 2. INSTRUMENTS FOR CREATING NEW MARKETS
ing the environment. e other reason is that usual y when it
Instrument
Example
comes to goods and services linked to natural resources and
Establishing property rights
Water markets
the environment, market prices only reflect private costs and
Tradable permits and rights
Tradable fishing quotas
benefits, disregarding the effects on other people or on the
Tradable effluent rights
environment. e prices of pesticides and fertilizers that pol-
lute watercourses do not reflect the social and environmental
e main advantage of these types of instruments is that they
costs that their use imposes on others. e main categories of target the actual problem in a direct way, getting the incen-
instruments that rely on existing markets and some examples
tives right and encouraging cost-effective solutions for envi-
of their use are shown in Table 1.
ronmental problems. eir main disadvantages are that they
require solid institutions for their implementation and that
TABLE 1. INSTRUMENTS FOR USING EXISTING MARKETS
they may be costly to implement.
Instrument
Example
Regulations are the most common type of instrument
Subsidies reduction
Energy to pump groundwater
Pesticides
to address environmental and natural resource problems.
Targeted subsidies
Payment for non-marketable ecological services
e reasons for this are mainly due to their intuitive simplic-
Taxes
Pesticides
Effluent taxes
ity and to the fact that they frequently match the interests of
User charges
Irrigation water
Deposit refund systems
Plastic bottles
both the authorities and the regulated community. e main
Performance bonds
Tourism development of coastal areas
categories of instruments that rely on regulations and some
Hazardous pol utants management
examples of their use are shown in Table 3.
Policy instruments based on existing markets have two
TABLE 3. INSTRUMENTS FOR REGULATIONS
positive characteristics: Firstly, they are, frequently, easy to
Instrument
Example
implement and they may have positive fiscal impacts (as in
Boat and mesh sizes
Action (technology) standards
Zoning
the case of reducing subsidies or levying taxes on goods or
Bans
services that have a negative environmental impact). e
Performance standards
Effluent standards
Total al owable catch quotas
main disadvantage of this family of instruments is that most
of them are political y difficult to implement because they
Conditions that favour the use of regulations include:
impose an additional financial burden on users of water and
Unacceptably high costs of even minor quantities of a
water-related resources. An additional disadvantage is that
pol utant (or any undesired effect);


CHALLENGES TO INTERNATIONAL WATERS: REGIONAL ASSESSMENTS IN A GLOBAL PERSPECTIVE
118
ANNEXES 119
A minimal number of pol uters;
TABLE 4. INSTRUMENTS FOR ENGAGING THE PUBLIC
Monitoring results is expensive while monitoring tech-
Instruments
Examples
nologies is simple; and
Information for consumers
Eco-label ing
Information disclosure
ere is one clearly superior technology.
Information for producers
Best practices dissemination
Compliance promotion
Perhaps the most important disadvantage of regulations is
River basin councils
Participation
Irrigation management
that authorities misuse them easily (because of their intuitive
Community management
appeal) when regulators do not consider all the direct and
indirect costs that regulations impose. An additional problem their deeper values. Information-based instruments work best
is the risk that regulators may identify themselves with the
when they are coupled with other instruments. Similarly, a
interests of the regulated community rather than with the
call for increased participation is on its own not likely to be
interests of society as a whole (including the regulated com-
effective. Instruments based on participation require solid in-
munity).
stitutions to balance the interests of the different stakehold-
Engaging the public means providing people with more ers.
information and giving stakeholders the opportunity to par-
Economic, social and demographic dynamics are in-
ticipate in the decision-making process. Lack of information
creasing the interdependency of nations. e use of water,
can be an obstacle to more environmental y friendly behav-
its pol ution, the destruction of aquatic ecosystems and the
iour because the links between individual behaviours and
unsustainable exploitation of fisheries have local, national
their environmental impacts may be difficult to understand
and frequently regional and even global effects. Address-
from personal experiences. Providing more information al-
ing regional environmental problems requires cooperation.
lows the public to act in the economic and political arenas
International environmental agreements offer a framework
to demand better environmental quality. In the economic
for cooperative management of aquatic ecosystems. However,
arena, consumers can affect production processes by demand-
effective international environmental agreements are neither
ing environmental y friendly products. In the political arena,
easy to craft nor implement. ere is no problem in discuss-
information can trigger political demands for a better envi-
ing an agreement but the combination of self-interest and
ronment. Information can also help producers improve their
sovereignty may keep important countries out of the agree-
environmental performance, as in the case of best practices
ment. Moreover, it may happen that signatories to such an
and information on the environmental y correct application
agreement may not uphold their responsibilities.
of certain inputs, like pesticides.
Public participation in decision-making processes is
Non-behavioural interventions
the other major way to engage the public to solve or mitigate
Direct government involvement, including different forms
environmental problems. One of the main features of envi-
of government investment, plays an important role in both
ronmental problems is that some decision-making processes
actual and potential interventions. Funding protected natural
may not always consider the interests of all stakeholders. In-
areas, financing improved understanding of natural phenom-
creased participation to improve environmental quality may
ena, investing in infrastructure and financing research are
be achieved at different levels (project planning, monitoring
some of the major categories of direct government interven-
and evaluation of large infrastructure; operation of irrigation
tion. Economies of scale and the public-good nature of many
infrastructure; management of small scale natural resources;
environmental and natural resource services are the main rea-
court processes etc.). e main categories of instruments that sons to include instruments based on government investment
rely on engaging the public and some examples of their use
on a list of effective actions to solve or mitigate problems in
are shown in Table 4.
international waters. Public goods provide services that com-
Providing information is not enough to guarantee a
munities enjoy in common, such as unpol uted water. Gov-
change in people's behaviour. Furthermore, better informa-
ernment intervention is required to produce public goods be-
tion is only likely to induce behavioural changes that are not
cause most people would not voluntarily pay for a service that
very expensive to the people and that are compatible with
they can get for free. e funds raised by voluntary contribu-


CHALLENGES TO INTERNATIONAL WATERS: REGIONAL ASSESSMENTS IN A GLOBAL PERSPECTIVE
118
ANNEXES 119
tions to finance large infrastructure projects (e.g. water treat-
litical support; etc. Robustness is a useful criterion to apply
ment plants) would not be enough to finance the required
when some of these situations are likely to occur.
project at its optimal scale. e scale of these projects may
Efficiency refers to the maximisation of net benefits.
require the taxing and borrowing capacities of governments
A full evaluation of efficiency is beyond the mandate (and
to raise the necessary funds. e main categories of instru-
resources) of the GIWA. However, most regional GIWA teams
ments that rely on direct government involvement and some
did include lists of the costs and benefits of the options they
examples of their use are shown in Table 5.
analysed. Even in this limited and unquantified form, a list of
costs and benefits serves a useful purpose: it reminds policy
TABLE 5. INSTRUMENTS FOR DIRECT GOVERNMENT
INVOLVEMENT
makers of the potential impacts (both positive and negative)
of a policy decision.
Instruments
Examples
Equity is not usual y the main objective of environmen-
Understanding, describing and predicting Meteorological systems
Infrastructure
Municipal water treatment plants
tal and natural resource policy. However, we should question
Protection
Protected areas
the justification of any measures designed to improve envi-
Research
ronmental conditions in international waters whose costs are
disproportionately paid by the poor. Furthermore, unfair pat-
terns of incidence may erode the political support necessary
e main drawback of policy instruments based on
for policy interventions. e GIWA methodology instructs
government investment is the lack of funding due to the fiscal regional teams to evaluate the fairness in the distribution
situation of governments (especial y in developing countries)
of costs and benefits of the analysed options. It also advises
and their inability (again, mainly in developing countries) to
regional teams to suggest compensating measures in certain
charge beneficiaries for the positive outcomes that these in-
cases.
terventions generate.
A policy option may have great theoretical appeal, but
e next task is selecting evaluation criteria and evalu-
its eventual impact will be determined by what happens to
ation outcomes to assess the expected results of the selected
the option as it goes through the decision-making and policy
options. e methods used to test the performance of options implementation processes. Practical criteria are meant to as-
under the different criteria are practical and simple because
sess the prospect of a successful transit through these pro-
the GIWA policy option analysis is only meant to provide op-
cesses. e most widely used practical criteria are political ac-
tions for further analysis and discussion.
ceptability and administrative feasibility.
ere are several criteria that can be used to evaluate
A quick (and preliminary) way to assess the political
the outcomes of policy interventions. A combination of the
acceptability of an intervention is to look at who gains and
fol owing criteria is frequently used:
who looses from it, and to estimate the expected actions and
Effectiveness (certainty of result);
impacts of the opposing and supporting groups. Administra-
Efficiency (maximisation of net benefits) or cost effective-
tive feasibility includes considerations about the legality of an
ness (achieving a set policy goal at minimum cost);
intervention, as well as the capacity (technological, financial
Equity (fairness in the division of costs and benefits); and
and operative) of the implementing organisation.
Practical criteria (political acceptability, implementation
e last task is to choose actions from the list of anal-
feasibility).
ysed options. In most circumstances, instruments are comple-
mentary and a combination of incentives, regulations, infor-
To evaluate the effectiveness of an instrument, it is useful to
mation and direct government involvement is the best way
think about situations that could hinder its successful imple-
to address a problem. Consider the case of pol ution. A good
mentation, as well as the likelihood that these situations will
programme to improve water quality would probably include
occur. e list of adverse situations is unfortunately long: bu-
regulations (e.g. banning certain pol utants in water effluents
reaucratic resistance, lack of political wil , "capture" of policy
and setting acceptable ranges for others), incentives to induce
benefits by an undeserving group; excessive administrative
the required reductions in pol ution discharges, information
costs; lack of enforcement; waste; abuse that undermines po-

CHALLENGES TO INTERNATIONAL WATERS: REGIONAL ASSESSMENTS IN A GLOBAL PERSPECTIVE
120
on best practices, and the provision of col ective infrastruc-
In these cases, what option(s) is (are) chosen depends on the
ture (e.g. treatment facilities).
relative weights of the different criteria and on the differences
Options have to be prioritised when they are substitutes in performance under each criterion.
or when restrictions (budgetary or otherwise) do not al ow
e relative weights of the criteria may depend on the
the implementation of all the interventions that would have
conditions of each particular problem. Equity considerations
a positive impact on the problem. If one of the policy options
will probably not be influential if the problem affects a soci-
under consideration is expected to produce a better result
ety with an even distribution of wealth and modest imple-
than any of the other options with regard to every evaluative
mentation costs. In contrast, if the problem takes place in a
criterion, the choice is obvious. However, this is not always
context of a skewed distribution of wealth, and the imple-
the case. It may also happen that under a specific criterion
mentation of an option would entail net losses for the poor,
one instrument outperforms another but the relation is re-
equity should be strongly weighted. Regardless, effectiveness
versed if another criterion to evaluate performance is used.
should be weighted heavily.


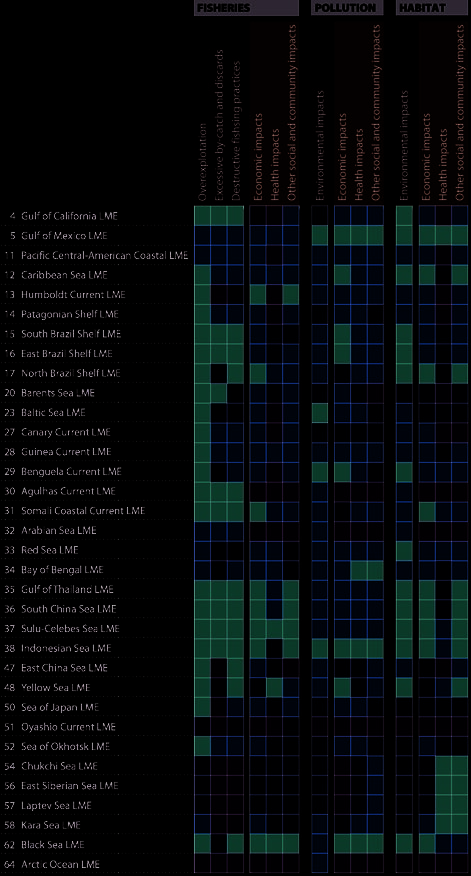
EGION
CORING
IWA S EGA R
Y M
THE G
MATRIX B
THE GIWA LME MATRIX
GIWA Assessment scoring
Some of the GIWA regions include one or more LMEs
Severe impact
within their boundaries. However, the numbering system
Moderate impact
Slight impact
used by GIWA is different to that used for LMEs. Where the
No impact reported
GIWA considered several sub-systems within an LME, an ad-
justed score of the sub-systems was applied at the LME scale.
erefore the scores presented in this matrix do not always
correspond with the GIWA regional scores.
e GIWA findings for the concerns of Overfishing and
other threats to aquatic living resources, Pol ution and Habi-
tat and community modification as well as information from
other sources, were arranged into the five LME modules.
THE GIWA SCORING MATRIX BY MEGA REGION
Annex IV:
FRESHWATER SHORTAGE
POLLUTION
OVERFISHING
HABITAT MODIFICATION
GLOBAL CHANGE
ISSUES
IMPACTS
ISSUES
IMPACTS
ISSUES
IMPACTS
ISSUES
IMPACTS
ISSUES
IMPACTS
Matrix of GIWA concerns
source/sink funktion
Modification of stream flow
Pol ution of existing supplies
Changes in the water table
Environmental
Economic
Health Other social and community
OVERALL
Environmental
Economic
HealthOther social and community
OVERALL
Modification of ecosystems
Loss of ecosystems
Environmental
Economic
HealthOther social and community
OVERALL
Overexploitation
Excessive by-catch and discards
Destructive fishing practices
Decreased viability of stock
Impact on biological and genetic diversity
Environmental
Economic
HealthOther social and community
OVERALL
Changes in the hydrological cycle
Sea level change
Increased UV-B radiation
Changes in ocean CO 2
Environmental
Economic
HealthOther social and community
OVERALL
Suspended solids
Eutrophication
Microbiological
Solid wastes
Chemical
Spil s Radionuclides
Thermal
1a
Russian Arctic
1b
Arctic Greenland
11
Barents Sea
13
Faroe plateau
A
r
c
t
i
c
R
i
m
15
East Greenland Shelf
16
West Greenland Shelf
28a Bering Sea (West Bering Sea)
28b Bering Sea (East Bering Sea)
17
Baltic Sea
22
Black Sea
al Asia
23
Caspian Sea
E
u
r
ope &
C
entr
24
Aral Sea
2a
Gulf of Mexico (Mississippi River)
2b Gulf of Mexico (Rio Grande/Rio Bravo)
2c
Gulf of Mexico (Usumacinta/Grijalva)
2d Gulf of Mexico (Rio Hondo/Chetumal Bay)
3a
Caribbean Sea (Small Islands)
e
r
i
c
a
3b Caribbean Sea (Orinoco/Magdalena/Catatumbo)
a
l
A
m
3c
Caribbean Sea (Central America/Mexico)
C
entr
4
Caribbean Islands
27
Gulf of California
65a Eastern Equatorial Pacific (Southwest Mexico)
65b Eastern Equatorial Pacific (Central Equatorial Pacific)
65c Eastern Equatorial Pacific (Pacific Colombian)
38a Patagonian Shelf (La Plata River Basin)
38b Patagonian Shelf (South Atlantic Drainage Basin)
a
39a Brazil Current (South/Southeast Atlantic Basins)
39b Brazil Current (East Atlantic Basins)
39c Brazil Current (Săo Francisco River Basin)
South Americ
40a Northeast Brazil Shelf
40b Amazon
64
Humboldt Current
41a Canary Current (North)
41b Canary Current (South)
42a Guinea Current (Comoe Basin)
42b Guinea Current (Volta Basin)
42c Guinea Current (Niger Basin)
42d Guinea Current (Congo Basin)
42e Guinea Current LME
a
43
Lake Chad
44
Benguela Current
an Afric
45b Indian Ocean Islands
46a Somali Coastal Current (Juba/Shebelle)
S
u
b
-
S
ahar
46b Somali Coastal Current (Tana/Athi/Sabaki)
46c Somali Coastal Current (Wami/Ruvu/Pangani)
46d Somali Coastal Current (Rufiji/Ruvuma)
46e Somali Coastal Current (Lake Jipe/Chala)
47a East African Rift Valley Lakes (Lake Turkana)
47b East African Rift Valley Lakes (Lake Victoria)
47c East African Rift Valley Lakes (Lake Tanganyika)
47d East African Rift Valley Lakes (Lake Malawi)
E
a
st
51
Jordan
th Africa &
N
o
r
Middle
30
Sea of Okhotsk
31
Oyashio Current
33
Sea of Japan
theast
Asia
34a Yellow Sea (Yellow Sea)
N
o
r
34b Yellow Sea (Bohai Sea)
36
East China Sea
53
Bay of Bengal
54
South China Sea
55
Mekong River
56
Sulu-Celebes Sea
57a Indonesian Seas (Sunda)
Southeast Asia
GIWA Assessment scoring
57b Indonesian Seas (Wallacea)
Severe impact
Moderate impact
57c Indonesian Seas (Sahul)
Slight impact
No impact reported
58a North Australian Shelf (Wet Tropics)
Likely direction of future changes
58b North Australian Shelf (Dry Tropics)
for Environmental impact
59a Coral Sea Basin (South PNG and Papua)
Increased impact
59b Coral Sea Basin (Coral Sea)
No changes
60
Great Barrier Reef
Decreased impact
61a Great Australian Bight
61b Great Australian Bight (Muray Darling Basin)
FOR INFORMATION ON THE GIWA
A
u
s
t
r
a
l
i
a
&
P
a
cific Islands
62
Pacific Islands
METHODOLOGY AND CRITERIA
63
Tasman Sea
SEE ANNEX II.
The Global International Waters Assessment (GIWA) is a holistic, global y comparable
assessment of the world's transboundary waters that recognises the inextricable
links between the freshwater and the coastal marine environment and integrates
environmental and socio-economic information to determine the impacts of a broad
range of influences on the world's aquatic environment.
BROAD TRANSBOUNDARY APPROACH
GIWA recognises that many water bodies and resources, and the human impacts on them are not
confined to a single country.
REGIONAL ASSESSMENT GLOBAL PERSPECTIVE
GIWA provides a global perspective of the world's transboundary waters by assessing regions that
encompass major drainage basins and adjacent Large Marine Ecosystems.
e GIWA Assessment incorporates information and multidisciplinary expertise from all countries
sharing the transboundary water resources of each region.
GLOBAL COMPARABILITY
In each region, the assessment focuses on five major concerns that are comprised of
22 specific water-related issues.
INTEGRATION OF INFORMATION AND ECOSYSTEMS
GIWA recognises the inextricable links between the freshwater and the coastal marine environment
and assesses them together as one integrated unit.
GIWA recognises that the integration of socio-economic and environmental information and expertise
is essential in order to obtain a holistic understanding of the interactions between the environmental
and societal aspects of transboundary waters.
PRIORITIES, ROOT CAUSES AND OPTIONS FOR THE FUTURE
GIWA identifies the priority concerns of each region, determines their societal root causes and
discusses options to mitigate the impact of those concerns in the future.
THIS REPORT
e GIWA Final Report provides a comprehensive review of the most important findings from the
GIWA regional reports. It summarises the major transboundary concerns and their environmental and
socio-economic impacts. To better understand these concerns and develop solutions to address them,
the Report identifies the root causes and draws policy relevant conclusions. It also outlines knowledge
gaps which impede the sustainable management of international waters.
ISBN 91-89584-47-3
UNEP/GCSS.IX/INF/9