
Eutrophication in
the Black Sea region
Impact assessment and Causal chain analysis
Leading authors:
Olena Borysova
Kharkiv National Academy of Municipal Economy, Ukraine
Andrey Kondakov
Southern Centre of Russian National Academy of Science, Russia
Susanna Paleari
National Research Council of Italy, Italy
Elina Rautalahti-Miettinen
Global International Waters Assessment, Sweden
Felix Stolberg
Black Sea Ecosystem Recovery Project, Ukraine
Dag Daler
Global International Waters Assessment, Sweden
Global International Waters Assessment
Eutrophication in the Black Sea region; Impact assessment and
Causal chain analysis.
Published by the University of Kalmar with an agreement with the
GEF-UNDP Black Sea Ecosystem Recovery Project.
© 2005 University of Kalmar
ISBN: 91-89584-50-3
University of Kalmar
SE-391 82 Kalmar
Sweden
This publication may be reproduced in whole or in part and in
any form for educational or non-profi t purposes without special
permission from the copyright holder, provided acknowledgement
of the source is made. No use of this publication may be made for
resale or for any other commercial purpose whatsoever without
prior permission in writing from the University of Kalmar.
CITATIONS
When citing this report, please use:
Borysova, O., Kondakov, A., Paleari, S., Rautalahti-Miettinen, E.,
Stolberg, F. and D. Daler, 2005. Eutrophication in the Black Sea
region; Impact assessment and Causal chain analysis. University of
Kalmar, Kalmar, Sweden.
DISCLAIMER
This publication has been peer-reviewed and the information herein
is believed to be reliable, but the publisher does not warrant its
completeness or accuracy.
Printed and bound in Kalmar, Sweden, by Sunds Tryck ÷land AB.
Contents
Preface 7
Executive summary
8
Regional defi nition
9
Geographical boundaries
9
Physical characteristics of the region
10
Political and socio-economic characteristics
16
Impact assessment, eutrophication
27
Environmental impacts
27
Scoring and list with justifi cation of the priority impacts for the Black Sea Basin
37
Causal chain analysis
40
Introduction to methodology
40
Conceptual model of the CCA
40
Immediate causes
41
Sector analysis
42
Root causes
44
Conclusion
46
Sources 48
Annexes 49
Annex I Contact information on the authors and the contributors of the report
49
Annex II Socio-economic indicators of the countries of the Black Sea catchment area
50
Annex III Water resources in the Black Sea countries
53
Annex IV Economic estimation for the damage of eutrophication for 5 Southern regions of Ukraine
56
Annex V Classifi cation tables for eutrophication levels of marine and fresh waters
60
CONTENTS
List of figures
Figure 1
General map of the region, elevations are based on USGS 2002 . . . . . . . . . . . . . . . . . . . . . . . . . . . . . . . . . . . . . . . . . . . . . . . . . . . . . . . . . . . . . . . . . . . . . . . . . . . . . . . . . . . . . . . . . . . . . . . . . . 9
Figure 2
Sub-basin map of the Black Sea.. . . . . . . . . . . . . . . . . . . . . . . . . . . . . . . . . . . . . . . . . . . . . . . . . . . . . . . . . . . . . . . . . . . . . . . . . . . . . . . . . . . . . . . . . . . . . . . . . . . . . . . . . . . . . . . . . . . . . . . . . . . . . . . 10
Figure 3
Land use in the Dnipro Basin . . . . . . . . . . . . . . . . . . . . . . . . . . . . . . . . . . . . . . . . . . . . . . . . . . . . . . . . . . . . . . . . . . . . . . . . . . . . . . . . . . . . . . . . . . . . . . . . . . . . . . . . . . . . . . . . . . . . . . . . . . . . . . . . . . . 13
Figure 4
Heavy industry in the Black Sea area. . . . . . . . . . . . . . . . . . . . . . . . . . . . . . . . . . . . . . . . . . . . . . . . . . . . . . . . . . . . . . . . . . . . . . . . . . . . . . . . . . . . . . . . . . . . . . . . . . . . . . . . . . . . . . . . . . . . . . . . . . . . 17
Figure 5
Population density in the Black Sea catchment area. . . . . . . . . . . . . . . . . . . . . . . . . . . . . . . . . . . . . . . . . . . . . . . . . . . . . . . . . . . . . . . . . . . . . . . . . . . . . . . . . . . . . . . . . . . . . . . . . . . . . . . . . . . 18
Figure 6
Dams in the Black Sea region. . . . . . . . . . . . . . . . . . . . . . . . . . . . . . . . . . . . . . . . . . . . . . . . . . . . . . . . . . . . . . . . . . . . . . . . . . . . . . . . . . . . . . . . . . . . . . . . . . . . . . . . . . . . . . . . . . . . . . . . . . . . . . . . . . . 19
Figure 7
Total national water abstraction from the Danube River Basin . . . . . . . . . . . . . . . . . . . . . . . . . . . . . . . . . . . . . . . . . . . . . . . . . . . . . . . . . . . . . . . . . . . . . . . . . . . . . . . . . . . . . . . . . . . . . . . . . 21
Figure 8
National demand for water (%) from the Dnipro Basin in Ukraine (by sector). Agricultural sector demand supplies 85% of water for irrigation.. . . . . . . . . . . . . . . . 22
Figure 9
Algae bloom in the Black Sea. . . . . . . . . . . . . . . . . . . . . . . . . . . . . . . . . . . . . . . . . . . . . . . . . . . . . . . . . . . . . . . . . . . . . . . . . . . . . . . . . . . . . . . . . . . . . . . . . . . . . . . . . . . . . . . . . . . . . . . . . . . . . . . . . . 27
Figure 10
The process of eutrophication in the Black Sea. . . . . . . . . . . . . . . . . . . . . . . . . . . . . . . . . . . . . . . . . . . . . . . . . . . . . . . . . . . . . . . . . . . . . . . . . . . . . . . . . . . . . . . . . . . . . . . . . . . . . . . . . . . . . . . . . 27
Figure 11
Development of plant life in coastal waters with increased level of nutrients. . . . . . . . . . . . . . . . . . . . . . . . . . . . . . . . . . . . . . . . . . . . . . . . . . . . . . . . . . . . . . . . . . . . . . . . . . . . . . . . . . . 28
Figure 12
Eutrophication levels in the Black Sea (hypertrophic ≠ red, eutrophic ≠ orange, mesotrophic ≠ yellow and blue). . . . . . . . . . . . . . . . . . . . . . . . . . . . . . . . . . . . . . . . . . . . . . . . 28
Figure 13
Expansion of hypoxia and anoxia zones in the northwest of the Black Sea. . . . . . . . . . . . . . . . . . . . . . . . . . . . . . . . . . . . . . . . . . . . . . . . . . . . . . . . . . . . . . . . . . . . . . . . . . . . . . . . . . . . . 29
Figure 14
Linkages between eutrophication and other transboundary issues . . . . . . . . . . . . . . . . . . . . . . . . . . . . . . . . . . . . . . . . . . . . . . . . . . . . . . . . . . . . . . . . . . . . . . . . . . . . . . . . . . . . . . . . . . . . 34
Figure 15
Mineral nitrogen (N) fertilizers consumption ≠ E.U.15 Member States, from 1930 to 1999. . . . . . . . . . . . . . . . . . . . . . . . . . . . . . . . . . . . . . . . . . . . . . . . . . . . . . . . . . . . . . . . . . . . . . . 41
Figure 16
The agricultural nitrogen air/soil/water exchanges and possible impacts. . . . . . . . . . . . . . . . . . . . . . . . . . . . . . . . . . . . . . . . . . . . . . . . . . . . . . . . . . . . . . . . . . . . . . . . . . . . . . . . . . . . . . 42
Figure 17
Flow Chart Diagram of the CCA for the Black Sea region . . . . . . . . . . . . . . . . . . . . . . . . . . . . . . . . . . . . . . . . . . . . . . . . . . . . . . . . . . . . . . . . . . . . . . . . . . . . . . . . . . . . . . . . . . . . . . . . . . . . . . . 44
List of tables
Table 1
Water balance of the Azov Sea (1953-1985), km3/year (average) . . . . . . . . . . . . . . . . . . . . . . . . . . . . . . . . . . . . . . . . . . . . . . . . . . . . . . . . . . . . . . . . . . . . . . . . . . . . . . . . . . . . . . . . . . . . . . . . 11
Table 2
Environmental protection areas in the Danube River Basin countries . . . . . . . . . . . . . . . . . . . . . . . . . . . . . . . . . . . . . . . . . . . . . . . . . . . . . . . . . . . . . . . . . . . . . . . . . . . . . . . . . . . . . . . . . . . 13
Table 3
Annual precipitation in selected Danube River Basin countries . . . . . . . . . . . . . . . . . . . . . . . . . . . . . . . . . . . . . . . . . . . . . . . . . . . . . . . . . . . . . . . . . . . . . . . . . . . . . . . . . . . . . . . . . . . . . . . . . 13
Table 4
The major Dnipro tributaries . . . . . . . . . . . . . . . . . . . . . . . . . . . . . . . . . . . . . . . . . . . . . . . . . . . . . . . . . . . . . . . . . . . . . . . . . . . . . . . . . . . . . . . . . . . . . . . . . . . . . . . . . . . . . . . . . . . . . . . . . . . . . . . . . . . 13
Table 5
Economic characteristics of the countries in the Dnipro Basin (1998-2000) . . . . . . . . . . . . . . . . . . . . . . . . . . . . . . . . . . . . . . . . . . . . . . . . . . . . . . . . . . . . . . . . . . . . . . . . . . . . . . . . . . . . . . 14
Table 6
Industrial production output of the Ukrainian part of the Dnipro Basin . . . . . . . . . . . . . . . . . . . . . . . . . . . . . . . . . . . . . . . . . . . . . . . . . . . . . . . . . . . . . . . . . . . . . . . . . . . . . . . . . . . . . . . . . 14
Table 7
Surface waters. . . . . . . . . . . . . . . . . . . . . . . . . . . . . . . . . . . . . . . . . . . . . . . . . . . . . . . . . . . . . . . . . . . . . . . . . . . . . . . . . . . . . . . . . . . . . . . . . . . . . . . . . . . . . . . . . . . . . . . . . . . . . . . . . . . . . . . . . . . . . . . . . . 14
Table 8
Groundwater (usable reserves) . . . . . . . . . . . . . . . . . . . . . . . . . . . . . . . . . . . . . . . . . . . . . . . . . . . . . . . . . . . . . . . . . . . . . . . . . . . . . . . . . . . . . . . . . . . . . . . . . . . . . . . . . . . . . . . . . . . . . . . . . . . . . . . . . 15
Table 9
Population characteristics. . . . . . . . . . . . . . . . . . . . . . . . . . . . . . . . . . . . . . . . . . . . . . . . . . . . . . . . . . . . . . . . . . . . . . . . . . . . . . . . . . . . . . . . . . . . . . . . . . . . . . . . . . . . . . . . . . . . . . . . . . . . . . . . . . . . . . 15
Table 10
River network of the Don Basin . . . . . . . . . . . . . . . . . . . . . . . . . . . . . . . . . . . . . . . . . . . . . . . . . . . . . . . . . . . . . . . . . . . . . . . . . . . . . . . . . . . . . . . . . . . . . . . . . . . . . . . . . . . . . . . . . . . . . . . . . . . . . . . . . 15
Table 11
Dominant industries in the littoral countries. . . . . . . . . . . . . . . . . . . . . . . . . . . . . . . . . . . . . . . . . . . . . . . . . . . . . . . . . . . . . . . . . . . . . . . . . . . . . . . . . . . . . . . . . . . . . . . . . . . . . . . . . . . . . . . . . . . . 17
Table 12
Black Sea population per riparian country . . . . . . . . . . . . . . . . . . . . . . . . . . . . . . . . . . . . . . . . . . . . . . . . . . . . . . . . . . . . . . . . . . . . . . . . . . . . . . . . . . . . . . . . . . . . . . . . . . . . . . . . . . . . . . . . . . . . 18
Table 13
Usage of water resources in some of the Black Sea Basin countries, 1999. . . . . . . . . . . . . . . . . . . . . . . . . . . . . . . . . . . . . . . . . . . . . . . . . . . . . . . . . . . . . . . . . . . . . . . . . . . . . . . . . . . . . . . . 19
Table 14
Water withdrawal by population connected to central water supply systems in the Danube River Basin . . . . . . . . . . . . . . . . . . . . . . . . . . . . . . . . . . . . . . . . . . . . . . . . . . . . . . . . 21
Table 15
Range of water supply and wastewater treatment tariffs in the Danube countries . . . . . . . . . . . . . . . . . . . . . . . . . . . . . . . . . . . . . . . . . . . . . . . . . . . . . . . . . . . . . . . . . . . . . . . . . . . . . 22
Table 16
Total annual freshwater consumption in the Dnipro Basin (2000). . . . . . . . . . . . . . . . . . . . . . . . . . . . . . . . . . . . . . . . . . . . . . . . . . . . . . . . . . . . . . . . . . . . . . . . . . . . . . . . . . . . . . . . . . . . . . 22
Table 17
Major diversion channels in the Ukrainian part of the Dnipro Basin. . . . . . . . . . . . . . . . . . . . . . . . . . . . . . . . . . . . . . . . . . . . . . . . . . . . . . . . . . . . . . . . . . . . . . . . . . . . . . . . . . . . . . . . . . . . 23
Table 18
The main reservoirs of the Don River. . . . . . . . . . . . . . . . . . . . . . . . . . . . . . . . . . . . . . . . . . . . . . . . . . . . . . . . . . . . . . . . . . . . . . . . . . . . . . . . . . . . . . . . . . . . . . . . . . . . . . . . . . . . . . . . . . . . . . . . . . . 23
Table 19
Water-borne diseases in the Danube River Basin. . . . . . . . . . . . . . . . . . . . . . . . . . . . . . . . . . . . . . . . . . . . . . . . . . . . . . . . . . . . . . . . . . . . . . . . . . . . . . . . . . . . . . . . . . . . . . . . . . . . . . . . . . . . . . . 23
Table 20
Percentage of cases of contagious diseases attributed to microbiological pollution. . . . . . . . . . . . . . . . . . . . . . . . . . . . . . . . . . . . . . . . . . . . . . . . . . . . . . . . . . . . . . . . . . . . . . . . . . . . 24
Table 21
Increase in phytoplankton blooms. Phytoplankton concentration in the northwestern Black Sea . . . . . . . . . . . . . . . . . . . . . . . . . . . . . . . . . . . . . . . . . . . . . . . . . . . . . . . . . . . . . 29
Table 22
Variation in the levels of organics in the Sea of Azov (The Taganrog Bay), mg/m3 . . . . . . . . . . . . . . . . . . . . . . . . . . . . . . . . . . . . . . . . . . . . . . . . . . . . . . . . . . . . . . . . . . . . . . . . . . . . . . 32
Table 23
Current status of surface waters in Ukraine (extract) . . . . . . . . . . . . . . . . . . . . . . . . . . . . . . . . . . . . . . . . . . . . . . . . . . . . . . . . . . . . . . . . . . . . . . . . . . . . . . . . . . . . . . . . . . . . . . . . . . . . . . . . . . 33
Table 24
Shallow-water sections in the Dnipro reservoirs . . . . . . . . . . . . . . . . . . . . . . . . . . . . . . . . . . . . . . . . . . . . . . . . . . . . . . . . . . . . . . . . . . . . . . . . . . . . . . . . . . . . . . . . . . . . . . . . . . . . . . . . . . . . . . . 34
Table 25
The scenario trophic levels of the Black Sea main river basins . . . . . . . . . . . . . . . . . . . . . . . . . . . . . . . . . . . . . . . . . . . . . . . . . . . . . . . . . . . . . . . . . . . . . . . . . . . . . . . . . . . . . . . . . . . . . . . . . . 35
Table 26
Saaty's fundamental scale . . . . . . . . . . . . . . . . . . . . . . . . . . . . . . . . . . . . . . . . . . . . . . . . . . . . . . . . . . . . . . . . . . . . . . . . . . . . . . . . . . . . . . . . . . . . . . . . . . . . . . . . . . . . . . . . . . . . . . . . . . . . . . . . . . . . 38
Table 27
Environmental Impacts of Eutrophication of the Black Sea basin . . . . . . . . . . . . . . . . . . . . . . . . . . . . . . . . . . . . . . . . . . . . . . . . . . . . . . . . . . . . . . . . . . . . . . . . . . . . . . . . . . . . . . . . . . . . . . 38
Table 28
Environmental Impacts of Eutrophication of the Azov Sea basin. . . . . . . . . . . . . . . . . . . . . . . . . . . . . . . . . . . . . . . . . . . . . . . . . . . . . . . . . . . . . . . . . . . . . . . . . . . . . . . . . . . . . . . . . . . . . . . 38
Table 29
Socio-Economic Impacts of Eutrophication of the Black Sea basin . . . . . . . . . . . . . . . . . . . . . . . . . . . . . . . . . . . . . . . . . . . . . . . . . . . . . . . . . . . . . . . . . . . . . . . . . . . . . . . . . . . . . . . . . . . . . 39
Table 30
Socio-Economic Impacts of Eutrophication of the Azov Sea basin . . . . . . . . . . . . . . . . . . . . . . . . . . . . . . . . . . . . . . . . . . . . . . . . . . . . . . . . . . . . . . . . . . . . . . . . . . . . . . . . . . . . . . . . . . . . . 39
Table 31
The Estimated Input of Total Nitrogen into the Black Sea. . . . . . . . . . . . . . . . . . . . . . . . . . . . . . . . . . . . . . . . . . . . . . . . . . . . . . . . . . . . . . . . . . . . . . . . . . . . . . . . . . . . . . . . . . . . . . . . . . . . . . . 41
Table 32
The Estimated Input of Total Phosphorus to the Black Sea . . . . . . . . . . . . . . . . . . . . . . . . . . . . . . . . . . . . . . . . . . . . . . . . . . . . . . . . . . . . . . . . . . . . . . . . . . . . . . . . . . . . . . . . . . . . . . . . . . . . . 41
Table 33
Emission of nitrogen oxides from the stationary sources in Ukraine . . . . . . . . . . . . . . . . . . . . . . . . . . . . . . . . . . . . . . . . . . . . . . . . . . . . . . . . . . . . . . . . . . . . . . . . . . . . . . . . . . . . . . . . . . . . 42
Table 34
Immediate Causes of Eutrophication . . . . . . . . . . . . . . . . . . . . . . . . . . . . . . . . . . . . . . . . . . . . . . . . . . . . . . . . . . . . . . . . . . . . . . . . . . . . . . . . . . . . . . . . . . . . . . . . . . . . . . . . . . . . . . . . . . . . . . . . . . 42
Preface
This report presents the results of the eutrophication impact assessment
Sea marine regions, as well as the river basins of the main tributaries,
for the Black Sea river basins and coastal area. The assessment was
namely the Danube, Dnipro and Don. The land-based pollution and its
carried out by the United Nations Environment Programme (UNEP)/
main sectoral causes are analyzed by river basins and marine regions,
Global International Waters Assessment (GIWA), with an agreement with
as well as by country. This report describes in brief the major trends in
the GEF-UNDP Black Sea Ecosystem Recovery Project (BSERP), a Global
the region with respect to eutrophication.
Environment Facility (GEF) project implemented by the United Nations
Development Programme (UNDP).
Further, this report includes an assessment of the legal and institutional
framework currently in place that is relevant to the environmental
This report provides supporting information to facilitate the assessment
situation in the Black Sea region. As a part of the GIWA assessment, an
of environmental and socio-economic impacts of eutrophication and
additional report has been prepared regarding applicability of the EU
to analyze the causes behind eutrophication. Provided in this report
Water Framework Directive in the Black Sea region.
is an assessment of the state of eutrophication in the Azov and Black
Dag Daler
Scientifi c Director, UNEP-GIWA
PREFACE
7
Executive summary
The Black Sea is one of the world's largest inland seas. The catchment area
states (Danube catchment area). During the same timeframe, the nutrient
of the Black Sea covers entirely or partially 23 countries; six countries are
loading also decreased in the Dnipro and Don catchment areas due to
located in its coastal zone and 17 countries are closely linked with the sea
economic recession and the collapse of the USSR, and as consequence,
via the largest European rivers that fl ow into the sea. Approximately 110
the reduction of agricultural activities in the Newly Independent States.
million people live in the Black Sea Basin, and up to ten million tourists
visit the region annually.
As for the future, this decreasing trend in nutrient pollution will continue
in the Danube region as a result of the implementation of the European
The Black Sea is one of the most important European seas; it contributes
Union's (EU) environmental policies. In the catchment areas of the Dnipro
signifi cantly to the regional economy as a source of fi sheries, tourism
and Don Rivers, however, nutrient loading is expected to increase as a
business, oil production and transport. For people living around the Black
result of the development of the agriculture sectors of Ukraine, Russia
Sea, the sea is part of their home. It remains a place of natural beauty.
and Byelorussia.
The Black Sea is vulnerable to pressure from land-based pollution from its
As a result, the northwestern part of the Black Sea, the Azov Sea and
catchment area that causes the degradation of the sea's aquatic ecosystem
the lower parts of the Danube, Dnipro and Don Rivers will reach the
through eutrophication. Similar processes are taking place in the Azov Sea,
maximal level of eutrophication, or very close to it. This process will
as well as in the rivers fl owing into both seas: Danube, Dnipro and Don.
increase signifi cantly in the future for the Dnipro River, the Don River, for
Eutrophication of the sea and the rivers has harmful environmental, socio-
the Azov Sea and for the southwestern part of the Black Sea. This signifi es
economic and human health impacts, causing the death of animals and
that eff orts for rehabilitation of the Black Sea aquatic ecosystem should
fi sh, degrading waters used for both drinking and irrigation, impacting
be strengthened, and national and international fi nancing should be
recreation, among others. Annual economic losses for the Black Sea from
allocated to implement measures to decrease eutrophication in order to
environmental problems were estimated to be approximately 500 million
avoid the loss of this unique aquatic ecosystem.
USD in only the fi shery and tourism industries.
Root causes of eutrophication in the Black Sea Basin have been
The immediate cause of eutrophication is an overabundance of
identifi ed as legal and institutional causes, lack of knowledge, absence
nutrients originating primarily from agriculture and municipal sewage:
of implementation of the best environmental technologies and low
approximately 80% from agriculture, 15% from urban water and 5% from
economic incentives to address long-term environmental problems.
other sources.
Decentralisation has often taken place before the establishment of a
clear legal framework and the development of institutional capacity
The nutrient input into the Danube, Dnipro and Don Rivers increased
for environmental management at the regional level. Public authorities
by approximately 10 times from the 1960s until the 1990s as fertilizer
across the region point out insuffi
cient funds as the principal reason
usage was drastically extended in the agricultural sector of the European
for their inability to carry out the needed management reforms and
countries. During the last decade of the 20th century, nutrient pollution
infrastructure development. The lack of practical knowledge and skills
in the Black Sea region decreased slightly due to implementation of best
in water resources management has been placed at the same level of
environmental practices in the agricultural sector in the EU member
importance as the lack of adequate fi nances.
8
EUTROPHICATION IN THE BLACK SEA REGION IMPACT ASSESSMENT AND CAUSAL CHAIN ANALYSIS
Regional defi nition
Geographical boundaries
Herzegovina, Croatia, the Czech Republic, Germany, Hungary, Italy,
Macedonia, Moldova, Montenegro, Poland, Slovakia, Serbia, Slovenia
The catchment area of the Black Sea is over 2 million km2, entirely or
and Switzerland. The Black Sea is bordered by the Ukraine to the
partially covering 23 countries. These include six littoral states (Bulgaria,
north, Russia to the northeast, Georgia to the east, Turkey to the south,
Georgia, Romania, the Russian Federation, Turkey and Ukraine) that
and Bulgaria and Romania to the west. The Black Sea catchment area
were the primary focus of this study, and 17 states in the catchment
comprises the Black Sea, the Azov Sea and three main river basins: the
area, whose impacts were mainly studied through their eff ects on the
Danube, the Dnipro and the Don (Figure 1).
discharge from the major rivers: Albania, Austria, Belarus, Bosnia and
r
o
Minsk
i
p
n
D
Do
Belarus
Germany
n
Poland
Pripyat'
Russia
Czech Republic
Kh
a
op
esn
D
er
Danube
Kiev Dn
Munich
ipr
Kharkiv
o
Dn
Vienna
Slovakia
iest
Seve
Volga
Switzerland
er
Yu
rskiy
-D
zh
Ukraine
Don
D
on
Austria
Ca
Pru
n
ets
i
na
t
ny
pr
l
y B
o
T
Donets'k
Dr
isa
ug
Dnipropetrovs'k
ava
Budapest
Hungary
Slovenia
Rostov-on-Don
s
za
Moldova
Ti
Odesa
Croatia
Dnipro
s
a
Ti
Sava
Romania
Kuban'
Bosnia &
Urup
V
Herzegovina Belgrade elik
Bucharest
a
Elevation/Depth (m)
M
Serbia & orava
4 000
Montenegro Sofiya Bulgaria
2 000
Georgia
1 000
500
Istanbul
100
zil
Ki
0
Ankara
-50
Turkey
-200
-1 000
-2 000
0
500 Kilometres
© GIWA 2004
Figure 1
General map of the region, elevations are based on USGS 2002
REGIONAL DEFINITION
9
Physical characteristics of the
plateau territories (basins of Dnipro and Don, except separate plots;
region
middle and lower fl ow of the Danube; Black Sea and Rion Lowlands).
The second part is composed of geologically open territories of
Black Sea
eminences, lowlands and mountains (the remainder of the watershed),
The surface area of the Black Sea is 423,000 km2. The sea's greatest width
containing archaic ores of the Proterozoic era (gneisses, granites), the
is 1,200 km, it contains a total volume of 547,000 km3 of water and has
Paleozoic era (sandstone, quartz, shale, limestone, marble) and the
a maximum depth of 2,212 m. The Black Sea shoreline is approximately
Mezozoic era (of approximately the same composition) which have
4,340 km long (the Bulgarian coastline is 300 km; the Georgian coastline
inclusions and coverings of magmatic and erupted ores (basalt,
is 310 km; the Romanian coastline is 225 km; the Russian coastline is
diabase). The composition of mountain ores forms a complex
475 km; the Turkish coastline is 1,400 km and the Ukrainian coastline is
geochemical environment, which infl uences the ion composition of
1,630 km). The major rivers fl owing into the Black Sea and their basins
the surfacewater drainage. In the regions of mass development of
are shown on the map below (Figure 2).
limestone, karst signifi cantly infl uences the surfacewater drainage
(Dinarian and Crimean Mountains, Volyn Podol Eminence).
The seafl oor is divided into the shelf, the continental slope and the
deep-sea depression. The shelf occupies a large area only in the
Climate
northwestern region of the Black Sea, where it is over 200 km wide
A major part of the Black Sea watershed territory is located in the humid
with a depth of less than 200 m. In other parts of the sea, the shelf has
moderate climate zone. Only the eastern and southeastern parts are
a width of 2.2 to 15 km; near the Caucasian and Anatolian coasts the
characterised by a sub-arid moderate climate. A subtropical climate is
shelf is only a narrow strip.
characteristic for the Black Sea coasts of the Caucasus, Anatolia and
the southern Crimea. An area of the watershed to the west of the
The center of the Black Sea depression consists of a deep-water basin
Carpathians has a moderate humid climate of the middle-European
with a depth of 2,000-2,200 m. Salinity of the Black Sea diff ers strongly
type (regular quantity of rainfall with a slight increase in the mid
dimensionally. The presence of a hydrogen sulfi de (anoxic) zone starting
summer and opposite movement of relative air humidity), including a
from a depth of 100-200 m is a signifi cant feature of the Black Sea.
moderate contrast of clearly diff erentiated seasons and slight episodic
Hypoxia phenomena in shallow otherwise oxic habitats have developed
snow covering in winter. The eastern part of the European watershed of
during recent decades in the surface layer of the Black Sea (22).
the Black Sea has a continental climate with a decreasing temperature
the further east one moves. In summer, the humidity defi cit leads to
Geological structure
the increase of evaporation and corresponding change of the structure
The watershed of the Black Sea is divided into two nearly equal parts
of the water balance. In the subtropical region of the watershed, one
according to surface characteristics. The fi rst part is composed of
can observe the Mediterranean type of weather regime where
closed territories where friable deposits of the Cenozoic age refl ect the
maximum rainfall occurs in winter, the average monthly temperature
conditions of the newest geological history. They are characteristic for
does not decrease to 0įC, and the movement of humidity follows the
temperature (Black Sea of the Caucasus) or keeps the opposite to the
temperature movement (e.g. the southern Crimea and Istanbul). The
high mountains, such as the Alps and Caucasus, have a high mountain
type of climate.
Dnipro
Don
Dniester
In the Bosporus area (Turkish coast), the average winter temperature
varies from 0 to 5įC. During the hot and wet summers, the average
Danube
ambient air temperature is 24-25įC and the absolute maximum of
40įC is reached in July-August. Higher temperatures are caused by
winds coming from the coastal mountains. In the Varna area (Bulgarian
coast), the average air temperature in winter is 0-3įC, while the average
Sakarya Kizil
summer temperature is relatively high, reaching 22-23įC in July and
©©GIWA©
2004
August. In the northwestern part of the Black Sea Basin (Ukrainian coast),
Figure 2
Sub-basin map of the Black Sea.
the average January temperature is -3-5įC (in the Odessa area), and the
10
EUTROPHICATION IN THE BLACK SEA REGION IMPACT ASSESSMENT AND CAUSAL CHAIN ANALYSIS
average July temperature is 19-20įC. In the southern Crimean coast,
Table 1
Water balance of the Azov Sea (1953-1985), km3/year
the average temperature in January is 0-8įC, and the average summer
(average)
temperature (July-August) is 23-24įC.
Mean value
Coefficient of variation
River discharge
35.7
0.24
The precipitation pattern is also highly variable throughout the region.
Including: Don
21.5
0.31
Precipitation is abundant on the eastern and southern coasts, and
Kuban
12.0
0.25
is lowest on the northern and western coasts. The total amount of
precipitation in the area from the Bosporus area to the Varna area is
total fl ow), with the remaining infl ow coming from more than 20 small
500-700 mm per year. The north near Odessa receives approximately
rivers (Table 1). Both the seasonal variations and the yearly variations of
300-400 mm per year, and the southern coast of Crimea (Yalta),
freshwater runoff are high, causing frequent shortages of freshwater
586 mm per year. Annual precipitation signifi cantly increases to the
in the region.
east: 1,600 mm between Novorossiysk and Sukhumi, and 2,465 mm
in Batumi. On the Anatolian coast (Turkey), annual precipitation is
Geological structure
signifi cantly lower (875 mm per year in Trabzon).
Like the northwestern shelf of the Black Sea, the Azov Sea is situated
in an area of moderate tectonic subsidence along the southern edge
Biodiversity
of the Russian platform and bordering the Skiff platform. The southern
Given the complexity and heterogeneity of the biotopes in the Black Sea
part of the sea hollow is located within the area of active submontane
Basin, only marine biodiversity is discussed in this section for purposes
troughs of the Alpine zone.
of brevity. Approximately 160 species of fi sh of varying origin make up
the ichthyofauna of the Black and Azov Seas. Black Sea ichthyofauna
The areas of bars of the so-called "Azov type" form bays, each of which
and other invertebrate species consist of marine fi sh species originating
has its specifi c features of bottom morphology, and which together
from the Mediterranean Sea (about 60 %). Ichthyofauna also includes
represent a range of geomorphologic areas. The major source of
the freshwater fi sh species (more than 20 %) and pontocaspian relicts
sedimentary material into the Azov Sea is the transport of suspended
(about 16 species). It is diffi
cult to state the total number of species in
and dissolved substances with the runoff of the Don and Kuban Rivers
the Black Sea. According to Zaitsev & Mamaev (1997), however, a total
(more than 19 million tonnes), abrasion of the shores (about 17 million
of 3,774 species have been identifi ed.
tonnes) and bottom abrasion (more than 11 million tonnes). The
total entry of sedimentary material into the Azov Sea reaches up to
Azov Sea
52 million tonnes/year.
The Azov Sea is a shallow (maximum depth of 9 m) inland sea on the
northern Black Sea. From a hydrological point of view, the Azov Sea is a
Climate
bay (lagoon) of the Black Sea, and therefore it could be considered to be
The climate of the Azov Sea as a whole is temperate-continental.
a part of the Black Sea. Its maximum width and length are approximately
The winters are relatively cold with thawing and cloudy periods,
150 km and 300 km, respectively, with a surface area of 35,000 km2.
and the summers are mainly dry and hot. Atmospheric circulation
The total area of the drainage basin is approximately 570,000 km2. The
plays an important role in the climate-forming process, transporting
average natural fl ow of freshwater into the Azov Sea is 43 km3 per year,
marine air masses into the region from the Atlantic and Arctic Seas
with large yearly fl uctuations ranging between 30-50 km3.
and continental air masses from Eurasia. The autumn-winter period
is infl uenced by the spur of the Siberian anticyclone and the spur
The water exchange with the Black Sea is mainly wind driven and
of the Azores high infl uences the spring-summer period. With the
can only take place through the narrow Kerch Strait. The estimated
Siberian anticyclone, northeast and east winds with an average speed
residence time is between 10-20 years, which is much shorter than
of 4-7 m/sec dominate. The frequency of strong gale-strength winds
that of the Black Sea. The quality of the Azov Sea water system is very
increases, which is accompanied by an abrupt fall in temperature. For
much dependent upon the quantity and quality of the freshwater
example, in January, when the air temperature ranges from ≠2 to ≠50įC,
runoff from its drainage basin. The main river infl uencing the sea is
the Siberian anticyclone may cause the temperature to drop to -25įC
the Don (Severskiy Donetz, the Don's tributary, is the most polluted
or below. With the Azores high, calm, cloudless and warm weather
river in Europe), with an average natural fl ow of 28 km3 (65% of total
dominates. The average temperature in July is 23-25įC. The maximum
fl ow) per year. The Kuban contributes approximately 12 km3 (28% of
temperature (up to 43įC) occurs in July-August.
REGIONAL DEFINITION
11
The Taganrog Bay is the large part of the Azov Sea where algae blooms
regions, brown earths on weathered solid rocks are widely distributed.
typically begin. Due to plenty of solar radiation, the Taganrog Bay
Grey-brown podsolised soils are often found between 300 and
water has a high average annual temperature (11.2įC). In July-August,
1,000 m, especially around the Carpathians. The Pannonian inner basin
the water temperature reaches 24-25įC and may exceed 30įC near the
is a mixture of loess chernosems (black earth), meadow chernosems
coast. In winter, the water temperature is close to the freezing point.
and various brown-earths. At the eastern banks of the middle Tisza in
Ice phases are notable for high spatial and temporal variability. The
Hungary, wide areas of solonetzs (alkaline soil) are found. Ribbons of
earliest appearance of ice in the Taganrog Bay is registered at the end
grey alluvial soils are found along all middle and lower parts of rivers
of October and the ice cover reaches its maximum thickness (40-50 cm)
in the basin.
at the end of February or beginning of March on average.
Biodiversity
Danube and river basin
As the Danube River Basin has a broad variety of landscapes, it is
The Danube River rises in the Black Forest mountains of Germany, fl ows
outstandingly rich in biodiversity and is a valuable pool of genetic
about 2,850 km to the Black Sea, drains approximately 817,000 km2 and
resources. It serves as habitat for approximately 100 species of fi sh
includes 300 tributaries (the major ones being the Inn, the Drava, the
(compared to about 227 in Europe as a whole), 180 species of birds
Tisza, the Sava, the Morava and the Prut). The basin covers the territories
and 2000 species of higher plants. The variety increases from the source
of 18 countries: Albania, Austria, Bosnia-Herzegovina, Bulgaria, Croatia,
of the rivers to the delta.
the Czech Republic, Germany, Hungary, Italy, Macedonia, Moldova,
Poland, Romania, Slovakia, Slovenia, Switzerland, Ukraine and Serbia-
Many protected areas have been set aside within the basin (See
Montenegro. Five of these states (Albania, Italy, Macedonia, Poland and
Table 2). Apart from Slovakia, where the portion of protected areas is
Switzerland) have territories in the basin smaller than 2,000 km2. The
high (22% of the national territory) due to the inclusion in the defi nition
Danube water infl ux to the Black Sea is approximately 200 km3/year.
of "protection areas" of "landscape protection areas and buff er zones",
the share of the registered protected areas in the basin varies between
The geography of the Danube River Basin is diverse and includes high
0.5% (Bosnia-Herzegovina) and 14% (Czech Republic) of the national
mountain chains, wide plains, sand dunes, large forested or marshy
territories.
wetlands and, specifi cally, the karst, and the delta. Three sections are
usually distinguished in the basin:
Climate
The upper course, which stretches from its source to the gorge,
The Danube Basin is in general dominated by a continental climate,
called Hungarian Gates, in the Austrian Alps and the western
primarily in the central and eastern regions. The western parts of the
Carpathian Mountains;
upper basin in Germany are infl uenced by the Atlantic climate and the
The middle course, which runs from the Hungarian Gates to the Iron
southwest of the basin by the Mediterranean climate, however. The
Gate Gorge in the southern Romanian Carpathians;
Alps in the west, the Dinaric-Balkan mountain chains in the south and
The lower course, which fl ows from the Iron Gate to the delta-like
the Carpathian bow in the eastern-centre are distinctive morphological
estuary at the Black Sea.
barriers that form climatic regions.
The above-mentioned diff erent physical features aff ect the amount of
The mountain chains receive the highest annual precipitation
water runoff in the three river sections. In the upper Danube, the runoff
(1,000-3,200 mm), while the inner and outer basins (Vienna Basin,
corresponds to that of the Alpine tributaries, where the maximum
Pannonian Basin, Romanian and Prut low plains), the lowlands of the
occurs in June. In the middle basin, the phases last up to four months
Czech Morava and the delta region are dry (350-600 mm per year). The
with two runoff peaks in June and April. Finally, in the lower basin,
higher elevations in the Alps have 50 to 70 days of annual snowfall, while
all Alpine traits disappear completely from the river regime and the
1 to 3 days per year of snowfall are recorded in the plains.
maximum runoff occurs in April.
Dnipro and river basin
Soil structure
The Dnipro River is the third largest in length in Europe (after the Volga
With reference to geological aspects, dominant soils in the higher
and the Danube) and the second-largest river emptying into the Black
Alps are podsolised brown-earths and limestone rendzinas. For the
Sea. It drains an area of 511,000 km2 and has a total length of 2,200 km.
Carpathians and the Yugoslav mountains, except for the highest
The Dnipro River is a transboundary system, with 20% of the river basin
12
EUTROPHICATION IN THE BLACK SEA REGION IMPACT ASSESSMENT AND CAUSAL CHAIN ANALYSIS
Table 2
Environmental protection areas in the Danube River
Table 4
The major Dnipro tributaries
Basin countries
Major Dnipro tributaries
Countries
Reach
Environmental protection areas
Berezina River
Belarus
Upper
Country
Remarks
Share of country
Total area (ha)
territory (%)
Pripyat River
Ukraine, Belarus, Ukraine
Upper
Target: 16-24% protection areas by
Bosnia-Herzegovina*
28 000
0.5
Desna River
Russia, Ukraine
Upper
the year 2025
Psyol River
Russia, Ukraine
Middle
Bulgaria**
138 000
3.0
High number of national parks and
Vorskla River
Russia, Ukraine
Middle
Croatia
/
/
nature reserves
Inhulets River
Ukraine
Lower
Czech Republic**
300 000
14.0
Hungary
804 000
8.6
Climate
Moldova**
49 000
2.2
The eastern part of the European watershed of the Black Sea
Romania**
85 000
0.4
including the Dnipro Basin has a continental climate with a decreasing
Including landscape protection areas
Slovakia*
1 080 000
22.0
and buffer zones
temperature the further east one moves. In summer, the humidity
Slovenia*
140 000
8.0
60 000 ha in the Danube River Basin
defi cit leads to an increase in evaporation and corresponding change
Ukraine
/
/
No data
in the structure of the water balance.
Target: 15% protection areas by the
Yugoslavia**
635 000
7.0
year 2020
Germany**
128 000
2.3
23 major protection areas
Mineral resources
Austria
/
/
No data
The main mineral resources located in the Dnipro Basin in the Republic
* Figures for total country; **Figures for the Danube River Basin part of the country
of Belarus include oil, natural gas, peat, potassium salts, rock salt,
(Source: DPRP, Socio-economic effects of water pollution in the Danube River Basin, 1999)
building stone, ferruginous quartzite and rare-metal deposits.
within the territory of the Russian Federation, 23% in Belarus, and the
largest portion, 57%, in Ukraine.
The basin area in the Russian Federation contains iron-ore deposits,
ferruginous quartzite, low-grade coal and peat, building materials
Administrative and territorial division
(chalk, marl, sand, sandstone, clay and tripoli) and building stone.
The following administrative and territorial divisions are located
within the Dnipro Basin: 30 oblasts, 385 districts, 220 cities/towns, 447
In Ukraine, 4,464 (or 57% of the country's total) mineral resource
townships and 28,020 rural settlements.
deposits are located in the Dnipro Basin; 1,759 of them are exploited.
Key mineral resources include oil, gas, brown coal and coal, peat, iron
Geological structure
ore, manganese ore, titanium/zirconium ore, kaolin, bentonitic clay and
The Dnipro Basin includes structures from the proterozoic eastern
building materials. The Dnipro Basin contains 29.5% of the country's coal
European Platform, overlain by Cenozoic sediments.
reserves, 53% of its oil reserves, 67% of its natural gas reserves, 84% of
its iron ore reserves, 85% of its brown coal reserves, and 100% of its
titanium/zirconium ore reserves.
Table 3
Annual precipitation in selected Danube River Basin
countries
100
Agricultural©
land
Total annual precipitation
Relative annual precipitation
90
Country
Forest©
cover
in 2002 (mm)
in 2002 (%)
80
Built-up©
area
Germany
1 329
113
70
Nature©
reserves©
and©
protected©
areas
60
Inundated©
area
Austria
1 115
109
50
Czech Republic
765
107
%
40
Slovakia
841
110
30
Hungary
567
93
20
10
Slovenia
1 307
93
0
Croatia
685
105
Russian©
Federation
Belarus
Ukraine
Country
Romania
636
98
(Source: ICPDR, Annual report on the activities of the ICPDR in 2002)
Figure 3
Land use in the Dnipro Basin
REGIONAL DEFINITION
13
Land uses
The land resources of the Dnipro Basin have been intensively used
Biological resources
for a number of diff erent purposes (See Figure 3). The area of arable
The Dnipro Basin is a unique Eastern European ecosystem sustaining
land totals 283,000 km2 (55.4%). Forests cover 172,400 km2 (33.8%) and
rich biological diversity and featuring an ecological network with a
wetlands cover an additional 41,900 km2. Urbanised or built-up areas
stable pattern of natural processes (28). The Dnipro Basin has been
make up 18,100 km2 of the basin. The total drained land area is 7.38
recognised as one of the major wetland areas in Europe. It provides a
million ha and the irrigated land area is 2.64 million ha.
habitat for various birds and animals and is a powerful barrier against
fl ooding events and water percolation. It also operates as a major
The Russian part of the Upper Dnipro Basin occupies the central,
carbon sink. Sections of the basin also enjoy international recognition
western and southwestern parts of the Central Russian Upland,
and special protection under the Ramsar Convention. These include
consisting mainly of extensive areas of hills and plains intersected by
the Mid Pripyat State Landscape Zakaznik, the Pripyat River fl oodplain
lowland rivers, gorges and valleys. Soil cover in this part of the basin is
and the Dnipro River Delta.
represented by fertile loamy soils lying in the north, dark-grey and grey
forest soils in the western part of the Central Russian Upland, and very
Biodiversity in the basin consists of over 90 fi sh species (60 of them
fertile black-earth soils in the southwest.
inhabiting the Dnipro River itself), approximately 182 bird species and
over 2,500 plant species.
The Belorussian Polessie, extending into the southern part of Belarus,
consists mainly of lowland wetlands and marshes and represents one
Water resources per capita: Republic of Belarus - 7,580 m3/person; Russian
of the major wetland resources in Europe. Between the mid-1960s and
Federation - 2,640 m3/person; Ukraine - 3,520 m3/person.
1980s, a major land drainage scheme was implemented in this part
of the basin to provide over 2 million hectares of land for agriculture,
Population in the Dnipro Basin: In 2001, the total population in the Dnipro
which has led to a loss of over 50% of the natural wetland area. Currently,
Basin was 32.1 million with an average density of 64 persons/km2.
former peat bog soils in this area are depleted, leading to a continuous
reduction of crop productivity. Land drainage activities have had a
profound impact on the environment, manifested in large-scale soil
erosion, land degradation and a higher susceptibility to fl ooding eff ects
Table 5
Economic characteristics of the countries in the Dnipro
Basin (1998-2000)
resulting in the contamination of water resources.
Real GDP per
Industrial
Country
GDP
GNP growth
Agriculture
capita
output growth
The land resource of the Ukrainian part of the Dnipro Basin is 29.14
Republic of
9,134 million BR
105.8%
2,198 USD
107.8%
-6%
Belarus
million hectares, or 48.6% of the country territory. Of that, 32.8% lies
Russian
68% of the
95.9 billion RR
118%
832 USD
119%
in the Ukrainian Polessie zone, 39.9% in the Forest Steppe zone and
Federation
1990 level
26.6% in the Steppe zone. Generally, the land resources within the
Forest Steppe and Steppe zones have been intensively used for arable
Table 6
Industrial production output of the Ukrainian part of
agriculture, urban and industrial development purposes.
the Dnipro Basin
Industry
Output (%)
Area of protected territories
Energy (electric power)
12.4
The Republic of Belarus has 3,100 km2 of protected areas, or 3.0% of its
Ferrous and non-ferrous metallurgy
32.0
total territory. The Russian Federation has 1,300 km2 (1.3%) and Ukraine
Machine-building and metal fabrication
13.2
has 3,200 km2 (1.1%) of their territories under protection.
Food processing
17.2
The Dnipro Basin sustains rich biodiversity, much of which can be
Table 7 Surface
waters
found within nature reserves and protected areas. There are more than
Internal flow
External inflow
Flow discharge
Hydrographic
Country
(km3/year)
(km3/year)
(km3/year)
network
35 nature reserves and protected areas in the Dnipro Basin occupying
(km)
MAF1
LFY2
MAF
LFY
MAF
LFY
approximately 1.6% (8,100 km2) of the catchment area. Due to severe
Republic of Belarus
16,9
10,7
19,1
9,1
36,0
19,8
45,400
Russian Federation
15,5
10,7
-
-
15,5
10,7
39,500
budgetary constraints, however, an adequate protection regime has not
Ukraine
22,1
9,0
31,9
22,1
52,01
31,14
78,500
been properly maintained in the majority of these areas.
1Mean Annual Flow. 2Low-flow Year (95%)
14
EUTROPHICATION IN THE BLACK SEA REGION IMPACT ASSESSMENT AND CAUSAL CHAIN ANALYSIS
Table 8 Groundwater
(usable
reserves)
its source with its mouth by a factor of 2.5. The general slope of the
Projected reserve
Explored reserve
Groundwater abstraction
Don riverbed is less than 0.0001, which conditions the low speed of
Country
(km3/year)
(km3/year)
(km3/year)
its current.
Republic of Belarus
9.27
1.117
0.687
Russian Federation
2.31
0.681
0.379
The largest tributaries of the Don River are: the Krasivaya Mecha, Bistraya
Ukraine
12.80
n/a
1.027
Sosna and Voronezh in the upper reaches; the Tikhaya Sosna, Bityug,
Total
24.38
n/a
2.093
Khoper, Medveditsa and Ilovlya in the middle course; the Tchir, Tsymla,
Severskiy Donets, Sal, Manych and Tuzlov in the lower course. The
Table 9 Population
characteristics
Population characteristics
Volga-Don navigation canal connects the Don with the Volga.
urban
rural
Country
Population
Life expectancy
total
growth,
(HDI Report,
(2001)
million
million
%
%
At its mouth, the Don forms a delta. The length of the delta on a straight
(persons/year)
2000)
people
people
Republic of
line from its beginning to the Taganrog Bay is approximately 30 km,
6 300 000
4 600 000
73
1 700 000
27
-25 000
68.1
Belarus
and the width between its extreme branches is 23 km. The total area
Russian
3 600 000
2 400 000
66.7
1 200 000
33.3
-35 000
66.7
Federation
of the delta is 340 km2. The delta is densely indented by channels and
Ukraine
22 200 000
14 920 000
67.2
7 280 000
32.8
-222 500
69.1
eriks (lades). An active sea navigation canal passes on a southern large
Total
32 100 000
21 920 000
10 180 000
-
-
branch (Old Don).
Table 10
River network of the Don Basin
The Don and its tributaries are typical plain-steppe and forest-steppe
Tributaries of more
Tributaries of fewer
Coefficient
The name of the
than 10 km in length
than 10 km in length
Catchment
rivers. Their water regime is determined by the features of their feed:
area in
of the river
basin's parts
total length
total length
km2
net density
number
number
conditioned by seasonal effl
uent of thawed snow waters providing a
in km
in km
Don (up to the
high water period during the spring. This snowmelt makes up to 65-70%
473
15 134
1 651
9 906
107 123
0.23
Khoper)
of the total annual discharge. The size of the underground feeding does
Khoper
262
9 112
1 867
6 402
61 120
0.25
Don (between
not exceed 25-30%, and rainfall makes up no more than 3-5% of the
the Khoper and
257
10 551
1 181
7 086
88 700
0,.20
total discharge.
Seversky Donets)
Seversky Donets
453
14 526
2 041
12 246
99 557
0.27
Don (between the
Because the Don's current fl ows from the north to the south, melting of
Seversky Donets
242
8 611
1 451
8 706
86 000
0.20
and the mouth)
the snow cover in the lower part of the basin usually begins earlier than
The whole basin
1 687
57 934
7 391
44 346
442 500
0.23
in its top part. Thus, there are two waves of high water. In 1951, the Don's
current was regulated by a dam that forms the Tsymlyanskoe water
Don and river basin
reservoir. Prior to the dam's construction, the Lower Don experienced
The Don River, with a length of 1,980 km, is the 4th longest river in the
continuous spring fl oods of great strength. Total discharge from March
European part of Russia. It is the third largest river by area of reservoir
through May 2004 at the location of stanitsa Razdorskaya was 7,83 km3,
(422,500 km2) after the Volga and the Dnipro, making it the largest
which is almost at the level of average long-term values between
waterbody in the European part of the CIS. The Don River originates in
1952-2000. This is 2,3 times less than the natural volume prior to the
the northern part of the Central Russian upland, at an elevation of about
building of the dam (measured from 1911-1951), which was 18,4 km3.
180 m above sea level, and runs into the Taganrog Bay of the Azov Sea,
forming a delta of an area up to 340 km2. The long-term average volume
Geology and sediments
of its runoff is 39.5 km3.
The fl at relief of the Don Plain was generated on geological structures
of vastly diff ering ages ≠ the ancient East Europe platform and younger
The basin of the Don and its tributaries is mainly situated on the slightly
Scythian plate. In the upper streams of the rivers (on the Russian Plain),
hilly East-European Plain. Not far from its source, fl owing on the Middle-
the most ancient outcrops are nearly horizontal. The Don passes
Russian Height and Oka-Don lowland, the Don forms numerous bends.
through strata of the Donetsk range, which are raised by orogenic
Farther to the south, the Don River fl ows around many obstacles in
folds. Development of the Don River valley was connected with
the form of changing elevations and other geological structures, thus
numerous changes of the sea level where the modern Black Sea exists.
forcing the river to change the direction of its riverbed four times.
The sea's intersection with the land formed a delta, washing away earlier
Because of this, the Don's real length exceeds the direct line connecting
deposits and leaving them on slopes as ledges of river terraces. During
REGIONAL DEFINITION
15
the period of the lowest sea level, the Don had advanced far in the
tributaries. The vegetation here is characterised by a variety of endemic
western direction, forming the modern Gulf of Taganrog.
and rare species. The fauna of the Don steppes is the major biodiversity
component of the plain, and upon which the health and well-being of
The sequestration of the carbon pool of the Don sediments is
the region's population depends.
distributed rather widely. Bottom carbon in natural exposures is found
southwest of east Donbass and in the Tizlov river basin. Outcrops of
carbon reach the city of Kamensk ≠ where it is excavated. Outcrops
of the top strata of the Cretaceous of the Mesozoic group are widely
Political and socio-economic
distributed in a valley of the rivers Don, Severski Donets, Miyc, Tizlov
characteristics
and Kagalnik.
Political structure
Climate
The Black Sea Basin covers a region characterised by a mixed and
The climate of the Don plate is moderate-continental, with cool and
complicated political history. During the last two decades, the political
sometimes severe winters: cool and damp in the west and more severe
map of the region has undergone a dramatic re-shaping. Currently,
in the east. The evenness of the plane territories, only occasionally
three out of six littoral states that were the primary focus of this study
broken by low rises in elevation and superfi cial downturns, promotes
(Georgia, the Russian Federation and Ukraine) are Newly Independent
quiet development of climatic processes. Continental and tropical air
States (so-called NIS countries) that gained independence after the
masses prevail in autumn periods, bringing warming and rains from
collapse of the Soviet Union in 1992. Since then, the countries have
southern areas. The Asian air masses coming from the deserts of
developed into democratic states with elected parliaments, directly-
Kazakhstan cause hot, dry and dusty weather in the summers, quite
elected presidents as heads of state, and the political structures
often accompanied by dry winds. Sharp drops in temperature, cloudy
necessary to become a modern European State. Two others, Bulgaria
weather with drizzles and fog defi ne the cold season. The average
and Romania, belong to the so-called CEE (Central and Eastern
annual air temperature within the river basin ranges from 3,7į in the
European countries) and are aiming to join the EU in the next decade.
north up to 9,5į in the south.
Turkey, with its unique position as an European-Asian country, has the
ambition to demonstrate the viability of a modern Muslim state with a
The maximum temperature of the year, falling in July, ranges from 33į
market economy and democratic political institutions. The seventeen
in the upper plain up to 43į in its lower reaches. The annual minimum
European states located in the basins of the rivers fl owing into the
temperature, falling in January, has a smaller range in the basin: from≠
Black Sea represent a broad political spectrum of Central, Eastern
40į in the north to≠32į in the south. Because of the vast expanse of the
and Western Europe, with diff erent stages of market economy and
plain, precipitation is distributed non-uniformly. The greatest quantity
democratic development.
of mid-annual precipitation (more than 550 mm) falls in the northwest
region of the upper Don. The extreme east, Privolszskaya heights,
Economic structure
receives up to 350 mm of precipitation. The average wind speed is
The countries belonging to the Black Sea catchment area are
2-5 m/s, with maximum speeds reaching 35-40 m/s. It is important
characterised by varying degrees of economic development, including
to note the climatic infl uence of the artifi cial Tsymlyanskoeo water
great disparities in national GDP in terms of absolute fi gures, per capita
reservoir. The territory adjoining the reservoir has a longer spring,
values, sectoral composition and annual growth (see Annex II).
with 5-6į lower temperatures on the coast. Autumns are longer with
temperatures 3-4į higher than in the adjoining territory.
The most important sectors aff ecting the water environment
are industry and agriculture
Biodiversity
In the immediate area of the Black Sea and in the river basins, virtually
In the Don River Basin, the steppe biotope prevails, forming a strip
every type of heavy industry is represented: oil refi ning, ferrous and
stretching from Moldova and Ukraine to East Mongolia. The faunal
nonferrous metal refi ning, chemicals, pulp and paper production, food
richness results from not only features of the area's genesis, but is also
processing, fi sh meal plants, as well as production of coal, iron ore, and
connected to the variety of ecosystems in the steppe zone. Specifi c
oil and gas (Figure 4).
complexes of plants and animals were developed on Cretaceous
exposures, which are found on the right coast of the Don and its
16
EUTROPHICATION IN THE BLACK SEA REGION IMPACT ASSESSMENT AND CAUSAL CHAIN ANALYSIS
it inevitably leads to runoff of nutrients and agricultural chemicals.
For example, the Russian Federation's Ministry of Natural Resources
found that substantial damage was caused to the Azov Sea by runoff
from rice growing in the Slavyansk district of Krasnodar. The Kuban
River discharges this runoff , which contains considerable amounts of
nutrients and pesticides, into the Black Sea. Although fertilizer use has
decreased in the region in recent years, mineral fertilizer storage and
application is still a serious problem. Inappropriate storage (often in
the open air) and excessive application leads to leaching into rivers and
pollution of groundwater, which can aff ect human health.
The transportation system is well developed in the Black Sea Basin.
Transport on the Danube, Dnipro, Dniester and Don Rivers to the
Black and Azov Seas involves ships of the "river-sea" type. Sea ships
include the ocean ships, such as dry cargo ships, and the tankers for
the transportation of oil products. Water transportation adversely
impacts water quality in the region during normal operations and
represents a serious potential risk during accidents such as spills. Motor
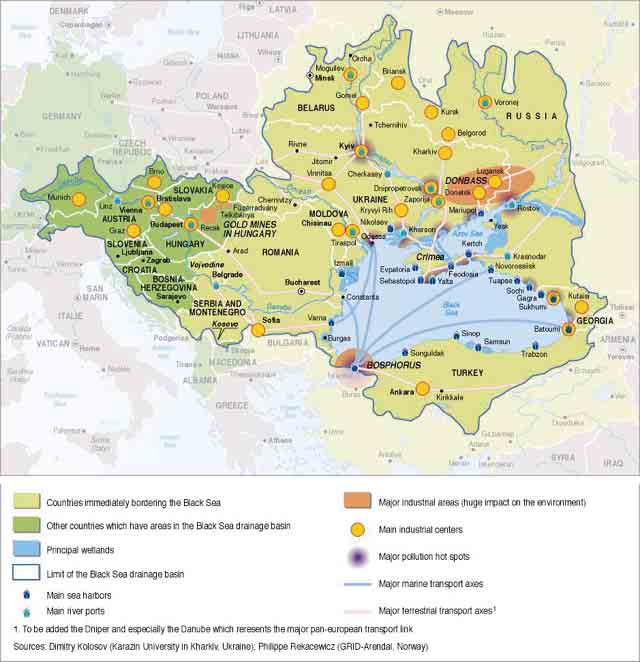
Figure 4
Heavy industry in the Black Sea area.
transport prevails in the western part of the Black Sea Basin where
there is a highly developed road network, while railway transportation
All of the types of industry shown in Table 11 contribute to the heavy
is better developed in the eastern region (Ukraine, Russia and Georgia).
pollution of the Black Sea via wastewater discharge, runoff from waste
The extensive transportation network and intense mobility of the
dumps or air pollution that is then deposited in the waterways by
population and goods in the region aff ects the water quality negatively
rainfall.
through such avenues as spills of oil products on the roadways and the
use of inadequate technologies to treat wastewater coming from the
Dominant industries in the Black Sea Basin countries
industries servicing the transportation network.
All industries are fl ourishing in the Black Sea catchment area, including
water-consuming ferrous and non-ferrous metallurgy (Ukraine,
Population
Bulgaria, etc.); chemical and petrochemical plants (Bulgaria, Romania,
Approximately 162 million people live in the catchment area of the Black
Ukraine, Hungary, Austria, etc.); power plants, some of them nuclear
Sea (Figure 5), with urban residents accounting for more than 60% of the
(all countries, but highest laden are Bulgaria, Romania, Ukraine, Russia,
total population. Many state capitals and other major cities are situated
Hungary and Austria); machine engineering (all countries); and the food
in the basins of the Black Sea rivers. Cities with a population of more
industry (all countries).
than 1 million inhabitants include Budapest, Vienna, Sofi a, Bratislava,
Belgrade, Kyiv, Minsk, Donetsk, Kharkov, Rostov-on-Don and Krasnodar.
Agriculture is a major polluter of the Black Sea of nutrients and, to
The coastal zone of the Black and Azov Seas is heavily populated. Such
a lesser degree, chemicals. Where intensive agriculture is practiced,
signifi cant cities and ports as Istanbul, Varna, Constanza, Odessa,
Sevastopol, Yalta, Kerch, Sochi, Sukhumi, Batumi and others are situated
Table 11
Dominant industries in the littoral countries
here.
Country
Dominant Industry
Bulgaria
Energy, coal industry, metallurgy, chemical industry
The population is unevenly distributed in the countries and sub-basins.
Georgia
Energy
According to the European Commission, the population of the Black Sea
Energy, coal industry, metallurgy, chemical industry, machine-building, oil
Romania
region is about 110 million, with Ukraine, Russia and Romania counting
industry, petroleum refining industry
together for more than 80% of the total (see Table 12). This fi gure
Turkey
Energy, chemical industry
includes the population of Bulgaria and Romania that are part of both
Russian Federation
Energy, coal industry, metallurgy, chemical industry, machine-building
the Black Sea region and of the Danube sub-basin.
Energy, coal industry, metallurgy, chemical industry, machine-building, oil
Ukraine
industry, petroleum refining industry
REGIONAL DEFINITION
17
r
Minsk
e
p
Belarus
ie
Don
Dn
a
ara
ron
Shch
Vo
Germany
Poland
Pripyat'
Kh
na
op
es
e
D
Russia
r
Czech Republic
Kiev
Danube
Kharkiv
Munich
Vienna
Ukraine
Seve
Slovakia
Y
rskiy
u
Don
Switzerland
zh
Dn
ets
Prut
nyy B
iepe
Austria
Tis
r
Donets'k
Dr
Budapest
a
ug
a
Dnipropetrovs'k
va
Dnies
Rostov-on-Don
Hungary
t
er
Slovenia
Moldova
s
za
Ti
eper
Odesa Dni
Ti
Croatia
s
a
Sava
Romania
n'
Kuba
Belgrade
Urup
Bosnia & Herzegovina
Bucharest
Yuzn
Serbia & Montenegro
Italy
a Mo
rava
Sofiya
Georgia
Population density
Bulgaria
(persons/km2)
Albania
<1
Istanbul
1-2
Kizil
3-5
Ankara
6 -10
Turkey
11-100
0
500 Kilometres
>100
© GIWA 2004
Figure 5
Population density in the Black Sea catchment area.
The Black Sea littoral countries, with the exception of Turkey, have
agglomeration situated on both the European and the Asian sides of
experienced decreased production levels and resulting decreased
the Bosporus, and containing a resident population of over 7.3 million
socio-economic parameters, in part causing a decrease in the region's
and a high number of migrants and visitors.
population. For example, between 1996 and 2000, the population of
Ukraine dropped from 52 to 50 million people. Since 1980, the total
Water sector
national population has slightly decreased in Bulgaria and Ukraine,
In terms of the territorial distribution of water resources, the Dnipro
remained stable in Georgia, slightly increased in Romania and Russia,
Basin features two major zones. The fi rst is the fl ow formation zone
and substantially increased in Turkey. Between 2000 and 2015, the
located within the Republic of Belarus and the Russian Federation,
average annual population growth rate is expected to be negative
which is characterised by very low water consumption. The second
in Bulgaria (-0.6%), Georgia (-0.3%), Romania (-0.3%), Russia (-0.5%)
is the fl ow transit zone starting downstream of Kyiv and extending
and Ukraine (-0.6%). Only Turkey is expected to experience a positive
throughout the Ukrainian part of the basin, which has minor side
growth rate (+1.2%). Life expectancy is low compared with developed
Table 12
Black Sea population per riparian country
European countries.
Country
Population
%
Bulgaria
5.5
5
Most coastal territories are densely populated and even over-populated
Romania
23
20.6
during the summer season. According to diff erent estimates based on
Ukraine
47.1
42.2
Turkey
7.8
7
national census statistics, permanent human population distributed
Russia
26.1
23.4
along the Black Sea shores came to 16-20 million in the 1990's, with
Georgia
2
1.8
an extra 4-12 million tourists per year. These data do not cover people
Sub-total for riparian countries
111.5
100
inhabiting the coasts of the Azov and Marmara Seas, however. These
Other countries of the basin
50.5
fi gures also exclude the citizens of Istanbul, the largest Black Sea urban
Total 162
18
EUTROPHICATION IN THE BLACK SEA REGION IMPACT ASSESSMENT AND CAUSAL CHAIN ANALYSIS
fl ow inputs and a high water demand. Water usage in the region is
Table 13
Usage of water resources in some of the Black Sea Basin
countries, 1999.
characterised by the signifi cant amount of dams on the major rivers
(Dnipro, Don, Danube) built for agricultural and urban water supply and
Consumption (million m3)
%
electricity production (Figure 6).
Drinking and household needs
321.8
36
Manufacturing
371.9
40
Water withdrawal, water consumption, wastewater discharge,
Irrigation
2.2
2
wastewater treatment, water tariff s
e
deration
Agricultural water supply
100.0
11
Overview. Water resources are critical and are used for a variety of
F
purposes in the region. The fi rst priority use is of potable water for
Sea water
1.3
1
Russian
drinking and household needs, which receives 15-40% of the total
Other
91.5
10
volume. Irrigation requires 5% to 40% of potable water, depending
Total
888.7
100
on the level of its development. In industrialised areas, manufacturing
Drinking and household needs
3 566
25
consumes 40 -50%, and in agrarian areas up to 10-15%. Pond pisciculture
Manufacturing
7 304
51.1
takes 1-3%, and agricultural water supply an additional 1-3%.
Irrigation
2 327
16.2
e
Russia and Ukraine may be used as a typical example of water usage in
r
a
i
n
Agricultural water supply
641
4.5
Uk
the region (Table 13).
Pond pisciculture
315
2.2
Other
132 1
The Black Sea region is generally well provided with freshwater
Total
14 285
100
resources, including those suitable for drinking water. Heavy pollution
Smolenskoye
pro
ni
D
Do
Germany
Belarus
n
Poland
Pripyat'
Russia
Desna
Czech Republic
Kievskoye
Khoper
Orava
D
Danube
nip
Pechenezhskoye
ro
Liptovska©
Mara
Kanevskoye
Kremenchugskoye
Vo
Dni
Krasnooskol'skoye
lga-D
Dnestrovskoye
o
Slovakia
e
Vihorlat
ster
n
Ukraine
Sev
C
er
ana
s
l
Switzerland
kiy Do
Austria
Yuzhn
nets
Prut
y
Ti
y
Dneprodzerzhinskoye
Krasnopavlovskoye
Dr
sa
Bug
©
a
Kiskoreo
Tsymlyanskoye
va
Hungary
Costesti©Stinca
Karachunovskoye
Dneprovskoye
Proletarskoye
Slovenia
Bicaz
isza
Dnipro
Veselovskoye
T
Romania
Moldova
Croatia
Kakhovskoye
saTi
Valea-Sadului
Sava
'
Djerdap©
1
Vidra-Lotru
Kuban
Sengileyevskoye
Elevation/Depth (m)
Bosnia &
Sasykskoye
Vidraru
U
Herzegovina
r
V
up
elik
Krasnodarskoye
a Mo
Ipotesti
4©0
00
Yalpug-Kugurluy
Bajina-Basta
rav
2©0
00
Serbia & a
Piva
Inguri
Mikhajlovgrad
1©0
00
Montenegro
Vinishha
Georgia
Bulgaria
500
Iskar
100
Altinkaya
Ayvacik
0
Almus©
Baraji
karya
Yesil
Kizil
-50
Sa
Kilickaya
Sariyar
Turkey
-200
Gokcekaya
-1©0
00
-2©0
00
Hirfanli©
Baraji
©GIWA©
2004
Figure 6
Dams in the Black Sea region.
REGIONAL DEFINITION
19
of the rivers, however, has led to a sharp decline in the water resources
The design effi
ciency of such works is suffi
ciently high and meets local
available for the drinking supply and necessitates costly technologies
standards (BODs at outlet - 10-20 mg/l, suspended solids - 10-25 mg/l,
for water treatment. Usage of groundwater for drinking purposes is not
ammoniacal nitrogen 1-5 mg/l).
possible everywhere because of a lack of resources; this particularly
applies to the southern part of the Black Sea region. As a result, the
At the same time, some acute problems exist. The fi rst problem is that
current drinking water supply issue in the region could be characterised
more than 50% of the plants do not meet design effi
ciency standards
as problematic.
due to worn-out equipment as they have been operating for more
than 25 years, investments for updating are not apportioned, and
Wastewater treatment is not suffi
cient in the region; untreated
assets are lacking for acquisition of modern fl occulants. The second
or insuffi
ciently-treated sewage is the main source of pollution
problem is that no structures exist to remove effl
uent far from the shore
from coastal cities and villages. Municipal wastewater contributes
(for instance, 3 miles). Thus, the coastal area of the sea is polluted. The
signifi cantly to the load of organic materials and nutrients, as well as
third problem is the destruction of obsolete sewage networks in the
to the spread of diseases. Microbiological pollution is primarily a local
coastal area, which results in the discharge of impure effl
uent to the sea
problem. Although it is well known that there are, for example, high
(Odessa, Sevastopol, etc.).
concentrations of E. coli in coastal waters, there are few published data
on microbiological pathogens (disease-causing microorganisms) in the
Municipal and corporate sewage works in the water catchment area
Black Sea region. One reason for this is that in the cases where there are
outside the coastal zone can be characterised as follows. The large
data, they are often considered confi dential. There are many reports on
cities of Bulgaria, Georgia, Russia, Romania and Ukraine mostly have
water-related epidemics, however.
full biological treatment works, which in general operate with a
suffi
cient effi
ciency. Thus, in Ukraine, the largest and most populated
The Russian coast of the Black Sea is typical in the region in its
country of the Black Sea Basin, sewage works of cities with more
inadequate wastewater treatment. The population of approximately
than 1 million inhabitants (Kyiv, Kharkiv, Donetsk, Dnipropetrivsk,
14.5 million increases by roughly 15 percent in the summer. At present,
etc.) operate quite effi
ciently. The most urgent problem of Black Sea
wastewater treatment plants in most of the 175 towns in the area do not
countries is the necessity to completely update sewage works due to
function adequately. In some towns, there is no wastewater treatment
worn-out equipment. An example of such an update is the Zaporizhya
at all. Only 14% of all wastewater undergoes full biological processing
(population 890 000) sewage update project being carried out using
and is treated so that it meets the established standards. Some major
EBRD credit.
cities such as Sochi, Krasnodar, Rostov-on-Don and Taganrog cannot
meet the standards because of plant overloads, low effi
ciency, physical
EC countries adjacent to the Danube have recently fi nished construction
wear and violation of regulations for industrial wastewater discharge
of a large number of full biological treatment works according to EC
into the municipal sewerage system.
directives, which guarantees an optimal level of purifi cation for the
next 10-15 years.
Similar problems exist in virtually all coastal cities around the Black Sea.
Wastewater from Odessa, Ukraine (1.2 million inhabitants) goes almost
Danube Basin
untreated into the sea. In no city along the Turkish Black Sea coast is
Most data available on the water sector in the Black Sea Basin refer to
there any treatment of wastewater. As a result, the quality of drinking
the Danube Basin as it is the most studied part of the region in terms
water is in many cases compromised by contamination from polluted
of water management. Table 14 covers domestic freshwater withdrawal
wastewater. Construction of sewage treatment plants for several Turkish
by population connected to water supply systems in the Danube River
cities including Istanbul is continuing, however.
Basin (usually including withdrawal by private households and by the
commercial, institutional and tourist sectors). It must be underlined
The large and medium-size sewage treatment plants currently operating
that part of the population of the Danube countries is still supplied by
in the the Black and Azov Sea region primarily belong to municipal
alternative water sources such as dug wells, pipe wells, rain water tanks,
authorities of the littoral countries, with the exception of large works
etc. In particular, only 29% of the Moldovan population in 1995 and
at Mariupol steel works, Krasnoperekopsk chemical complex, etc. These
45% of the Yugoslavian population in 1991 were connected to central
works have a standard full biological purifi cation process. They treat
water supply systems. The highest per capita withdrawals are recorded
over 95% of household and industrial effl
uent fed to municipal works.
in Bulgaria and Romania (mainly due to breakdowns in water supply
20
EUTROPHICATION IN THE BLACK SEA REGION IMPACT ASSESSMENT AND CAUSAL CHAIN ANALYSIS
networks, lack of water metering, water losses and water wastage),
10©000
while the lowest are recorded in Ukraine and Moldova.
9©000
8©000
Regarding domestic wastewater generation, there is a principal
7©000
diff erentiation between populations using individual wastewater
6©000
solutions (e.g. septic tanks) and populations connected to central
5©000
Mln mc/a
sewerage systems.
4©000
3©000
According to the available data, the share of population in the basin
2©000
using individual systems for wastewater collection treatment and
1©000
discharges varies between 11% (Germany) and 87% (Moldova). In six
0
Bulgaria
Cr
Republic
Cz
Hungar
Mo
Romania
Slo
Slo
FR
Germ
Au
oatia
ech©
ld
v
v
Y
s
t
countries, more than 50% of the population uses some kind of individual
o
ak
enia
an
r
i
a
y
v
ia
a
y
solution; in the rural areas of some countries this share is higher than
Country
95%. The main problem of the individual wastewater solutions is that
Figure 7
Total national water abstraction from the Danube River
the privately owned facilities are often not properly maintained and,
Basin
therefore, constitute a permanent or periodically relevant hazard of
soil and groundwater contamination. Another general problem is that
The aggregate wastewater generation is anticipated to increase to
there are usually no appropriate methods and facilities for adequate
about 3,900 million m3 per year by 2020, which is about 56% higher
disposal of sludge from septic tanks. The aggregated annual wastewater
than the present wastewater generation.
generation by the population in the basin using individual systems is
unknown.
The extent and the standard of wastewater treatment greatly diff er
from country to country. According to the fi gures provided by National
According to the fi gures provided by National Review Reports (1998)
Review Reports (1998), the share of wastewater discharged without any
to the International Commission for the Protection of the Danube
treatment ranges from 0% (Germany) to 86% (FRY). From this point of
River (ICPDR), the aggregated annual wastewater generation by the
view, the Danube countries can be categorised as follows:
population in the basin connected to central sewerage systems is on
Germany, Austria, Slovakia and the Czech Republic: less than 10%
the order of 2,500 million m3. The per capita wastewater generation
of non-treated wastewater discharge;
varies between 80 l/c/day (Czech Republic) and 202 l/c/day (Slovakia).
Hungary, Moldova: between 10 and 20% of non-treated wastewater
discharge;
Table 14
Water withdrawal by population connected to central
Romania, Ukraine, Bulgaria and Slovenia: between 30 and 40% of
water supply systems in the Danube River Basin
non-treated wastewater discharge;
Total
Per capita
Population
Range of losses
Croatia, Bosnia-Herzegovina, FRY: more than 80% of non-treated
State
Year
withdrawal
withdrawal connected to central
(%)
(Mln m3/a)
(l/c/d)
systems (%)
wastewater discharge.
Bosnia and
1997
153
250
57
40
Herzegovina
Bulgaria
1996
622
439
98
43
The range of water and wastewater tariff s for population and industry in
Croatia
1997
184
254
62
35
the Danube countries is illustrated by Table 15. Water tariff is the price a
Czech Republic
1995
201
248
80
26
customer connected to a central water supply system has to pay to the
Hungary
1996
546
147
96
27
water utility for one m3 of water consumed. Wastewater tariff is defi ned
Moldova
1995
21
177
29
20
as the price a customer connected to a central sewerage system has to
Romania
1996
2 062
409
61
22
pay to the utility for the discharge of one m3 of wastewater.
Slovakia
1997
361
245
78
23
Slovenia
1995
100
196
81
28
Ukraine
1997
136
172
70
17
These fi gures show that both water supply and wastewater treatment
Yugoslavia
1991
372
255
45
30
tariff s are extremely diff erent from country to country and that there
Germany
1997
750
230
98
/
is usually a signifi cant gap between the relatively low (and often
Austria
1997
586
242
86
/
still subsidised) tariff s for population and the high (in some cases
Total
6 093
(Source: PCU, Transboundary Analysis Report, 1999)
extraordinarily high) tariff s for industry. In many accession countries
REGIONAL DEFINITION
21
Table 15
Range of water supply and wastewater treatment tariff s
90
in the Danube countries
80
Water supply
Wastewater treatment
70
Tariffs for population, (US$/m3)
60
©(%) 50
Minimum
0.02 (Moldova)
0.01 (Moldova)
40
Maximum
0.79 (Slovenia)
0.80 (Hungary)
Demand 30
Tariffs for industry (US$/m3)
20
10
Minimum
0.07 (Yugoslavia)
0.01 (Yugoslavia)
0
Maximum
2.95 (Hungary)
4.22 (Hungary)
Industry
Energy
Ferrous
Chemical/
Agriculture
Domestic
metallurgy petrochemical
(Source: PCU, Strategic Action Plan for the Danube River Basin 1995-2005, Revision 1999)
Sector
Table 16
Total annual freshwater consumption in the Dnipro
Figure 8
National demand for water (%) from the Dnipro Basin
Basin (2000)
in Ukraine (by sector). Agricultural sector demand
supplies 85% of water for irrigation.
Other Subtotal
Industry Of that, Agriculture
Of that,
Municipal
Country
sectors
(km3/
(%)
energy
(%)
irrigation sector (%)
(%)
year)
of 43.8 km3) and 13,283 ponds (the total water surface area is 12 km2
Republic of Belarus
29.4
8.7
0.4
43.8
18.1
1.040
with a capacity of 1.8 km3). About 30% of the total abstracted volume
Russian Federation
55.4
36.5
16.4
0.4
28.2
0.715
is supplied to arid areas of the basin via water diversion channels. In
Ukraine
58
14.9
9.7
22.1
5
8.87
Belarus, 0.04-0.06 km3/year is diverted annually via the Dnipro-Buh
Total (km3/year)
10.63
Channel.
there was a marked increase in prices during transition, resulting in lower
water use. In Hungary, for example, household water prices increased
Flow diversion to other basins. Republic of Belarus - 2 schemes (0.29 km3/
15-fold after subsidies were removed, which led to a reduction in water
year); Russian Federation ≠ none; Ukraine - 6 channels, 5 water ducts,
use during the 1990's of about 50%.
3.14 km3/year.
Dnipro Basin
Agriculture appears to be the most intensive water user, being
The Dnipro is a vital water artery for the economies and populations of
responsible for 69% of total non-returnable water consumption in
the three nations in its basin. Table 16 provides statistical data on water
the basin. A large proportion of this abstracted water is supplied to
consumption in the Dnipro Basin in 2000.
irrigation systems. Seasonally, about 56% of the total annual water
abstraction occurs between May and August, which is attributed to
The total volume of water extraction in the Dnipro Basin in 2000
intensive irrigation of arable farmland downstream of the Dniprovsky
was 10.6 km3. This can be broken down by country as follows: 6%
hydropower dam.
in the Russian Federation, 8% in the Republic of Belarus, and 86% in
Ukraine. Ukraine is by far the largest water user in the basin with the
Water losses during transmission.
Dnipro covering about 60% of the national demand for freshwater (a
Republic of Belarus - 380 million m3/year; Russian Federation - 22 million
breakdown by sector is shown in Figure 8).
m3/year; Ukraine - 1,660 million m3/year.
Wastewater discharge (point sources) in the Dnipro Basin (2000).
Water protection expenditures.
Republic of Belarus - 0.818 km3/year; Russian Federation - 0.425 km3/year
Republic of Belarus - 49,240 million BR (61. 5 million USD); Russian
(0.243 km3/year of polluted wastewater); Ukraine - 5.6 km3/year.
Federation - 75 million RR (2.4 million USD); Ukraine - 136.6 million UAH
(25.5 million USD).
Water-related engineering
Water reservoirs in the Dnipro Basin. The Republic of Belarus has 102
Water reservoirs in the Don Basin.
reservoirs (the total water surface area is 345 km2 with a capacity of
All signifi cant water reservoirs of the Don Basin are located in the Rostov
1.044 km3) and 730 ponds (the total water surface area is 93 km2 with
region. The biggest of these, Tsimlyanskoe, is situated directly in the Don
a capacity 0.164 km3). The Russian Federation has ponds (the total
plate. In addition, there are 3 supporting dams below the Tsymlyanskaya
water surface area is 180 km2). Ukraine has 564 reservoirs, including
Dam providing navigation on the Lower Don (Nikolayevskaya,
6 major ones (the total water surface area is 688 km2 with a capacity
Konstantinovskaya, and Kotchetovskaya).
22
EUTROPHICATION IN THE BLACK SEA REGION IMPACT ASSESSMENT AND CAUSAL CHAIN ANALYSIS
Table 17
Major diversion channels in the Ukrainian part of the
Table 19
Water-borne diseases in the Danube River Basin
Dnipro Basin
Health hazards
Water related causes
Sources of problems
Diversion Channel
Million m3/year
Communicable diseases
Pathogens in:
The Dnipro-Donbass Channel
228
- Dysentery
- Drinking
water
Insufficient water supply
- Hepatitis
- Recreational
water
Sewage contamination
The North-Rohachitska irrigation scheme
58
- Salmonellosis
- Irrigation
water
Manure
- Cholera
- Fish
consumption
The Kakhovka irrigation system
513
Inadequate water treatment
The North-Crimean Channel
2 004
Toxic substances in:
Sewage contamination
- Drinking
water
The Inhulets irrigation scheme
191
Acute intoxication and
Manure
- Irrigation
water
chronic diseases
Agrochemicals
The Dnipro-Kirovhrad water conduit
59
- Fish
Industry, hazardous wastes
- Recreation
water
River/road traffic
The Dnipro-Mykolaiv water conduit
87
Nutrient overloading from:
Total
3 140
Allergies and skin irritations
Proliferation of toxic
- Sewage
contamination
(from bathing)
cyanobacteria
- Manure
- Agrochemicals
Table 18
The main reservoirs of the Don River
Skin and eye infections and
Insufficient household
The name of the
Volume
Water surface
Insufficient water supply
River
Usage
infestations
hygiene
reservoirs
mln m3
area km2
(Source: Danube Pollution Reduction Programme, Socio-economic effects of water pollution in
irrigation navigation
Tsimljanskoe
Don
23 860
2 702
the Danube river basin, 1999)
fishing
irrigation navigation
Proletarskoe
Western Manich
2 031
798
fishing
disability, disease or disorder) that is directly or indirectly caused by the
irrigation navigation
state or changes in quantity or quality of any water resource. In general
Veselovskoe
Western Manich
893
246
fishing
terms the main health hazards mediated by water from the Danube
irrigation navigation
Ust'-Manichskoe Western
Manich
72
73
fishing
River system can be summarised as outlined in Table 19.
Flow diversion to other basins.
Investigations carried out with support from the European Commission
The Tsimlyanskoe water reservoir serves as the main power supply of
and the WHO shows the signifi cant infl uence of eutrophication on
irrigation systems. Water delivery is carried out with the help of the
human health. Algal toxins are observed in freshwater and marine
Don Main Channel (DMC) and the Generalovskaja and Khoroshevskaja
ecosystems where they can accumulate in shellfi sh, and more
irrigating systems. Through DMC, water is supplied for irrigation, for
generally in seafood, reaching dangerous levels for human and animal
fi lling the Sal River, and for feeding and desalination of the Manich
health. People may be exposed to toxins through the consumption
water reservoirs. The planned capacity of DMC is 250 m2/sec. DMC is
of contaminated drinking water, direct contact with fresh or marine
connected with the Nizhne-Donskaya, Verkhne-Sal'skaya, Bagayevsko-
water, or the inhalation of aerosols. Toxins induce damage in animals
Sadkovskaya and Proletarskaya irrigation systems. In the recent past,
and humans by acting at the molecular level and consequently
water from the Tsymlyanskoye water reservoir was used to irrigate
aff ecting cells, tissues and organs. The nervous, digestive, respiratory
290 000 hectares of land.
and cutaneous systems may be aff ected. Secondary eff ects can be
observed in numerous organs. Age or physiological conditions of the
Health status related to water
aff ected individual may determine the severity of the symptoms. A
The condition of the population's health is aff ected by a number of
variety of symptoms, depending on the toxins implicated, are observed
factors, including the poverty level, the development of and access to
such as fatigue, headache, diarrhea, vomiting, sore throat, fever and
medicine, and environmental conditions. This last factor determines
skin irritations.
the condition of water resources and water consumption, as well as
the condition of soils, vegetation and fauna. Relatively low levels of
Water-borne diseases in the Dnipro Basin
income and high levels of environmental pollution in developing
There is a continuous threat of outbreaks of waterborne diseases in the
countries have been correlated with poor health conditions compared
Dnipro River Basin. Available data show numerous limited outbreaks of
to the developed countries.
diseases caused by exposure to or consumption of poor quality water
containing pathogenic bacteria that are responsible for transmitting
According to the offi
cial defi nition of the European Regional Bureau of
various contagious diseases.
the World Health Organisation (WHO), water-borne diseases mean any
signifi cant and widely spread negative eff ect on human health (death,
In 2000-2001, 10 outbreaks of contagious viral and bacterial diseases
REGIONAL DEFINITION
23
were offi
cially recorded within the Russian part of the Dnipro Basin,
This picture varies across the basin. For example, the highest disease
attributed to microbial contamination of drinking water. The total
incidence rate has traditionally been recorded in the Central Ukrainian
number of people aff ected was 307, about 38% of whom were children
Oblasts with disease patterns being dominated by circulatory system
under 14 years of age. Enteric fever, A, B, and C-paratyphoid and bacterial
diseases and respiratory diseases. This, in some part, can be attributed
dysentery are the most frequent water-borne diseases. In the Kaluga,
to the ageing population of this region. Malignant tumours are frequent
Orel and Bryansk Oblasts, the incidence of dysentery, hepatitis A and
in the industrialised areas of the basin (Dnipropetrovsk, Zaporizhzhia
other acute contagious diseases is higher than the country average.
and Kirovhrad Oblasts), which can be attributed to higher levels of
environmental pollution.
Over the period of 1994-2001, 12 outbreaks of contagious waterborne
viral and bacterial diseases were recorded in the Belorussian part
The incidence of endocrine and digestive system diseases remains
of the Dnipro Basin. The total number of people aff ected was 1,135
high in the central and northwestern areas of the basin, where thyroid
with over 50% of them children under 14 years of age. In addition to
adenoma has been a serious issue. Since 1999, the situation has become
contagious viral and bacterial diseases, human health in the Dnipro
even more complicated due to higher incidence of hyperplasia of the
Basin is threatened by parasitic invasions. In the Pripyat River Basin,
thyroid gland, indicative of the impact of the Chernobyl accident.
parasitic invasion levels are relatively low. This is because fi sh have
never dominated the local food pattern, with only between 2% and
Legal and institutional framework at the national level
9% of the local population engaged in non-commercial fi shing. The
With regard to national water laws and institutions, the countries of
incidence of opisthorchiasis is diff erent in the Dnipro River Basin where as
the Black Sea Basin can be divided into four main groups: Austria and
much as 20% of the local population is engaged in such activities. In this
Germany, the new EU member states and the candidate countries, the
area, fi sh is consumed in large quantities, particularly dried and pickled.
Balkan countries, and the Newly Independent States (NIS).
Inadequate existing water treatment and disinfection technologies are
considered to be the major causes of water-borne disease outbreaks.
The fi rst group, Austria and Germany, as EU member states, have aligned
their laws and institutions with the strict requirements established in
In Ukraine, contaminated water is considered to be one of the major
the framework of the EU water policy. This entails the implementation
causes of enteric infections. There is a direct relationship between
of several Directives, such as the Water Framework Directive (2000/60/
the increasing contamination of water and the incidence of water-
EC), the Bathing Water Quality Directive (76/160/EEC), the Drinking
borne diseases (enterocolitis, dysentery, salmonellosis, viral hepatitis
Water Quality Directive (80/778/EEC), the Urban Wastewater Treatment
ņ, etc). Results of studies carried out in the Dnipro Basin suggest
Directive (91/271/EEC), the Nitrates Directive (91/676/EEC), among
that microbiological contamination of drinking water is the major
others.
contributor to the growing frequency of contagious disease incidence
(Table 20).
The new EU member states of central and eastern Europe (the Czech
Republic, Hungary, Slovakia and Slovenia) were also required to adopt
Table 20
Percentage of cases of contagious diseases attributed
the acquis communitaire before accession, even if all of them had already
to microbiological pollution
concluded some transitional arrangements concerning diff erent pieces
% of total cases attributed to
Contagious disease
microbiological contamination
of EU water legislation. The same criterion for membership applies to
Dysentery
41
Bulgaria and Romania, which will join the EU in 2007, and to Turkey that
is expected to open its negotiations with the EU by the end of 2004.
Salmonellosis
62-77
Prospects for EU accession have thus prompted most of the above-
Hepatitis A
72
mentioned countries to improve their water resources management
Enterocolitis
45
legislation and to develop sound water policies and strategies.
Fragmented approaches to water resources management are being
Between 1990 and 2000 the incidence of human disease has been
replaced with integrated and/or river basin management or catchment
growing at an average annual rate of 0.7%. Notably, the incidence of
approaches. The challenges ahead are to improve cooperation among
diseases related to or associated with environmental pollution has been
the diff erent administrative bodies (decentralisation has in fact in some
growing at a signifi cantly higher rate.
cases been accompanied by disintegration, as existing legislation does
not clearly specify responsibilities and functions) and to improve
The Czech Republic, Hungary, Slovakia and Slovenia have concluded transitional arrangements related to the Urban Wastewater Treatment Directive (91/271/EEC). Slovakia has also concluded a
transitional arrangement related to the Dangerous Substances Directive (74/464/EEC).
24
EUTROPHICATION IN THE BLACK SEA REGION IMPACT ASSESSMENT AND CAUSAL CHAIN ANALYSIS
the capacity, at various levels, to implement/enforce the regulations
of the Black Sea marine environment against pollution by dumping. The
eff ectively.
Convention provides for the establishment of a Commission for the
Protection of the Black Sea against Pollution (CPBSP), which promotes
The southeastern European states (Bosnia-Herzegovina, Croatia and
its implementation. To this end, the Commission is supported by
Serbia-Montenegro) have made signifi cant eff orts, after the end of the
a Permanent Secretariat and by diff erent Advisory Groups, Activity
war, to establish legal and institutional frameworks for water resources
Centres and national focal points. In 1996, the Black Sea countries
management. Croatia, in particular, which applied for EU membership
approved a Strategic Action Plan, in order to defi ne policy measures,
in 2003, is adapting its national laws and acts, as well as its institutions,
actions and timetables for setting up and achieving the environmental
to regulate many areas of water resources management (WRM) with
objectives of the Bucharest Convention. The Strategic Action Plan
EU water directives. Although new institutional arrangements for WRM
focuses on three major issues that are closely interrelated: the reduction
were established in all the countries in the 1990's and at the beginning
of pollution, the management of living resources and sustainable
of this century, the degree of eff ectiveness varies across countries.
human development.
Some areas of concern that need to be tackled in the immediate future
include: a) revision of legal frameworks to ensure proper delegation
The fi rst initiative for cooperation in protecting the water environment
of functions and responsibilities among diff erent institutions and
in the Danube River Basin was taken with the signing of the Bucharest
ministries; b) development of a legal basis for a river basin management
Declaration in 1985. Afterwards, in 1994, the Convention on the
approach; c) adequate resources allocation for water institutions; and d)
Protection and Sustainable Use of the Danube River was adopted,
implementation of plans for restructuring existing water institutions.
which, with its entry into force in October 1998, became the key
legal instrument for regulating cooperation and transboundary
Finally, NIS countries (Belarus, Georgia, Moldova, Russia and Ukraine)
water management in the basin. To facilitate its implementation, the
have also issued a number of laws and regulations for the protection
International Commission for the Protection of the Danube River (ICPDR)
and management of water resources. Nonetheless, legislation still
was set up as the main decision-making body of the Convention. The
needs to be updated in order to take full account of good international
Commission's work is supported by a Permanent Secretariat and by
practices and principles in WRM and to specify responsibilities of
diff erent Expert Groups and Working Groups. In 1994, the Danube
various institutions and the diff erent water uses. A river basin planning
countries prepared a Strategic Action Plan, which provides directions
management approach as opposed to a sectoral planning approach
for achieving the goals of regional integrated water management
needs to be promoted, especially in the Dnipro Basin where confl ict
expressed by the Convention. The Strategic Action Plan was reviewed
among users seems to be increasing. Russia has a long tradition of
in 2000 under the ICPDR, through the establishment of the Joint Action
integrated river basin management, but the overall status of utilisation
Programme, which covers the 2001-2005 period. The main aims of the
and protection of water resources in the country is still unsatisfactory,
Joint Action Programme are: the improvement of the ecological and
due to the low level of implementation of the existing legislation.
chemical status of the water, the prevention of accidental pollution
events and the minimisation of the impact of fl oods.
Legal and institutional framework at the international level
In the Black Sea Basin there are two main legal and institutional
Institutional cooperation between the Black Sea and the Danube
frameworks related to transboundary water protection and
countries started in 1997 when representatives of the CPBSP and the
management concerning the Black Sea coastal states and the Danube
ICPDR, with the assistance of UNDP/GEF and UNEP, set up a Joint ad-hoc
River Basin.
Technical Working Group (JTWG). The JTWG has recently supported the
adoption of the so-called Memorandum of Understanding between the
Environmental cooperation in the Black Sea is based on the Convention
CPBSP and the ICPDR, which identifi es a long-term and an intermediate
on the Protection of the Black Sea against pollution, which was signed
goal for the Black Sea region. The long-term goal is to reduce the loads
in 1992 by the six coastal states and entered into force in 1994. Three
of nutrients and hazardous substances discharged to such levels
protocols form an integral part of the Convention: the Protocol on the
necessary to permit the Black Sea to recover to conditions similar to
protection of the Black Sea marine environment against pollution
those observed in the 1960s. The intermediate goal is to avoid that
from land-based sources; the Protocol on cooperation in combating
the loads of nutrients and hazardous substances discharged into the
pollution of the Black Sea marine environment by oil and other harmful
Black Sea and the Azov Sea exceed those that existed in the mid-1990s.
substances in emergency situations; and the Protocol on the protection
An informal Task Force for cooperation on water-related issues in the
REGIONAL DEFINITION
25
Danube/Black Sea region (DABLAS Task Force) has also been created to
creation of a transboundary management regime and coordinating
promote the implementation of the Memorandum of Understanding,
body, the formulation of a Strategic Action Programme (SAP) and the
provide suggestions to the CPBSP and the ICPDR concerning further
building of the capacity needed for SAP implementation. In 1998, the
strategic priorities, and develop a series of concrete activities, including
Transboundary Diagnostic Analysis was published that was to serve as
a short list of prioritised projects for the rehabilitation of the waters in
a basis for the preparation of the SAP. Moreover, on May 2003, the three
the region.
Ministers of the Environment of Belarus, Russia and Ukraine signed a
new Declaration on cooperation in the sphere of environmental
Finally, with regard to the Dnipro River Basin, it has to be highlighted that
rehabilitation of the Dnipro Basin. In this document, they expressed
in 1995 Belarus, Russia and Ukraine signed a Memorandum by which
their readiness to prepare an international agreement, which will serve
they applied to UNDP for assistance in developing an international
as the main organisational mechanism for ensuring stable international
programme on environmental rehabilitation of the basin. The UNDP/GEF
cooperation among Dnipro countries and which will defi ne the general
Dnipro Basin Environmental Programme started in 1996. Its goals are: a)
principles, goals, objectives and commitments of the signatories for the
remedying the serious environmental eff ects of pollution and habitat
Dnipro Basin environmental rehabilitation.
degradation of the basin; b) ensuring sustainable use of its resources;
and c) protecting biodiversity. Among its specifi c objectives are the
26
EUTROPHICATION IN THE BLACK SEA REGION IMPACT ASSESSMENT AND CAUSAL CHAIN ANALYSIS

Impact assessment, eutrophication
Environmental impacts
Cause
High nutrient
Eutrophication is a complex process, which occurs both in fresh and
Supporting Factors
marine waters, where excessive development of certain types of algae
Top layer
disturbs the aquatic ecosystems and becomes a threat for animal and
human health. The primary cause of eutrophication is an excessive
Direct Effect
concentration of plant nutrients originating from agriculture or sewage
High phytoplankton biomass
treatment. Eutrophication is commonly linked to algal blooms, "red
Supporting Factors
tides", "green tides", fi sh kills, inedible shellfi sh, blue algae and public
Bottom layer
health threats (Figure 9).
Indirect Effects
A brief description of the mechanisms of eutrophication development
Oxygen depletion, flora/fauna changes
is as follows (Figure 10). The main cause of eutrophication is the large
input of nutrients to a water body and the main eff ect is the imbalance
Figure 10 The process of eutrophication in the Black Sea.
in the food web that results in high levels of phytoplankton biomass
in stratifi ed water bodies. This can lead to algal blooms. The direct
of the water body. Additional factors supporting this process can be
consequence is an excess of oxygen consumption near the bottom
divided into two categories depending on whether they are linked to
the nutrient dispersion and the phytoplankton growth, or to the oxygen
cycle near the bottom of the water body (for example, containment,
light and water movements). Various eff ects can be observed
depending upon the severity of the eutrophication.
The enrichment of water by nutrients can be of natural origin, but it is
often dramatically increased by human activities. This occurs almost
everywhere in the world. There are three main sources of anthropogenic
nutrient input: runoff , erosion and leaching from fertilised agricultural
areas, and sewage from cities and industrial wastewater. Atmospheric
deposition of nitrogen (from animal breeding and combustion gases
and coals) can also be important.
Main consequences of eutrophication
The major consequence of eutrophication concerns the availability of
Figure 9
Algae bloom in the Black Sea.
oxygen. Plants, through photosynthesis, produce oxygen in daylight.
IMPACT ASSESSMENT, EUTROPHICATION
27


On the contrary, in darkness all animals and plants, as well as aerobic
Yuzhn
yy
Eutrophication levels
microorganisms and decomposing dead organisms, respire and
Dniester
Bu
g
Odesa
consume oxygen. These two competitive processes are dependent
Hypertrophic
Dnipro
on the development of the biomass. In the case of severe biomass
Eutrophic
Danube
accumulation, the process of oxidation of the organic matter that has
Not Assessed
-50 m
formed into sediment at the bottom of the water body will consume
-200 m
all the available oxygen. Even the oxygen contained in sulphates (SO 2-)
4
will be used by some specifi c bacteria. This will lead to the release of
sulphur (S2-) that will immediately capture the free oxygen still present
in the upper layers. Thus, the water body will loose all its oxygen and
all life will disappear. This is when the very specifi c smell of rotten eggs,
Istanbul
originating mainly from sulphur, will appear.
© GIWA 2004
Figure 12 Eutrophication levels in the Black Sea (hypertrophic ≠ red,
eutrophic ≠ orange, mesotrophic ≠ yellow and blue).
In parallel with these changes in oxygen concentration other
changes in the water environment occur, such as changes in algal
population and changes in zooplankton. During eutrophication,
Adverse changes in the structure and functioning of the water
macroalgae, phytoplankton (diatoms, dinofl agellates, chlorophytes)
ecosystems
and cyanobacteria, which depend upon nutrients, light, temperature
Eutrophication severely infl uences the structure and functioning of
and water movement, will experience excessive growth. From a public
the water ecosystem. In shallow areas of the sea, where the seabed
health point of view, the fact that some of these organisms can release
is bathed in light, larger plants and algae may grow in underwater
toxins into the water or be toxic themselves is important.
meadows. These too can form the base of a food-chain but also provide
shelter for a myriad of animals which live attached to the sea fl oor or
phytoplankton
arrive as visitors, sometimes remaining during an important stage in
their reproductive cycle.
filamentous
algae
light penetration
The northwestern part of the Black Sea is largely below one hundred
meters depth and has always received a good supply of nutrients
macrophyte
from the Danube and Dnipro Rivers, Europe's second and third largest
rivers. It was virtually covered with underwater meadows. One species
alone, red algae Phyllophora, dominated an area with the combined
size of Belgium and the Netherlands. The meadow, named Zernov's
sedimented organic material
fi eld after its Russian discoverer, was the home to a unique and highly
Figure 11 Development of plant life in coastal waters with
productive ecosystem of plants and animals. Incidentally, humans also
increased level of nutrients
harvested the red algae for their agar. These sea grass and algal beds
Where eutrophication occurs, fi sh and shellfi sh populations are the fi rst
of the northwestern shelf were unable to absorb large amounts of
to demonstrate changes. Being most sensitive to oxygen availability,
nutrients, however, and large quantities of phytoplankton began to
these species may die from oxygen limitation or from changes in the
grow, shading the light from the larger plants below. Deprived of light,
chemical composition of the water such as the excessive alkalinity that
the meadows began to die.
occurs during intense photosynthesis. Ammonia toxicity in fi sh, for
example, is much higher in alkaline waters.
Algae blooms
As the base of the marine food chain, phytoplankton is an important
Black Sea
indicator of change in the seas. These marine fl oras, in the process of
Eutrophication can adversely aff ect the diversity of the biological
photosynthesis, also extract carbon dioxide from the atmosphere,
system, the quality of the water and the uses to which water may be put
and, as a result, play an important role in the balance of greenhouse
in the Black Sea region. The Black Sea is known to be one of the marine
gases that control global climate. Though incredibly small as individual
water bodies most aff ected by eutrophication in the world (Figure 11).
cells, their vast numbers infl uence both the primary production of the
28
EUTROPHICATION IN THE BLACK SEA REGION IMPACT ASSESSMENT AND CAUSAL CHAIN ANALYSIS
Table 21
Increase in phytoplankton blooms. Phytoplankton
Ralfs blue-greens in 1954-1960. At present, however, both the quantities
concentration in the northwestern Black Sea
and composition of mass species in freshwater phytoplankton have
1960-70
1980-90
changed. Eutreptia lanovii Steuer green algae have become common.
Species
Cell densities
Number of
Cell densities
Number of
The percentage of diatoms in total summer phytoplankton has
(10 cells )
blooms
(10 cells )
blooms
1.
Skeletonema costatum
10-18
3
10-90
8
increased up to 40%.
2.
Sceletonema subsalsum
-
-
10-19
2
3.
Cyclotella caspia
-
-
23-300
2
Expansion of hypoxic and anoxic zones.
4.
Chaetoceros similis
-
-
22
1
The presence of a sulphur hydrogen (anoxic) zone starting from the
5.
Cerataulina pelagica
-
-
5-6
3
depth of 200 m is a very signifi cant feature of the Black Sea. Hypoxia
6.
Nitzschia delicatissima
6-21
4
17
1
7.
Nitzschia closterium
-
-
13
1
phenomena in shallow otherwise oxic habitats have developed during
8.
Nitzschia tenuirostris
-
-
75
1
the recent decades in the surface layer of the Black Sea (Figure 13).
9.
Leptocylindrus danicus
7
1
-
-
Total
diatoms
7-21
8
5-300
19
After studying the geography in the bottom layer zones of the
10.
Prorocentrum cordatum
17-51
4
10-810
9
11.
Prorocentrum scutellum
-
-
7
1
northwestern shelf of the Black Sea that experienced an oxygen defi cit,
12.
Scripsiella trochoidea
-
-
26
1
three characteristic sites were revealed where hypoxia was registered
13.
Heterocapsa triquetra
-
-
5-12
3
most often: "Odesa", "Central" and "Danube". "Central" refers to the area
Total
dinoflagellates
17-51
4
5-810
14
between the Dniester and Danube rivers. The geographic position of
14.
Eutreptia lanowii
-
-
-
6
15.
Total Euglenophytes
-
-
-
6
the other sites is indicated by their names.
16.
Emiliania huxleyi
-
-
220-300
2
17.
Chromulina sp.
-
-
1 000
1
In the year 2000, the total area exposed to hypoxia reached 14 thousand
Total
prymnesiophytes
-
-
220-1
000
3
km2 (38 % of the area of the northwestern shelf). This is much less than
Total
blooms
-
12
-
42
the 1983 fi gures when more than 50 % of the northwestern shelf of the
oceans and the world's climate. Phytoplankton blooms that occur near
Black Sea was exposed to hypoxia.
the surface are readily visible from space, enabling a global estimation
of the presence of chlorophyll and other pigments using satellite
Reduction in biodiversity and in fi sh resources.
Eutrophication and other types of ecosystem degradation have led to
The contemporary condition of spring phytoplankton is characterised
reduced biodiversity and imbalanced ecosystems in the Black Sea. In
by a reduced percentage of diatoms (75% in average) in total volume
the past 25-30 years, the Black Sea has been transformed from a diverse
of biomass and an increased role of peridinia as compared to 1954-1960
ecosystem supporting varied marine life to a eutrophic plankton culture
data. For the fi rst time, substantial quantities of Gleccapsa blue-greens
1973
1974
1978
and Inkistredesmus and Scenedesmus protococci appeared in the Dniester
and Danube estuaries. "Florescence" of typically maritime Sceletonema
costatum Cl., Chaetoceros socialia f. radians is observed every year, whereas
previously scanty freshwater diatoma Stephanodiscus hantzsohii Grun was
seen in the sea near the Dnipro estuary.
1982
1983
1990
Intense growth of peridinia has become typical for the summer
period: they made up only 19% of biomass in 1954-1960, but have
increased to 54.5% in recent years. Many new peridinia species have
also appeared. Summer water is "blooming" almost permanently
and a new phenomenon of "red tide" determined by Ex.cordata has
been observed. Acantoica acanthus Schill was scarce earlier, but now
Figure 13 Expansion of hypoxia and anoxia zones in the
develops in outbreaks.
northwest of the Black Sea.
Note: Eutrophication was so strong that it caused temporary hypoxia events
on the sea bottom that resulted to the mass mortality of benthic animals in the
In the Dnipro-Bug Estuary, area summer "blooming" was determined
relatively shallow northeastern Black Sea.
Source: Y. Zaitsev and V. Mamaev, Marine biological biodiversity in the Black Sea: A
by Microcystis aeruginesa Kuts et Elenk, Aphanizomenon fl os aquas
study of change and decline, United Nations Publications, New York, 1997.
IMPACT ASSESSMENT, EUTROPHICATION
29
- environmental conditions unsuitable for most organisms higher in
resources, including 5 million tonnes of fi sh. As a consequence, the
the food chain.
largest community of mussels in the Odessa Gulf that were exported
in the beginning of the 20th century has completely lost its commercial
As species diversity is reduced, often as a result of eutrophication,
signifi cance in recent years.
opportunistic settler species, brought in the ballast water of ships, can
easily fi nd an ecological niche in which to fl ourish. The fi rst documented
Damage to and destruction of habitats.
case was that of the predatory sea snail Rapana thomasiana, probably
The commercial fi sh stocks strongly depend upon the availability
carried from Japan on ships' hulls or in ballast in the late 1940s and
of wintering and feeding resources and undisturbed spawning and
widely held responsible for the demise of commercially-harvested
nursery grounds. Although diff erent fi sh species depend upon diff erent
oyster populations and a general decrease in biodiversity. Ironically, in
wintering and main feeding areas, the Black Sea shelf and in particular
recent years, it has itself become the target of heavy fi shing, with the
Ukrainian Black Sea shelf is the most important of these wintering and
harvest exported to Japan, and stocks are now declining. Another one
feeding habitats.
was the soft-shelled clam, which fi rst appeared in the late 1960s and
successfully competed against the local species, Corbula mediterranea,
The quality of nursery and spawning grounds plays a crucial role in the
to achieve densities of more than 1,000 per square meter (about
reproduction of fi sh stocks. The construction of dams and hydraulic
1 kilogram per square meter) on the Romanian shelf. These large
structures has kept anadromous species such as sturgeons from their
populations may actually improve the capacity of the ecosystems for
natural spawning grounds in the estuaries of the Danube and Dnipro
self-purifi cation. But large banks of clams and mussels have now been
Rivers. As a result, these anadromous fi sh species currently depend
eliminated by the eff ects of anoxia.
upon industrial breeding for their survival. The most intensive work
to industrially breed sturgeon is being done in the Azov Sea in the
Benthic vegetation.
Russian Federation. Fishing activities during the spawning period are
Benthic vegetation includes seagrasses and seaweeds and micro-
strictly prohibited in all Black Sea states. Illegal fi shing is common under
phytobenthos biomass. At the present time, a small Phyllophora fi eld,
the current economic conditions, however, and damages the success
situated at a depth of 10-15 m in the eastern part of the Black Sea, still
of breeding eff orts, in particular in the cases of sturgeons and turbots.
develops normally. A loss of the Phyllophora fi eld would be disastrous
Most of these species require special protection and remedial measures
because of its valuable resources and more importantly because of its
in order to safeguard the successful replenishment of fi sh stocks in the
unique biocenoesis with its specifi c red color fauna (Phyllophora fauna)
Black Sea.
and its importance as a source of oxygen.
Signifi cant evidence of the destruction of critical habitats resulting from
The Black Sea brown alga, Cystoseira barbata, that inhabits rocky coasts,
eutrophication is the catastrophic loss of the "Zernov" phyllophora fi eld
began disappearing from the coastal waters of Ukraine and Romania
in the northwestern Black Sea.
in the 1980s. This large perennial alga, unable to endure the eutrophic
costal waters, was replaced by fi lamentous green and red algae. Due
Increased water turbidity.
to a recent reduction of pollution pressures on coastal waters, a
Phytoplankton blooms increase the water turbidity and isolate the
reoccurrence of the Cystoseira barbata was reported by Ukraine.
bottom seagrasses from sunlight. After the cells die, a large quantity of
detritus settles on the sea bottom covering the seagrass and preventing
Benthic fauna.
its development.
The development of large-scale eutrophic phenomena and the
resulting depletion of oxygen occurred due to decay of massive
Azov Sea
quantities of dead algae and due to sedimentation building up on
The major constituents of the Taganrog Bay water balance are the Don
benthic communities. This provoked frequent occurrences of hypoxic
River runoff and water exchange with the open part of the Azov Sea.
and anoxic conditions on the Black Sea shelf. First observed in 1973,
The Don River runoff on average contributed about 27.3 km3/year up
oxygen poor zones have since been observed frequently every year
to the middle of the 20th century, 18.4 km3 or almost 70% of which
in summer and autumn. A mass mortality of benthic animals has
occurred during the spring fl ood. Since being regulated by dams,
been caused by this phenomenon. The biological losses over 18 years
the annual runoff of the Don River contributes only 21.5 km3, which is
(1973-1990) were estimated to be 60 million tonnes of living marine
5.8 km3 (20%) lower than would naturally occur, and 8.0 km3 lower in the
30
EUTROPHICATION IN THE BLACK SEA REGION IMPACT ASSESSMENT AND CAUSAL CHAIN ANALYSIS
spring period. This is 2.4 times lower than the norm prior to regulation
578 mg/m3. This is lower than the levels of the same substances in the
through dams and exceeds the natural minimum by only1.2 km3.
period 1952-1981 (N-22%, P-38%, H SiO 3-4.1%).
2
In June 2003, maximum concentrations of mineral and organic
Due to the intensive assimilation of nitrates by phytoplankton, their
phosphorus were noted in the areas most infl uenced by river runoff : the
concentration in the sea over the period 1996-2000 decreased on
Taganrog Bay and along the coastline of the Temryuksky and Yasensky
average to 19 mg/m3, compared to 46 mg/m3. A decrease in the nitrate
Bays. The levels of phosphate phosphorus were 146-154 mg/l, and the
levels in the Taganrog Bay (to 80 mg/m3 on average from 200-300 mg/m3
levels of total phosphorus were 162-175 mg/l. Thus, the entry of organic
in 1985-1990) has resulted from both biologic factors and decreased
phosphorus from the river runoff was low, at the level of 10-12% of the
anthropogenic pressure. A downtrend in the phosphate levels in the
total amount.
Azov Sea manifested itself later (since 1997); levels are 8.7 mg/m3, or
1.3 times lower than in the fi rst half of the 1990s (Aleksandrova 2001).
The Don River runoff is less rich in nitrogen compounds than the Azov Sea
On the other hand, changes in concentrations of biogenic substances
water mass itself. Mobilisation of the nitrogen in the Azov Sea sediments
result from the natural desalination of the Azov Sea. This has led to a
by storm action is a source for elevated levels of nitrates. Many scientifi c
decrease in the amount of diatoms, which have been crowded out by
publications describing the patterns of the formation of the sea's
the algae not consuming silicon, including Cyanophyceae.
hydrochemical regime illustrate the unique role of runoff from the Don
and Kuban Rivers in the eutrophication of the basin. A decrease in the use
The Don and Kuban Rivers are responsible for 90% of dissolved
of mineral fertilizers in the catchment area has obviously led to a decrease
substances fl owing into the Azov Sea. Nitrogen takes the leading place
in the delivery of oxidised nitrogen forms into the Taganrog Bay.
in the structure of the discharge of these substances. During the period
1981-2000, long-term average annual transport of total mineral nitrogen
Between 1971 and 1991, average levels of ammonium nitrogen in the
from the Don River into the Azov Sea varied from 8 000 tonnes to 30 000
Taganrog Bay water were 198 mg/l in April and 146-166 mg/l in July.
tonnes, from the Kuban River ≠ from 12 000 t to 33 000 t, and from the
In 1992, an average concentration in the Azov Sea water area was
Mius River ≠ from 200 to 1 300 t. Mineral nitrogen discharge from the
30 mg/l. In 1998 (June) an average concentration in the Taganrog Bay
Kuban River water is comparable with that from the Don River, though
was 32.5 mg/l.
the water discharge of the Kuban is only half that of the Don. This shows
more intensive pollution of the Kuban River by nitrogen. The transport
The changes in the hydrophysical and hydrochemical regime in the
of mineral nitrogen by the Mius and other rivers is dozens and even
Azov Sea in the summer season has a range of features that infl uence
hundreds times lower.
the phytoplankton community and primary production processes.
Episodic reconfi guration of the system of currents, infl uenced by wind
During the period 1981-2000, the volumes of mineral phosphorous
and wave activity, and intensive turbulent mixing, cause changes in
discharged into the Azov Sea constituted: from the Don River ≠ from
the structure of the hydrophysical and hydrochemical fi elds that have
1 400 to 2 000 t, from the Kuban River ≠ from 100 to 400 t, and from
diff erent ecological eff ects: rapid replenishment of reserves of mineral
the Mius River ≠ from 20 to 100 t. The ratio of mineral phosphorous to
forms of biogenic substances from subterranean solutions and the
total phosphorous varied from 1:2 to 1:3. In the 1980s, the volume of
destruction of the water stratifi cation; a short-term decrease of the
the phosphorous transport in the Don Basin increased by a factor of 3,
euphotic layer due to a drastic decrease of the water transparency;
and in the Kuban Basin it increased by a factor of 2 compared to the
and a temporary decrease in the infl ow of freshwater and halophilous
background period. In the 1990s it remained at the level of the 1980s.
microalgae from the Black Sea. Such non-recurrent restructuring of
The transport of mineral phosphorous by the Mius River decreased by
oceanographic fi elds is diffi
cult to assess. However, in contrast to
a factor of 2 in the 1990s compared to the 1980s.
deepwater and stratifi ed water bodies, the Azov Sea is supplied with
the main biogenic substances for microalgae vegetation even during
According to assessments made by FAO experts, the annual economic
the summer period.
damage of Mnemiopsis leidyi to the states of the Black Sea coast equals
$250,000. During the period of 1981-2000, the instability of the marine
Between 1985 and 1995, the average annual level of nitrogen
ecosystem was discovered; the high intensity of the introduction of
molecular forms in the Azov Sea as a whole was 819 mg/m3, the level
alien species (approximately one species a year) caused changes in
of phosphorus was 42 mg/m3, and the level of dissolved silicic acid was
the productivity of deepwater and bottom marine communities of
IMPACT ASSESSMENT, EUTROPHICATION
31
Table 22
Variation in the levels of organics in the Sea of Azov
the Azov Sea it has forced out the local crab, Brachynotus sexdentatus,
(The Taganrog Bay), mg/m3
from its habitat. Unintentional introduction of Beroe ovata has a positive
1958-1968
1969-1976
1977-1987
1988-1998
impact since these organisms are antagonistic to Mnemiopsis, whose
Mineral nitrogen (N )
81-161
129-242
125-325
102-174
min
population decreased after the introduction of Beroe ovata into the
Mineral phosphorous (P )
6.2-10.5
8.1-11.3
8.7-12.7
9.7-20.2
min
local ecosystem. Current data show a cardinal restructuring of copepod
Total nitrogen (N )
1 150-1 293
906-1 249
1 079-1 393
774-659
tot
taxocene in the Taganrog Bay.
Total phosphorous (P )
97.7-104.3
70.3-88.3
47.3-64.8
38.9-62.4
tot
Silicon
604-999
471-980
526-961
521-986
Don
N :P
13.4:10.3
16.9:21.4
12.9:25.5
10.5:8.6
min
min
The Don River runoff is less rich in nitrogen compounds than the Azov
N :P
11.8:12.4
12.8:14.1
22.8:21.4
19.8:10.6
tot
tot
Sea water mass itself. Subterranean solutions mixing with the pelagic
N :P
11.7:12.1
12.5:13.1
25.3:20.5
23.0:11.5
org
org
water mass, when bottom sediments are roiled up, are a source for
(These are the lower and upper limits. There are no analogical published data for the Black Sea)
elevated levels of nitrates here.
the Black Sea. It can be stated that changes of the ecosystem state,
when the trophic status increases in the course of the eutrophication,
Danube
have upset the stability of ecological niches formed by invasive highly-
It is generally recognised that eutrophication constitutes a problem
productive species, which are most adapted to new conditions. Ballast
for the Danube River, even if much more attention is usually paid
water was a main source of the introduction of alien species during
to the river's contribution to the total nutrients load (and hence to
that period.
eutrophication) of the Black Sea.
In fact every introduced species can have both positive and negative
With regard to the environmental impacts of eutrophication, the
eff ects on local species. For example, brown alga, Desmarectia viridis
Joint Danube Survey (JDS) collected some interesting data in 2001.
introduced from the North Atlantic excretes cell sap, which destroys
Concerning macrophytes, a clear dominance of higher plants, i.e. free
other alga species. This feature has not yet been studied in the Black
fl oating and fl oating leafed plants, was observed particularly in the
Sea, however. Diatom alga, Rhizosolenia calcar-avis, introduced from
lower Danube from 537 river km to the delta. The dominance of these
the boreal part of the Atlantic, is one of the phytoplankton species
two plant groups is determined by light availability (which, in turn,
that causes water bloom in the Black Sea. This species produces more
depends on transparency) and by nutrients. The majority of the plant
negative than positive eff ects as it is not consumed by zooplankton,
species collected during the JDS are indicators of eutrophic conditions
and pelagic fi shes like anchovy avoid Rhizosolenia blooming areas. It
and others such as Ceratophyllum demersum, Potamogeton crispus and
can have positive eff ect as well, however, such as producing oxygen.
Zanichella palustris are common signals of signifi cant nutrient loads. The
The Bivalve mollusk, Anadara inaequivalvis (Cunearca cornea), was
species group of Characea (Phycophyta) usually serves as an indicator
introduced into the Black Sea from the coast of the Philippine Islands
of oligotrophic (low in nutrients) habitats, providing high transparency
in 1981, then it penetrated into the Azov Sea. Anadara inaequivalvis is a
values. Such preferred conditions occurred in some parts of the Iron
self-acclimatiser, resistant to changes in oxygen regime in bottom water.
Gate Reservoir where this specifi c group could be found.
It survives under conditions of hypoxia when other mollusks die. In the
Azov Sea, Anadara inaequivalvis forms its own biocenose on sandy and
Phytoplankton biomass and, specifi cally, the concentrations of chlo-
sandy-shell bottom, forcing out some local bivalve species. The rate
rophyll-a were also assessed. High values of biomass/chlorophyll-a in-
of growth of Anadara inaequivalvis exceeds the rate of growth of an
dicated eutrophic conditions in the middle Danube reach, particularly
aboriginal Azov species, Cerastoderma rhombodes, by 25% on average.
downstream of Budapest. For the tributaries, the highest concentrations
Since the shell of Anadara inaequivalvis is half as wide again than the
of phytoplankton biomass were found in the Iskar, the Velica Morava,
shell of Cerastoderma rhombodes of the same size, the mollusk is eaten
the Ipoly, and the Sio, where high eutrophic status was accompanied
by fi sh only when 1-2 years old and then becomes unavailable for
by high nutrient concentrations and oxygen-hypersaturation. Despite
bottom-feeding fi shes of the Azov Sea. The crab, Rhitropanopeus harrisi
the fact that the Jantra, the Russesky Lom, the Arges, the Siret and the
tridentate, introduced from the Atlantic Ocean, is a bottom predator that
Prut were also found to have high concentrations of nutrients or bio-
also eats dead organisms and serves as an additional source of food
degradable organic matter, the phytoplankton biomass was found to
for bottom fi shes such as bullheads, fl ounder and turbot. In the Black
be low, probably due to retarding or toxic eff ects. In contrast, a high
Sea, this introduction has had more positive than negative eff ects. In
concentration of phytoplankton biomass was observed in the Drava,
The Joint Danube Survey was conducted from August to September 2001 and has produced a consolidated picture of the Danube and its major tributaries in terms of water quality, providing
comparable data about the entire course of the river on over 140 parameters.
32
EUTROPHICATION IN THE BLACK SEA REGION IMPACT ASSESSMENT AND CAUSAL CHAIN ANALYSIS
despite the low concentration of nutrients. Chlorophyll-a concentration
Basin water bodies in the territories of the three riparian countries,
was also measured by the Trans-National Monitoring Network (TNMN)
excessive fl ow regulation, and the presence of extensive shallow-water
in the 1996-2000 period. Spatial coverage of the Danube Basin by TNMN
sections in the Dnipro reservoirs. The current status of Dnipro waters in
data is not complete, however, as only the upper part of the Danube
Ukraine is presented in Table 23 from the National Report on the Status
and the main tributaries were monitored between 1997 and 2000, while
of the Environment in Ukraine (2001):
few data were obtained from the Bulgarian section. For the upper part
of the Danube, statistical values resulted the I-III class; results from the
Table 23
Current status of surface waters in Ukraine (extract)
lower part of the Danube were in class I-III as well. Among the tributar-
Waterbodies
Trophicity (dominating type)*
State value of ecosystem
in winter: oligotrophic;
ies, only the Sio River was in class IV.
Dnipro
in summer: off Nedanchichi village - eutrophic;
Stressed environment
Kherson, Nova Kakhovka - meso-eutrophic.
rr. Styr, Ustja, Irpin, Unava,
Other indicators commonly used to assess the environmental impacts
Oligotrophic: r. Styr;
Desna, Ros - stressed
Mesotrophic: r. Mokra Moskovka;
of eutrophication were evaluated by the TNMN. In particular, dissolved
Tributaries of the
environment;
Meso-eutrophic: r. Ustja;
Dnipro
r. Mokra Moskovka - stressed
oxygen concentrations generally showed positive results, with only
Eutrophic: rr. Desna, Ros, Irpin;
environment with elements of
Eu-polytrophic: rr. Teteriv, Unava.
degradation
7.4% of values below the quality target in the Danube River, and 8.6%
Reservoirs:
in selected tributaries. Oxygen concentration decreased from the upper
Kyjivske
Meso-eutrophic - eutrophic
Stressed environment
to lower part of the Danube River, reaching the lowest values in the
Kanivske
Mesotrophic -eutrophic
Stressed environment
section from Danube Bazias to Danube-Novo Selo/Pristol. From the
Mesoeutrophic;
tributaries, low oxygen content was also identifi ed in those located in
Kremenchukske
in summer, off Svitlovodsk -
Stressed environment
the lower part of the river basin.
eu-polytrophic.
Antropogenically stressed
Dniprodzerzhynske
Meso-eutrophic
environment
Biochemical oxygen demand (BOD) data indicated that 13.3% of
Antropogenically stressed
Dniprovske
Oligotrophic- Mesotrophic
environment with
the values were above the target in the Danube River (mainly in the
impairments in spring
middle and in the lower sections), and 35.9% were above the target in
Antropogenically stressed
Kakhovske
Mesotrophic - eutrophic
environment
the tributaries. Organic pollution expressed by BOD increased along
Notes:
the Danube, reaching its maximum in the section from Danube-
*Trophicity (dominating type)
Phytoplankton biomass, mg/l
Dunafoldvar (rkm 1560) to Danube-Pristol/Novo Selo (rkm 834).
oligotrophic, oligo-mesotrophic
<0.5
mesotrophic
0.5-1.0
Tributaries most polluted by degradable organic matter were Morava,
meso-eutrophic
1.1-2.0
Dyie and Sio in the upper/middle part, and Russenski Lom and Arges
eutrophic
2.1-5.0
in the lower part.
eu-polytrophic
5.1-10.0
polytrophic
10.1-50.0
hyperpolytrophic
>50.0
Suspended solids, which give a measure of the turbidity of water, slightly
increased in content from the upper to the lower Danube section.
Some of the tributaries showed signifi cantly higher concentrations of
Eutrophication can result in the following impacts:
suspended solids than the Danube River itself (Tisza, Russesky Lom,
Deterioration in water quality due to intensive algal blooms;
Arges, Siret and Prut).
Changes in redox capacity;
Changes in the structure and functions of aquatic ecosystems;
In general terms it can be noted that for the 1992-1996 period, total
Changes in species composition and the productivity of native fi sh
nitrogen load in the Danube River was estimated to be between 537,000
species.
and 551,000 tonnes per year, depending on the estimates for removal
by de-nitrifi cation, while total phosphorus load was 48,900 tonnes per
The diagram below illustrates how this issue is linked to other
year. The size of these loads is large compared to other important rivers
transboundary issues (Figure 14).
in Europe, such as the Rhine or the Seine.
The impacts of this issue are linked closely with those of a number of
Dnipro
other issues including changes in the groundwater regime, fl ooding
Eutrophication in the Dnipro has developed as a result of the following
events and elevated groundwater levels, and modifi cation and loss
factors: large organic and nutrient pollution loads entering the Dnipro
of ecosystems and ecotones. The impacts of other water resource
3 The Trans-National Monitoring Network has collected data on physicochemical and biological determinants in the 1996-2000 period.
4 The following classification scale was used: class I< or = 25 Ķg/l; class II < or = 50 Ķg/l; class III < or = 100 Ķg/l; class IV< or = 250 Ķg/l; class V > 250 Ķg/l
IMPACT ASSESSMENT, EUTROPHICATION
33
siltation and swamping, leading to the excessive growth of higher
aquatic plants and blue-green algae.
Eutrophication
Changes in species composition and productivity of indigenous
fi sh species.
Acute and major changes in the condition of aquatic ecosystems have
Impact on
Chemical pollution
biological diversity
been associated with the construction of reservoirs in the Belorussian
part of the Dnipro Basin. Flowing rivers have been converted into
stagnant water bodies with altered fl ow and temperature regimes,
resulting in changes in species diversity. Valuable indigenous species
have disappeared and have been substituted by opportunistic species
Modification and loss
Microbiological
of low or no value.
of ecosystems
pollution
In Ukraine commercial fi sh yields signifi cantly increased by up to
Figure 14 Linkages between eutrophication and other
20,000-23,000 tonnes immediately after the construction and fi lling of
transboundary issues
the reservoir chain. However, valuable fi sh species including sturgeon,
pollution issues such as suspended solids, chemical pollution and
herring and sabre carp (Pelecus cultratus L.) have virtually disappeared
microbiological pollution are also closely linked.
since this period and currently only can be found in the Dnipro Estuary.
Semi-submerged vegetation thickets have intensively developed in
Deterioration of water quality due to intensive algal blooms.
the shallow-water sections over the course of the operational life of
Reduced fl ow circulation and extensive shallow-water sections in the
the reservoirs. The high density of this vegetation aff ects light and air
reservoir chain in Ukraine have intensifi ed the eff ects of water pollution
penetration, causing anoxic conditions in the bottom water layer, thus
in the Dnipro Basin. The most visible indication of pollution is the
reducing the fi sh spawning value of the ecosystem. Spawning and
increased frequency of algal blooms related to high loads of nutrients
fattening areas in the Dnipro and its reservoirs have been reduced by
(especially nitrogen and phosphorus) entering the Dnipro and its
three-fold.
reservoirs. Within Ukraine, the total area of shallow-water sections in the
reservoir chain is 1,341 km2 (Table 24). Of that, aquatic vegetation covers
Regional analyses and trend of eutrophication
480 km2 with a total mass of over 300,000 tonnes/year. Higher aquatic
processes
plants (reed, rush, cattail, etc.) occupy approximately one-third of the
Period up to the 1960s:
total shallow-water area. Reduced water circulation and expansion
This period was characterised by moderate growth in population size and
of shallow-water sections, however, frequently leads to (virtually
water consumption for domestic, agricultural and industrial purposes.
annual) algal blooms, stimulated by high loads of nutrients (nitrates
There was only insignifi cant water fl ow regulation in the main river basins
and phosphates) received by the Dnipro reservoirs. As a result of this,
for the purposes of energy production, irrigation and transport.
large quantities of dead algae fall to the bottom, representing a source
of secondary pollution. Shallow-water sections are also conducive to
Sewerage water treatment systems and agriculture practices did not
provide for the reduction of the infl ux of nutrients to the Danube,
Table 24
Shallow-water sections in the Dnipro reservoirs
Dnipro and Don Rivers. Nitrogen remained the limiting nutrient for the
Area
algae blooms in the fresh and marine water systems.
Reservoir
km2
% of area
Kyiv reservoir
312
34.0
Period from the 1960s up to the 1990s:
Kaniv reservoir
167
26.0
Stable population and water consumption for domestic and
Kremenchug reservoir
410
18.0
industrial purposes characterised this period. Strong regulation (dams
Dniprodzerzhinsk reservoir
182
32.0
construction) of the water fl ow in the Dnipro, Don and Kuban Rivers
Dniprovsky reservoir
160
39.0
for the purposes of energy production, irrigation and transport was
Kakhovka reservoir
110
5.1
undertaken during this timeframe. Rapid growth (up to ten times) of
Total
1 341
19.1
fertilizer usage occurred in the Black Sea Basin including the Danube,
34
EUTROPHICATION IN THE BLACK SEA REGION IMPACT ASSESSMENT AND CAUSAL CHAIN ANALYSIS
Dnipro and Don River systems. Sewerage water treatment systems
Economic, health impacts and other social and
and agriculture practices did not provide for the reduction of the
community impacts
infl ux of nutrients to the Danube, Dnipro and Don Rivers. The Black
Pilot assessment of socio-economic damage of eutrophication
Sea tributaries and Azov Sea experienced a rapid increase of nitrogen
in the Ukrainian part of the Black Sea Basin (pilot version)
infl ux from rural territories. Phosphorous became the limiting nutrient
Over the last 30 years the environmental quality of the Black Sea has
for the algae development in the Black Sea Basin. Harmful algae blooms
deteriorated due to the eutrophication of the waters, resulting in
became evident in the Black Sea Basin.
alarming algal overgrowth. Between 1973 and 1990, fi sh deaths were
estimated at fi ve million tonnes, representing 2 billion USD at market
Period from the 1990s through the present:
cost. A further consequence is that tourist visits to the Black Sea coast
This has been a relatively stable period in terms of urbanisation and
have decreased, leading to economic losses for the tourist industry. A
agriculture practices in the Danube Basin. The Don and Dnipro Basins
study performed within the framework of the Black Sea Environmental
have experienced stable population and water consumption levels, and
Programme (BSEP) estimated that in 1995 the annual economic loss due
a signifi cant reduction fertilizer usage. This has resulted in a reduced
to tourist disaff ection in this region was close to 360 million USD for a
infl ux of nitrogen to the fresh and marine water systems from rural
10% decrease in the environmental quality. Thus, the annual losses due
areas, so that nitrogen became the limiting nutrient for the algae
to Black Sea environmental problems, including eutrophication, could
growth in the Black Sea waters. Sewerage water treatment systems and
be approximately estimated as 500 million USD.
agriculture practices do not allow reduction of the input of nutrients to
Table 25
The scenario trophic levels of the Black Sea main river
the Danube, Dnipro and Don Rivers. There has been little reduction of
basins
the eutrophication phenomena in the Black Sea Basin.
Years
Basins
Since 90th till the
Coming
Till the 60th
Since 60th till 90th
present time
decades
Forecast for coming decades:
Danube and its tributaries
I - II
I ≠ III
I - III
I - II
If the projected fi gures for surface water extraction provided by eight
Dnipro and its tributaries
I - II
I-III
I-II
I - III
Danube countries in 1998 are representative, it can be anticipated that
Don and its tributaries
I - II
I - IV
I - III
I - IV
the overall volume extracted from the Danube Basin could increase
by approximately 100% between 1997 and 2020. The extraction of
For the purposes of this study, additional research was carried out to
raw water from the Danube River system, however, will depend on
assess diff erent impacts of eutrophication at the local level. Socio-
the quality and availability of surface water at the river stretches and
economic damage caused by eutrophication is understood to be a
locations where the water is needed.
sum of additional expenses spent to obtain products and services
of proper quality in the industrial, agricultural and municipal sectors.
If the projected fi gures for wastewater discharge provided by nine
The conception of seasonal changes of water quality and the infl uence
Danube countries in 1998 are representative, it can be anticipated
of these changes on the costs of services and products and on the
that the total volume discharged into the Danube River system could
quality of the resources (expressed in monetary value) is the basis of the
increase by about 50% between 1997 and 2020.
assessment of the above-mentioned additional expenses.
Implementation of the best available technologies and best
The methodological framework of the present study consists of research
environmental practices in the states of the Danube Basin is anticipated.
conducted by the University of Essecs team and the research described
This would result in a reduction of the nutrient infl ux and trophic level
in the Methodology of Assessment of the Damage of the Consequences
of the Danube River system. Signifi cant increase of fertilizer usage and
of the Emergency Situations of Technogenic and Natural Origin, studies
water consumption for irrigation purposes in the Dnipro and Don River
of the National Academy of Ukraine, and on the recommendations of
Basins is forecast. The treatment facilities of settlements' sewerage
the Ministry of Environment of Ukraine in environmental economics
waters and agriculture practices will not suffi
ce to reduce the infl ux of
from 1994 ≠ 2001.
nutrients, resulting in an increase in the trophic levels of these basins.
Phosphorous will become the limiting nutrient for algae growth in the
This present study is one of the fi rst attempts to assess, in economic
Black Sea waters. The trophic level will grow and harmful algae blooms
terms, damage caused by eutrophication to the economy of Ukraine.
will therefore expand in the Black Sea Basin.
Geographically, the scope of the pilot study is limited to the 5 Southern
regions of Ukraine (Republic of Crimea, city of Sevastopol, Odes'ka,
IMPACT ASSESSMENT, EUTROPHICATION
35
Mykolaevs'ka and Khersons'ka regions); methodologically, the study
microstephanus Slastenenko, Lucioperca marina, Gymnocephalus schraetser,
is limited by the scarcity of data, novelty of the approach and limited
Zingel zingel, Zingel streber streber, Callionymus belenus Risso, Acipenser
time and space for reporting. Results obtained should be considered
ruthenus Linnaeus, Umbrina cirrosa, Trigla lucerna Linnaeus).
tentative and further research is obviously needed.
Based on the described approach, annual damage is estimated to be:
D = 57.24 mln UH or 10.78 mln USD.
2
Main damage indicators:
1. Reduced commercial values of the water bodies (fi sheries and other
3. Increased costs of drinking water treatment.
water bodies products);
The costs of drinking water treatment were assessed on the basis of
2. Reduced biodiversity of the water bodies;
the average cost of water to the consumer in the municipal sector
3. Increased costs of drinking water treatment;
and the volume of water consumption in the regions aff ected by
4. Clean-up costs of waterways (dredging, weed-cutting);
eutrophication.
5. Reduced recreational and amenity value of water bodies for water
sports, (bathing, boating, windsurfi ng, canoeing), angling, and
Experimental studies show that eutrophication damage is meaningful
general amenities (picnics, walking, aesthetics);
for the southern part of Ukraine during 4 months in the year. Using the
6. Net economic losses for commercial aquaculture and shellfi sheries;
same approach as when calculating the increase in fi sheries costs, the
7. Negative ecological eff ects on biota (arising from changed nutrient
value of the coeffi
cient is assessed to be 0,945. Thus, economic damage
status, pH and oxygen content of water), resulting in both changed
caused by eutrophication via increased costs of drinking water for the
species composition and loss of key or sensitive species;
region equal D = 7.2402 mln UAH or 1.36 mln USD annually.
3
8. Costs of legislation compliance arising because of negative impacts
of nutrient enrichment.
4. Clean-up costs of waterways (dredging, weed-cutting).
Costs were assessed based on the data of the enterprises involved in the
Assessment of the indicators:
clean-up works of the water bodies and waterways. The majority of such
(Methods of calculation are provided in the Annex; only the monetary
work is carried out in Ukraine by the "Ukrrechfl ot" company. The annual
assessments are presented here.)
assessment is calculated as: D = 0.2 mln UH or 0.038 mln USD.
4
1. Reduced commercial values of the water bodies (fi sheries and other
water bodies products)
5. Reduced recreational and amenity value of water bodies for water
A reduction of commercial value has been taking place during the past
sports (bathing, boating, windsurfi ng, canoeing), angling and
30 years with the increasing anthropogenic pressure on the Dnipro
general amenities (picnics, walking, aesthetics).
Basin and Ukrainian share of the Black Sea Basin. This process takes place
This indicator is diffi
cult to calculate since the majority of such changes
with an increased effi
ciency, and eutrophication plays a signifi cant role
in the priorities of the tourists are not refl ected in the statistics. Several
in it. Impact of the eutrophication has a seasonal character and may
recreational industry studies, however, show a relationship between a
be, by our estimation, assigned a range of 5 ≠ 7% of total loss. Thus the
reduction in tourist visits to a water body and eutrophication. We assume
annual damage is estimated to be: D = 2.1945 mln UAH or 0.41 mln
that the majority of economic damage is borne by the small private
1
USD (by rate UAH /USD).
businesses serving the tourists. Literature shows that the income may
decrease by up to 10-15% during an algae bloom. Thus, the assessment
2. Reduced biodiversity of the water bodies.
of the damage D5 is assesed as: D = 0.43 mln UAH or 0.81 mln USD.
5
The economic value of the decrease in biodiversity has been assessed on
the basis of provisions of the Cabinet of Ministries of Ukraine and taking
6. Net economic losses for commercial aquaculture and shellfi sheries.
into account studies conducted by experts. The decrease of one species
Losses for commercial aquaculture are directly connected with changes
is assessed on the basis of the average number of individuals, or, if the
in habitats. Shellfi sh yield has dropped by 7 times compared to the 1970
above is not possible, on the basis of the average costs of maintaining
level. Aquaculture and shellfi sheries are scattered and non-organised in
one species' perseverance, which is 20 mln USD (Reimers approach,
the Ukrainian part of the Black Sea Basin, however. As a result, statistics
1994). (Eudontomyzon mariae Berg, Acipenser nudiventris Lovetzky, Huso
are scarce and this assessment is based on experts' judgment.
huso ponticus Salnikov et Malatski, Umbra krameri Walbaum,Vimba vimba
tenella, Barbus barbus borysthenicus Dybowski, Chalcalburnus chalcoides
Eutrophication impacts on the decrease of aquaculture income are
mento, Gobio uranoscopus, Barbus tauricus Kessler, Hippocampus guttulatus
assessed to be 8-12%. Decrease of the area of traditional aquaculture is
5 Damage is quite significant; however it represents "monetary value" approach towards biodiversity decrease that does not have "reverse dynamics" in the future regardless any financial and
organisational efforts of the humans.
36
EUTROPHICATION IN THE BLACK SEA REGION IMPACT ASSESSMENT AND CAUSAL CHAIN ANALYSIS
assessed according to the national standard to be 17,000 per ha. Thus,
authorities in some specifi c areas are forced to use treated eutrophic
eutrophication impacts on aquaculture and shellfi sheries may be
waters for drinking purposes, posing a threat to human health. There
assessed as: D = 0.29 mln UAH or 0.05 mln USD.
are two major health risks associated with using such waters:
6
7. Negative ecological eff ects on biota (arising from changed nutrient
1. Risks linked to the presence of organic matter: Treating raw water
status, pH and oxygen content of water), resulting in both changed
with high levels of organic matter is always technically diffi
cult. It can
species composition and loss of key or sensitive species.
lead to the creation of carcinogenic by-products (Trihalomethanes
It is complicated to assign monetary values to negative impacts
(THMs), other chlorinated components or ozonides) as a result of
on biota, in part because they are refl ected already in the results of
their reaction with disinfectants. If the water is eutrophic, then in
economic activities associated with the water bodies (e.g., decrease
addition to the organic matter that would be present under normal
in fi sheries, biodiversity and commercial aquaculture). For this report,
circumstances, there will also be the organic matter produced by
negative consequences to the biota have been assessed by analysing
the cyanobacteriae (toxins and intracellular materials). An apparent
environmental protection costs at the regional level and by defi ning
association between bladder cancer and THMs has already been
the weight of the costs for preservation of the biodiversity of the water
demonstrated. As chlorinated water contains a large number of
bodies, with the consideration of the relative value of eutrophication.
by-products, however, it is not possible from such epidemiological
Expert assessment suggests that for the protected areas in Ukraine,
studies to conclude that specifi c THMs are human carcinogens.
the impact of eutrophication on decreased biodiversity of the water
bodies is 30-45% (. .2002). Thus, negative ecological eff ects on biota are
2. Risks linked to the presence of specifi c cyanobacteria in fresh waters:
assessed as: D = 17.22 mln UAH or 3.24 mln USD.
When eutrophication leads to the development of cyanobacteria
7
that are potentially toxic, the elimination of these toxins is complex.
8. Costs of legislation compliance arising because of negative impacts
When faced with eutrophication of a water reservoir, the best
of nutrient enrichment.
option, where possible, is to rely on an alternative water supply
The costs of legislation compliance arising due to nutrient enrichment
source. If it is not possible, then some changes can be made to
have never been studied and are not reported in the offi
cial statistics.
the existing treatment chain, but there is no guarantee that the
According to the assessment of the offi
cers of the Main Ecological
end product will be completely safe. It is necessary to inform the
Inspection of the Ministry of Environment of Ukraine, these costs
receiving population of the potential risks and distribution of bottled
constitute not more then 10% in seasonal form (where the season is
water to the population at risk can be an option to consider.
the whole eutrophication cycle, namely for the 8 months of March
through October). Therefore, these costs are assessed to be: D = 0.75
8
mln UAH or 0.14 mln USD.
Scoring and list with
The total value of the economic damage resulting from eutrophication
justification of the priority
impacts for the 5 studied regions in Ukraine is 85.647 mln UH per year,
impacts for the Black Sea Basin
or 16.13 mln USD. This fi gure exceeds the income portion of the
consolidated budget of the environmental protection funds of Ukraine
(including the state fund and regional and local funds) by two times,
Environmental impacts
clearly illustrating the necessity of tackling the eutrophication problem
GIWA Methodology enables the implementation of expert qualitative
on the national, regional and international levels. This pilot assessment
assessment procedures to rank the importance of factors if there
is in line with the internationally-recognised assessment of environmental
are not suffi
cient quantitative data available. The ranks of relative
damage to the regional economy as 500 mln USD annually and represents
importance, intensity or magnitude of diff erent factors or activities are
only a portion of the research on economic damages of eutrophication.
chosen in accordance with Saaty's fundamental scale. According to this
approach, a rank of zero is given to the activity (impact, factor) that has
Health impacts and other social and community
no importance for the issue under question. The activity (impact, factor)
impacts
of the lowest importance gets a rank of 1. Ranks of other activities are
In addition to the health impacts from Harmful Algae Blooms (HABs)
introduced in accordance to the pair-wise comparisons based on the
resulting from eutrophication described in Section 1.3.4.3, local
experts' experience and the scale shown in Table 26.
IMPACT ASSESSMENT, EUTROPHICATION
37
The national experts' points of view on the relative importance of
term debilitating symptoms associated with chronic exposures to low
diff erent indicators for the environment impacts of eutrophication are
toxin levels, although of great concern, are less known and subjected to
listed in Table 27 and 28.
increasing investigation. In addition to direct human health concerns,
public perception of coastal health in general, and thereby safety for
Socio-economic impacts
consumers and coastal inhabitants more specifi cally, is intimately
There are many societal impacts of eutrophication through HABs
linked to water color, clarity and odor; fi sh and shellfi sh abundance;
resulting in signifi cant economic commitments in both the EU and
and governmental advisories for unseen microbes and toxins.
the Black Sea sub-region toward reducing threats to local economies,
living resources and public health. The human health threat posed by
Putting a cost on eutrophication as an environmental problem is a com-
HAB toxin production is by far the most important, exerting a high
plex task for the simple reason that there is no absolute defi nition of when
cost due to necessary monitoring programmes for toxins in shellfi sh,
nutrient enrichment becomes a problem - that is, when it has adverse ef-
fi sh, and drinking waters designed to reduce public exposure. Both
fects. Algal and higher plant growth is determined by a combination of
acute illnesses and mortality are now well established, while long-
interdependent hydrochemical, geographic and climatic factors, and so
a given level of nutrients in one water body may give rise to adverse ef-
Table 26
Saaty's fundamental scale
fects with associated costs, but in another water body, or the same one at
Intensity (rank) Definition
Explanation
of Importance
a diff erent time, there may be no eff ects and thus no costs. Moreover, the
1
Equal Importance
Two activities contribute equally to the objective
threshold at which nutrient enrichment becomes a problem varies. The
2
Weak
central problem is the nature of the relationships between nutrient enrich-
Experience and judgment slightly favor one
3
Moderate im
portance
activity over another
ment, the resultant eff ects, and the costs. These can be diffi
cult to defi ne.
4
Moderate plus
Experience and judgment strongly favor one
5
Strong im
portance
activity over another
Drinking water treatment costs (to remove toxins, algal
6
Strong plus
decomposition products and nitrogen from fresh water for
Very strong or demonstrated
An activity is favored very strongly over another;
7
human health and ecological reasons).
importance
its dominance demonstrated in practice
8
Very, very strong
Nutrient enrichment and algal blooms incur signifi cant costs for fresh
The evidence favoring one activity over another is
9
Extreme importance
water supply and sewerage treatment operators. Some of these costs
of the highest possible order of affirmation
Table 27
Environmental Impacts of Eutrophication of the Black Sea basin
Years
Environmental Impacts
Impact indicators
Adverse changes in structure and
Reduction in biodiversity and
Damaging and destruction
1960-1970
1980-1990
functioning of the water ecosystems
in fish resources
of habitats
Algae blooms
- abundance
North-West Black Sea
North-West Black Sea
7
5
5
- timing
spring-summer, 12 events
spring-summer, 42 events
5
3
3
- duration
0.5 month
0.5-1.5 months
1
1
1
Change in dissolved oxygen
Hypoxic area was about
Hypoxic area was about
5
5
5
concentration
7 700 km2 in 1996
14 000 km2 in 2 000
Increase of nitrates concentrations
Change in nutrient concentration
7
3
3
in two-three times
Increased water turbidity
1
1
1
Table 28
Environmental Impacts of Eutrophication of the Azov Sea basin
Years
Environmental Impacts
Impact indicators
Adverse changes in structure and
Reduction in biodiversity and
Damaging and destruction of
1960-1970
1980-1990
functioning of the water ecosystems
in fish resources
habitats
Algae blooms
Azov Sea
- abundance
Average part
Average part
6
5
7
- timing
summer
summer
4
5
3
- duration
0,5-1 month
1 month
1
1
1
Change in dissolved oxygen concentration
?
?
Change in nutrient concentration
7
7
6
Increased water turbidity
7
7
7
38
EUTROPHICATION IN THE BLACK SEA REGION IMPACT ASSESSMENT AND CAUSAL CHAIN ANALYSIS
are for complying with established national and European regulations,
Health costs to humans.
especially for nutrient concentrations, while others relate to the adverse
Eutrophication poses three potential health risks to humans, livestock
eff ects of algal blooms and their decomposition products. In reservoirs,
and pets. These arise from the high nitrate content of drinking water,
the eff ects of eutrophication can be costly, particularly if they mean the
toxic algal blooms and an enhanced presence of bacterial pathogens.
closure of treatment plants. In the process of water purifi cation, fi ltration
Algal blooms in eutrophic water bodies pose a potential health
and straining measures can cope with large numbers of small algae,
hazard to humans and animals in contact with the water. There are
but can become blocked when large algae are present, thus reducing
25 species of cyanobacteria that produce a variety of toxins including
their eff ectiveness for water treatment. When purifi cation has to be
neurotoxins, hepatotoxins and lipopolysaccharides. A further risk
stopped for fi lter cleaning, supply problems can occur, with consequent
arises amongst people prone to allergic reactions coming in contact
increased costs for water companies and receiving households and/or
with water containing cyanobacterial blooms. In addition, water high
shareholders of water companies.
in dissolved organic carbon, a by product of dense algal blooms, can
produce potentially carcinogenic and mutagenic trihalomethanes
Reduced recreational and amenity value of water bodies for
when disinfected by chlorination. In the tropics, eutrophic waters can
water sports (bathing, boating, angling) and general aesthetics.
contribute to the spread of diseases such as cholera and typhoid,
Many standing and running fresh and marine water bodies are used
and produce an environment in which mosquito larvae fl ourish, so
extensively for recreational and amenity purposes, such as bathing,
encouraging malarial infection. As these events appear to be rare,
boating, windsurfi ng and canoeing, and for waterside activities, such
these costs in this category can be taken to be close to zero.
as angling, dog-walking, rambling and picnics. Eutrophication results in
a loss of recreational and amenity value, particularly if water becomes
Expert assessments of socio-economic damage of eutrophication for
turbid, emits unpleasant odours and is aff ected by algal blooms. Such
Ukraine are presented in Tables 29 and 30.
blooms may be simply unpleasant, with green slimy margins to the
water, or toxic if blue-green algae are present. But such blue-green
Table 29
Socio-Economic Impacts of Eutrophication of the Black
Sea basin
algal blooms do not aff ect all recreational users in the same way. At
Economic
Health
Social and
high risk of harm are those engaged in swimming, diving, wind-surfi ng
Impact indicators
Impacts
Impacts
community Impacts
and water-skiing. At medium risk are canoeists, sailors and walkers, and
1. Reduced biodiversity of water bodies
5
0
7
at low risk would be those engaged in boating and pleasure cruising
2. Drinking water treatment costs
4
2
4
(some of whom may not even notice the presence of a blue-green algal
3. Clean-up costs of waterways
1
0
1
bloom). There is no national database recording how eutrophication
4. Reduced recreational and amenity value
2
1
2
of water bodies for water sports
aff ects the recreational and amenity value of water bodies.
5. Net economic losses for commercial
3
1
5
aquaculture, fisheries, and shell-fisheries
Economic losses for commercial aquaculture, fi sheries and
6. Health costs
0
1
0
shellfi sheries.
Although the eutrophication of lakes and rivers increases the biomass
Table 30
Socio-Economic Impacts of Eutrophication of the Azov
of fi sh present, the associated changes in species composition due to
Sea basin
ecosystem changes frequently result in a reduction in the economic
Economic
Health
Social and
Impact indicators
Impacts
Impacts
community Impacts
value of the fi shery. In addition, shell-fi sheries can be adversely aff ected
1. Reduced value of waterside dwelling
1
1
1
by toxins from algal blooms and extreme eutrophication can result in
2. Reduced value of water bodies for commercial
0
0
0
uses
deoxygenation that kills all aquatic life. Thus, the livelihoods of those
3. Drinking water treatment costs
0
0
0
involved in commercial fi shing can be adversely aff ected, even though
4. Clean-up costs of waterways
4
1
5
revenues from some fi shing activities (e.g. recreational) may rise.
5. Reduced value of non-polluted atmosphere
2
0
1
Commercial fi sheries have declined in the Dnipro reservoirs due to
6. Reduced recreational and amenity value of
0
0
0
water bodies for water sports
eutrophication.
7. Net economic losses for formal tourist industry
2
0
3
8. Net economic losses for commercial
3
3
4
aquaculture, fisheries, and shell-fisheries
9. Health of humans
0
2
2
IMPACT ASSESSMENT, EUTROPHICATION
39
Causal chain analysis
Introduction to methodology
the GIWA CCA focuses on a particular system and then only on those
Causal Chain Analysis (CCA) traces the cause-eff ect pathways from the
issues that were prioritised during the scoping assessment. The
socio-economic and environmental impacts back to their root causes.
starting point of a particular causal chain is one of the issues selected
The GIWA CCA aims to identify the most important causes of each
during the Scaling and Scoping stages and its related environmental
concern prioritised during the scoping assessment in order to direct
and socio-economic impacts. The next element in the GIWA chain is
policy measures at the most appropriate target to prevent further
the immediate cause; defi ned as the physical, biological or chemical
degradation of the regional aquatic environment.
variable that produces the GIWA issue. For example, for the issue of
eutrophication the immediate causes may be, inter alia:
Root causes are not always easy to identify because they are often spatially
Enhanced nutrient inputs;
or temporally separated from the actual problems they cause. The GIWA
Increased
recycling/mobilisation;
CCA was developed to help identify and understand the root causes of
Trapping of nutrients (e.g. in river impoundments);
environmental and socio-economic problems in international waters and
Run-off and storm waters.
is conducted by identifying the human activities that cause the problem
and then the factors that determine the ways in which these activities
Once the relevant immediate cause(s) for the particular system has (have)
are undertaken. However, because there is no universal theory describing
been identifi ed, the sectors of human activity that contribute most
how root causes interact to create natural resource management
signifi cantly to the immediate cause have to be determined. Assuming that
problems and due to the great variation of local circumstances under
the most important immediate cause in our example had been increased
which the methodology will be applied, the GIWA CCA is not a rigidly
nutrient concentrations, then it is logical that the most likely sources of
structured assessment, but should be regarded as a framework to guide
those nutrients would be the agricultural, urban or industrial sectors. After
the analysis, rather than as a set of detailed instructions. Secondly, in an
identifying the sectors that are primarily responsible for the immediate
ideal setting, a causal chain would be produced by a multidisciplinary
causes, the root causes acting on those sectors must be determined.
group of specialists that would statistically examine each successive
For example, if agriculture was found to be primarily responsible for the
cause and study its links to the problem and to other causes. However,
increased nutrient concentrations, the root causes could potentially be:
this approach (even if feasible) would use far more resources and time
Economic (e.g. subsidies to fertilisers and agricultural products);
than those available to GIWA6. For this reason, it has been necessary to
Legal (e.g. inadequate regulation);
develop a relatively simple and practical analytical model for gathering
Failures in governance (e.g. poor enforcement); or
information to assemble meaningful causal chains.
Technology or knowledge related (e.g. lack of aff ordable substitutes
for fertilisers or lack of knowledge as to their application).
Conceptual model of the CCA
Once the most relevant root causes have been identifi ed, an
A causal chain is a series of statements that link the causes of a problem
explanation, which includes available data and information, of how
with its eff ects. Recognising the great diversity of local settings and the
they are responsible for the primary environmental and socio-economic
resulting diffi
culty in developing broadly applicable policy strategies,
problems in the region should be provided.
6 This does not mean that the methodology ignores statistical or quantitative studies; as has already been pointed out, the available evidence that justifies the assumption of causal links should be
provided in the assessment.
40
EUTROPHICATION IN THE BLACK SEA REGION IMPACT ASSESSMENT AND CAUSAL CHAIN ANALYSIS
Immediate causes
Table 31
The Estimated Input of Total Nitrogen into the Black Sea
Inputs, thousand tonnes per year
Country
Nutrients in river discharged into the Black Sea
Domestic *
Industrial *
Riverine
Subtotal
system
Bulgaria 2.5
71.0
19.2
92.7
From the year 1950 until 2000, the use of mineral nitrogen in fertilizers
Georgia
0.9
44.4
132.0
177.3
for agriculture in the 15 EU member states has increased tenfold, from
Romania
9.5
31.0
36.3
78.6
1 to 9-10 million tonnes.
Russian Federation
0.4
0.0
62.3
62.7
Turkey
1.6
0.0
0.0
1.6
12
Ukraine
5.4
0.6
32.0
38.0
ear)
Other
countries
198.3
10
Sub Total
20.3
146.9
281.8
647.3
onnes/y
8
*direct discharges of nutrients to the Black Sea from its coastal zone
6
Table 32
The Estimated Input of Total Phosphorus to the Black Sea
(million t
Inputs, thousand tonnes per year
4
Country
Domestic Industrial Riverine Subtotal
2
onsumption
Bulgaria 0.7
0.0
1.9
2.6
N c
0
Georgia
0.3
0.3
11.6
11.6
1930 1935 1940 1945 1950 1955 1960 1965 1970 1975 1980 1985 1990 1995
Romania
2.6
1.7
5.7
9.9
Year
Russian Federation
0.5
0.0
6.1
6.6
Figure 15 Mineral nitrogen (N) fertilizers consumption ≠ E.U.15
Member States, from 1930 to 1999.
Turkey
0.4
0.0
0.0
0.4
Ukraine
2.2
0.1
3.6
5.9
Other
countries
13.6
Subtotal
6.7
2.0
28.2
50.5
The Black Sea littoral countries also followed this trend in using
increasing amounts of mineral nitrogen and phosphorus. During the
same timeframe, the amount of nitrogen released by animal husbandry
rose to nine million tonnes. The nitrogen pressure on the environment
According to the assessment of the Southern Scientifi c Center of the
currently reaches 18 million tonnes solely from agriculture. Agricultural
Academy of Science of Russia, 32.5 thousand tonnes of nitrogen and 3.2
practices have also led to a reduction of permanent grassland and
thousand tonnes of phosphorous were discharged by the Don to the
other "buff er" areas such as ditches, hedges and wetlands, a situation
Taganrog Bay of the Azov Sea. The impact of the Don discharge on the
which favours erosion, run-off and quick drainage of nutrients to the
nutrient content in the Taganrog Bay was the most signifi cant during
water bodies.
spring time. This discharge defi ned the high concentration of nitrogen
and phosphorous compounds in the delta of Taganrog Bay: ammonia
Nutrient loads from rivers and coastal states.
ions: 70-9-, nitrites ≠ 17-20, nitrates ≠ 520-600, phosphates ≠ 70-80 mg
Based on available scientifi c assessments and fi ndings of the
per cubic meter.
Transboundary Diagnostic Analysis (1995), the overall yearly input of
nutrients from human activity amounts to 647,000 tonnes of nitrogen
Increased recycling/mobilisation, trapping of nutrients, runoff
and 50,500 tonnes of phosphorus (Black Sea Pollution Assessment,
and storm waters.
1998). These estimates also included the river discharges.
Based on available scientifi c assessments and fi ndings of the
Transboundary Diagnostic Analysis (1995), the atmospheric input of
The input of nutrients and other pollutants from land-based sources is
total nitrogen to the Black Sea is estimated to be 400 thousand tonnes
refl ected in data sets presented in the national reporting to the Black
per year and is comparable in magnitude to the total input of this
Sea Commission for the period 1996-2000. The available data, although
nutrient from rivers, domestic and industrial sources. If these estimates
not presented in a harmonised manner, explicitly shows a steady
are correct, the air emissions are signifi cant sources of nitrogen input
decline in the discharges of wastewaters and individual pollutants and
into the marine environment.
nutrients in the territorial waters of the Contracting Parties.
CAUSAL CHAIN ANALYSIS
41
Table 33
Emission of nitrogen oxides from the stationary sources
Sector analysis
in Ukraine
Emission (hundred tones)
Change in 2001 versus 2000
Main sectoral causes for agriculture
Branches of Industries
2000 2001
(hundred
tones)
%
The greatest sources of diff use pollution are related to agricultural
Agriculture, Hunting and
1.1
1.1
-0.1
-9.1
activities, to households not connected to sewer systems and to
related services
Mining 13.6
14.5
+0.9
+6.6
atmospheric depositions. Inadequate land use and the excessive
Manufacturing
97.0
105.5
+8.5
+ 8.8
application of mineral and organic fertilizers result in high nutrient
Energy production
186.3
184.5
-1.8
-1.0
inputs into the rivers and ultimately into the Black Sea.
Construction
1.2
1.4
+0.2
+16.7
Other brunches
20.8
21.2
+0.4
+1.9
Total
320.0
328.1
+8.1
+2.5
Data on the emission of nitrogen oxides from stationary sources of
pollution in Ukraine are listed in Table 33.
Analysis and selection of the 2-3 most significant
immediate causes
An expert team was used to identify the most signifi cant immediate
causes of eutrophication in the Black Sea region. These experts
developed separate rankings of the immediate causes of eutrophication
for the Black and Azov Seas. Since it was recognized that the immediate
causes of eutrophication of the seawaters and of the rivers may be
Figure 16 The agricultural nitrogen air/soil/water exchanges and
diff erent, separate scores were introduced for these components.
possible impacts.
According to the Causal Chain Analysis Methodology, the expert
team had the task of identifying the causes considered to be the
most signifi cant at the basin scale, which would then be further
The quantities of inorganic fertilizers used in those Black Sea states with
analysed. Expert team opinion is based on published research data
transitional economies were drastically reduced in the 1990s due to high
and international reports (see: Sources).
prices and to the inability of the population involved in the agricultural
sector to pay for fertilizers. For example, in Georgia the quantity of
The expert assessments of diff erent immediate causes of eutrophication
inorganic fertilizers used in the Black Sea catchment area constituted
in the Black Sea Basin are presented in Table 34. According to these
300 - 370 thousand tonnes annually prior to 1989. In 1999, the applied
estimations, the most important immediate causes of eutrophication
volume of nutrients (N and P) amounted to 39.1 thousand tonnes of N
are "discharges of effl
uents from agriculture and municipal wastewater"
and 36.9 thousand tonnes of P. Demand for mineral fertilizers in Ukraine
from settlements and "runoff and storm waters from coastal zone" of
is estimated at 7 million tonnes a year. Even in the most successful year,
rural territories.
demand for mineral fertilizers was not covered by local production.
Currently, even though three Ukrainian plants (Vynitsa, Sumy and
Table 34
Immediate Causes of Eutrophication
Immediate Causes
Assessed area
A- sea water
Discharge of effluents from agriculture
Runoff and storm waters
Increased recycling/
Discharge of solids
Trapping of nutrients
Atmospheric deposition
B- fresh water
and municipal waste water
from coastal zone
mobilisation of nutrients
5
1
3
2
3
4
Black Sea
A
B
5
1
3
2
3
1
5
3
5
1
2
3
Azov Sea
A
B
2
3
2
1
2
1
42
EUTROPHICATION IN THE BLACK SEA REGION IMPACT ASSESSMENT AND CAUSAL CHAIN ANALYSIS
Donetsk) produce approximately 600 thousand tonnes of phosphorus
Centralised water supply systems are available in virtually all urban areas
fertilizers a year, this is not suffi
cient to meet the country's needs. Total
located in the Dnipro Basin (e.g. in Belarus, 95% of all municipalities are
application of pesticides was reduced from 62.3 thousand tonnes in
covered by such systems). They are poorly developed in the majority
1993 to 46.5 thousand tonnes in 1994. The high prices for fertilizers and
of the rural areas, however, particularly within the Ukrainian part of the
pesticides and inability of the population to pay were major causes of
basin.
reduced loads of discharges from diff use pollution sources.
In Ukraine, a centralised water supply service is available in 100% of
The area of arable land in the Dnipro Basin is 283,000 km2, or 55.4%
cities/towns, 89% of townships, and about 20% of rural settlements.
of the total basin area. Serious structural changes have taken place in
Centralised sewerage services are available in 94% of cities/towns,
the agricultural sector of the three riparian countries of the basin over
50% of townships, and about 3% of rural settlements. About 62% of
the last decade, leading to a continuous reduction in the proportion
the population is connected to a centralised sewerage service, mainly
of arable agricultural land compared with total agricultural output.
in the urban areas. The highest level of coverage is provided in the
Mineral fertiliser application has signifi cantly increased over recent
Zaporizhzhia (81.4%), Dnipropetrovsk (74.5%), Sumy (62%) and Kherson
years, however, and livestock production has stabilised following a
Oblasts, as opposed to the Volyn and Rivne Oblasts where coverage
period of steep decline. Private sector involvement schemes have
is low (less than 27%). According to expert estimates, this coverage is
been set up, resulting in a 6% increase in the area of farmland allocated
extremely low when compared to Western Europe.
for individual farming activities. One of the major causes of the loss of
arable land is deterioration of soil quality, with 50% of agricultural land
In general, major water supply/sewerage systems are in poor repair
being swamped or acidifi ed due to insuffi
cient levels of lime. Large areas
and have reached a high level of depreciation. The total length of
of agricultural land have also been inundated with shrubs. Erosion is
sewage mains within Ukraine is 33,840.9 km, with about 10% of the
also a continuing problem and inherent to agricultural fi elds located on
pipework reaching the highest level of depreciation. In addition, about
slopes with gradients of greater than 1.5≠2į. This has been aggravated
2,160 km is in extremely poor repair and requires urgent replacement.
because simple anti-erosion practices, such as lateral slope tillage, have
The poor state of municipal utilities in the Dnipro Basin is illustrated
been applied on only a third of this erosion-susceptible land.
by the fact that wastewater discharges from municipal wastewater
treatment plants have been recognised as a major (immediate) source
Numerous studies also recognise (see: Sources) that agricultural
of pollution.
practices that are not friendly towards the environment, and towards
water bodies in particular, are deeply rooted in the post-Soviet
The municipal utility sector accounts for a signifi cant proportion
countries, and, to a lesser extent, in the post-socialist countries, as
of the total volume of effl
uents received by the Dnipro Basin water
a heritage of the centralised planned economy of Soviet/socialist
bodies. Therefore the state of wastewater treatment plants and related
times. In order to change the attitudes and introduce agricultural
operation/maintenance costs are considered to have a signifi cant
techniques that would reduce nutrient discharge, public awareness
eff ect on the actual treatment level and quality of municipal effl
uents
must be signifi cantly raised, from the decision-making level down to
entering the water bodies of the Dnipro Basin. For example, in Ukraine,
the agricultural practitioners and farmers.
the actual capital expenditure in the water utility sector is currently
only 15≠20% of the required amount. As a result, municipal wastewater
Main sectoral causes for urbanisation
discharges accounted for 40%, or over 0.5 billion m3, of the total amount
Municipal sewerage waters are the most important source of sea
of insuffi
ciently treated or untreated wastewater received by the basin
pollution by nutrients; industrial discharges are less important. For
water bodies in 2001 (over 1.3 billion m3).
example, demand for municipal biological wastewater treatment
facilities in towns and settlements of the Autonomous Republic of
Apart from technical and economic problems, the level of available
Crimea, cities of Mykolaiv, Odesa, and Sevastopol exceeds capacity
technologies and willingness of the society to apply these technologies
by 273 thousand m3 per day. In the centralised water sewer system
are both very low. Eutrophication is traditionally considered by the local
of the coastal zone settlements, almost 25% of sewer pipelines are
and regional authorities responsible for water quality to be an issue that
dangerously worn out.
is not feasible to address:
1. Eutrophication is considered to be an unavoidable seasonal hazard,
which is impossible to tackle;
CAUSAL CHAIN ANALYSIS
43
2. Accepting the negative consequences of the eutrophication,
governance structures based on decentralisation and greater levels
authorities often at the same time demonstrate unawareness of
of autonomy at the regional level. Water and river management are
the possibilities to manage eutrophication on the local and regional
actually in the hands of several authorities and private individuals,
levels.
landowners and companies.
As a consequence, motivation for eutrophication management is
Countries in the Black Sea region can be divided into two main
very low. Local eff ective fi nancial and administrative mechanisms that
groups: the Balkan countries (Bosnia-Herzegovina, Croatia, Serbia and
would decrease the negative impacts of eutrophication on the regional
Montenegro plus Albania and Macedonia, which share a very limited
economy and population are practically absent. The public is also
part of the Danube catchment area) and the Newly Independent States
unaware of the negative economic, environmental and social impacts
(NIS), which include Belarus, Georgia, Moldova, Russia and Ukraine. Our
of eutrophication, and therefore, is not participating in eutrophication
further analysis is focused on the last group since it has the most
management.
signifi cant impact on the water quality. However, taking into account
the basin approach to the water management required by the recent EU
Eutrophication as such is of low concern to the authorities and the
Water Directive and other international water initiatives, policy option
public, except for the narrow circle of representatives of the scientifi c,
analysis shall focus only on this second group, which is not linked to
engineering and educational communities.
the EU Water Directive.
Analyses of the sectoral causes of
In Black Sea countries, many industrial plants were closed during the
eutrophication in the Black Sea region
last ten years. Industrial restructuring is usually not feasible and shifting
The summarised picture of sectoral causes of eutrophication in the
to cleaner technologies is even harder; technologies currently used are
Black Sea region is presented in the Conceptual Model of the CCA for
outdated and highly polluting. Water treatment facilities quite often are
the Black Sea Basin (Figure 17).
unable to meet the demand in water maintenance because of out-of-
date methods and treatment technologies, the gap between treated
volume and existing demand and low quality of communications.
Root causes
Decentralisation has often taken place before the establishment of a
clear legal framework and the development of institutional capacity
Economic drivers, legal and institutional causes
for environmental management at the regional level. Basic water laws
The past ten years have seen rapid and massive changes in the political
and regulations have been generally subject to repeated adjustments
and administrative systems of the Black Sea states and in the way in
and modifi cations. These have made long-term planning and fi nancing
which responsibilities and costs for freshwater and coastal water
diffi
cult and are not in the interest of private investors.
management are distributed. State domination has been replaced by
Impacts
Issues
Immediate causes
Sectors/Activities
Root causes
Environmental:
Eutrophication
Discharge of effluent
Agriculture
- Algae blooms
Economic
35%
- Sedimentation
- Turbidity
- Oxygen depletion
Urbanisation
Runoff and storm waters
Knowledge
35%
Socio-economic:
- Reduced biodiversity
Energy production
- Commercial fisheries
Technology
20%
- Drinking water treatment
Transport
10%
Governance
Figure 17 Flow Chart Diagram of the CCA for the Black Sea region
44
EUTROPHICATION IN THE BLACK SEA REGION IMPACT ASSESSMENT AND CAUSAL CHAIN ANALYSIS
Decentralisation has in some cases been accompanied by disintegration.
Danube River Protection Convention (DRPC), the Bucharest Convention,
New ownership structures and the transfer of control of water and
or both. The International Commission for the Protection of the Danube
sewage facilities to regional authorities have made the system more
River (ICPDR) and the Black Sea Commission are currently working on the
unstable and decreased the level of security and eff ectiveness of
implementation of the Directive. In particular, the Danube countries have
water resources management. Eutrophication as such is of low
committed themselves to making the necessary eff orts to implement
concern to the authorities and the public, except for the narrow circle
the WFD within their territory (ICPDR 3rd Plenary Session, 27-28 November
of the representatives of the scientifi c, engineering and educational
2000), while, from the offi
cial point of view, the position of the Black Sea
communities.
littoral countries is less clearly defi ned.
Most of the public authorities across the region point out insuffi
cient
It has to be added that a report on harmonisation of environmental
funds as the principal reason for their inability to carry out the needed
legislation of the Dnipro River countries with the legislation of EU
management reforms and infrastructure developments. Since
Member States has been recently produced within the framework of
international resources are limited, most regional authorities still rely
the Dnipro Basin Environment Programme. The report suggests that the
on support from the state for both construction and maintenance of
Draft Programme of harmonisation of the environmental legislation of
infrastructure and subsistence operational costs.
Ukraine with the legislation of the European Union, developed in 2001
under the agreement with the Ministry of Ecology and the Natural
A pilot study of the economic damage caused by eutrophication in
Resources Ukrainian Research Institute of Environmental Problems,
5 Southern regions of Ukraine has demonstrated that state fi nancing
can be recommended for all three Dnipro River countries. Taking into
is insuffi
cient to tackle the problem. Total eutrophication economic
account that water codes of the three Dnipro countries have a common
damage for the studied region has been roughly assessed as 16.13 mln
foundation, as well as the fact that this legislation did not undergo
USD per year. This fi gure exceeds the income portion of the consolidated
radical changes, the authors underline that there is good reason to
budget for environmental protection activities in Ukraine by two
believe that there should not be signifi cant diff erences between the
times, clearly indicating the necessity of involving private business and
Draft Programme for Ukraine and the ones to be prepared for Belarus
international initiatives in solving this acute regional problem.
and Russia.
Economic instruments, including appropriate water tariff s, are a
Based on their importance for the Dnipro countries, six top-priority
necessary element of eff ective water management that needs to be
documents were selected out of the EU water and environmental
strengthened in the whole Black Sea region. The involvement of the
legislation and the EU environmental legislation relevant for the
private sector in the construction, operation and management of water
water sector, to be compared with national legislation. The WFD was
and wastewater facilities can be an important source of fi nancing,
recognised to have the higher priority.
effi
ciency and innovation.
Therefore, taking into account the basin approach employed by the
Finally many public authorities report a severe lack of practical
WFD, and the requirement of cooperation with the Black Sea littoral
knowledge and skills in water resources management and place
countries in the development of integrated water management in the
this problem at the same level of importance as the lack of fi nances.
river basins, a high level of integration and coordination between both
This requires both funding and the commitment on the part of the
riparian countries and the countries lying in the Danube watershed is
authorities themselves to build up their capacity in this fi eld.
to be expected in regards to the environmental protection activities,
and water management in particular.
Analysis of current situation and trends based
on the EU Water Framework Directive
International projects and financing: general
Black Sea basin countries are not unrelated to the implementation of the
trends and analysis
EC Water Framework Directive (WFD) for several important reasons. First,
Identifying the sources of fi nancing of environmental and water
each of them receives EU fi nancial assistance in order to improve national
expenditures in the Black Sea countries is quite diffi
cult.
water infrastructures/management and the conditions under which
such assistance is provided refl ect the fundamental principles of the EU
One interesting policy issue is to what extent the countries rely on
water policy. Second, most of the countries are contracting parties to the
their domestic funds in fi nancing such expenditures. Among EECCA
CAUSAL CHAIN ANALYSIS
45
(Eastern Europe, Caucasus and Central Asia) countries, the domestic
there is still a long way to go before EECCA countries would absorb
share of total environmental-related-expenditures (EEE) varies widely
similar levels of environmental assistance as the EU accession countries
from country to country. According to the United Nations Economic
in the past.
Commission for Europe (UNECE), Russia, Moldova and Ukraine fi nance
more than 90% of EEE from domestic sources. Georgia seems to be
The diff erence between the EU accession and EECCA countries is
more dependent on foreign sources of fi nancing, which account for
even more apparent when looking at per capita IFI commitments to
62% of total national EEE.
environmental projects over the period 1996-2001. Among the Black
Sea basin countries, Czech Republic is at the forefront of the absorptive
For many Southern and Eastern European (SEE) countries, foreign
capacity of multilateral environmental loans. EECCA countries show
sources of fi nancing are playing the dominant role in fi nancing
instead low per capita commitments that can be attributed to the low
environmental investments. This is especially true for Albania, Bosnia-
demand for environmental investments and to the signifi cant impact
Herzegovina, and Serbia-Montenegro, while in Croatia and Macedonia
of the Russian fi nancial crisis in 1998, from which borrowing capacity of
domestic sources are relatively more important.
the region is only slowly recovering. Surprisingly, the highest per capita
environmental borrowing can be found among some of the lowest
Finally in EU candidate countries, external sources of fi nancing, in
income countries in the region (such as Georgia).
particular pre-accession funds of the EU, are relevant especially in small
countries (such as Slovenia).
Among the SEE countries, the highest per capita level of environmental
assistance was received in the 1996-2001 period by Macedonia, followed
Considering international environmental assistance to the Black Sea
by Albania and Croatia.
region, we have to distinguish between bilateral donors (including
individual countries, but also other institutions and organisations such
In the EU accession countries, environmental assistance accounted
as the European Commission) and International Financial Institutions
in the 1996-2001 period for a larger share of total assistance than in
(IFI) loans. In the 1996-2001 period, the total bilateral environmental
EECCA countries (21% and 6%, respectively). This indicates a potential
assistance to EU accession countries amounted to about 2.5 billion ,
for enhancing environmental assistance to EECCA countries without
and to EECCA countries 0.8 billion . Environmental assistance to EU
increasing it. However, refocusing priorities in international co-
accession countries increased in 2000 and 2001 with the pre-accession
operation programs towards the environment would require a clear
fi nancial instruments to support investments. Moreover, EU pre-
demand by EECCA countries themselves that needs to be agreed upon
accession funds have been slowly replacing bilateral environmental
and articulated at the highest levels of the government.
assistance from individual countries. This trend, coupled with the overall
growth in bilateral assistance to EECCA countries, suggests that some
There can be observed no general pattern for division of
"refocusing" towards EECCA has taken place.
environmental assistance to diff erent media. In EECCA countries,
however, it can be noted that water (supply and sanitation) seems
The total volume of IFI loans committed to environmental projects
to be a dominant focus of bilateral assistance, while, with regard to
in the period 1996-2001 amounted to almost 4 billion in EU
IFI loans, the largest sums seem to be associated with environmental
accession countries and 1.3 billion in EECCA countries. Time trends in
components of non-environmental projects fi nanced in power
commitments of IFI loans show larger annual variations due to fewer
generation and agriculture.
but larger projects, programming and project development cycles and
local conditions (such as the Russian fi nancial crisis in 1998).
Examining per capita fi gures, we have to note that the EU accession
Conclusion
countries have received much more commitments of environmental
bilateral assistance per capita than EECCA countries. The most successful
The Black Sea environment is of paramount value in terms of regional
benefi ciaries were small countries. However, also the candidate counties
development and quality of life for the local inhabitants. It is one of the
that have received fewer per capita commitments (the Czech Republic
most, if not the most, important European seas and yet the Black Sea is
and Hungary) still are better assisted than the highest aided EECCA
one of the most anthropogenically-loaded seas in the world.
countries. Thus, although some refocusing towards EECCA has begun,
46
EUTROPHICATION IN THE BLACK SEA REGION IMPACT ASSESSMENT AND CAUSAL CHAIN ANALYSIS
The Black Sea ecosystem is known to be valuable and diverse, but at
the moment it is also considered to be vulnerable as it is experiencing
signifi cant pressure from land-based pollution. One of the leading issues
of environmental quality deterioration in the region has been identifi ed
as eutrophication caused by an overabundance of nutrients and leading
to numerous environmental and socio-economic problems.
Analysis of current trends shows that, although nutrient pollution is
likely to decrease in the Danube Basin due to the implementation of
EU environmental policy, such important tributaries as the Don and
Dnipro will still carry heavy nutrient loadings into the southwestern
part of the coast. This implies that the whole Black Sea ecosystem will
be endangered if necessary eff orts are not undertaken at the regional
and international level.
Pilot assessment of eutrophication economic damage for the 5
southern regions of Ukraine shows that the fi gure is twice as much
as the consolidated budget of the environmental protection funds of
Ukraine. This corresponds to the already cited fi gure of 500 mln USD
annual loss caused by environmental quality deterioration in the Black
Sea region.
Root causes of eutrophication in the Black Sea Basin are identifi ed
as a lack of knowledge and information, insuffi
cient management
techniques and low economic incentives to tackle long-term
environmental problems. Combined local, regional and international
eff orts are needed for further research and policy development in
order to rehabilitate one of the most valuable marine ecosystems in
the world.
CAUSAL CHAIN ANALYSIS
47
Sources
3. DPRP,
Socio-economic eff ects of water pollution in the Danube River
21. David L. Alles. Marine Phytoplankton Blooms, Western Washington
Basin, 1999
University, e-mail: alles@biol.wwu.edu.
4. PCU, Transboundary Analysis Report, 1999
22. State of Environment of the Black Sea, Pressure and Trends, 1996
5. PCU, Strategic Action Plan for the Danube River Basin 1995-2005,
≠ 2000, Istanbul, English, 2002.
Revision 1999
23. Pretty J.N. et al., Environmental Costs of the Eutrophication of
6. ICPDR, Annual report on the activities of the ICPDR in 2002
Fresh Waters in England and Wales. Center for Environment and
7. EC,
COM
(2001)615
def.
Society and Department of Biological Sciences, University of Essex,
8. Danube
Pollution
Reduction
Programme,
Socio-economic eff ects of
Colchester UK November 2002
water pollution in the Danube river basin, 1999
24. Pearson M J. 1996. The Management of a National Environmental
9. UNDP/GEF
Danube
Regional
Project,
Five-years report on water
Problem "Toxic Cyanobacteria". PhD Thesis, University of Dundee
quality in the Danube River Basin based on Trans-National Monitoring
25. Thomas L. Saaty, Theory of the Analytic Hierarchy Process. Part 2.1,
Network 1996-2000, Draft August 2003, p. 204
System Research & Information Technologies, 2003, Ļ 1, p. 48-71
10. Danube Pollution reduction Programme, PCU, Strategic action plan
26. National Report on the State of Environment in Ukraine in 2001 Year.
for the Danube River Basin 1995-2005,Revision 1999
Kyiv, 2003
11. European Commission, COM(2001)615 fi n., Communication on
27. National Report of Ukraine on the Harmonization of the Life of
environmental cooperation in the Danube-Black Sea region, 2001
Society in the Environment, Kyiv, 2003
12. Report on the Status of the Environment in Ukraine (2001)
28. Transboundary Diagnostic Analysis for the Dnipro River Basin.
13. Methodology of assessment of the damage of the consequences
UNDP-GEF Program. Kiev, 2003
of the emergency situations of technogenic and natural origin
14. Thomas L. Saaty, Theory of the Analytic Hierarchy Process. Part 2.1,
System Research & Information Technologies, 2003, Ļ 1, p. 48-71
15. Strategic Action Plan for the Rehabilitation and Protection of the
Black Sea, Istanbul, 31 October 1996. 29p. English
16. Black Sea Transboundary Diagnostic Analysis, Istanbul, 1997, 142p.
English. ISBN 92-1-126075-2, UN Publications, New York.
17. Laurence D. Mee. How to save the Black Sea,
18. Eutrophication in Europe's coastal waters, European Environment
Agency, Topic report, 7/2001, 116p.
19. Nixon S.W. Coastal marine eutrophication, A defi nition, social causes
and future concerns, Ophelia 41, 1995, 199-219.
20. Vershinin A.O. Life of the Black Sea, "MAKCENTER", Moscow, 2003,
176p.Russian.
48
EUTROPHICATION IN THE BLACK SEA REGION IMPACT ASSESSMENT AND CAUSAL CHAIN ANALYSIS
Annexes
Annex I Contact information on the authors and the
contributors of the report
Name
Affiliation, position
Country
Email address
Kharkiv National Academy of Municipal Economy, Department of Environmental Engineering and
v_barannik@yahoo.com
Valeriy Barannik, Dr
Management;
Ukraine
barval@ukr.net
associate professor
GIWA individual expert;
Kharkiv National Academy of Municipal Economy, Department of Environmental Engineering and
oborysova@yahoo.co.uk
Olena Borysova, Dr
Ukraine
Management;
borysova@velton.kharkov.ua
associate professor
Ukrainian National Academy of Science, Council on the Study of Productive Forces of Ukraine, Laboratory
Evgen Khlobystov, Dr
of the methodology of sustainable development;
Ukraine
hlobystov@rvps.kiev.ua
senior researcher
Southern Center of Russian National Academy of Science, Laboratory of Marine Biology;
Andrey Kondakov, Dr
Russia
a_kondakov@mmbi.krinc.ru
Head
UNEP-GIWA fellow;
Susanna Paleari, Dr
National Research Council;
Italy
paleari@idse.mi.cnr.it
researcher
Elina Rautalahti-Miettinen, Dr
UNEP-GIWA Coordinator for Northern Hemisphere
Sweden
elina.rautalahti@giwa.net
BSERP national expert for Ukraine;
Kharkiv National Academy of Municipal Economy, Department of Environmental Engineering and
stolberg@kharkov.ua
Felix Stolberg, prof
Ukraine
Management;
stolberg@ksame.kharkov.ua
Head
Dag Daler, Director
UNEP-GIWA Scientific Director
Norway
dag@daler.no
ANNEXES
49
Annex II Socio-economic indicators of the countries of the
Black Sea catchment area1
AUSTRIA
BULGARIA
1975
2001
2015
1990
2000
2015
2020
Total population (millions)
7.6
8.1
8.1
Total population (millions)
8.72
7.95
6.82
6.47
Urban pop (%)
67.4
67.4
71.0
Urban pop (%)
66
67
69
71
Rural pop (%)
32.6
32.6
29.0
Rural pop (%)
34
33
31
29
1998
1999
2000
2001
1990
1994
1999
2000
GNI per capita (current US$)
26,69
25,70
25,23
23,94
GDP per capita (constant 1995 US$)
1716
1503
1443
1544
GDP total (billions of current US$)
211.12
209.51
188.72
188.54
GDP total (billions of 1995 US$
15.0
12.7
11.6
12.3
Agriculture value added (%)
2
2
2
2
Share from agriculture (%)
18
11
17
n.a.
Industry value added (%)
33
33
33
33
Share from industry
51
33
27
28
1998
1999
2000
2001
1991-1997
1998-2000
GDP growth (annual %)
4
3
3
1
Average annual growth
1975-2001
2001-2015
Of GDP (%)
-4.2
3.6
Annual population growth rate
0.3
n.a.
Of population (%)
-0.7
-0.6
BELARUS
CROATIA
1990
2000
2015
2020
1990
2000
2015
2020
Total population (millions)
10.26
10.19
9.67
9.51
Total population (millions)
4.78
4.65
4.62
4.58
Urban pop (%)
66
71
73
74
Urban pop (%)
54
58
64
67
Rural pop (%)
34
29
27
26
Rural pop (%)
46
42
36
33
1990
1994
1999
2000
1990
1995
1999
2000
GDP per capita (constant 1995 US$)
3,045
2,172
2,543
2,703
GDP per capita (constant 1995 US$)
5438
4059
4969
5146
GDP total (billions of 1995 US$
31.1
22.4
25.5
27.0
GDP total (billions of 1995 US$
26.0
18.8
21.7
22.5
Share from agriculture (%)
24
15
13
n.a
Share from agriculture (%)
10
11
10
n.a.
Share from industry
47
37
39
37
Share from industry
34
33
33
33
1991-1997
1998-2000
1991-1997
1998-2000
Average annual growth
Average annual growth
Of GDP (%)
-4.0
5.9
Of GDP (%)
-2.2
2.0
Of population (%)
-0.1
-0.1
Of population (%)
0.4
0.0
BOSNIA AND HERZEGOVINA
CZECH REPUBLIC
1990
2000
2015
2020
1990
2000
2015
2020
Total population (millions)
4.31
3.98
4.28
4.24
Total population (millions)
10.36
10.27
10.03
9.90
Urban pop (%)
39
43
51
54
Urban pop (%)
74
75
76
78
Rural pop (%)
61
57
49
46
Rural pop (%)
25
25
24
22
1994
1995
1999
2000
1990
1995
1999
2000
GDP per capita (constant 1995 US$)
439
546
1.479
1.526
GDP per capita (constant 1995 US$)
5,270
5,037
5,157
5,311
GDP total (billions of 1995 US$
1.5
1.9
5.7
6.1
GDP total (billions of 1995 US$
54.6
52.0
53.0
54.6
Share from agriculture (%)
36
25
14
n.a.
Share from agriculture (%)
6
5
4
n.a.
Share from industry
27
26
25
26
Share from industry
49
45
41
41
1991-1997
1998-2000
1991-1997
1998-2000
Average annual growth
Average annual growth
Of GDP (%)
48.8
12.4
Of GDP (%)
0.0
0.1
Of population (%)
0.1
4.1
Of population (%)
-0.1
-0.1
1 Albania, Italy, Macedonia, Poland and Switzerland, which hold in the basin territories smaller than 2,000 km2, are not covered by the Annex. Sources: for Austria and Germany -WB Data Query and
UNDP, Human Development Report, 2003; for all the other countries - International Bank for Recostruction and Development and the World Bank, Volume II ≠ Country Water Notes and Selected
Transboundary Basins, 2003
50
EUTROPHICATION IN THE BLACK SEA REGION IMPACT ASSESSMENT AND CAUSAL CHAIN ANALYSIS
GEORGIA
ROMANIA
1990
2000
2015
2020
1990
2000
2015
2020
Total population (millions)
5.46
5.26
4.78
4.58
Total population (millions)
23.21
22.44
21.44
21.03
Urban pop (%)
55
56
61
64
Urban pop (%)
54
55
59
61
Rural pop (%)
45
44
39
36
Rural pop (%)
46
45
41
39
1990
1995
1999
2000
1992
1995
1999
2000
GDP per capita (constant 1995 US$)
1,232
351
493
502
GDP per capita (constant 1995 US$)
1,377
1,564
1,461
1,489
GDP total (billions of 1995 US$
6.7
1.9
2.5
2.5
GDP total (billions of 1995 US$
31.4
35.5
32.8
33.4
Share from agriculture (%)
32
52
36
21
Share from agriculture (%)
18
21
15
13
Share from industry
33
24
23
23
Share from industry
44
42
36
36
1991-1997
1998-2000
1991-1997
1998-2000
Average annual growth
Average annual growth
Of GDP (%)
10.6
2.6
Of GDP (%)
-1.6
-1.8
Of population (%)
-0.4
-0.3
Of population (%)
-0.4
-0.2
GERMANY
RUSSIA
1975
2001
2015
1990
2000
2015
2020
Total population (millions)
78.7
82.3
82.5
Total population (millions)
148
145
133
130
Urban pop (%)
81.2
87.7
89.9
Urban pop (%)
73
73
74
75
Rural pop (%)
18.8
12.3
10.1
Rural pop (%)
27
27
26
25
1998
1999
2000
2001
1992
1995
1999
2000
GNI per capita (current US$)
26,63
25,69
25,13
23,56
GDP per capita (constant 1995 US$)
2,967
2,280
2,255
2,471
GDP total (billions of current US$)
2,144.48
2,103.39
1,866.13
1,846.06
GDP total (billions of 1995 US$
441.2
337.7
329.9
359.6
Agriculture value added (%)
1
1
1
1
Share from agriculture (%)
7
8
7
6
Industry value added (%)
32
31
32
31
Share from industry
41
37
35
39
1998
1999
2000
2001
1991-1997
1998-2000
GDP growth (annual %)
2
2
3
1
Average annual growth
1975-2001
2001-2015
Of GDP (%)
-6.8
2.9
Annual population growth rate (%)
0.2
n.a.
Of population (%)
-0.1
-0.4
HUNGARY
SERBIA AND MONTENEGRO
1990
2000
2015
2020
1990
2000
2015
2020
Total population (millions)
10.37
9.97
9.25
9.02
Total population (millions)
10.53
10.55
10.31
10.19
Urban pop (%)
62
65
69
71
Urban pop (%)
49
52
55
58
Rural pop (%)
38
35
31
29
Rural pop (%)
47
48
45
42
1990
1995
1998
2000
1990
1994
1999
2000
GDP per capita (constant 1995 US$)
4,857
4,343
4,849
5,326
GDP per capita (constant 1995 US$)
n.a.
1,167
1,181
1,240
GDP total (billions of 1995 US$
50.3
44.7
49.6
54.4
GDP total (billions of 1995 US$
n.a.
12.3
12.6
13.2
Share from agriculture (%)
15
7
6
n.a.
Share from agriculture (%)
31
31
25
n.a.
Share from industry
39
32
34
n.a.
Share from industry
40
39
38
n.a.
1991-1997
1998-2000
1991-1997
1998-2000
Average annual growth
Average annual growth
Of GDP (%)
-0.7
4.9
Of GDP (%)
n.a.
-2.9
Of population (%)
-0.3
-0.5
Of population (%)
0.1
-0.1
MOLDOVA
SLOVAKIA
1990
2000
2015
2020
1990
2000
2015
2020
Total population (millions)
4.36
4.30
4.15
4.11
Total population (millions)
5.3
5.4
5.4
5.4
Urban pop (%)
47
42
45
48
Urban pop (%)
56
57
62
65
Rural pop (%)
53
58
55
52
Rural pop (%)
44
43
38
35
1992
1995
1999
2000
1992
1995
1999
2000
GDP per capita (constant 1995 US$)
1,056
713
623
637
GDP per capita (constant 1995 US$)
3,211
3,426
4,075
4,160
GDP total (billions of 1995 US$
4.6
3.1
2.7
2.7
GDP total (billions of 1995 US$
17.0
18.4
22.0
22.5
Share from agriculture (%)
51
33
28
28
Share from agriculture (%)
5
5
4
4
Share from industry
31
31
19
20
Share from industry
38
37
32
31
1991-1997
1998-2000
1991-1997
1998-2000
Average annual growth
Average annual growth
Of GDP (%)
-11.8
-2.7
Of GDP (%)
-0.1
2.7
Of population (%)
-0.1
-0.2
Of population (%)
0.3
0.1
ANNEXES
51
SLOVENIA
1990
2000
2015
2020
Total population (millions)
1.9
2.0
1.9
1.9
Urban pop (%)
50
49
52
54
Rural pop (%)
50
51
48
46
1992
1995
1999
2000
GDP per capita (constant 1995 US$)
8,331
9,419
11,160
11,659
GDP total (billions of 1995 US$
16.6
18.7
22.2
23.2
Share from agriculture (%)
5
5
4
3
Share from industry
41
38
38
38
1991-1997
1998-2000
Average annual growth
Of GDP (%)
0.9
4.6
Of population (%)
0.6
-0.1
TURKEY
1990
2000
2015
2020
Total population (millions)
56.1
66.7
79.0
82.9
Urban pop (%)
61
66
72
74
Rural pop (%)
39
34
28
26
1992
1995
1999
2000
GDP per capita (constant 1995 US$)
2,670
2,794
2,975
3,147
GDP total (billions of 1995 US$
154.6
169.3
191.4
205.5
Share from agriculture (%)
15
16
16
15
Share from industry
30
28
25
25
1991-1997
1998-2000
Average annual growth
Of GDP (%)
4.4
1.7
Of population (%)
1.8
1.6
UKRAINE
1990
2000
2015
2020
Total population (millions)
51.9
49.6
43.3
41.5
Urban pop (%)
67
68
70
72
Rural pop (%)
33
32
30
28
1992
1995
1999
2000
GDP per capita (constant 1995 US$)
1,621
953
840
896
GDP total (billions of 1995 US$
84.5
49.1
41.9
44.4
Share from agriculture (%)
20
15
14
14
Share from industry
51
38
38
38
1991-1997
1998-2000
Average annual growth
Of GDP (%)
-11.6
1.2
Of population (%)
-0.3
-0.9
52
EUTROPHICATION IN THE BLACK SEA REGION IMPACT ASSESSMENT AND CAUSAL CHAIN ANALYSIS
Annex III Water resources in the Black Sea countries
BELARUS
CROATIA
Of which
Of which
Overlap between
Of which
Of which
Overlap between
Total
surface
groundwater
surface and
surface
Total
groundwater
surface and
water (BCM)
(BCM)
groundwater
water
(BCM)
groundwater
Internal water resources (BCM)
37.2
37.2
18.0
18.0
(BCM)
External water resources (BCM)
20.8
20.8
0.0
Internal water resources (BCM)
37.7
27.2
11.0
0.5
Total water resources (BCM)
58.0
58.0
18.0
18.0
33.7
(does not
1990
1993
1995
2000
External water resources (BCM)
33.7
include
0.0
Total water consumption (BCM)
2.8
2.5
1.9
1.7
border
Agriculture
0.4
0.3
0.3
0.2
flows)
Industrial
1.7
1.5
0.9
0.8
Total water resources (BCM)
71.4
60.9
11.0
0.5
Domestic
0.7
0.7
0.7
0.8
1990
1996
1995
2000
1990
1995
Total water consumption (BCM)
2.65
1.42
Watewater produced (BCM)
1.98
1.33
Irrigation/fishponds
0.42
0.43
Wastewater biologically treated (BCM)
0.92
0.84
Industrial/cooloing
1.76
0.46
Domestic
0.47
0.53
BOSNIA AND HERZEGOVINA
1997
2000
Total
Of which
Of which
Overlap between
Watewater produced (BCM)
0.29
n.a.
surface
groundwater
surface and
water (BCM)
(BCM)
groundwater
Wastewater treated (%)
20
12%
Internal water resources (BCM)
36.0
n.a.
n.a.
n.a.
CZECH REPUBLIC
External water resources (BCM)
2.0
n.a.
n.a.
Of which
Of which
Overlap between
Total water resources (BCM)
38.0
n.a.
n.a.
n.a.
surface
Total
groundwater
surface and
1990
1993
1995
2000
water
(BCM)
groundwater
(BCM)
Total water consumption (BCM)
0.8
Internal water resources (BCM)
13.2
13.2
1.4
1.4
Agriculture
External water resources (BCM)
0.0
0.0
0.0
Industrial
Total water resources (BCM)
13.2
13.2
1.4
1.4
Domestic
1991
1995
1997
1990
1995
Total annual water used (BCM)
2.74
2.47
2.50
Watewater produced (BCM)
n.a.
n.a.
Irrigation
0.25
0.17
0.17
Wastewater biologically treated (BCM)
n.a.
n.a.
Industrial/thermal power
1.86
1.70
1.37
BULGARIA
Domestic
0.63
0.60
0.95
Of which
Of which
Overlap between
2001
surface
Total
groundwater
surface and
Volume of wastewater (BCM)
0.57
water
(BCM)
groundwater
(BCM)
Volume treated (%)
94.8
Internal water resources (BCM)
21.0
20.1
6.4
5.5
GEORGIA
External water resources (BCM)
0.3
0.3
0.0
Of which
Of which
Overlap between
Total water resources (BCM)
21.3
20.4
6.4
5.5
surface
Total
groundwater
surface and
1988
1997
water
(BCM)
groundwater
(BCM)
Total water consumption (BCM)
13.0
3.1
Internal water resources (BCM)
58.1
56.9
17.2
16.0
Agriculture
7.2
0.3
External water resources (BCM)
5.2
5.2
0.0
Industrial
4.9
1.4
Total water resources (BCM)
63.3
62.1
17.2
16.0
Domestic
0.9
1.4
1987
1990
1996
2000
1990-91
1998
Total annual water withdrawn (BCM)
3.47
2.49
Watewater produced (BCM)
1.73
1.14
Irrigation
2.04
1.47
0.98
Wastewater treated (%)
42
57
Industrial
1.5
0.70
0.26
Domestic
0.73
0.76
0.67
1998
Watewater produced by households
0.6
(BCM)
Percentage treated
13
ANNEXES
53
HUNGARY
RUSSIA
Of which
Overlap
Of which
Overlap
Of which
Of which
surface
between
surface
between
Total
groundwater
Total
groundwater
water
surface and
water
surface and
(BCM)
(BCM)
(BCM)
groundwater
(BCM)
groundwater
Internal water resources (BCM)
6.0
6.0
6.0
6.0
Internal water resources (BCM)
4,313
4,037
788
512
External water resources (BCM)
98.0
98.0
0.0
External water resources (BCM)
186
186
0
Total water resources (BCM)
104.0
104.0
6.0
6.0
Total water resources (BCM)
4,498
4,222
788
512
1990
1995
1991
1993
1995
1997
Total annual water withdrawn (BCM)
6.02
6.70
Total annual water used (BCM)
88.4
77.6
68.8
64.0
Irrigation
1.00
1.01
Agriculture
20.9
17.0
14.9
12.0
Industrial
4.33
4.82
Industrial
52.8
46.0
39.7
38.4
Domestic
0.69
0.87
Domestic
14.7
14.6
14.2
13.6
1999
1999
Population with sewerage connection (%)
60
Watewater discharge requiring
22.0
Population with wastewater treatment (%) 22
treatment (BCM)
10.8 (Although
MOLDOVA
Treated to required standards (%)
75% is treated)
Of which
Overlap
Of which
surface
between
SERBIA AND MONTENEGRO
Total
groundwater
water
surface and
Of which
Overlap
(BCM)
Of which
(BCM)
groundwater
surface
between
Total
groundwater
Internal water resources (BCM)
1.0
1.0
0.4
0.4
water
surface and
(BCM)
(BCM)
groundwater
External water resources (BCM)
6.3
6.3
0.0
Internal water resources (BCM)
25.1
23.5
3.0
1.4
Total water resources (BCM)
7.3
7.3
0.4
0.4
External water resources (BCM)
164.5
164.5
0.0
1990
1991
1995
1996
Total water resources (BCM)
189.6
188.0
3.0
1.4
Total annual water used (BCM)
3.83
2.98
1.87
1.77
1997
Agriculture
1.03
0.51
0.49
0.35
Total annual water used (BCM)
8.40
Industrial (thermal power)
2.52
2.20
1.14
1.17
Agriculture
0.76
Domestic
0.27
0.27
0.25
0.24
Industry/cooling
6.23
1993-94
Domestic
1.41
Domestic and industrial wastewater
350
discharge (MCM)
1999
51 (only 18%
Watewater discharge requiring
Wastewater treated to required
2.86
municipal
treatment (BCM)
standards (%)
wastewater)
Subject to adequate treatment (BCM)
0.16
ROMANIA
SLOVAKIA
Of which
Overlap
Of which
Overlap
Of which
Of which
surface
between
surface
between
Total
groundwater
Total
groundwater
water
surface and
water
surface and
(BCM)
(BCM)
(BCM)
groundwater
(BCM)
groundwater
Internal water resources (BCM)
42.3
42.0
8.3
8.0
Internal water resources (BCM)
13
13
2
2
External water resources (BCM)
169.6
169.6
0.0
External water resources (BCM)
38
38
0
Total water resources (BCM)
211.9
211.6
8.3
8.0
Total water resources (BCM)
50
50
2
2
1989
1999
1991
1997
Total annual water used (BCM)
19.40
8.57
Total annual water used (BCM)
1.9
1.3
Agriculture
8.17
1.03
Agriculture
0.3
0.1
Industrial
9.03
5.70
Industrial (cooling)
1.0
0.8
Domestic
2.20
1.84
Domestic
0.6
0.5
1999
1998
Watewater discharge requiring
Watewater discharge requiring
3.0
1.14
treatment (BCM)
treatment (BCM)
Subject to treatment (%)
40
36
Treated biologically (%)
(36% is
untreated)
54
EUTROPHICATION IN THE BLACK SEA REGION IMPACT ASSESSMENT AND CAUSAL CHAIN ANALYSIS
SLOVENIA
Overlap
Of which
Of which
between
Total
surface water
groundwater
surface and
(BCM)
(BCM)
groundwater
Internal water resources (BCM)
19
19
14
13
External water resources (BCM)
13
13
0
Total water resources (BCM)
32
32
14
13
1994
1997
Total annual water used (MCM)
237.4
333.2
Agriculture
3.4
3.4
Industrial 76.0
71.4
Domestic
158.0
258.4
1998
Watewater discharge requiring
treatment (BCM)
Treated (%)
75%
TURKEY
Overlap
Of which
Of which
between
Total
surface water
groundwater
surface and
(BCM)
(BCM)
groundwater
Internal water resources (BCM)
196.0
192.8
20.0
16.8
External water resources (BCM)
4.7
4.7
0.0
Total water resources (BCM)
200.7
197.5
20.0
16.8
1990
1995
1997
2000
Total annual water used (BCM)
30.6
31.6
33.5
42.0
Agriculture
22.0
23.1
24.7
31.5
Industrial 3.4
3.5
3.5
4.1
Domestic
5.1
5.1
5.3
6.4
1998
Watewater discharge requiring
2.40
treatment (BCM)
Treated (BCM)
0.1
UKRAINE
Overlap
Of which
Of which
between
Total
surface
groundwater surface and
water (BCM)
(BCM)
groundwater
Internal water resources (BCM)
53
50
20
17
External water resources (BCM)
86
86
0
Total water resources (BCM)
140
137
20
17
1991
1994
1997
1998
Total annual water used (BCM)
26.7
22.3
14.6
13.0
Agriculture
10.2
9.0
4.5
3.6
Industrial 12.8
9.5
6.5
5.9
Domestic
3.7
3.8
3.6
3.5
1991
1997
Municipal watewater discharge (BCM)
4.0
3.6
Treated according to standards (%)
43
38
ANNEXES
55
Annex IV Economic estimation for the damage of eutrophication
for 5 Southern regions of Ukraine
For the purposes of this study, socio-economic damage caused by
Assessment of the indicators
eutrophication is understood as a sum of additional expenses spent
1. Reduced commercial values of the water bodies (fi sheries and other
to obtain products and services of proper quality in the industrial,
water bodies products)
agricultural and municipal sectors.
Reducing of commercial value has been taking place during recent 30
Conception of seasonal changes of water quality and infl uence of these
years with the increasing of antropogenic pressure on the Dnipro basin
changes on the costs of services and products and on the quality of
and Ukrainian share of the Black Sea basin. This process takes place
the resources (expressed in the monetary values) is the basis of the
with increased effi
ciency, and eutrophication plays signifi cant role in it.
assessment of the above additional expenses.
Impact of the eutrophication has a seasonal character and may be, by
our estimation, assigned a range of 5 ≠ 7% of total loss. Considering that
The methodological framework of the present study consists of
fi shering does not take place during winter time, seasonal coeffi
cient of
the research of the University of Essecs team (>>) and our research
impact of eutrophication on commercial values of water bodies may
mainly described in the Methodology of assessment of the damage
be estimated as 0,96875.
of the consequences of the emergency situations of technogenic and
Then the annual damage will be estimated as: D = F d(1 ≠ e),
1
natural origin (>>), studies of the National Academy of Ukraine, and
on the recommendations of the Ministry of Environment of Ukraine in
Where:
environmental economics in 1994 ≠ 2001.
D ≠ damage from the decrease of the commercial values of water
1
bodies;
The present study is one of the fi rst attempts to assess, in economic
F ≠ value of the fi sheries catch (annual, mln of UH)
terms, damage caused by eutrophication to the economy of Ukraine.
d ≠ coeffi
cient of fi shering catch decrease caused by the totality of all
Geographically, the scope of the pilot study is limited to the 5 Southern
factors, equal 0,22 (2000);
regions of Ukraine (Republic of Crimea, city of Sevastopol, Odes'ka,
e ≠ seasonal coeffi
cient equal to 0,96875.
Mykolaevs'ka and Khersons'ka regions); methodologically, the study is
limited by the scarcity of data, novelty of the approach and limited time
Fisheries catch for the Southern part of Ukraine studied here are shown
and space available for reporting. Results obtained shall be treated as
in the Table below (data from 2002, if not otherwise indicated)
tentative and further research is obviously needed.
Average costs of wholesale
Fish catch
Fishering
Seafood
trade (basing on the
Main damage indicators
in the inner
zone of
and
average wholesale cost
Region
water bodies
Ukraine in
other sea
of 1t of fish caught by the
1. Reduced commercial values of the water bodies (fi sheries and other
(freshwater,
the Black
products,
resident of Ukraine as
incl rivers), t
Sea, t
t
water bodies products)
4,480 UH), mln UH
Republic of Crimea
676.0
21,658
57.0
97.02784
2. Reduced biodiversity of the water bodies
Sevastopol
23.3
44,239.0
39,256.0
198.29072
3. Increased costs of drinking water treatment
Odes'ka
3,336.0
1,135.0
39.0
5.0848
4. Clean-up costs of waterways (dredging, weed-cutting);
Mykolaevs'ka
563.0
1,217.0
-
5.45216
5. Reduced recreational and amenity value of water bodies for water
Khersons'ka
1,996.0
3,002.0
5.0
13.44896
Total
319.20448
sports, (bathing, boating, windsurfi ng, canoeing), angling, and gen-
eral amenity (picnics, walking, aesthetics);
6. Net economic losses for commercial aquaculture, and shellfi sheries
Thus, annual damage D constitutes 2,1945 mln UH.
1
7. Negative ecological eff ects on biota (arising from changed nutrient
status, pH, and oxygen content of water), resulting in both changed
2. Decrease of biodiversity of the water bodies.
species composition and loss of key or sensitive species
8. Costs of control of legislation compliance arising because of nega-
Economic value of decrease of biodiversity has been assessed on the
tive impacts of nutrient enrichment
basis of provisions of the Cabinet of Ministries of Ukraine and taking
56
EUTROPHICATION IN THE BLACK SEA REGION IMPACT ASSESSMENT AND CAUSAL CHAIN ANALYSIS
into account the experts studies(>>). Decrease of one species assessed
work is carried out in Ukraine by the "Ukrrechfl ot" company. Assessment
on the basis of the average number of the individuals, or, if the above
is calculated as: D = Mc x Me x e
4
4
is not possible, on the basis of the average costs of maintaining one
species preservance which is 20 mln USD (Reimers approach, 1994).
where
Eutrophication has a seasonal character, and for the assessment of the
D ≠ Increased costs for waterways clean-up caused by eutrophication
4
negative impact on biodiversity average impact coeffi
cient has been
Mc ≠ maintenance costs for clean up, mln UH per month
estimated as 0,97. 18 most valuable specie whose habitats lie in the
Me ≠ number of months when the eutrophication is maximum.
study regions has been selected out of protected fi sh specie in Ukraine
e ≠ eutrophication coeffi
cient, equal to 0,945.
4
(Eudontomyzon mariae Berg, Acipenser nudiventris Lovetzky, Huso huso
Expert assessment of the maintenance costs is 50 thousand UH per
ponticus Salnikov et Malatski, Umbra krameri Walbaum,Vimba vimba
month, i.e.
tenella, Barbus barbus borysthenicus Dybowski, Chalcalburnus chalcoides
mento, Gobio uranoscopus, Barbus tauricus Kessler, Hippocampus guttulatus
D = 0,2 mln UH.
4
microstephanus Slastenenko, Lucioperca marina, Gymnocephalus
schraetser, Zingel zingel, Zingel streber streber, Callionymus belenus Risso,
Acipenser ruthenus Linnaeus, Umbrina cirrosa, Trigla lucerna Linnaeus).
5. Reduced recreational and amenity value of water bodies for water
sports, (bathing, boating, windsurfi ng, canoeing), angling, and gen-
Basing on the described approach, D = 57,24 mln UH.
eral amenity (picnics, walking, aesthetics)
2
3.
Costs of drinking water treatment.
This indicator is diffi
cult to calculate, since the majority of such changes
in the priorities of the tourists are not refl ected by the statistics.
Costs of drinking water treatment are assessed on the basis of the
However, several studies of recreational industry show the dependence
average cost of water to the consumer in the municipal sector
of decreasing of the visits of the water body and eutrophication. We
and the volume of water consumption in the regions aff ected by
assume that the majority of economic damage is born by the small
eutrophication.
private business serving the tourists. Literature shows that the income
may decreases up to 10-15% during algae bloom (>>>). Then assessment
Experimental studies show that eutrophication damage is meaningful
of the damage D is calculated as: D = I x Me x e
5
5
5
for the Southern part of Ukraine during 4 months in the year. Using
same approach as when calculating the increase in costs for fi sheries,
Where
the value of the coeffi
cient is assessed as 0,945.
D ≠decrease in economic value of the water body caused by
5
eutrophication
Then economic damage caused by eutrophication via increased costs
I ≠ average monthly income from small business serving tourists, expert
of drinking water are: (Table)
assessment, thousand UH per month
Me ≠ number of months when the eutrophication is maximum.
Drinking water treatment costs,
Annual eutrophication
e ≠ eutrophication coeffi
cient, equal to 0,15.
Region
5
mln UH per month
damage, mln UH
Republic of Crimea
9.17
2.0174
Annual income from small business serving tourists is shown in the
Sevastopol
1.74
0.3828
Table below (mln UH, 2002)
Odes'ka
11.11
2.4442
Mykolaevs'ka
5.66
1.2452
Khersons'ka
5.23
1.1506
Official expert data of the Ministry of
Region
Declared income
economy on non-declared income
Republic of Crimea
1,4
2,24
Total for the region D3 = 7.2402 mln UH
City of Sevastopol
0,69
1,104
Odes'ka
2,628
4,2
Mykolaevs'ka
0,6
0,96
4. Clean-up costs of waterways (dredging, weed-cutting);
Khersons'ka
0,1
0,16
Total
8,664
Costs are assessed basing on the data of the enterprises involved in the
Total accounting for 4 months
2,89
of maximum eutrophication
clean-up works of the water bodies and waterways. Majority of such
Damage is quite significant; however it represents "monetary value" approach towards biodiversity decrease that does not have "reverse dynamics" in the future regardless any financial and
organizational efforts of the humans.
ANNEXES
57
Hence the decrease in economic value of the water body caused by
Z ≠ consolidated fi nancing of environmental protection and
b
eutrophication is: D = 0,43 mln UH.
biodiversity maintenance measures for the region, thousands UH
5
B ≠ share of the fi nancing spent for the biodiversity maintenance in
b
6. Net economic losses for commercial aquaculture and shellfi sheries
the water bodies
e ≠ coeffi
cient of the relative eutrophication weight equal to 0,45.
7
Losses for commercial aquaculture are directly connected with the
changes of habitats. Shellfi sh yield has dropped 7 times compared to
Financing of the environmental protection measures in the studies
the 1970 level. Aquaculture and shellfi sheries are scattered and non-
regions are (mln UH, 2002):
organised in the Ukrainian part of the Black Sea basin; therefore, statistic
adapt are scare and our assessment s based on the experts judgment.
Region
Z
B (%)
B
b
b
b , mln UH
Eutrophication impact on the decrease of aquaculture income is
Republic of Crimea
61,1933
0,18
0,11
City of Sevastopol
15,0258
0,18
0,027
assessed as 8-12%. Decrease of the area of traditional aquaculture is
Odes'ka
59,54
0,16
0,095
assessed according to the national standard (>>>>>, >>>>) as 17,000 per
Mykolaevs'ka
63,909
0,18
0,116
ha. Therefore eutrophication impact on aquaculture and shellfi sheries
Khersons'ka
25,5067
0,17
0,045
may be assessed as: D = Aa x U x e ;
Total
225,1748
0,17
0,393
6
6
where
Therefore, considering relative eutrophication weight, monetary value
D ≠ loss of aquaculture and shellfi sheries income caused by
of the negative impacts of eutrophication on biota may be assessed as
6
aquaculture,
D = 17,22 mln UH.
7
Aa - average area of the territory used for the aquaculture, ha
U ≠ damage standard, UH per ha
8. Costs of control of legislation compliance arising because of nega-
e ≠ eutrophication coeffi
cient equal to 0,12.
tive impacts of nutrient enrichment
6
Area of the territory used for aquaculture is approximately equal to the
shelf of the Black Sea, appr. 14,164.5 km2.
Costs of control of legislation compliance arising have never before
Therefore, D ≠ income loss from commercial aquaculture caused by
studies individually and are not reported in the offi
cial statistics. According
6
eutrophication is D = 0,29 mln UH.
to the assessment of the offi
cers of the Main Ecological Inspection of the
6
Ministry of Environment of Ukraine, they constitute not more then 10%
7. Negative ecological eff ects on biota (arising from changed nutrient
in seasonal form (where the season is the whole eutrophication cycle,
status, pH, and oxygen content of water), resulting in both changed
namely from March to October, 8 months) Therefore, calculation is:
species composition and loss of key or sensitive species
D = 8 (L
/12 ≠ (L
x e )/12) = 2/3 (L
≠ L
x e ),
8
env
env
8
env
env
8
It is quite complicated to assign monetary values to the negative
where,
impacts on biota, and they are actually refl ected in the results of the
D ≠ costs of control of legislation compliance arising because of
8
economic activities (decrease in fi sheries, biodiversity, commercial
negative impacts of nutrient enrichment, thousand UH per year
aquaculture). We suggest to assess negative consequences to the
L ≠ consolidated fi nancing of the measures on monitoring of
env
biota by analysis of environmental protection costs on the regional
compliance with environmental legislation, by region, thousand UH
level and by defi ning the weight of the costs for preservation of the
per year
water bodies biodiversity, with the consideration of the eutrophication
e ≠ coeffi
cient of the eutrophication weight equal to 0,9.
8
relative value. Expert assessment suggests that for the protected areas
in Ukraine impact of eutrophication on decreased biodiversity of the
Consolidated fi nancing of the measures on monitoring of compliance
water bodies is 30-45% (.... 2002).
with environmental legislation, by region, thousand UH per year is
Therefore, calculation will be: D = Z x B x e ;
shown in the Table below.
7
b
b
7
where
D ≠ monetary value of the negative impact on the biota caused by
7
eutrophication
58
EUTROPHICATION IN THE BLACK SEA REGION IMPACT ASSESSMENT AND CAUSAL CHAIN ANALYSIS
Region
Lenv
Republic of Crimea
3,055
City of Sevastopol
0,75
Odes'ka
2,95
Mykolaevs'ka
3,15
Khersons'ka
1,28
Total
11,185
Therefore, costs of control of legislation compliance arising because of
negative impacts of nutrient enrichment are D = 0,75 mln UH.
8
Total eutrophication economic damage for the 5 studied regions is
85.647 mln UH (1 USD = 5,31 UH) per year. Considering that income part
of the consolidated budget of the funds of Environmental protection
of Ukraine (including state Fund and regional and local Funds) is about
43 mln UH, the fi gure is signifi cant and clearly indicates the necessity
of tackling eutrophication problem on the regional, country and
international level.
ANNEXES
59
Annex V Classification tables for eutrophication levels of marine
and fresh waters
Status
TRIX x)
g Cm-2yr-1 xx)
Oligo
< 4
< 100
Mezo
4 ≠ 5
100 ≠ 300
Eutro
5 ≠ 6
301 ≠ 500
Hyper
> 6
> 500
x) Erika Magaletti, 2000
Vollenweider et al., 1998
Italian Legislation (Dlg.152/99)
xx) Nixon, 1995
Trophic Index
TRIX = ( Log [Chl"a"]*[D%O]*[PT]*[DIN]* + 1.5) / 1.2
Where Chl"a" in Ķg/L, D%O deviation, in absolute value, of dissolved
Oxygen from 100% saturation, PT = Total Phosporus in Ķg/L, DIN =
Dissolved Inorganic Nitrogen in Ķg/L
Table of eutrophication levels classifi cation
Chl "a" Ķg/l
N mg/l
P mg/l
tot
tot
OECD
FN
RSA
SW
UA
Ave
OECD
FN
RSA
SW
UA
AVE
OECD
FN
RSA
SW
UA Ave
Oligo
<2,5
1-3
-
-
<2,0
-
-
-
0,30-0,45
>0,3
0,010
0,010
-
0,007-0,015
>0,015
Mezo
2,5 ≠ 8,0
3-8
-
-
3-8
-
-
-
0,45-0,75
0,3 ≠0,7
0,010 ≠0,03
0,010-0,020
-
0,015-0,025
O,015-0,050
Eutro
8,0 ≠25,0
8-40
10-30
-
8-40
-
-
-
0,75-1,5
0,7-1,5
0,03 ≠0,10
0,020-0,10
-
0,025-0,050
0,050-0,15
Poly
-
-
-
40-100
-
-
-
-
1,5-5,0
-
-
-
0,15-0,50
Hyper
>25,0
40-100
30 - 100
-
>100
-
-
-
>1,5
>5,0
>0,10
0,10 ≠1,0
-
-
>0,50
60
EUTROPHICATION IN THE BLACK SEA REGION IMPACT ASSESSMENT AND CAUSAL CHAIN ANALYSIS
