Appendix 2
The Cook Islands--Climate Risk Profile1
Summary
the spatial scale and pervasive nature of weather and
climate. Thus, the likelihood of, say, an extreme
event or climate anomaly is often evaluated for a
The likelihood (i.e., probability) components country, state, small island, or similar geographical
of climate-related risks in the Cook Islands
unit. While the likelihood may well vary within a
are evaluated, for both present-day and
given unit, information is often insufficient to assess
future conditions. Changes into the future
this spatial variability, or the variations are judged
reflect the influence of global warming.
to be of low practical significance.
The risk events for which current and future
The following climate conditions are
likelihoods are evaluated are extreme rainfall events
considered to be potential sources of risk:
(both hourly and daily), drought, high sea levels,
strong winds, and extreme high air temperatures.
·
extreme rainfall events,
Tropical cyclone frequencies over the past century
·
drought,
are also examined. Some climate-related human
·
high sea levels and extreme wave heights,
health and infrastructure risks are also investigated.
·
strong winds, and
Projections of future climate-related risk are
·
extreme high air temperatures.
based on the output of global climate models, for
given emission scenarios and model sensitivity.
Some climate-related human health and
All the likelihood components of projected
infrastructure risks are also investigated.
climate-related risk show marked increases as a
result of global warming.
B.
Methods
A. Introduction
Preparation of a climate risk profile for a given
geographical unit involves an evaluation of current
Formally, risk is the combination of the
likelihoods of all relevant climate-related risks,
consequence of an event and the likelihood (i.e.,
based on observed and other pertinent data.
probability) of that event taking place.
Climate change scenarios are used to develop
While the consequence component of a
projections of how the likelihoods might change in
climate-related risk will be site or sector specific, in
the future. For rainfall and temperature projections,
general the likelihood component of a climate-
the Australian Commonwealth Scientific and
related risk will be applicable over a larger
Industrial Research Organization global climate
geographical area and many sectors. This is due to
model (GCM) was used, as it is considered to work
best in the South Pacific. For drought, strong winds,
and sea level, the Canadian GCM was used to
1 At this time the profile is limited to Rarotonga.
132
Climate Proofing: A Risk-based Approach to Adaptation
develop the projections, as this was the only GCM
envelope of projected emissions, and hence of
for which the required data were available.
greenhouse gas concentrations. For drought, both
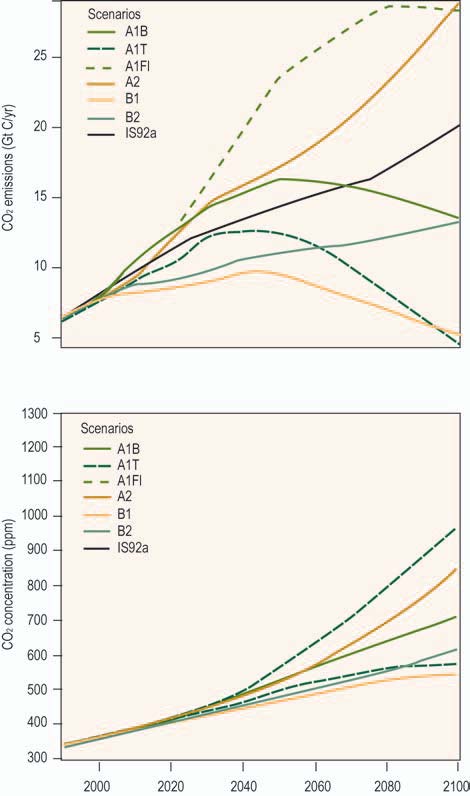
The SRES A1B greenhouse gas emission
the A2 and B2 emission scenarios were used, while
scenario was used when preparing rainfall,
for extreme wind gusts, only the A2 scenario was
temperature, and sea-level projections. Figure A2.1
used. Again, the required projections were available
shows that this scenario is close to the middle of the
only for these scenarios.
C.
Information Sources
Figure A2.1. Scenarios of CO Gas Emissions
2
and Consequent Atmospheric Concentrations
of CO
Daily and hourly rainfall, daily temperature, and
2
hourly wind data were obtained through the Cook
Islands Meteorological Service Office. Sea-level data
for Rarotonga were supplied by the National Tidal
Facility, The Flinders University of South Australia,
(a) CO emmisions
2
and are copyright reserved.
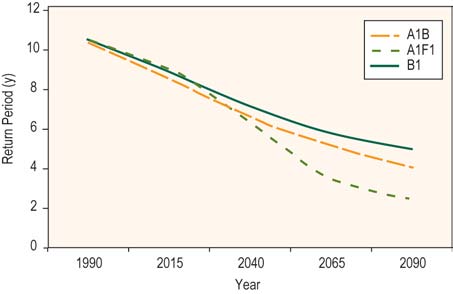
D. Uncertainties
Sources of uncertainty in projections of the
likelihood components of climate-related risks are
numerous. These include uncertainties in greenhouse
gas emissions and those arising from modelling the
complex interactions and responses of the
atmospheric and ocean systems. Figure A2.2 shows
how uncertainties in greenhouse gas emissions
impact on estimates of the return periods of a daily
precipitation of at least 250 mm for Rarotonga.
Similar graphs can be prepared for other GCMs
(b) CO concentrations
2
and extreme events, but are not shown here. Policy
and decision makers need to be cognizant of
uncertainties in projections of the likelihood
components of extreme events.
E.
Graphical Presentations
Many of the graphs that follow portray the
likelihood of a given extreme event as a function of
a time horizon. This is the most appropriate and
useful way in which to depict risk, since design life
(i.e., time horizon) varies depending on the nature
of the infrastructure or other development project.
Notes: CO = carbon dioxide; Gt C/yr = gigatonnes of carbon per year.
2
Source: IPCC 2001.
Appendix 2
133
F.
Extreme Rainfall Events
Figure 2.2. Return Periods for Daily Rainfall
of 200 mm in Rarotonga for Given
Daily Rainfall
Greenhouse Gas Emission Scenarios
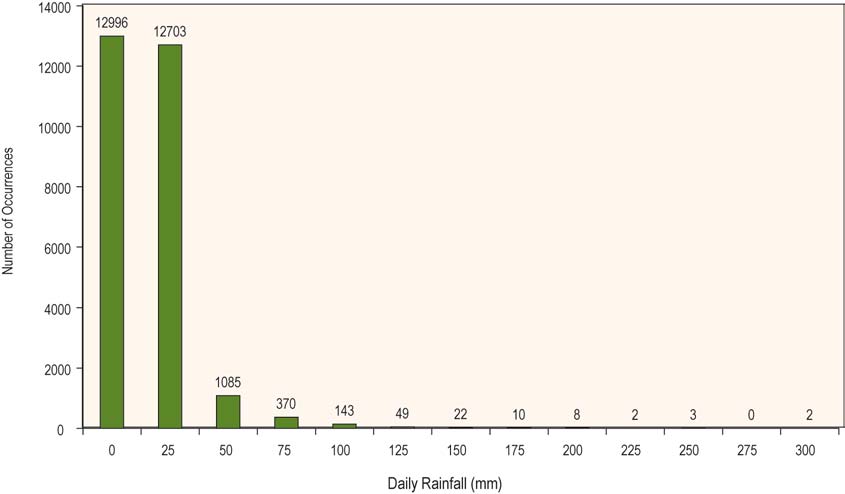
Figure A2.3 shows the frequency distribution of
daily precipitation for Rarotonga. A daily total above
200 millimeters (mm) is a relatively rare event, with
a return period (i.e., recurrence interval) of 11 years.
Figure A2.4 shows the likelihood of such an
extreme rainfall event occurring in Rarotonga within
a given time horizon ranging from 1 to 50 years.
It is clear that the frequency of extreme rainfall
events has increased markedly since 1929, when
records began.
As shown in Table A2.1, global warming will
significantly alter the return periods, and hence the
likelihoods, of the extreme rainfall events. For
Note: Calculations used Hadley Center global climate model (GCM) with Best
example, Figure A2.5 illustrates how the likelihood
Judgment of Sensitivity.
of a daily rainfall of 200 mm will increase over the
Source: CCAIRR findings.
remainder of the present century.
Figure A2.3. Frequency Distribution of Daily Precipitation for Rarotonga
(19292003)
Note: The values above the bars represent the number of occurrences, for the given data interval.
Source: CCAIRR findings.
134
Climate Proofing: A Risk-based Approach to Adaptation
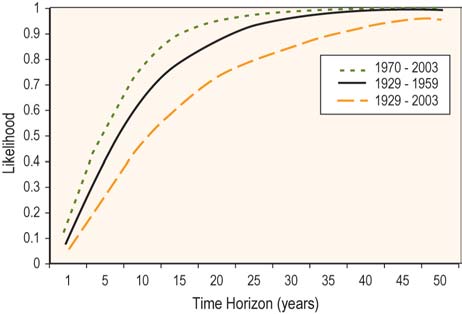
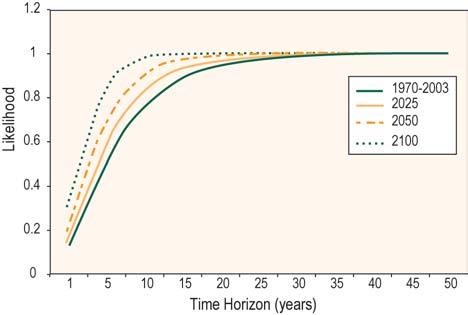
Figure A2.4. Likelihood of a Daily Rainfall
Figure A2.5. Likelihood of a Daily Rainfall
of at Least 200 mm Occurring within the
of at Least 200 mm Occurring within the
Time Horizon
Indicated Time Horizon
(years)
(years)
Note: 0 = zero chance; 1 = statistical certainty. Data for Rarotonga, for
indicated data periods.
Note: 0 = zero chance; 1 = statistical certainty. Data for Rarotonga.
Source: CCAIRR findings.
Source: CCAIRR findings.
Table A2.1: Return Periods and Likelihood of Occurrence in 1 Year1 for Daily Rainfall in Rarotonga
Rainfall
Present
(mm)
(19702003)
2025
2050
2100
(at least)
RP
LO
RP
LO
RP
LO
RP
LO
100
1
0.78
1
.81
1
0.83
1
0.87
150
3
0.34
3
.38
2
0.44
2
0.56
200
7
0.14
6
.16
5
0.20
3
0.31
250
18
0.06
13
.08
10
0.10
6
0.17
300
38
0.03
26
.04
19
0.05
11
0.09
350
76
0.01
47
.02
35
0.03
19
0.05
400
141
0.01
81
.01
59
0.02
31
0.03
450
248
0
130
.01
95
0.01
50
0.02
500
417
0
201
0
148
0.01
78
0.01
Notes: RP = return period; LO = likelihood of occurrence.
1 A likelihood of 0 equals zero chance while a likelihood of 1 equates to a statistical certainty that the event will occur within a year.
Source: CCAIRR findings.
Appendix 2
135
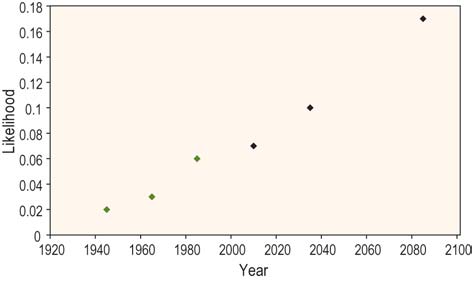
An obvious question arises: are the past changes
in the probability component consistent with the
Figure A2.6. Observed and Projected Likelihoods
changes projected to occur in the future as a result
of a Daily Rainfall of at Least 250 mm
of global warming? The trend of increasing likelihood
Occurring in a Year
that was apparent in the historical data for much of
the last century is projected to continue, in a
consistent manner, through the present century.
Observed and projected likelihoods of at least 250
mm of rain falling in a day are presented in Figure
A2.6. A high degree of consistency is apparent. It is
important to note that this consistency does not
prove the existence of a global warming signal in the
observed data. More detailed analyses are required
before any such attributions can be made.
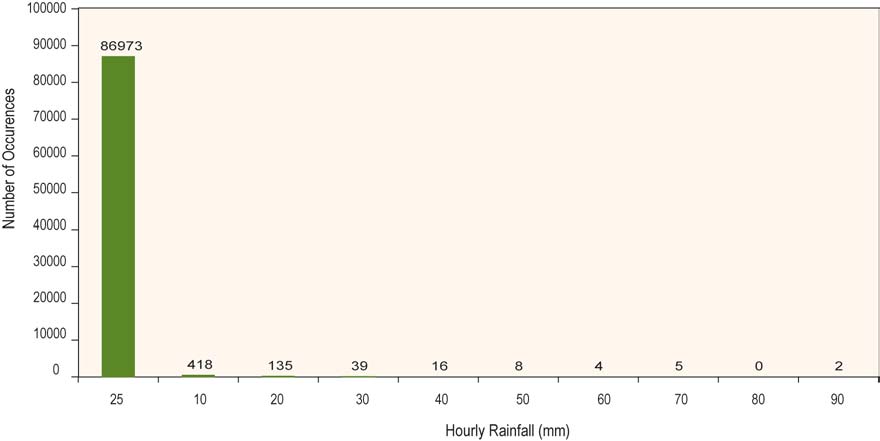
F.
Hourly Rainfall
Notes: black symbols = observed likelihoods; green symbols = projected
Figure A2.7 shows the frequency distribution of
likelihoods. Data for Rarotonga.
Source: CCAIRR findings.
hourly precipitation for Rarotonga. An hourly total
above 50 mm is a relatively rare event. Table A2.2 shows
such a rainfall has a return period of 3 years, and that
global warming will have a significant impact on the
return periods of extreme rainfall events.
Figure A2.7. Frequency Distribution of Hourly Precipitation for Rarotonga
Notes: Data for 19701979. The values above the bars represent the number of occurrences for the given data interval.
Source: CCAIRR findings.
136
Climate Proofing: A Risk-based Approach to Adaptation
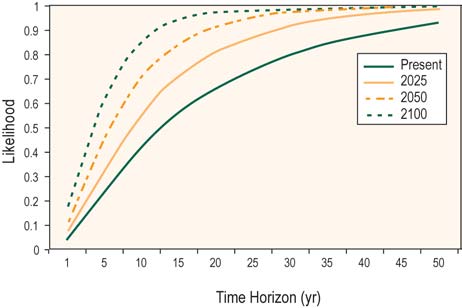
Table A2.2: Return Periods and Likelihood of Occurrence in 1 Year for Daily Rainfall Rarotonga
Rainfall (mm)
Present
2025
2050
2100
(at least)
RP
LO
RP
LO
RP
LO
RP
LO
25
1
0.93
1
0.92
1
0.93
1
0.93
50
3
0.29
3
0.36
3
0.39
2
0.45
75
18
0.05
12
0.08
8
0.12
6
0.18
100
91
0.01
57
0.02
25
0.04
13
0.08
125
384
0
246
0
67
0.01
25
0.04
150
N/A
N/A
980
0
159
0.01
46
0.02
Notes: RP = return period in years; LO = likelihood of occurrence.
Source: CCAIRR findings.
Figure A2.8 depicts the impact of global
F.
Drought
warming on the likelihood of an hourly rainfall of
75 mm for Rarotonga.
Figure A2.9 presents, for Rarotonga, the number
of months in each year (19292003) and each decade
for which the observed precipitation was below the
10th percentile. Monthly rainfall below the fifth
Figure A2.8. Likelihood of an Hourly Rainfall
percentile is used here as an indicator of drought.
of at Least 75 mm Occurring Within the
Most of the low rainfall months are concentrated
Indicated Time Horizon in Rarotonga
in the latter part of the period of observation,
(years)
indicating that the frequency of drought has
increased since the 1930s. The years with a high
number of months below the fifth percentile
coincide with El Nińo Southern Oscillation (ENSO)
events.
Figure A2.10 shows the results of a similar
analysis, but for rainfall estimates (19611990) and
projections (19912100).
The results indicate that prolonged and more
intense periods of drought will occur during the
remainder of the 21st century.
Notes: Likelihood 0 = zero chance; 1 = statistical certainty. Values for present
day based on observed data for 19802002, with gaps.
Source: CCAIRR findings.
Appendix 2
137
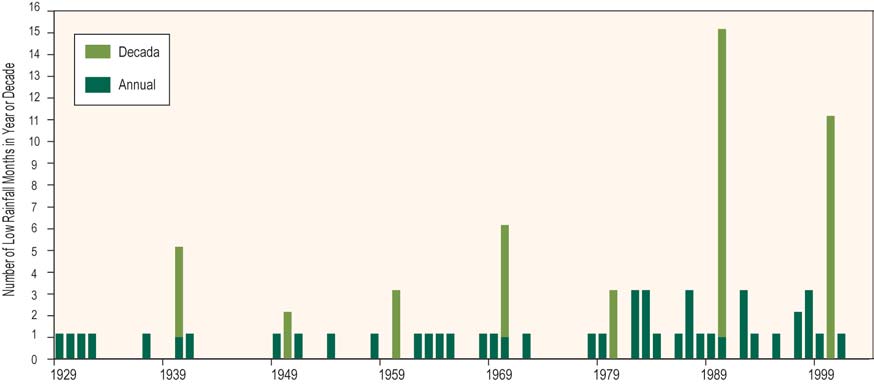
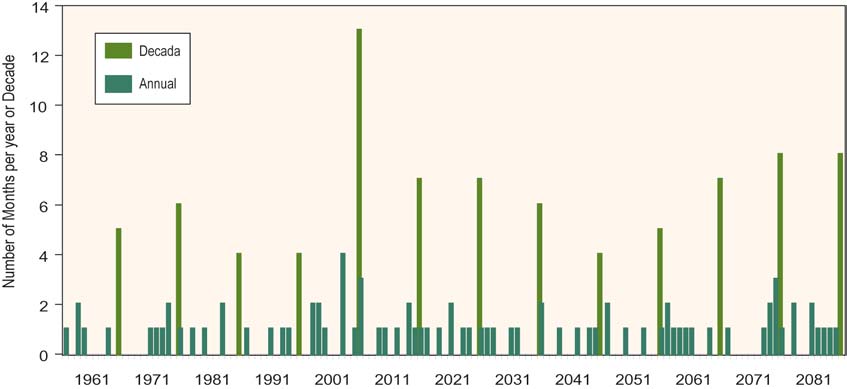
Figure A2.9. Number of Months in Each Year and Decade for which the
Precipitation was Below the Fifth Percentile
Note: data for Rarotonga.
Source: CCAIRR findings.
Figure A2.10. Number of Months Per Year and Per Decade for Which Precipitation in
Rarotonga was Observed, and is Projected to Be, Below the Fifth Percentile
Notes: data from the Canadian global climate module (GCM), with A2 emission scenarios and best estimate for GCM sensitivity.
Source: CCAIRR findings.
138
Climate Proofing: A Risk-based Approach to Adaptation
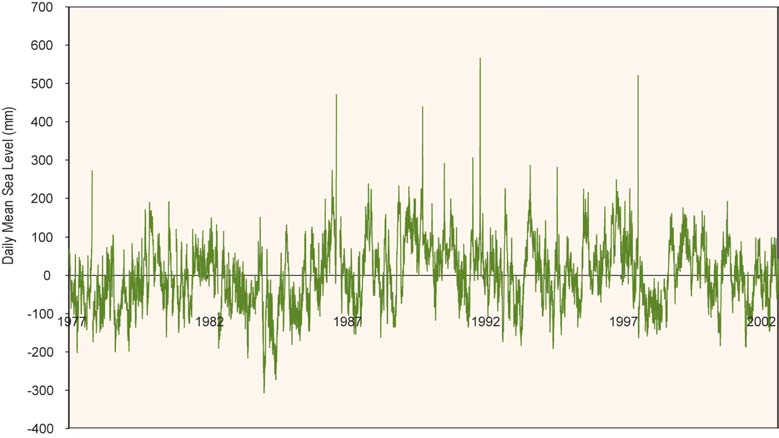
G. High Sea Levels and Extreme
Even more extreme high sea levels occur for
Wave Heights
time scales less than a day. Table A2.3 provides
return periods for given significant on-shore wave
Figure A2.11 shows daily mean values of sea level
heights for Rarotonga, for the present day and
for Rarotonga, relative to mean sea level. Large
projected future. The latter projections are based on
interannual variability occurs in sea level. The
the Canadian GCM 1 GS and the A1B emission
exceptionally high sea levels shown in Figure A2.11 are
scenario.
all associated with the occurrence of tropical cyclones.
Figure A2.11. Daily Mean Values of Sea Level for Rarotonga
(19772002)
Source: CCAIRR findings.
Table A2.3. Return Periods for Significant On-shore Wave Heights, Rarotonga
(years)
Sea Level (m)
Present Day
2025
2050
2100
(at least)
RP
LO
RP
LO
RP
LO
RP
LO
2
2
0.51
2
0.59
2
0.65
1
0.75
4
4
0.25
3
0.31
3
0.35
2
0.45
6
10
0.10
8
0.13
7
0.15
5
0.21
8
30
0.03
23
0.04
18
0.05
12
0.08
10
112
0.01
80
0.01
62
0.02
39
0.03
12
524
0
349
0
258
0
149
0.01
Notes: LO = likelihood pf occurrence; RP = return period.
Source: CCAIRR findings.
Appendix 2
139
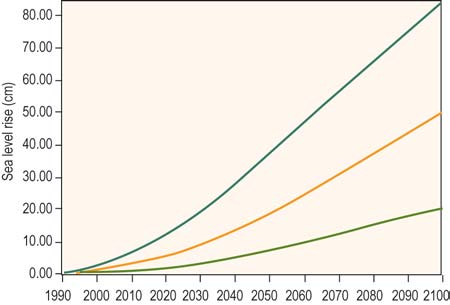
The indicated increases in sea level over the
next century are driven by global and regional
Figure A2.13. Annual Maximum Wind Gust
changes in mean sea level as a consequence of global
Recorded in Rarotonga for the Period
warming. Figure A2.12 illustrates the magnitude of
19721999
this contribution.
Figure A2.12. Sea Level Projections
for Rarotonga
Source: CCAIRR findings.
Figure A2.14. Likelihood of a Wind Gust of
40 m/sec (78 kt) Occurring Within the
Indicated Time Horizon, Rarotonga
Notes: Uncertainties related to global climate model sensitivity are indicated
by the blue, red and green lines, representing high, best estimate, and low
sensitivities, respectively.
Source: CCAIRR findings.
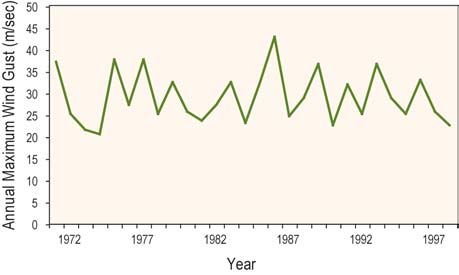
H. Strong Winds
Figure A2.13 shows the annual maximum wind
gust recorded in Rarotonga for the period 19721999.
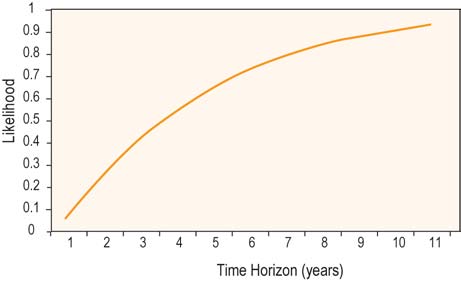
Figure 2.14 presents the likelihood of a wind
gust of at least 40 m/sec occurring at Rarotonga
within the specified time horizon.
Table A2.4 presents the return periods based on
Notes: 0 = zero chance; 1 = statistical certainty. Data for Rarotonga, Cook
an analysis of the observed maximum hourly wind
Islands (19721999). A wind gust of 40 ms-1 has a return period of 20 years.
gust data and the adjusted GCM wind speed data.
Source: CCAIRR findings.
The return period estimates of Kirk are for open
water conditions. Strong agreement is observed
between these and the return periods based on
to show slightly shorter return periods for lower
observed data, suggesting that the Rarotonga
extreme wind speeds and slightly longer return
anemometer provides extreme gust estimates that
periods for higher extreme wind speeds.
are reasonably representative of open water
Arguably the most important finding arising
conditions.
from this analysis is the suggestion that, over the
Comparison of the return period estimates for
coming 50 years or so, the return periods for the
the 19611990 GCM data with the observed data also
most extreme wind speeds will reduce significantly,
reveals good agreement, though the GCM data tend
decreasing by approximately half by 2050.
140
Climate Proofing: A Risk-based Approach to Adaptation
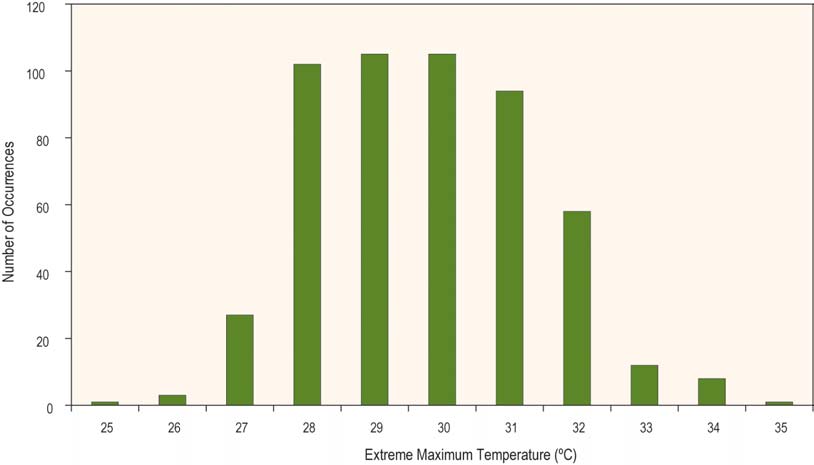
Table A2.4: Estimates of Return Periods for Given Maximum Wind Speeds, Rarotonga
(years)
Return Period (years)
Wind Speed
Kirk
Observed Data
GCM Based Maximum Wind Speed Data
(m/sec)
(1992)
(19721999)
19611990
19912020
20212050
28.5
2
2
1
1
1
33.9
5
5
2
2
2
37.5
10
11
3
4
4
38.8
13
14
5
5
6
41.9
25
29
18
16
14
44.9
50
57
60
45
31
47.8
100
113
120
95
64
Note: GCM = global climate module.
Source: CCAIRR findings.
I.
Extreme High Temperatures
maximum temperature for Rarotonga, based on
observed data (19612003) and GCM projections.
Figure A2.15 presents the frequency distribu-
Figure A2.16 shows the likelihood of a
tion of daily maximum temperature for Rarotonga.
maximum temperature of at least 35°C occurring
Table A2.5 details the return periods for daily
within the indicated time horizon.
Figure A2.15. Frequency distribution of Monthly Extreme Maximum Temperature for Rarotonga
Note: Based on observed data from 1961 to 2003.
Source: CCAIRR findings.
Appendix 2
141
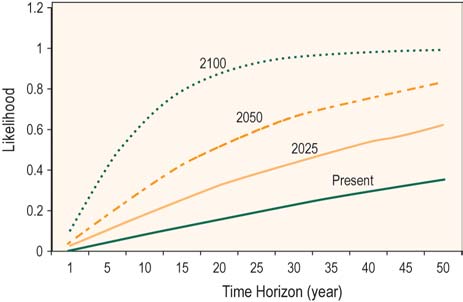
Table A2.5. Return Periods for Monthly Extreme Maximum Temperature, Rarotonga
(years)
Maximum
Observed
Projected
Temperature
(oC)
(1961-2003)
2025
2050
2100
RP
LO
RP
LO
RP
LO
RP
LO
31
1
0.72
1
0.90
1
0.97
1
1
32
3
0.33
2
0.54
1
0.71
1
0.94
33
9
0.12
5
0.22
3
0.34
2
0.64
34
29
0.03
14
0.07
9
0.12
3
0.29
35
108
0.01
52
0.02
29
0.03
10
0.10
36
435
0
208
0
115
0.01
37
0.03
Notes: LO = likelihood of occurrence; RP = return period.
Source: CCAIRR findings.
improved substantially over the same time period,
Fig A2.16 Likelihood of a Maximum
it is unwise to read too much into the marked
Temperature of at Least 35°C Occurring Within
contrast in frequency between the first and second
the Indicated Time Horizon in Rarotonga
halves of the 20th century. The record for the last
(years)
few decades is much more reliable, hence the
doubling in decadal frequencies between the 1950s
and 1990s may well be closer to the truth. It is
certainly consistent with the fact, since the 1970s
that El Nińo episodes have tended to be more
frequent, without intervening La Nińa events. The
duration of the 199095 El Nińo is unprecedented
in the climate record of the past 124 years.
Studies by Australia's Bureau of Meteorology
(Figure A2.18a and b) reveal the consequences of
the weakened trade winds and eastward movement
of the warm waters of the western tropical Pacific
during El Nińo events. Because convective systems
(e.g., thunderstorms and rainstorms) and tropical
cyclones preferentially occur over warmer waters,
Note: 0 = zero chance; 1 = statistical certainty.
Source: CCAIRR findings.
changes in the pattern of sea surface temperatures
is reflected in the distribution of rainfall and tropical
cyclones.
A possible consequence of the increased
J.
Tropical Cyclones
persistence of El Nińo conditions in recent decades
is the apparent intensification of tropical cyclones,
as reflected in the systematic increase in upper 10
The number of tropical cyclones passing close
percentile heights of open water waves associated
to, and affecting Rarotonga appears to have
with tropical cyclones occurring in the vicinity of
increased during the last century (Figure A2.17).
Rarotonga (Table A2.6).
However, since observing and reporting systems
142
Climate Proofing: A Risk-based Approach to Adaptation
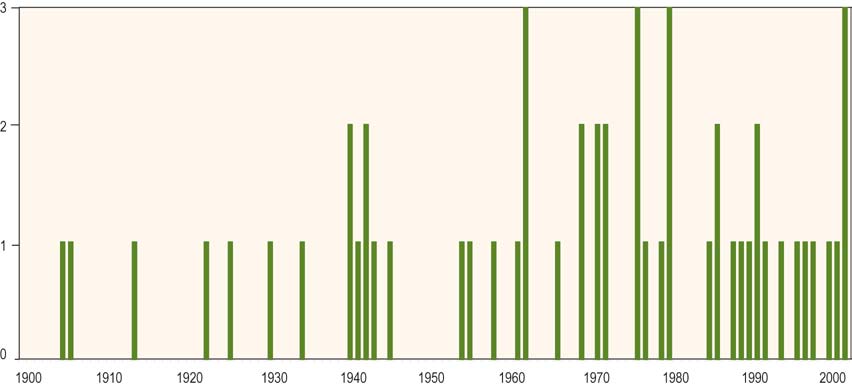
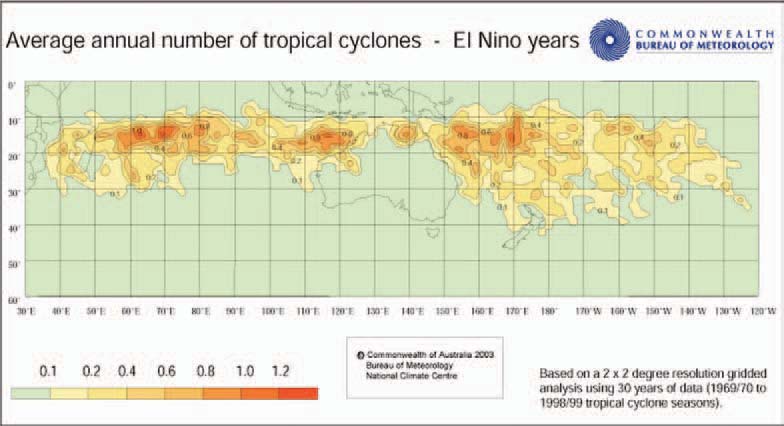
Figure A2.17. Number of Tropical Cyclones per Year passing Close to, and Affecting, Rarotonga
Sources: Kerr 1976, Revell 1981, Thompson et al. 1992, d'Aubert and Nunn 1994, Fiji Meteorological Service 2004, and Ready (personal communication).
Figure A2.18a. Average Annual number of Tropical Cyclones for El Nińo Years
Source: Australian Bureau of Meteorology, n.d. Reproduced by permission
Appendix 2
143
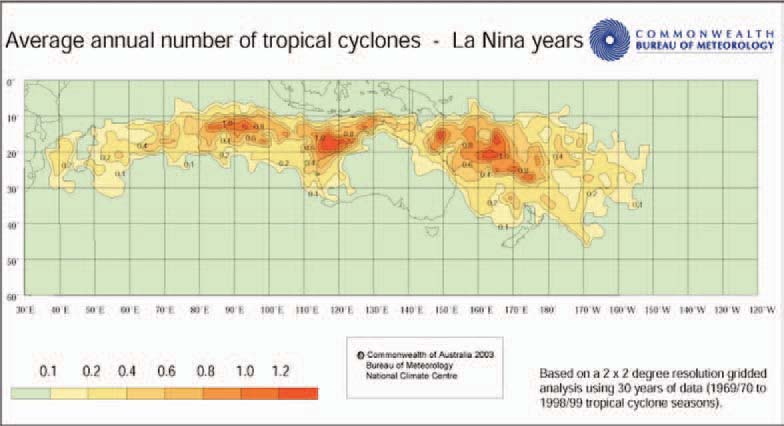
Figure A2.18b. Average Annual number of Tropical Cyclones for La Nińa Years
Source: Australian Bureau of Meteorology, n.d. Reproduced by permission
Table A2.6. Open Water Wave Height (Average of Top 10%)
Associated with Tropical Cyclones Recently Affecting Rarotonga
Cyclone
Wave Height
(name and year)
(m)
Charles (1978)
11
Sally (1987)
10
Val (1991)
14
Pam (1997)
14
Dovi (2003)
17
Heta (2004)
17
Nancy (2005)
22
Percy (2005)
19
Source: Dorrell (personal communication).
144
Climate Proofing: A Risk-based Approach to Adaptation