The
Danube River
Basin District
River basin characteristics, impact of human activities and economic analysis required under Article 5, Annex II and Annex III,
and inventory of protected areas required under Article 6, Annex IV of the EU Water Framework Directive (2000/60/EC)
Part A ≠ Basin-wide overview
Short: "Danube Basin Analysis (WFD Roof Report 2004)"
//// Deutschland //// ÷sterreich //// BosnaiHercegovina////Balgarija////H
//// Slovensko ///
r
/
v
ora
S
a
G
lo
ts
ve
k
n
a
rna
ija
//
i C
//
/
//
/
Ukr
C
aÔna ////
e
rbija
sk· r
//// S
epub
‚nia
lika //// Magyarorsz·g////Moldova////Rom
The complete report consists of Part A: Basin-wide overview, and Part B: Detailed analysis of the Danube river basin countries
18 March 2005, Reporting deadline: 22 March 2005
Prepared by
International Commission for the Protection of the Danube River
(ICPDR) in cooperation with the countries of the Danube River Basin
District.
The Contracting Parties to the Danube River Protection Convention
endorsed this report at the 7th Ordinary Meeting of the ICPDR on
December 13-14, 2004. The final version of the report was approved
18 March 2005.
Overall coordination and editing by Dr. Ursula Schmedtje, Technical
Expert for River Basin Management at the ICPDR Secretariat, under
the guidance of the River Basin Management Expert Group.
ICPDR Document IC/084, 18 March 2005
International Commission for the Protection of the Danube River
Vienna International Centre D0412
P.O. Box 500
A-1400 Vienna, Austria
Phone: +(43 1) 26060 5738
Fax:
+(43 1) 26060 5895
e-mail: icpdr@unvienna.org
web:
http://www.icpdr.org/DANUBIS
Acknowledgements
We would like to thank the many people that have contributed to the
Specific text contributions have been provided by:
successful preparation of this report:
Jasmine Bachmann ∑ Horst Behrendt ∑ Sebastian Birk ∑ Pavel Biza ∑
≠ the 13 Danube countries and their experts for their comprehensive
Joachim D'Eugenio ∑ Jos van Gils ∑ Johannes Grath ∑ Carmen
data and text contributions, their comments and ideas,
Hamchevici ∑ Wenke Hansen ∑ Eduard Interwies ∑ Eleftheria Kampa ∑
≠ the ICPDR River Basin Management Expert Group for the overall
Helga Lindinger ∑ Igor Liska ∑ Liviu Popescu ∑ Mihaela Popovici ∑
guidance and coordination of WFD implementation in the Danube
Tanja Pottgiesser ∑ Ursula Schmedtje ∑ Gerhard Sigmund ∑
River Basin District,
Mario Sommerh‰user ∑ Stefan Speck ∑ Ilse Stubauer ∑ Birgit Vogel ∑
≠ the other ICPDR Expert Groups for giving guidance on specific
Philip Weller ∑ Gerhard Winkelmann-Oei ∑ Alexander Zinke.
WFD issues, and for defining common criteria for basin-wide data
collection,
The maps have been produced by Ulrich Schwarz.
≠ the consultants for drafting chapters and giving their expertise on
Danube issues,
≠ the UNDP/GEF Danube Regional Project for technical and
financial support, and
≠ the ICPDR Secretariat for the preparation of the Roof Report,
coordination and harmonisation of contributions, and editing to
create an informative and readable report.
This report was coordinated and edited by Ursula Schmedtje.
Technical support was given by Edith Hˆdl.
Mario Romulic, Croatia
Table of Contents
Analyses required under Article 5, Annex II and Annex III, and Inventory required under Article 6, Annex IV WFD
1. INTRODUCTION
1.1. Aim of the report
12
1.2. Structure and contents of the report
12
1.3. Status of the report and disclaimer
16
2. THE DANUBE RIVER BASIN DISTRICT AND ITS INTERNATIONAL COORDINATION ARRANGEMENTS
2.1. Delineation of the Danube River Basin District
18
2.2. States in the Danube River Basin District
20
2.3. International coordination of WFD implementation
22
2.3.1. Coordination at the basin-wide level
22
2.3.2. Bilateral and multilateral
24
2.3.3. Competent authorities
25
3. GENERAL CHARACTERISATION OF THE DANUBE RIVER BASIN DISTRICT
3.1. Geographic characterisation
26
3.2. Climate and hydrology
26
3.3. The Danube River and its main tributaries
28
3.4. Important lakes in the Danube River Basin District
30
3.5. Major wetlands in the Danube River Basin District
32
3.6. Important canals for navigation
33
3.7. Groundwater in the Danube River Basin District
35
4. CHARACTERISATION OF SURFACE WATERS (ART. 5 AND ANNEX II)
4.1. Identification of surface water categories
36
4.2. Surface water types and reference conditions
36
4.2.1. Ecoregions in the Danube River Basin District
36
4.2.2. Rivers
38
4.2.2.1. Typology of the Danube River
38
4.2.2.2. Typology of the tributaries in the Danube River Basin District
39
4.2.2.3. Reference conditions
41
4.2.3. Lakes
44
4.2.3.1. Lake types
44
4.2.3.2. Reference conditions
45
4.2.4. Transitional waters
45
4.2.5. Coastal waters
47
4.3. Identification of surface water bodies
48
4.3.1. Water bodies in rivers
48
4.3.2. Water bodies in lakes
48
4.3.3. Water bodies in transitional and coastal waters
49
4.3.4. Heavily modified water bodies (provisional identification)
49
4.3.5. Artificial water bodies
49
4.4. Identification of significant pressures
51
4.4.1. Significant point source pollution (overview)
52
4.4.1.1. Data availability
52
4.4.1.2. Contribution of sub-basins to the total point source pollution of the Danube
54
Table of Contents 2
4.4.2. Significant sources of nutrients (point and diffuse) including land use patterns
57
4.4.2.1. Introduction
57
4.4.2.2. Present state of the nutrient point discharges
57
4.4.2.3. Land use patterns and agricultural indicators
58
4.4.2.4. Diffuse nutrient pollution
66
4.4.2.5. Historical development of the diffuse source nutrient pollution into the Danube River system
71
4.4.3. Other significant diffuse source pollution
72
4.4.3.1. Analysis of priority pesticides used in the Danube River Basin District
73
4.4.4. Significant hydromorphological alterations
74
4.4.4.1. Hydropower generation
75
4.4.4.2. Flood defence measures
77
4.4.4.3. Navigation
78
4.4.4.4. Water transfer and diversion
79
4.4.4.5. Future infrastructure projects
79
4.4.5. Other significant anthropogenic pressures
80
4.4.5.1. Accident Pollution
80
4.4.5.2. Fisheries
82
4.4.5.3. Invasive species
82
4.5. Assessment of impacts on the basin-wide level
84
4.5.1. Impacts on rivers
86
4.5.1.1. Impacts from organic pollution
86
4.5.1.2. Contamination with hazardous substances
93
4.5.1.3. Impacts from nutrient loads
100
4.5.1.4. Impacts caused by hydromorphological alterations
109
4.5.1.5. Impacts from over-fishing
113
4.5.2. Impacts on lakes and lagoons
115
4.5.2.1. Neusiedlersee / Ferto-tÛ
115
4.5.2.2. Lake Balaton
115
4.5.2.3. Ozero Ialpug
116
4.5.2.4. Razim-Sinoe lacustrine system
116
4.5.3. Impacts on the Danube Delta
117
4.5.3.1. Link to pressures
117
4.5.3.2. Impact assessment
118
4.5.3.3. Expected future developments
118
4.5.4. Impacts on coastal waters and the wider marine environment of the Black Sea
119
4.5.4.1. Assessment of status and impact
119
4.5.4.2. Impact assessment
120
4.5.4.3. Expected future developments
124
4.5.5. Impacts on artificial water bodies
124
4.5.5.1. Main-Danube Canal
124
4.5.5.2. Danube-Tisza-Danube Canal System
124
4.5.5.3. Danube-Black Sea Canal
124
4.6. Heavily modified surface waters (provisional identification)
125
4.6.1. Provisionally identified heavily modified waters on rivers
125
4.6.1.1. Approach for selecting heavily modified water bodies for the basin-wide overview
125
4.6.1.2. Provisional identification of heavily modified waters on rivers based on the agreed criteria
125
4.6.2. Provisional HMWBs on lakes
129
4.6.3. Provisional HMWBs on transitional and coastal waters
129
Table of Contents 3
4.7. Risk of failure to reach the environmental objectives (overview)
130
4.7.1. Approach for the risk assessment on surface waters
130
4.7.2. Risk of failure analysis on rivers
132
4.7.2.1. Results on the Danube River
133
4.7.2.2. Results on the Danube tributaries
134
4.7.2.3. Discussion of results of the risk analysis on rivers
135
4.7.3. Risk of failure analysis on lakes
135
4.7.4. Risk of failure analysis on transitional and coastal waters
136
4.7.5. Risk of failure analysis on heavily modified water bodies
136
4.7.6. Risk of failure analysis on artificial water bodies
136
4.8. Data gaps and uncertainties
137
4.8.1. Typology of surface waters and definition of reference conditions
137
4.8.2. Significant pressures relevant on the basin-wide scale
137
4.8.3. Assessment of impacts on the basin-wide level
139
4.9. Conclusions on surface waters
141
4.9.1. Surface water types and reference conditions
141
4.9.2. Significant point and diffuse sources of pollution
141
4.9.3. Impacts from organic pollution
142
4.9.4. Contamination with hazardous substances
143
4.9.5. Impacts from nutrients
143
4.9.6. Impacts on the Danube Delta
144
4.9.7. Coastal waters and the wider marine environment of the Black Sea
144
4.9.8. Hydromorphological alterations
145
4.9.9. Important heavily modified surface waters
145
4.9.10. Invasive species
146
4.9.11. Risk of failure analysis
146
5. CHARACTERISATION OF GROUNDWATERS (ART. 5 AND ANNEX II)
147
5.1. Location, boundaries and characterisation of groundwater bodies
148
5.1.1. Important transboundary groundwater bodies in the Danube River Basin District
149
5.1.2. Summary description of the important transboundary groundwater bodies
151
5.2. Risk of failure to reach the environmental objectives (overview)
152
5.2.1. Approach for the risk of failure analysis on groundwater
152
5.2.2. Results of the risk analysis on groundwater
152
5.3. Data gaps and uncertainties
153
5.4. Conclusions on groundwater
153
6. INVENTORIES OF PROTECTED AREAS (ART. 6 AND ANNEX IV)
154
6.1. Inventory of protected areas for species and habitat protection
154
6.1.1. Approach for setting up the inventory
155
6.1.2. Definition of important water-related protected areas on the basin-wide scale
155
6.1.3. Establishment of the inventory with a core data set
155
6.2. Data gaps and uncertainties
156
6.3. Conclusions on protected areas
156
Table of Contents 4
7. ECONOMIC ANALYSIS (ART. 5 AND ANNEX III)
157
7.1. Economic analysis of water uses (overview)
157
7.1.1. Assessing the economic importance of water uses
157
7.1.1.1. Characteristics of water services
161
7.1.1.2. Characteristics of water uses
163
7.1.2. Projecting trends in key economic indicators and drivers up to 2015
163
7.1.3. Assessing current levels of recovery of the costs of water services
165
7.1.4. Preparing for the cost-effectiveness analysis
165
7.2. Data gaps and uncertainties
165
7.3. Conclusions on the economic analysis of water uses
165
8. PUBLIC INFORMATION AND CONSULTATION
166
8.1. Strategy for public participation in river basin management 2003-2009
166
8.2. ICPDR Operational Plan
167
8.2.1. Activities in 2004
167
8.2.1.1. Joining forces ≠ a Network of Public Participation Focal Points
167
8.2.1.2. Confidence building ≠ WFD brochure and WFD on the internet
167
8.2.1.3. Reaching the public ≠ developing a media network
167
8.2.1.4. Knowing your partners ≠ a stakeholder analysis
167
8.2.2. Celebrating the Danube River Basin ≠ Danube Day
168
9. KEY CONCLUSIONS AND OUTLOOK
169
10. REFERENCES
172
5
List of Tables
TABLE 1
Issues covered in Part A (Roof report) and Part B (National reports)
15
TABLE 2
Area of the Danube River Basin District
18
TABLE 3
States in the Danube River Basin District
20
TABLE 4
Coverage of the states in the Danube River Basin (DRB) and estimated population
21
TABLE 5
Overview of bilateral agreements and bilateral cooperations for WFD implementation in the Danube River Basin District
24
TABLE 6
List of competent authorities in the Danube River Basin District
25
TABLE 7
The Danube and its main tributaries (1st order tributaries with catchments > 4,000 km2) in the order of their confluence with the
Danube from the source to the mouth
29
TABLE 8
The main lakes (with a surface area > 100 km2) in the Danube River Basin
31
TABLE 9
Hydrological characteristics of DBSC and PAMNC
34
TABLE 10
Ecoregions in the Danube River Basin
37
TABLE 11
Definition of Danube section types
38
TABLE 12
Obligatory factors used in river typologies (System A and B)
40
TABLE 13
Optional factors used in river typologies by countries using System B
41
TABLE 14
Number of stream types defined on the DRBD overview level
42
TABLE 15
Basic criteria for defining reference conditions (harmonised basin-wide)
43
TABLE 16
Lakes selected for the basin-wide overview and their types
44
TABLE 17
Quality elements used to describe reference conditions of lakes
45
TABLE 18
Types of transitional waters in the Danube River Basin District
47
TABLE 19
Types of coastal waters in the Danube River Basin District
47
TABLE 20
Number of water bodies on rivers on the DRBD overview scale
48
TABLE 21
Criteria for the delineation of water bodies in rivers
48
TABLE 22
Transitional water bodies and reasons for their delineation
49
TABLE 23
Coastal water bodies and reasons for their delineation
49
TABLE 24
Artificial water bodies relevant on the basin-wide scale
50
TABLE 25
Definition of significant point source pollution on the basin-wide level
52
TABLE 26
Significant point sources of pollution in the Danube River Basin District according to the criteria defined in Table 25
53
TABLE 27
Municipal, industrial and agricultural point source discharges of COD, BOD, total nitrogen and phosphorus from
significant sources according the criteria of Table 25
55
TABLE 28
Specific point source discharges of COD, BOD, total nitrogen and phosphorus from municipal waste water treatments (WWTPs),
direct industrial discharges, and agricultural point discharges in the sub-catchments of the Danube
56
TABLE 29
Consumption of pesticides (in t/a) in some Danube countries and specific pesticide consumption (kg per ha agricultural area and year)
in the year 2001 according to the FAO database
73
TABLE 30
Classification scheme of water quality according to saprobic index
91
TABLE 31
Annual mean Saprobic Index based on macrozoobenthos (TNMN stations 1997-2000)
92
TABLE 32
Annual mean Saprobic Index based on phytoplankton (TNMN stations 1997-2000)
93
TABLE 33
Fish stocking and catch of sturgeon in Bulgaria in 2001-2003
114
TABLE 34
Matrix of common borders and number of nominated important transboundary groundwater bodies or
groups of groundwater bodies in the DRBD
149
TABLE 35
Nominated important transboundary groundwater bodies or groups of groundwater bodies in the DRBD
150
TABLE 36
General socio-economic indicators
158
TABLE 37
Water production, wastewater services and connection rates
159
TABLE 38
Wastewater treatment plants
160
TABLE 39
Population connected to wastewater treatment plants ≠ data refers to whole country
161
TABLE 40
Production of main economic sectors
161
List of Tables 6
TABLE 41
Electricity generation in the DRB: total and electricity generation devided by origin
162
TABLE 42
Inland navigation
165
TABLE 43
National trends in total water supply and demand up to 2015
164
TABLE 44
National economic growth rates for main economic sectors (up to 2015)
164
7
List of Figures
FIGURE 1
Structure of the report for the Danube River Basin District
13
FIGURE 2
Organisational structure under the Danube River Protection Convention
22
FIGURE 3
Coordination mechanisms for WFD implementation in the Danube River Basin (for bilateral agreements only some examples are shown;
a full list is contained in Table 5)
23
FIGURE 4
Location of the Danube River Basin in Europe
27
FIGURE 5
Longitudinal profile of the Danube River and contribution of water from each country (in %) to the cumulative discharge of the Danube
(in Mio m3/year), based on data for 1994-1997 using the Danube Water Quality Model
28
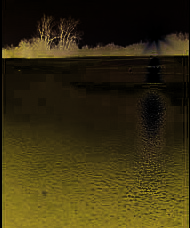
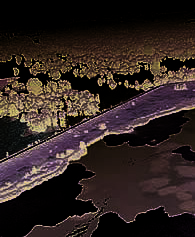
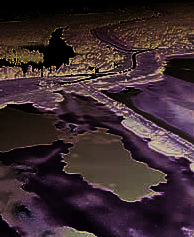
FIGURE 6
The Danube Delta
33
FIGURE 7
Ecoregions covered by the Danube River Basin District
37
FIGURE 8
Danube section types; the dividing lines refer only to the Danube River itself
39
FIGURE 9
Location of transitional and coastal water types
46
FIGURE 10 Transitional and coastal water bodies in the Danube River Basin District
50
FIGURE 11 Inhabitant-specific N discharges from point sources (total load divided by total population in the state) in the Danube countries
for the period 1998 to 2000; results of the MONERIS application for this report
57
FIGURE 12 Inhabitant-specific P discharges from point sources (total load divided by total population in the state) in the Danube countries
for the period 1998 to 2000; results of the MONERIS application for this report
58
FIGURE 13 Portion of land use types in the total area of the Danube countries for the period 1998 to 2000 (data source FAO the exception is Germany -
DE* represents the land use for Baden- W¸rttemberg and Bavaria according to the German Federal Statistical Office for the same period)
59
FIGURE 14 Portion of land use types at the parts of countries within the Danube basin and the average for the total Danube according to CORINE land
cover map and transferred USGS land cover map (source: SCHREIBER et al. 2003)
59
FIGURE 15 Consumption of nitrogen market fertilizers in the Danube countries, within the EU 15 countries, and EU maximum value in the period
1998 to 2000 (The bars represent the consumption of nitrogen market fertilizers per agricultural area of the Danube countries. The data
given for DE* represents the average N fertilizer consumption of the German "L‰nder" Baden-W¸rttemberg and Bavaria. The database
is the national statistics published by the statistical offices of the countries or by FAO)
60
FIGURE 16 Consumption of nitrogen market fertilizers per inhabitant in the Danube countries, the EU 15 countries, and EU maximum value in the
period 1998 to 2000 (The bars represent the consumption of nitrogen market fertilizers per inhabitant living in the Danube countries.
The data given for DE* represents the average N fertilizer consumption of the German "L‰nder" Baden-W¸rttemberg and Bavaria. The
database is the national statistics published by the statistical offices of the countries or by FAO)
61
FIGURE 17 Animal unit density per agricultural area in the Danube countries for the period 1998 to 2000. (The bars represent the animal units per
agricultural area in the Danube countries. The data given for DE* represents the animal unit density of the German "L‰nder" Baden-W¸rttemberg
and Bavaria. The database is national statistics published by the statistical offices of the countries or by FAO, equivalents for Czech Republic
and Germany were used)
62
FIGURE 18 Animal units per inhabitant in the Danube countries for the period 1998 to 2000. (The bars represent the animal units per inhabitant in the
Danube countries. The data given for DE* represents the inhabitant-specific animal unit density of the German "L‰nder" Baden-W¸rttemberg
and Bavaria. The database is national statistics published by the statistical offices of the countries or by FAO, equivalents for Czech Republic
and Germany were used)
62
FIGURE 19 Nitrogen surplus per agricultural area in the Danube countries for the period 1998 to 2000. Data sources: SCHREIBER et al. (2003), based on
data of FAO and national statistics for the German "Bundesl‰nder"; data source for EU15 and EUmax: FAO (2004). The data of these sources
are not directly comparable, but give a general indication.
63
FIGURE 20 Phosphorus accumulation on agricultural area in the Danube countries for the period 1950 to 2000 (for data sources see Figure 19)
64
FIGURE 21 Agricultural area per inhabitant living in the Danube countries, the EU15 countries, the minimum in the EU15 countries, as well as the population
weighted average for the Danube basin for the period 1998 to 2000 (Data sources: see Figure 19)
65
FIGURE 22 Nitrogen surplus per inhabitant and year in the Danube countries for the period 1998 to 2000 (data sources: see Figure 19)
66
FIGURE 23 Pathways and processes used in MONERIS
67
FIGURE 24 Diffuse nutrient pollution by pathways for the total Danube river systems for the period 1998 to 2000; result of the MONERIS application
for this report
67
List of Figures 8
FIGURE 25 Total nutrient emissions by human sources and background values for the Danube river basin in the period 1998-2000
result of the MONERIS application for this report
68
FIGURE 26 Total N emissions by human sources for area of the countries within the Danube basin in the period 1998-2000
69
FIGURE 27 Total P emissions by human sources for area of the countries within the Danube basin in the period 1998-2000; result of the MONERIS application for
this report
69
FIGURE 28 Deviations of the specific total diffuse nitrogen pollution from agricultural activities in the main sub-catchments of the Danube from the average for
the period 1998-2000
70
FIGURE 29 Deviations of the specific total diffuse phosphorus pollution from agricultural activities in the main sub-catchments of the Danube from the average
for the period 1998-2000
70
FIGURE 30 Temporal changes of the nitrogen emissions into the total Danube river system for the years 1955 to 2000 (see also Chapter 4.5.1.3)
71
FIGURE 31 Temporal changes of the phosphorus emissions into the total Danube river system for the years 1955 to 2000 (see also Chapter 4.5.1.3)
71
FIGURE 32 TNMN stations in the Danube river basin
85
FIGURE 33 Procedure for the estimation of the risk of failure to reach the environmental objectives of the WFD
86
FIGURE 34 Dissolved Oxygen - Spatial distribution of mean values of c10 for 1996 ≠ 2000 data against the limit of Class II (TV - target value) ≠ the
Danube River Contrary to the other determinands, in the case of dissolved oxygen the "above target value" means a favorable situation
87
FIGURE 35 Dissolved Oxygen - Spatial distribution of mean values of c10 for 1996 ≠ 2000 data against the limit of Class II (TV- target value) ≠ tributaries
Contrary to the other determinands, in the case of dissolved oxygen the "above target value" means a favorable situation
88
FIGURE 36 Biochemical Oxygen Demand - Spatial distribution of mean values of c90 for 1996 ≠ 2000 data against the limit of Class II (TV - target value) ≠
the Danube River. The values above the TV show unfavorable situations
89
FIGURE 37 Biochemical Oxygen Demand - Spatial distribution of mean values of c90 for 1996 ≠ 2000 data against the limit of Class II (TV - target value) ≠
tributaries. The values above the TV show unfavorable situations
89
FIGURE 38
Chemical Oxygen Demand (COD-Cr) Spatial distribution of mean values of c90 for 1996 ≠ 2000 data against the limit of Class II (target value) ≠
the Danube River. The values above the TV show unfavorable situations
90
FIGURE 39 Chemical Oxygen Demand (COD-Cr) Spatial distribution of mean values of c90 for 1996-2000 data against the limit of Class II (target value) ≠
tributaries. The values above the TV show unfavorable situations.
90
FIGURE 40 Temporal trends of Cadmium in the Danube River
95
FIGURE 41 TNMN Water quality classes for cadmium and for mercury in 2001
96
FIGURE 42 Temporal trends of pp'-DDT in the Danube River
96
FIGURE 43 TNMN Water quality classes for Atrazine in 2001
97
FIGURE 44 Schematic representation of the nutrient balances in the surface water network
100
FIGURE 45 Overall assessment of present nutrient concentrations (on the basis of TNMN data from the year 2001)
101
FIGURE 46 Temporal and spatial trends of nitrate concentrations (data for the years 1996-2001; figures from TNMN Yearbook 2001; ICPDR 2001)
102
FIGURE 47 Temporal and spatial trends of the concentration of total phosphorus (data for the years 1996-2001; figures from
TNMN Yearbook 2001; ICPDR 2001)
103
FIGURE 48 Historical development of nutrient loads in the Danube River for dissolved inorganic nitrogen (top) and total phosphorous (bottom)
based on modelling results with MONERIS; the estimates refer to the Danube River before it enters the delta
104
FIGURE 49 Information related to the concentrations of chlorophyll-£\ in the Danube and its large tributaries, on the basis of TNMN field data
from 2001 (compare also Figure 50)
106
FIGURE 50 Concentrations of chlorophyll- \ [µg/l] in the Danube River on the basis of field data collected during the JDS (compare also Figure 49)
106
FIGURE 51 River load profiles of nitrogen (a) and phosphorus (b), subdivided over countries of origin ≠ derived from simulations with the
Danube Water Quality Model (DWQM) during the GEF-UNDP Danube Pollution Reduction Programme, 1999 UNDP/GEF (1999a)
108
FIGURE 52 Symbolised view of floodplains in the Danube River Basin
FIGURE 53 Schematic representation of the distribution of water over the main Danube branches and the Delta complexes
111
FIGURE 54 The evolution of the inorganic nutrients concentrations (µM) in the Romanian coastal waters (Constanta monitoring site): phosphates (a),
silicates (b) and inorganic nitrogen (c) (Source: "State of the Environment of the Black Sea, Pressures and Trends, 1996 - 2000")
118
FIGURE 55 Development of the phytoplankton biomass in different parts of the Black Sea (derived by Horstmann and Davidov from field data
collected in the daNUbs research project)
120
FIGURE 56 Long term development of the N/P ratios in the Danube influenced waters off Constanta
121
List of Figures 9
FIGURE 57 Number of macro benthic species in front of the Danube delta (10 stations on 3 transects off Constanta, data from
C. Dumitrache, IRCM Constanta)
122
FIGURE 58 Development of seasonal areas of low oxygen concentration near the bottom on the northwestern shelf of the Black Sea
(after ZAITSEV & MAMAEV 1997)
122
FIGURE 59 Concentration of dissolved oxygen (expressed as % of saturation value) near the bottom on the Romanian shelf of the Western Black Sea
in September 1996, September 1999 and September 2003 (compiled in the daNUbs project from data collected by RMRI)
127
FIGURE 60 Main uses of the identified HMW sections on the Danube River
127
FIGURE 61 Main uses of the identified HMW sections on the tributaries of the DRBD
127
FIGURE 62
Physical alterations of the identified HMW sections on the Danube River
127
FIGURE 63
Physical alterations of the identified HMW sections on tributaries of the DRBD
127
FIGURE 64
Criteria used in expert judgement for the provisional identification of HMW sections on the Danube
128
FIGURE 65 Criteria used in expert judgement for the provisional identification of HMW sections on the tributaries of the DRBD
128
FIGURE 66 From the pressure and impact analysis to assessing the risk of failure to reach the environmental objectives
130
FIGURE 67 Risk classification of the Danube, disaggregated into risk categories. Each full band represents the assessment for one risk category
(hydromorphological alterations, hazardous substances, nutrient pollution, organic pollution). Colours indicate the risk classes.* SK territory.
133
10
List of Abbreviations
a.s.l.
above sea level
DRBD
Danube River Basin District
AEWS
Accident Emergency Warning System
DRBMP
Danube River Basin Management Plan
AOX
Adsorbable Organic Halogens
DRP
Danube Regional Project
AP
Action Programme
DRPC
Danube River Protection Convention
APC EG
Expert Group on Pollution, Prevention and Control
DTD
Danube-Tisza-Danube (Canal)
AQEM
The development and testing of an integrated assessment system
EC
European Commission
for the ecological quality of streams and rivers throughout Europe
ECO EG
Expert Group on Ecology
using benthic macroinvertebrates (EU-Project)
Econ ESG
Expert Sub-group on Economics
ARS
Accident risk spots
Eds
Editors
AT
Austria
EEA
European Environment Agency
AWB
Artificial Water Bodies
EEC
European Economic Community
BAT
Best available technology
EG
Expert Group
Bd
Band
EMIS EG
Expert Group on Emission
BG
Bulgaria
EPER
European Pollutant Emission Register
BOD
Biochemical Oxygen Demand
EQS
Environmental Quality Standards
BR
Biosphere Reserve
EU
European Union
BSC
Black Sea Commission
FAO
Food and Agricultural Organisation of the United Nations
CCO-Mn
Chemical Oxygen Consumption
FAOSTAT
Database of the Food and Agriculture Organization of the
CEE
Central and Eastern Europe
United Nations
CIS
Common Implementation Strategy
FP EG
Expert Group on Flood Protection
CITES
Convention on International Trade in Endangered Species of
FP
Flood Protection
Wild Fauna and Flora
FPOM
Fine Particulate Organic Matter
COD
Chemical Oxygen Demand
GDP
Gross domestic product
COD-Cr
Chemical oxygen demand (dichromate method)
GEF
Global Environment Facility
COD-Mn
Chemical oxygen demand (manganesedichromate method)
GES
Good Ecological Status
CORINE
Coordination of information on the environment - CORINE
GIS ESG
Expert Sub-group on Cartography and GIS
land cover
GIS
Geographical Information System
CP
Contracting Party
GWP
Global Water Partnership
CPOM
Coarse Particulate Organic Matter
HMWB
Heavily Modified Water Body
CS
Serbia and Montenegro
HPP
Hydro-Power Plant
CZ
Czech Republic
HPS
Hydroelectric Power Station
daNUbs
Nutrient Management in the Danube Basin and its Impact
HR
Croatia
on the Black Sea
Hrsg
Herausgeber (Editor)
DBSC
Danube-Black Sea Canal
HU
Hungary
DDNI
Danube Delta National Institute for Research and Development
IAD
International Association for Danube Research
DDT
Chlorinated Organic Insecticides-1,1,1-Trichloro-2,2-bis-
IAWD
International Association of Water Supply Companies in the
(4'-chlorophenyl) ethane
Danube River Catchment Area
DDT
Dichlorodiphenyltrichloroethane
IBA
Important Bird Area
DE
Germany
ICPDR
International Commission for the Protection of the Danube River
DEF
Danube Environmental Forum
IHD
International Hydrological Decade
DIN
Dissolved Inorganic Nitrogen
IHP
International Hydrological Programme of the UNESCO
DO
Dissolved oxygen
IRCM
Institutul Roman de Cercetari Marine, Constanta
DOC
Dissolved Organic Carbon
IUCN
International Union for the Conservation of Nature
DPRP
Danube Pollution Reduction Programme
JAP
Joint Action Programme
DRB
Danube River Basin
JDS
Joint Danube Survey
List of Abbreviations 11
km
kilometre
RefCond
Reference Conditions
MHQ
mean high flow
rkm
river kilometre
MLIM EG
Expert Group on Monitoring, Laboratory and Information
RMRI
Romanian Marine Research Institute
Management
RO
Romania
MLIM
Monitoring, Laboratory & Information Management
RR
Roof Report
MNQ
mean low flow
Si
Silica
MONERIS
Modelling Nutrient Emissions into RIver Systems
SI
Slovenia
MoU
Memorandum of Understanding
SK
Slovak Republic
MQ
mean flow
SWG
Standing Working Group
N
Nitrogen
t
ton
na
not available
TEN
Trans-European Transport Networks
NGO
Non-governmental Organisation
TNMN
Transnational Monitoring Network
OECD
Organisation for Economic Cooperation and Development
TOC
Total Organic Carbon
OJ
Official Journal
TP
Total Phosphorus
OM
Ordinary Meeting
TS
Technical Support
P
Phosphorus
TV
Target value
PAHs
polycyclic aromatic hydrocarbons
UBA
Umweltbundesamt (Federal Environment Agency)
PAMNC
Poarta Alba ≠ Midia Navodari Canal
UN/ECE
United Nations Economic Commission for Europe
PIAC
Principal International Alert Centre
UNDP
United Nations Development Programme
POPs
Persistent Organic Pollutants
UNESCO
United Nations Educational, Scientific and Cultural Organisation
PPP
Purchase power parity
USGS
United States Geological Survey
PRTR
Pollutant Release and Transfer Register
VOCs
volatile organic compounds
PS
Permanent Secretariat
Vol
Volume
RBI
River Basin Initiative
WFD
Water Framework Directive
RBM EG
Expert Group on River Basin Management
WRI
Water risk index
RBM
River Basin Management
WWF
World Wide Fund for Nature
REC
Regional Environmental Center for Central and Eastern Europe
WWTP
Waste Water Treatment Plant
Mario Romulic, Croatia
12
1. Introduction
1.1. Aim of the report
This report responds to reporting obligations of the Water Framework
This report therefore has different addressees:
Directive 2000/60/EC (WFD) under Article 5, Annex II and Annex III
≠ the countries in the Danube river basin, this report being the common basis
regarding the first characterisation and analysis of the Danube River
for river basin management on the basin-wide scale,
Basin District. In addition, information is given on progress related to
≠ the European Commission, to inform on the progress of WFD implementation,
Article 6 and Annex IV for setting up an inventory of protected areas
and
in the river basin district, as well as on progress related to Article 14
≠ all interested parties as well as the general public, to inform about the
regarding public information and consultation.
results of the first analysis of the Danube River Basin District and to prepare
for the consultation process.
This report is the second report to the European Commission on the
progress of implementation of the WFD. The first report dealt with
the reporting obligations under Article 3.8 and Annex I related to the
1.2. Structure and contents of the report
delineation of the Danube River Basin District, the identification of
The Danube River Basin is the second largest river basin of Europe
the competent authorities for WFD implementation and on the
covering territories of 18 states including EU-Member States,
international coordination arrangements for international river basin
Accession Countries and other states. In addition to the Danube River
districts. The WFD Roof report 2003 (see explanations in Chapter 1.2)
Basin the Danube River Basin District (DRBD) includes some of the
was completed on 26 April 2004 and sent to the Commission on
Black Sea coastal catchments (see Chapter 2.1). Due to the large
22 June 2004.
number of states and the coordination requirements in the DRBD (see
Chapter 2.3) the report on the DRBD has been divided into two parts.
Annex II and III of the Directive stipulate the analysis of environmen-
Part A (roof report) gives the basin-wide overview; Part B (national
tal and economic characteristics including the assessment of
reports) gives all relevant further information on the national level as
significant anthropogenic pressures and impacts in surface waters
well as information coordinated on the bilateral level (see Figure 1).
and groundwater. This analysis forms the basis for the assessment
of the status of surface waters and groundwater in Europe and
The International Commission for the Protection of the Danube River
illustrates, which water bodies are "at risk" of failing the environmen-
(ICPDR) is the implementing body under the "Convention on
tal objectives. The future developments of monitoring networks and
Cooperation for the Protection and Sustainable Use of the Danube
of the programme of measures will be based on the results of this
River" (Danube River Protection Convention, DRPC) and serves as
analysis.
the platform for coordination to develop the Danube River Basin
Management Plan (DRBMP). The ICPDR has a coordinating and
Article 14 of the Directive specifies that Member States shall
supporting function, but does not report on its own.
encourage the active involvement of all interested parties in the
implementation of the Directive and in the development of river
Each EU Member State will send the Roof report (Part A) together
basin management plans.
with its own national report (Part B) to the European Commission. In
addition, the ICPDR will informally send to the European
Commission a copy of the Roof report and a copy of the national
reports (Part B) of those countries, which are (currently) not obligated
to report to the European Commission (Bosnia i Herzegovina,
Bulgaria, Croatia, Moldova, Romania, Serbia and Montenegro, and
Ukraine). This approach was also undertaken for the delivery of
information required according to Art. 3 (8) and Annex I WFD.
Introduction 13
Structure of the report for the
Part A ≠ Roof report
Danube River Basin District1
FIGURE 1
The Roof report gives the basin-wide overview on issues requiring
Part A: Roof report coordinated by the ICPDR
reporting under WFD. It provides information on the main surface
Part B: National reports
waters, which are shown in the Danube River Basin District overview
GERMANY
EU-Member State
map (Map 1) and the important transboundary groundwaters shown in
Map 15.
AUSTRIA*
EU-Member State
CZECH REPUBLIC
EU-Member State
The Roof report includes, in particular, an overview of the main
SLOVAK REPUBLIC**
EU-Member State
pressures in the DRBD and the related impacts exerted on the
HUNGARY
EU-Member State
environment. The overview includes effects on the coastal waters of
SLOVENIA
EU-Member State
the Black Sea as far as they are part of the DRBD, since their status
CROATIA
Accession Country
could be a reason for designating the whole DRBD as a sensitive area.
BOSNIA I HERZEGOVINA
Other
SERBIA AND MONTENEGRO***
Other
The analysis is based on available data resulting from past and
ongoing programmes and projects and a hierarchy of information
BULGARIA
Accession Country
used has been defined (see Chapter 1.3). The contents of the Roof
ROMANIA
Accession Country
report results from the work of the ICPDR expert groups and has
MOLDOVA
Other
been approved by the ICPDR at its Ordinary Meetings. The issues
UKRAINE
Other
referred to in the basin-wide overview will be the basis for the
including bilateral coordination:
*
with Switzerland and Italy,
preparation of the Danube River Basin Management Plan by the
**
with Poland
end of 2009.
*** with Albania and Macedonia
The Roof report intends to give an overview of the situation in the
Danube river basin district as a whole and to set the frame for the
understanding of the detailed national reports. The Roof report is
therefore comparatively brief. Detailed information is given in the
national reports.
Part B ≠ National reports
The National reports give all relevant further information on the
national level as well as information coordinated on the bilateral
level. Transboundary issues not covered by the ICPDR are solved at
the appropriate level of cooperation e.g. in the frame of bilateral/
multilateral river commissions. The national information is given in
addition to the information in Part A.
1 This figure reflects the situation at the time of reporting (March 2005).
Introduction 14
Interplay between Part A (Roof report) and Part B (National reports)
Regarding Annex III ≠ Economic analysis
The Roof report addresses those issues of Annex II, III and IV WFD
The Roof report addresses three issues:
relevant on the basin-wide scale, i.e. information concerning the
≠ assessment of the economic importance of water uses,
1. Analysis of surface waters (Annex II, 1.)
≠ projection of trends of key economic indicators and drivers up to 2015, and
2. Analysis of groundwaters (Annex II, 2.)
≠ assessment of current levels of cost recovery of water services.
3. Economic analysis (Annex III)
The assessment of current levels of cost recovery of water services
4. Inventory of protected areas (Annex IV)
and the cost-effectiveness of measures is not analysed on the basin-
wide level as these issues are primarily of national importance. This
In addition, an overview will be given on steps undertaken on
report gives some general considerations on the issue, but the actual
the basin-wide level for public information and consultation.
analysis will be contained in the National reports (Part B).
Table 1 shows which information which will be given in which
part of the report.
Regarding Annex IV ≠ Inventory of protected areas
The protected areas for drinking water abstraction, for economically
Regarding Annex II ≠ 1. Analysis of surface waters
significant aquatic species, for recreational waters and the nutrient-
The Roof report gives an overview for the following surface waters:
sensitive areas (including vulnerable zones) are generally not of trans-
≠ the Danube and its tributaries with a catchment size of > 4 000 km2,
boundary importance. These inventories have been set up nationally
≠ all lakes and lagoons with an area of > 100 km2,
and are dealt with in the national reports.
≠ the main canals,
≠ transitional and coastal waters.
Wetlands play an important role in the Danube River Basin and many
A summary of the relevant information on surface waters will be
of them are transboundary and under international protection.
given in Part A. Detailed information will be in Parts B.
Therefore, an inventory of protected areas for species and habitats has
been set up where the maintenance or improvement of the status of
Regarding Annex II ≠ 2. Analysis of groundwaters
water is important for their protection. The protected areas selected
Groundwaters are generally of local or regional importance and are
for the basin-wide overview have been defined as follows
described in detail in the national reports. The Roof report gives an
≠ an international protection status (RAMSAR and World Heritage Convention,
overview for important transboundary groundwater bodies according
UNESCO/ MAB and/or IUCN category II or Natura 2000 site), and
to the following criteria:
≠ a size of > 1,000 ha.
≠ all transboundary groundwater bodies > 4000 km2,
≠ transboundary groundwater bodies < 4000 km2, if they are very important;
The National reports address all issues listed in Annex II and III WFD.
the identification as important has to be bilaterally agreed. The agreement
must include the criteria for the importance, e.g. socio-economic importance,
groundwater use, impacts, pressures, interaction with aquatic eco-systems.
Introduction 15
Issues covered in Part A (Roof report) and Part B (National reports)
TABLE 1
Part A Roof report
Part B National reports
Article 5 and
ANNEX II ≠ 1. ANALYSIS OF SURFACE WATERS
1.1 Surface water categories
X
X
1.2 Ecoregions and surface water types
X
X
1.3 Establishment of type-specific reference conditions
X
X
1.4 Identification of pressures
X
X
1.5 Assessment of impacts
X
X
ANNEX II ≠ 2. ANALYSIS OF GROUNDWATERS
2.1 Initial characterisation
X
X
2.1 Further characterisation
X
2.3 Review of the impact of human activity
X
X
2.4 Review of the impact of changes in groundwater levels
X
2.5 Review of the impacts of pollution on groundwater quality
X
X
ANNEX III ≠ ECONOMIC ANALYSIS
(a) Analysis of water uses incl. levels of cost-recovery for water services
X
X
(b) Judgements of most cost-effective combination of measures in respect of water uses
X
Article 6 and
ANNEX IV ≠ INVENTORY OF PROTECTED AREAS
1. (i) for abstraction of water intended for human consumption
X
1. (ii) for protection of economically significant aquatic species
X
1. (iii) as recreational waters, incl. areas designated as bathing waters
X
1. (iv) nutrient-sensitive areas, incl. areas designated as vulnerable zones
X
1. (v) for protection of habitats or species where the maintenance or improvement of
the status of water is important for their protection
X
X
Article 14
PUBLIC INFORMATION AND CONSULTATION
X
X
Introduction 16
1.3. Status of the report and disclaimer
In some cases, national data, which were available only for one or few
This report is the first comprehensive characterisation and analysis
countries, have not been used if there were alternative published data
for the entire Danube River Basin, in which all 13 Danubian countries
from other sources for the entire Danube basin, e.g. generated through
cooperating under the DRPC have participated. The nature, the
modelling tools. On one hand, the advantage of such an approach is
extent and the quality of the available data and information varies
that largely comparable data, e.g. generated through modelling,
considerably in relation to the issues and the countries concerned. All
for the DRBD can be presented. However, this approach leads to a
countries of the Danube basin have committed themselves to develop
number of consequences, which have to be born in mind when
jointly a Danube River Basin Management Plan by the end of 2009,
interpreting the findings of this report:
and, as a first step, provide the required information for this report.
1. Official national data have not been used and may, in some cases, differ
Some of the experiences while compiling the report are listed below
from the Danubewide data set. If the modelled data had been replaced by the
and should be born in mind when reading and interpreting the report.
national data only for some countries, the level of comparability would have
decreased. Hence, more emphasis was given on the relative quantitative
The key objective was to compile comparable data and information
levels rather than the correct absolute values.
throughout the basin and to generate the level of detail or aggregation
2. In particular, results used in this report stemming from models (e.g.
required for the assessment of transboundary and basinwide issues.
MONERIS) are focussed on a Danube-wide scale and in a generic way, these
Thus, for surface water, data collection focused mainly on the Danube
results have not been used to derive conclusions for particular countries or
River and, in most cases, on the main rivers and lakes as identified in
regions. The assumptions of the model and the input data are not fully repro-
the DRBD overview map. For groundwater, the focus was on the
duced in this report but are published in secondary literature. Some countries
important transboundary groundwater bodies. A more detailed level
may not agree with the estimations of such models, in particular when a
of the analysis will be presented in the national reports. Hence, this
more detailed analysis has been carried out on the national level. However, it
report should only be read and interpreted in conjunction with the
was appropriate to draw conclusions from the modelling results for a
national reports. Where inconsistencies may have occurred, the na-
comparison on the basin-wide scale.
tional report may provide the latest up to date information since they
3. Natural conditions may vary, and thereby significantly influence the results of
have been finalised several months after this report. In other words,
the modelling, e.g. data used in MONERIS for the upper part of the Danube
some of the data presented in this report were presented as a first
basin was based on a wet period, which included a major flood event. This
approximation or at a different level of aggregation but the finally
has led to the overestimation of nutrient loads for this area.
agreed result on the national level was only becoming available after
the final date of data delivery for this report as mentioned below.
In summary, the results of modelling and other publicly available data
and information have only been used if they provided added value to
The report is mainly based on available data. Wherever possible, the
the report and only generic conclusions have been drawn on the basis
following hierarchy of information has been used:
of those data. In most cases, it was an indication that official and
1. data that has previously been collected in the context of the ICPDR, e.g.
comparable data for the Danube basin do not yet exist.
results of the TransNational Monitoring Network
(1996-2000), the ICPDR Emission Inventory (status 2002) or the results
For some issues it was possible to get expert input through support of
of the Joint Danube Survey2 conducted in 2001;
the UNDP/GEF Danube Regional Project3. The contribution of the
2. data and information officially delivered by the competent authorities of the
Danube Regional Project consisted of
DRB countries (collected by the ICPDR in templates or questionnaires) during
≠ conducted studies for the characterisation of surface waters and
the preparation of the report (data mostly from 2004) based on agreed
groundwater (development of a typology of the Danube River, study on hydro-
criteria;
morphological alterations in the DRB); Agricultural policy study as a
3. other published data and information.
contribution to the pressure and impact analysis; Contributions to the
economic analysis; and the development of a Public Participation Strategy;
The reference of the data sources has been included, in particular
≠ specialised workshops for capacity building and for coordination/harmonisa-
for material used from the third category. Whenever a reference is
tion of WFD implementation amongst DRB countries;
missing, it can be assumed that the data fall under the second
≠ data collection via templates and questionnaires, drafting of specific
category. The maps generated for this report are either produced by
chapters of this report, and preparation of DRBD maps for WFD topics
the ICPDR on the basis of data sources categories 1 or 2, or maps
through consultants input.
from other sources have been used and clear reference is provided.
2 ICPDR (2002).
3 United Nations Development Programme / Global Environment Facility Project: "Strengthening the Implementation Capacities for Nutrient Reduction
and Transboundary Cooperation in the Danube River Basin".
Introduction 17
As regards reporting obligations under the Water Framework
Moldova is attempting to meet the requirements of the WFD and has
Directive for EU Member States, this report together with the national
progressed jointly with Romania, with whom Moldova shares a
report will comprise the package of information sent to the European
border, in undertaking the necessary work to prepare the necessary
Commission in order to enable an assessment of the compliance and
information collection and assessment for reporting under WFD.
conformity with the Directive. Given the situation of data availability
Ukraine is at the beginning of preparing the necessary internal
described below, this report on its own may not be sufficient to
structures and management arrangements for WFD implementation
completely fulfil the requirements of the Directive, in particular when
and has discussed with the ICPDR and the UNDP Danube Regional
pragmatic approaches or generalisations had to be applied on the
Project potential assistance in capacity building related to this issue.
basin-wide level in order to come up with a first screening analysis
No timetable for completing tasks or meeting requirements has yet
within the very short available time frame.
been developed.
Moreover, the harmonisation of approaches and methodologies
All of the countries have, however, progressed with the work
throughout the basin is only at the beginning. In some areas, harmoni-
necessary and have attempted to organize their internal structures to
sation and comparability of data is already advanced (e.g. the TNMN)
meet the requirements of the Water Framework Directive.
or harmonised work was carried out for the purpose of this report
(e.g. the typology for the Danube river). In other areas, it was
This report is based on data delivered by the Danube countries by
necessary to rely completely on national approaches and thereby
8 November 2004. Data that has been compiled after this date will
presenting data based on a diversity of approaches. Whenever
only be contained in the national reports. Where data was not
harmonised criteria are being used in the report, the thresholds should
delivered by the countries other data sources were used where they
be interpreted as significant in the transboundary and basin-wide con-
were available. Other sources than the competent authorities of the
text of the Danube river basin. Given the immense size of the DRBD,
Danube River Basin have been clearly identified in the report.
it seems evident that criteria determining significance in the sense of
the Water Framework Directive are likely to be much more stringent.
As regards countries with a share of less than 2000 km2 in the DRBD,
Thereby the report only identifies the "major" problems, more stringent
Austria, Slovakia, and Serbia and Montenegro have endeavoured to
criteria in line with the Directive and protecting much smaller water
establish appropriate coordination with these neighbours. Italy and
bodies (e.g. lakes smaller than 100 km2 or groundwater bodies
Switzerland have submitted geographical data for this report. Poland
smaller than 4000 km2) must be used in the national reports. The data
delivered data to the Slovak Republic, through the Transboundary
concerning transboundary watercourses was bilaterally harmonised.
Commission established in the frame of bilateral agreement between
the Slovak Republic and Poland. Albania and Macedonia communicated
In view of the above, the delivery of data from EU Member States4
the competent authorities for water management issues.
and Candidate Countries5 in the Danube River Basin District6 was
satisfactory, even though there is still considerable divergence in the
In conclusion, this first assessment reflects the current level of prepa-
level of detail and availability of data from upstream to downstream.
ration for a harmonised, integrated river basin management. The
As regards the other Danubian countries, the situation during the
extent, the quality and the degree of harmonisation of the data will
preparation of the report was as follows:
improve with future reviews and updates of the characterisation and
Serbia and Montenegro ≠ after becoming a full Contracting Party to the
analysis making later assessments more comprehensive and robust.
Danube River Protection Convention in August 2003 ≠ has developed
Notwithstanding, this first analysis is an outstanding milestone and
a detailed timetable to complete the necessary work for the 2004
provides a sound basis for the next stages of the implementation of
report by the end of 2004.
the Water Framework Directive, in particular the development of the
Bosnia i Herzegovina is in the process of internal reorganization of the
monitoring programmes and the river basin management planning
water management sector to meet requirements of the Water Frame-
process. To this end, the identified gaps and deficiencies will guide
work Directive and has begun work to prepare the needed information.
the followup activities after finalisation of this report, in line with the
Croatia has also reoriented its water management in line with the
principles identified by the EU Common Implementation Strategy for
WFD, has undertaken most tasks needed and provided the majority
the Water Framework Directive.
of the information required for this report.
4 Austria, Czech Republic, Germany, Hungary, Slovakia, Slovenia.
5 Bulgaria, Romania (note: Croatia has become a new EU Candidate Country in June 2004 when the most part of the preparatory work was finalised).
6 Only referring to those 13 Danubian countries, which have a share of the Danube River Basin District larger than 2000 km2.
18
2. The Danube River Basin District and its
international coordination arrangements
Most of the information given in this chapter is taken from the Danube Roof Report 2003 (Art. 3.8 and Annex I), but is provided here to help readers use this
report as an alone-standing document.
2.1. Delineation of the Danube River Basin District
The International Commission for the Protection of the Danube River
The Danube River Basin is the second largest river basin of Europe7
(ICPDR) is the implementing body under the "Convention on
covering 801,463 km2 and territories of 18 states including EU-Mem-
Cooperation for the Protection and Sustainable Use of the Danube
ber States, Accession Countries and other states that have not applied
River" (Danube River Protection Convention, DRPC) and serves as
for EU Membership. According to Article 3.3 of the WFD "Member
the platform for coordination to develop and establish the Danube
States shall ensure that a river basin covering the territory of more
River Basin Management Plan (DRBMP).
than one Member State is assigned to an international river basin
district". Where a river basin district extends beyond the territory of
The Danube River Basin District has been defined in the frame of the
the Community, the WFD requests the Member State or Member
work of the ICPDR. It covers 1) the Danube River Basin, 2) the Black
States concerned to "endeavour to establish appropriate coordination
Sea coastal catchments on Romanian territory, and 3) the Black Sea
with the relevant non-Member States, with the aim of achieving the
coastal waters along the Romanian and partly the Ukrainian coast.
objectives of this Directive throughout the river basin district."
(Art. 3.5 WFD). The main objective of WFD implementation is the
development of a Danube River Basin Management Plan.
Area of the Danube River Basin District
TABLE 2
Territory
Official area [km2]
Digitally determined area [km2]*
Danube River Basin (DRB)
18 countries (see Table 3)
801,463
Black Sea coastal river basins
Romania
5,198
5,122
Black Sea coastal waters
Romania and Ukraine
1,242
Danube River Basin District (DRBD)
807,827
* For the purpose of comparison the areas were calculated using GIS on the basis of the DRBD overview map. The value for
the Black Sea coastal river basins differs slightly from the official data, since other methods of calculation have been used.
7 The area of the DRB was determined digitally with GIS. If other sources are consulted this value may vary slightly,
because other methods of calculation have been used.
The Danube River Basin District and its international coordination arrangements 19
Map 1 shows the geographical coverage of the Danube River Basin
The coastal waters of the DRBD extend along the full length of the
District as well as the competent authorities. The outer boundary
Romanian coastline and along part of the Ukrainian coast up to the
of the Danube River Basin District was defined taking into considera-
hydrological boundaries of the Danube River Basin. The Romanian
tion the hydrological boundaries of the surface waters and ground-
coastal waters were included in the DRBD, because the water quality
water. In a few small places the district boundaries of groundwater
and the morphology of the seashore are substantially influenced by
and surface waters are not aligned (Germany, Slovenia, Serbia and
the Danube River. The Romanian coastal waters are delineated at
Montenegro, Bosnia i Herzegovina, and Bulgaria). Details can be
1 nautical mile from the baseline, which is defined along 9 points
found in the respective national reports.
within the territorial sea of Romania as laid down in the Romanian
Law No. 17/1990, modified by Romanian Law No. 36/2002. A
In addition to the Danube River Basin, the small coastal basins of the
detailed description of the coastal waters is contained in the
Black Sea tributaries lying on Romanian territory between the eastern
Romanian national report (Part B). The Ukrainian coastal waters are
boundary of the DRB and the coastal waters of the Black Sea have
not defined by Ukrainian law. For WFD implementation the coastal
been included in the Danube River Basin District. Here also lies the
waters are defined in line with Art. 2.7 WFD at 1 nautical mile from
Danube-Black Sea Canal (Canal Dunarea-Marea Neagra), which
the baseline.
diverts part of the water of the Danube River directly to the Black
Sea. These coastal catchments were included in the DRBD, because
The coastal waters of Bulgaria are not included in the DRBD, since
they influence the coastal waters along the Romanian coastline.
their characteristics are substantially influenced by rivers on
Bulgarian territory flowing into the Black Sea and by processes in the
Black Sea itself. Bulgarian coastal waters are assigned to the
Bulgarian Black Sea River Basin.
Danube River Basin District - Overview
MAP 1
The Danube River Basin District and its international coordination arrangements 20
2.2. States in the Danube River Basin District
States in the Danube River Basin District
TABLE 3
18 states have territories in the Danube River Basin District. Besides
State
ISO-Code
Status in the European Union*
Austria, Germany, and Italy, five additional Danube countries have
Albania
AL
-
become EU Member States on May 1, 2004. At the time of reporting,
Austria
AT
Member State
three other Danube countries are in the process of accession and are
Bosnia i Herzegovina
BA
-
preparing to fulfil the complete body of EU legislation in order to
Bulgaria
BG
Accession Country
become EU Members. Seven states have not initiated a formal
Croatia
HR
Accession Country
process to join the EU (see Table 3).
Czech Republic
CZ
Member State
Germany
DE
Member State
For the EU Accession countries the WFD is part of the `acquis
Hungary
HU
Member State
communautaire'. By the time the deadline for the completion of the
Italy
IT
Member State
River Basin Management Plan is reached in December 2009
Macedonia
MK
-
probably two more Danube countries, Bulgaria and Romania, will
Moldova
MD
-
have become EU Members. Croatia has officially become an
Poland
PL
Member State
Accession Country in April 2004 and will begin its accession
Romania
RO
Accession Country
negotiations in 2005. Although these countries have no reporting
Serbia and Montenegro
CS
-
obligations until they become EU-Member States, they are
Slovak Republic
SK
Member State
cooperating in the frame of the ICPDR to implement the necessary
Slovenia
SI
Member State
steps just as the other Non-EU States.
Switzerland
CH
-
Ukraine
UA
-
* The table reflects the situation at the time of reporting (March 2005).
The Danube River Basin District and its international coordination arrangements 21
Table 4 shows the coverage of the states in the DRB and the estimated
The Danube River Basin has a rich history with a strong cultural
population in the basin. The territory of Hungary is 100 % within
heritage. This is also reflected in the large number of ethnic groups
the basin. Romania, the Slovak Republic and Austria lie almost
in the basin and the large number of languages still spoken (at least
completely within the DRB (96 ≠ 97 % of state). Countries sharing
17 official languages in the DRB). The official languages of the
< 2000 km2 are (in descending order by size) Switzerland, Italy,
ICPDR are English and German; English is the language used.
Poland, Albania and Macedonia. Romania contributes by far the
largest population in the DRB (more than 26 %), followed by
Hungary, Germany, and Serbia and Montenegro with nearly equal
percentages of the total population in the DRB (11 ≠ 12 %).
Coverage of the states in the Danube River Basin (DRB) and estimated population
(data source: Competent authorities in the DRB unless marked otherwise)
TABLE 4
Official
Digitally
Percent of
coverage in DRB
determined coverage in
Percentage of DRB
Percentage of DRB
Population in DRB
population in DRB
State
Code
[km2]
DRB [km2]*
[%]
in state [%]
[Mio.]
[%]
Albania
AL
126
< 0.1
0.01
< 0.01
< 0.01
Austria
AT
80,423
10.0
96.1
7.7
9.51
Bosnia i Herzegovina
BA
36,636
4.6
74.9
2.9
3.58
Bulgaria
BG
47,413
5.9
43.0
3.5
4.32
Croatia
HR
34,965
4.4
62.5
3.1
3.83
Czech Republic
CZ
21,688
2.9
27.5
2.8
3.46
Germany
DE
56,184
7.0
16.8
9.4
11.60
Hungary
HU
93,030
11.6
100.0
10.1
12.47
Italy **
IT
565
< 0.1
0.2
0.02
0.02
Macedonia
MK
109
< 0.1
0.2
< 0.01
< 0.01
Moldova
MD
12,834
1.6
35.6
1.1
1.36
Poland
PL
430
< 0.1
0.1
0.04
0.05
Romania
RO
232,193
29.0
97.4
21.7
26.79
Serbia and Montenegro***
CS
88,635
11.1
90.0
9.0
11.11
Slovak Republic
SK
47,084
5.9
96.0
5.2
6.42
Slovenia
SI
16,422
2.0
81.0
1.7
2.10
Switzerland
CH
1,809
0.2
4.3
0.02
0.02
Ukraine
UA
30,520
3.8
5.4
2.7
3.33
Total
(801,463)
100
81.00
100
*
For the purpose of comparison the coverage of the states was calculated using GIS based on the DRBD overview map.
These values differ slightly from the official data of some countries, since other methods of calculation have been used.
**
Data source: Autonomous Province of Bozen ≠ South Tyrol.
*** According to the 2002 census the population in Serbia and Montenegro without the provinces of Kosovo and Metohia is 7.668.000 inhabitants.
On the territory of Kosovo and Metohia the last census was in 1981. On the basis of this census and OEBS data the estimated population of Kosovo
and Metohia in the Danube river basin today is about 1.300.000 inhabitants.
The Danube River Basin District and its international coordination arrangements 22
2.3. International coordination of WFD implementation
2.3.1. Coordination at the basin-wide level
and its environment. Austria, Bosnia i Herzegovina, Bulgaria, Croatia,
The Danube River Protection Convention forms the overall legal
the Czech Republic, Germany, Hungary, Moldova, Romania, the
instrument for cooperation and transboundary water management in
Slovak Republic, Slovenia, Serbia and Montenegro, Ukraine and the
the Danube River Basin. The main objective of the convention is the
European Community are Contracting Parties to the DRPC.
sustainable and equitable use of surface waters and groundwater and
includes the conservation and restoration of ecosystems. The
To facilitate the implementation of the DRPC, the Danubian countries
Contracting Parties cooperate on fundamental water management
agreed that with its entry into force the ICPDR is established. The
issues and take all appropriate legal, administrative and technical
ICPDR is therefore the framework for basin-wide cooperation (see
measures, to maintain and improve the quality of the Danube River
Figure 2).
Organisational Structure under the Danube River Protection Convention
FIGURE 2
CONFERENCE OF THE PARTIES
International Commission for the Protection of the Danube River (ICPDR)
≠ Implementation of Danube River Protection Convention (DRPC)
≠ Decision making, management and coordination of regional cooperation
≠ Approval of the budget and annual work programme
≠ Follow up of activities and evaluation of results from Expert Groups
≠ Joint Action Programme
UNDP/GEF Danube Regional Project
≠ Creation of sustainable ecological conditions for land use and water mgmt
≠ Capacity building and reinforcement of trans-boundary cooperation
≠ Strengthening public involvement in environmental decision making
Permanent Secretariat (PS)
≠ Reinforcement of monitoring, evaluation and Information System
≠ Supporting the ICPDR sessions
≠ Supporting the Expert Groups
≠ Coordinating the work programme
≠ Supporting project development and implementation
≠ Maintenance of the Information System
Legal and Strategic
River Basin
Ecology (ECO EG)
Emissions (EMIS EG)
Monitoring, Laboratory
Accident Prevention
Flood Protection
issues (ad-hoc S EG )
Management (RBM EG)
≠ Habitats and species
≠ Emissions from
and Information Mgmt
and Control (APC EG)
(FP EG)
≠ Strategic issues
≠ Integrated river
protection areas
point sources
(MLIM EG)
≠ Accident pollution
≠ Preparation and
≠ Legal issues
basin management
≠ Management of
≠ Emissions from
≠ Trans-National
incidents
implementation of
≠ Administrative and
≠ Implementation
wetlands and
diffuse sources
Monitoring Network
≠ AEWS operation
Action Plan for
financial issues
of the EU Water
floodplains
≠ Guidelines on BAT
≠ Laboratory Quality
≠ Accident prevention
Sustainable Flood
Framework Directive
Assurance
Protection
Cartography and GIS
Danube ≠ Black Sea
(RBM/GIS ESG)
Joint Technical WG
Economic Analysis
(RBM/ECON ESG)
The Danube River Basin District and its international coordination arrangements 23
At its 3rd Ordinary Meeting on November 27-28, 2000 in Sofia the
Coordination mechanisms for WFD implementation
ICPDR made the following resolutions:
in the Danube River Basin (for bilateral agreements only
≠ The ICPDR will provide the platform for the coordination necessary to
some examples are shown; a full list is contained in Table 5)
FIGURE 3
develop and establish the River Basin Management Plan for the Danube
River Basin.
≠ The Contracting Parties ensure to make all efforts to arrive at a coordinated
international River Basin Management Plan for the Danube River Basin in
line with the requirements of the WFD.
In the ICPDR all Contracting Parties support the implementation of
the WFD in their territories and cooperate in the framework of the
ICPDR to achieve a single, basin-wide coordinated Danube River
Basin Management Plan. The ICPDR President has addressed
the other DRB countries not cooperating under the DRPC to commit
themselves to cooperate with the ICPDR to achieve a basinwide
coordinated DRBMP. Poland, Switzerland, Macedonia and Albania
have offered their support. From Italy no response was received.
On the operational level, it is the obligation of the Contracting Parties
to ensure the necessary coordination with their DRB neighbours not
cooperating under the DRPC.
The River Basin Management Expert Group was created to prepare
and coordinate the necessary activities for the implementation of the
WFD. All countries cooperating under the DRPC are represented in
the River Basin Management Expert Group. The group jointly agrees
on the necessary actions for the development of the Danube River
Basin Management Plan, e.g. the development of a strategy for estab-
lishing the RBM Plan, development of the roof report to the European
Commission or identifying needs for harmonisation of methods and
mechanisms (see Figure 3).
The Danube countries cooperating under the DRPC report regularly
to the ICPDR on the progress of WFD implementation in their
own states. These national reports serve as a means for exchanging
information between the states and for streamlining the implementation
activities on the national level. At each of its Ordinary Meetings
and Standing Working Group Meetings8 the ICPDR deals with the
step-wise implementation of the WFD in the Danube River Basin and
takes the necessary decisions.
8 See the Convention on Cooperation for the Protection and Sustainable use of the Danube River (Danube River Protection Convention).
The Danube River Basin District and its international coordination arrangements 24
2.3.2. Bilateral and multilateral cooperation
agreements were not "established in order to ensure coordination" as
The ICPDR serves as the platform for coordination in the
stated in WFD Annex I, 6. These are generally older treaties that deal
implementation of the WFD in the Danube River Basin District on
with specific issues of transboundary cooperation, which in many
issues of basin-wide importance. Transboundary issues not covered
cases includes water management issues. Some of these agreements
by the ICPDR are solved at the appropriate level of cooperation e.g.
have been adapted to cover issues related to WFD implementation,
in the frame of bilateral/multilateral river commissions. Local issues
but generally they are only used as the platform for coordination
remain a national task. Generally, coordination will take place at the
needed to fulfil the requirements of the WFD.
lowest level possible so that the coordination via the ICPDR can be
limited to those issues necessary on the basin-wide level.
Table 5 gives an overview of the existing agreements that are being
used for WFD implementation. There are cases where no formally
Bilateral agreements are in place between almost all states in the
approved bilateral agreements and commissions implementing them
Danube River Basin District, but it is important to note that these
exist, but regular meetings serve to facilitate cooperation.
Overview of bilateral agreements and bilateral cooperations for WFD implementation in the Danube River Basin District
TABLE 5
AL
AT
BA
BG
CH
CS
CZ
DE
HR
HU
IT
MD
MK
PL
RO
SI
SK
UA
AL
X
AT
(X)
X
X
X
(X)
X
X
BA X
BG X
X
X
CH (X)
CS
X
X
X
X
CZ
X
X
X
X
DE X
X
HR
X
X
X
HU X
X
X
X
X
X
X
IT (X)
MD
X
X
MK
X
PL X
X
X
RO
X
X
X
X
X
SI
X
X
X
SK
X
X
X
X
X
UA
X
X
X
X
X
X = formal agreement between neighbouring states, (X) = bilateral cooperation without formal agreement
The Danube River Basin District and its international coordination arrangements 25
2.3.3. Competent authorities
serves as the platform for coordination for the implementation of the
The competent authorities for WFD implementation are designated
WFD in the Danube River Basin District on issues of basin-wide
by the states. The link between these on the basin-wide level is
importance. The competent authorities are listed in Table 6 and also
ensured through the ICPDR and its Contracting Parties. The ICPDR
shown in Map 1.
List of competent authorities in the Danube River Basin District
TABLE 6
Albania
Czech Republic
Moldova
Slovak Republic
Ministry of Environment
Ministry of Environment
Ministry of Ecology,
Ministry of the Environment
Rruga e Durresit 27
Vrsovick· 65
Construction and Territorial
N·mestie L' St˙ra 1
AL-Tirana
CZ-10010 Praha 10
Development
SK-81235 Bratislava
and
9 Cosmonautilor St.
Austria
Ministry of Agriculture
MD-2005 Chisinau
Slovenia
Federal Ministry for Agriculture,
Tesnov 17
Ministry of the Environment,
Forestry, Environment
CZ-117 05 Praha 1
Poland
Spatial Planning and Energy
and Water Management
Ministry of Environment
Dunajska 48
Stubenring 1
Germany
Ul. Wawelska 52/54
SI-1000 Ljubljana
A-1012 Wien
Bavarian State Ministry for Envi-
PL-00922 Warszawa
ronment, Public Health
and
Switzerland
Bosnia i Herzegovina
and Consumer Protection
Regional Water
Bundesamt f¸r Wasser und
Ministry of Foreign Trade
Rosenkavalierplatz 2
Management Authority
Geologie (BWG)
and Economic Relations
D-81925 M¸nchen
Ul. C.K. Norwida 34
Abt. Wasserwirtschaft
Musala 9
and
PL-50950 Wroclaw
CH-3003 Bern
BiH-71000 Sarajevo
Ministry for Environment and
and
and
and
Transport Baden-W¸rttemberg
Regional Water
Bundesamt f¸r Umwelt, Wald
Federal Ministry of Agriculture,
Kernerplatz 9
Management Authority
und Landschaft
Water Management and Forestry
D-70182 Stuttgart
Ul. J. Pilsudskiego 22
Abt. Gew‰sserschutz und
Marsala Tita 15
PL-31109 KrakÛw
Fischerei
BiH-71000 Sarajevo
Hungary
CH-3003 Bern
and
Ministry of
Romania
Ministry of Agriculture,
Environment and Water
Ministry of Environment
Ukraine
Forestry and Water Management
FOE utca 44-50
and Water Management
Ministry for Environmental
of Republika Srpska
H-1011 Budapest
12 Libertatii Blvd., Sector 5
Protection of Ukraine
Milosa Obilica 51
RO-04129 Bucharest
35, Uritskogo str.
BiH-76300 Bijeljina
Italy
and
UA-03035 Kyiv
No information
National Administration
Bulgaria
"Apele Romane"
Ministry of
Macedonia
6 Edgar Quinet St., Sector 1
Environment and Water
Ministry of Agriculture,
RO-010018 Bucharest
22 Maria-Luisa Blvd.
Forestry and Water supply
BG-1000 Sofia
Department for Water
Serbia and Montenegro
Management and Water Supply
Ministry of Agriculture,
Croatia
Ul. Leninova 2
Forestry and Water Resources
Ministry of Agriculture,
MK-1000 Skopje
Management of the Republic
Forestry and Water Management
and
of Serbia
Ulica grada Vukovara 220
Ministry of Agriculture,
Nemanjina 22-26
HR-10000 Zagreb
Forestry and Water supply
CS-11000 Beograd
Ul. Skupi bb
MK-1000 Skopje
26
3. General characterisation of the
Danube River Basin District
This chapter gives a general overview of the Danube River Basin District and serves as background information for the detailed analysis according to Art. 5
and Annex II and III WFD, which is described in Chapter 3, 4, 5, 6 and 7.
3.1. Geographic characterisation
3.2. Climate and hydrology
The Danube River Basin9 is the second largest river basin in Europe
Due to its large extension from west to east, and diverse relief, the
after the Volga covering 801,463 km2. It lies to the west of the Black
Danube River Basin also shows great differences in climate. The
Sea in Central and South-eastern Europe (see Figure 4). To the west and
upper regions in the west show strong influence from the Atlantic
northwest the Danube River Basin borders on the Rhine River Basin,
climate with high precipitation, whereas the eastern regions are
in the north on the Weser, Elbe, Odra and Vistula River Basins, in the
affected by Continental climate with lower precipitation and typical
north-east on the Dnjestr, and in the south on the catchments of the
cold winters. In the area of the Drava and Sava, influences from the
rivers flowing into the Adriatic Sea and the Aegean See (see Map 2).
Mediterranean climate, can also be detected11. The heterogeneity of
the relief, especially the differences in the extent of exposure to the
Due to its geologic and geographic conditions the Danube River
predominantly westerly winds, as well as the differences in altitude
Basin can be divided into 3 main parts.10
diversify this general climate pattern. This leads to distinct landscape
≠ The Upper Danube Basin reaches from the sources in the Black Forest
regions showing differences in climatic conditions and in the biota,
Mountains to the Gate of DevÌn, to the east of Vienna, where the foothills of
e.g. the vegetation. The precipitation ranges from < 500 mm to
the Alps, the Small Carpathians and the Leitha Mountains meet. The area
> 2000 mm based on differences in the regions (Map 3). This in turn
covers in the north the Swabian and Frankonian Alb, parts of the Oberpf‰lzer,
has strong effects on the surface run-off and the discharge in the
the Bavarian and the Bohemian Forests, the Austrian M¸hl- and Waldviertel,
streams.
and the Bohemian-Moravian Uplands. South of the Danube lie the Swabian-
Bavarian-Austrian Alpine Foothills as well as large parts of the Alps up to the
water divide in the crystalline Central Alps.
≠ The Middle Danube Basin covers a large area reaching from the Gate of
DevÌn to the impressive gorge of the Danube at the Iron Gate, which divides
the Southern Carpathian Mountains in the north and the Balkan Mountains
in the south. The Middle Danube Basin is confined by the Carpathians in the
north and the east, and Karnic Alps and the Karawankas, the Julian Alps and
the Dinaric Mountains in the west and south. This circle of mountains
embraces the Pannonian Plains and the Transsylvanian Uplands.
≠ The Lower Danube Basin covers the Romanian-Bulgarian Danube sub-basin
downstream of Cazane Gorge and the sub-basins of the Siret and Prut River.
It is confined by the Carpathians in the north, by the Bessarabian Upland
Plateau in the east, and by the Dobrogea and Balkan Mountains in the south.
Due to this richness in landscape the Danube River Basin shows a
tremendous diversity of habitats through which rivers and stream flow
including glaciated high-gradient mountains, forested midland moun-
tains and hills, upland plateaus and through plains and wet lowlands
near sea level.
9
The area of the DRB was determined digitally with GIS. If other sources are consulted this value may vary slightly,
because other methods of calculation have been used.
10 STANCIK et al. (1988).
General characterisation of the Danube River Basin District 27
Location of the Danube River Basin in Europe
FIGURE 4
Danube River Basin District - Relief and Topography
MAP 2
Danube River Basin District - Annual Precipitation
MAP 3
General characterisation of the Danube River Basin District 28
Longitudinal profile of the Danube River and contribution of water from each country (in %)
to the cumulative discharge of the Danube (in Mio m3/year), based on data for 1994-1997 using the Danube Water Quality Model11
FIGURE 5
Altitude
Discharge
Discharge
in m a.s.l.
in m3/s
per country:
Upper Danube
Middle Danube
Lower Danube
700
7000
m3/s
%
279
4,3
Ukraine
49
0,7
Moldova
600
6000
1151
17,6
Romania
500
5000
243
3,7
Bulgaria
574
8,8
Bosnia i Herzegovina
400
4000
741
11,3
Serbia and Montenegro
421
6,4
Croatia
202
3,1
300
3000
Slovenia
283
4,3
Hungary
125
1,9
Slovak Republic
81
1,2
Czech Republic
200
2000
1448
22,1
Austria
100
1000
952
14,5
Germany
0
0
Elevation
2800
2600
2400
2200
2000
1800
1600
1400
1200
1000
800
600
400
200
0
6551
100,0
Distance from the
Inn
Drava
Iron Gates
Delta
Black Sea in km
735 m3/s
577 m3/s
5520 m 3/s
6550 m3/s
Tisza
Sava
794 m3/s
1564 m 3/s
The hydrologic regime of the Danube River, in particular the
3.3. The Danube River and its main tributaries
discharge regime, is distinctly influenced by the regional precipitation
The Danube rises in the Black Forest (Schwarzwald) in Germany at a
patterns. This is well illustrated in Figure 5, which shows the surface
height of about 1,000 m a.s.l. and receives its name at the confluence
water contribution from each country to the cumulative discharge of
of Brigach and Breg in Donaueschingen. Interestingly, the Danube
the Danube. Austria shows by far the largest contribution (22.1 %)
loses about half its discharge to the Rhine basin through underground
followed by Romania (17.6 %). This reflects the high precipitation in
passages in its upper course near Immendingen (reduction from 12 to
the Alps and in the Carpathian mountains. In the upper part of the
6 m3/s). The Danube flows predominantly to the south-east and
Danube the Inn contributes the main water volume adding more water
reaches the Black Sea after 2,780 km where it divides into 3 main
to the Danube than it has itself at the point of confluence of the two.
branches, the Chilia, the Sulina, and the Sf. Gheorghe Branch. At its
In the middle reach it is the Drava, Tisza and Sava, which together
mouth the Danube has an average discharge of about 6,500 m3/s. The
contribute almost half of the total discharge that finally reaches the
Danube Delta lies in Romania and partly in Ukraine and is a unique
Black Sea.
"World Nature Heritage". The entire protected area covers 675,000 ha
including floodplains, and more than 600 natural lakes larger than
one hectare, and marine areas. The Danube is the largest tributary into
the Black Sea.
Some of the largest tributaries of the Danube are characterised below.
Their key hydrologic characteristics are listed in Table 7 (catchment
areas have been calculated digitally for the purpose of comparison):
11 Developed during the Danube River Pollution Reduction Programme in 1999, UNDP/GEF (1999b).
General characterisation of the Danube River Basin District 29
The Danube and its main tributaries (1st order tributaries with catchments > 4,000 km2) in the order of their confluence with the Danube
from the source to the mouth (data source: Competent authorities in the DRB unless marked otherwise)
TABLE 7
Mouth at
Length
Size of
Average
Time series
Danube
[km]
catchment
discharge
for discharge
River
[rkm]
[km2]*
[m3/s]
values
Danube
0
2,780
801,463
6,460
(1914-2003)
Lech
2,497
254
4,125
115
(1982-2000)
Naab
2,385
191
5,530
49
(1921-1998)
Isar
2,282
283
8,964
174
(1926-1998)
Inn
2,225
515
26,130
735
(1921-1998)
Traun
2,125
153
4,257
150
(1961-1999)
Enns
2,112
254
6,185
200
(1961-1999)
Morava/March
1,880
329
26,658
119
(1961-1999)
Raab/R·ba
≠ **
311
10,113
88
(1901-2000)
Vah
1,766
398
18,296
161
(1931-1980)
Hron
1,716
278
5,463
55
(1931-1980)
Ipel/Ipoly
1,708
197
5,108
22
(1931-1980)
SiÛ***
1,498
121
9,216
39
(1931-1970)
Drau/Drava
1,382
893
41,238
577
(1946-1991)
Tysa/Tisza/Tisa
1,214
966
157,186
794
(1946-1991)
Sava
1,170
861
95,719
1,564
(1946-1991)
Tamis/Timis
1,154
359
10,147
47
(1946-1991)
Morava (CS)
1,103
430
37,444
232
(1946-1991)
Timok
846
180
4,630
31
(1946-1991)
Jiu
694
339
10,080
86
(1921-2003)
Iskar
636
368
8,684
54
(1936-1998)
Olt
604
615
24,050
174
(1921-1995)
Yantra
537
285
7,879
47
(1936-1998)
Arges
432
350
12,550
71
(1914-2003)
Ialomita
244
417
10,350
45
(1915-2003)
Siret
155
559
47,610
240
(1921-2003)
Prut
132
950
27,540
110
(1928-2003)
*
For the purpose of comparison the size of the catchments was calculated using GIS on the basis of the DRBD overview map.
These values may differ slightly from the official data, because other methods of calculation have been used.
**
The Raab/R·ba flows into the Mosoni Duna, an arm of the Danube, at rkm 14.
*** SiÛ River is the outflowing river of Lake Balaton, which has in itself a catchment area of 5,737 km2.
The total catchment area of Lake Balaton and SiÛ River is 14,953 km2.
The Tysa/Tisza/Tisa River basin is the largest sub-basin in the Danube
The Sava River is the largest Danube tributary by discharge (average
River Basin (157,186 km2). It is also the longest tributary (966 km) of
1,564 m3/s) and the second largest by catchment area (95,419 km2). It
the Danube. By flow volume it is second largest after the Sava River.
rises in the western Slovenian mountains and passes through Croatian
The Tysa/Tisza/Tisa River basin can be divided into three main parts:
lowland before forming the border between Croatia and Bosnia i
≠ the mountainous Upper Tysa in Ukraine (upstream of the Ukrainian-
Herzegovina. Continuing through Serbia and Montenegro it reaches
Hungarian border),
its confluence with the Danube in Belgrade. Its main sub-tributaries
≠ the Middle Tisza in Hungary (receiving the largest tributaries: Bodrog River
are Krka, Kolpa/Kupa, Una, Vrbas, Bosna, Drina and Kolubara.
and Slan·/SajÛ River collecting water from the Carpathian Mountains in
Slovak Republic and Ukraine as well as the Somes/Szamos River, the
The Inn is the third largest by discharge and the seventh longest
Crisul/Kˆrˆs River System and Mures/Maros River draining Transylvania in
Danube tributary. At its mouth in Passau, it brings more water into
Romania), and
the Danube than the latter itself. However, its catchment area of
≠ the Lower Tisa (downstream of the Hungarian border with Serbia and
26,130 km2 is only nearly half as big as the Danube at this point.
Montenegro, where it receives the Bega/Begej and other tributaries indirectly
The main tributary of the Inn is the Salzach River.
through the Danube ≠ Tisza ≠ Danube Canal System).
General characterisation of the Danube River Basin District 30
The Morava/March River is a left hand tributary of the Danube. Its
3.4. Important lakes in the Danube River Basin District
catchment area of 26,658 km2 covers parts of the Czech Republic,
In the Danube River Basin there are a multitude of natural lakes.
Slovak Republic and Austria. In terms of geological structure, this
Most of them are small, but some are also very large, with areas of
basin forms a boundary between the Bohemian Highlands, the
several square kilometres. The middle Danube region shows some
Carpathians and the Pannonian Province. It is an ecologically
characteristic steppe lakes, of which the most prominent ones are
valuable area with high diversity of species and landscape types.
Neusiedlersee / Ferto-tÛ and Lake Balaton. A characteristic lake type
of the lower Danube basin is the Liman Lake12, of which several
The Drau/Drava is the fourth largest (41,238 km2) and fourth longest
are situated to the north of the lower Danube. Ozero Ialpug in
Danube tributary (893 km). It rises in the Southern Alps in Italy but is
Ukraine is a liman-like lake that has been blocked off by levees of
the dominant river of southern Austria, eastern Slovenia, southern
the Danube River.
Hungary and Croatia. Main Austrian sub-tributaries are Isel, Mˆll,
Lieser and Gurk, and the Mur/Mura with its mouth at the Croatian-
Lakes selected for the basin-wide overview are those larger than
Hungarian border.
100 km2 (see Table 8).
The Velika Morava in Serbia and Montenegro is the last significant
Neusiedler See / Ferto-tÛ
right-bank tributary before the Iron Gate, with a catchment area of
Neusiedler See / Ferto-tÛ is located in the east of Austria and shared
37,444 km2. The Velika Morava is formed by the confluence of two
with Hungary. It has a total surface area of 315 km2 (at a defined
rivers, the Juzna/Southern Morava draining the south-eastern part of
water level), of which 240 km2 are located in Austria and 75 km2 in
Serbia, together with the Nisava River and Zapadna/Western Morava
Hungary. A fluctuation in the water level of the lake of +/- 1.0 cm
draining the south-western part of Serbia together with the Ibar.
means a change in the lake surface of up to 3 km2. More than half of
its total area consists of reed beds; in certain parts the reed belt is 3 to
The Prut River is the second longest (950 km) and the last tributary
5 km wide. In the past the lake had no outflow and therefore
of the Danube, with its mouth just upstream of the Danube Delta. Its
extremely large fluctuations of its surface area were recorded.
source is in the Ukrainian Wood Carpathians. Later it forms the
border between Romania and Moldova. Main sub-tributaries are
Neusiedler See / Ferto-tÛ has an average natural depth of 1.1 m, its
Ceremosh, Derelui, Volovat, Baseu, Corogea, Jijia, Chineja, Ciugur
maximal water depth is 1.8 m. In its history it has dried out
and Lapusna.
completely several times. Later the Hans·g Main Canal was built as
the lake outlet. Since 1965 the water level is stabilised by the outlet
sluice based on an agreement of the Hungarian-Austrian Water
Commission in 1965 (water level in April-August: 115.80 m a.s.l.,
October-February: 115.70 m a.s.l., transition periods March and
September: 115.75 m a.s.l.). The main surface water input is through
precipitation on the lake surface, secondly by Wulka River, R·kos
Creek and other smaller tributaries. Inflow due to groundwater is
close to negligible. Due to its low depth the lake is quickly mixed by
wind action and therefore naturally turbid. The lake water is
characterised by a high salt concentration.
12 Liman lakes are enclosed shallow flooded river estuaries that have been separated from the sea by narrow sandbars.
General characterisation of the Danube River Basin District 31
Lake Balaton
Razim-Sinoe Lake System
Lake Balaton, situated in the western part of Hungary, is a large
The Razim-Sinoe Lake System is a complex system consisting of
shallow lake with a surface area of 605 km2 (official data) and an
several large brackish lagoons separated from the sea by a sandbar
average depth of 3.6 m. The shape of the lake is slender with a length
(see Figure 6). Every year thousands of tons of alluvial deposits are
of 77.8 km and a width of 7.7 km on average. The narrowest point is
carried into the Delta by the Danube resulting in a constant reshaping
the Tihany Strait. Here the accelerated lake current erodes the bottom
of the river banks and sandbars.
sediment up to more than 10 m depth. The catchment area of the lake
is 5,188 km2 excluding the surface of the lake itself. Out of the many
Lacul Razim has a surface area of 392 km2 (520 km2 including Lacul
water courses that enter the lake River Zala is the most significant,
Golovita and Lacul Zmeica). Lacul Razim is fed from several
contributing 45 % of the catchment area.
sources: the Danube ≠ Sf. Gheorghe arm through Dranov and
Dunavat Channel as well as Babadag Lake through Enisala Channel.
The southern shore is characterised by a gently deepening, velvety
The catchment area of Babadag Lake is 924 km2. Razim Lake is
quicksand due to its lotic conditions. Reed belts cover major parts
predominantly influenced by water from the Danube and much less
of the southern shore and the area around Keszthely Bay. Due to
from the Babadag and Razim catchments.
its shallow waters the lake responds quickly to changes in air
temperature and solar radiation. During the summer it is not rare
Lacul Sinoe is the only lagoon along the Romanian seashore. It covers
that the water temperature exceeds 25∞ C, while in winter the lake
162 km2 at the southern end of the Razim-Sinoe complex. The hydro-
freezes. For management purposes the lake is usually subdivided into
logical character of Lacul Sinoe has changed over time. Originally it
four basins, namely Keszthely-, Szigliget-, Szemes- and SiÛfok
was a bay of the Black Sea, which was gradually cut off by natural
basins, from west to east.
sandbar formation. In 1975 to 1977 hydrological works were
performed that resulted in the closure of the Black Sea connection of
Ozero Ialpug
the Razim-Sinoe complex. The only connection remaining between
For Ozero Ialpug no information is available.
the Sinoe Lagoon and the Black Sea today is the Periboina Channel.
Since that time the lagoon has experienced an increased inflow of
freshwater through Lake Razim and the natural inlets connecting it to
the Danube River. During the last 25 years of freshwater inflow Lacul
Sinoe has turned into an oligohaline lake.
The main lakes (with a surface area > 100 km2) in the Danube River Basin
(data source: Competent authorities in the DRB unless marked otherwise)
TABLE 8
Surface area
Average
Maximum
Lake
Country(ies)
[km2]
depth [m]
depth [m]
Neusiedler See / Ferto-tÛ
AT, HU
315
1.10
1.80
Lake Balaton
HU
605
3.60
10.60
Ozero Ialpug*
UA
149
na
na
Lacul Razim / Razelm
RO
392
2.05
3.50
incl. L. Golovita and L. Zmeica
RO
520
na
na
Lacul Sinoe / Sinoie
RO
162
1.25
2.30
* The size of the surface area was calculated using GIS on the basis of the DRBD slightly from the official data, because another method of calculation has been used.
General characterisation of the Danube River Basin District 32
3.5. Major wetlands in the Danube River Basin District
poplar and oak), floodplain lakes, ponds, extensive reed beds and
Floodplain forests, marshlands, deltas, floodplain corridors, lake
marshes and was already designated as a Ramsar Site and a Nature
shores and other wetlands are essential components in the Danube
Park (IUCN category I b and V). It was further proposed as part of a
River Basin's biodiversity and hydrology. The Danube River Basin
transboundary Biosphere Reserve along the Drava and Mura rivers.
extends into five of the eight Biogeographical Regions of Europe: the
100 days flooding per year and the abundance of food and underwater
Alpine, the Continental, the Pannonic, the Steppic and the Black Sea
vegetation makes Kopacki Rit, after the Danube Delta, the most
Region. Each of these shows characteristic wetlands, some of them
important fish-spawning ground along the entire Danube.
are protected, others not. Many of the larger wetland areas are
transboundary in nature. The wetlands in the Alps and Carpathians
Just opposite Kopacki Rit lies the wetland complex of Gornje
also represent valuable drinking water reserves for millions of people.
Podunavlje (Serbia and Montenegro) with 19,648 ha of floodplain
habitats. This spatially and ecologically unique complex with its
The current extent of wetlands in the DRB is only a remnant of the
mosaic of water, marsh, swamp, meadows, bush and forest
former wetland systems. The 13 most important wetland complexes
ecosystems is characterised by a high biodiversity and significant
in the Danube River Basin are described below (see also Map 16 and
number of threatened, rare, endemic and relict species.
Chapter 6 of this report).
A special case are the middle and lower Drava-Mura wetlands (Slovenia,
The Donauauen National Park (Austria) with approximately 11,000 ha
Croatia, Hungary) forming an intact bio- and landscape corridor of
of floodplain forests, riparian habitats and side-arms between Vienna
380 km from the alpine foothills up to the Pannonian Lowlands on
and Hainburg represents the last intact floodplain of the upper Danube.
the Danube. Although there are already some nature reserves and
Together with the Floodplains of the Lower Morava and Dyje (Austria,
other protected areas, most of the area has remained unprotected. The
Czech Republic and Slovak Republic) it forms a transboundary
floodplain corridor covers 60,000 ha and forms a unique living space
"wetland of international importance" and was declared as a trilateral
especially for migratory freshwater species and alpine pioneer species
Ramsar Site. On the Czech side, it is partly a biosphere reserve and
living on sand, gravel bars and islands as well as for forest species
World Heritage Site; protected nature reserves and landscapes exist in
and mammals such as river otter and beaver.
all three countries. The area contains extended floodplains and
lowland steppe river habitats along the former Iron Curtain. Extended
The Sava wetlands extend through Croatia, Serbia and Montenegro,
old hardwood forests and the largest wet meadow complex in Central
and Bosnia i Herzegovina. The Nature Park Lonjsko Polje constitutes
Europe form an inter-connected wetland area of 25,000 ha in three
the largest wetland in Croatia and covers an area of more than
countries.
100,000 ha. Obedska Bara is the largest wetland in Serbia within this
system and has an extent of more than 30,000 ha.
The Neusiedlersee and Ferto-Hans·g (Austria and Hungary), a trans-
boundary National Park since 1993, and World Heritage Site since
A mosaic of Ramsar Sites, Important Bird and Landscape Protection
2003, is a 30,000 ha shallow steppe lake area with a huge reed belt,
Areas, Biosphere Reserves and also non-protected areas can be found
adjacent small soda lakes and traditional pastures. It is one of the
along the wetlands of the Upper and Middle Tisza River. The Ecsedi Lap
most important resting sites for migrating birds in Europe. Protected
Complex (Ukraine, Slovak Republic, Romania, and Hungary) forms a
landscape areas, including small nature reserves, form the Szigetkˆz
riverine ecocorridor which is 400 km long and has a size of 140,000 ha.
and Zitny Ostrov Floodplain Complex (Hungary and Slovak Republic), an
On the lower Tisza, the Stari Begej- Carska Bara Ramsar Site at the
extended meander zone around the low water bed of the Danube.
confluence of the Begej and the Tisza River is the most valuable
wetland area.
As a part of the Duna-Drava National Park, established in 1996, the
Gemenc-BÈda-Karapancsa Wetlands (Hungary) represent an exceptional
A major wetland complex for Europe is the Lower Danube wetlands
example of a large old floodplain with big meanders, oxbow lakes,
(Serbia and Montenegro, Romania, Bulgaria, Moldova, and Ukraine)
marshland and extended hardwood forests. This Important Bird Site
with a size of approximately 600,000 ha. They are also a mosaic of
(Black Stork, Sea Eagle) with a total area of 47,000 ha is also an
protected areas including Ramsar sites, Biosphere Reserves, World
excellent fish spawning ground.
Heritage Site (Srebarna Lake) and National/Nature Parks (e.g. Balta
Mica a Brailei). Most important are the Bulgarian islands at Belene,
Kopacki Rit (Croatia) with some 30,000 ha between the Drava and the
the Kalimok marshes, the lower Prut floodplains and liman lakes in
Danube is one of the richest and most dynamic floodplains of the
Moldova. Together with the Danube Delta this area is one of the
Danube River Basin. It has extended floodplain forests (willow,
world's most important ecoregions for biodiversity.
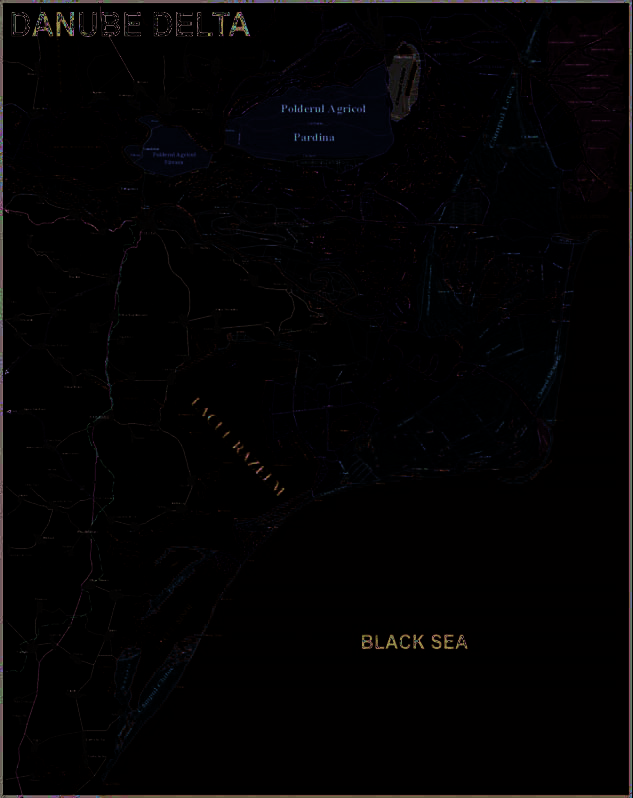
General characterisation of the Danube River Basin District 33
The Lower Prut floodplains (Romania and Moldova) are 147 km long and
It was designated as a transboundary UNESCO World Heritage Site
have a size of 19,153 ha with adjoining floodplain terraces and river-
and Man and Biosphere Reserve, has 2 Ramsar Sites, a national park
cliffs with ravines. Up to the confluence of Prut and Danube the
and some nature reserves. The Danube Delta includes the largest reed
floodplain is up to 6 km wide, and includes meadows and riverine
bed in the world (180,000 ha) and a complex of three large river
forests; the aquatic biodiversity is high especially in the floodplain
arms, floodplain forests, inner lakes, natural and man-made channels,
lakes Beleu (1,700 ha) and Manta (complex of interconnected lakes).
sand dunes and coastal biotopes (see Figure 6). It has globally
important breeding, feeding and resting areas for pelicans and
The Danube Delta (80 % Romania and 20 % Ukraine) with a size of
300 other birds, for sturgeons, the river otter and many other
675,000 ha is the most important wetland in the Danube River Basin.
endangered species.
The Danube Delta
FIGURE 6
Grafik nicht druckf‰hig, wird ersetzt!
General characterisation of the Danube River Basin District 34
3.6. Important canals for navigation
Danube-Tisza-Danube Canal System
Location
Main-Danube Canal
The Danube-Tisza-Danube (DTD) Canal System is situated in the
Location
Vojvodina province of Serbia. The DTD System is divided into two
With a length of 171 km the Main-Danube Canal connects the River
practically independent parts, in the Backa and in the Banat region. In
Main at Bamberg with the River Danube at Kelheim in Germany
Backa, the main canals receive water from the Danube River gravitatio-
thereby linking the Danube with the Rhine river basin. The altitude
nally (up to 72 m3/s) and by pumping (33 m3/s). In the Banat region,
difference between the top of the canal in the franconian Jurassic and
the main canals are fed from the Tisza River (120 m3/s) and intercepted
the Main is approximately 175 m. The altitude difference between the
rivers (Old and Navigable Bega, Timis, and a few minor). The biggest
top of the canal and the Danube is approximately 68 m. To overcome
canals of the DTD System are used for navigation. These include 330 km
this altitude difference, 16 sluices were necessary. The Canal is 55 m
of navigable canals, which enable the navigation of 1,000 t vessels.
wide and 4 m deep.
The economy in the area is based mainly on agriculture and related
History of its construction
industry. Many industrial plants and larger settlements are located on
The idea of a continuous waterway between the Main and the Danube
the main canals.
dates back to Charlemagne in 793, who made the attempt to build a
2 km long ditch between Altm¸hl and the Swabian Rezat, yet failed to
History of its construction
complete it. In the following centuries, this idea was brought up
From the ancient times people in these areas made great efforts to
several times but it was never fully realised.
protect their properties from frequent flooding and prevent water-
related diseases. Organized works started in the eighteenth and
The Bavarian King Ludwig I established a continuous waterway ≠ the
nineteenth century. Canals were excavated to drain swamps and
"Ludwig-Main-Danube-Canal". However, the Canal did not achieve
enable navigation: the Bega Canal for the drainage of the Central
acceptance because of competition with the railway, its narrow width
marsh (4,000 km2), the Teresia Canal in the Banat region, and the
and its insufficient development in the Main and the Danube. The
Danube-Tisza Canal in the Backa region. After the Second World
construction of the current Main-Danube Canal started in 1960 and
War, the existing canals were connected into a multipurpose water
was completed in 1992.
management system. Its design started in 1947 and the project was
finished in 1977 with the completion of the dam on the Tisza. These
Important uses
developments changed Vojvodina from a swampy and uninhabited
Besides navigation, the diversion of water from the Altm¸hl and the
area to a densely populated and developed part of Serbia.
Danube in the Regnitz-Main-area is of particular importance. The
diversion aims at:
Important uses
≠ improvement of low water availability in northern Bavaria,
The DTD multi-purpose system fulfills the following tasks:
≠ improvement of the water quality and the ecological status in the Main area,
(a) Flood protection, (b) Drainage of excess interior waters and
≠ flood protection in the Altm¸hl valley downstream of Gunzenhausen,
routing of drainage waters through the main canals towards the
≠ improvement of the regional structure and creation of new jobs in the
Danube and the River Tisza, (c) Convey of water for the irrigation
tourism sector, and
of agricultural land, (d) Water supply of industry and fisheries,
≠ enrichment of the landscape with water and near-natural areas.
(e) Navigation, (f) Receiving and convey of wastewater (wastewater
discharge of 40 million m3/year), (g) Abstraction of water from
the Danube and the River Tisza to improve water quality, and
(h) Recreation, sports and tourism.
General characterisation of the Danube River Basin District 35
Danube-Black Sea Canal
3.7. Groundwater in the Danube River Basin District
Location
The hydrological basins drain directly or indirectly towards seas with
The Danube-Black Sea Canal (DBSC) is situated in Romania. It takes
little or no tide, slow renewal processes and sensitive ecosystems.
its waters from the Danube upstream of the town Cernavoda, and
Most of the renewable water resources come from rivers that have
flows into the Black Sea at Agigea. It is 64.4 km long. From the
significant hydrological variability. The water resources in the DRB
Poarta Alba Locality, the canal has a 32.7 km long branch (Poarta
show a large variability in terms of groundwater quantity.
Alba ≠ Midia Navodari Canal, PAMNC), which flows into the Black
Nonetheless, they share common characteristics.
Sea at Navodari. The catchment area of both canals is 939.8 km2.
Table 9 includes information on the hydrology of the DBSC and its
Besides porous aquifers there are many karstic aquifers in the DRB.
branch PAMNC.
Due to their high permeability karstic aquifers are highly vulnerable
to contamination. The percolation time for contaminants is very
History of its construction
short and therefore natural purification processes are very limited.
The main purpose of the Danube-Black Sea Canal (DBSC) is to
For selected countries such as Bulgaria, Croatia, and Serbia and
decrease the navigation distance to the Black Sea. The works began in
Montenegro, groundwater resources represent as much as 30 % of
1975 and were completed in 1987. The canal locks are situated at
total internal renewable water resources.
Cernavoda, Agigea, Ovidiu, and Navodari, separating thus the canals
in distinct reaches. Part of the Carasu Valley, which was a tributary to
A large number of transboundary aquifers exist in the region. Not
the Danube River, was used in order to dig the DBSC. The construction
much is known at present about the availability of groundwater or
of the branch PAMNC began in 1983 and was completed in 1987.
potential extraction capacity in many countries, although aquifers are
the main sources for drinking and industrial water.
The tributaries of the DBSC are characterised by torrential flow
regime. In order to mitigate the maximum flows and to decrease the
sediment transport, 34 reservoirs were constructed.
Important uses
The main uses of the canals DBSC and PAMNC are the following:
(a) Navigation (maximum weighcarrying capacity of the canal is
70 million t/year), (b) Water supply, (c) Nuclear power generation
(Cernavoda Nuclear Power Plant), (d) Hydropower generation
(Agigea Micro-Hydroelectric Power Plant), (e) Irrigation, (f) Flood
defence, (g) Drainage, and (h) Receiving effluent discharges from
the Cernavoda Nuclear Power Plant (thermic pollutant), municipal
wastewater and industrial effluents.
Hydrological characteristics of DBSC and PAMNC
TABLE 9
Hydrological characteristics
DBSC
PAMNC branch
Flow variation [m3/s]
800 (1 % probability) - 220 (94 % probability)
32.8 - 51
Water level difference between the intake and the outlet [m]
11.5 - 3.75
7.5 - 8.1
Flow velocity [m/s]
0.3 - 0.9
0.13 - 0.23
Water depth [m]
8.4 - 4.5
-
Width [m]
90
50


Characterisation of surface waters 36
4. Characterisation of surface waters
(Art. 5 and Annex II)
According to Annex II 1.1 WFD "Member States shall identify the location and boundaries of bodies of surface water and shall carry out an initial
characterisation of all such bodies ...". Details on the implementation of the requirements of the WFD are given in this chapter.
4.1. Identification of surface water categories
Romania have finalised their surface water typologies in line with the
The first step in the analysis is the identification of the surface water
requirements of the WFD. Slovenia, Croatia, Serbia and Montenegro,
categories. According to Annex II 1.1.(i) WFD "The surface water
and Moldova have started the development of their typologies. They
bodies within the river basin district shall be identified as falling
have focussed on the surface waters dealt with in the Roof report and
within either one of the following surface water categories ≠ rivers,
will further develop their typologies for other surface waters
lakes, transitional waters or coastal waters ≠ or as artificial surface
afterwards. The latter countries have provided information on drafts
water bodies or heavily modified surface water bodies."
of their typologies in order to make a basin-wide overview of the cur-
rent status of development possible. Deviations between this report
The following surface waters have been selected for the basin-wide
and the National Reports of these countries may occur, since the
overview and are therefore dealt with in the Roof report:
finalised typologies will only become available after finalisation of
≠ all rivers with a catchment size of > 4 000 km2
this report.
≠ all lakes and lagoons with an area of > 100 km2
≠ the main canals
4.2.1. Ecoregions in the Danube River Basin District
≠ transitional and coastal waters.
Fauna and flora show different geographical distributions depending
on the natural characteristics of the environment. To account for these
These surface waters are shown on the Danube River Basin District
differences the WFD requests the definition of surface water types
overview map (see Map 1). The surface water body categories have
and the development of type-specific ecological classification
been identified on the national level. A brief description of these
systems to assess the status of water bodies. Ecoregions are regions of
waters is given in Chapter 4.1. A list of all rivers and lakes selected for
similar geographical distribution of animal species. They are
the basin-wide overview is contained in Annex 1.
therefore an important basis for the definition of biologically relevant
surface water types. These have been delineated by ILLIES13 and are
4.2. Surface water types and reference conditions
used in Annex XI WFD.
For each surface water category, the relevant surface water bodies
within the river basin district need to be differentiated according to
The Danube River Basin District covers nine ecoregions or parts
type (Annex II 1.1 (ii) WFD). The Directive foresees the use of
thereof (see Table 10). Some countries have shares of several
System A (a defined set of descriptors) or System B (a set of
ecoregions, e.g. Austria, and Serbia and Montenegro each have
obligatory and a set of optional descriptors) for the development of
parts of five ecoregions on their territory in the DRBD. Ecoregion
surface water typologies.
11 (Hungarian Lowlands) has an importance due to its location in
the middle of the basin. Eight DRB countries have territories in this
As mentioned in Chapter 1.3 the state of implementation of WFD
ecoregion (Figure 7). For the transitional and Black Sea coastal waters,
varies strongly between the countries in the Danube River Basin. This
Romania and Bulgaria have proposed to define a new ecoregion:
is especially true for the development of surface water typologies and
"the Black Sea ecoregion". A detailed description of this ecoregion
the definition of their reference conditions. Germany, Austria, the
will be included in the National reports of these countries.
Czech Republic, the Slovak Republic, Hungary, Bulgaria and
13 ILLIES (1978)
Characterisation of surface waters 37
Ecoregions in the Danube River Basin
TABLE 10
Ecoregion
Countries with territories in the DRB
4 ≠ Alps
Germany, Austria, Slovenia, Italy, Switzerland
5 ≠ Dinaric Western Balkan
Austria, Slovenia, Croatia, Bosnia i Herzegovina, Serbia and Montenegro, Albania
6 ≠ Hellenic Western Balkan
Serbia and Montenegro, Albania, Macedonia
7 ≠ Eastern Balkan
Serbia and Montenegro, Bulgaria, Macedonia
9 ≠ Central Highlands
Germany, Austria, Czech Republic
10 ≠ The Carpathians
Austria, Czech Republic, Slovak Republic, Poland, Serbia and Montenegro, Romania
11 ≠ Hungarian Lowlands
Austria, Czech Republic, Slovak Republic, Slovenia, Hungary, Croatia, Serbia and Montenegro, Romania
12 ≠ Pontic Province
Romania, Bulgaria, Moldova, Ukraine
16 ≠ Eastern Plains
Romania, Moldova, Ukraine
Location of the Danube River Basin in Europe
FIGURE 7
O
ae
S
c
i c
l t
i
N o r t h
a
B
t
S e a
n
a
l
16
t
16
16
C h a n n e l
Sea
9
A
9
of Azov
10
10
10
4
4
11
11
11
12
12
12
B l a c k
S e a
5
5
7
A
7
driatic Sea
6
6
Aegean
Sea
Tyrrhenian
Se a
I o n i a n
M
e
d
i
S e a
t
e
r
r
a
n
e
a
n
S
e
a
In several countries (Germany, Austria, Croatia, Hungary and
topography, geomorphology and riparian vegetation. Romania has
Romania) the ecoregions have been divided into smaller geographical
introduced a new sub-ecoregion within ecoregion 10, the Carpathians.
regions to address differences in river types based on different
This sub-ecoregion is the Transylvania Plateau, an inner mountain
landscape features or differences in the aquatic communities.
area that shows differences in altitude, geomorphology and in the
macroinvertebrate communities. In Germany, "river landscape units"
Hungary has subdivided ecoregion 11, Hungarian Lowlands, into
have been defined as sub-ecoregions based on geological and
five sub-ecoregions based on the topography and the (hydro-)geo-
geographical features. In Austria, abiotic and biotic characteristics
chemical character of the region. Croatia has specified five
were used to define a total of 15 "bioregions" as sub-divisions of
sub-ecoregions on its territory discerning differences in fluvial
ecoregions.
Characterisation of surface waters 38
4.2.2. Rivers
4.2.2.1. Typology of the Danube River
The typology of the Danube River has been developed in a joint
and System B. The most important factors are ecoregion, mean water
activity by the countries sharing the Danube River14. The Danube
slope, substratum composition, geomorphology and water temperature.
typology therefore constitutes a harmonised system used by all these
countries. The Danube flows through or borders on territories of
Ten Danube section types were identified (see Table 11). The ten Danube
10 countries (Germany, Austria, Slovak Republic, Hungary, Croatia,
section types are defined below. The morphological and habitat charac-
Serbia and Montenegro, Bulgaria, Romania, Moldova and Ukraine)
teristics are outlined for each section type. In order to ensure that the
and crosses four ecoregions (9 ≠ Central Highlands, 11 ≠ Hungarian
Danube section types are biologically meaningful, these were validated
Lowlands, 10 ≠ Carpathians, and 12 ≠ Pontic Province). The Danube
with biological data collected during the Joint Danube Survey, a
typology was based on a combination of abiotic factors of System A
longitudinal survey conducted in August/September 2001 (see Annex 3).
Definition of Danube section types
TABLE 11
Section Type 1: Upper course of the Danube
rkm 2786:
confluence of Brigach and Breg ≠ rkm 2581: Neu Ulm
Section Type 2: Western Alpine Foothills Danube
rkm 2581:
Neu Ulm ≠ rkm 2225: Passau
Section Type 3: Eastern Alpine Foothills Danube
rkm 2225:
Passau ≠ rkm 2001: Krems
Section Type 4: Lower Alpine Foothills Danube
rkm 2001:
Krems ≠ rkm 1789.5: Gˆnyu/ Klizsk· Nem·
Section Type 5: Hungarian Danube Bend
rkm 1789.5: Gˆnyu/ Klizsk· Nem· ≠ rkm 1497: Baja
Section Type 6: Pannonian Plain Danube
rkm 1497:
Baja ≠ rkm 1075: Bazias
Section Type 7: Iron Gate Danube
rkm 1075:
Bazias ≠ rkm 943: Turnu Severin
Section Type 8: Western Pontic Danube
rkm 943:
Turnu Severin ≠ rkm 375.5: Chiciu/Silistra
Section Type 9: Eastern Wallachian Danube
rkm 375.5:
Chiciu/Silistra ≠ rkm 100: Isaccea
Section Type 10: Danube Delta*
rkm 100:
Isaccea ≠ rkm 20 on Chilia arm, rkm 19 on Sulina arm and rkm 7 on Sf. Gheorghe arm
* Within this section the Danube divides into the three main branches of the Danube Delta.
Each arm also has transitional waters with the following limits: Chilia arm: rkm 20 ≠ 0, Sulina arm: rkm 19 ≠ 0, Sf. Georghe arm: rkm 7 ≠ 0.
14
This activity has been supported by the UNDP/GEF Danube Regional Project.
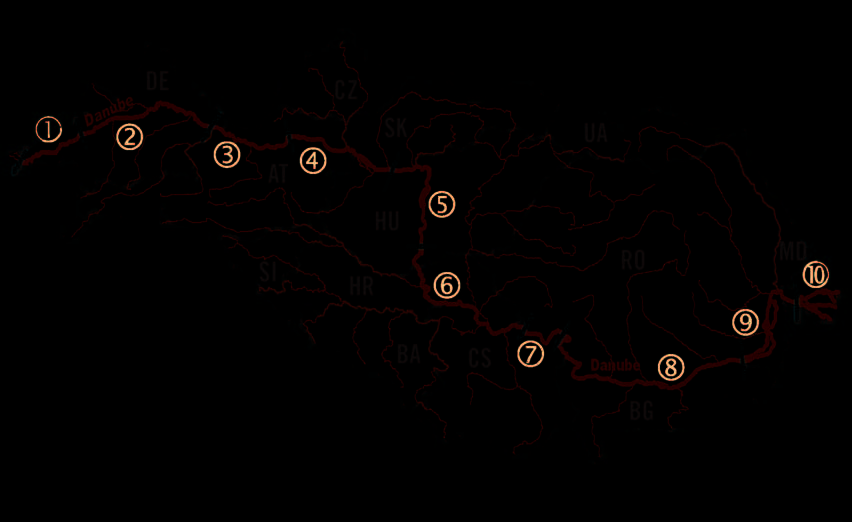

Characterisation of surface waters 39
Danube section types; the dividing lines refer only to the Danube River itself
FIGURE 8
Number of Section Type
Border of Section Type
Tributaries
National borders
4.2.2.2. Typology of the tributaries in the Danube River Basin District
Altitude
The typologies of the Danube tributaries were developed by the
In general, the class boundaries suggested in Annex II WFD have
countries individually. Workshops enhanced the exchange of informa-
been applied in the DRB countries. Both Austria and Slovak Republic
tion between the countries and allowed for a streamlining of
include an additional altitude class for watercourses higher than 1500
approaches. In addition, stream types relevant on transboundary water
metres. Since the typology system of Croatia accounts for the main
courses were bilaterally harmonised with the neighbours. Information
rivers only two altitude classes are defined. A 500 metres-class
on river typologies or drafts of river typologies was available from
boundary is set up by Austria, Serbia and Montenegro, and Romania.
Germany, Austria, Czech Republic, Slovak Republic, Hungary,
Slovenia, Croatia, Bulgaria and Romania. Romania has helped
Catchment area
Moldova with the development of the river typology for the Prut
The size classes of System A are generally applied. Austria, Hungary
River, and Moldova has confirmed the typology. Most countries in
and Serbia and Montenegro have introduced other class boundaries
the Danube River Basin (Germany, Austria, Slovak Republic,
than those suggested in the Directive. The Austrian system has an
Hungary, Slovenia, Croatia, Romania) have applied System B (Annex
additional class boundary at 500 km2 and one at 2500 km2. Hungary
II, 1.2.1 WFD). Only the Czech Republic and Bulgaria have used
has established overlapping class boundaries in order to take account
System A.
of continuous changes in nature that do not stop at fixed borders.
Serbia and Montenegro has defined an additional catchment area
The common factors used in all DRB typologies are ecoregion
boundary at 4000 km2. Bulgaria has no rivers with catchment areas of
(described above), altitude, catchment area and geology.
more than 10,000 km2 and has therefore dropped this class.
Their use in the DRBD is described below.
Geology
The Directive identifies three main categories for geology: siliceous,
calcareous and organic. These have been refined by some countries,
e.g. by Austria and the Slovak Republic. Croatia has added the
category "mixed geology". The Czech Republic does not make use of
the category "organic".
Characterisation of surface waters 40
Table 12 gives an overview of the class boundaries used by the DRB
as a descriptor in their stream typology. In Austria, watercourses are
countries for the common descriptors altitude, catchment area and
classified according to the Strahler System for stream order. River
geology.
basin and intermittent flow are optional parameters of the Slovenian
scheme. Romania uses mean air temperature, precipitation and yearly
Countries using System B have used a number of optional factors to
minimum specific monthly flow with 95 % probability as an indicator
further describe the river types. River discharge, mean substratum
of temporary streams among others. The only optional factor of the
composition and mean water slope are most frequently used (Table 13).
German system is the delineation of the River Landscape Units,
The Romanian system relates the river discharge to the catchment
which is based on several abiotic and biotic features. Biocoenotic
area. Serbia and Montenegro has used mean substratum composition
parameters are considered in Austria, Slovak Republic and Romania.
Obligatory factors used in river typologies (System A and B)
TABLE 12
Descriptor
Country
Class boundaries
altitude
Germany
0-200 m
200-800 m
> 800 m
Austria
0-200 m
200-500 m
500-800 m
800-1500 m
> 1500 m
Czech R.
0-200 m
200-800 m
> 800 m
Slovak R.
0-200 m
200-800 m
800-1500 m
> 1500 m
Hungary
0-100 m
100-200 m
200-500 m
> 500 m
Croatia*
0-200 m
> 200 m
Slovenia**
0-200 m
200-800 m
> 800 m
Serbia and Montenegro
0-200 m
200-500 m
500-800 m
> 800 m
Romania
0-200 m
200-500 m
500-800 m
> 800 m
Bulgaria
0-200 m
200-800 m
> 800 m
catchment area
Germany
10-100 km2
100-1000 km2
1000-10,000 km2
> 10,000 km2
Austria
10-100 km2
100-500 km2
500-1000 km2
1000-2500 km2
2500-10,000 km2
> 10,000 km2
Czech R.
10-100 km2
100-1000 km2
1000-10,000 km
> 10,000 km2
Slovak R.***
< 1000 km2
> 1000 km2
Hungary
10-200 km2
100-2000 km2
1000-12,000 km2
> 10,000 km2
Croatia1
100-1000 km2
1000-10,000 km2
> 10,000 km2
Slovenia2
10-100 km2
100-1000 km2
1000-10,000 km2
> 10,000 km2
Serbia and Montenegro
10-100 km2
100-1000 km2
1000-4000 km2
4000-10,000 km2
Romania
10-100 km2
100-1000 km2
1000-10,000 km2
> 10,000 km2
Bulgaria
10-100 km2
100-1000 km2
1000-10,000 km2
geology
Germany
siliceous
calcareous
organic
tertiary and quaternary
limestone
Austria
cristalline
sediments
flysch and helveticum
and dolomite
Czech R.
siliceous
calcareous
siliceous rock
siliceous rock of other
Slovak R.
of neo-volcanics
geologic formations
calcareous
Hungary
siliceous
calcareous
organic
Croatia1
siliceous
calcareous
organic
mixed
Slovenia2
siliceous
calcareous
organic
Serbia and Montenegro
siliceous
calcareous
organic
Romania
siliceous
calcareous
organic
Bulgaria
siliceous
calcareous
organic
*
This is a very first draft of type-specific sections of Croatian main rivers. The Croatian typology will be subject to future revision in accordance with national verifica-
tion and bilateral harmonisation processes with neighbouring countries.
** Only valid for large rivers.
*** The river typology is not based on strict boundaries of catchment area. Rivers > 1,000 km2 make up individual types;
definition of types for smaller rivers is based on ecoregion, altitude and geology.
Characterisation of surface waters 41
Optional factors used in river typologies by countries using System B
TABLE 13
Descriptor
Country Class
boundaries
mean annual discharge
Austria
> 0-5 m3/s
5-10 m3/s
10-50 m3/s
> 50 m3/s
Croatia
< 10 m3/s
10-300 m3/s
300-1000 m3/s 1000-10,000 m3/s > 10,000 m3/s
Romania
< 3 l/s km2
3-30 l/s km2
> 30 l/s km2
mean substratum
Hungary
middle-fine
coarse
composition
Croatia
loam
Clay
silt
sand
gravels
boulders
Serbia and
fine
medium
coarse
Montenegro
(clay, silt, sand, gravel)
(sand, gravel, cobbles)
(gravel, cobbles, boulders)
Romania
clay
silt
sand
pebbles
boulders
blocks
mean water slope
Slovak R.*
< 2
2-5
5-50
> 50
Croatia
> 0-0.1
0.1-0.5
> 0.5
Romania
< 10
10-40
> 40
Strahler system
Austria
seven different stream orders
river basin
Slovenia*
Danube
Adriatic
intermittent flow
Slovenia*
yes
no
mean air temperature
Romania
< 0 ∞C
0-8 ∞C
> 8 ∞C
precipitation
Romania
< 500 mm
500-800 mm
> 800 mm
yearly minimum
specific monthly flow
with 95% probability
Romania
< 1 l/s km2
0.3-2 l/s km2
> 2 l/s km2
"river landscape unit"
Germany
46 in total, aggregated to larger biocoenotic units
"bioregion"
Austria**
15 in total
zoogeographical division
Slovak R.
Poprad area
Upper Vah area Tisza area
Danube area
* only large rivers
** Large rivers (Danube, Morava, Thaya, Rhine and the alpine rivers) are defined as "special types".
In total, 216 stream types have been defined for the Danube River
4.2.2.3. Reference conditions
Basin District. Annex 2 gives a complete list of all stream types that
Annex II 1.3 (i) WFD prescribes, that for each surface water type,
have been identified so far. 131 of these stream types are relevant on
type-specific hydromorphological and physico-chemical conditions
the DRBD overview scale (see Table 14). This includes the 10 section
shall be established representing the values of the hydromorpho-
types for the Danube River. Most of the stream types (45) are
logical and physico-chemical quality elements specified for that
located in the Hungarian Lowlands (ecoregion 11). 24 stream types
surface water type at high ecological status. Type-specific biological
are situated in the Carpathian Mountains (ecoregion 10). In some
reference conditions shall be established, representing the values of
ecoregions only few stream types were identified (ecoregion 5, 7
the biological quality elements for that surface water type at high
and 16). The latter mainly cover territories of countries still
ecological status.
developing their river typologies. Therefore, these numbers will
increase in the future.
Due to the overview nature of this report most stream types relevant
on the basin-wide scale cover large and very large rivers. The geology
is siliceous in about 2/3 of all stream types and calcareous in about
1/3. Only very few stream types were identified as being of organic
nature. About half of the stream types are located in the lowlands
(altitude < 200 m). About 10 % of the stream types are located above
800 m. About 40 % of the remaining types are at mid-altitude.
Characterisation of surface waters 42
Number of stream types defined
On the basin-wide level, the Danube countries have agreed on general
on the DRBD overview level
TABLE 14
criteria as a common base for the definition of reference conditions
Country
Number of stream types
(see Table 5). These have then been further developed on the national
Tributaries
level into type-specific reference conditions.
Germany*
6
Austria
17
The definition of reference conditions was based on the following
Czech Republic
8
approaches:
Slovak Republic
17
- spatially based approach using data from monitoring sites, or
Hungary
12
- approach based on predictive modelling, or
Slovenia
9
- definition of temporally based reference conditions using either historical
Bosnia i Herzegovina
-
data or palaeo-reconstruction, or
Serbia and Montenegro
8
- use of expert judgement (where none of the above methods was possible).
Croatia
12
Bulgaria
6
Spatially based reference conditions and expert judgement were the
Romania*
23
two methods predominantly used in the DRBD. Methods were also
Moldova
3
combined to derive reference conditions.
Ukraine
-
Total number on tributaries
121
Use of spatially based data from monitoring sites
The method is based on the use of existing sites of high ecological
Danube River
10
status. In the DRBD (as in other European river basins) only few
Total number for DRBD
131
reference sites are available, which fulfil all criteria mentioned in
Table 15. Especially in the lowlands, and for large rivers, undisturbed
* including sub-types
reference sites do not exist anymore. Therefore, the description of
reference conditions was based on best available sites for these types.
This method was used by all countries to describe the reference
conditions for the fish fauna.
Use of expert judgement
In addition to spatially based reference sites, most countries applied
expert judgement for deriving reference conditions of benthic inverte-
brates and for phytobenthos.
Historical reconstruction
Historical data were frequently applied to define reference conditions
for fish communities and for macrophytes.
Predictive modelling
Predictive modelling was used to define macrozoobenthos reference
conditions in the Czech Republic. Germany used this approach for
defining the physico-chemical aspects of the reference conditions.
Biological quality elements
As for the biological elements, the description of reference conditions
was generally based on benthic macroinvertebrates. The following
variables were used: taxonomic composition, abundance, diversity,
and the ratio `sensitive to insensitive taxa'. Austria also defined type-
specific reference values for the Saprobic Index and for multimetric
indices. Romania added type-specific values for the Saprobic Index.
Characterisation of surface waters 43
Basic criteria for defining reference conditions (harmonised basin-wide)
TABLE 15
Basic statements
Reference conditions must be reasonable and politically acceptable.
Reference sites have to include important aspects of "natural" conditions.
Reference conditions should reflect no or minimum stress.
Land use in catchment area
Influence of urbanisation, land use and forest management should be as low as possible.
Stream and habitats
Reference sites should be covered by natural climax vegetation or unmanaged forests.
No removal of coarse woody debris.
No bed or bank fixation.
No obstructions that hinder the migration of organisms or the transport of bed material.
Only minor influence due to flood protection measures.
Bank and floodplain vegetation
Bank and floodplain vegetation should be present to allow lateral migration.
Hydrology and water management
No alteration of natural discharge regime.
No or only minor alteration of hydrology by dams, reservoirs, weirs, or sediment retaining structures affecting the site
No alteration of regime due to water diversion, abstraction, and no pulse releases.
Physico-chemistry
No point source of organic pollution.
No point source of nutrient pollution.
No sign of diffuse pollution inputs.
No acidification.
No liming.
No alteration of natural thermal regime.
No salinisation.
Biology
No significant impairment of the indigenous biota by introduction of animals and plants (e.g. in the frame of fish farming).
Lake morphology
Morphological alterations do not influence biodiversity and ecological functioning.
Biomanipulation
No biomanipulation (e.g. in lakes).
Recreation uses
No intensive recreational use.
Reference values for fish have been used by all countries (except
Reference conditions for phytoplankton were described by the same
Slovenia) but different indicative parameters were applied:
four countries named above. Germany only defined taxonomic
- taxonomic composition and abundance of fish fauna (Germany, Czech
composition. Slovak Republic, Romania and Moldova added
Republic and Moldova; Romania has used taxonomic composition without
information on the abundance of species. Biomass was used a
using abundance)
reference criterion in Moldova and Romania (for naturally eutrophic
- abundance of fish fauna (Germany, Czech Republic and Moldova)
streams). The Slovak Republic and Romania both used phytoplankton
- age structure (Austria and Slovak Republic)
diversity. In addition, Romania used the Saprobic Index.
- ratio of sensitive to insensitive species (Austria)
- fish diversity (Czech Republic, Slovak Republic)
The hydromorphological and physico-chemical reference conditions for rivers
- biomass, habitat guilds, reproduction guilds or share of reproducing species,
were defined by Germany, Austria, Czech Republic, Slovak Republic
and a fish index (Austria).
and Romania.
For the biological element, `macrophytes and phytobenthos', different
The reference conditions of the Danube River have been developed in
approaches were used for each organism group: for macrophytes, the
a uniform approach together with the typology of the Danube River.
taxonomic composition of the reference communities was defined
A first draft of the reference conditions is available and may be found
by Germany, Slovak Republic and Moldova. Moldova also used
in Annex 3. These will need further revision and validation.
abundance of macrophytes. For phytobenthos, taxonomic composition
and abundance were used by all DRB countries. Austria has defined
reference values for the trophic index based on phytobenthos.15
Romania has defined reference values for Saprobic Index.
15 ROTT et al. (1999).
Characterisation of surface waters 44
4.2.3. Lakes
4.2.3.1. Lake types
The lake typologies were developed individually in the Danube
covers only lakes of less than 200 m altitude. The mean water depth is
countries. Five lakes have been selected for the basin-wide overview.
classified in the categories less than 1 m, less than 1.5 m (intermittent
These are situated in Austria, Hungary, Romania and Ukraine. Only
lakes), 1-3 m, less than 4 m (oxbow lakes) and 3-15 m. Three lake
one lake is transboundary in nature (see Table 16).
size classes are applied in the Hungarian typology: 0.5-10 km2, 10-
100 km2 and more than 100 km2. The hydro-geochemical character is
Information on lake typologies, or drafts of lake typologies, was
differentiated in the categories calcareous, calcareous-organic,
available from Austria, Hungary and Romania. All these countries
calcareous-salinic, and salinic. Additional factors are the permanency
implemented System B (Annex II, 1.2.2 WFD). The common factors
of the lake and oxbow character. The Romanian typology follows the
used in these lake typologies are the obligatory factors of System B:
class boundaries of System A. Lake surface area is differentiated in
altitude, depth, surface area and geology. In addition, ecoregion was
five size classes: < 0.5 km2, 0.5-1 km2, 1-10 km2, 10-100 km2 and
used in the typologies of these countries. The class boundaries
> 100 km2. The lake typology is currently being further developed to
defined in System A were generally used. How these factors were
cover biological elements as well.
applied is described below.
Table 16 indicates the lake types for lakes relevant on the basin-wide
In the Austrian lake typology two additional altitude classes were
scale. All lake types are calcareous by geology and dominated by
introduced (800-1800 m and > 1800 m). The factor geology was
sandy and muddy substratum. They are all oblong in shape and very
further differentiated into the following categories: crystalline,
shallow. Lacul Razim / Razelm is less than 3 metres deep and has
tertiary and quaternary sediments, flysch and helveticum, and
monomictic mixing characteristics. Neusiedler See / Ferto-tÛ is
limestone and dolomite. Regarding depth, only two classes were used:
characterised as the last and most western member of the so-called
< 15 m and > 15 m. For the further characterisation of lake types
steppe-type lakes in Europe. It has a mean water depth of 1.1 m and
Austria used lake mixing characteristics, acid neutralising capacity,
is holomictic. Lake Balaton is a very large steppe-type lake. It has a
water level fluctuation as well as biological elements (fish,
mean water depth of 3.6 m and is polymictic. A typological
phytoplankton and macrophytes). The Hungarian lake typology
description of Ozero Ialpug is not available.
Lakes selected for the basin-wide overview and their types
TABLE 16
Lakes > 100 km2
Country/ies
Type of lake
Ecoregion
Altitude class
Depth class
Size class
Geology
Neusiedler See / Ferto-tÛ
AT, HU
large shallow, salinic steppe-type lake
11
lowland: < 200 m
< 3 m
> 100 km2
calcareous
Lake Balaton
HU
very large shallow steppe-type lake
11
lowland: < 200 m
3-15 m
> 100 km2
calcareous
Ozero Ialpug
UA
na
12
na
na
> 100 km2
na
Lacul Razim /Razelm
RO
lowland, very shallow, calcareous,
very large lake type
12
lowland: < 200 m
< 3 m
> 100 km2
calcareous
Characterisation of surface waters 45
4.2.3.2. Reference conditions
4.2.4. Transitional waters
As for rivers, the Directive (Annex II 1.3 (i) WFD) prescribes, that
"Transitional waters are bodies of surface water in the vicinity of
for each surface water type, type-specific hydromorphological and
river mouths, which are partly saline in character as a result of their
physico-chemical conditions need to be established representing the
proximity to coastal waters but which are substantially influenced by
values of the hydromorphological and physico-chemical quality
freshwater flows" (Art. 2 6. WFD). The transitional waters of the
elements that have been specified for that surface water type at high
DRBD are located in the Danube Delta in Romania and Ukraine. In
ecological status. Type-specific biological reference conditions shall
this area, the arms of the Danube are influenced by marine water of
be established, representing the values of the biological quality
the Black Sea. In addition, transitional waters are located on the
elements for that surface water type at high ecological status.
Romanian coast of the Black Sea. Lacul Razim and Lacul Sinoe are
originally marine waters that have gradually been cut off from the
The reference conditions were developed individually by the countries.
Black Sea by sandbars. In the 1970s the remaining connection to the
In Hungary and Romania the definition of reference conditions is still
Black Sea has been closed through hydrological works. Today, Lacul
being developed. The methods most frequently applied were spatially
Sinoe is a transitional water (lagoon), which still receives marine
based methods, the use of historical data, and expert judgement.
water at very high tides. Lacul Razim is no longer influenced
Hungary also used historical data and palaeo-reconstruction for
by marine water and has turned into a freshwater lake (see also
phytoplankton and physico-chemical conditions to define reference
Chapter 3.4.).
conditions in its lakes.
For the development of the typology of transitional waters the
A comparison shows that similar approaches are being applied. While
following obligatory and optional parameters of System B were used:
Austria has finalised the definition of reference conditions, Hungary
≠ ecoregion
and Romania are still in the process of development. All countries are
≠ salinity
basing their assessment on species composition, abundance and the
≠ flow velocity of fluvial water
diversity of species. In some cases, additional parameters were used
≠ wave exposure
(e.g. age structure, biomass, ratio of sensitive to insensitive species).
≠ mixing characteristics
Table 17 gives an overview for which quality elements reference
≠ mean substratum composition
conditions are being defined.
≠ tidal range
≠ depth
≠ current velocity of marine water
Quality elements used to describe
≠ mean water temperature
reference conditions of lakes
TABLE 17
≠ turbidity
Quality element
Austria
Hungary
Romania
≠ ice coverage duration
Hydromorphological conditions
-
x
x
Physico-chemical conditions
x
x
x
Phytoplankton
x
x
x
Macrophytes
x
x -
Phytobenthos
-
-
x
Benthic invertebrates
-
x
x
Fish fauna
x
x
-
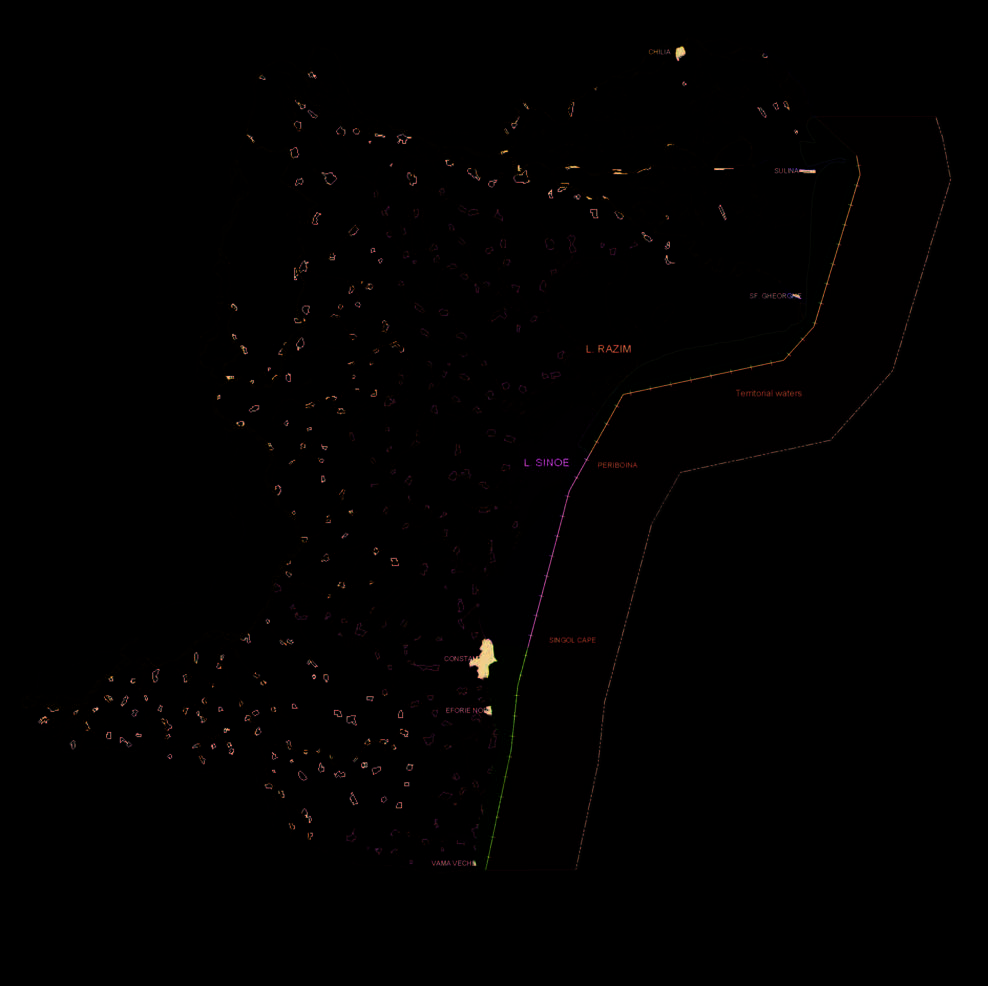
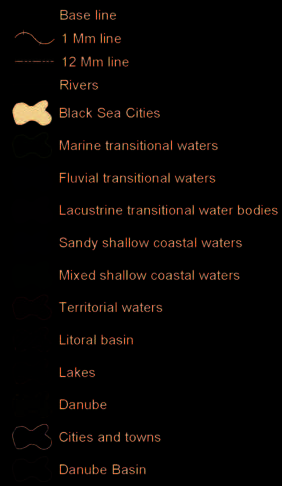


Characterisation of surface waters 46
Location of transitional and coastal water types
FIGURE 9
BLACK SEA ≠ ROMANIA
Transitional and coastal Water Types
UKRAINE
ROMANIA
BLACK
SEA
BULGARIA
Characterisation of surface waters 47
The transitional waters are differentiated into fluvial, lacustrine and
4.2.5. Coastal waters
marine transitional waters (see Table 18). The marine transitional
The coastal waters of the DRBD are located in the coastal area of the
waters are strongly influenced by the Danube, which has an average
Black Sea in Romania and Ukraine.
discharge of about 6,500 m3/s. The freshwater of the Danube is gener-
ally transported southwards along the Romanian coast with the
For the development of the typology of coastal waters the following
predominant southward coastal current. Figure 9 shows the location of
obligatory and optional parameters of System B were used:
the transitional and coastal water types. A detailed description of the
≠ ecoregion
transitional surface water types and their reference conditions are
≠ salinity
given in the National report of Romania.
≠ current velocity
≠ mean water temperature
≠ turbidity
Types of transitional waters in the
≠ mean substratum composition
Danube River Basin District
TABLE 18
≠ ice cover duration
Transitional water
Type
≠ tidal range
Danube River ≠ Chilia arm
transitional fluvial type
≠ depth
Danube River ≠ Sulina arm
transitional fluvial type
≠ wave exposure
Danube River ≠ Sf. Gheorghe arm
transitional fluvial type
≠ mixing characteristics
Lacul Sinoe
transitional lacustrine type
Black Sea coastal waters (northern sector) ≠
Two coastal water types have been defined for the coastal waters in
Chilia mouth to Periboina
transitional marine type
the DRBD. The location of these coastal water types are depicted in
Figure 9. A detailed description of the types as well as the definition of
the reference conditions is given in the National report of Romania
(Part B).
Types of coastal waters in the Danube River Basin District TABLE 19
Coastal water
Type
Periboina ≠ Singol Cape
sandy shallow coastal water
Singol Cape ≠ Vama veche
mixed shallow coastal water
Characterisation of surface waters 48
4.3. Identification of surface water bodies
4.3.1. Water bodies in rivers
According to Annex II 1.1 WFD "Member States shall identify the lo-
44 water bodies have been identified on the Danube River. Two of
cation and boundaries of bodies of surface water ...". "A body of sur-
these are shared by the Slovak Republic and by Hungary. The number
face water means a discrete and significant element of surface water
of water bodies on the Danube varies per country, e.g. on the German
such as a lake, a reservoir, a stream, river or canal, part of a stream,
part of the Danube 15 water bodies were delineated, on the Bulgarian
river or canal, a transitional water or a stretch of coastal water"
part only one. This means that the size of the water bodies also varies
(Art. 2. 10. WFD).
significantly. The smallest water body on the Danube is only 7 km
long, the longest is 487 km. Table 20 gives an overview of the number
Water bodies need to be clearly identified. Certain rules apply for
of water bodies identified on rivers. So far, 485 water bodies have
their delineation. For this initial characterisation water bodies may
been identified on the tributaries on the overview scale. Romania has
also be aggregated to form groups of water bodies of similar
the largest number of water bodies but also the largest part of the
character. The surface water categories have been identified in
basin (29 %). The mean length of water bodies is 55 km on the
Chapter 4.1. The water bodies described here refer to the Danube River
tributaries, on the Danube it is 140 km. Map 4 gives an overview of
Basin District overview map (see Map 1), i.e. to those relevant on the
surface water bodies identified on the basin-wide level.
basin-wide level. All other water bodies are dealt with in detail in the
National Reports (Part B). Croatia, Bosnia i Herzegovina, Serbia and
Table 21 give an overview of the criteria used for the delineation of
Montenegro, Moldova and Ukraine have not finalised the
water bodies. A change in type is the most frequent reason for the
identification of water bodies.
separation of water bodies as well as a change in pressure, in
particular a change in the degree of pollution. Also, changes in the
hydrological regime and in morphology were frequently used criteria.
Number of water bodies on rivers on the DRBD overview scale
TABLE 20
DE
AT
CZ
SK
HU
SI
HR
BA
CS
BG
RO
MD
UA
Danube River
15
6
-
3*
4*
-
2
-
9
1
6
na
na
Tributaries
42
74
29
43
57
11
12
na
42
11
161
5
na
* Two of these water bodies are shared by SK and HU.
Criteria for the delineation of water bodies in rivers
TABLE 21
DE
AT
CZ
SK
HU
SI
HR
BA
CS
BG
RO
MD
UA
Change in surface water category
x
x
x
x
x
-
x
na
x
-
x
x
na
Change in type
x
x
x
x
x
x
x
na
x
x
x
x
na
Change in pressure
- pollution x
x
x
x
x
x
-
na
x
x
x
x
na
- alteration of hydrological regime
x
x
x
x
x
x
-
na
x
x
x
x
na
- change in morphology
x
x
-
x
x
x
-
na
x
-
x
x
na
- fisheries
-
-
-
x
-
-
-
na
-
x
x
x
na
4.3.2. Water bodies in lakes
Lakes were generally delineated as one water body (Neusiedlersee /
Ferto-tÛ, Lake Balaton, Lacul Razim). The delineation of the water
bodies for Ozero Ialpug is not available.
Danube River Basin District - Surface Water Bodies
MAP 4
Characterisation of surface waters 49
4.3.3. Water bodies in transitional and coastal waters
4.3.4. Heavily modified water bodies (provisional identification)
Romania has delineated five transitional water bodies and three
The provisional identification of heavily modified water bodies
coastal water bodies in the DRBD (see Figure 10). For all water bodies
(HMWB) is part of the characterisation of the River Basin District
changes in pressures were used for the delineation of water bodies
and the identification of distinct water bodies as defined in Annex II
(Table 22 and Table 23). In addition, the criterion "provisionally
of the WFD. However, the provisional identification of HMWB is
identified heavily modified water body" was used on the Sulina
discussed in detail in Chapter 4.6 because it is closely related to the
arm of the Danube River and on the coastal water Singol Cape ≠
analysis of hydromorphological pressures and impacts. Chapter 4.6
Eforie Nord.
provides an overview of the provisionally identified HMW sections
which meet basin-wide agreed criteria.
Transitional water bodies and reasons
for their delineation
TABLE 22
4.3.5. Artificial water bodies
alteration of
changes in
The identification of artificial water bodies (AWB) is part of the
Transitional water bodies
pollution
hydrological regime
morphology
fisheries
characterisation of the River Basin District as defined in Annex II
Danube River ≠ Chilia arm
x
-
x
-
of the WFD. This subchapter describes the AWB selected for the
Danube River ≠ Sulina arm
x
-
x
-
basin-wide overview. These are the three main navigation canals of
Danube River ≠
the Danube River Basin District, which are shown Map 4: the
Sf. Gheorghe arm
x
-
x
-
Main-Danube Canal, the Danube-Tisza-Danube Canal System, and
Lacul Sinoe
x
-
x
-
the Danube-Black Sea Canal.
Black Sea coastal waters
(northern sector) ≠
Table 24 includes information on the main characteristics of the three
Chilia mouth to Periboina
x
x
x
-
canals. All three are used for navigation, two of them (the Danube-
Tisza-Danube Canal and the Danube-Black Sea Canal) additionally
serve the purpose of flood protection. In addition, the Danube-Black
Coastal water bodies and reasons for their delineation
TABLE 23
Sea Canal is highly urbanised.
alteration of
changes in
Coastal water bodies
pollution
hydrological regime
morphology
fisheries
All other AWBs are dealt with in the national reports.
Periboina ≠ Singol Cape
x
x
x
-
Singol Cape ≠ Eforie Nord
x
x
x
-
Eforie Nord ≠ Vama veche
x
-
x
-
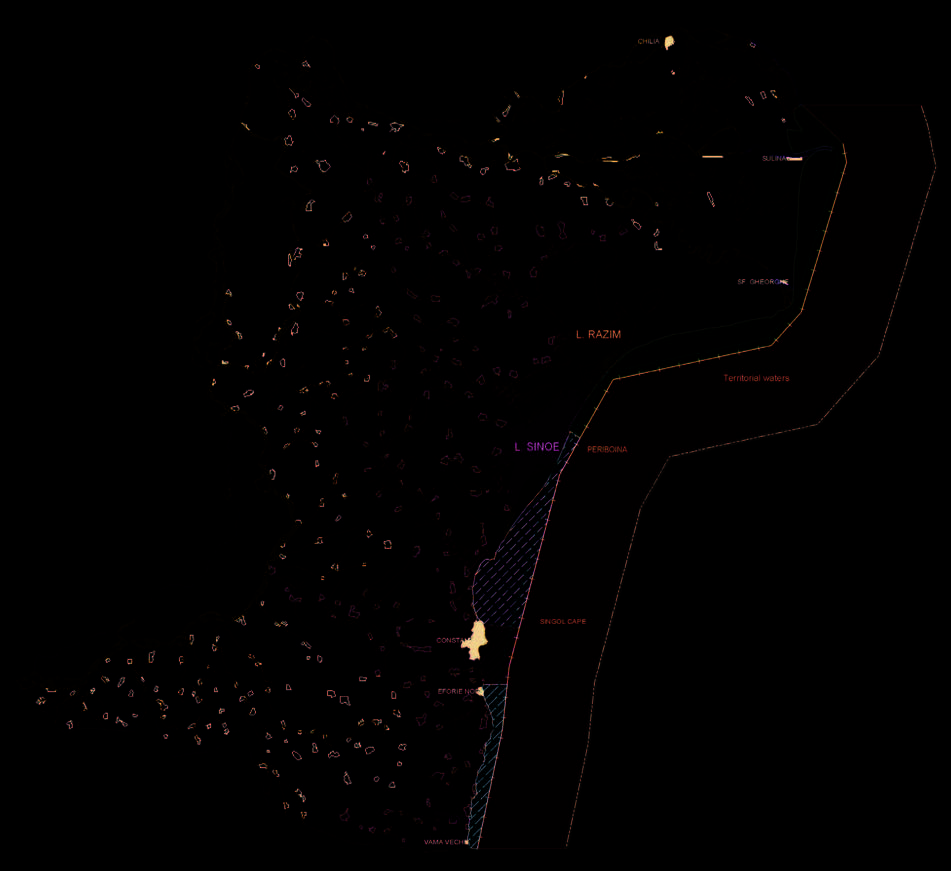

Characterisation of surface waters 50
Transitional and coastal water bodies in the Danube River Basin District
FIGURE 10
BLACK SEA ≠ ROMANIA
Transitional and Coastal Water Bodies
UKRAINE
ROMANIA
BLACK
SEA
BULGARIA
Artificial water bodies relevant on the basin-wide scale
TABLE 24
Name
Country
Length [km]
Area [km2]
Main uses
Main-Danube Canal
DE
171
Navigation
Danube-Tisza-Danube Canal (DTD)
CS
695
20,000 (canal system)
Navigation, Flood protection, Drainage
Danube-Black Sea Canal (DBSC)
64.4
incl. the Poarta Alba-Midia-Navodari Canal (PAMNC)
RO
(PAMNC: 32.7)
939 (catchment)
Navigation, Flood protection, Urbanisation
Characterisation of surface waters 51
4.4. Identification of significant pressures
The ICPDR Emission Inventory covers at present the emissions in the
The WFD requires information to be collected and maintained on the
Danube River Basin and still has to be complemented by the
type and magnitude of significant anthropogenic pressures, and
emissions in the remaining part of the Danube River Basin District.
indicates a broad categorisation of the pressures into:
The inventory is the key data base for the assessment of emissions
- point sources of pollution,
from point sources on the basin-wide level. It includes the major
- diffuse sources of pollution,
municipal, industrial and agricultural point sources and identifies the
- effects of modifying the flow regime through abstraction or regulation, and
total population equivalents of the municipal waste water treatment
- morphological alterations.
plants, the industrial sectors of the industrial waste water treatment
plants, and the types of animal farms for the agricultural point
Any other pressures, i.e. those not falling within these categories, must
sources. In addition, it includes information on the receiving water
also be identified. In addition, there is a requirement to consider land
and data on some key parameters of the effluent such as BOD, COD,
use patterns (e.g. urban, industrial, agricultural, forestry) as these may
P and N.
be useful to indicate areas, in which specific pressures are located.
In Chapter 1.3 it was already indicated that the results derived from
The pressures and impacts assessment follows a four-step process:
models should be interpreted and used with caution. In particular, the
1. describing the driving forces, especially land use, urban development,
results presented in the Chapter 4.4.1 and 4.4.2 which were derived
industry, agriculture and other activities which lead to pressures, without
from the application of the MONERIS model, are not consistent with
regard to their actual impacts;
national data despite several rounds of improvements. It was not
2. identifying pressures with possible impacts on the water body and on water
possible to finally assess and agree the quality and accuracy of the
uses, by considering the magnitude of the pressures and the susceptibility
basic datasets used for the calculations. Therefore, the assumption
of the water body;
and base data used are not necessarily approved by the countries
3. assessing the impacts resulting from the pressures; and
concerned.
4. evaluating the likelihood of failing to meet the objective.
However, the MONERIS work represents the latest and best possible
In this first analysis, the list of pressures and the assessment of
attempts to present comparable data on nutrient pressures from point
impacts on a water body, and possibly on up- or downstream situated
and diffuse sources for the Danube basin. The results have been
water bodies, includes the identification of all potentially important
presented in several publications and are going to be part of the
problems. This is then followed by a screening according to certain
final report of the daNUbs project of 200516. Despite considerable
criteria, which determine what `significant pressure' means.
efforts to ensure the consistency of the results with the final daNUbs
report, the sections represent the state-of-play on 8 November 2004.
While pressures from point sources may result e.g. from a large
Thereafter, certain model calculations have been updated and
number of different human activities (e.g. households, industrial
published (see BEHRENDT et al. 2005 and SCHREIBER et al. 2005).
activity, power generation, agriculture, forestry, fish farming, mining,
navigation, dredging, etc.) only those pressures are addressed here that
The ICPDR is committed to improve the quality and consistency of
have significant impacts on the basin-wide level. Therefore, some
the input data by, in particular, collecting and using latest official and
activities with only local effects such as mining will not be discussed
comparable national datasets, and, if necessary, to further develop the
in this report. Detailed information can be found in the National
MONERIS model. An updated and officially authorised inventory of
Reports.
pressures from point and diffuse sources of nutrient pollution will be
available by the end of 2006 as an important basis for preparing the
detailed programme of basin-wide nutrient reduction measures as part
of the Danube River Basin Management Plan.
16 daNUbs (2005).
Characterisation of surface waters 52
4.4.1. Significant point source pollution (overview)
4.4.1.1. Data availability
Within this report the focus of the analysis is on the significant point
The analysis of the point source pollution in the Danube river basin
sources of pollution. Table 26 gives an overview of the significant
district requires the availability of complete inventories of point
point sources identified in the Danube River Basin. The locations of
sources with data of high and homogenous quality covering the whole
the significant point sources are shown in Map 5. Annex 4 provides a
catchment area. This analysis is based on the ICPDR Emission Inven-
list of all identified significant point sources in the Danube River
tory. More detailed information is available in the national reports.
Basin District.
The criteria for the identification of the significant point sources for
The point source pollution is not only due to significant sources.
the basin-wide overview are given in Table 25. These criteria refer
Therefore, the results on the significant sources have to be compared
especially to substances mentioned in Annex VIII WFD, to the Urban
with the total emissions from point sources. The ICPDR has prepared
Waste Water Treatment Directive (91/271/EEC), to the Integrated
inventories for point source emissions for the reference years 2000
Pollu-tion Prevention and Control Directive (96/61/EC) and to the
and 2002. These include municipal sources (2000 only existing waste
Dangerous Substances Directive (76/464/EEC).
water treatment plants; 2002 untreated and treated municipal
sources), industrial and agroindustrial (only 2002) point sources.
Definition of significant point source pollution on the basin-wide level
TABLE 25
Discharge of
Assessment of significance
Municipal waste water
any municipal waste water from
agglomerations with < 10,000 PE
not significant
WWTPs with < 10,000 PE
untreated municipal waste water from
agglomerations with > 10,000 PE
significant
only mechanically treated
municipal waste water from
WWTPs with > 10,000 PE
significant
mechanically and biologically treated
municipal waste water without
tertiary treatment from
WWTPs with > 100,000 PE
significant if at least one parameter is exceeded:
≠ BOD*
> 25 mg/l O2
≠ COD*
> 125 mg/l O2
≠ Ntotal** > 10 mg/l N***
≠ Ptotal** > 1 mg/l P
Industrial waste water
significant if at least one parameter is exceeded:
≠ COD*** > 2 t/d
≠ pesticides**** > 1 kg/a
≠ heavy metals and compounds*****:
Astotal > 5 kg/a
Cdtotal > 5 kg/a
Crtotal > 50 kg/a
Cutotal > 50 kg/a
Hgtotal > 1 kg/a
Nitotal > 20 kg/a
Pbtotal > 20 kg/a
Zntotal > 100 kg/a
Waste water from agricultural point sources (animal farms)
significant if at least one parameter is exceeded:
Ntotal****** > 50,000 kg/a
Ptotal****** > 5,000 kg/a
WWTP = waste water treatment plant
* according to Table 1 of the EU Urban Wastewater Treatment Directive, 91/271/EEC
** according to Table 2 of the EU Urban Wastewater Treatment Directive, 91/271/EEC
*** equivalent to 13 mg/l N in Germany, due to 2h-composite sample monitoring
**** threshold as in the EMIS inventory for industrial discharges 2000
***** thresholds water in kg/year as in the EPER
****** threshold as in the EPER (EMIS inventory for point agricultural sources 2002)
Characterisation of surface waters 53
The inventory for the reference year 2002 includes 987 municipal,
Because both inventories do not include all point sources, these
306 industrial and 62 agroindustrial point sources. The inventory of
results will also be compared with the total point source pollution of
the point sources includes also the significant point sources according
nutrients given by SCHREIBER et al. (2003) and BEHRENDT et al.
to Table 25. The list of significant point sources therefore represents
(2005). Within the framework of the research project "Harmonised
24 %, 56 % and 34 % of the municipal, industrial and agroindustrial
Inventory of Point and Diffuse Emissions of Nitrogen and Phosphorus
point sources respectively of the 2002 inventory. Unfortunately,
for a Transboundary River Basin"17 the database of the point source
however, the inventory of point sources for 2002 does not include the
pollution for the nutrients was enlarged by additional data for
pollution from priority substances for all locations. In addition, the
Germany, Hungary and Slovak Republic. Because in 2004 Austria
impact analysis within this report (see Chapter 4.5.1.3), as well as the
also provided a complete set of the municipal point sources, the
analysis of the diffuse sources of emissions into the Danube river sys-
database used for this report is larger than the ICPDR Emission
tem, is using data from the year 2000. For these reasons the following
inventory. As part of the daNUbs project18 this database was used to
analysis has mainly used the existing list of significant point sources
estimate the development of the point source pollution in recent
and the point source inventory for the reference year 2000.
decades. With regard to organic point source pollution the ICPDR
Emission inventory is the exclusive database. The estimation of the
point source pollution of other substances is on the other hand based
only on the overview of the significant point sources.
Significant point sources of pollution in the Danube River Basin District according to the criteria defined in Table 25
TABLE 26
DE
AT
CZ
SK
HU
SI
HR
BA
CS
BG
RO
MD
UA
Municipal point sources:
WWTPs
2
5
1
9
11
3
10
3
4
6
45
0
1
Untreated wastewater
0
0
0
2
1
3
16
15
14
31
14
0
0
Industrial point sources
5
10
10
6
24
2
10
5
14
4
49
0
5
Agricultural point sources
0
0
0
0
0
1
0
0
0
0
17
0
0
Total
7
15
11
17
36
9
36
23
32
41
125
0
6
* Two of these water bodies are shared by SK and HU.
Danube River Basin District - Significant Point Sources of Pollution
MAP 5
17 SCHREIBER et al. (2003).
18 daNUbs (2005).
Characterisation of surface waters 54
4.4.1.2. Contribution of sub-basins to the total point source pollution
If the results of the point source pollution of organic substances and
of the Danube
nutrients for the inventory are compared with the pollution caused by
the significant sources (see Table 27) the portion of the contribution
Point source pollution from organic substances and nutrients
from the main sources is very different for the different substances.
Table 27 shows the results of the point source inventory for the main
Table 27 includes, in addition to the 15 sub-catchments of the Danube
sub-catchments of the Danube river basin district for the year 2000
river basin, the significant point sources for the coastal zone of
(missing values for COD, BOD, N and P for individual municipal
the Black Sea in Romania, which form part of the Danube basin river
waste water treatments and agricultural point sources were replaced
district.
on the country averages of the ratios of COD/BOD, N/BOD and N/P).
The selection of the sub-catchments is based on the results of the
For COD, the significant point sources account for 82 % of the total
Transboundary Analysis within the Danube Pollution Reduction
COD for all point sources in the emission inventory. For BOD, the
Program19 and is not related to a possible subdivision of the Danube
significant point sources account for only 48 %. The difference
river basin within the framework of the WFD.
between the organic pollution indicated by COD and BOD should not
be so significant. For this reason it can be assumed that one of the
Additionally the table includes the results of the estimated point
databases is incomplete and leads to biased assessments. Further
source discharges for nitrogen and phosphorus estimated by
clarification is needed.
SCHREIBER et al. (2003). The base for this study was data on the
total point source nutrient emissions from municipal waste water
A comparison of the significant point source emissions with the
treatment plants (WWTPs) of Germany, Austria, Slovak Republic and
complete list of point sources in the emission inventory illustrates
Hungary. For the other countries the total point source discharges
that only few point sources are responsible for about half of the point
were estimated from the ICPDR Emission Inventory and additional
discharges into the Danube River system. From this it can be
data for total national point source emissions20.
concluded that reduction of emissions (organic substances and
nutrients) from these sources would lead to a remarkable reduction of
If the main point source discharges of the ICPDR Emission Inventory
the total point source pollution.
are taken into account the total organic pollution from point sources
into the river system of the Danube in 2000 was about 420 kt/a BOD
Table 28 shows population specific point discharges within the sub-
(COD data for Serbia and Montenegro were not available and could
catchments of the Danube and for the total Danube basin. Table 28
also not be estimated). The point source discharges of nutrients were
allows a comparison on the present state of the treatment of organic
125 kt/a (N) and 20.1 kt/a (P) according to the ICPDR inventory for
pollution and nutrients within the sub-catchments. It is necessary to
2000.
consider that these data are based on the total population in the
sub-catchments and not on the population connected to WWTPs.
If it is taken into account that the inventory includes only a portion
The lowest discharge of organic pollution was found in the sub-
of the total organic point source discharges the total organic point
catchments of the Upper Danube, Austrian Danube, and Morava,
pollution of the Danube river system was about 560 kt/a BOD in
where the specific organic pollution of BOD is only about 10 % of
2000. If the same correction is made for the nutrients the total
the Danube average. Specific organic pollution above the Danube
pollution the total nutrient pollution by point discharges was about
average is indicated for the catchments of Sava, Banat-Eastern Serbia,
167 kt/a N and 26.8 kt/a P, respectively. These estimations are to a
Velika Morava and Mizia-Dobrudzha.
large extent consistent with the estimation of the modelling done for
388 sub-catchments of the Danube basin.21
19 UNDP/GEF (1999c).
20 SCHREIBER et al. (2005).
21 SCHREIBER et al. (2005).
Characterisation of surface waters 55
Municipal, industrial and agricultural point source discharges of COD, BOD, total nitrogen and phosphorus*
TABLE 27
Sub-catchment
COD t/a
BOD t/a
N t/a
P t/a
Municipal sources
01 Upper Danube
3,100
550
2,200
80
02 Inn
1,037
160
288
30
03 Austrian Danube
604
130
248
14
04 Morava
898
100
189
20
05 V·h-Hron
14,899
4,248
2,102
349
06 Pannonian Central Danube
94,759
32,304
11,618
1,495
07 Drava-Mura
14,970
5,802
2,291
418
08 Sava
83,649
37,102
6,005
1,358
09 Tisza
37,507
14,327
4,883
1,029
10 Banat-Eastern Serbia
13,261
4,247
2,679
619
11 Velika Morava
na
na
na
na
12 Mizia-Dobrudzha
64,057
29,149
5,064
1,254
13 Muntenia
59,917
29,861
15,602
1,844
14 Prut-Siret
25,314
9,869
2,751
215
15 Delta-Liman
744
272
50
4
16 Romanian Black Sea Coast
10,297
2,801
910
87
Municipal sources Total DRBD
425,013
170,922
56,880
8,816
Industrial sources
01 Upper Danube
7,346
49
20
8
02 Inn
8,469
375
305
20
03 Austrian Danube
4,825
196
12
9
04 Morava
1,911
136
130
19
05 V·h-Hron
8,294
2,681
96
4
06 Pannonian Central Danube
16,424
3,515
352
13
07 Drava-Mura
29,718
6,083
185
52
08 Sava
33,965
6,772
310
374
09 Tisza
16,622
3,315
331
32
10 Banat-Eastern Serbia
1,158
120
20
2
11 Velika Morava
na
na
na
na
12 Mizia-Dobrudzha
9,244
na
na
na
13 Muntenia
16,173
5,166
2,312
5
14 Prut-Siret
4,456
903
136
1
15 Delta-Liman
982
na
24
15
16 Romanian Black Sea Coast
842
242
390
na
Industrial sources Total DRBD
160,427
29,555
4,625
555
Agricultural sources
07 Drava-Mura
2
1
na
1
08 Sava
191
41
107
3
09 Tisza
2,263
579
749
na
10 Banat-Eastern Serbia
357
104
57
16
13 Muntenia
2,040
1,085
881
57
14 Prut-Siret
285
1,074
326
5
15 Delta-Liman
901
206
na
na
Agricultural sources Total DRBD
6,039
3,089
2,121
82
* from significant sources according the criteria of Table 25 (based on ICPDR Emission Inventory data of 2002)
Characterisation of surface waters 56
Specific point source discharges of COD, BOD, total nitrogen and phosphorus from municipal waste water treatments (WWTPs),
direct industrial discharges, and agricultural point discharges in the sub-catchments of the Danube.*
TABLE 28
Sub-catchment
CODs g/(Inh∑d)
BODs g/(Inh∑d)
Ns inv g/(Inh∑d)
Ps inv g/(Inh∑d)
Ns calc g/(Inh∑d)
Ps calc g/(Inh∑d)
01 Upper Danube
9.5
1.2
3.5
0.2
3.8
0.3
02 Inn
20.2
3.9
3.9
0.4
3.6
0.5
03 Austrian Danube
11.8
1.4
2.8
0.2
3.4
0.3
04 Morava
10.8
1.8
3.5
0.4
4.9
0.5
05 Vah-Hron
26.0
9.1
7.1
0.6
4.2
0.4
06 Pannonian Central Danube
35.8
18.8
5.3
0.6
6.7
1.0
07 Drava-Mura
44.2
12.5
5.2
0.8
4.1
0.7
08 Sava
52.3
28.6
4.0
1.0
4.8
1.2
09 Tisza
14.4
8.3
2.7
0.5
3.5
0.5
10 Banat-Eastern Serbia
17.8
68.5
12.4
2.7
10.4
2.4
11 Velika Morava
n.a.
24.9
3.3
1.1
3.3
1.1
12 Mizia-Dobrudzha
64.6
30.2
6.4
1.6
6.7
1.5
13 Muntenia
17.3
10.0
4.1
0.7
4.5
0.9
14 Prut-Siret
15.1
5.9
2.1
0.2
2.4
0.3
15 Delta-Liman
15.6
8.4
4.3
0.5
3.7
0.6
Total DRBD
23.9
14.0
4.2
0.7
4.5
0.8
* Ns, PsINV ≠ based on the ICPDR Emission Inventory data for 2000; Ns, PsCALC ≠ results of the MONERIS application for this report
For nutrients the situation is not so clear. This is because additional
Point source pollution from other substances and nuclear power plants
waste water treatment in WWTPs, and lower proportion of the
The database of the significant sources does not include enough data
population connected to WWTPs, lead to lower specific nutrient
on other substances that an estimation of these pollutants for the
discharges. For this reason, in addition to the Upper Danube, Inn,
whole Danube River Basin as well as for the sub-catchments can be
Austrian Danube and Morava catchments, the lower sub-catchments
given. For some countries, such as Germany, only qualitative numbers
of the Danube and the Tisza are also characterised by low specific
are presented. For most of the countries, the data are partially or
nutrient discharges. The catchments with the highest specific nitrogen
totally missing. For Romania the list of significant point source
discharges are Vah-Hron, Pannonian Central Danube, Drava-Mura,
pollution includes at least data for the heavy metals.
Banat-Eastern Serbia and Mizia-Dobrudzha. For phosphorus the
situation is also dependent on the existing use of P in detergents.
In addition, 8 nuclear power plants are located within the Danube
Therefore the highest specific P discharges were found for the Sava,
River Basin District (see Map 5). Emissions of organic substances,
Banat-Eastern Serbia, Velika Morava and Mizia-Dobrudzha.
nutrients and other substances into the river system should not exist
from this energy source or should be insignificant. Emissions of radio
Within the Upper Danube, Austrian Danube and partly the Inn the
nuclides have not been presented and should not occur.
point source discharges are considerably lower due to significant
elimination of organic pollution and nutrients especially in municipal
and industrial WWTPs.
If the criteria of the Urban Waste Water Directive (91/271 EEC) are
used as a delimiter for the treatment efficiency, a large potential for
the reduction of the point source discharges exists for the sub-catch-
ments of the middle and lower Danube.
An overview on the significant sources of point discharges for the
COD, BOD and the nutrients is given for the countries in the Annex 4.
Characterisation of surface waters 57
4.4.2. Significant sources of nutrients (point and diffuse)
connected inhabitant followed by Austria, Ukraine and Moldova. It is
including land use patterns
likely that the low N discharges for the latter two countries are due to
inconsistent data for the population connected to waste water
4.4.2.1. Introduction
treatment plants, or to low nitrogen discharges from the point sources
Whereas the load of substances from point discharges can be
in the inventory. The lowest N discharges per capita were found for
measured or calculated from measured concentrations and flows, the
Germany and Austria, this corresponds to the highest N-elimination
emissions of substances from diffuse sources cannot be measured.
in WWTPs. For some countries the specific N discharges are higher
For small watersheds the loads can be estimated but for medium and
than the assumed N emission per inhabitant of 12 g/(Inh.∑d). This is
large river catchments the estimation of the diffuse source pollution
due to the present low level of nitrogen removal in most of the
is only possible by mathematical modelling. This is done using land
WWTPs of these countries and the additional fact that the point
use, hydrological, soil and hydrogeological data collected in a
source database includes industrial discharges emitted into the river
Geographical Information System (GIS) as well as statistical infor-
indirectly (via sewer system) and directly (industrial point sources).
mation for different ad-ministrative levels.
The picture for phosphorus presented in Figure 12 is similar to that for
The definition of significant sources of pollution for the diffuse emis-
nitrogen (Figure 11), but the differences between the countries are
sions is a very complex theme. This is especially the case for large
much larger. This is due to the fact that the specific P point discharges
transboundary river basins such as the Danube. The main problem is
reflect, not only the state of the P elimination in waste water
to distinguish between areas with low and high levels of diffuse pollu-
treatment plants, but also the existing use of phosphorus in
tion. These levels are not only dependent on anthropogenic factors
detergents, and discharges from direct industrial sources. This is the
such as land use and land use intensities, but also on natural factors
reason that the specific P emissions are above 2.5 g/(Inh.∑d) for
such as climate, flow conditions and soil properties. These factors
Slovenia, Croatia, and Serbia and Montenegro. The medium level P
influence the pathways of the diffuse nutrient emissions and the reten-
emissions between 1 and 2 g/(Inh.∑d) were found for the Slovak
tion and losses on the way from the origin to the inputs into the river
Republic, Hungary, Bosnia i Herzegovina, Romania and Bulgaria.
system. Absolute values of the significant diffuse source of pollution
Beside Germany and Austria, the specific point P discharges are also
are also difficult to define. This is because the level of the intensity of
below 1 g/(Inh.∑d) for Czech Republic, Moldova and Ukraine. This is
land use as the main indicator for the diffuse emissions into the river
due to the fact that some WWTPs have additional P elimination. The
is also dependent on the population density in the catchment area.
relative low specific P emissions for Ukraine and Moldova are likely
due to the same reasons as pointed out for the low nitrogen values.
Criteria for estimating the significant diffuse sources, which ignore
the natural and basic anthropogenic conditions, are not reliable for
distinguishing between significant and insignificant levels. Therefore,
Inhabitant-specific N discharges from point sources
a number of uncertainties need to be taken into account when
(total load divided by total population in the state)
analysing the data (see Chapter 4.8.2).
in the Danube countries for the period 1998 to 2000;
results of the MONERIS application for this report
FIGURE 11
The following chapters present the analysis of the point and diffuse
nutrient emissions for the Danube river basin, but not for the Danube
Point N-discharges [g∑Inh.-1∑d-1]
river basin district. Such an analysis should be done in the future.
16
14
4.4.2.2. Present state of the nutrient point discharges
12
The total nutrient point discharge into the Danube was about 134.2 kt/a
10
nitrogen and 22.7 kt/a phosphorus in the year 200022. Figure 11 and
8
Figure 12 show the difference in the present state of the specific
6
nutrient point source discharges within the Danube countries. For
4
these figures the estimated point discharges of nutrients for the
2
individual countries were divided by the population in the countries,
0
which is connected to sewer systems. For nitrogen it is shown that
DE
AT
CZ
SK
HU
SI
HR
BH
CS
RO
BG
MD
UA
the lowest point N discharges are in Germany with 4 g/(Inh.∑d) per
22 SCHREIBER et al. (2003).
Characterisation of surface waters 58
4.4.2.3. Land use patterns and agricultural indicators
Another source of information on land use patterns in the Danube
The Danube basin is characterized by large gradients of anthropogenic
River Basin is the available CORINE land cover map. This data is not
and natural indicators, which are important for affecting nutrient
yet available for Croatia, Serbia and Montenegro, Ukraine and
inputs into the river system. One indicator for the level of the diffuse
Moldova. SCHREIBER et al. (2003) tried to fill this gap by
emissions of substances can be the land use within the basin and its
transferring the USGS land cover map into the classes of CORINE.
regional distribution.
A similar procedure was applied for Map 6 covering the whole Danube
River Basin District. As shown by information from SCHREIBER et
Figure 13 gives an overview of the portion of differing land uses,
al. (2005) for Bosnia i Herzegovina, such a transfer can lead to
arable land, grassland and pasture, forest and other kinds of land use,
substantial deviations for land use patterns. The advantage of using
related to the total area of the Danube countries. The use of these
the land use patterns according CORINE is that it contains the higher
country averages does not allow a calculation of an average for the
segmentation for the land use classes, and the possibility to estimate
total Danube river basin. The figure shows an increase of the share of
the land use for the river basin, as well as the sub-catchments.
arable land, and a decrease of forest, from the upper to the lower part
of the Danube. Because most countries (Hungary is the exception)
Figure 14 shows the land use patterns for those parts of the countries
have only a portion of their territory in the Danube catchment, the
within the Danube basin and the average for the whole Danube. If
estimation of a Danube average for the land use pattern is not
both figures are compared, it is obvious that the estimated portions of
possible using data on the country level. In addition, it must be
the arable land are higher based on CORINE data.
considered that the average land use for the countries can deviate
from the status within the parts of the countries only in the Danube
basins. This is due to the inhomogenous distribution of land use
within the countries.
Inhabitant-specific P discharges from point sources*
FIGURE 12
Point P-discharges [g∑Inh.-1∑d-1]
4
3
2
1
0
DE
AT
CZ
SK
HU
SI
HR
BH
CS
RO
BG
MD
UA
*
(total load divided by total population in the state) in the Danube countries for
the period 1998 to 2000; results of the MONERIS application for this report
Danube River Basin District ≠ Land Use
MAP 6
Characterisation of surface waters 59
These differences are due to the different classification systems being
overestimation of the dominant land cover (arable land and forest)
used. The national statistics represent the actual uses of land whereas
and an underestimation of the other classes. For the total Danube the
the CORINE data reflects the cover of the land according to the
share of the land use is: arable land 47.4 %, grassland and pasture
classification of satellite images. Because the resolution for the
6.2 %, forest 33.5 %, urban areas 3.9 %, surface water area 0.9 % and
classification of CORINE is 25 ha, this procedure leads further to an
other areas including open land, wetlands and glaciers 8.0 %.
Portion of land use types in the total area of the Danube countries for the period 1998 to 2000*
FIGURE 13
Portion of landuse [%]
100
100
other land
90
90
forest
80
80
grassland
70
70
arable land
60
60
50
50
40
40
30
30
20
20
10
10
0
0
DE**
AT
CZ
SK
SI
HR
BH
CS
HU
RO
BG
MD
UA
* The data source FAO the exception is Germany.
** DE represents the land use for Baden-W¸rttemberg and Bavaria according to the German Federal Statistical Office for the same period.
Portion of land use types at the parts of countries within the Danube basin and the average for the total Danube
according to CORINE land cover map and transferred USGS land cover map (source: SCHREIBER et al. 2003)
FIGURE 14
Portion of landuse [%]
100
100
other land
90
90
water
80
80
urban
70
70
forest
60
60
grassland
50
50
arable land
40
40
30
30
20
20
10
10
0
0
DE
AT
CZ
SK
SI
HR
BH
CS
HU
RO
BG
MD
UA
Total
Characterisation of surface waters 60
Besides being influenced by the land use it self, the level of the
From Figure 15 three groups of countries can be distinguished.
emissions into the surface waters of a river system is also dependent
Germany, Slovenia and Czech Republic are the countries with a
on the intensity of the land use. Because agricultural activities are a
consumption of mineral nitrogen fertilizer of more than 50 kg/(ha∑a)
main source for the diffuse nutrient emissions into the river system, it
N, although there is a large difference between the amount of use in
is important to show differences in intensity of use on a unique
the three countries.
database. Statistical data for the countries is the best way to do this.
Figure 15 shows the consumption of nitrogen fertilizer used in
In the second group of countries (Austria, Slovak Republic, Croatia
agriculture of the Danube countries. The source of the data is the
and Hungary) the use of mineral fertilizers in agriculture is low to
FAO agricultural statistics for the individual countries for the years
moderate, between 25 and 50 kg/(ha∑a) N. In all other countries
1998 to 2000.23 For Germany the information is not from the national
the level of mineral fertilizer consumption is significantly below
level but from the "L‰nder" of Baden-W¸rttemberg and Bavaria
25 kg/(ha∑a) N. The area weighted average of consumption of
where the data of BEHRENDT et al. (2003) was used based on
N fertilizer was estimated as 31.4 kg/(ha∑a) N for the Danube basin.
the GERMAN STATISTICAL YEARBOOK (1999 to 2001). The
Comparison with the average of the EU15 countries shows that the
figure includes also the average value for the 15 countries of the EU
level of fertilizer consumption in the Danube basin is less than half
(before May 2004), and the maximum value reached within the
this amount. The maximum of N fertilizer consumption reached in
set of countries. Further the area weighted average for the Danube
the EU15 countries is five times higher than the average in the
basin is given.
Danube basin.
Consumption of nitrogen market fertilizers in the Danube countries
within the EU 15 countries, and EU maximum value in the period 1998 to 2000 *
FIGURE 15
Consumption of N market fertilizers [kg∑ha-1∑a-1]
154
130
130
fertilizer
consumption
120
120
danube
110
110
average
100
100
90
90
80
80
70
70
60
60
50
50
40
40
30
30
20
20
10
10
0
0
DE**
AT
CZ
SK
SI
HR
BH
CS
HU
RO
BG
UA
MD
EU15
EUmax
* The bars represent the consumption of nitrogen market fertilizers per agricultural area of the Danube countries.
** The data given for DE** represents the average N fertilizer consumption of the German "L‰nder" Baden-W¸rttemberg and Bavaria.
The database is the national statistics published by the statistical offices of the countries or by FAO
23 FAO (2004).
Characterisation of surface waters 61
Consumption of nitrogen market fertilizers per inhabitant in the Danube countries
the EU 15 countries, and EU maximum value in the period 1998 to 2000 *
FIGURE 16
Consumption of N market fertilizers [kg∑ha-1∑a-1]
99
40
40
fertilizer
consumption
35
35
danube
30
30
average
25
25
20
20
15
15
10
10
5
5
0
0
DE**
AT
CZ
SK
SI
HR
BH
CS
HU
RO
BG
UA
MD
EU15
EUmax
* The bars represent the consumption of nitrogen market fertilizers per inhabitant living in the Danube countries.
** DE represents the average N fertilizer consumption of the German "L‰nder" Baden-W¸rttemberg and Bavaria.
The database is the national statistics published by the statistical offices of the countries or by FAO.
If N fertilizer consumption is calculated per inhabitant living in the
only 79 % of the number found for the Czech equivalents. Figure 17
countries a different picture emerges (see Figure 16). The deviation be-
includes the average for the total Danube basin for both kinds of
tween the countries, with exception of Bosnia i Herzegovina and
animal units, as well as this indicator for the average of the EU 15
Ukraine, is lower. The Danube average is 16.6 kg/(Inh.∑a). This is only
countries, and the maximum of these countries.
64 % compared to the average of the EU 15. The EU 15 maximum is
also 4.5 times higher than the average of the Danube basin.
The countries with a density of 1 or 0.8 animal units per hectare and
more are Germany, Austria and Slovenia. All other countries have a
In addition to the application of mineral fertilizer, the number of
livestock density lower than 0.5 animal units. The reason for these
livestock is an indicator for determining land use intensities that
low densities is that in most countries of Eastern Europe there has
affect diffuse nutrient inputs. Figure 17 shows the livestock density as
been a strong reduction of livestock numbers after the changes of
animal units per hectare agricultural area for the Danube countries.
socio-economic conditions around 1990. The average density of
The animal unit (AU) corresponds to a live weight of 500 kg.
animal units in the Danube basin is only 55 % of the EU 15 average.
Coefficients used for the conversion of animals of various types into
The maximum of the EU 15 countries is more than 7 times higher
the animal unit differ from state to state. In Figure 17 and Figure 18 the
than the average of the Danube basin.
coefficients common in the Czech Republic and Germany,
respectively are applied for the purpose of comparison. A systematic
The deviation between the countries for the livestock density is much
deviation is found when using the different equivalents. The animal
lower if this indicator is calculated as animal units per inhabitants
unit number calculated with the German equivalents is on average
living in the countries (see Figure 18).
Characterisation of surface waters 62
Animal unit density per agricultural area in the Danube countries for the period 1998 to 2000 *
FIGURE 17
Animal unit density [500 kg/ha]
4.13.2
2.0
2.0
Animal unit density
CZ classification
1.8
1.8
Animal unit density
1.6
1.6
DE classification
1.4
1.4
Danube average
for CZ classification
1.2
1.2
Danube average
for DE classification
1.0
1.0
0.8
0.8
0.6
0.6
0.4
0.4
0.2
0.2
0
0
DE**
AT
CZ
SK
SI
HR
BH
CS
HU
RO
BG
UA
MD
EU15
EUmax
* The bars represent the animal units per agricultural area in the Danube countries.
** The data given for DE* represents the animal unit density of the German "L‰nder" Baden-W¸rttemberg and Bavaria. The database is national statistics published by
the statistical offices of the countries or by FAO, equivalents for Czech Republic and Germany were used)
Animal units per inhabitant in the Danube countries for the period 1998 to 2000 *
FIGURE 18
Animal unit density [500 kg/Inh.]
2.41.9
0.5
0.5
Animal unit density
CZ classification
Animal unit density
0.4
0.4
DE classification
Danube average
for CZ classification
0.3
0.3
Danube average
for DE classification
0.2
0.2
0.1
0.1
0
0
DE**
AT
CZ
SK
SI
HR
BH
CS
HU
RO
BG
UA
MD
EU15
EUmax
* The bars represent the animal units per inhabitant in the Danube countries.
** The data given for DE represents the inhabitant-specific animal unit density of the German "L‰nder" Baden-W¸rttemberg and Bavaria. The database is national stati-
stics published by the statistical offices of the countries or by FAO, equivalents for Czech Republic and Germany were used.
Characterisation of surface waters 63
Nitrogen surplus per agricultural area in the Danube countries for the period 1998 to 2000*
FIGURE 19
Agricultural N surplus [kg/(ha∑a)]
249
100
100
N surplus
90
90
danube
average
80
80
70
70
60
60
50
50
40
40
30
30
20
20
10
10
0
0
DE**
AT
CZ
SK
SI
HR
BH
CS
HU
RO
BG
UA
MD
EU15
EUmax
* Data sources: SCHREIBER et al. (2003), based on data of FAO and national statistics for the German "Bundesl‰nder";
data source for EU15 and EUmax: FAO (2004). The data of these sources are not directly comparable, but give a general indication.
The group of countries with a value above the Danube average
The high animal density, and the large consumption of mineral
includes Romania and Ukraine. The average of the Danube is
nitrogen fertilizer, is the reason that Germany and Slovenia are also
between 75 and 80 % of the livestock density of the EU15 but about
the countries with the highest nitrogen surplus per hectare
8 times lower than the EU15 maximum. This is due to the lower
agricultural area (see Figure 19). The level of the N-surplus was 91 and
population density within the Danube than in the EU15 countries.
74 kg/(ha∑a) N respectively for the period 1998 to 2000.
Consumption of mineral fertilizer and livestock density are the major
From Figure 15 and Figure 17 a higher difference in the N-surplus
sources of information on nutrient inputs from agriculture. If the
between Germany and Slovenia could be expected, but higher
inputs by atmospheric deposition, seeds and for nitrogen N-fixation,
specific nitrogen outputs by harvested crops partly compensate for
and the outputs by harvested crops are taken into account, then the
the larger fertilizer consumption and higher animal density in
nutrient surplus on agricultural area can be calculated. The procedure
Germany. For the second group of countries (Austria, Czech Republic
for this calculation can differ from country to country and within the
and Croatia) the estimated N-surplus is moderate, between 30 and
countries. The results presented in Figure 19 are for all Danube
50 kg/(ha∑a) N. The level of the N-surplus of all other countries is
countries using the OECD procedure. The coefficients used for the
below 25 kg/(ha∑a) N. Figure 19 presents the wide variation in nitrogen
transfer of the different livestock excreta and crops into nitrogen and
surplus between countries and indicates that the potential for nitrogen
phosphorus are the ones used in the Czech Republic. As shown by
inputs into the surface waters of the Danube from countries also
SCHREIBER et al. (2003), the N surplus can differ within a minor
varies widely.
range if the coefficients or procedures of other countries were
applied. It should be pointed out that the application of different sets
The area weighted average of the N surplus within the Danube basin
of coefficients for the individual countries would lead to systematic
was estimated as 27 kg/(ha∑a). In comparison to the EU15 countries
differences and consequently to incompatibilities of the data.
this level of N surplus is only about 47 %. The maximum of the
EU15 countries is more than 9 times higher than the average of the
Danube basin.
Characterisation of surface waters 64
Because the annual phosphorus surplus on agricultural area is
large part accumulated in the soil, one main indicator for diffuse
P emissions into the river system is the longterm P accumulation on
the agricultural area. This indicator provides a basis for determining
the P emissions by erosion and surface runoff into the river system.
Figure 20 shows the estimated P accumulation on the agricultural area
of the Danube countries.
Phosphorus accumulation on agricultural area in the Danube countries for the period 1950 to 2000*
FIGURE 20
P accumulation [kg/ha]
2500
1000
1000
P accumulation
in the period
900
900
1950 to 2000
800
800
danube
average
700
700
600
600
500
500
400
400
300
300
200
200
100
100
0
0
DE*
AT
CZ
SK
SI
HR
BH
CS
HU
RO
BG
UA
MD
EU15
EUmax
* for data sources see Figure 19
According to Figure 20 the highest P accumulation was estimated for
Figure 21 shows the agricultural area per inhabitant living in the
Germany and Czech Republic. For these countries, the P-accumulation
countries. The figure shows that the agricultural area per inhabitant is
of agricultural soils is about the double of the value for the most
the lowest in Germany and Slovenia, where only a little more than
of the other countries. Moldova and Ukraine have an estimated
0.2 ha per inhabitant are used for agriculture. A second group of
P-accumulation, which is half that of most countries.
countries has an inhabitant-specific agricultural area of about
0.6 ha/inh. or more (Croatia, Serbia and Montenegro, Hungary,
The nitrogen surplus on the agricultural area, as well as the long term
Romania, Bulgaria, Ukraine and Moldova). This is at least three times
P accumulation on this area, reflects the differences of the intensity of
higher than for Germany and Slovenia. The Danube average is
land use. The interpretation of the consequences of these differences
0.54. This is about 50 % higher than the EU15 average and more than
between countries involves more than examining the agricultural
4 times higher than the minimum reached within the EU15 countries.
sector. The level of agricultural intensities in the countries is also
dependent on the people living in the region. If consideration is given
From this, the nutrient surplus per inhabitant can be calculated (see
to this factor then the results will change.
Figure 22), which shows that the behaviour regarding nutrients is much
more similar in the countries than may be deducted from the previous
graphs.
Characterisation of surface waters 65
Agricultural area per inhabitant*
FIGURE 21
agricultural area per inhabitant [ha/Inh.]
1.0
1.0
Agricultural
area per
inhabitant
0.8
0.8
danube
average
0.6
0.6
0.4
0.4
0.2
0.2
0
0
DE*
AT
CZ
SK
SI
HR
BH
CS
HU
RO
BG
UA
MD
EU15
EUmin
* living in the Danube countries, the EU15 countries, the minimum in the EU15 countries, as well as the population weighted average
for the Danube basin for the period 1998 to 2000. (Data sources: see Figure 19)
Nitrogen surplus per inhabitant and year in the Danube countries for the period 1998 to 2000*
FIGURE 22
agricultural N surplus [kg/(Inh.∑a)]
99
40
40
N-surplus
35
35
danube
average
30
30
25
25
20
20
15
15
10
10
5
5
0
0
DE*
AT
CZ
SK
SI
HR
BH
CS
HU
RO
BG
UA
MD
EU15
EUmax
* Data sources: see Figure 19
Figure 22 shows that one reason for the very high N surplus in
Romania, Bulgaria, Ukraine and Moldova) has an N surplus of
Germany is that Germany has a high population density in
10 to 15 kg/(inh.∑a). Only for Bosnia i Herzegovina as well as Serbia
comparison to most of the other Danube countries. If this is taken into
and Montenegro the N surplus per inhabitant is below 10 kg/(inh.∑a).
account, the variation of the agricultural intensities is much lower.
The average of the N surplus per inhabitant within the Danube basin
The N surplus per inhabitant and year is very similar in Germany
was estimated as 14.7 kg/(inh.∑a) N. This value corresponds to
Austria, Czech Republic, Slovenia and Croatia (about 20 kg/(inh.∑a)).
67 % of the EU15 average and is about 7 times lower than the
The second group of countries (Slovak Republic, Hungary,
EU15 maximum.
Characterisation of surface waters 66
4.4.2.4. Diffuse nutrient pollution
Figure 23 gives an overview of the pathways and main processes used
in the model. The basic inputs into the model are data on discharges,
Applied method
data on water quality of the investigated river basins, a Geographical
Since comparable data on diffuse nutrient pollution are not available
Information System (GIS) integrating digital maps and statistical
on the basin-wide scale (see also Chapter 1.3), the analysis of the
information for different administrative levels. The sum of the diffuse
diffuse nutrient pollution was undertaken by applying the model
nutrient inputs into the surface waters is the result of different
MONERIS (MOdelling Nutrient Emissions into RIver Systems). This
pathways realized by several runoff components. Distinction between
model was developed for the estimation of the nutrient emissions in
the inputs from the different runoff components is necessary. This is
German river systems24 and has recently been applied for the total
because the nutrient concentrations within the runoff components and
basin of the Danube.25 A detailed description of the model, and the
the processes within these runoff components are different.
results for the Danube for the time period 1998 to 2000, is presented
Consequently MONERIS takes seven pathways into account: point
by SCHREIBER et al. (2005).
sources, atmospheric deposition, erosion, surface runoff, ground-
water, tile drainage and paved urban areas.
Pathways and processes used in MONERIS
FIGURE 23
Nutrient balance on the agricultural area
Atmosheric deposition
Paved urban areas
Point sources
Nutrient surplus in the top soil
Erosion
Surface
Nutrient leaching from the root zone
Sedimentation
runoff
and retention
Sorption,
on land
Desorption
Base flow
Interflow
Tile drainage
Retention & losses in the unsaturated zone
Retention & losses in the groundwater
Nutrient emissions into the river systems
Nutrient retention and losses in the river systems
Nutrient load in the rivers
Nutrient inputs into the seas
24 BEHRENDT et al. (2000).
25 SCHREIBER et al. (2003).
Characterisation of surface waters 67
Along the pathway from the source to emission into the river,
Diffuse nutrient pollution by pathways for the
substances are governed by manifold processes of transformation,
total Danube river systems for the period 1998 to 2000
retention and loss. To quan-tify and forecast the nutrient inputs in
result of the MONERIS application for this report
FIGURE 24
relation to their source requires knowledge of these transformation
and retention processes. The use of a GIS allows a regional
Nitrogen
Erosion
5
differentiated quantification of nutrient emissions into river systems.
623500t/a N
14
12
Surface runoff
The EU research project daNUbs is currently verifying these.
Tile drainage
11
Atm. Deposition
Because the discussion on possible indicators and the criteria for
5
Groundwater
determining significance for diffuse source pollution has not yet been
53
Urban area
completed, the current situation of diffuse nutrient emissions and
relative differences between regions are shown in the following
paragraphs.
Phosphorus
45300 t/a P
The results, which are presented here focus only on the nutrients and
31
use the results of the modelling of the nutrient inputs into the Danube
51
basin published by SCHREIBER et al. (2003).
10
The following chapters present the analysis of the estimated point and
5
diffuse nutrient emissions for the Danube river basin, but not for the
2 1
Danube river basin district. This means that the Black Sea coastal
catchments, which are included in the Danube river basin district, are
not included in the analysis with the MONERIS model. Such an
analysis should be done in the future.
The respective shares of the other types of diffuse phosphorous
Significant diffuse nutrient pollution by pathways
emissions into the river system are smaller compared with the ones
Based on the data on the indicators described above, and further input
for nitrogen. The sub-catchments with high precipitation and high
data, the model MONERIS calculates the diffuse nutrient emissions
altitude or slope are the catchments with the highest specific inputs.
from six different diffuse pathways into the river system of 388 sub-
Figure 24 shows the contribution of the different diffuse nutrient
catchments of the Danube basin.
pathways for the Danube.
For each pathway of diffuse sources, the model takes into account the
It is clear that two pathways contribute about half of the diffuse
special natural conditions, which determine the retention and losses
nutrient inputs into the river system ≠ groundwater for N and erosion
from the origin to the point of input into the river systems. The large
for P. For both nutrients the pollution from surface runoff and urban
gradient of these conditions leads to high variation in the retention
areas are the next major dominant pathways. Tile drained areas are
and losses. The consequence is that the human input to the
important for nitrogen; inputs via groundwater are important for
environment (as shown in Figure 15 to Figure 22) will be decreased to a
phosphorous. According to SCHREIBER et al. (2003) the
different extent within the sub-catchments. Especially in the sub-
contribution from the different diffuse nutrient pathways varies
catchments of the upper Danube, the retention is lower than in the
significantly within the Danube basin. The effect is that the total
other sub-catchments. For this reason the specific diffuse nitrogen
diffuse nutrient emissions into the Danube river system also show
emissions are higher due to natural conditions. On the other hand the
large differences.
retention is ≠ also due to natural conditions ≠ higher in Central and
Lower Danube. In combination with moderate or low human
pressures, these conditions lead to lower specific diffuse N-emissions.
As shown in Figure 24 the total diffuse nutrient pollution into the
Danube river system was estimated to be 624 kt/a nitrogen and
45.3 kt/a phosphorus. The average area-specific emission discharge
into the whole river system (total load divided by total area of river
basin) over all diffuse pathways is therefore 7.8 kg/(ha∑a) for nitrogen
and 0.56 kg/(ha∑a) for phosphorus.
Characterisation of surface waters 68
The sources of nutrient pollution by human activities
Total nutrient emissions by human sources and background
A portion of the diffuse nutrient emissions into the Danube river
values for the Danube river basin in the period 1998-2000;
system is caused by natural conditions and independent from human
result of the MONERIS application for this report
FIGURE 25
activities. This portion is the natural background. SCHREIBER et al.
(2003) estimated the amount of the background emissions of the
Nitrogen
background
8
nutrients for the Danube and the sub-catchments. If this background
758kt/a N
26
point and diffuse
sources from
(for the total Danube about 61 kt/a nitrogen 6.5 kt/a phosphorus) is
settlements
27
taken into account in calculating the diffuse nutrient emissions, it is
agriculture
possible to separate the portion of the emissions from human
other diffuse
sources
activities from the total nutrient pollution.
39
After separating the nutrient pollution of the Danube into human
sources and background sources, four main sources can be identified ≠
Phosphorus
5 10
background, point sources, agricultural diffuse sources, and other
68 kt/a P
diffuse sources such as nutrient inputs from urban area and atmospheric
32
deposition by NOx. The contribution of phosphorous and nitrogen
emissions from these sources is shown in Figure 25 and Figure 26.
53
In general, the portion of point sources to the total nutrient emissions
is higher for phosphorus than for nitrogen. The share of background
contributions is higher for phosphorus than for nitrogen. That means
that the total human influence on the nutrient pollution of the Danube
is much higher for phosphorus than for nitrogen.
and Figure 27. The figures show clearly that the present state of the
The relation between different human sources/activities to the total
nutrient pollution of the Danube is due to different sources in the
emissions is important to monitor. For the Danube basin the share of
different countries. Whereas in the countries Hungary and Serbia and
the different human sources compared to the total nutrient pollution
Montenegro the N emissions from urban settlements are the dominant
is shown in Figure 25.
sources, it was found that the other diffuse N emissions mainly due to
atmospheric deposition of NOx are the dominant source for Austria
The total amount of nutrient pollution was in the period 1998 to 2000
and Bosnia i Herzegovina. For all other countries the N emissions
about 758 kt/a nitrogen and 68 kt/a phosphorus. The Figure shows
caused by agricultural activities represents the major source. For
that for both nutrients the pollution is far from the background
phosphorus, the point and diffuse emissions from urban settlements
conditions (Background: 8 % for N; 10 % for P). The portion of the
are the major source of pollution with the exception of Germany and
other sources is different for both nutrients. For nitrogen it was found
Austria where agriculture shows the largest share. This finding also
that diffuse agricultural sources are the dominant source of pollution
reflects the different state of the waste water treatment within the
(39 %) at the present time. In contrast, the dominant sources for
Danube countries. In a number of countries the share from
phosphorus are the point and diffuse emissions from urban
agricultural sources and from urban settlements is equally high (CZ,
settlements. This source contributes only 27 % of the total emissions
SK and UA). In the other DRB countries, agricultural sources for
for nitrogen. For nitrogen the pollution by other diffuse sources
P emissions rank second, with the exception of Moldova, where the
due to atmospheric deposition of NOx are also important and can
share of P from agricultural sources is higher than that for settlements
not be neglected. Due to the differences of human pressures in
(see Figure 27). Figure 28 and Figure 29 show the deviation of the
agriculture, as well as in the natural conditions, the regional
specific diffuse agricultural nutrient emissions from the average for
distribution of agricultural diffuse nutrient pollution varies
the total Danube basin for the considered sub-catchments. For
significantly.
nitrogen (average of the specific diffuse agricultural emissions is
7.2 kg/(ha∑a) agricultural area) there is a clear tendency for
The contribution of the natural background, point and diffuse
agricultural emissions to decrease from the upper part of the Danube
emissions from urban settlements, agricultural diffuse inputs
to the lower part. This means that a reduction of the agricultural
and other diffuse sources to the total N and P emissions is shown
diffuse pollution in the upper part of the Danube would lead to higher
for the areas of the countries within the Danube basin in Figure 26
effects for the Danube than in the lower part.
Characterisation of surface waters 69
Total N emissions by human sources for area of the countries within the Danube basin in the period 1998-2000
result of the MONERIS application for this report
FIGURE 26
N-emissions by sources [%]
100
100
background
90
90
other diffuse sources
80
80
agricultural sources
70
70
point and diffuse
sources from
60
60
settlements
50
50
40
40
30
30
20
20
10
10
0
0
DE
AT
CZ
SK
SI
HR
BH
CS
HU
RO
BG
MD
UA
Total
Total P emissions by human sources for area of the countries within the Danube basin in the period 1998-2000
result of the MONERIS application for this report
FIGURE 27
P-emissions by sources [%]
100
100
background
90
90
other diffuse sources
80
80
agricultural sources
70
70
point and diffuse
sources from
60
60
settlements
50
50
40
40
30
30
20
20
10
10
0
0
DE
AT
CZ
SK
SI
HR
BH
CS
HU
RO
BG
MD
UA
Total
The situation for phosphorus is somewhat different. Because erosion
land use patterns given by CORINE are for some countries much
from arable land is the main source of the agricultural diffuse
different to that of the statistical sources. This is in part due to the fact
pollution, it can be expected that sub-catchments with a high portion
that CORINE does not include a separation into used and unused
of arable land and mountainous areas have a higher emission from
agricultural area. For the phosphorus emission calculations it should
this source than the average of the Danube.
be noted that erosion into water, the main source of emissions, is
based on a raw map of the soil losses in Europe. A new soil loss map
It should be noted that the information related to agricultural diffuse
is in preparation but at present not yet available.
nutrient pollution should be treated as general estimates. This is
because there is a need to take into account the problem of the spatial
resolution of the statistical data and the incomplete harmonized data
for the land use, as well as the discrepancy of the data sources. The
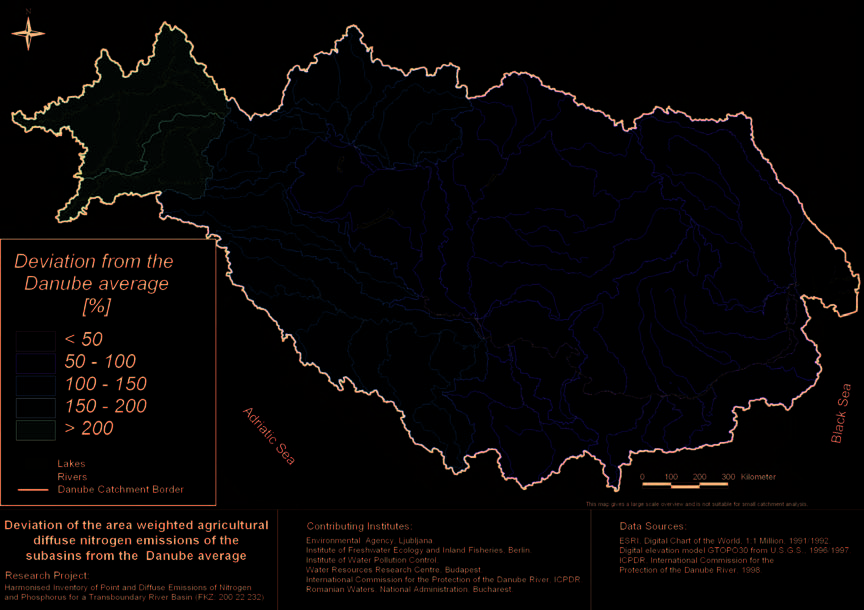
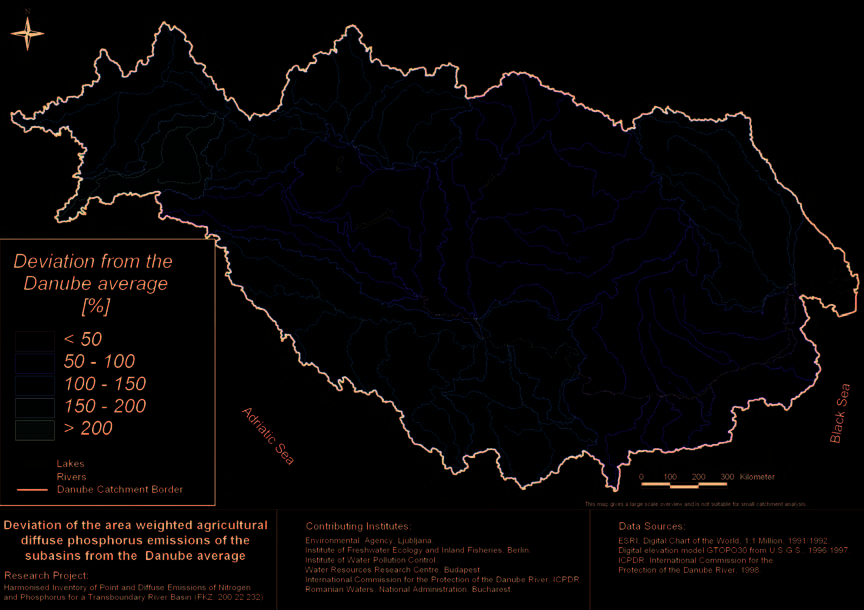
Characterisation of surface waters 70
Deviations of the specific total diffuse nitrogen pollution from agricultural activities
in the main sub-catchments of the Danube from the average for the period 1998-2000
FIGURE 28
Deviations of the specific total diffuse phosphorus pollution from agricultural activities
in the main sub-catchments of the Danube from the average for the period 1998-2000
FIGURE 29
Characterisation of surface waters 71
4.4.2.5. Historical development of the diffuse source nutrient pollution
Temporal changes of the nitrogen emissions
into the Danube River system
into the total Danube river system for the years 1955 to 2000
A historical look at the development of the Danube nutrient emissions
(see also Chapter 4.5.1.3)*
FIGURE 30
from point and diffuse sources over the last 50 years has been prepared
based on the results of the present situation, and a reconstruction by
N emissions [kt/a N]
means of the model MONERIS (SCHREIBER et al. 2005, BEHRENDT
1000
et al. 2005). Figure 30 and Figure 31 show the results.
900
800
According to Figure 30 the diffuse source pollution of nitrogen is
700
about doubled in the period in the 1950s to the mid of 1980s. In the
600
1990s this pollution is reduced by about 23 % mainly due to the
500
reduction of the land use intensities as represented by the N-surplus
400
on agricultural areas. The reduction of the nitrogen surplus is much
300
larger, especially for the countries in the middle and lower part of the
200
Danube, than the reduction of the diffuse nitrogen sources. This is due
100
to the differences in the residence time in the groundwater and the
0
different retention rates for nitrogen in the unsaturated zone and in the
1955
1960
1965
1970
1975
1980
1985
1990
1995
2000
groundwater. The large residence times in the groundwater are
point source discharges
responsible for the fact that a further reduction of the diffuse nitrogen
diffuse source emissions
emissions can be assumed in the next years if the N-surplus will
remain on the present level.
* result of the MONERIS application for this report
The present level of the diffuse nitrogen emissions into the Danube
river system is about 1.8 times higher than in the 1950s. One reason
for the change of the total nitrogen emissions is the change of the
Temporal changes of the phosphorus emissions
point source discharges. The increase from the 1950s to the end of the
into the total Danube river system for the years 1955 to 2000
1980s is approximately a factor 5 and the decrease within the 1990s
(see also Chapter 4.5.1.3); *
FIGURE 31
is about 20 %. This is due to a decrease in the number of industrial
discharges in the lower Danube countries after the political changes
P emissions [kt/a P]
and substantial improvement of waste water treatment especially in
120
Germany and Austria.
110
100
For total N-emissions, it was found that the present state is a factor
90
of 1.8 higher than in the 1950s but about 23 % lower than in the late
80
1980s.
70
60
50
40
30
20
10
0
1955
1960
1965
1970
1975
1980
1985
1990
1995
2000
point source discharges
diffuse source emissions
* result of the MONERIS application for this report
Characterisation of surface waters 72
For phosphorus the changes in the amount of diffuse source pollution
4.4.3. Other significant diffuse source pollution
is much lower than for nitrogen. This is because, other pathways
Diffuse pollution results from broad-scale activities linked to the
(erosion and surface runoff) are more responsible for the diffuse
land use itself, and the land use intensities in both the urban and rural
P emissions into the river system. In addition, the main indicators for
environments. This includes, for example, the application of fertiliser,
the diffuse P emissions as a portion of arable land were changed in
forestry, inappropriate cultivation which can cause problems by
the past to a lesser extent than the N-surplus.
increasing soil erosion on the effected land, livestock units on
pastureland; handling and transport of oil, chemicals, raw materials
Further it should be noted that important pa-rameters for changes of
and products, run-off from impermeable surfaces of roads, and urban
diffuse P emissions by erosion over time, such as the change of the
and industrial areas. Industrial activities may generate diffuse
field size in the different regions of the Danube basin, are not
pollution including oils and hydrocarbons, sediment, phosphorus,
available up to now.
iron, acidifying pollutants through atmospheric emissions, and chemi-
cals such as solvents. Dispersed settlements and atmospheric
If these uncertainties in the database and for the modelling are taken
depositions (mostly caused by transport and traffic) also fall into the
into account, the present level of diffuse P emissions into the Danube
category of diffuse pollution.
river system is probably more than 20 % above the level of the 1950s.
The disposal of waste heat from industry or power generation
Changes in the amount of point source discharges of phosphorous
processes can cause deterioration of water quality or alterations of the
are much higher than for the diffuse sources. For P, an increase by a
sedimentary environment and water clarity. These can lead to
factor of 4.6 was estimated from the 1950s to 1990.
increased growth of microalgae and other nuisance flora.
This development in the amounts of P from point sources is the result
Water pollution from navigation is linked to several diffuse sources.
of two overlapping effects ≠ increase of the use of P in detergents and
These include poorly flushed waterways, boat maintenance, discharge
an increase in connection of population to sewers and WWTPs. The
of sewage from boats, storm water runoff from parking lots, and the
de-crease of the point P emissions is due to the replacement of P in
physical alteration of shoreline, wetlands, and aquatic habitat during
detergents to a high proportion and the increase of P elimination in
construction and operation. A significant amount of solvent, paint,
WWTPs. The consequence is that the reduction of point P emissions
oil, and other pollutants potentially can seep into the groundwater or
is more than 50 %. The present level in the upper Danube is already
be washed directly into surface water. Many boat cleaners contain
in the range of the 1950s. The change of the total P emissions is
chlorine, ammonia, and phosphates ≠ substance that can harm
larger than for nitrogen. A reduction of about 40 % during the 1990s
plankton and fish. Small amounts of oil released from motors and
was estimated and the present level of the total P emissions is a factor
during refuelling activities contain petroleum hydrocarbons that tend
1.6 higher than in the 1950s. The reconstruction of the historical
to attach to waterborne sediments. These persist in aquatic
changes of the sources of nutrient pollution in the Danube shows that
ecosystems and harm the bottom-dwelling organisms that are at the
in the last decade a substantial reduction of nutrient pollution was
base of the aquatic food chain. The discharge of sewage and waste
reached in the Danube.
from boats can degrade water quality.
Article 16 WFD sets out a strategy against the pollution of water and
outlines the steps to be taken. WFD Annex 10 specifies 33 priority
substances, which need to be taken into account when assessing the
chemical status of surface waters. One third of these are pesticides.
The WFD requests that the priority hazardous substances are phased
out in the next 20 years after adoption of appropriate measures. The
Directive also requests to identify additional chemical pollutants if
they are of specific concern in the river basin district. For the Danube
River Basin District the following four heavy metals have been
identified in addition to the 33: Arsenic, Chromium, Copper and Zinc.
Characterisation of surface waters 73
Additional pesticides that need special attention are mentioned in
Unfortunately, comparable data is not available for the whole Danube
the following EU legislation:
River Basin District, but FAOSTAT provides data for the CEE
≠ POPs Convention26:
countries. The data of FAOSTAT shows a strong decline in pesticide
aims at the elimination or restriction of persistent organic pollutants (POPs),
use in the CEE countries to about 40 % of 1989 levels. This compares
≠ EU Authorisation under Directive 91/414/EEC27 and 79/117/EEC28:
with a relatively small decrease in EU Member States during the
only 2 of the Danube priority pesticides are fully registered in the European
same period. There are indications, however, that the use of pesticides
Union and listed in Annex I of Council Directive 91/414/EC. For three of the
in the CEE region is increasing again. Of concern is especially the
priority pesticides, registration will expire or has already expired and seven
fact that the expected economic development in the region may lead
are still in the re-authorisation process. According to Directive 79/117, use
to a further increase of pesticide use.
of two of the priority pesticides is banned in the EU.
Table 29 presents a summary of the national pesticide consumption
4.4.3.1. Analysis of priority pesticides used in the Danube River Basin
according to the FAO statistics for seven of the Danube countries.
District
The FAO database does not include data for the other Danube
The use of pesticides has declined significantly in most of the
countries. The table shows that the total use of pesticides varies
countries of the DRB since the political changes and the sector
between 0.5 and 3.8 kg/ha agricultural area, and that, in general,
reforms of the early 1990s. These have disrupted the process of
herbicides are used most followed by fungicides and bactericides.
modernisation, specialisation and intensification of agricultural
A harmonised overview on pesticide consumption for all Danube
production.
countries is not possible at present.
Consumption of pesticides (in t/a)
in some Danube countries and specific pesticide consumption (kg per ha agricultural area and year) in the year 2001*
TABLE 28
DE
AT
CZ
SK
HU
SI
RO
Pesticide category
t/a
t/a
t/a
t/a
t/a
t/a
t/a
Fungicides and bactericides
7,912
1,336
1,050
537
1,637
921
2,802
Herbicides
14,942
1,436
2,590
2,136
3,149
362
3,960
Inorganics
1,959
99
272
0
684
504
0
Insecticides
1,255
0
157
175
298
81
1,110
Rodenticides
80
1
162
34
20
19
0
Total
26,148
2,872
4,231
2,882
5,788
1,887
7,872
Pesticide consumption
kg/ha∑a
kg/ha∑a
kg/ha∑a
kg/ha∑a
kg/ha∑a
kg/ha∑a
kg/ha∑a
Specific pesticide consumption
per ha agricultural area and year
1.53
0.82
0.99
1.18
0.94
3.77
0.53
* according to the FAO database on agriculture
26 Stockholm Convention on persistent organic pollutants (POPs Convention).
27 Council Directive 91/414/EEC of 15 July 1991 concerning the placing of plant protection products on the market, OJ 1991 L 230/1.
28 Council Directive 79/117/EEC of 21 December 1978 prohibiting the placing on the market and use of plant protection products containing certain active
substances, OJ 1979 L 33/36.
Characterisation of surface waters 74
An additional source of information on pesticide use within the
sphere as well as on the ecology and the ecological status of the
Danube countries is the report "Inventory of Agricultural Pesticide
ecosystem. The evaluation of hydromorphological alterations in
Use in the DRB Countries"29. The data collected presents a picture of
combination with biological assessment is a new territory for the
the situation at the national level for eight countries (CZ, SK, HU,
Danube River Basin countries as it is for many countries in Europe.
HR, BA, CS, MD and UA). An analysis has shown that 29 priority
In the past decades, biological monitoring of rivers in the Danube
chemicals are used in the Danube River Basin in pesticide products.
River Basin has focused mainly on detection of effects due to organic
Of these only three priority pesticides are authorized for use in all of
pollution (often referred to as "classical" biological water quality
the DRB countries, while seven priority pesticides are not authorized
monitoring). Although information on hydrology and morphology has
in any of the countries.
been recorded in many countries (e.g. Romanian Water Cadastres,
German LAWA `Strukturg¸tekarte'), interrelationship between
Although pesticide use is currently relatively low in the DRB
hydromorphological alterations and ecological status of rivers was
countries the risks of pesticide pollution remains:
hardly considered. Being an innovative subject, only a few countries
≠ Priority pesticides, as well as other pesticides, are frequently detected in
have already developed systems / criteria to integrate hydromorpho-
surface water and groundwater in the DRB and pose a serious hazard to the
logical alterations into the ecological assessment (see national
environment and human health.
reports). Therefore, this chapter deals primarily with the abiotic/phys-
≠ Seven priority pesticides are not authorised in the Danube countries; some of
ical effects of hydromorphological alterations whereas Chapter 4.5.1.4
them continue to be of concern because of the existence of old stockpiles and
focusses on the biological and ecological impacts. Nonetheless, the
residues in soils and sediments.
separation of the two is not always easy so that some overlap is
≠ The uncontrolled and illegal trade of pesticide products lead to the use of
unavoidable.
banned pesticides (e.g. DDT) by farmers.
Three main hydromorphological driving forces have been determined
An overall estimation of pesticide use in the Danube catchment is not
as most relevant on the basin-wide scale: hydropower generation,
possible. Detailed information is given in the national reports of the
flood defence and navigation. Gravel and water abstraction as well as
countries.
outdoor recreation activities and fisheries have been identified as
being of minor or local importance.
4.4.4. Significant hydromorphological alterations
Map 7 presents information on dams (for hydropower generation as
According to Annex II, 1.4 WFD the Members States are requested
well as water abstraction purposes), flood defence/river regulation
to carry out an:
and navigation for the Danube and the main tributaries. The specific
≠ "Estimation and identification of significant water abstraction for urban,
details may be found in Annex 5 on the
industrial, agricultural and other uses,
≠ free flowing sections,
≠ Estimation and identification of the impact of significant flow regulation,
≠ length of impounded sections and associated dams (especially of hydropower
including water transfer and diversion, on overall flow characteristics and
plants),
water balances, [and]
≠ strongly regulated sections characterised by artificial banks and/or dikes
≠ Identification of significant morphological alterations to water bodies."
along the main river,
≠ navigable sections and harbours.
These three categories of hydrological and morphological alterations
are strongly interrelated and have therefore been summarised as
The following descriptions provide an overview of the main
"hydromorphological alterations" in the context of this report.
hydromorphological alterations displayed in Map 7. Morphological
alterations are often undertaken for more than one use and often
In addition, the separation of the pressures and the impacts resulting
overlap with each other (e.g. river canalisation for flood protection
from hydromorphological alterations poses difficulties. Physical
and navigation). At present overall quantitative information on single
alterations of the environment may have severe impacts on the abiotic
pressures related to the driving forces is not available.
Danube River Basin District ≠ Major Hydraulic Structures
MAP 7
29 UNDP/GEF (2004).
Characterisation of surface waters 75
4.4.4.1. Hydropower generation
What major effects hydropower dams can have is illustrated on the
The major pressures of basin-wide importance resulting from
special case of Iron Gates I and II (see textbox page 76).
hydropower use are
≠ disruption of the longitudinal river continuity by artificial in-channel
Hydromorphological effects as described for the Iron Gate case study
structures,
can also be seen on other large hydropower dams such as Gabcikovo
≠ alteration of the hydraulic characteristics.
Hydropower Plant. The impacts on the aquatic environment of these
dams on the Middle and Lower Danube are described in Chapter 4.5.1.4.
Other important pressures30 are
≠ other alteration of the river course and channel form,
In total, the Danube is impounded on approximately 30 % of its
≠ disruptions of lateral connectivity,
length. The above mentioned chain of hydropower plants in Austria
≠ alteration of the hydrological (discharge) regime,
and Germany as well as the Iron Gate section are provisionally
≠ possible effects on drinking water supply due to sedimentation processes.
identified Heavily Modified Water Bodies, because the water body
shows "substantial change in character", which is widespread,
The interruption of the longitudinal continuum occurs as a
permanent and affecting both hydrological and morphological
consequence of the existence of several chains of hydropower plants
characteristics (for details Chapter 4.6).
in the Danube itself and along many tributaries. Over 700 large dams
/ weirs exist on the DRB main tributaries. A large number of these
Chains of hydropower dams are also present in the main tributaries of
dams and weirs impound the rivers on which they are built. Impound-
the Upper Danube, which originate in mountainous areas, such as
ments change hydromorphological conditions by modifying water
Iller, Lech, Isar, Inn, Salzach and Enns. River Lech for example, is
depth and river width, changing flow characteristics (reducing flow
impounded on over 90 % of its length by 32 dams. 29 out of these
velocity) and interrupting natural sediment transport as well as the
operate by hydropeaking, an operating mode used at various
migration way of biota (see Chapter 4.5.1.4). Not all of the dams
impounded mountainous tributaries (e.g. Inn, Salzach, Enns).
displayed in the map are constructed for hydropower generation,
Hydropeaking and pulse release cause special problems. Water from
some of them are built for water abstraction, e.g. on the Danube
different smaller brooks or tributaries is often diverted through
downstream Budapest or the Cunovo weir, which diverts water to the
pipelines into large reservoirs, leading to residual flow and droughts
Gabcikovo hydropower plant. The upper part of the Danube was ideal
in river beds. Water is then released by pulses several times per day
for building hydropower plants that operate in running mode due to
resulting in non-natural water level fluctuations. On the Danube such
advantageous slope conditions ranging between > 1 and 0.4 .
fluctuations can be observed approximately down to Melk. Tributaries
In the first approximately 1000 rkm ≠ from the source down to
in the middle and lower DRB with steeper gradients such as the
Gabcikovo ≠ 59 dams are present, many of them built decades ago. In
Mura, upper parts of the Sava and Drava, Olt, Arges and Bistrita are
this section, the Danube is interrupted by a dam and accompanying
also influenced by numerous hydropower dams built on these rivers.
impoundment on average every 16 km. Only very few stretches can
The Olt, for example, is impounded by a chain of 24 hydropower
still be characterised as free-flowing. These sections are Vohburg-
dams over the last 307 km of its total length of 615 km.
Weltenburg and Straubing-Vilshofen in Germany, and Wachau and
Vienna-Bratislava in Austria.
Downstream of Bratislava three more hydropower plants exist,
which interrupt the free-flowing conditions. The first of these, the
Gabcikovo dam system, operating since 1992, diverts approximately
80 % of the Danube river water into a side-canal and the reservoir.
The remaining 40 km of the original river bed are affected by a
lack of water. The diversion and the flood protection works
affect the surrounding wetlands on both sides of the Danube (see
Chapter 4.5.1.4).
30 Information on major pressures due to MOOG & STUBAUER (2003).
Characterisation of surface waters 76
Pressures from hydromorphological alterations Case study: Iron Gates I and II on the Danube River
History of the modifications:
Iron Gate I and II, located in the transboundary area of Romania and Serbia and Montenegro, impound the Danube up to Novi Sad.
The Iron Gate I dam was completed in 1972. The hydropower plant (HPP) operation regime is adjusted to the hydraulic/hydrologic
conditions on the mouth of the Nera river (rkm 1,075) at the end of the common part of the Danube. The HPP operates as run-off-
river, covering peak demands, which is enabled by the Iron Gate II reservoir (completed in 1985). The operating rules of the HPP
were gradually changed from the initial phase (impoundment up to 7,500 m3/s) to the present (impoundment up to 11,500 m3/s).
Geography and hydrology:
Reservoirs have variable height of water levels and extent of backwater zone that depend on the inflow and the power-plant
operation. At low flow the backwater zone extends up to the Danube River for 310 km (up to Novi Sad), into the Sava River (100 km)
and the Tisza River (60 km), and many small tributaries. At high flow the backwater zone extends to rkm 1,075. The average volume
is 3.5 109 m3, and the surface area of the reservoir is on average 330 km2. The Iron Gate II reservoir is 80 km long; the average
volume is 0.8 109 m3, and its area is 79 km2. The average annual discharge is 5,550 m3/s for both dams. There are two distinct
parts of the Iron Gate reservoir: the lowland areas upstream of the mouth of the Nera river (rkm 1,075), and the downstream reach
in the Iron Gate Gorge. The latter part has a very rich archaeological, historical and tourist potential, and the Nature Park Iron
Gates was established to protect its special natural habitat.
Important uses:
≠ Hydropower: Iron Gate I is the most important hydropower plant (HPP) on the Danube River, with installed power 2 x 1,050 MW,
and average energy output 2 x 5,250 GWh/year. The characteristics of the Iron Gate II HPP are 2 x 270MW and 2 x 1,320
GWh/year, respectively.
≠ Navigation: Navigable conditions on the formerly very dangerous Djerdap section of the Danube are completely improved,
and navigation is possible all over the year. From Belgrade (rkm 1,170) to the Iron Gate II (rkm 863), the Danube is a VII class
waterway according to the ECE classification (ECE/TRANS/SC.3/131), while upstream it is a VIa class waterway.
Significant physical alterations constructed to serve the uses of water at the Iron Gate I and II dams:
≠ The Iron Gate I dam consists of two symmetrical parts, each comprising a navigation lock, earthen non-overflow dam, a
hydropower plant (with 6 turbines) and concrete gravity overflow dam (14 spillways, each 25 m wide, with double table-gates,
enabling evacuation of a 1,000 year flood). The dam is 60 m high and 1,278 m long. The hydropower plant (HPP) head is
21-35 m, with an installed capacity of 8,700 m3/s.
≠ The Iron Gate II system consists of two dams: one on the main Danube channel (30 m high, 1,003 m long, with concrete overflow
part, HPP plants and CS navigation lock) and one on the Gogos branch (with overflow dam and HPP). The hydropower plants are
equipped with 20 turbines. The HPP head varies from 5 to 12.75 m, according to the river flow.
Significant changes linked to the physical alterations:
≠ Changed hydromorphological conditions. The Iron Gate I reservoir provides a daily and sometimes weekly flow regulation. Water
velocities are considerably reduced in comparison to the natural river regime. The low water level is elevated 33 m at the dam,
and 2.5 m about 230 km upstream (near Belgrade). The high water level is 19 m higher at the dam, while 132 km upstream it is
nearly the same as natural.
≠ Reduced sediment transport capacity, followed by sediment deposition, which mostly occurs between the Iron Gate I dam and km
1,075 (in the CS-RO part of the reservoir). Particularly intense sedimentation is present in one part of the gorge (between km
970 and km 1,003). Deposits are composed of fine silt and sand, covering the rocky riverbed and former floodplains. Sediment
deposition induced the gradual increase of high water levels upstream, reducing the safety of the existing flood protection
system.
≠ Raised ground water table in the lowlands of the Serbian territory, which endangers many settlements, industrial, municipal and
transportation facilities, as well as the agricultural production in the riparian belt.
≠ Increased forming of ice and decreased ice transport capacity in the upstream parts of the Iron Gate I reservoir.
Characterisation of surface waters 77
Dams and weirs have an important effect on natural sediment
were already built in the 16th century, but were intensified in the 19th
transport. Studies in Germany have shown, that a former load of
and 20th century. The former extensive floodplains with numerous
180 000 tons per year from the River Lech into the Danube decreased
side arms and backwaters were largely altered into canalised and
to nearly zero by 1960. The same can be said for River Inn, where a
straightened waterways with distinct river bank reinforcement. As a
former 540 000 t/a of sediment transport was decreased to 180 000 t/a
consequence, today only less than 19 % of the former flood plains in
by 1960 and is today nearly zero31. Interruption of sediment transport
the Danube basin, compared to the situation 150 years ago, remain.
has two important effects. Upstream of a dam the sediment is retained
The area of floodplain affected by river regulation/flood defence is
and often has to be extracted or flushed out during floods to maintain
large ≠ in Hungary for instance 2.12 million ha were diked.
river depth for hydropower generation and navigation. For example,
gravel extraction of approximately 15 000 m3/a is necessary on the
These facts point out the basin-wide importance of river regulation
River Traun on the impounded section of Abwinden≠Asten in Austria,
works and flood defence measures. The major pressures resulting
which acts as a sediment trap32. In the backwater zone of the Iron
from flood defence are "alteration of the river course and channel
Gate, 325 million tons of sediment accumulated between 1972 and
form/profile", "flood defence dams, set-back embankments, dykes",
1994, and fill 10 % of the entire reservoir capacity.
"alteration of the hydrological/hydraulic characteristics" and
"alteration of the bank vegetation and banktop land use". Compared
Downstream of dams the loss of sediment transport requires artificial
to pressures resulting from hydropower generation, where the
donation of material to stabilise the river bed and to prevent incision.
disruption of the longitudinal continuity is most important, flood
This is the case downstream of the Freudenau dam where addition of
defence measures affect mainly the lateral connectivity.
160 000 m3 bed load per year is required33. Immediately downstream
of the Iron Gate Dams, incision of the riverbed is monitored, as a
In the upper part of the Danube in particular, river regulation works
result of change of flow and sediment regime. The overall reduction
for flood defence often go hand in hand with alterations due to
of sediment transported by the Danube over long-term leads to
impoundments. The effects of these alterations on the river overlap
intensive erosion on unregulated banks and islands in the Lower
with one another. For example, on the rivers Inn, Salzach and Enns
Danube region, e.g. Tcibtriza-Island, Belene Island, Garla Mare,
chains of hydropower plants are built and almost the entire river
Calafatul Mic or Cama-Dinu. Increasing coastal erosion along the
stretches are strongly regulated. On the Inn, for example, less than
244 km stretch of the Romanian seashore between Musura arm and
20 % can still be classified as free-flowing which means not
Vama Veche, an area which represents 6 % of the total Black Sea
impounded or not strongly regulated.
seashore, is also partly caused by reduced sediment transport by the
Danube. Recent measurements (1980 - 2003) of erosion processes at
The Danube itself is regulated along over 80 % of its length. Due to
the sea-land interface have indicated that erosion is more accentuated
hydraulic works aimed at navigation improvement oxbows have been
in the northern area of the seashore (Sulina ≠ Vadu).
locked or filled up, and major floodplain complexes separated from
the natural hydrological conditions of the Danube. Discontinuity
4.4.4.2. Flood defence measures
between the river and its accompanying floodplains reduces the
Most of the larger rivers in densely populated areas are characterised
hydrological connectivity leading to changes in frequency and
by anthropogenic modifications for flood protection and to secure
duration of floods and degradation of the former floodplains. The
land for urban development. In many cases, hydro-engineering
examples for loss of flood plains are manifold. In the 19th and 20th
structures have multiple purposes often resulting in changes of the
century, altogether 15-20,000 km2 of the Danube floodplains were cut
river character, e.g. straightening of a meandering or anabranching
off from the river by engineering works34. On the Tisza River
river. These changes affect not only the river itself but larger areas of
drainage projects reduced a formerly large floodplain to a very
the valley floor.
narrow one, resulting in an 84 % loss, from 7542 km2 to 1215 km2.
The meandering river bed was shortened by 32 % by river regulation
Major systematic regulations for flood defence and navigation
works. Today, the Tisza can be classified as strongly regulated along
purposes began in Austria in the 19th century. On the present
more than 70 % of the total river length.
territories of Hungary, Serbia and Montenegro, Bulgaria and
Romania first dike systems for flood protection along the Danube
31 BANNING (1998).
32 SCHIMPF & HARREITER (2001).
33 SCHIMPF & HARREITER (2001).
34 KONOLD & SCHÐTZ (1996).
Characterisation of surface waters 78
In the Sava River area, in particular in the area of the Nature Park
(115 km in Hungary) and Bega (117 km in Romania and Serbia and
Lonjsko Polje, there is an example of possible co-existence between
Montenegro, which is over 48 % of the total river length). On Sava,
the complex solution of flood control and conservation of natural,
navigation is possible on over 50 % of the river starting from Croatia
landscape and cultural values of national and international
down to the mouth in Serbia and Montenegro.
importance.
Additional artificial waterways were built along the Danube for
In the Danube Delta, more than 100,000 ha (most of them
transport purposes. These include the Main-Danube Canal in
temporarily flooded areas) were embanked. It must be noted that
Germany providing a link to the Rhine and the North Sea, the
between 1994 and 2003 about 15 % of the area with embankments
Danube-Tisza-Danube Canal System in Serbia and Montenegro,
have been re-connected to the natural influence of water, through
and the Danube-Black Sea Canal in Romania. A detailed description
ecological restoration works. In the Razim-Sinoe system coastal area,
of these waterways is given in Chapter 3.6.
an amount of 23,500 ha have been embanked. The separation of the
main river from the backwaters results in a loss of habitats, which
The (hydro)morphological alterations constructed for navigation
affects the aquatic fauna and flora (see Chapter 4.5.1.4).
purposes are manifold and often overlap with changes from hydro-
power impoundments and flood protection. These include building
Large dikes and disconnected meanders and side-arms also reduce the
weirs with sluices, regulation, canalisation and bed stabilisation.
dynamics of the groundwater by suppressing the exchange of surface
Unfortunately detailed quantitative information about pressures
and groundwater. This is important for re-newing river bank filtrate
resulting from navigation in the DRB is currently not available.
used for drinking water supply.
One of the main pressures resulting from navigation is the effects
4.4.4.3. Navigation
related to channel maintenance. Sediment excavation and flushing of
Navigation routes in the DRB are restricted to the Danube itself and
areas is undertaken where sediment accumulates and hampers naviga-
the lower portions of some tributaries (see Map 7). Regulation works
tion. Studies have shown that on the Austrian Danube, up to 60 % of
for navigation in the Upper Danube region started already in the 19th
the river bed deepening in several sections downstream Vienna was
century and led to a straightening and shortening of the main Danube
caused by increased regulation and dredging activities for securing
bed and creation of one main channel for navigation. In Lower
waterway transport37. Yet, a recent ruling by the Austrian Supreme
Austria for instance, lateral dams were built between 1898 and 1927
Water Authority only permits dredging in the Danube, if no more than
to narrow the river width. In Hungary, the Danube was shorted by
50 % of the dredged material is used for structural measures on the
cutting-off meanders from 472 km to 417 km.35
river banks and the rest of the material is deposited in the river such
that it can be continuously mobilised by the flow of the river.
At present the Danube is navigable from Ulm down to the Danube
Delta. From Kehlheim (rkm 2411) to the Delta the Danube serves
In the lower Danube region, lateral river bed erosion dislocates the
as an international waterway. These 2411 km are equivalent to 87 %
navigation channel in the Danube. Additional river training works as
of the Danube's length. 78 harbours36 are located on the Danube
well as dredging of shallow fords to maintain the minimum shipping
between Kelheim and the Black Sea. Therefore, navigation is of
depth are carried out. In the Danube delta, dredging is also an
multilateral importance.
important problem. Already at the beginning of the 20th century, but
especially in the last decades canals were dredged in the interior of
In the upper part of the DRB, navigable tributaries are Morava
the Delta. The total length of artificial water channels in the Delta
(about 30 % of its total length), Raba (29 km at the mouth) and
created by dredging amounts to over 1,700 km, which is as much as
V·h (71 km, equals 20 % of the river length). The Drava is navigable
the total length of natural water courses.
on approximately 20 % of its length. The Tisza River is used as a
waterway from the Ukrainian-Hungarian border to the confluence
Other pressures related to navigation are e.g. alterations of the
with the Danube, which is over 70 % of the total river length.
river course or disruption of the lateral connectivity by detaching
Some Tisza tributaries are navigable on shorter sections: Bodrog
side arms, tributaries and wetlands, have been described earlier.
(Hungarian stretch and 15 km in the Slovak Republic), Mures
Environmental impacts resulting from navigation are mentioned in
(25 km, which corresponds to less than 5 % of its total length), Kˆrˆs
Chapter 4.5.1.4.
35 IHD (1986).
36 via donau (2004).
37 BERNHART et al. (1987).
Characterisation of surface waters 79
4.4.4.4. Water transfer and diversion
have a negative impact on the Danube since they are affecting the
Water transfer and diversion is generally an issue of local or regional
last free-flowing sections.
importance and dealt with in the national reports (Part B). Nonetheless,
it should be mentioned that in one case water is diverted from the
The pressures and impacts that result from all these envisaged
Danube basin into another river basin (district). Through the Main-
projects are similar to those described in Chapters 4.4.4.1, 4.4.4.2 and
Danube-Canal water is abstracted from the Bavarian part of the Danube
4.4.4.3). In addition to these severe ecological impacts (including the
River at Kehlheim and diverted to the Rhine River Basin (see Map 7).
effects on drinking water supplies) from these future hydro-
engineering projects, other pressures are likely to increase as well,
Background information: In Bavaria, the water resources are subject
e.g. the pollution loads from navigation (e.g. oil spills, antifouling
to highly varied conditions. Whereas Southern Bavaria is rich in water
agents, etc.) are likely to increase as well due to the significant
due to his high precipitation, water is short in supply in large parts of
increasing of shipping.
Northern Bavaria (Franconia). At times of low discharge, there is
three times more water available per inhabitant in the Danube region
Although, to date, it is not possible to quantify the overall pressures
in comparison to the Main region. For this reason, a supra-regional
and impacts of these projects, it is possible that the implementation
compensation system has been created between Southern and Northern
of projects will lead to a deterioration of the current status of the
Bavaria, i.e. between the Danube and the Main region. Depending
water bodies affected. Hence, these projects fall under Article 4,
on the needs and the discharge of the Danube up to 20 m3/s or
Paragraph 1 (a). In order to respect the requirements of the Water
125 Mio m3/year are transferred to the Main i.e. Rhine river basin.
Framework Directive, such projects must fulfil the conditions set out
in Article 4, in particular the provisions for new modifications
With the transfer, the following principal objectives are achieved:
specified in Article 4, Paragraph 7 which require that:
≠ improvement in the quality of the water at times of low discharge,
"(a) all practicable steps are taken to mitigate the adverse impact on the
≠ compensation for evaporation losses caused by the operation of the thermal
status of the body of water;
power stations,
(b) the reasons for those modifications or alterations are specifically set out
≠ reduction in the number of floods in the valley of the middle Altm¸hl in
and explained in the river basin management plan required under
summer.
Article 13 and the objectives are reviewed every six years;
(c) the reasons for those modifications or alterations are of overriding public
The water is transfered via two separate routes:
interest and/or the benefits to the environment and to society of achieving
≠ water from the Danube is pumped to Lake Rothsee via the Main-Danube-
the objectives set out in paragraph 1 are outweighed by the benefits of
Canal, from where it is distributed as the need arises,
the new modifications or alterations to human health, to the maintenance
≠ water from the Altm¸hl is collected in Lake Altm¸hlsee, then transferred to
of human safety or to sustainable development, and
Lake Brombachsee and used in times of water shortage.
(d) the beneficial objectives served by those modifications or alterations of the
water body cannot for reasons of technical feasibility or disproportionate
4.4.4.5. Future infrastructure projects
cost be achieved by other means, which are a significantly better
In addition to the significant degradation of the Danube and its
environmental option."
tributaries caused by existing hydromorpological alterations, a
considerable number of projects on navigation, hydropower and flood
In addition, the effects of these modifications on other water bodies
defenses are at different stages of planning and preparation. A
should be avoided (cf. Article 4 (8)).
non-exhaustive list of such future projects is enclosed in Annex 6.
In consequence, these future projects must be subject to an
One prominent set of projects with Danube-wide importance are
Environmental Impact Assessment and/or a Strategic Environment
included in the Trans-European Networks (TENs) agreed by the
Assessment during the planning phase which takes account of the
European Union38. The projects related to the Danube aim at reducing
pressures and impacts to the aquatic environment and ensures that
the "bottlenecks" in the Danube, in order to increase capacity of
the above-mentioned conditions are met. If these assessment cannot
navigation and thereby shifting transport from the roads to the
justify the use of the derogations introduced in the WFD, these
waterways. Whilst this certainly has a favourable impact on the
projects would result in breaching the objectives of the Directive.
reduction of greenhouse gases from transport, these projects may
Hence, all the stretches for which such projects are envisaged (based
38 Decision No 884/2004/EC of the European Parliament and of the Council of 29 April 2004 amending Decision No 1692/96/EC on Community guidelines for the
development of the trans-European transport network (Text with EEA relevance), OJ 2004 L 167/1.
Characterisation of surface waters 80
on list in Annex 6), the current analysis must identify them as being "at
The procedures for the AEWS operation are described in the
risk of failing the objectives of the Water Framework Directive"
International Operation Manual, which is translated into the national
unless it can be demonstrated that there is no deterioration of status.
languages of the Danube countries. Satellite communication with
Information Processing System and faxes were established with the
Depending on the scale of the above-mentioned project, it is possible
support of the Phare programme and are used for the fast
that significant transboundary effects will occur. The International
transmission of the messages. The Expert Unit uses the database of
Commission for the Protection of the Danube River should be used
dangerous substances to evaluate the possible impact to the
by the Danube countries as a platform to facilitate and promote infor-
environment and the Danube Basin Alarm Model to assess and
mation exchange and transparency with regard to the possible
forecast the transfer of pollutants in the river network.
transboundary impacts of projects, plans and programmes affecting
the aquatic ecosystem, and thereby also contributing to commitments
AEWS operation
under the Espoo Convention39.
The Danube AEWS is activated in the event of transboundary water
pollution danger or if warning threshold levels are exceeded (see
4.4.5. Other significant anthropogenic pressures
Annex 7). The AEWS operation has been tested many times during
4.4.5.1. Accident Pollution
various Danube alerts. Since the official start of its operation in May
To prevent the surface waters from pollution caused by accidents it is
1997, 37 accidents were registered by AEWS until December 2003.
necessary to establish an efficient basin-wide warning system and to
The most frequent pollutant was oil in 48.6 % of cases. The cause of
adopt the appropriate precautionary measures to minimize the risk
an accident was identified only in 12 cases. A significant proof of the
from accident pollution. In the past the ICPDR put strong efforts to
efficiency of AEWS was done during the Baia Mare and Baia Borsa
the sector of accident prevention and control by establishing an
spill accidents on the Tisa River in January and March 2000. A sound
Accident Emergency Warning System as well as by developing the
operation of the system enabled timely activation of measures
effective accident prevention policy.
preventing larger damages of the Tisa River ecosystem.
Accident Emergency Warning System (AEWS) of the Danube River Basin
AEWS development
The need for an accident emergency warning system is recognized in
A substantial upgrade of AEWS is being carried out to make the
Article 16 of the Convention on Cooperation for Protection and
whole system more effective and cost-efficient. The satellite-based
Sustainable Use of the Danube River. The general objective of the
communication is being replaced by a web-based communication
system is to increase public safety and protect the environment in the
using Internet and SMS messages to be an integral part of the ICPDR
case of an accidental pollution by providing early information for
information system (Danubis). Simultaneously, the AEWS supporting
affected riparian countries. The first stage of the Danube AEWS came
tools (Danube Basin Alarm Model and database of dangerous
into operation in April 1997 in Austria, Bulgaria, Czech Republic,
substances) are continuously improved. Importance is given to regular
Croatia, Germany, Hungary, Romania, Slovak Republic and Slovenia.
trainings and experience exchange of the PIAC's staff to support the
Ukraine and Moldova entered the system in 1999; Bosnia i Herzegov-
proper operation of the AEWS.
ina, and Serbia and Montenegro are joining at present.
At present, the system deals only with accident spills but it is planned
AEWS system set-up and tools
to extend the system activities in the future to ice and flood warning.
In the participating countries so-called Principal International Alert
Centres (PIACs) have been established. The main function of these
ICPDR Accident Prevention
centres is to propagate the warning message at the international level.
The environmental disasters caused by the cyanide accident in the
Tisa River Basin on 30 January 2000 proved that inadequate
Each PIAC has three basic units:
precautionary measures at Accident Risk Spots (ARS) could lead to
≠ the Communication Unit, which sends and receives warning messages,
massive harmful effects to humans as well as to the environment.
≠ the Expert Unit, which evaluates the possible transboundary impact of an
Consequences of such events lead to significant economic impacts on
accident,
entire regions. The lessons learned out of the cyanide spill are that the
≠ the Decision Unit, which decides about international warnings.
ICPDR has to pay attention to a better prevention as well as to a
PIACs have 24-hour attendance at the communication unit.
better preparedness for such accidental events.
39 Convention on environmental impact assessment in a transboundary context (ESPOO-Convention).
Characterisation of surface waters 81
Therefore, the prevention activities of the ICPDR are focussed to
following key elements:
1. To identify the ARS in the Danube River Basin
2. To establish the respective safety measures minimizing the risk potential.
The general structure of this strategy is demonstrated below:
ICPDR ACCIDENT PREVENTION
ARS-Inventory
Safety Measures
Industrial Sites
Contaminated Sites
Recommendations
Checklists
WRI-Methology
M1-Methology
Basic Safety Requirements
CS
Safety against Floods
Industrial ARS
Safety of CS
ARS-Inventory
posing an additional threat to the environment. Therefore, in addition
The ARS Inventory is subdivided into two main parts:
to the ARS Inventory based on ongoing industrial activities it was de-
1. Industrial Sites (ongoing activities)
cided to prepare an inventory of contaminated sites related to closed-
2. Contaminated Sites (closed-down waste disposal sites and industrial
down waste disposal and industrial installations in flood prone areas.
installations in flood-risk areas)
To enable preassessment of contaminated sites a special so-called
M1-Methodology was elaborated. This methodology is used as a tool
In both cases a specific methodology was developed to
for a screening and preliminary ranking of suspected contaminated
(i) identify potential ARS and
sites with regard to their risk potential. After this pre-ranking, further
(ii) establish a ranking system to evaluate a real risk.
assessment using flood probabilities will have to be carried out (see
Map 9).
For ARS based on industrial activities the ICPDR developed a
method for evaluation of potential risk. The methodology used was
Finally, it has to be stressed that, at present, both inventories and
based on the transposition of amounts of hazardous substances stored
related maps reflect only potential dangers; the actual danger to the
in a particular site into the Water Risk Class 3 ≠ equivalents
environment can only be determined on the basis of safety measures
(according to a German assessment system). From the sum of WRC 3
that have been put in place including a thorough site analysis. This
≠ equivalents a so-called WRI (water risk index ≠ a logarithmic unit)
will predominantly be a national task still to be performed.
was calculated to evaluate the overall risk potential of the site.
Application of this procedure resulted in preliminary ranking of
Safety Measures
potential Accident Risk Spots in the Danube River Basin. The ARS
The philosophy of water protection, as seen in relation to industrial
inventory was finalized in 2001 for most of the Danube countries and
installations in developed industrial countries is based on the assump-
updated in 2003 with the contributions of Austria and Bosnia i Herze-
tion that the potential hazard to water bodies can be compensated by
govina (see Map 8).
comprehensive technological and organisational safety precautions.
The floods of August 2002 highlighted the problem of inundation of
An evaluation of the quality and quantity of prevention, or of the
landfills, dump sites and storage facilities where harmful substances
safety rating of the ARS concerned, is therefore one of the major
are deposited. Transfer of toxic substances into the water may occur
future tasks of the ICPDR.
Danube River Basin District ≠ Potential Accident Risk Spots
MAP 8
Danube River Basin District ≠ Old Contaminated Sites in Potentially Flooded Areas
MAP 9
Characterisation of surface waters 82
For this purpose two major instruments are used by the APC EG:
4.4.5.3. Invasive species
≠ Recommendations for safety guidelines as supporting instruments for the
Results of hydrobiological surveys carried out along the Danube
Danube member states to improve the current standard of safety measures
River indicated already that permanent colonization of new species is
and
going on. Large scale engineering activity and river training works on
≠ Application of existing and development of new checklists to control the
the original European river systems resulted in a complicated water
implemented safety measures at existing ARS.
network consisting of interconnected canals and highly regulated
water bodies that facilitated shipping and transporting all around
Concerning safety recommendations the ICPDR is building up on the
Europe. The increased volume of the traffic between continents
work and experience of other river commissions.
resulted in the exchange of several faunal elements, too. This was
never observed before in European water bodies, due to geographical
Two important documents were elaborated by the ICPDR:
barriers.
≠ "Basic Requirements for installations handling water endangering
substances"
Most of the factors influencing the faunal exchange process originate
≠ "Safety Requirements for contaminated sites in flood-risk areas"
in human activity such as water engineering, traffic along the
European and the intercontinental water network. Additionally,
The application of existing and the development of new checklists to
artificial introduction, natural colonization processes due to the trans-
control the realized safety measures at existing ARS is related to this
mission of other species or the increased spreading ability of the
work. The "Checklist-methodology", which was developed by the
given species itself play an important role in this phenomenon.
German Federal Environmental Agency (Umweltbundesamt, UBA)
on the basis of the safety recommendations of the International River
The temporal and spatial processes of the faunal exchange between
Commissions of the Rhine and the Elbe River was proved to be the
the different parts of Europe and the other continents are well
best solution to check and improve the technical safety level. Using
documented mainly by German and Dutch scientists. According to
this methodology it is possible to identify for the accidental risk spots
several authors40 there are different possibilities for non-indigenous
all necessary safety measures applicable in a short-, medium- and
species to invade new rivers in the continent. Two main directions of
long-term basis for fulfilling the safety standards of the EU. The
frequently observed colonization are described: East-West for the
ICPDR recommended the use of this methodology in the Danube
pontocaspic and West-East for the Northwest European taxa.
countries. In the near future the ICPDR will focus on the
However, some pontocaspic species could reach the western part of
development of a checklist for "Safety requirements for contaminated
Europe via the northern Dnjepr-Pripet-Bug-Weichsel-Netze-Oder
sites in flood-risk areas".
river chain that is connected to the Mittellandkanal in Germany. This
means that some pontocaspic species could have reached the upper
4.4.5.2. Fisheries
stretches of the Danube from the Rhine.
Fisheries are mainly important locally and in some places may still
constitute an important source of income. At present, no data is avail-
Some countries in the DRB have sufficient data about invasive
able for the Danube basin on an overview scale. Where relevant this
species, but in the majority of the Danube countries data sources or
information will be given in the National Reports (Part B).
information on neozoa and neophyta is not available. A new
investigation on the significance of alien animal and plant species
The issue has been addressed in this report since there are some
(neobiota) in Austria41 informs that 46 animal species, 35 plant
significant impacts on aquatic species such as the sturgeon or the
species, and 6 fungus species can be regarded as invasive or
sterlet that are of basin-wide interest (see Chapter 4.5.1.4 and 4.5.1.5).
potentially invasive species. They cause problems mainly in river
floodplain forests and in riverine wetlands.
40 BIJ DE VAATE & KLINK (1995), BRINK VAN DEN et al. (1989), BRINK VAN DEN et al. (1990), BRINK VAN DEN et al. (1993), FOECKLER (1987),
FONTES & SCH÷LL (1994), KINZELBACH (1995), KOTH… (1968), SCHLEUTER et al. (1994), SCHLEUTER & SCHLEUTER (1995), TITTIZER et al. (1993),
TITTIZER et al. (1994), TOBIAS (1972), WITTMANN (1995), SCH÷LL et al. (1995), TITTIZER (1996a), TITTIZER (1996b).
41 ESSL & RABITSCH (2002).
Characterisation of surface waters 83
Neozoa
could have serious consequence on the original composition of the
Macrozoobenthos
biota. This species represents an example of the West-East direction
Few Neozoa species are well known in the different sections of the
of the expansion.
Danube River since the beginning of the 20th century (Viviparus
viviparus, Dreissena polymorpha). Many species originated from the
All of these additional occurrences indicate that the permanent
vicinity of the Black Sea and migrated westwards. Several ponto-
increase of the number of new non-indigenous members has to be
caspic taxa started to occur on the upper section only from the middle
taken in consideration.
of the 20th century (Hypania invalida, Lithoglyphus naticoides,
Theodoxus danubialis, Dreissena polymorpha, Corophium curvispinum,
Fish species
Jaera istri). Others could reach the upper stretch from the Black Sea
Having in mind that factors, such as riverbed regulation, land
closed to the end of the 20th century only (Cordylophora caspia, Valvata
reclamation, construction of water gates, change of the water flow,
naticina, Chaetogammarus ischnus, Dikerogammarus villosus).
pollution, habitat degradation, overfishing of native species can
provide conditions that favour alien species it is necessary to control
At present there are not so many species that arrived from the
or eradicate them, not only from protected areas, but from all the
Western European region, such as the Rhine River or the Atlantic
natural and semi-natural aquatic ecosystems. Serious upstream expan-
coast (Potamopyrgus antipodarum, Theodoxus fluviatilis, Corbicula
sion of some pontocaspic fish species is known in the Danube also
fluminea, C. fluminalis, Eriocheir sinensis) but their number will
that represents more and more characteristic elements of the given
most probably increase in the future.
river stretch (Neogobius fluviatilis, N. melanostomus, etc.).
The velocity of the colonization can be very different, similarly to the
From the beginning of the twentieth century eight alien fish species
different survival or reproduction strategies of these animals. Recent
(Aristichthys nobilis, Carassius auratus gibelio, Ctenopharyngodon
international surveys (ICPDR 2002) indicated that there are some
idella, Hypophthalmichthys molitrix, Ictalurus nebulosus, Lepomis
major changes concerning the Neozoa species added to the original
gibbosus, Micropterus salmoides, Pseudorasbora parva) have been
Danubian biota. The Chinese Pond Mussel (Sinanodonta woodiana)
found in the Serbian section of the Danube River. Some of them
is expanding slowly from the middle Danube to the upper and the
occurred in these waters as a consequence of imprudent introduction
lower section stretch since the 1960s. The snail Theodoxus fluviatilis
upstream and downstream from the Serbian section of the Danube,
was found in the Hungarian Danube stretch first in 1987 at Budapest.
and some were intentionally introduced, at first, in the fishponds, and
At present this snail species has an enormously abundant population
then in the running and stagnant waters.
on this relatively polluted Danube section. Additionally, it should be
mentioned that similar expansion is registered on the Tisza River to
Neophyta
upstream direction, too.
River bank vegetation and floodplains of the Danube and its
tributaries belong to those habitats which are most endangered by
Corbicula fluminea reported from the Rhine42 was observed first in the
invasion of nuisance species when they are suppressing local aquatic
Hungarian section in 1999 together with C. fluminalis in the vicinity
communities and altering natural habitats. In the upper part of the
of the Nuclear Power Plant of Paks43. The latter species was found
Danube there are currently 15 invasive plant species that are effecting
only at Paks. C. fluminea was wide spread on the lower Danube during
and changing the habitats in a drastic form.
the JDS Survey and only one occurrence data was detected upstream
Budapest, at Sturovo (SK). Further data in 2002 and 2003 increased
A rapid distribution of certain neophytes in the riparian and water
very quickly between the Danube Belt and Moh·cs (Hungary). The
vegetation can be perceived (e.g. Aesclepias syriaca, Amorpha
first occurrence of this Asian mussel was registered from the
fruticosa, Elodea canadensis, Impatiens glandulifera, Solidago
Szigetkˆz floodplain in 2003 as the uppermost Hungarian data. Today
canadensis, and S. gigantea). Czech Republic confirms the problem
this mussel species is the most common one is the middle Danube.
of neophyta especially in wetlands along rivers. In addition, there are
problems with Fallopia japonnica, Impatiens glandulifera, tree
The first data of the Chinese Woolcrab (Eriocheir sinensis) from Aus-
species in floodplain forests Negundo aceroides (= Acer negundo),
tria and Hungary were collected in the end of 2003 very near to each
Ailanthus altissima, Fraxinus pennsylvanica, and others, which are
other. This indicates another important change on this section that
supported by activities of foresters (clear-cuttings).
42 KINZELBACH (1991).
43 CS¡NYI (1998-1999).

Mario Romulic, Croatia

Characterisation of surface waters 84
4.5. Assessment of impacts on the basin-wide level
The TNMN load assessment programme started in 2000 and it
The assessment of impacts on a water body requires quantitative
provides an evaluation of the pollution load for the following
information to describe the state of the water body itself, and/or the
determinands:
pressures acting on it. The timetable for completing the first pressure
≠ BOD5
≠ inorganic nitrogen
and impact analysis and reporting their results is very short. The first
≠ ortho-phosphate-phosphorus
≠ dissolved phosphorus
analysis therefore relies heavily on existing information on pressures
≠ total phosphorus
≠ suspended solids
and impacts and on existing assessment methods.
≠ chlorides (voluntary)
The TransNational Monitoring Network (TNMN) constitutes the main data
There are 23 sampling stations in the TNMN load assessment
source on water quality of the Danube and its major tributaries. The
programme with a requirement of a minimum sampling frequency of
TNMN was formally launched in 1996, and aims to contribute to
24 times per year. Moreover, valid daily flow data must be available
the implementation of the Danube River Protection Convention. The
for the load assessment station. The quality of the TNMN data is
Contracting Parties cooperate in the field of monitoring and
regularly checked by a basin-wide analytical quality control
assessment with the aim to harmonise or make comparable their
programme (QUALCO-DANUBE). The results of this programme are
monitoring and assessment methods, in particular in the field of river
reported annually. To evaluate the data collected by the TNMN an
quality.
interim water quality classification scheme was developed that exclu-
sively serves the presentation of current status and assessment of
The main objective of the TNMN is to provide a structured and
trends of the Danube River water quality (i.e. it is not considered as a
well-balanced overall view of the pollution status as well as of the
tool for the implementation of national water policies).
long-term development of water quality and pollution loads in terms
of relevant determinands for the major rivers in the Danube River
In line with the implementation of the EU Water Framework
Basin (for list of determinands see Annex 8). The international aspect
Directive TNMN is going to be revised in 2005-2006 to ensure a full
of TNMN is of high importance.
compliance with the provisions of the WFD.
The TNMN monitoring network is based on the national surface
The multiple uses of surface waters by human activities (discharge of
water monitoring networks. For selection of TNMN sampling profiles
partially treated/untreated waste waters, water abstraction,
following criteria were applied:
hydropower generation, agricultural irrigation, navigation etc.) can
≠ site located just upstream/downstream of an international border
affect natural abiotic as well as biotic characteristics of surface waters
≠ site located upstream of confluences between Danube and main tributaries
and negatively impact aquatic community. Consequently, the risk
or main tributaries and larger sub-tributaries (mass balances)
assessment is based on both significant pressures and their impacts
≠ site located downstream of the largest point sources
on the aquatic ecosystem.
≠ site located according to control of water use for drinking water supply
Overall, different pressures can be identified, each of them having the
The selection procedure has led to establishment of a final list of
potential to impact the status of surface water bodies:
61 TNMN monitoring locations in the Phase I. At the initial stage, the
≠ Point source pollution (e.g. from urban and industrial wastewater treatment
territory of Yugoslavia was not included into the network due to war
plants or waste management sites). Impacts on the status of surface water
conditions, but Serbia and Montenegro joined the TNMN in 2001
bodies may result from the input of organic substances, nutrients and
increasing thus the number of TNMN sampling sites to 79 (Figure 32).
hazardous substances.
On the other hand, it must be pointed out that from Bosnia i
≠ Diffuse source pollution (e.g. from agricultural and urban land use
Herzegovina no data has been provided so far, Ukraine provided data
activities). Impacts on the status of surface water bodies can result from the
only for 1998 and 1999. Moreover, the data on several parameters
input of organic substances, nutrients and hazardous substances.
(especially micropollutants) have not been reported for many other
≠ Hydrological alterations (e.g. water abstraction, hydro-peaking, flow
downstream sites. The minimum required sampling frequency is
regulation). Impacts on the status of surface water bodies may result from
12 times per year for the chemical determinands in water and two
changed hydrological conditions.
times per year for the biological parameters.
≠ Morphological alterations (e.g. impoundments, weirs, bank reinforcements,
channelisation). Impacts on the status of surface water bodies may result
The assessment of pollution loads in the Danube River is necessary
from hydraulic engineering measures altering the structural characterisation
for estimating the influx of polluting substances to the Black Sea and
of surface waters.
for providing an information basis for the policy design.
≠ Any other pressures which might be identified.
0'
0'
3
3
47∫
45∫
42∫
FIGURE 32
K
C
SEA
BLA
Ismail
0∫
3
Kishinev
MD04
MD
BG05
RO04
3
RO0
RO09
BG08
0'
Ialomita
3
MD01
Bucuresti
27∫
BG04
3
BG0
BG
UA
BG02
e
b
u
25∫
n
RO
Da
Sofia
RO02
G08
C
S
G07
BG01
C
S
FYROM
RO01
i
s
0'
m
G17
3
Ta
C
S
G06
22∫
Mures
C
S
G05
C
S
G04
G12
C
G16
C
S
C
S
S
G11
d
H
C
S
PL
ra
H09
H08
g
3
Beo
G0
C
G14
S
C
G10
S
G15
C
C
S
est
S
G09
p
C
a
G02
S
d
G01
C
3
C
S
20∫
S
G1
el
Bu
H04
C
I
p
S
H05
3
HR08
H0
BIH
HR02
SK
HR01
H06
BIH04
3
SK0
SK04
H07
HR05
Sarajevo
H02
3
BIH01
BIH0
0'
Z01
SK01
3
C
HR
Bratislava
H01
17∫
HR07
Zala
BIH02
HR04
A04
reb
Z02
3
g
C
3
Za
HR0
a
A0
SL01
p
Wien
Ku
HR06
Danube
15∫
A02
SL
Praha
CZ
Drava
A
A01
Ljubljana
The Danube Stationmap TNMN
D02
0'
3
D04
12∫
50 km
2
3
D0
I
50
2
M¸nchen
D
150
10∫
100
D01
g
location
50
on the Danube River
on the tributary
50∫
0'
45∫
3
0
47∫
Monitorin
TNMN stations in the Danube river basin
Characterisation of surface waters 86
The risk assessment is based on a 4-step procedure (Figure 33). In a
4.5.1. Impacts on rivers
first step, the driving forces and its related pressures are identified.
The analysis of the water quality in rivers is based on the
Secondly, the significant pressures are determined. Thirdly, the
≠ Five-year Report on Water Quality in the Danube River Basin Based on
environmental impacts are assessed. In the last step, the risk of failing
Trans-National Monitoring Network, 2003;
to reach the environmental objectives is estimated by comparing the
≠ Joint Danube Survey Database;
current status of the water body to the environmental objectives of the
≠ Joint Danube Survey ≠ Technical Report of the International Commission for
Directive. This estimation is based on available data and is not the
the Protection of the Danube River, 2002;
ecological classification.
≠ A Synthesis of Activities in the Framework of "Bucharest Declaration
1985 -1997"; and the
≠ TNMN Database 1996-2000.
Procedure for the estimation of the risk of failure
4.5.1.1. Impacts from organic pollution
to reach the environmental objectives of the WFD
FIGURE 33
The organic pollution is the result of contamination of water with
organic substances originating both from natural and anthropogenic
sources. The natural organic matter occurring in water stems mainly
Identification of driving forces and pressures
Identification of significant pressures
from soil erosion and decomposition of dead plants and animals; it is
relatively insoluble and slowly decomposed. Organic compounds
Impact Assessment
originating from various human activities belong to the most frequent
pollutants discharged into rivers.
comparison with objectives
Rather critical status of the Danube water quality in eighties forced
the Danube countries to act jointly in implementing the integrated
Risk Assessment: Estimation which water bodies are at risk of failing WFD environmental objectives
transboundary water management. The first steps towards a basin-
wide water quality assessment and protection have been done in 1985
when the Bucharest Declaration was established as a new frame for
The pressures and impacts described in Chapter 4.4 and 4.5 are the
regional cooperation. The monitoring network created under the
basis for estimating the risk of failing to reach the WFD
Bucharest Declaration started to operate in 1988. It consisted of
environmental objectives by 2015 (Chapter 4.7).
eleven monitoring sites located on the border sections on the main
stream of the Danube River. Within the Bucharest Declaration
monitoring the parameters characterizing the organic pollution were
grouped under the name "dissolved oxygen regime". This group
contained following determinands: dissolved oxygen concentration
and saturation (DO), biochemical oxygen demand (BOD5), chemical
oxygen demand (both by KMnO4 and K2Cr2O7 - COD-Mn and
COD-Cr). The agreed monitoring frequency was 12 times per year.
In the nineties the Danube cooperation was strengthened and led to
signing of the Danube River Protection Convention in 1994. Under
DRPC the Transnational Monitoring Network was created that is
described in detail elsewhere. For the characterization of the organic
pollution TNMN took over the dissolved oxygen regime parameters
from the Bucharest Declaration monitoring.
The assessment of organic pollution has been based on the
"Five-year Report on Water Quality in Danube River Basin Based on
Trans-National Monitoring Network, 1996-2000".
Characterisation of surface waters 87
Link to pressures
a year). For the dissolved oxygen the higher concentrations mean a
It is clear that the status of the water ecosystem as well as the impacts
better situation, which is opposite to all other determinants and from
depend on the type of pressure. Point and diffuse sources of the
this reason it is considered that the best descriptor for dissolved
organic pollution are recorded within the ICPDR in form of the
oxygen content is the 10 %-ile data.
emission inventories of industrial and municipal discharges in the
Danube River Basin. These inventories are updated regularly to
In the assessment of the water quality 57 out of 61 TNMN sampling
provide a sound overview of emissions of organic matter into the
profiles are included, for which the data were available. 31 sites are
waters.
located on the main stream of the Danube River and 26 on the
important tributaries included in the TNMN.
In this chapter the status of the water ecosystem is presented based
on the results of the TNMN and the extent of the impact is based on
The c90 values are presented in a way indicating the compliance with
tools and criteria agreed within the ICPDR.
the "target value" used in the TNMN classification system.
Status of water
Dissolved oxygen
The assessment methodology refers to the classification of the
Because oxygen that is dissolved in water is far less abundant then
surface water quality in accordance to an interim classification
the oxygen in the air, the actual amount of oxygen present in water is
system developed for TNMN. In this classification system five
an important water quality parameter. As a general rule, the less
quality classes are used for the assessment, with target value being
oxygen dissolved in water the worse is the water quality. Low oxygen
the limit value of class II. The class I should represent the background
levels in water are caused mainly by the discharges of inadequately
concentrations hence the reference conditions. The classes III - V
treated or untreated wastewater. This leads to a growing microbio-
show "non-compliance"and the limit values are usually 2 - 5 times
logical activity and hence to the depletion in dissolved oxygen. Low
the target values. They should indicate the extent of the exceedence of
oxygen concentration results in a decrease in plant and animal species
the target value and should help to recognise the positive tendency in
and a deterioration of water quality.
water quality development.
According to TNMN data from 1996-2000, the dissolved oxygen
The basis for the water quality assessment agreed by the MLIM EG is
concentrations varied from 4.5 mg/l O2 to 10.6 mg/l O2 in the Danube
90 %ile (c90) for each considered determinand (90 percentile method
River and from 2.1 mg/l O2 to 11.5 mg/l O2 in tributaries that are part
has the advantage that extreme values caused by exceptional
of the TNMN. This is a rather positive situation, with only 7.4 % of
conditions or measuring errors are not taken into account, but still
values below the quality target (6 mg/l O2) in the Danube River and
represents "unfavourable" situation that occurred in monitoring site in
8.6 % in tributaries.
Dissolved Oxygen ≠ Spatial distribution of mean values of c10 for 1996 - 2000 data against the limit of Class II (TV - target value) ≠ the Danube River.
Contrary to the other determinands, in the case of dissolved oxygen the "above target value" means a favorable situation
FIGURE 34
12
12
10
10
8
8
6
6
4
4
2
2
0
0
D01
D02
A01
A02
A03
A04
K01
K02
K03
S
S
H01
S
H02
H03
H04
H05
HR01
HR02
RO01
RO02
BG01
BG02
BG03
BG04
RO03
RO04
BG05
RO05
UA01
RO06
UA02
RO07
RO08
2581
2204
2120
1935
1874
1865
1806
1768
1708
1560
1535
1429
1337
1071
834
834
641
554
503
432
375
375
132
132
18
16
0
0
DO
TV
Characterisation of surface waters 88
Dissolved Oxygen ≠ Spatial distribution of mean values of c10 for 1996 ≠ 2000 data against the limit of Class II (TV- target value) ≠ tributaries.
Contrary to the other determinands, in the case of dissolved oxygen the "above target value" means a favorable situation
FIGURE 35
12
12
9
9
6
6
3
3
0
0
D03
D04
K04
H06
101
H07
H09
H08
102
C201
C201
S
S
HR03
HR04
HR05
S
HR06
HR07
HR08
BG06
BG07
BG08
RO09
RO10
MD01
MD02
RO11
MD03
637
537
498
432
154
2225
1880
1766
1497
1379
1215
1170
2581
h
io
ava
iret
Inn
Morava
Va
S
Drava
T
isza
S
Iskar
Jantra
Russ. Lom
Arges
S
Pruf
DO
TV
Summarizing the spatial distribution of the mean values of DO - c10
Biochemical Oxygen Demand
data for 1996 - 2000 for the Danube River and the major tributaries
BOD5 characterizes the oxygen demand arising from biological activ-
(Figure 34 and Figure 35), the following statements can be done:
ities. High BOD5 values are usually a result of organic pollution
≠ A decreasing tendency of the dissolved oxygen content downstream the
caused by discharges of untreated wastewaters from treatment plants,
Danube River was recorded; To a certain extent this is a natural phenomenon
industrial effluents and agricultural run-off. Generally, it can be said
caused by reduced aeration and elevation of water temperature
that BOD concentrations less than 2 mg/l O2 are indicative of
≠ In the upper Danube section, the dissolved oxygen values increase from
relatively clean rivers and concentrations higher than 5 mg/l O2 are
Danube-Neu Ulm (rkm 2581) to Danube-Wien-Nussdorf (rkm 1935). In this
signs of relatively polluted rivers.
stretch, all concentrations are above 8.5 mg/l and no value is below the
target limit which indicates a positive situation;
According to TNMN data, BOD5 values varied during 1996 ≠ 2000
≠ In the middle stretch, the oxygen concentrations are slightly lowers then
in a range of 1.4 ≠ 8.2 mg/l O2 in the Danube River and 1.8 ≠ 60.5
those in the upper part. A uniform pattern is present along this stretch, with
mg/l O2 in the major tributaries. This means that 13.3% of values
no value below the target limit;
were above the target value (5 mg/l O2) in the Danube River (mainly
≠ Decreased concentrations appeared in the areas influenced by the two major
in the middle and in the lower sections) and 35.9% in the major tribu-
reservoirs (Gabcikovo ≠ slight decrease at rkm 1806 and Iron Gates ≠ a
taries.
significant decrease downstream of rkm 1071);
≠ In the lower part only three values were below the target value at rkm 834;
The spatial distribution of the mean values of BOD5 - c90 data in
≠ In the tributaries, the dissolved oxygen content generally decreases from
1996 - 2000 in the Danube River (Figure 36) shows that the profile is
those located in the upper area to those located in the lower part;
relatively scattered, with a concentration maximum located in the
≠ While only a slight deviation from Class II occurs in the Siret and the Prut
middle stretch of the Danube. In the tributaries (Figure 37), the BOD5
River, a critical situation was observed in the Arges River having a mean
values indicate a higher content of biodegradable organic matter
value of less than 4.0 mg/l O2, which is the limit value for Class V. This is
occurring in the Morava, Dyje and Sio in the upper and middle
mainly due to the absence of a waste water treatment plant for a
Danube section and in the Yantra, Russenski Lom, Arges and Siret in
municipality with more than 2 million inhabitants.
the lower Danube. It should be pointed out that the maximum BOD5
value was found in the Arges river as a consequence of the pressure
The above-mentioned results are in good correlation with the
from a big municipality discharging insufficiently treated wastewaters
conclusions of the Joint Danube Survey44.
into this tributary.
44 ICPDR (2002).
Characterisation of surface waters 89
Biochemical Oxygen Demand ≠ Spatial distribution of mean values of c90 for 1996 - 2000 data against the limit of Class II (TV - target value) ≠
the Danube River. The values above the TV show unforable situations
FIGURE 36
7
7
6
6
5
5
4
4
3
3
2
2
1
1
0
0
D01
D02
A01
A02
A03
A04
K01
K02
K03
S
S
H01
S
H02
H03
H04
H05
HR01
HR02
RO01
RO02
BG01
BG02
BG03
BG04
RO03
RO04
BG05
RO05
UA01
RO06
UA02
RO07
RO08
2581
2204
2120
1935
1874
1865
1806
1768
1708
1560
1435
1429
1337
1071
834
834
641
554
503
432
375
375
132
132
18
16
0
0
BOD
TV
Biochemical Oxygen Demand ≠ Spatial distribution of mean values of c90 for 1996 - 2000 data against the limit of Class II (TV - target value) ≠ tributaries.
The values above the TV show unforable situations
FIGURE 37
20
20
16
16
12
12
8
8
4
4
0
0
D03
D04
K04
H06
101
H07
H09
H08
102
C201
C201
S
S
HR03
HR04
HR05
S
HR06
HR07
HR08
BG06
BG07
BG08
RO09
RO10
MD01
MD02
RO11
MD03
637
537
498
432
154
2225
1880
1766
1497
1379
1215
1170
2581
h
io
ava
iret
Inn
Morava
Va
S
Drava
T
isza
S
Iskar
Jantra
Russ. Lom
Arges
S
Pruf
BOD
TV
Characterisation of surface waters 90
Chemical Oxygen Demand
stream and between 6.3 mg/l O2 and 90.4 mg/l O2 in the major
Chemical Oxygen Demand (COD) informs on the demand of the
tributaries. 22.4% of the samples from the Danube and 39.7% samples
oxygen needed for the oxidation of organic substances. Similar to
from the tributaries were above the TNMN target value (25 mg/l O2).
BOD5, high COD values adversely affect the aquatic environment.
According to the oxidizing agens applied two different COD methods
The spatial variation of the mean values of COD-Cr - c90 data for
are distinguished: COD-Cr (oxidation by dichromate) and COD-Mn
1996 - 2000 along the Danube River shows a relative scattered
(oxidation by permanganate). Although in the TNMN both methods
profile, caused by inhomogeneous data available from the same cross
are used, in this report only COD-Cr was chosen for the assessment
sections (yearly variation of COD-Cr is much higher in the lower
because of its higher oxidation ability (oxidizes 90-100% of the
Danube section than in the upper and middle reaches). An increase
organic substances). It is generally considered that concentrations of
of COD-Cr from upper to lower Danube is visible (Figure 38), with
COD-Cr less than 10 mg/l O2 are indicative of relatively clean rivers,
values exceeding the target limit (TV= 25 mg/l O2) in the lower
while concentrations above 25 mg/l O2 indicate an organic pollution.
Danube stretch. The target value was exceeded also in many Danube
tributaries (Figure 39). The most significant non-compliance on a
According to TNMN c90 data in 1996 - 2000, the COD-Cr values
long-term basis was recorded in Dyje, Sio, Yantra, Russenski Lom,
varied between 2.9 mg/l O2 and 58.0 mg/l O2 in the Danube main-
Siret and Prut.
Chemical Oxygen Demand (COD-Cr) ≠ Spatial distribution of mean values of c90 for 1996 - 2000 data against the limit of Class II (target value) ≠
the Danube River. The values above the TV show unfavorable situations
FIGURE 38
35
35
30
30
25
25
20
20
15
15
10
10
5
5
0
0
2581
2204
2120
1935
1874
1865
1806
1768
1708
1560
1435
1429
1337
1071
834
834
641
554
503
432
375
375
132
132
18
16
0
0
COD-Cr
TV
Chemical Oxygen Demand (COD-Cr) ≠ Spatial distribution of mean values of c90 for 1996 - 2000 data against the limit of Class II (target value) ≠
tributaries. The values above the TV show unfavorable situations
FIGURE 39
50
50
40
40
30
30
20
20
10
10
0
0
D03
D04
K04
H06
101
H07
H09
H08
102
C201
C201
S
S
HR03
HR04
HR05
S
HR06
HR07
HR08
BG06
BG07
BG08
RO09
RO10
MD01
MD02
RO11
MD03
637
537
498
432
154
2225
1880
1766
1497
1379
1215
1170
2581
h
io
ava
iret
Inn
Morava
Va
S
Drava
T
isza
S
Iskar
Jantra
Russ. Lom
Arges
S
Pruf
COD-Cr
TV
Characterisation of surface waters 91
Impact assessment
≠ Downstream of Belgrade to the Iron Gate reservoir, water quality varied
As the benthic invertebrates are sensitive to the presence of the
between class II and II-III. Signs of pollution began to appear, and there were
organic compounds in water, the analysis of macrozoobenthos in the
significant differences in the saprobity of the samples collected from the left
aquatic ecosystem provides useful information on the impacts of
and right banks of the Danube, which seemed to be due to the pollution
organic pollution.
effects of the discharging tributaries. Only the impounded reach upstream of
the Iron Gate Dam showed saprobity values below the limit for water quality
The results of the macrozoobenthos analysis presented in this chapter
class II.
are based on the biomonitoring procedures agreed within the ICPDR.
≠ In the Lower Danube reach, especially down-stream of big cities, discharges
A so-called saprobic index system is based on a classification of
seemed to result in an increase in the level of destruents, bacteria and detri-
water quality using seven biological quality classes (Table 30) Similar
tus feeders; even toxic effects see-med to exist. On the right bank of the
to the chemical water classes, water quality class II (moderately
Danube, for example at Vrbica/Smiljan, no invertebrates were present on
polluted) indicates the general quality objective. It must be pointed
rocks and pebbles, and the very fine-grained, reduced sediment was
out that this procedure is not fully compatible to the type-specific
predominantly inhabited by a few oligochaetes and chironomids. Comparing
biological monitoring as requested by the WFD.
the Upper and Lower Danube in terms of the sum of abundances, the lower
section of the Danube was clearly marked by a significant decrease in
It must be stressed that the presented saprobic indices (Table 31) are
biodiversity. Arms and tributaries of the Danube were found to be more
rather heterogeneous owing to the differences in national
polluted than the River itself and even reached water quality class III
methodologies and that a lot of data is missing due to gaps in national
(strongly polluted) or higher. The Moson-Danube arm and the dammed
monitoring programmes.
Rackeve-Soroksar arm were found to be critically polluted (water quality
class II-III). The Schwechat, the Drava and the Tisza could be placed between
Viewing the results presented in Table 31 it is apparent that the
class II and II-III. The mouths of the V·h, Velika Morava, Yantra, Siret and
Danube and most of its tributaries belong to the classes II ≠ II/III
Prut tributaries are critically polluted (water quality class II-III).
( ≠ mesosaprobity).
≠ The SiÛ even reached water quality class III. No macroinvertebrates were
found ≠ probably due to toxic effects ≠ in the Iskar, Olt and Arges tributaries
Macrozoobenthos was analysed also during the JDS and the results
which exceeded the limit of water quality class III and represented the
obtained showed that:
worst quality conditions identified during the Survey. Due to the problems in
≠ The saprobity of the Danube varied between water quality class II
implementation of macro-invertebrates assessment procedures for the lower
(moderately polluted) and II/III (critically polluted). Taking into
part of the Danube River (along the Romanian stretch) the evaluation of the
account that the saprobic index is also influenced by the habitat structure
organic pollution was made based on phytoplankton communities that has
(for example, comparison of free-flowing stretches to impounded areas), the
been monitored for many years (Table 32). The assessment of primary
Danube showed good water quality (class II) all the way to Budapest.
producers is important for the lower part of the river and gives information
≠ Downstream of Budapest, where the Danube passes through the Hungarian
on pollution impact, water quality and ecosystem health, together with other
Lowlands, water quality often decreased to class II-III, indicating significant
biotic communities data. The information based on phytoplankton
organic pollution. Taking into account the high chlorophyll-A values as well
complements the information based on macro-invertebrates. The
as the extreme over-saturation with oxygen in this reach, secondary pollution
classification of water quality (with seven classes) is similar as for
caused by an elevated phytoplankton biomass, which usually leads to an
macrozoobenthos.
increase in saprobity, was clearly recognisable.
Classification scheme of water quality according to saprobic index
TABLE 30
CLASSIFICATION SCALE
I.
I.-II.
II.
II.-III.
III.
III.-IV.
IV.
unpolluted
low
moderately
criticaly
strongly
very high
extensively
polluted polluted polluted polluted polluted polluted
1,25
1,75
2,25
2,75
3,25
3,75
>3,75
Characterisation of surface waters 92
Annual mean Saprobic Index based on macrozoobenthos (TNMN stations 1997 - 2000)
TABLE 31
Saprobic index (macrozoobenthos)
D - Danube site (rkm)
T, T/T Tributaries (site)
1997
1998
1999
2000
D01-Neu-Ulm (2581); D
2,40
D04-Salzach (Laufen); T/T
2,12
2,03
2,25
D03-Inn (Kirchdorf); T
1,86
1,77
1,85
D02-Jochenstein (2204); D
2,26
2,27
2,19
A01-Jochenstein (2204); D
2,11
2,09
2,00
2,19
A02-Abwinden-Asten (2120); D
2,08
2,03
2,00
2,00
A03-Wien-Nussdorf (1935); D
1,93
2,19
2,00
2,20
A04-Wolfsthal (1874); D
2,14
2,15
2,10
2,20
CZ02-Dyje (Pohansko) T/T
2,40
2,20
2,13
2,16
CZ01-Morava (Lanzhot) T
2,71
2,30
2,23
2,15
SK01-Bratislava (1869) ; D
2,08
2,04
2,54
1,98
SK02-Medved'ov/Medve (1806); D
2,12
2,09
2,18
1,99
H01-Medved'ov/Medve (1806); D
2,20
2,18
2,00
SK03-Kom·rno/Kom·rom; D (1768)
2,11
2,12
2,27
2,11
H02-Kom·rno/Kom·rom; D (1768)
2,25
2,27
2,10
SK04-V·h (Kom·rno); T
2,70
2,45
2,42
2,26
H03-Szob (1708); D
2,11
2,24
2,26
H04-Dunafoldvar (1560); D
H06-Sio (Szekszard-Palank) T
2,38
H05-Hercegszanto (1435); D
H07-Drava; T (Dravaszabolcs)
HR01-Batina (1429); D
HR02-Borovo (1337); D
HR03-Drava; T (Varazdin)
H09-Sajo (Sajopuspeki); T/T
H08-Tisza (Tiszasziget); T
SL01-Drava (Ormoz); T
2,34
2,35
2,52
HR04-Drava (Botovo); T
HR05-Drava; T (D.Miholjac)
SL02-Sava (Jesenice); T
2,57
2,32
2,36
HR06-Sava (Jesenice)*; T
2,60
2,80
2,50
2,24
HR07-Sava (us.Una)*; T Jasenovac
2,70
2,40
2,50
2,03
BIH01-Sava; T (Jasenovac)
BIH02-Una(Kozarska); T/T Dubica
BIH03-Vrbas(Razboj); T/T T/T
BIH04-Bosna; T/T (Modrica)
HR08-Sava*; T (ds.Zupanja)
3,70
2,90
2,60
2,34
* In Croatia the list of saprobic indicators was changed after 1999, so the results of 2000 are not comparable to the data of 1997-1999.
Characterisation of surface waters 93
Annual mean Saprobic Index based on phytoplankton (TNMN stations 1997 - 2000)
TABLE 32
Saprobic index (phytoplankton)
D - Danube site (rkm)
1997
1998
1999
2000
RO01-Bazias (1071); D
2,03
1,86
1,83
2,06
RO02-Pristol/Novo Selo ; D Harbour (834)
2,12
1,92
1,88
RO04-Chiciu/Silistra (375); D
2,07
2,02
2,08
1,96
RO05-Reni-Chilia/Kilia arm; D
2,08
2,11
2,11
2,17
UA01-Reni-Chilia/Kilia arm; D
RO06-Vilkova-Chiliaarm/Kilia; D arm
2,08
2,06
2,17
RO07-Sulina-Sulina arm ; D
2,05
2,13
RO08-Sf.Gheorghe arm; D Gheorghe arm
2,03
2,32
Regarding the phytoplankton results along the Romanian stretch of
4.5.1.2. Contamination with hazardous substances
the Danube (1071 ≠ 0 km), the range of the saprobic index varied
The EU Water Framework Directive explains in its Article 2 the term
between 1.88 (Reni, 1996) to 2.32 (Sf. Gheorghe arm, 2000). The
`hazardous substances' as substances or groups of substances that are
average value for 5 years and for all TNMN Romanian sections was
toxic, persistent and liable to bio-accumulate; and other substances
2.02. The observed tendency was a slight increase of the saprobic
or groups of substances which give rise to an equivalent level of
index from Bazias (1.97) and Gruia (1.91) to the Danube Delta
concern. Exposure to excessive loads of hazardous substances can
direction (2.10 ≠ Valcov, 2.09 ≠ Sulina, 2.17 ≠ Sf. Gheorghe).
result in a series of undesirable effects to the riverine ecology and to
the health of the human population. Hazardous substances may
The Saprobic values based on phytoplankton in the lower Danube
affect organisms by inhibition of vital physiological processes (acute
and the values based on macro-invertebrates for the upper and
toxicity), or they may cause effects threatening population on a
middle parts of the Danube River are not fully comparable, since
long-term basis (chronic toxicity).
the assessment is based on different parts of the process of
biodegradation: The macrozoobenthos indicates the degree of
If a substance is persistent, i.e. its degradation process exceeds certain
decomposition of organic matter and degree of oxygen depletion,
time span, it remains in the environment and leads to a continuous
phytoplankton indicates the degree of primary production, which
and/or long-term exposure. Substances with a high lipophilicity that
results from nutrients stemming either from the process of
enter the water environment tend to accumulate in a solid phase and
decomposition or from other point or diffuse sources.
in living organisms. That is why it is necessary to investigate all
compartments of the riverine ecosystem before a contamination by
Almost the same pattern of water quality assessment is provided
hazardous substances can be assessed. It is necessary to emphasize
by the Joint Danube Survey data. Thus, the results obtained show that
that only a thorough assessment of in-stream pollution by hazardous
the saprobity of the Danube varied between water quality class II
substances enables designing of the effective protection measures.
(moderated polluted) or II/III (critically polluted).
This assessment is performed by appropriately tailored monitoring
programmes.
Principles of monitoring and assessment
The ICPDR monitoring activities concerning hazardous substances
are based on two complementary approaches: (i) regular monitoring
of a water column via Transnational Monitoring Network (TNMN)
and (ii) complex investigation of the whole river by occasional
surveys. The TNMN has been operating since 1996 and produces a
basin-wide database of hazardous substances on annual basis. In 2001
a longitudinal monitoring survey (Joint Danube Survey) was
organized. The results of the survey provided a complex picture on
contamination of water, sediments, suspended solids and biota by
heavy metals and organic micropollutants.
Characterisation of surface waters 94
To assess the extent of contamination of the aqueous environment by
Link to pressures
the hazardous substances the environmental quality standards
The data on releases of hazardous substances in the Danube River
(sometimes referred to as target values) have to be derived. Until now,
Basin is relatively scarce, the Emission Inventories provide only very
the quality standards for particular substances were included in the
limited information. According to the Inventory of Agricultural
environmental legislation in the Danube countries. However, these
Pesticide Use, performed in 2003 within the UNDP/GEF project, the
national lists of priority substances were not harmonized on a basin-
use of pesticides has declined significantly in most of the countries
wide scale. Therefore, to evaluate the data collected by the TNMN
of DRB. Data from the FAOSTAT database show a strong decline in
an interim water quality classification scheme was developed by
pesticide use in the CEE countries to about 40% of 1989 levels
the ICPDR (see Annex 9). This scheme serves exclusively for the
compared to a relatively small decrease in EU Member States during
presentation of the current status and the assessment of trends of the
the same period. The most applied pesticides are Atrazine, 2,4-D,
Danube River water quality (i.e., it is not considered as a tool for
Alachlor, Trifluralin, Chlorpyrifos and copper containing compounds.
the implementation of national water policies). The border of the
There are indications, however, that the use of pesticides in the CEE
class II in the TNMN classification is referred to as a target value for
region increases again and that this tendency might be accelerated
good water quality. The TNMN classification has been applied for
after the enlargement of the EU.
the evaluation of TNMN results and the related impact assessment in
this chapter.
Status of water
Heavy metals
In November 2001 the Decision No 2455/2001/EC of the European
Within the TNMN eleven heavy metals are regularly analyzed in
Parliament and of the Council amended EU WFD by establishing
water both as total and dissolved forms (however, for dissolved heavy
the list of priority substances in the field of water policy. Altogether
metals, the data have been available only since 1998 and only for
33 priority substances are listed in this document, which has been
certain reaches of the Danube River). Out of these, eight heavy metals
accepted by the ICPDR as a basis for establishing the Danube List of
are of a particular importance due to the fact that they are considered
Priority Substances. At present, the environmental quality objectives
as priority substances for the Danube River Basin ≠ four of them are
are being developed by the EC Expert Advisory Forum on Priority
listed in the list of Priority Substances included in Annex X of the
Substances (EAF PS) for all EU WFD priority substances. It is neces-
EU Water Framework Directive (Cd, Pb, Hg and Ni) and the other
sary to point out that the WFD's normative definitions for ecological
four belong to priority substances specific to the Danube River Basin
status and potential clearly describe the conditions required for
(As, Cu, Cr and Zn).
the specific pollutants at good status/potential. In such case the
concentrations of specific pollutants should not exceed the
For most of the monitored heavy metals the general pattern of their
environmental quality standards set in accordance with Annex V,
occurrence is an increase from the upper to the lower part of the
Section 1.2.6 of the Directive. If one or more of the specific
Danube (see the example for Cadmium in Figure 40). The only
pollutants do not meet the required conditions (even if the biological
exception is manganese, for which the maxima were observed in the
quality elements do) the overall ecological status/potential will be
middle Danube. As for the tributaries ≠ the content of heavy metals
moderate. In the other words for the hazardous substances the WFD
is elevated in many of them, especially in those located in the lower
classification is based on a one-out all-out principle.
Danube. A necessary issue still to be clarified in the future is the
determination of natural background concentrations to be used
for setting of region-specific quality standards. Due to the
geomorphologic conditions the natural occurrence of heavy metals
in the Danube River Basin varies.
Characterisation of surface waters 95
Temporal trends of Cadmium in the Danube River *
FIGURE 40
Cd g/l
1,2
1,2
1,0
1,0
0,8
0,8
0,6
0,6
0,4
0,4
0,2
0,2
1996
0
0
1997
2581
2204
2204
2120
1935
1874
1869
1806
1806
1768
1768
1708
1560
1435
1429
1998
D01
D02
A01
A02
A03
A04
SK01
SK02
H01
SK03
H02
H03
H04
H05
HR01
1999
Monitoring sites / distance from the mouth [km]
2000
2001
Cd g/l
30
30
25
25
20
20
15
15
10
10
5
5
0
0
2581- 1427
1367
1337
1258
1174
1155
1077
1071
955
851
834
834
641
554
503
432
375
375
132
132
18
18
0
0
1429 SCG01 SCG02 HR02 SCG03 SCG04 SCG05 SCG06 RO01 SCG07 SCG08 RO08
BG01
BG02
BG03
BG04
RO03
RO04
BG05
RO05
UA01
RO06
UA02
RO07
RO08
Monitoring sites / distance from the mouth [km]
* The full data is contained in ICPDR (2001).
Based on the evaluation of TNMN data from years 1996 ≠ 2000 using
the interim classification the following conclusions can be drawn on
the content of the total heavy metals:
≠ the content of lead, copper and cadmium in the Danube mainstream is
rather high having 57 % of the results for lead and copper and 47 % of the
results for cadmium above the target limit; the situation in the tributaries is
slightly better ≠ 53% results exceeded the target value for lead, 22 % for
copper and 32 % for cadmium (target value for total Cu is 20 g/l, for total
Pb is 5 mg/l and for total Cd is 1 mg/l).
≠ due to the lack of data for mercury in the lower Danube a comprehensive
picture cannot be given, however, it is worth mentioning that altogether
63 % of the results from tributaries were above the ICPDR limit of 0.1 mg/l.
≠ pollution of the Danube mainstream and its tributaries by arsenic,
chromium, nickel and zinc can be considered as low. However, the lack of
data for these heavy metals in the lower Danube section has to be
mentioned.
Characterisation of surface waters 96
The overview of classification of the TNMN results from the year
fluence). Tributaries with the highest excess in heavy metal
2001 for cadmium and mercury is shown in Figure 41.
concentrations in water included the Rusenski Lom, the Iskar and the
Timok River. In sediments, concentrations of arsenic, cadmium,
During the Joint Danube Survey a variety of elements (Al, As, Cd, Cr,
copper, nickel, zinc and lead (in tributaries only) were found to be
Cu, Fe, Pb, Mn, Hg, Ni and Zn) was determined in water samples,
above the applied quality targets at more than one-third of the
sediments, suspended solids and mussels from the Danube River and
sampling points (German quality targets were used for this
its tributaries. While for chromium and lead relatively low
evaluation). Despite a significant decrease in arsenic, chromium, mer-
concentration levels were detected all other metals showed elevated
cury, lead, nickel and zinc in core sediment samples of the Iron Gate,
concentrations in at least one of the investigated matrices, particularly
their surface concentrations are still significant.
in the lower stretch of the Danube (downstream of the Sava River con-
TNMN Water quality classes for cadmium and for mercury in 2001
FIGURE 41
100%
100%
no data
90%
90%
class V
80%
80%
class IV
70%
70%
class III
60%
60%
class II
50%
50%
class I
40%
40%
30%
30%
20%
20%
10%
10%
0%
0%
Danube
Tributaries
Total
Danube
Tributaries
Total
Temporal trends of pp'-DDT in the Danube River on the basis of field data collected during the JDS (compare also Figure 49)
FIGURE 42
g/l
1.6
1.6
1.4
1.4
1.2
1.2
1.0
1.0
0.8
0.8
0.6
0.6
0.4
0.4
0.2
0.2
0.0
0.0
D01
D02
A01
A02
A03
A04
K01
K02
K03
S
S
H01
S
H02
H03
H04
H05
HR01
HR02
RO01
RO02
BG01
BG02
BG03
BG04
RO03
RO04
BG05
RO05
UA01
RO06
UA02
RO07
RO08
upper
middle
lower I
lower II
Monitoring site
1996
1999
1997
2000
1998
Characterisation of surface waters 97
Organic micropollutants
For the volatile organic compounds (VOCs), data are available for
Lindane, pp'-DDT, Atrazine, chloroform, carbon tetrachloride,
the upper and middle Danube only. Chloroform was the most often
trichloroethylene and tetrachloro-ethylene are the organic micro-
detected VOC in the Danube River Basin during 1996-2000. It
pollutants regularly monitored in water in the frame of the TNMN
exceeded the interim target of 0.6 g/l in about one third of the
programme. In general, the data collected so far exhibit rather large
collected samples. Significantly lower contamination was recorded
variation due to big differences between reported limits of detection
for tetrachloroethylene ≠ only about one tenth of the samples were
in various Danube countries.
above the target value of 1 g/l. The situation was even better in
the case of tetrachloromethane and trichloroethylene. Only in 2% of
The organochlorine pesticides (Lindane and pp'-DDT) show an
the samples from the tributaries the target value of 1 g/l was
analogous increasing profile from the upper to the lower Danube
exceeded. In the Danube mainstream no elevated concentrations of
(see Figure 42). As regards exceeding of the ICPDR interim targets
tetrachloromethane and trichloroethylene were observed during
the situation is worse for pp'-DDT: 71 % of the Danube samples
1996-2000.
and 54 % of the samples collected from tributaries contained more
than 0.01 g/l of this analyte. In case of Lindane the limit value of
The Joint Danube Survey was focused on the analysis of a wide
0.1 g/l was exceeded in 24 % of the Danube samples and in 9 % of
variety of hazardous organic substances in different compartments of
the samples from tributaries.
the riverine ecosystem.
From 1996 to 2000 the concentrations of the polar pesticide Atrazine
As for polycyclic aromatic hydrocarbons (PAHs), the concentration of
were found below the detection limits at most of the monitoring sites
2 mg/kg was exceeded in 17 samples only and none of the samples
along the Danube River. The target limit of 0.1 g/l was exceeded
reached 20 mg/kg. The concentration of PAHs in mussels showed an
only in 13 % of the Danube samples. The tributaries were more
increasing trend downstream to the Danube Delta. Moreover, the
contaminated with Atrazine with approx. 30 % of values above the
highest concentrations of PAHs were measured in mussels collected
quality target. The highest concentrations of Atrazine during that five-
from tributaries in the Middle Danube reach.
year period were found in the tributaries Sio and Sajo. The overview
of classification of the TNMN results for Atrazine in the year 2001 is
The contamination of the Danube and its main tributaries with
shown in Figure 43.
volatile organic compounds was found very low during the JDS. High
air and water temperatures during sampling might be a decisive factor
for low concentrations of VOCs in this case.
TNMN Water quality classes for Atrazine in 2001
FIGURE 43
Out of 23 polar pesticides investigated during the JDS, only Atrazine
100%
and Desethylatrazine could be found along the Danube in the average
no data
90%
concentrations of around 0.05 µg/l. It was only in a few samples that
class V
80%
the interim Danube quality target (being equal to that one set by the
class IV
70%
Rhine Commission) was exceeded. The few higher Atrazine results
class III
60%
were mainly found in the tributaries. The maximum value for
class II
50%
Atrazine was found in the Sava River (rkm 7 from the confluence to
class I
40%
the Danube; 0.78 µg/l) and it affected the Danube River downstream
30%
of its confluence with the Sava.
20%
10%
0%
Danube
Tributaries
Total
Characterisation of surface waters 98
During the Joint Danube Survey altogether 63 suspended matter
Heavy metals
samples and 187 sediment samples (including 26 core samples)
As mentioned above for a sound assessment of anthropogenic
from the Danube River and its major tributaries and arms were
contamination by heavy metals the determination of natural
analyzed for the EU WFD compounds para-tert-octylphenol,
background concentrations must be performed for setting of
4-iso-nonylphenol, di[2-ethylhexyl]phthalate, pentachlorophenol,
region-specific quality standards. The process of setting the
pentabromodiphenyl ether and tributyltin. Pentabromodiphenyl ether
respective quality standards for EU WFD priority substances is
and pentachlorophenol were not found in the investigated samples,
currently underway, thus, for a preliminary impact assessment
while tributhyltin was present only at low concentrations. Para-tert.-
the TNMN classification can only be applied.
octylphenol was found only in bottom sediments; significant
concentrations of 4-iso-nonylphenol and di[2-ethyl-hexyl]phthalate
Reviewing the 1996 ≠ 2000 TNMN data the assessment of the risk
were found in bottom sediments as well as in suspended solids (from
separates the heavy metals into several groups.
a few µg/kg up to more than 100 mg/kg) indicating the relevance
of these compounds as an indicator of industrial pollution in the
Cadmium and lead can be considered as the most serious inorganic
Danube River. Most of the elevated concentrations of nonylphenol
microcontaminants in the Danube River Basin. Their target values are
were found in the Serbian section of the Danube. The use of alkyl-
slightly exceeded in several locations in the middle Danube and
phenol-containing surfactants in this region was considered as a
seriously exceeded in most of the sampling sites of the lower Danube.
potential cause of the increased contamination. In the sediment
The situation in the case of cadmium is critical (Figure 40). The target
core samples decreasing concentration profiles of the EU WFD
value is substantial exceeded in many locations downstream rkm
compounds from the old to the new sediment layers were usually
1071 (values mostly 2-10 times higher than the target value). The
detected.
pollution of the lower Danube by cadmium and lead can be regarded
as a significant impact.
A special JDS task was focused on the search for unknown organic
compounds, which are not included in the regular monitoring
For mercury the data is missing from more than 40 % of locations.
programmes and were not directly searched for during the Survey.
Moreover, from almost half of monitoring sites reporting the results
Altogether 96 organic compounds were identified in the Danube
no quality class indication was possible because the limit of detection
water. The most ubiquitous compounds involved phthalates, fatty
of the analytical method used was higher that the target limit. So, the
acids, aliphatic chlorohydrocarbons and sterols. In addition to these
overall picture on mercury is incomplete focusing predominantly on
compounds, the following groups were observed: aliphatic and
the upper and middle Danube. Viewing the available data, the
aromatic hydrocarbons, phenols, hydroxy- and keto-aliphates and
elevated concentrations of mercury in the Danube mainstream and its
aromates, benzothiazoles and other sulphur and nitrogen-containing
tributaries in the upper and middle section are quite frequent. It can
compounds, organophosphates and a limited number of herbicides.
be stated that mercury is the only heavy metal for which the target
limit was exceeded even in the upper Danube section.
Impact assessment
Copper is a very common element naturally occurring in the environ-
The identification of the results surpassing class limits of the TNMN is of a
ment. Its concentration increases significantly downstream the
pure informational nature, as these class limits are not based on harmonised
Danube. Most of the exceeding values (up to several times the target
quality standards needed for hazardous substances within the River Danube
value) were detected in the lower section of the river (including
Basin. Classifying according to TNMN must in any case not prejudice the
tributaries). In the middle part the only significant occurrence of
assessment as performed by Member States under Article 5 of the WFD.
copper was detected in the Tisza River.
Under this assumption the Danube Basin States agree that ≠ for the first risk
assessment report ≠ the TNMN quality criteria may be applied as a pragmatic
solution.
Characterisation of surface waters 99
The pollution of the Danube River and its major tributaries by nickel,
The postemergent herbicide Atrazine, despite its banning in the upper
zinc and arsenic is rather low with the elevated profile only in the
Danube area, belongs to the most applied pesticides in the Danube
lower section. For zinc the non-compliance with the target value in
River Basin. This makes Atrazine detectable especially in the middle
the lower Danube was not very frequent, the limit was exceeded by
and lower Danube section including the tributaries. Extremely high
20 ≠ 100 %. Nickel concentrations in the whole Danube River did not
concentrations were found in the Sio and the Sajo. The elevated
go over the target limit during 1996 ≠ 2000. Arsenic levels in the
concentration of Atrazine in the Sava triggered the alarm in the
upper and middle Danube section do not pose any significant risk.
ICPDR Accident Emergency Warning System in 2003. Even though it
The problem is the lack of the data from the lower Danube, where
is still not clear what will be the EQS set by the WFD, Atrazine
elevated concentrations were observed. In general, the risk stemming
belongs to significant pollutants of the Danube River and its
from these three elements can be looked upon as low.
tributaries.
Organic micropollutants
The detected concentrations of volatile organic compounds indicate
The major problems in assessing the results on organic
that this group of pollutants is of lower relevance for the Danube
micropollutants are the lack of the data (especially from the lower
River Basin. Even though chloroform, being the most frequent VOC
section), high detection limits not matching with the environmental
representative, exceeded the target value in about one third of the
quality standards and a high uncertainty of analytical results. These
results primarily from the middle section (data from the lower section
all factors must be taken into account when formulating any
are missing) the non-compliance was not very significant. The excep-
statements on existing risk.
tions were several high values reported for the Slovak part of the
basin. However, comparing these high results with the substantially
For the two monitored persistent pesticides ≠ p,p'-DDT and Lindane
lower obtained by the JDS it can be concluded that the high values of
≠ the observed profile of occurrence is similar ≠ relatively low
chloroform sporadically found in the Danube River or its tributaries
amounts in the upper and middle sections and the elevated concentra-
can indicate that sources of pollution were still not sufficiently under
tions in the lower section. However, the substantially lower target
control (of course assuming that the analysis of chloroform was not
value for p,p'-DDT makes this substance a critical issue for the lower
influenced by an error).
Danube and the respective tributaries as the non-compliance factor in
these areas reaches the order of two magnitudes. This means that
despite a high uncertainty the level of pollution by p,p'-DDT is
significant and gives a strong indication of potential risk of failure to
achieve a good status taking into account the one-out all-out rule. An
important fact in this case is that p,p'-DDT is a pesticide banned in
Europe and it is likely that the contamination stems from the past
loads. However, the Inventory of Agricultural Pesticide Use reports
on uncontrolled and illegal trade of pesticide products leading to the
use of banned pesticides (e.g. DDT) by farmers so this pollution
source should be checked if possible.
A magnitude higher TNMN target value for Lindane suppresses the
extent of non-compliance for this pesticide. Thus, the situation is not
as negative as for p,p'-DDT. However, it is foreseen that the
environmental quality standard for Lindane that will be set by the
WFD may be substantially lower that the TNMN target value. In such
case the probability of risk of failure to achieve a good status would
be much higher and the situation similar to that for p,p'-DDT.
Characterisation of surface waters 100
4.5.1.3. Impacts from nutrient loads
Link to pressures
This paragraph discusses the impacts from the emissions of nutrients
Chapter 4.4 provides an overview of the emissions of nitrogen and
in the Danube Basin District (see Chapter 4.4). The impact assessment
phosphorus to the Danube Basin District surface waters, which repre-
starts from the moment that the emitted nutrients reach the surface
sent the pressure responsible for the impacts discussed here. The
waters in the catchment (see Figure 44). In the surface waters, the
subdivision of these emissions over different pathways is relevant in
nutrients undergo a range of transformation processes, which together
this respect: the emissions stem from point sources (municipalities,
with the emissions determine the status of the surface waters. Some
industry and agriculture) and from diffuse sources (erosion and
of the transformation processes result in loss or (semi-) permanent
surface runoff, ground water inflow and atmospheric deposition).
storage of nutrients in the catchment. The remaining nutrients are
From the diffuse sources, a part has a natural origin, while the rest is
transported downstream, eventually towards the Danube Delta and the
of an anthropogenic nature, mostly related to agriculture. The applica-
Black Sea.
ble emission control measures are different for the different pathways.
Furthermore, the impacts also have some relation to the emission
The present paragraph discusses the emissions (pressures), the status
pathways. For example, the phosphorus emitted by WWTP's has a
of the surface waters and the impacts. The focus is on the trans-
higher bio-availability than the phosphorus stemming from the
boundary, large scale impacts. The impacts on the national level are
erosion of the soils.
discussed in Part B.
Present status
Schematic representation of the nutrient balances
Nutrient concentrations in the Danube River and its tributaries
in the surface water network
FIGURE 44
The nutrient concentrations in the Danube River and its tributaries are
discussed on the basis of the TNMN results. These represent the
Emissions
larger transboundary rivers. For the smaller water bodies reference is
made to Part B.
River catchment
The 2001 TNMN Yearbook45 presents the current status (2001) in
an aggregated form, indicating the classification of the observed
concentrations in 5 classes. Class I represents the lowest
concentrations and Class V represents the highest values. The upper
transformation
limit of class II represents a Target Value46. The summary charts for
processes
status
different nutrient species are presented in Figure 45.
These graphs indicate that for most of the stations sufficient data are
available (only about 10 % is classified as "no data"). The percentage
Losses/Storage
Transport
of stations satisfying the Target Value varies between 50 % and 65 %
downstream
for the different parameters. It should be noted that the analysis
concerns yearly averaged concentrations.
The present analysis requires the availability of data of high and
homogenous quality, covering the whole catchment area. The time
scale of the issue requires data over a long period of time, at least
several decades. There is not one individual data set with sufficient
temporal and spatial coverage. For this reason, gaps and
inconsistencies in the existing data sets have been addressed by using
mathematical models to interpret the data (see remarks on the use of
models in Chapter 4.4).
45 ICPDR (2001).
46 This is an existing classification system. It should not be confused with the WFD Good Ecological Status criteria for these water bodies.
To determine the Ecological Status, a system with type specific class boundaries is required.
Characterisation of surface waters 101
Overall assessment of present nutrient concentrations (on the basis of TNMN data from the year 2001)
FIGURE 45
N-NH4
N-NO3
100%
100%
no data
90%
90%
class V
80%
80%
class IV
70%
70%
class III
60%
60%
class II
50%
50%
class I
40%
40%
30%
30%
20%
20%
10%
10%
0%
0%
Danube
Tributaries
Total
Danube
Tributaries
Total
P-PO4
total P
100%
100%
90%
90%
80%
80%
70%
70%
60%
60%
50%
50%
40%
40%
30%
30%
20%
20%
10%
10%
0%
0%
Danube
Tributaries
Total
Danube
Tributaries
Total
By inspecting the observed concentrations for individual stations
along the Danube River and its tributaries, additional information
can be obtained. Figure 46 and Figure 47 present such information for
nitrogen in nitrates47 and for total phosphorus, for the years
1996-2001. These graphs show clearly that the highest levels are
observed in the tributaries and not in the Danube itself. A clear spatial
trend along the Danube can not be observed for total phosphorus.
For nitrates such a trend exists, but it is not representative for total
nitrogen.
47 Nitrates represent an important species of nitrogen, but it may not be considered representative for the total nitrogen content of the river, since ammonium and
organic nitrogen are not included.
Characterisation of surface waters 102
Temporal and spatial trends of nitrate concentrations
(data for the years 1996-2001; figures from TNMN Yearbook 2001; ICPDR 2001)
FIGURE 46
Temporal trends of nitrate-nitrogen in Danube River
NO3-N mg/l
6
6
5
5
4
4
3
3
2
2
1
1
0
0
D01
D02
A01
A02
A03
A04
K01
K02
K03
S
S
H01
S
H02
H03
H04
H05
HR01
CG01
CG02
HR02
CG03
CG04
CG05
CG06
RO01
CG07
CG08
RO02
BG01
BG02
BG03
BG04
RO03
S
S
S
S
S
S
S
S
RO04
BG05
RO05
UA01
RO06
UA02
RO07
RO08
2581
2204
2204
2120
1935
1874
1869
1806
1806
1768
1768
1708
1560
1435
1429
1427
1367
1337
1258
1174
1155
1077
1071
955
851
834
834
641
554
503
432
375
375
132
132
18
18
0
0
Monitoring sites / distance from the mouth [km]
Temporal trends of nitrate-nitrogen in tributaries
NO3-N mg/l
12
12
10
10
8
8
6
6
4
4
2
2
0
0
01
D03
D04
K04
H05
S
H07
H08
H09
I02
CZ01
CZ02
S
HR03
HR04
HR05
CG10
CG11
CG12
S
HR06
HR06
HR07
HR08
HR08
CG13
CG14
CG15
CG16
CG17
BG06
BG07
BG08
RO09
S
S
S
S
S
S
S
S
RO10
MD01
MD02
MD04
RO11
MD03
ajo
alzach
S
S
h
io
ava
iret
Inn
Inn/
Morava
Morava/Dyje
Va
S
Drava
T
isza
T
isza/
S
V
elka Morawa
Iskar
Jantra
Russ. Lom
Arges
S
Pruf
Monitoring sites / Tributary
1996
1997
1998
1999
2000
2001
Characterisation of surface waters 103
Temporal and spatial trends of the concentration of total phosphorus
(data for the years 1996-2001; figures from TNMN Yearbook 2001; ICPDR 2001)
FIGURE 47
Temporal trends of total phosphorus in Danube River
P total mg/l
8
8
7
7
6
6
5
5
4
4
3
3
2
2
1
1
0
0
D01
D02
A01
A02
A03
A04
K01
K02
K03
S
S
H01
S
H02
H03
H04
H05
HR01
CG01
CG02
HR02
CG03
CG04
CG05
CG06
RO01
CG07
CG08
RO02
BG01
BG02
BG03
BG04
RO03
S
S
S
S
S
S
S
S
RO04
BG05
RO05
UA01
RO06
UA02
RO07
RO08
2581
2204
2204
2120
1935
1874
1869
1806
1806
1768
1768
1708
1560
1435
1429
1427
1367
1337
1258
1174
1155
1077
1071
955
851
834
834
641
554
503
432
375
375
132
132
18
18
0
0
Monitoring sites / distance from the mouth [km]
Temporal trends of total phosphorus in tributaries
P total mg/l
2,0
2,0
1,8
1,8
1,6
1,6
1,4
1,4
1,2
1,2
1,0
1,0
0,8
0,8
0,6
0,6
0,4
0,4
0,2
0,2
0,0
0,0
01
D03
D04
K04
H05
S
H07
H08
H09
I02
CZ01
CZ02
S
HR03
HR04
HR05
CG10
CG11
CG12
S
HR06
HR06
HR07
HR08
HR08
CG13
CG14
CG15
CG16
CG17
BG06
BG07
BG08
RO09
S
S
S
S
S
S
S
S
RO10
MD01
MD02
MD04
RO11
MD03
ajo
alzach
S
S
h
io
ava
iret
Inn
Inn/
Morava
Morava/Dyje
Va
S
Drava
T
isza
T
isza/
S
V
elka Morawa
Iskar
Jantra
Russ. Lom
Arges
S
Pruf
Monitoring sites / Tributary
1996
1997
1998
1999
2000
2001
Characterisation of surface waters 104
Historical development of the Danube nutrient loads
The historical development of the Danube nutrient loads over the last
50 years has been reconstructed by means of mathematical modelling
with MONERIS, since it can not be derived from field data alone.
Figure 48 shows the result.
Historical development of nutrient loads in the Danube River for dissolved inorganic nitrogen (top) and total phosphorous (bottom)
based on modelling results with MONERIS; the estimates refer to the Danube River before it enters the delta
FIGURE 48
DIN load [kt/a N]
800
800
Almasov 1961
700
700
TNMN load
600
600
Model results
500
500
Uncertainty ranges
400
400
300
300
200
200
100
100
0
0
the
1955
1960
1965
1970
1975
1980
1985
1990
1995
2000
purple
and red
bars >>
The green bars represent the model results from MONERIS. The dashed lines represent the uncertainty ranges, estimated by expert judgement. The purple and red
bars represent the available field data: historical data reported by Almasov in 1961, data collected by the Danube countries in the framework of the TNMN and the
beige
Buch rest Declaration ("TNMN load").
and
blue
TP load [kt/a P]
60
60
50
50
40
40
30
30
20
20
10
10
0
0
1955
1960
1965
1970
1975
1980
1985
1990
1995
2000
The green bars represent the model results from MONERIS. The dashed lines represent the uncertainty ranges, estimated by expert judgement. The purple and red
bars represent the available field data: historical data reported by Almasov in 1961, data collected by the Danube countries in the framework of the TNMN and the
Bucharest Declaration ("TNMN load").
Characterisation of surface waters 105
The river loads of Dissolved Inorganic Nitrogen (DIN) show an
The development of the annual nutrient loads shows a pronounced
increase from 1950 onwards up to a maximum in the mid 1980s. The
inter-annual variability, which is strongly influenced by hydrological
increase is about a factor of 2.5 for DIN. In the 1990s, the river DIN
differences. For example, the Danube discharge has been higher than
loads decrease again for DIN (~ - 27 %). Compared to the 1950s the
average for 7 consecutive years in 1996-2002. This affects the
present DIN load is about 1.9 times higher. This increase of the river
nutrient loads to such an extent that human induced trends can very
load is the result of the increase of the anthropogenic emissions of
well be obscured by this hydrology induced variability.
nitrogen to the river system.
The historical development of the river loads is the direct result of the
The change of the load of Total Phosphorus (TP) is determined by
historical development of the anthropogenic emissions of nutrients in
two factors. As with DIN, the development of the emissions plays an
the Danube River Basin District (see Chapter 4.4). The decrease of the
important role. Another relevant factor is the construction of the Iron
loads in the past decade is partly the result of emission control
Gate dams in the second half of the 1970s, which introduces a strong
measures in the basin. To a significant degree however, it is the result
P storage in the backwater area of the dams (see impact assessment
of the economic crisis in the former communist countries. This has
below). Therefore, the highest TP load was estimated for the mid of
caused a dramatic decrease of the application of mineral fertilizers,
the 1970s, just before the Iron Gate was established. A second
the closure of large animal farms (agricultural point sources) and the
maximum occurs in the mid of 1980s due to the emission maximum.
closure of nutrient discharging industries (e.g. fertilizer industry). In
The highest TP load around 1975 is about a factor of 1.9 higher than
order to get a full picture of the nutrient pressures impacting the
the 1950 load. The TP loads decrease in the 1990s (~ - 29 %).
coastal waters of the DRBD an estimation is still needed of the
Compared to the maximum in the mid 1970s, the TP load is reduced
nutrient loads stemming from the Romanian Black Sea coastal
by about 42 %. The TP load of 2000 is only about 10 % higher than
catchments that are part of the DRBD but have not been included in
the 1950s load. That is due to the storage effect of Iron Gates area.
the current modelling of nutrient loads into the Black Sea.
Without this effect, the present TP load would be about 40 % higher
than in the 1950s.
The Report "State of the Environment of the Black Sea, Pressures
and Trends, 1996 - 2000", issued by the Black Sea Protection
Commission48, reports substantially lower values for the Danube
River load of inorganic nitrogen around the year 2000. The reason for
this discrepancy is not fully understood, and is subject of study
(e.g. in the EU research project daNUbs).
48 BSC (2002).
Characterisation of surface waters 106
Impact assessment
there is a large data availability problem: more than 60 % of
The most relevant impact of high nutrient loads is eutrophication.
the stations are classified as "no data". The available data indicate
This is defined as the enrichment of water by nutrients, especially
eutrophication problems in the slow-flowing and relatively shallow
compounds of nitrogen and/or phosphorus, causing an accelerated
reaches of the Middle Danube (in Hungary). The JDS results also
growth of algae and higher forms of plant life to produce an
point in this direction (see Figure 50). This survey in August-
undesirable disturbance to the balance of organisms present in the
September 2001 indicated a strong algae bloom in the Hungarian
water and to the quality of the water concerned49.
part of the Danube.
Impact on the Danube River and its tributaries
The eutrophication impacts in the Danube River and its tributaries are
Information related to the concentrations of chlorophyll-
discussed on the basis of the TNMN results. These represent the larger
in the Danube and its large tributaries, on the basis of
transboundary rivers. For the smaller water bodies we refer to Part B.
TNMN field data from 2001 (compare also Figure 50)
FIGURE 49
The 2001 TNMN Yearbook50 tries to assess the concentrations of
Chlorophyll
chlorophyll- . This parameter represents the amount of live
100%
no data
phytoplankton in the surface water and is generally considered to
90%
class V
be an indicator for eutrophication. The Yearbook presents the current
80%
class IV
impacts (2001) in an aggregated form, indicating the classification
70%
class III
of the observed concentrations of chlorophyll- in 5 classes. Class I
60%
class II
represents the lowest concentrations and Class V represents the
50%
class I
highest values. The upper limit of class II represents a Target Value51.
40%
The summary chart is presented in Figure 49. This graph indicates that
30%
20%
10%
0%
Danube
Tributaries
Total
Concentrations of chlorophyll-
[µg/l] in the Danube River on the basis of field data collected during the JDS (compare also Figure 49)
FIGURE 50
g/l
160
160
140
Dunafˆldv·r
140
120
Baja
120
100
100
80
80
Paks
Hercesgsz·ntÛ
Gabcikovo
60
60
reservoir 2
u/s Novi Sad
40
Neu-Ulm
Passau
40
Irongate-reservoir
u/s Ruse
Vikova
20
20
0
0
2600
2400
2200
2000
1800
1600
1400
1200
1000
800
600
400
200
0
49 Council Directive 91/271/EEC of 21 May 1991 concerning urban waste-water treatment (UWWT-Directive).
50 ICPDR (2001).
51 This is an existing classification system. It should not be confused with the WFD Good Ecological Status criteria for these water bodies.
To determine the Ecological Status, a system with type specific class boundaries is required.
Characterisation of surface waters 107
Transboundary conveyance of nutrients in the Danube River
Some years ago, a Transboundary Diagnostic Analysis was carried
and its tributaries
out into the Danube River loads of nitrogen and phosphorus (Danube
If we compare the total emissions of N and P in the Danube River
Pollution Reduction Programme, GEF-UNDP, 1999). Figure 51 shows
Basin with the river loads to the Black Sea, we find that the river
the longitudinal profile along the River Danube of the in-stream load
loads are substantially smaller. Apparently, the nutrients undergo loss
of N and P respectively. The load is subdivided over the countries of
or storage in the Danube Basin surface waters. Loss processes imply
origin. Figure 5 provides a similar profile for the annual water volume.
the permanent removal of nutrients from the hydrosphere, while
storage processes are of a temporal nature: remobilisation may be
The results show that certain countries contribute relatively strong to
relevant depending on the time scale under consideration. Due to the
the annual water volume: as a result of the basin morphology and of
different nature of N and P, their fates in the surface waters are also
the climatic conditions, the area specific run-off is high in those
different. For nitrogen mainly denitrification is relevant. This is a loss
countries (e.g. Austria, Germany, Slovenia and Bosnia i Herzegovina).
process taking place mostly on the interface between the water and
Other countries have a low area specific run-off (e.g. Hungary).
the sediments. The process removes nitrogen from the hydrosphere to
These natural variations are reflected in the river load profiles for
the atmosphere in the form of N2 gas. For phosphorus on the contrary
N and P. The areas with a high specific run-off have a relatively high
there is only (semi-)permanent storage in the aquatic sediments.
contribution, while the areas with a low specific run-off have a
relatively low contribution. The load profile for P shows a strong
Loss and storage processes turn out to be concentrated in the small
decrease in the Iron Gates area; due to the local point sink which was
river systems, where there is an intensive contact between the water
already mentioned above.
and the aquatic sediments. In this respect a natural river system with
wetlands and floodplains is more efficient than a strongly canalised
Climatic conditions
(artificial) one. The River Danube and its main tributaries play a
Climatic conditions have a distinct effect on the river hydrology, and
minor role for nitrogen losses. In respect to phosphorus the Iron Gate
significantly affect the impact assessment. For example, hydrologic
backwater area represents a major storage area due to net
variations may induce a variability of the nutrient concentrations
sedimentation of P in particles. Recent research indicates that about
(e.g. the high concentrations of P in the Danube Delta in the
1/3 of the incoming load is semi-permanently stored. It can be
extremely dry year 2003). Furthermore, the Danube River nutrient
expected that this storage function is limited in time (< 100 years).
loads to the Black Sea show a pronounced inter-annual variation
influenced by the variability of the river discharge, which may be
The losses and storage of nutrients in the small scale river networks in
strong enough to obscure a man-induced trend.
the Danube Basin show strong geographical differences. This is the
result of the natural morphological and hydrological gradients in the
Future developments
basin. Generally speaking, areas with a relatively high specific
The decrease of the Danube River nutrient loads in the last decade is
runoff54 show relatively low losses and storage and consequently
partly a positive side-effect of the economic crisis in the middle and
convey a relatively high share of the nutrient emissions downstream.
lower Danube Basin. The ongoing economic recovery will potentially
result in increasing nutrient loads to the Black Sea. However, the
economic development in these countries is a social necessity, even if
an increase in the level of production probably will lead to an increase
of nutrient emissions to the environment in the future. Therefore, the
challenge is to compensate these possible increases by a decrease of
emissions from point and diffuse sources and to level the increase of
emissions.
From the present state of knowledge we can derive that future
emission control efforts can best be concentrated on phosphorus
(being the limiting nutrient). Furthermore, measures directed
at dissolved P-compounds, which are easily available for algae
growth, are most effective.
52 Specific runoff: river runoff generated per unit of surface area (m3/s/m2).
Characterisation of surface waters 108
River load profiles of nitrogen (a) and phosphorus (b), subdivided over countries of origin ≠ derived from simulations
with the Danube Water Quality Model (DWQM) during the GEF-UNDP Danube Pollution Reduction Programme, 1999 UNDP/GEF (1999a)
FIGURE 51
(a)
river load of N (kt/y)
600
N
(kt/y)
%
28.3
5.1%
Ukraine
8.2
1.5%
Moldova
500
121.3
22.0%
Romania
400
22.8
4.1%
Bulgaria
35.7
6.5%
Bosnia i Herzegovina
300
72.3
13.1%
Serbia and Montenegro
22.6
4.1%
Croatia
19.5
3.5%
Slovenia
200
30.8
5.6%
Hungary
29.7
5.4%
Slovak Republic
15.2
2.8%
Czech Republic
100
76.8
13.9%
Austria
67.9
12.3%
Germany
0
551.0 100.0%
source
Inn
Drava
Sava
Delta
Tisza
(b)
river load of P (kt/y)
60
P
(kt/y)
%
50
4.0
8.1%
Ukraine
1.4
2.9%
Moldova
40
12.7
26.0%
Romania
30
4.0
8.1%
Bulgaria
2.2
4.6%
Bosnia i Herzegovina
20
7.0
14.4%
Serbia and Montenegro
2.2
4.5%
Croatia
1.3
2.7%
Slovenia
3.8
7.7%
Hungary
10
1.7
3.5%
Slovak Republic
1.1
2.2%
Czech Republic
3.8
7.7%
Austria
3.7
7.6%
Germany
0
48.9
100.0%
source
Inn
Drava
Sava Iron Gates
Delta
Tisza
The introduction of P-free detergents, P-removal at municipal and
important role in nitrogen management, as diffuse sources from
industrial waste water treatment plants and the avoidance of
agriculture in the Eastern Danubian countries are bound to increase as
agricultural point sources are such measures. In the same time,
a result of the expected economic growth.
nitrogen removal from point sources (treatment plants) will play an
Characterisation of surface waters 109
4.5.1.4. Impacts caused by hydromorphological alterations
Pronounced sediment accumulations occur behind the Iron Gate
Although a number of studies have been carried out on individual
dams. Between 1972 and 1994, about 325 million tons of sediment
river stretches and special aspects of river degradation, a
were deposited, taking up 10 percent of the entire reservoir and result-
comprehensive assessment of the direct and indirect effects of
ing in a much reduced transport of suspended solids and soil
hydro-morphological alterations in the DRB countries does not yet
sediments downstream of the Iron Gate. In the backwater of the Iron
exist. Therefore, it is not possible to give an overview of the situation
Gate, stretching upstream over 310 km (up to Novi Sad), the effects
for the whole Danube basin. Instead examples will be given, which
of the increased inner and outer colmation (clogging) have led to
highlight the kind of impacts from hydromorphological changes that
problems with the supply of drinking water in communities located
have occurred and allow the assumption that similar impacts have
along the impoundment.
taken place in other parts of the basin where similar pressures from
hydromorphological alterations exist.
Downstream of Bratislava from the impounded Danube 80 % of
waters are diverted into the sealed Gabcikovo power side-canal. The
Impacts from river regulation works
remaining 20 % for the 40 km long section of the main river bed are
The Danube regulation works of the 19th century (since 1870 in the
too small to balance various effects: A drop of 2 - 4 m of the surface
Austrian-Hungarian Monarchy, since 1895 in districts of the present
and groundwater table and resulting desiccation of bank forests; a
Serbia and Montenegro) together with the nearly complete loss of
loss of hydro-dynamics in the disconnected, artificially irrigated and
sediment supply from the Upper Danube catchment in the 20th
impounded side-arm systems (altogether 8,000 ha on both sides of the
century (retained by a series of dams from the Alps down to
river); absence of former morphological processes resulting in a
Gabcikovo Hydropower Dam), increased the sediment deficit for
disappearing of pioneer species, a reduced water quality and an
the entire Danube up to the Iron Gate and even beyond. The result is
overgrowing of former open or periodically inundated habitats.56
an ongoing channel incision for long stretches of the Danube,
e.g. on the Hungarian Danube of about 1 - 3 cm/a. On the Austrian
Specific impacts from dams and weirs (disruption of river continuity)
Danube downstream Vienna, the river bed is eroding at a rate of
Impoundments lead to an alteration of the hydraulic characteristics of
2.0 - 3.5 cm/a53. Connected water tables in the alluvial flood plain
a river. A major problem associated with the interruption of the river
are reduced as well, sometimes in a magnitude of several meters.
continuum is the decrease of velocity and retention of sediment in the
An example can be seen in parts of the upper Danube in Baden-
impounded stretches. As a consequence of reduced slope and current
W¸rttemberg (rkm 2,670 - 2,655).
velocity, fine sediments cover the natural habitats of the bottom-
dwelling organisms and clog the interstices in the bed sediments.
The meander cut-offs carried out to improve the navigation route
This leads to a diminished flow of oxygen into the bed sediments and
(e.g. the Hungarian Danube was shortened from 472 km to 417 km)
to a reduced recharge of the groundwater. These changes in flow and
have changed the water table and resulted in a progressive silting of
substrate composition affect the benthic invertebrates and the
the many cut-off side-channels and oxbows. Most important flood-
spawning grounds for fish. Typical rheophilic fish species, dependent
plain areas, such as the protected areas of Gemenc-BÈda Karapancsa
on gravel and cobble as spawning habitats, such as Thymallus
are slowly drying out. The local nature and water management
thymallus, Chondrostoma nasus, Barbus barbus, or Hucho hucho
authorities have started to halt this erosion and improve the water
are especially affected during their spawning and larval phase.
exchange by re-connecting the Gemenc floodplain area with the main
Another impact of reduced current velocity and changes in sediment
channel and retaining more water in the side-arm system. The
composition in mountain streams is the loss of habitat for algae.
formerly rich fisheries can only thrive by restoring the migration
Hydrurus foetidus, a typical winter species, is one of the most densely
routes and spawning areas in the floodplain54.
colonised habitats for benthic invertebrates57. Bottom-dwelling,
rheophilic species feeding on algal and bacteria disappear and species
During the last ten years the war and post-war impacts in former
typical for fine sediments can occur in masses (for example
Yugoslavia inhibited the maintenance and reconstruction works in
Tubificidae). As a result, typical benthic invertebrate communities are
many areas of the Danube River. Between Baja (HU) and Belgrade
absent and the ecological integrity of such rivers is disturbed.
numerous ecologically valuable bank segments and islands were
therefore preserved or have even self-restored themselves over these
past ten years55.
53 HANISCH & KORDINA (2004).
54 WWF (2002).
55 WWF (2002).
56 WWF (2002).
57 MOOG & JANECEK (1991).
Characterisation of surface waters 110
Due to all these effects the self-purification capacity of the river may
Effects of intermittent hydropower generation (hydropeaking)
also be reduced. As an example, monitoring results on the Bavarian
Intermittent hydropower generation (hydropeaking) causes special
Danube show a change in water quality from class II to II/III after
downstream effects on the aquatic fauna. Water is released by pulses
completion of the impoundments Straubing and Geisling in 1999,
several times per day, which causes tremendous water level changes.
although discharge of waste water has been minimised. The impound-
These "artificial floods" damage the aquatic fauna, by sweeping them
ment changes the living conditions for all organisms ≠ e.g. slower
away during pulses and drying out in periods of retention. In the
current velocity ≠ and results in a change in river water quality due to
Austrian part of River Drau/Drava for example a reduction of 50 % of
intensified secondary production.
the fish stock, and 80 % of the benthic invertebrate community, has
been attributed to peak operation in the Mˆll tributary and the
Migratory species are impacted by dams and impoundments that
impoundment of the Malta tributary61.
disrupt the longitudinal connectivity of rivers and streams. In-channel
structures that exceed a certain height prevent or severely reduce the
Effects on riverine wetlands (disruption of the lateral connectivity)
migration of certain aquatic species. Particularly some of the
Wetland habitats in the Danube river basin have been drastically
migratory fish species such as the sturgeon or the sterlet can no
altered in the last two centuries. The main causes of wetland destruc-
longer reach their spawning grounds, feeding and shelter areas.
tion have been the expansion of agriculture uses and river engineering
works mainly for flood control, navigation and power production.
One of the well-known impacts of the Iron Gate dams has been the
Drainage and irrigation are also responsible for the drop in water
extinction of sturgeons migrating in the middle and upper Danube
levels and the loss of wetland and floodplain forests, leaving only a
basin after its construction58. The construction of the Iron Gate dams
few natural forests. Compared to the 19th century less than 19 % of
has changed the distribution of fish species. The migration path was
the former floodplains (7,845 km2 out of once 41,605 km2) are left in
cut for anadromous59 species coming from the Black Sea into the
the entire Danube basin (see Figure 52)62.
Danube for spawning. Now, in Serbia and Montenegro, Acipenser
gueldenstaedti (Danube or Russian sturgeon), Acipenser ruthenus
Since the 1950s, altogether 15-20,000 km2 of the Danube floodplains
(sterlet), Acipenser stellatus (stellate or starred sturgeon), Huso huso
were cut off from the river by engineering works. In the large plains
(beluga), and Acipenser nudiventris are present only downstream
of the middle and lower Danube (Hungary, Serbia and Montenegro,
from the Iron Gate II. Acipenser ruthenus (sterlet) is present in all
and Romania) extensive flood protection dike systems and
Serbian parts of the Danube, as well as its tributaries, such as the
drainage/irrigation networks were built up since the 16th century, but
Sava, the Tisza and the Morava River.
especially in the 19th and 20th century, and have caused a huge loss.
For instance, in Hungary, 3.7 million ha were diked in and in
Another example is known from the Inn River in Germany, where
Romania 435,000 ha.
over 30 fish species were originally present. After the construction of
the first impoundment at Jettenbach in 1921, professional fisheries on
the river collapsed. Today, only two fish species are able to maintain
their stocks by natural reproduction in this part of the river60.
58 REINARTZ (2002).
59 Anadromous species: species that spend their adult life in the sea but swim upriver to freshwater spawning grounds in order to reproduce.
60 WAIDBACHER & HAIDVOGEL (1998).
61 JUNGWIRTH (2003).
62 UNDP/GEF (1999d).
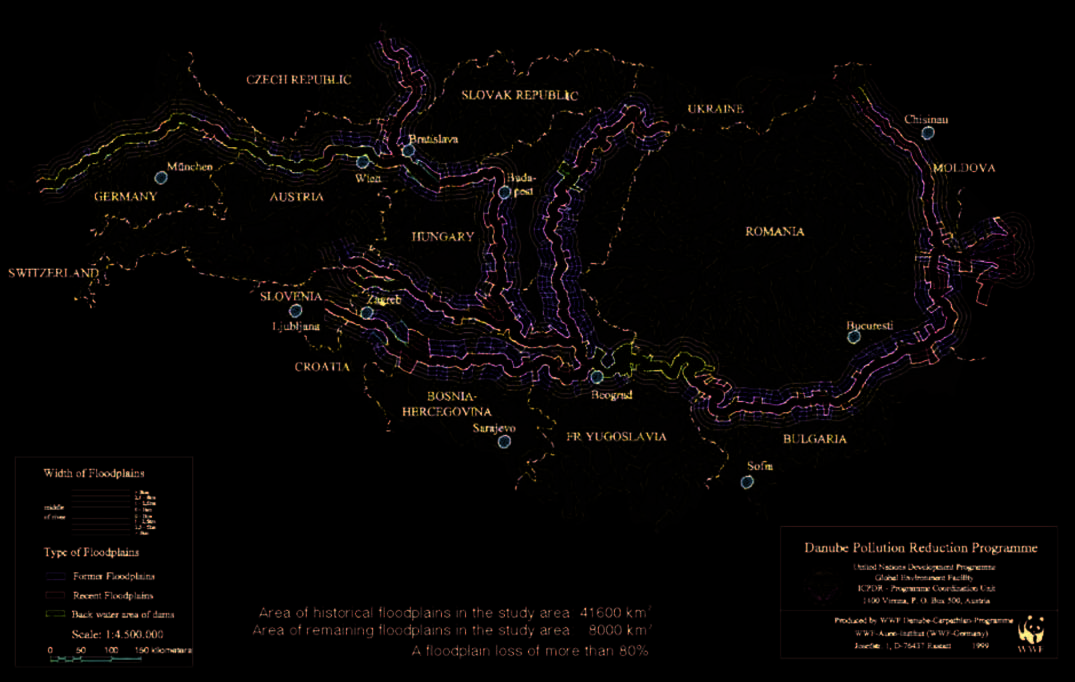
Characterisation of surface waters 111
Symbolised view of floodplains in the Danube River Basin
FIGURE 52
Characterisation of surface waters 112
In the Danube section between Romania and Bulgaria, dikes are
Impacts from navigation
usually only 200 to 300 m away from the main stream. Through this
Impacts from navigation often overlap with those of hydropower gen-
process, starting in the 16th century, the formerly extended
eration and flood defence, and are not very well studied. Special
floodplains along the Danube have been reduced drastically. Outside
measures for maintenance of the navigation channel such as dredging
the dikes, natural succession processes from reed and marsh
affect the vertical connectivity. Benthic invertebrates inhabiting the
vegetation towards dry meadows but also forestation measures alter
river bottom and fish eggs are directly affected in areas of gravel
the habitat structure of the dynamic floodplain. These habitats, which
extraction. Studies in Germany have shown that after the termination
are disconnected and partly far away from the Danube, are lost as
of gravel extraction typical benthic invertebrate communities re-
spawning grounds for fish (pike, carp, etc.). Their loss contributed to
establish themselves within two to three years65. From the mechanical
the decline of fisheries in the lower Danube63.
point of view, regular ship traffic causes waves resulting in artificial
changes of water level along the riparian zones. Consequences are the
The complex system of riverine flood plains with its typical aquatic
disturbance of reproduction habitats for fish and benthic invertebrates
communities is dependent on constant changes in the duration,
as well as de-rooting of aquatic plants. Fish larvae and young fish are
frequency and amount of floods. Elimination of these fluctuations
affected by the wash of the waves. Another negative effect of ships'
inhibits regeneration of these habitats and siltation of backwaters can-
engines is the unnatural suspension of fine sediments which increases
not be reversed. Impacts on fauna and flora are significant. Typical
turbidity and reduces the incidence of light needed for plant and algae
fish fauna dependent on different habitat types during their life cycle
growth. Construction of harbours especially those with steep,
(i.e. areas of refuge during floods and specific spawning and larval
artificial banks have adverse effects on the aquatic fauna and cannot
habitats) suffer from loss of habitats. Studies on the Middle Danube
be used as habitats66. German studies have shown that only half of the
have shown that following the construction of flood control measures
original species numbers and only 1/10 of the expected abundance
commercial fisheries have lost their importance. This factor is also
can be demonstrated in such artificial surfaces67.
apparently responsible for the decrease of fish catches in the Rajka
and Budapest section of the Danube during the last two decades
Exploitation of sand and gravel and other activities leading to
from over 300 tons in 1976 to approximately 50 tons in 1996.64
changes of gravel-dominated river bed can significantly affect the
In the lower Danube the number of fish species has declined from
sturgeon population, which requires deep gravel-dominated habitats
28 species before 1980 to 19 species today. Dominant species like the
with a high water velocity during the spawning period. In addition,
carp have been replaced by species of value for fisheries and have
water pollution can impact negatively the functionality of spawning
resulted in a decrease of fish catch from 6,000 t/a down to 2,500 t/a
sites, the development of embryos and reduce the abundance of
presently.
benthic invertebrates found in the diet of most sturgeons. And the
increase of waves disturbs the biota on the river banks.
Expected impacts from future infrastructure projects
Based on the experiences described above it is likely that impacts
from future infrastructure projects (see Chapter 4.4.4.5.) may result in
similar impacts. This will depend on how these projects are
implemented and the possibilities to reduce negative impacts should
be explored to the fullest extent. Therefore, it is of paramount
importance that an environmental impact assessment be carried out
that includes the criteria of the WFD in order to ensure that these
water bodies remain intact.
63 WWF (2002).
64 GUTI & KERESZTESSY (1998).
65 TITTIZER (1984).
66 KOVACECK et al. (1991).
67 TITTIZER & SCHLEUTER (1989).
Characterisation of surface waters 113
4.5.1.5. Impacts from over-fishing
It has been shown that migratory sturgeons have suffered from over-
Sturgeons and paddlefish exhibit a very specific combination of
fishing in the Danube River ≠ documented by a decline of stocks in
morphological, habit and life history characteristics, which make
the Upper and Middle Danube even before the construction of Iron
them highly vulnerable to impacts from human activities, in particular
Gate dams ≠ as well as by the use of fishnets in the Danube delta,
to fisheries. The following information is based on the IAD Report
which do not allow those species to proceed further up the Danube to
"Sturgeons in the Danube River"68.
reach their natural spawning areas.
During the last century sturgeons used to easily reach the Bulgarian
Sturgeons and paddlefish belong to the class of bony fishes, the Osteichthyes
part of the river. The catch of those species was then about 23 - 45
with the subclass Actinopterygii containing the Chondrostei and the order of
tons per year. As a result of over-fishing and of other causes during
Acipenseriformes. The order of Acipenseriformes contains three families of
the last 10 years, the number of sturgeon species significantly
which the family Acipenseridae (sturgeons) and Polyodontidae (Paddlefishes)
declined. For example Acipenser sturio disappeared about 50 years
are still represented by living species.
ago and there is no registered catch of Acipenser nudiventris since 20
years. Currently, natural spawning areas around the town of Vidin and
According to the IAD Report68, out of six acipenserid species once native to the
Kozlodui are reached only by single specimen of Huso huso and
Danube Basin, only four still reproduce in the Lower Danube ≠ Acipenser
Acipenser gueldenstaedti. The impact on sturgeon populations by
gueldenstaedti (Danube or Russian sturgeon), Acipenser ruthenus (Sterlet),
marine fisheries is also documented.
Acipenser stellatus (Stellate or Starred sturgeon) and Huso huso (Beluga).
Acipenser sturio and Acipenser nudiventris (Fringebarbel sturgeon) have
possibly become extinct, while the stocks of anadromous59 species A.
gueldenstaedti, A. stellatus, and H. huso have been drastically decreased in the
Lower Danube, as documented by catches. A remnant population of the resident
form of A. gueldenstaedti still exists upstream of the Iron Gate dams.
The location of spawning sites of migratory species in the Lower Danube under
the changed migration conditions, the exact status of stocks and their
reproduction is still unknown. Stocks of the only true potamodromous69 sturgeon
species in the Danube, the sterlet (A. ruthenus), depends on stocking in the
Upper Danube. Due to improved water quality and temporary protection and
stocking measures, the sterlet stocks have been increasing in the Middle
Danube. In the Lower Danube, the stocks of the sterlet have been reduced to a
minimum.
According to the available data, sturgeons are critically endangered in the
Danube River Basin. Scientists indicate clearly that most species of sturgeon
and paddlefish are endangered. However, it is rather difficult to exactly relate a
threat for a given sturgeon species to a single cause or to a particular
environmental impact.
68 REINARTZ (2002).
69 Potamodromous species: migrating within rivers and streams
Characterisation of surface waters 114
Some protection measures
Other measures, aimed at conserving and protecting sturgeons in Bul-
Legislation in some countries prohibits over-fishing of species from
garia, are the artificial fish farming of sturgeon species. Besides the
the Danube and Black Sea during their spawning period (e.g. in
artificial restocking of the Danube, the restoration of natural
Bulgaria from 20 April - 5 June). Fishing of individual specimen of
population could be supported by the designation of protected areas
sturgeons with a size smaller than 140 cm for Huso huso; 90 cm
in the preferred spawning areas for sturgeons. In those parts of the
for Acipenser gueldenstaedti and 40 cm for Acipenser ruthenus is
river a prohibition for the catch of those species during the entire year
prohibited.
could be imposed.
A common practice for reducing overexploitation is defining annual
In Romania, the following measures are secured for the protection and
quota for the catch of sturgeon species. For instance, Bulgaria had in
development of fish populations:
2002 a quota to export 1,720 kg of Beluga caviar and 20 kg of
≠ prohibition of fishing mainly in the spawning season, generally in the period
Russian sturgeon caviar from natural sources. For 2004 the quota for
12 April - 10 June (the prohibition period can vary annually and is regulated
export of caviar from Beluga was kept the same and for Russian
by Ministerial Order);
sturgeon was not determined due to the unfavourable state of its
≠ complete prohibition of fishing for some species in specific areas,
population. Once determined, these quotas are being communicated
e.g. for sturgeons and Danube shad in the Black Sea, in front of Danube
by the Ministry of Environment and Water and the Executive Agency
River mouths, on a 5 km length to the open sea, and on a 2 km wide
on Fishing and Aquacultures to Bulgarian license firms which
corridor, i.e. 1 km on the left side and 1 km on the right side of the Sfantu
process and export caviar. These firms are obliged in return to restock
Gheorghe and Sulina arms' axis (Fishing Law 192/2001 and Order
120 fingerlings (weight over 15 grams) in the Danube for each kg of
No. 207/24.03.2004);
exported caviar. Annually, the Danube is restocked with about 40,000
≠ stocking of the Danube River with sturgeon offspring downstream of the
to 60,000 fingerlings with a weight from 15 to 300 grams. Table 33
Iron Gate II (according to the "Agreement between Popular Republic of
shows data on fish stocking of the Danube and on the catch of
Romania and Federative Socialist Republic of Yugoslavia" signed in Belgrade
sturgeons in Bulgaria in 2001-2003.
on 30 November 1963).
Fish stocking and catch of sturgeon in Bulgaria in 2001-2003
TABLE 33
2001
2002
2003
Stocking with
Stocking with
Stocking with
fish (kg)
Catch (kg)
fish (kg)
Catch (kg)
fish (kg)
Catch (kg)
Russian sturgeon
7,852
na
5,231
1,200
3,180
400
Beluga
na
300
na
9,900
90
5,600
Characterisation of surface waters 115
4.5.2. Impacts on lakes and lagoons
The chemical characteristics of the water can be considered stable
including the characteristic anion and cation concentration. The
4.5.2.1. Neusiedlersee / Ferto-tÛ
calcium concentration is slightly reducing during the long axis
The lake water is characterised by a high salt concentration of more
therefore the water type is magnesium-calcium-hydrocarbon-contain-
than 2,000 mg/l, an alkaline pH, and by high dissolved organic matter
ing. The pH value of the water of the lake is 7.8-8.8, slightly alkaline.
(COD) of natural origin. Dominant cat ions are Na+ and Mg++, anions
It is suitable for recreational use. The dissolved oxygen content varies
are HCO ≠
2≠
3 , SO4
and Cl≠. The oxygen concentration in the open
between 7.5 and 14.2 mg/l depending on the algal content and its
lake water is fairly good, in the water of the reed belt a lack of oxygen
activity. The ammonium and nitrate ion content of the lake is rather
can be observed.
low. From the viewpoint of overall phosphorus concentration the
SiÛfok and Szemes basins show excellent and good, while the
Eutrophication processes started in the 1970s. A gradual deterioration
Szigligeti and Keszthelyi basins good and acceptable water quality re-
was observed during the early 1980s. A remarkable improvement of
sults. The phosphorus load has a positive impact on the chlorophyll-a
the nutrient levels occurred since the 1990s. This was the result of
concentration ≠ that is the trophic status of the lake ≠ therefore the re-
P-elimination in the waste water treatment plants built in the 1970s
duction of phosphorus load has a major role in projects aiming at the
and 1980s and the introduction of P-free detergents in the 1980s.
water quality protection. Exchange of water between adjacent basins
Buffer strips against soil erosion also contribute to this improvement.
is extremely little. The eutrophication level aggravates towards the
Neusiedlersee / Ferto-tÛ is at present only slightly polluted by
west.
point and diffuse sources. The lake is not affected by bacterial
contamination and is therefore excellent for recreational use.
Fish kills
There are two key dates in the recent history of the lake: the fish
The reference state of Neusiedler See / Ferto-tÛ is mesotrophic. The
death in 1991 and the over-multiplication of algae in 1994. After the
present status is "mesoeutrophic", which is shown by both the
latter, the monitoring system of Lake Balaton was reviewed combined
Austrian and the Hungarian monitoring results.
with a program-like determined activity aimed at the improvement of
water quality and the fostering of the publicity of environmental data
4.5.2.2. Lake Balaton
concerning the lake.
Hydromorphological alterations
The water level of the lake is regulated by the SiÛ Sluice, which was
State
constructed in 1863 at the mouth of the SiÛ Canal, the only effluent of
The present state of the lake is satisfactory, because in spite of
the lake. The artificial interventions had a significant influence on the
decreasing water levels in the past years the water quality of the lake
ecological balance of Lake Balaton, they have altered the character of
has not deteriorated. As mentioned above, the water level of the lake
the landscape. The regulations have brought the elimination of marsh-
is regulated. Due to the rainy spring in 2004 the water level has
lands and the arrangement of water-courses.
reached the lower minimum water level, which means a slight
increase, and the water quality is still good.
Chemical conditions
As a result of environmental regulations over the past decade a
significant part of the treated wastewater is driven now to other water
collection systems. By removing the phosphorus content the water
quality has been positively influenced.
Characterisation of surface waters 116
4.5.2.3. Ozero Ialpug
Impact assessment
For Ozero Ialpug no information is available.
The eutrophication process and also the hydraulic works generated
important changes for habitats and also on the level of main compart-
4.5.2.4. Razim-Sinoe lacustrine system
ments of the trophic chain in lacustrine ecosystems.
Link to pressures
(a) In 1979-1991, a decrease of 50% in the number of species was
The Razim Lake quality status is predominantly influenced by Danube
registered in the lacustrine ecosystems. These were frequently
discharge. Thus, the load from Danube is 105 times larger for BOD,
registered in previous years at phytoplankton communities level,
30 times larger for CCO-Mn, 57 times larger for dissolved
together with a significant increase in biomass (Cure et al., 1980;
substances, 350 times larger for total phosphorus and 140 times larger
Fetecau, 1992). A similar development was also noted for the
for total nitrogen in comparison to those from the Babadag and the
zooplankton communities (Zinevici et al., 1990).
Razim catchment area.
(b) A simplification of community structures was also registered for
The Sinoe Lake is qualitatively influenced by water supply sources,
the ichtyofauna as a result of the following changes in the abiotic and
represented by Razim ≠ Golovita ≠ Smeica, Nuntasi, Istria and Black
biotic factors:
Sea. Sinoe Lake is a transitional water body and meso-eutrophic.
≠ Along with increasing of water phosphorus content, Cyprinidae
The anthropic impact on Razim-Sinoe lacustrine system is due to (1)
species with larger demands for habitats (e.g. Abramis brama ≠
the nutrients content in Razelm and Sinoe lakes, owing to nitrogen
bream) proliferated; beside the bream also Carrassius auratus, an
and phosphorous from Danube and local pollution sources, (2) the
exotic and invasive species, which last 20 years evolution was
hydraulic works.
encouraged also by the eutrophication conditions, can be
mentioned.
Nutrients
≠ A regression was registered for species with specific demands for
Pollution sources from entire Danube River Basin, respectively the
habitat and food (zander and tench), which declined after 1970 and
increasing on nutrients content and nitrogen in Danube at the end
almost disappeared after 1980; zander is the only rapturous species
of `70 and in the next period 1980-1990, caused the increasing of the
with an industrial importance, which can adapt to eutrophication
above elements in Danube Delta ecosystems, including the Razim-
conditions and dispose of favorably environmentally conditions in
Sinoe lacustrine system.
Razim-Sinoe System, unlike the rest of Danube Delta.
≠ Despite of redressing trend for carp population, the habitat
Hydromorphological alterations
demands for spawn and evolution in Razim-Sinoe System are not
≠ A lot of complex works for fresh water supply of Razim lake has been
been reached for two reasons:
carried out in 1903-1916, by dredging the Dunavat water channel and
≠ In the Razim-Sinoe System coastal area, an amount of 23.500 ha have
partially Dranov water channel.
been embanked. This area represented spawning habitat, beside the
≠ The Dranov water channel between Dranov Lake and Razim Lake was
floodplain areas (which constitute carp local reproduction sites);
built in 1930-1940.
≠ The invasion of dominant species ≠ Carrassius auratus ≠ after 1970
≠ The Golovita-Smeica and Golovita-Sinoe water channels were built
restricts the success of the carp reproduction.
in 1952-1960.
≠ The adjacent areas of Razim-Sinoe were embanked in 1961-1989.
Characterisation of surface waters 117
4.5.3. Impacts on the Danube Delta
4.5.3.1. Link to pressures
Nutrient concentrations
Major impacts on the delta ecosystem result from the changes both
The nutrient concentrations in the Danube Delta area in the period
in the upstream conditions (retained sediments, increased pollution
1996≠2003 are as follows. For the Danube and its arms:
loads) as well as from the changes in the delta itself. The most
≠ The average concentrations of dissolved inorganic nitrogen are between
significant activities in recent decades have been the artificial
1-4 mg N/l;
extension of the natural channel network (doubling their length from
≠ The average concentrations of total phosphorus are between 0.1≠0.3 mg P/l.
1910 to 1990 up to altogether 3,400 km) to improve access and the
An increase has been recorded in 2003 at the stations Cotul Pisicii, Ceatal
circulation of water through the delta, as well as the re-construction
Chilia, Periprava and Sf. Gheorghe arm (average concentrations of 0.3 mg/l).
of wetlands into huge agricultural polders and fishponds. The many
canals bring more fine sediments and nutrient-laden river water into
For the lakes of the Danube Delta:
the lake complexes than before (the water discharge flowing through
≠ The average concentrations of dissolved inorganic nitrogen are similar to
the delta lakes increased from about 160 m3/s in the 19th century to
those in the Danube arms;
620 m3/s in the period 1981-1990). As a result, biodiversity
≠ The average concentrations of total phosphorus are between 0.1-0.5 mg/l,
(fisheries) declined and the fundamentally important natural water
which is somewhat higher than those in the Danube arms. An increase has
and sediment transport system has been altered, diminishing the
been recorded in 2003, with maximum values in the Somova (0.4 mg/l),
delta's capacity to retain nutrients and pollutants. The new regime
Iacub (0.6 mg/l) and Sinoie lakes (0.5 mg/l).
allows much of the nutrient-containing silt to pass directly through
the main canals into the Black Sea.
The historical development of the nutrient concentrations in the
Danube Delta can not be positively established71.
Dredging is another important problem also here in the Danube
Delta: In the delta of the Danube, the overall length of artificial water
Heavy metals
courses created by dredging amounts to 1,753 km ≠ equal to the total
Regarding heavy metals, the Danube Delta quality over the period
length of the natural water network. New channels created for
1996-2003 according to the Romanian Assessment System of water
transport purposes, like the Caraorman Channel and the Mila 23
and sediments quality 1146/2002 (5 quality classes) is as follows. In
Channel, have changed the natural runoff of the water in the delta and
the Danube and its arms, the concentrations of iron, cadmium and
cause an increase of sedimentation.
lead correspond to quality classes IV and V in all monitoring sites. In
general, zinc and nickel show average concentrations corresponding
By 1990, one forth (974 km2) of the Danube delta has been diked in,
to class II. Manganese concentrations correspond to the classes III
including 400 km2 for agricultural purposes. The Tulcea-Sulina
and IV, except 2003 when the concentrations of this metal correspond
branch (81 km) is completely canalised with all former meanders and
to class II.
side channels being cut off, and its length reduced from 85 to 62 km.
The 80 m wide navigation route has to be permanently dredged to
In the Danube Delta lakes, the concentrations of iron, cadmium and
secure a depth of 7.3 m. The southern Sfantu Gheorghe branch
lead were high, corresponding to quality classes IV and V. In general,
(109 km) is not used by sea ships but also affected by meander cut-
zinc and nickel show average concentrations corresponding to class
offs since the 1960s (loss of app. 50 km) and by the ship waves
II. Lake Erenciuc presents an exception for nickel, since in 1999
destroying the unprotected banks.70
values corresponding to quality classes III and IV have been
recorded. The concentrations of manganese corresponded in general
Other pressures and impacts on wetlands are gravel and sand
to water quality classes III and IV during the whole investigated
excavation in many rivers of the DRB, contributing to the loss of
period of time.
riverine habitats and bed erosion, agricultural activities like drainage
and irrigation systems, fishing and hunting and tourism.
70 WWF (2002).
71 OOSTERBERG et al. (2000).
Characterisation of surface waters 118
4.5.3.2. Impact assessment
Schematic representation of the distribution of water
over the main Danube branches and the Delta complexes FIGURE 53
Impacts from hydromorphological alterations
The embankment of 85 % of the Danube floodplains for agricultural
purposes, starting at the end of the 1950s, had effects also on the
>90% of Danube discharge
Danube Delta. The fish stock of the Danube Delta was based on a
through 3 main channels
carp population, which had its spawning areas in the Danube flood-
plains. The carp population has shown a decline, and it was replaced
by species with low economic values.
The embankment of more than 100,000 ha of mostly temporary
flooded areas (wetlands), has led to the destruction of an area with
an important role in the reproduction of fish and in the biology of
aquatic bird species. A correlation between the dynamics of the
embankment works and the dynamics of the cyprinidae biomass,
which had their spawning habitats in these areas, has been noticed.
<10% of Danube discharge
through Delta complexes
In the period 1994-2003, about 15 % of the embanked area has been
restored to the natural situation.
The building of dams on the Danube has reduced the migration way
of marine migratory sturgeons in the Danube and has affected the
number of spawning habitats. The spawning habitats downstream of
Impacts from nutrient loads
the Iron Gates II dam ensured the continuity of the species, but the
Role of the Danube Delta for the Danube river loads
habitats are now limited to the last sector of the Danube with a length
Recent research, based on field data and state-of-the-art mathematical
of 863 km. The construction of fish ladders for their upstream migration
modelling (Danube Delta Model), has provided good insight into the
is not feasible, because even if the adults can migrate upstream, the
water and nutrient balances of the Danube Delta. On average, more
downstream migration of their offspring is still inhibited by the present
than 90 % of the water carried by the Danube River upstream of the
lake conditions in the backwater area of the dams.
Delta reaches the Black Sea via the 3 main Danube branches Chilia,
Sulina and Sfintu Gheorghe. Less than 10 % enters the aquatic
complexes of the Danube Delta and evaporates or finds its way to the
Black Sea via smaller outlets (Figure 53).
The main branches effectively transport the nutrients in the Danube
towards the Black Sea, without significant loss or storage. The
nutrients in the < 10% of water that reaches the Danube Delta
complexes are subject to loss and storage processes in the Delta. The
Delta removes or stores about 1/3 of the incoming nutrient loads of
nitrogen and phosphorus, while the remaining 2/3 is eventually
transported to the Black Sea. Related to the total Danube River load,
the loss and storage of N and P amounts 2-3 %. Thus, the loss and
storage of nutrients is of negligible importance: the Danube River
loads enter the Black Sea almost unaffected.
Characterisation of surface waters 119
Impact of nutrient loads to the Danube Delta
4.5.4. Impacts on coastal waters and
The increasing nutrient concentrations of the Danube River, coming
the wider marine environment of the Black Sea
from the whole Danube River basin, have led to the intensification of
eutrophication phenomena in the Danube Delta lakes after the 1980s,
4.5.4.1. Assessment of status and impact
and to important changes in the structure of the flora and fauna
According to recent research, the Black Sea is affected by a
communities. Regarding the fish communities, the decline or even the
combination of human interventions, occurring simultaneously in
extinction of sensitive species has been recorded as a result of the
the Black Sea drainage basin and in the marine environment72.
reduced transparency water conditions.
Nutrient concentrations in the Danube-influenced waters of the Black Sea
These eutrophication impacts have been enhanced by another factor.
During 1960-1985, as a consequence of the intensification of the
Already at the beginning of the 20th century, but specifically in the
industrial and agricultural activities in the Danube River Basin, the
last decades many canals were dredged in the interior of the Delta,
Danube nutrient loads (N and P) to the Black Sea have increased
with the purpose to let oxygen and nutrient rich water penetrate
significantly, followed by a quasi-constant level during 1985-1990
deeper into the Delta, to increase fish production and to improve
and by a significant reduction after the 1990s. The high nutrient
navigation. Due to these canals and due to the change of the Danube
concentrations in the Danube River have contributed to high nutrient
water quality, more river-borne water, sediment and nutrients could
concentrations in the Danube influenced coastal waters, with
reach the Delta complexes. In the last decade, a number of 13 canals
maximum values in 1987. After 1990, a reduction of the
were cut off or partially cut off in order to re-establish the natural
concentrations of inorganic N and P and an increase of the
flow regime.
concentrations of inorganic Si occurred in the coastal waters (see
Figure 54). Similar developments are reported for the other rivers
4.5.3.3. Expected future developments
flowing into the Black Sea (Dnipro, Bug, Dniestr), but the Danube
The decrease of the nutrient loads of the Danube River in the past
represents by far the largest source of freshwater to the Black Sea.
decade may invoke the decrease of the eutrophication problems in the
Danube Delta. Furthermore, due to the increasing attention for the
Sediment transport
restoration of wetlands and natural habitats it can be expected that
Another significant pressure is the reduction of the sediments
the recovery of the Danube Delta floodplains and the restoration of
discharged by the Danube as a consequence of the
original river beds will be an ongoing process. In this respect, the
hydromorphological alterations in the river basin (see Chapter 4.4.4).
future intensity of the hydrological contact between the Danube arms
Again, similar developments could be recorded in the other rivers
and the Danube Delta will be a decisive factor for the water quality of
flowing into the Black Sea.
the Danube Delta.
Heavy metals
Regarding heavy metals and pesticides, the recorded concentrations
in the surface water, the aquatic sediments and in the biota of the
Black Sea do not present high levels. Elevated concentrations are
recorded only locally, subject to the presence of specific sources.
Other pressures
Other relevant pressures to the Black Sea ecology are the irrational
exploitation of fish stocks, and the invasion of the exotic species
Mnemiopsis leydi into the Black Sea via shipping vessels. This comb
jelly fish consumes fish eggs and larvae, as well as other small
invertebrates.
72 LANCELOT et al. (2002).
Characterisation of surface waters 120
4.5.4.2. Impact assessment
contributed to severe ecological problems. In addition, the discharges
Impact of nutrient loads to the Black Sea
from other land based sources, e.g. from the Romanian Black Sea
A water quality analysis has indicated that the increasing
coastal basins, had to be taken into account. The high nutrient
concentrations of nutrients and organic matter in the coastal waters
concentrations in the coastal waters, with maximum values in 1987,
represented the main cause of the ecological imbalance of the Black
determined the excessive development of phytoplankton, with
Sea, especially in the Northern-Western and Western parts (which are
frequent algal blooms between 1974 and 1992: an expression of the
relatively shallow and sensitive to eutrophication). In this area, the
eutrophication process of the coastal waters of the Black Sea.
elevated Danube River loads of the 1980s and early 1990s have
The evolution of the inorganic nutrients concentrations (µM) in the Romanian coastal waters (Constanta monitoring site):
phosphates (a), silicates (b) and inorganic nitrogen (c)*
FIGURE 54
P-PO4( M) (a)
14
14
12
12
10
10
8
8
6
6
4
4
2
2
0
0
1959 1961 1963 1965 1967 1969 1971 1973 1975 1977 1979 1981 1983 1985 1987 1989 1991 1993 1995 1997 1999 2001
Si-SiO4( M) (b)
70
70
60
60
50
50
40
40
30
30
20
20
10
10
0
0
1959 1961 1963 1965 1967 1969 1971 1973 1975 1977 1979 1981 1983 1985 1987 1989 1991 1993 1995 1997 1999 2001
N-NO3
NO2
M (c)
N-NO4
Ntotal
30
30
25
25
20
20
15
15
10
10
5
5
0
0
1976 1977 1978 1979 1980 1981 1982 1983 1984 1985 1986 1987 1988 1989 1990 1991 1992 1993 1994 1995 1996 1997 1998 1999 2000 2001
*(Source: "State of the Environment of the Black Sea, Pressures and Trends, 1996 - 2000")
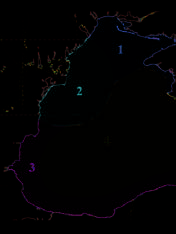
Characterisation of surface waters 121
The changes of the nutrient loads and their ratios in the coastal waters
phosphates in the marine waters affected by the Danube River has
after 1990, and especially after 1995, have caused important changes
decreased, and the ratio between inorganic nitrogen and inorganic
in the marine phytoplankton composition: the percentage of diatoms
phosphorus indicates that phosphorus is now the limiting factor for
which had been reduced from 92.3 % (during the 1960s and 1970s) to
algae growth (Figure 56). Furthermore, the diversity of the macro-
29.3 % (during the 1980s and early 1990s) increased again after 1994.
benthos has increased significantly since 1996 (see Figure 57), although
it is still lower than in the 1960s. In the 1970s and 1980s the zones of
After the late 1980s and early 1990s some signs of a recovery of
seasonal low oxygen concentrations (< 50 % of the saturation value)
the marine ecosystem in the North-western Black Sea have been
near the sediment in the North-western Black Sea were increasing
recorded, probably caused by reduced nutrient inputs from the
(see Figure 58), which was a clear indicator of eutrophication.
Danube River and the Black Sea coastal catchments. The quantity of
Recently, such zones have nearly completely disappeared from the
phytoplankton has decreased (see Figure 55). The concentration of
Romanian coastal waters (see Figure 59).
Development of the phytoplankton biomass in different parts of the Black Sea
(derived by Horstmann and Davidov from field data collected in the daNUbs research project )*
FIGURE 55
Chlorophyll (mg/m3)
6
6
5
5
4
4
3
3
2
2
NW Shelf (1)
1
1
Near Danube (2)
W Shelf (3)
0
0
Central BSea (4)
1998
1999
2000
2001
2002
2003
* daNUbs (2005).
Long term development of the N/P ratios in the Danube influenced waters off Constanta
FIGURE 56
N/P ratio
18
18
15
15
12
12
9
9
6
6
3
3
0
0
1980
1981
1982
1983
1984
1985
1986
1987
1988
1989
1990
1991
1992
1993
1994
1995
1996
1997
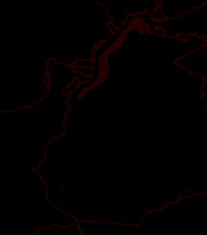
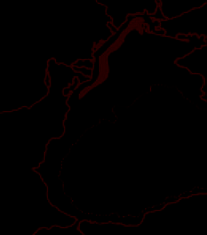

Characterisation of surface waters 122
Number of macro benthic species
in front of the Danube delta*
FIGURE 57
Number of species
70
60
50
40
30
20
10
0
1960s
1988
1996
1999
2000
2002
*10 stations on 3 transects off Constanta, data from C. Dumitrache, IRCM Constanta
Development of seasonal areas of low oxygen concentration near the bottom on the north-western shelf of the Black Sea*
FIGURE 58
1974
1978
1983
*(after ZAITSEV & MAMAEV 1997)
Concentration of dissolved oxygen (expressed as % of saturation value)
near the bottom on the Romanian shelf of the Western Black Sea *
FIGURE 59
Danube
45.0 _
45.0 _
Danube
120
45.0 _
Danube
90
140
60
100
44.8 _
44.8 _
44.8 _
80
140 120
100
44.6 _
50
44.6 _
44.6 _
30
100
90
80
44.4 _
40
44.4 _
44.4 _
80
40
70
50
100
100
70
120
44.2 _
60
44.2 _
44.2 _
80
80
50
44.0 _
44.0 _
44.0 _
60
43.8 _
September 1996
43.8 _
September 1999
43.8 _
September 2003
28.6
29
29.4
29.8
30.0
28.6
29
29.4
29.8
30.0
28.6
29
29.4
29.8
30.0
*in September 1996, September 1999 and September 2003 (compiled in the daNUbs project from data collected by RMRI))
Characterisation of surface waters 123
Marine eutrophication in the Black Sea
Algae need light and nutrients (N, P, Si etc.) to grow. The biomass of algae is able to increase until either the light or one of the nutrients is no longer available.
If the availability of one of the nutrients limits the growth of algae, this nutrient is referred to as the "limiting nutrient". The increasing inflow of nitrogen and
phosphorus from the Danube and other rivers, represent a potential for the increased development of algae biomass. The relative amounts of N and P decide how
much of this potential can be used, and which nutrient limits the growth of algae. Furthermore, the ratio of the nutrients and the solar energy availability influence
the competition between the different algae species and the development of the aquatic food chain. Evidently, the intensity of fishing and the introduction of exotic
species also play a role in this respect.
In general, a high share of diatom species within the algae community is considered a positive factor. Diatoms can develop as long as sufficient Si is available.
One of the consequences of the increased density of phytoplankton and the subsequent changes of the ecosystem is the occurrence of oxygen deficiency near the
marine sediment, which is potentially very harmful to the benthic life. This is the result of episodes of strongly increased deposition of dead organic matter.
Coastal erosion
Quantitative and qualitative changes have occurred in the structure
Coastal erosion affects the Romanian seashore over a length of 244 km
and functionality of the benthic and pelagic flora and fauna. Intense
(between the Musura arm and Vama veche), representing 6 % of the
algae blooms and zooplankton blooms have been recorded, as well as
total length of the Black Sea seashore. The relief is represented by low
a progressive reduction of the biodiversity, the simplification of the
shores (beaches, about 80 %) and high shores (cliffs, about 20 %).
trophic webs and the reduction of bioproductivity.
An analysis of the erosion process at the interface sea-land, based
The recent changes of the nutrient loads and their ratios in the coastal
on measurements from 1980-2003, has indicated that this process is
waters have caused important positive changes in the marine
more pronounced along the Northern sea-shore (Sulina-Vadu).
phytoplankton composition: the percentage of diatoms which had
reduced from 92.3 % (during the 1960s and 1970s) to 29.3 %
Loss of biodiversity
(during the 1980s and early 1990s) is increasing again after 1994.
The high nutrients concentrations in the coastal waters of the past
decades caused an excessive development of phytoplankton, with
During the last years a slow recovery of the marine ecosystem has
frequent algal blooms between 1974 and 1992.
been recorded, with a clear reduction of eutrophication indicators
(see Chapter 4.5.1.3). The recovery of the equilibrium of the ecosystem
The ecosystem of the Black Sea, including the Romanian sea shore,
and the increase of the biodiversity has been recently highlighted by
has undergone severe changes, regarding the species composition,
the development of the benthic macro flora and by the re-appearance
populations and biocenoses, as a result of anthropogenic activities.
of some invertebrate species.
Endangered species along the Romanian sea shore
The Red List (updated in 2003 for the Romanian sea shore) is made up of 206 endangered species of macro algae, invertebrates, fish and marine mammals;
special attention is paid to the Squalus acanthias, to the sturgeons (endangered owing to the conditions in the rivers of origin, to the conditions in the spawning
habitats ≠ the benthic area of the Black Sea and to over fishing) and to the 3 species of dolphins (Tursiops truncatus ponticus, Delphinus delphis ponticus and
Phocoena phocoena relicta). In relation to rare species, a coastal protected area was established in 2000 between Vama Veche ≠ 2 Mai, with a length of 7 km
and a surface area of 5,000 ha. The rare organisms present in this area belong to the following classes: Crustacea, Chondrichthyes, Osteichthyes, Reptilia and
Mammalia.
Characterisation of surface waters 124
Fish stocks
4.5.5. Impacts on artificial water bodies
The fish stocks have shown a pronounced decline. The fish catches
have been dramatically reduced: at the level of the Black Sea, the
4.5.5.1. Main-Danube Canal
catches were almost 3 times smaller in the early 1990s than they were
Due to relocation measures of the Altm¸hl and the intersection of
in the 1960s and 1970s, on the Romanian sea-shore even 10 times
moor areas, the construction of the Main-Danube Canal has had local
smaller. In the early 1990s, out of 26 fish species of commercial
impacts on the ecology.
interest annually captured in tens or hundreds of tons between
1960-1970, the commercial fishing of Scomber scombrus, Trachurus
4.5.5.2. Danube-Tisza-Danube Canal System
mediterraneus, Thunnus thynus and Xiphias gladius was stopped at
The largest impact on the biological and physico-chemical elements
the end of the 1970s. After the 1980s only 5 species (Sprattus
of the artificial water bodies within the Danube-Tisza-Danube Canal
sprattus, Engraulis encrasicolus, Merlangius merlangus euxinus,
System results from wastewater coming from all larger settlements,
Neogobius melanostomus and Atherina boyeri) have had a
industrial facilities, agriculture and fisheries. Wastewater is
commercial importance. As a consequence of the strong decline of
discharged into the canals and intercepted rivers in unpurified or
the predator species, the small pelagic fish with a short life-time, in
inadequately purified state.
particular Sprattus sprattus and Engraulis encrasicolus, represented
80 % of the total fish catches.
4.5.5.3. Danube-Black Sea Canal
The construction of the Danube-Black Sea Canal had a negative
Other impacts
impact on the aquatic ecosystem of the Carasu River and the riverine
Apart from the impacts mentioned above, the Romanian seashore is
areas.
also subject to impacts from the following natural and anthropogenic
processes:
The water quality of the two canals (DBSC and PAMNC) is mainly
≠ the deviation of the sediments carried along the seashore due to natural
affected by wastewater discharges from the towns Medgidia and
causes (Sahalin Island, the sand transfer from the beach to the lagoons)
Poarta Alba and by the Danube River water quality. Certain indicators
and due to some coastal works;
(dissolved oxygen, ammonia nitrate, chemical oxygen consumption
≠ the reduction of the mollusc populations (mussels) and implicitly of the
(CCO-Mn), and chlorides) are recorded as exceeding the limits
sand quantity of biogenic origin;
according to the quality standards.
≠ the intensification of the storm regime during the last decades;
the rise of the sea level.
The effluent discharge from the Cernavoda Nuclear Power Plant is a
thermic pollutant for the water in the canals, which causes the
4.5.4.3. Expected future developments
decrease of the dissolved oxygen concentration and sometimes the
The Danube River sediment load has decreased significantly in the
occurrence of mist.
past decades. There are no reasons to expect a recovery of this load in
the near future.
During the warm season, water eutrophication has been recorded in
the two canals, as well as the development of macrophyte algae, espe-
The Danube River nutrient loads have undergone a substantial
cially in the canal branch PAMNC. The water from both canals has an
decrease in the last decade, especially for phosphorus. The possible
insignificant impact on the Black Sea coastal waters.
increase of these loads in the future is driven by an economic
development without proper pollution control measures and this
represents a risk for failing to reach the good ecological status in the
coastal waters.
Characterisation of surface waters 125
4.6. Heavily modified surface waters
The relevant provisions of WFD Annex II include the description of
(provisional identification)
significant changes in hydromorphology (Annex II 1.4) and the
"'Heavily modified water body' means a body of surface water which
assessment of whether the water body is likely to fail the good
as a result of physical alterations by human activity is substantially
ecological status (GES) due to changes in hydromorphology
changed in character, as designated by the Member State in
(Annex II 1.5). In this context, the four basin-wide agreed criteria for
accordance with the provisions of Annex II." Art. 2(9) WFD.
selecting provisionally identified HMW sections in the DRBD are:
This chapter provides an overview of selected provisionally identified
1. Size of water sections should be more than 50 km (a minimum of
heavily modified waters, which meet basin-wide agreed criteria. All
70 % of the section should show significant physical alterations
other heavily modified water bodies (HMWB) are dealt with in the
and hydromorphological impacts, i.e. it should be heavily
National reports of the countries (Part B).
modified).73 AND
2. One or more of the following main uses which affect the DRBD
The content of this chapter is based on data delivered by Austria,
via hydromorphological alterations should be present: hydropower,
Germany, Czech Republic, Slovak Republic, Hungary, Slovenia,
navigation, flood protection, urbanisation.
Croatia, Serbia and Montenegro, Bulgaria, and Romania. Data from
The selection of these uses is based on the results of relevant
the other Danube countries was not available.
research work of the UNDP-GEF Regional Danube Project, which
identified the uses that may cause important hydromorphological
pressures affecting the ecological status of the Danube River.74 AND
3. One or more of the following significant physical alterations
4.6.1. Provisionally identified heavily modified waters on rivers
(pressures) should be present: dams/weirs, channelisation/straighte-
ning, bank reinforcement/fixation.75
4.6.1.1. Approach for selecting heavily modified water bodies
These alterations have been selected as the main significant
for the basin-wide overview
physical alterations linked to the uses of criterion 2 above. AND
In order to provisionally identify heavily modified waters of basin-
4. By expert judgement, it must be concluded that the section is
wide relevance it was agreed to identify heavily modified water
"at risk" of failing to achieve GES due to changes in hydro-
(HMW) sections that fulfil a set of four criteria. A section can be
morphology. According to the WFD, this "risk assessment" should
provisionally identified as heavily modified if all of the four criteria
be based on the assessment of significant physical alterations
are fulfilled.
and the assessment of the ecological status. Due to the lack of
appropriate biological data currently, indirect criteria based on
physical parameters (expert judgement) were selected to conclude
on the "risk".
For the expert judgement, the criteria which are based on the impacts of
the main hydromorphological pressures in the DRBD are the following:
≠ not passable obstacles (weirs/dams) for migratory species,
≠ change of water category (e.g. change of river to dammed reservoir),
≠ impoundment with significant reduction of water flow,
≠ disruption of lateral connectivity, and
≠ other criteria which need to be specified.
These expert judgement criteria allow to choose the most obvious
provisional HMW sections.
73 Such a section may also include more than one physical alterations with a significant impact on hydromorphology (for example, a chain of consequent hydropower
plants or weirs over a section of more than 50 km).
74 MOOG & STUBAUER (2003).
75 It is up to the individual countries to assess if these physical alterations are significant or not, based on their national approaches and as reported in their national
reports (Part B of the 2004/5 report).
Characterisation of surface waters 126
4.6.1.2. Provisional identification of heavily modified waters on rivers
The total length of the reported provisionally identified HMW
based on the agreed criteria
sections on the tributaries is 6,382 km.
Map 10 shows the provisionally identified HMW sections meeting
basin-wide agreed criteria, chosen according to the four criteria
The Danube tributaries with reported provisionally identified HMW sections are
mentioned above. Annex 11 contains a list of all reported HMW
the following:
sections meeting basin-wide agreed criteria, as well as information on
≠ in the upper Danube: Lech, Isar, Inn, Traun, Enns, March/Morava, Thaya,
their length, main uses, physical alterations and expert judgement for
Salzach,
risk of failure to reach GES. Some of the HMW sections meeting
≠ in the middle Danube: Raab/R·ba, Rebnitz/Repce, V·h, Hornad/Hern·d,
basin-wide agreed criteria consist of chains of consequent HMW
Drau/Drava, Mur/Mura, Sava, Drina, Velika Morava, Zapadna Morava, Juzna
sections. In these cases, some of the individual HMW sections of
Morava, Nisava, Timok, Cris∏ul Alb/FehÈr-Kˆrˆs, Cris∏ul Negru/Fekete-Kˆrˆs,
such a chain can be shorter than the 50 km threshold of the basin-wide
Barc„u/Berettyo, Zagyva, Tisza, Ipel'/Ipoly, Soroks·ri-Duna, Mosoni-Duna,
agreed criteria (see 1st criterion above).
SiÛ, Bodrog, Mures∏/Maros, Hortob·gy-BerettyÛ, Sebes-Kˆrˆs, Kettˆs- Kˆrˆs,
Timis/Tamis, and
A few Danube countries refer, as an exception, to an additional group
≠ in the lower Danube: Olt, Arges∏, Ialomit∏a, Buz„u, B‚rlad, Prut, Jijia.
of water bodies, which they defined as either `candidate for HMWB',
or `probable provisionally identified HMWB'76. There is no detailed
information available; therefore, this additional group of water bodies
The four main uses affecting the DRBD via hydromorphological
is not further described in the Roof Report but relevant information is
alterations are hydropower, navigation, flood protection and urbanisa-
provided in the national reports.
tion. Navigation appears to be the most dominant use of the
provisionally identified HMW sections on the Danube River followed
A large part of the Danube River and numerous tributaries of the
by flood protection, urbanisation and hydropower (mentioned here in
DRBD are significantly affected by hydromorphological alterations,
order of importance for the identified HMW sections) (see Figure 60).
and therefore provisionally identified as HMW sections. The
Regarding the tributaries of the DRBD, flood protection, urbanisation
provisionally identified HMW sections on the Danube River meeting
and hydropower appear as the main uses which affect hydro-
basin-wide agreed criteria are in total 2,089 km long, which is equiva-
morphological status (see Figure 61), contrary to the Danube River
lent to 75 % of the Danube. The length of the provisionally identified
where navigation is the dominant use.
HMW sections on the Danube differs in the upper Danube, the
middle Danube and the lower Danube.77 More than half of the upper
Danube River is provisionally identified as heavily modified. The
middle and the lower Danube are provisionally identified as `heavily
modified' to a slightly larger extent than the upper Danube.
Danube River Basin District ≠ Important Heavily Modified Surface Waters (provisional identification)
MAP 10
76 For instance, Hungary marked provisionally identified HMW sections as either "candidate (1)" or "probable (2)" to reflect uncertainty in the HMWB provisional iden-
tification procedure due to limited biological data. In the Roof Report, these two aspects have been combined into one provisional HMWB status. A detailed overview
is given in the Hungarian national report.
77 The upper Danube extends from the source to Bratislava in the Slovak Republic, the middle Danube from Bratislava to the Iron Gates dams (on the border of
Romania and Serbia and Montenegro) and the lower Danube from the Iron Gate dams to the mouth (ICPDR (2004)).
Characterisation of surface waters 127
The main significant physical alterations (pressures) which are
Physical alterations of the identified HMW sections
linked to the provisional identification of HMW sections on the
on the Danube River
FIGURE 62
Danube River are dams and weirs, followed by bank reinforcement/-
km
fixation and channelisation-/straightening (mentioned here in order
2500
of importance; see Figure 62). In the case of the tributaries, bank
2250
2170
reinforcement/fixation is present as the main significant physical
2000
alteration of the HMW sections, followed by channelisation/-
1750
straightening and as the last by dams/weirs (see Figure 63).
1587
1572
1500
Chapter 4.4.4 gives a more detailed description of these physical
1250
alterations and of other hydromorphological alterations with a
1000
935
significant impact. Chapter 4.4.4 also refers to future developments
750
in the DRBD which are linked to (new) hydromorphological
500
alterations.
250
0
HMWB total
HMWB with
HMWB with
HMWB with bank
dams/weirs
channelisation/
reinforcement/
Main uses of the identified HMW sections
straightening
fixation
on the Danube River
FIGURE 60
km
2500
Physical alterations of the identified HMW sections
2250
on tributaries of the DRBD
FIGURE 63
2170
2113
2000
1961
km
1750
7000
1549
6300
1500
6000
5096
1250
5000
1044
1000
4000
3879
3122
750
3000
500
2000
250
1000
0
0
HMWB total
HMWB with
HMWB with
HMWB with
HMWB with
HMWB total
HMWB with
HMWB with
HMWB with bank
hydropower
navigation
flood protection
urbanisation
dams/weirs
channelisation/
reinforcement/
straightening
fixation
Main uses of the identified HMW sections
on the tributaries of the DRBD
FIGURE 61
km
7000
6300
6000
5904
5000
4000
3000
2546
2729
2000
962
1000
0
HMWB total
HMWB with
HMWB with
HMWB with
HMWB with
hydropower
navigation
flood protection
urbanisation
Characterisation of surface waters 128
As already mentioned, several expert judgement criteria were used to
An example on the process of selecting provisionally identified
assess whether sections are "at risk" of failing to achieve GES due to
HMW sections, which meet the harmonised basin-wide criteria is
changes in hydromorphology and thereby should be provisionally
provided for the Austrian upper Danube (see textbox).
identified as HMW sections meeting basin-wide agreed criteria. The
three most commonly used expert judgement criteria for the HMW
sections of the DRBD were: the disruption of lateral connectivity, the
presence of impoundment with significant flow reduction, and the
presence of obstacles, such as weirs and dams, which are not passable
for migratory species (see Figure 64 and Figure 65). Dredging effects
were also often considered in the expert judgement on sections of the
Danube River.
Criteria used in expert judgement for the provisional
Criteria used in expert judgement for the provisional identification
identification of HMW sections on the Danube
FIGURE 64
of HMW sections on the tributaries of the DRBD
FIGURE 65
km
km
2500
7000
6300
2250
6000
2170
2000
5000
1750
4000
3561
1566
1500
3000
2526
2234
1250
2000
1858
1058
1304
1000
969
1000
782
750
0
HMWB
Not passaple
Change of
Impoundment Disruption of
Others
500
396
total
obstacles
water
with
lateral
category
significant
connectivity
250
flow reduction
0
HMWB
Not passaple
Change of
Impoundment Disruption of
Others
total
obstacles
water
with
lateral
category
significant
connectivity
flow reduction
Characterisation of surface waters 129
Application of the criteria for heavily modified water sections
Case study: Upper Danube in Austria
Over the last 125 years, the geomorphological properties of the upper Danube River in Austria have been changed significantly through dams and
regulation. Human activities in this Danube section mainly include hydroelectric power generation and flood protection. Because of its approximately
0.43 average slope and high discharge, the Austrian part of the Danube is significantly used for hydropower. Since the early 1950s, 10 hydroelectric
power plants have been constructed along this section of the Danube.
Further, activities of navigation, urbanisation, agriculture and recreation need to be mentioned. The history of river regulation in the Vienna section of the
Danube is also closely related to urban development. The first regulation measures to increase the navigability of the major Danube arms date back to the
17th century. In the second half of the 18th century embankments were constructed on a large scale. Catastrophic floods in 1830 and 1862 increased the
call for improved control. Thus, between 1870 and 1875, a straightened channel of 13 km was constructed.
In the Austrian upper Danube, two river sections are provisionally identified as heavily modified meeting the basin-wide agreed criteria:
≠ Section ATD1: This section is 165 km long (rkm 2203 ≠ 2038, Jochenstein to the beginning of Wachau) and is affected by hydropower including seven
hydroelectric power stations (HPS).
≠ Section ATD2: This section is 81 km long (rkm 2002 ≠ 1921, Headrace of HPS Altenwˆrth to HPS Freudenau). This Danube section is also affected by hydroelectric
power generation including three HPS. The first criterion for the selection of HMW sections meeting basin-wide agreed criteria is fulfilled for both sections of the
upper Danube in Austria, since both are longer than 50 km.
According to the second criterion, the following main uses linked to hydromorphological alterations are present in these two sections in order of importance:
hydropower generation, flood protection, navigation and urbanisation.
As required by the third criterion, the following physical alterations can be identified as having dominant impacts on the two HMW sections: dams (linked to
HPS), channelisation/ longitudinal straightening (for flood protection, navigation, urbanisation), and bank reinforcement (for flood protection, navigation
and urbanisation: e.g. dikes, transverse dikes).
Finally, by expert judgement (fourth criterion), it is concluded that the two sections are "at risk" of failing to meet the Good Ecological Status due to changes in
hydromorphology. For the expert judgement, the following criteria were used:
≠ presence of not passable obstacles (weirs/dams) for migratory species, which result in the disruption of river continuity,
≠ presence of impoundment with significant flow reduction (damming effects),
≠ disruption of lateral connectivity due to river bed degradation and due to dikes.
4.6.2. Provisional HMWBs on lakes
4.6.3. Provisional HMWBs on transitional and coastal waters
Of the lakes dealt with in this report (lakes with a surface area
Some parts of the transitional and coastal waters of the DRBD were
> 100 km2) Lacul Razim is the only lake that has been provisionally
provisionally identified as heavily modified water bodies.
identified as a heavily modified water body.
Information on these is provided in the National report of Romania,
since they are of small size and therefore not addressed in this report.
Mario Romulic, Croatia
Characterisation of surface waters 130
4.7. Risk of failure to reach the
Failure to achieve the objectives on surface waters may be the result
environmental objectives (overview)
from a very wide range of pressures, including point source
National data and approaches are used for the national risk
discharges, diffuse source discharges, water abstractions, water flow
assessment, whereas the risk assessment on the roof level is based
regulation and morphological alterations. These and any other
on the procedure described in Chapter 4.7.2. In the national risk assess-
pressures that could affect the status of aquatic ecosystems must be
ment additional substances beyond those described in Chapter 4.7.2
considered in the analysis. The risk assessment is therefore based on
may have been used. Therefore, results at the national level may
information collected in the pressure and impact analysis.
differ from those given in the Roof report.
In theory, evaluating the risk of failing the objectives should be a
4.7.1. Approach for the risk assessment on surface waters
straightforward comparison of the status of the water body with
The WFD requests from the Member States to carry out an
threshold values that define the objective. In practice, this becomes
assessment of the likelihood that water bodies will fail to meet the
more difficult, because the monitoring programmes and the
environmental quality objectives by 2015. The objectives include both
ecological classification tools have not been fully established.
the overall objective to achieve good status by 2015, and possibly
Therefore, considerable data gaps exist and it is necessary to define
additional specific objectives that apply to protected areas as defined
interim thresholds based on expert judgement that are generally appli-
from other legislation. The objectives may also depend on the current
cable in smaller geographical units. The risk assessment is based on
status of the water body, since Member States must generally prevent
the pressure and impact analysis and involves the steps illustrated in
any deterioration in the status.
Figure 66.
From the pressure and impact analysis to assessing the risk of failure to reach the environmental objectives
FIGURE 66
PRESSURE CRITERIA
IMPACT CRITERIA
RISK ASSESSMENT
Sigificant pollution or
Defined thresholds for impact assessment
hydromorphological Pressures
Likelihood, that WB will
fall the objectives of the WFD
Identification Significant Pressure
Identification Significant Impacts
Characterisation of surface waters 131
Pressure and impact criteria need to be defined in order to estimate
In the Danube River Basin the following three risk classes were defined:
if the identified pollution or hydromorphological pressures are signif-
≠ "water body not at risk": Based on the pressure/impact analysis it is
icant and as a consequence impact the status of a surface water body.
estimated, that the investigated water bodies will reach the objectives set
Such pressure criteria constitute defined thresholds e.g.
out by the WFD and are therefore "not at risk". No further characterisation or
concentrations of pollutants or thresholds related to morphological
additional monitoring is needed. Nonetheless, attention should be paid to
alterations. If a threshold is exceeded, then the water body is "at risk"
possible changes in pressures, which might cause deterioration. Water
and possible impact on the status is clearly defined. The same is true
bodies "not at risk" can form part of the surveillance monitoring network
when applying the impact criteria, e.g. biological quality classes: If
that has to be set up by the end of 2006.
the defined impact criteria are exceeded, a water body is identified as
≠ "water body possibly at risk": This category of water bodies, are those for
being "at risk". The identification of a water body "at risk" means
which not enough data is available. Due to the lack of sufficient data and/or
there is a likelihood that the water body will fail to achieve one of the
high uncertainty of existing methods (e.g. low differentiation) it is possible
objectives of the Directive.
that the objectives of the Directive will be failed. Further characterisation,
analysis or investigative monitoring are necessary by the end of 2006. This is
This report provides information on significant pressures of
necessary to determine if these water bodies are "at risk" of failure or not. If
transboundary and basin-wide importance. National reports identify
they are finally classified as being "at risk", or the uncertainty remains, then
significant pressures on a more detailed level using additional
these water bodies need to be included in the operational monitoring.
criteria. The risk assessment is based on both significant pressures
≠ "water body at risk": Based on the performed pressure/impact analysis it is
and their impacts on the aquatic ecosystem as identified in Chapter 4.4
estimated, that these water bodies are "at risk" of failing to meet the
and 4.5. If assessments of ecological status classification in line with
objectives set out by the WFD. No further characterisation or additional moni-
the requirements of Annex V WFD are already available, these may
toring data are needed to finish the risk assessment. In order to assess the
be used to determine if the water body is "at risk".
future status of the affected water bodies an operational monitoring network
has to be operational by the end of 2006.
The WFD requires the achievement of the principal objectives ≠ good
status of surface waters and groundwater ≠ by the end of 2015 at the
The data for this analysis was collected from the countries in the
latest, unless Art. 4.3 to 4.7 are applicable. Accordingly, the analyses
form of templates. Some of the countries were not able to deliver
of pressures and impacts must consider how pressures will likely
any data, either due to the short time available, or because the
develop prior to 2015 in ways that would place water bodies "at risk"
implementation of the WFD is not yet in an advanced stage, e.g. in
of failing to achieve good status if appropriate programmes of
most of the non-accession countries. If a country did not deliver any
measures were not designed and implemented. In the Danube River
data, the water bodies were not assigned to any of the three risk
Basin, a prediction of the future development of significant pressures
classes. The entire area of the country was classified with the label
and their impacts is currently not possible. This is because of the
"no data" in the maps.
significant economic changes under way and the lack of information
on the changes. Therefore, the risk analysis is mainly based on the
Operational monitoring networks need to be established for the
situation in 2004.
classes "at risk" and for those "possibly at risk" if further
characterisation, analysis or investigative monitoring confirms that
The risk assessment is linked with important follow-up actions, in
the water body is finally "at risk" or the uncertainty remains. The
particular the development of appropriate monitoring networks. The
results of the risk assessment may also be used for the revision of
risk class will determine the necessary follow-up actions.
the delineation of the water bodies.
Characterisation of surface waters 132
4.7.2. Risk of failure analysis on rivers
Risk assessment for hazardous substances
The risk assessment is based on a combined evaluation approach
Generally, there are substantial data gaps in both the pressure and the
considering both significant pressures and in-stream quality data.
impact data. It was agreed that if a water body is subject to a
The risk analysis proceeds in a step-wise approach from
significant pressure, which exceeds the limit values for hazardous
disaggregated information to the aggregated analysis of the risk.
substances as identified in Chapter 4.5.1.2, the water body is classified
The pressures and their resulting impacts are disaggregated into
as being "at risk". For the risk assessment of impacts, the presence of
the following risk categories:
hazardous substances from the ICPDR List of Priority Substances
≠ Organic pollution
(i.e. EU List for Priority Substances plus Arsenic, Chromium, Copper
≠ Hazardous substances
and Zinc) in the water or sediments was used. The substances of the
≠ Nutrient pollution
ICPDR List were screened by applying the national quality standards.
≠ Hydromorphological alterations
Risk assessment for nutrient pollution
Other kinds of risks were not identified on the overview level, but
It was not possible to define common criteria for risk assessment for
may be relevant in the National Reports. In many cases, water bodies
nutrient pollution, on the basin-wide level, due to the heterogeneity of
are affected by multiple risks. Therefore, each of the risks is presented
the surface water types. Therefore, countries applied national criteria.
separately.
Almost all countries used chlorophyll a to define threshold values for
the risk assessment. In some countries, threshold values for nutrients
In general, criteria for risk assessment were developed on the national
(phosphorus and nitrogen) were used as alone-standing criteria or as a
level (for details see National Reports), but for the overview some
supplement to chlorophyll a values. Special attention was given to the
basic criteria were agreed to make the results comparable on the
dislocation effects between the source of pollution and the impact
basin-wide level.
area. The recognition of past high risk, lower current risk, and
potential increase of risk in the future, was integrated in the analysis.
Risk assessment for organic pollution
If a water body is subject to a significant pressure from municipal, in-
Risk assessment for hydromorphological alterations
dustrial or agricultural point sources (exceeding the limit values for
No common criteria were defined for pressures from
organic pollution as identified in Chapter 4.4.1), then the water body is
hydromorphological alterations. Therefore, countries applied
classified as being "at risk". The discharge of partially treated or
nationally developed risk criteria. The classification proposed by
untreated wastewater from urban areas is especially significant and
MOOG & STUBAUER (2003) was used as a guidance. On the
does not meet the requirements of relevant EU legislation, in
impact side, there is a general lack of data and of assessment
particular the EU Urban Wastewater Treatment Directive and the
methods. It was agreed that if the criteria for heavily modified water
Directive for Integrated Pollution Prevention and Control (IPPC).
stretches on the basin-wide level are met (see Chapter 4.6), the water
Therefore, these water bodies were classified as being "at risk". This
body is classified as being "at risk".
is particularly relevant in the middle and lower parts of the Danube
basin.
Final risk classification
The final risk classification into one of the risk classes "at risk",
For impacts from organic pollution the Saprobic Index (SI) utilizing benthic
"possibly at risk", or, "not at risk", was based on the individual results
invertebrates was used. The following critical thresholds were defined at the
of the applied pressure and impact risk criteria described above. A
basin-wide level for the category "at risk":
water body was classified as being "at risk", if at least one of the four
≠ Danube mainstream and lower parts of major tributaries: SI > 2.4
risk categories had been identified. Water bodies where the data was
≠ all other tributaries with catchment areas > 4,000 km2: SI > 2.25
insufficient were classified as being "possibly at risk" until more
detailed information becomes available.
Characterisation of surface waters 133
4.7.2.1. Results on the Danube River
Based on the data shown in Figure 67 the percentages of river length
The evaluations of the risk analysis for the Danube are based on the
were calculated that are "at risk", "possibly at risk" and "not at risk".
length of the water bodies that have been identified. The information
In total, 58 % of the Danube is "at risk" or "possibly at risk" due to
about the risk of failure is presented in disaggregated form, i.e. evalu-
organic pollution, 65 % due to nutrient pollution and 74 % due to
ation of the single risk categories.
hazardous substances. Large parts of the Danube (93 %) are "at risk"
or "possibly at risk" due to hydromorphological alterations. As shown
Data on the risk assessment are available for the total length of the
in Figure 67 a water body can be influenced by more than one risk
Danube. Figure 67 illustrates for which reason the water body is at risk.
category so that the actual risk can be even larger.
The upper Danube, where chains of hydropower plants exist, is
mainly impacted by hydromorphological alterations. Many of the
water bodies in the upper Danube have also been provisionally identi-
fied as "heavily modified water bodies". The Middle Danube is
classified as "possibly at risk" due to hazardous substances for the
largest part. The Danube section shared by Slovakia and Hungary is
classified as "at risk" due to hydro-morphological alterations. The
part of the Danube shared by Croatia, and Serbia and Montenegro is
"possibly at risk" in all categories since not enough data is available
for a sure assessment. The lower Danube is "at risk" due to nutrient
pollution and hazardous substances, and in large parts due to
hydromorphological alterations. It is "possibly at risk" due to organic
pollution.
Risk classification of the Danube, disaggregated into risk categories. Each full band represents the assessment for one risk category
(hydromorphological alterations, hazardous substances, nutrient pollution, organic pollution). Colours indicate the risk classes.
FIGURE 67
pressures/
impacts
from
hydromorph.
hydromorph.
haz.subst.p.
haz.subst.p.
nutrient p.
nutrient p.
organic p.
organic p.
rkm
2780
2600
2400
2200
2000
1800
1600
1400
1200
1000
800
600
400
200
0
Characterisation of surface waters 134
4.7.2.2. Results on the Danube tributaries
The summary statistics show that 43 % of the tributaries are "at risk",
The analysis does not yet cover a detailed risk assessment for all
or "possibly at risk" due to organic pollution. The upper Danube
tributaries shown in the Danube River Basin District overview map
basin shows a comparatively low percentage of risk due to organic
(catchments > 4,000 km2, see Map 1). Data on the risk of failure to
pollution (5 to 20 % of the length), while in the middle and lower
reach the environmental objectives was available from Germany,
Danube basin the percentage is much higher (ranging between 20 to
Austria, Czech Republic, Slovak Republic, Hungary, Romania,
more than 90 % of the length). 50 % of the Danube tributaries are "at
Bulgaria (for Ogosta, Iskar and Yantra), and Moldova (only for Prut
risk", or "possibly at risk", due to nutrient pollution, and 36 % due to
River). These results cover about 85 % of the tributaries (based on the
hazardous substances. Hydro-morphological alterations are
length of the tributaries in comparison to the total length of
responsible for 78 % of the tributaries being "at risk", or "possibly at
tributaries, estimated to be about 18,850 km). For the other tributaries
risk", in the current analysis.
there was insufficient data available and these were therefore
classified as being "possibly at risk". A basin-wide overview on the
The overall risk assessment for Danube tributaries shows that 60 %
risk of failing to reach the environmental objectives of the Directive is
are "at risk", and 27 % are "possibly at risk", of failing to reach the
given for organic pollution in Map 11, for hazardous substances in
environmental objectives. 13 % are classified as being "not at risk".
Map 12, for nutrient pollution in Map 13 and for hydromorphological
As mentioned above, these percentages were calculated based on the
alterations in Map 14.
length of the water bodies.
Danube River Basin District ≠ Risk of Failure to reach the Environmental Objectives ≠ Organic Pollution
MAP 11
Danube River Basin District ≠ Risk of Failure to reach the Environmental Objectives ≠ Hazardous Substances
MAP 12
Danube River Basin District ≠ Risk of Failure to reach the Environmental Objectives ≠ Nutrient Pollution
MAP 13
Danube River Basin District ≠ Risk of Failure to reach the Environmental Objectives ≠ Hydromorphological Alterations
MAP 14
Characterisation of surface waters 135
4.7.2.3. Discussion of results of the risk analysis on rivers
4.7.3. Risk of failure analysis on lakes
With respect to organic pollution the number of water bodies "at risk" is
Within the Danube basin only a few lakes are larger than 100 km2 and
low in some areas, because of investments in wastewater treatment in
included as part of this report (see Chapter 4.2). Common risk criteria
the past decades, in particular in the upper part of the basin. On the
were not defined on the basin-wide level for lakes. The analysis
other hand, the total share of water bodies "at risk" or "possibly at
described here is therefore based on the national assessments. Infor-
risk" is nonetheless fairly low given the high number of insufficiently
mation on the risk of failure assessment is available for Neusiedler-
treated wastewater in the middle and lower part of the Danube river
see / Ferto-tÛ, which is shared by Austria and Hungary, for Lake
basin. Thus, it is likely that the percentage may further increase when
Balaton in Hungary, and for Lacul Razim located near the Black Sea
the application of the risk analysis approach is refined in the future.
in Romania. Details on the risk assessment are contained in the
In light of the combined approach of the WFD the fulfilment of
respective National Reports.
relevant EU legislation, e.g. the Urban Wastewater Treatment
Directive (UWWT) and the Directive for Integrated Pollution Preven-
Neusiedlersee / Ferto-tÛ is at present only slightly polluted by
tion and Control (IPPC) is a minimum requirement to reach the
non-point and point source loads. Due to biological treatment and
objectives of these directives.
phosphate elimination in the waste water treatment plants built since
the 1970s, and due to the introduction of phosphate-free detergents in
In general, nutrient pollution of rivers, in particular in large rivers like
the 1980s, considerable improvement was achieved in the nutrient
the Danube, is much more uncommon than of lakes and coastal
levels of the lake, which have become visible in the 1990s. Based on
waters. The percentage gives an indication that there is a high level
the common Austrian-Hungarian assessment, the open water of the
of nutrients in the system. In particular, slow flowing and impounded
lake is now classified as "meso-eutrophic" again indicating that the
sections of the river are the areas where eutrophication problems
current trophic situation is very near to the natural reference
may occur.
condition (mesotrophic). No other significant pressures (significant
amounts of dangerous substances, significant hydromorphological
The analysis for hazardous substances is complex and uncertain
changes) are observed that could cause a failure to achieve the
because of the high number of pollutants that might be present in the
environmental objectives. Therefore, Neusiedlersee / Ferto-tÛ is
aquatic ecosystem. The likelihood is that the percentage of water
classified as being "not at risk".
bodies in the DRBD "at risk" or "possibly at risk" will increase when
more hazardous substances are monitored in the future.
Lake Balaton is impacted by hydromorphological alterations resulting
from the elimination of marshlands and changes in the water courses.
The percentage of water bodies "at risk" or "possibly at risk" due to
The water level of Lake Balaton is controlled for recreational
hydromorphological alterations is very high and reflects the level of
purposes. Lake Balaton is not a heavily modified water body.
human intervention in the Danube river basin in the past more than
Nutrient pollution, especially the phosphorus loads, influences the
hundred years. However, some of these sections of the river will
trophic status of Lake Balaton. Eutrophication occurs particularly in
be designated as heavily modified water bodies in 2009. The risk
the western part of the lake, but the nutrients have substantially
assessment will then have to be carried out against the "ecological
decreased and the water quality has improved. The water quality of
potential" not against the "ecological status" as it has been considered
the lake corresponds to the bathing water standards. Lake Balaton is
in this analysis of 2004. Moreover, it should be noted that the type
"possibly at risk" due to the mentioned hydromorphological
and the extent of the hydromorphological pressures varies greatly
alterations.
between the upper, middle and lower part of the Danube river basin.
In particular in the lower part of the Danube, the identified pressures
Lacul Razim is "at risk" of failure to meet the objectives due to nutrient
may not be sufficient to identify the water bodies as heavily modified.
pollution. No significant sources of hazardous substances could be
identified but there is not enough data of sufficient quality to make
a clear risk assessment for this risk category. Also, information
regarding impacts from organic pollution and hydromorphological
alterations is insufficient. Lacul Razim is also a provisionally
identified heavily modified water body. Therefore, Lacul Razim is
classified as being "at risk" due to nutrient pollution and "possibly at
risk" due to organic pollution, hazardous substances and
hydromorphological alterations.
Characterisation of surface waters 136
4.7.4. Risk of failure analysis on transitional and coastal waters
The coastal waters of the Danube River Basin District are situated
The transitional waters in the Danube Basin are situated in the Danube
along the Romanian coastal zone of the Black Sea. They are divided
Delta (lower parts of the three Danube branches), in Lacul Sinoe
into three water bodies. All three coastal water bodies are "at risk".
(lacustrine system), and in the marine transitional waters from the
High nutrient loads from the Danube and the coastal river basins as
Danube-Chilia mouth to Periboina. The transitional waters are
well as coastal erosion on the Romanian seashore constitute
affected by a variety of different pressures and impacts (see Chapter
significant pressures to the Black Sea coastal waters. The risk
4.4 and 4.5). Among others, nutrient concentrations in the Danube
analysis showed that all three coastal water bodies are "at risk" due to
River cause eutrophication and changes in the flora and fauna. To
nutrient pollution. In addition, the Singol Cape-Eforie Nord coastal
undertake the risk assessment the criteria for rivers were applied.
water body is "at risk" due to hydromorphological alterations and
also a candidate for heavily modified water body. The Eforie Nord-
All transitional waters in the Danube branches are "at risk" of not
Vama Veche coastal water body is "possibly at risk" due to hydromor-
meeting the environmental objectives due to the presence of
phological alterations. For the other risk categories there is not
hazardous substances and nutrient pollution. Additional risks may
enough information available. Overall, all coastal water bodies have
exist from organic pollution but the available data is insufficient for a
been classified as being "at risk" for nutrient pollution and "possibly
clear assessment of the risk. Brat∏ul Sulina, the middle branch, is "at
at risk" for the other risk categories.
risk" due to hydromorphological alterations. Therefore, all
transitional waters in the Danube Delta are classified as being "at
Details on the risk assessment on transitional and coastal waters are
risk" for hazardous substances, "at risk" for nutrient pollution, and
contained in the National Report of Romania.
"possibly at risk" for organic pollution.
Lacul Sinoe shows significant effects from nutrient pollution. In
4.7.5. Risk of failure analysis on heavily modified water bodies
addition, further pressures may exist due to organic pollution and
The risk analysis for heavily modified water bodies was based on an
hazardous substances. There is, however, currently not enough
estimation of the risk of failing to reach the good ecological status.
information available to make this assessment. Lacul Sinoe is
The estimation of the risk of failure to reach the good ecological
therefore also classified as being "at risk" due to nutrient pollution
potential is strongly linked with the final designation of heavily modi-
and "possibly at risk" due to organic pollution and hazardous
fied water bodies and will be dealt with in the river basin
substances.
management plan, i.e. will be finalised at the end of 2009.
The marine transitional waters are "at risk" due to nutrient pollution and
due to insufficient data on organic pollution and hazardous
4.7.6. Risk of failure analysis on artificial water bodies
substances are "possibly at risk".
The approach for the risk of failure analysis on artificial water bodies
was based on national criteria. No data are available for this report.
Characterisation of surface waters 137
4.8. Data gaps and uncertainties
4.8.2. Significant pressures relevant on the basin-wide scale
A gap analysis has been carried out as regards missing or incomplete
In the future, the ICPDR emission inventory on point sources needs
data encountered in the analysis described above. The following data
to be extended to cover the whole Danube River Basin District.
gaps and uncertainties were identified.
Furthermore, it needs to be adapted to account for sources defined
as "agglomeration" in the EU Urban Wastewater Directive. This
would ensure the recognition of point source discharges from
4.8.1. Typology of surface waters and definition
agglomerations, both with and without sewer systems or sewage
of reference conditions
treatment. In addition, the question of smaller agglomerations and
The Danube typology and reference conditions have been jointly
their transboundary relevance should be addressed, given that nearly
developed in a unified approach in cooperation with the countries
40 % of the population is or will not be connected to large WWTPs
concerned. Nonetheless further validation with biological data is
in the coming years.
necessary. The national typologies for surface waters have been
developed independently by the countries. The countries in the middle
As regards the IPPC EPER database the publicly available data only
and lower basin have benefited from the fact that the typologies in
includes Germany, Austria and Hungary. In general, all the other
the upstream countries were developed at an earlier stage and have
Danubian countries, which are or will be part of the EU, have
been used as an orientation for the development of their own.
submitted data in the context of the IPPC and the UWWT Directive
Therefore, similar approaches have been taken, but there has not been
negotiations. As this information becomes available it should be
a unified or harmonised approach in the development of the national
aligned with the ICPDR emission database.
typologies.
For assessing diffuse sources the nutrient model MONERIS79 serves
Germany and Austria have finalised their national typologies
as a basis for a comparative assessment of the pressures caused by
including the bottom-up validation of the surface water types with
nutrients in the Danube River Basin, but does not yet cover the
biological data. Most of the new Member States and the Accession
coastal river basins of Romania. Calculated emissions as well as
Countries have completed the development of the typologies based on
assessed loads are based on available data of significantly different
abiotic variables, but generally these have not yet been validated with
quality, and time periods partly using very rough estimations. The
biological data at the time of finalising this report. The other
information used often represents large scale aggregations derived
Danubian countries78 have in part begun with the development of
from international statistics or surveys (e.g. CORINE Landcover).
surface water typologies, e.g. Serbia and Montenegro, and Moldova.
Regional, local and specific investigations respectively may strongly
differ in results. Regarding emissions, for example, a later detailed
The countries in the Danube basin have agreed to use the `general
investigation for the Bavarian part of the Danube River Basin shows
criteria for reference conditions' of the EU Guidance on reference
substantially lower amounts for livestock (lower than 1,5 livestock
conditions and this constitutes an important basic starting point for
unit/ha) and a noticeably smaller portion of arable land (less than
defining type-specific reference conditions in the countries. The
40 %) than used in MONERIS. Therefore, the calculated results differ
type-specific reference conditions have not yet been defined by all
in quality depending on the data sources and should be interpreted as
countries in the basin. While the EU Member States and Accession
a rough estimation.
Countries are quite advanced or have finalised the work, the other
Danubian countries have largely not even started.
The same is valid for the assessed immission loads that must be seen
as a rough indicator, since the available data is not in all cases
sufficient for such calculations. In addition, a longer time series of
data is needed to minimize the effects of strong fluctuations in the
hydrograph and its influence on nutrient loads. The balance period
1998-2000 represents for the upper Danube a wet time period
including a flood event in 1999 in the German part of the Danube
River Basin. In dryer years nutrient loads can be up to 20 % lower, in
the extremely dry year 2003 the registered loads were even lower.
78 Cooperating under the DRPC.
79 SCHREIBER et al. (2003).
Characterisation of surface waters 138
Calculated and assessed loads for phosphorous show a mean
There is a clear need for enlargement of the information to include the point
deviation of 30 % for the entire Danube River Basin (MONERIS
and diffuse sources of nutrient emissions to the Danube basin river district, in
report 2003). The authors have proposed to further develop the model
particular:
focussing on a higher spatial resolution of the source data and on the
≠ Improvement of the estimates on point and diffuse nutrient emissions will be
adjustment of the approach for erosion assessments to local
possible if additional data can be provided in the ICPDR Emission Inventory
conditions. Also, for some tributaries located on Romanian territory
for agglomerations less than 10,000 inhabitants, and on the connection
the background loads were underestimated, e.g. for the Siret River.
degree of the population to sewers and WWTPs.
≠ Improvement of the model results related to diffuse nutrient emissions will
Despite the mentioned limitations the results serve as a general
be possible by using existing digital maps with higher spatial resolution,
assessment of the nutrient situation in the Danube catchment and the
such as the European soil map (1:1,000,000), a detailed hydrogeological
mouth of the river at the Black Sea. It is expected that the
map (Danube Atlas) and the new digital elevation model (90 m grid).
incorporation of the MONERIS model into the Danube Water Quality
≠ Improvement of the estimation of diffuse nutrient emissions by application of
Model and the Danube Delta Model and the use of higher quality data
statistical data on the agricultural indicators (e.g. fertiliser use, harvested
will lead to an improved level of knowledge.
crops, livestock numbers) at a sub-national level for all Danube countries.
≠ Development of model approaches for the estimation of the point and diffuse
The MONERIS modelling results of the diffuse and point source
emissions of other substances such as heavy metals.
nutrient emissions are dependent on the quality and the resolution of
≠ Development of new approaches to evaluate the diffuse emission pathways
the available data in space and time. Because the quality of data
into the river system of the Danube based on the experiences and
varies within the Danube catchment, the results are only preliminary
measurements in case studies.
estimations and uncertain in a range of about 20 % for nitrogen (N)
and about 30 % for phosphorous (P) for the total catchment. For the
sub-catchments the level of uncertainty can be lower or higher
depending on the data quality and the data resolution.
The ICPDR Emission Inventory was utilised for the estimation of
point nutrient discharges, but this inventory only includes large point
sources. Therefore, other, more complete inventories for point source
nutrient discharges were additionally used for Germany and Austria
(which have complete inventories) and for the Slovak Republic and
Hungary (which have nearly complete, but partly inconsistent
inventories).
To estimate diffuse sources of nutrient pollution a harmonised
database is very important. This database should have the same
spatial resolution as the data for the sub-catchments. While the
establishment of a harmonised database for the DRB was largely pos-
sible (land cover data comparable to CORINE are missing for
Croatia, Serbia and Montenegro as well as for Ukraine and Moldova),
the spatial resolution is limited to the soil map (only FAO soil map;
the existing EU soil map in the scale of 1:1,000,000 was not publicly
available) and for the statistical data on agriculture as well as waste
water management. This data was only partly available at the country
level and not for the needed district level (NUT3).
Characterisation of surface waters 139
4.8.3. Assessment of impacts on the basin-wide level
A frequent phenomenon in reporting the TNMN data on hazardous
In view of the relatively brief history of the TNMN, and taking into
substances is that the limit of detection of the analytical method
account the complexity of the basin from a natural and socio-
applied is higher than the environmental quality standard. In such
economical point of view, the achievements within the TNMN have
cases no relevant information on a particular determinant can be
been huge. Nevertheless, the TNMN needs further strengthening
achieved. In the cases that the detection limit is reported as a final
on the basis of feedback from the end users of the data. Improvements
result, all data are formally non-compliant, giving a false impression
need to be achieved with respect to the reliability and the
on the pollution situation.
completeness of the data. Also, the consistency of data collected
by TNMN with data from other sources needs attention (e.g. with
The major methodological problem of environmental trace analysis
data published by the Black Sea Protection Commission).
is the reliability of data at low concentration levels. The level of
uncertainty of the result required by the ICPDR is 30 %, in some
The analysis of the data on impacts from organic pollution has shown
cases this figure may be even higher. To ensure the quality of the data
that there exist considerable data gaps. Of importance, not all
a basin-wide analytical quality control system is regularly organized
countries measure all determinants. In the future, the following
by the ICPDR. The reports on the analytical quality are published
determinants should be measured regularly on all TNMN monitoring
annually and indicate the precision and accuracy of the results
sites: Total Organic Carbon (TOC), Dissolved Organic Carbon (DOC)
produced within the TNMN. One of the major recommendations
and Adsorbable Organic Halogens (AOX). In addition, the quality of
made repeatedly is the need to improve the quality of analysis of
the data should be improved.
micropollutants.
The biological impact assessments are not fully comparable between all
The analysis of the impact from nutrient loads on a basin-wide scale is
countries. In the upstream and middle countries the assessment is
ideally based on the availability of data of high and homogenous
based on macrozoobenthos, in the down-stream countries (BG, RO
quality, covering the whole catchment area. Analysing the issue
and UA) on phytoplankton. The Saprobic System in its current form
requires data over a long period of time. There is not one individual
is not in line with the ecological status assessment as required by
data set with such a temporal and spatial coverage. For this reason,
Annex V WFD. It will therefore be necessary to develop ecological
the analysis presented herein is based on different existing data sets.
classification methods in line with the requirements of the WFD by
The gaps and inconsistencies between the data from different origin
all countries.
have been addressed by expert judgement or by using mathematical
models to interpret the data.
The lack of data on hazardous substances is a problem caused mostly
by the deficiency of adequate analytical instrumentation in the
The TNMN is the key source of surface water quality data in the
downstream countries and the lack of legal instruments for obligatory
Danube Basin. Despite the huge achievements within the TNMN in
measurements. An additional factor is the high costs of the trace
its relatively short period of existence (since 1996), improvements are
analysis. Thus, for each hazardous substance included in the TNMN a
still necessary with respect to the reliability and the completeness of
substantial amount of data is missing (40 to 60 %) mainly from the
the data. This refers in particular to data for total nitrogen and
lower section of the Danube.
silicates (completeness) and data for total phosphorus (consistency).
In general, this fact introduces some minor uncertainty in the
Moreover, it is necessary to emphasize that out of the 33 priority
analysis. The lack of basin-wide data for chlorophyll- creates a
substances identified from the Decision No. 2455/2001/EC only
strong uncertainty as to the possible eutrophication in the Danube and
seven are included in the TNMN. Concerning the other 26 substances
its large transboundary tributaries.
very limited basin-wide information is available. The major source of
information is the Joint Danube Survey. Therefore, to achieve a
High quality data with sufficient temporal and spatial coverage are
reliable assessment of the risk of failure to reach the good status, a
not always available. The availability of data for organic nitrogen, for
vast portion of information on the "new" substances must be
silica and for chlorophyll- is poor, while the quality of the available
collected. This is the task for the national screening surveys and the
data for phosphorus is not good. Furthermore, the consistency of data
operative monitoring.
from different sources presents a major problem.
Characterisation of surface waters 140
Long term data to detect temporal trends in the water quality and
developed assessment systems or criteria to integrate impacts from
ecology of the Danube Delta are not available. Therefore, it is difficult
hydromorphological alterations into the ecological status assessment.
to say if the decreasing concentration of phosphorus in the Danube
Due to the lack of information on the relevant drivers, the pressures
River has already started to have an effect in the Delta.
and their impacts on the biota, no harmonised assessment system has
been elaborated so far.
The collection of data from the marine environment is a difficult
and expensive exercise. As a result, the analysis of the impacts in
Several Danube countries do not yet have data on hydromorphological
the coastal waters and the marine environment of the Black Sea is
alterations or methodologies for the assessment of their significance.
necessarily based on data with a limited temporal and spatial
This should be an item of further research and of possible harmonisa-
resolution. Satellite imagery presents an additional source of high
tion of the approaches used in the different countries. Furthermore,
resolution data, but the number of parameters which can be observed
more research is needed on the link of hydromorphological and
is limited. However, based on recent marine research, we can be quite
biological elements in the context of the Danube region. This would
certain that there is indeed a positive development of the Black Sea.
also be relevant for monitoring the success of restoration measures.
Year-to-year climatological variability and climatological trends are
known to affect the marine ecology significantly. It is not clear
For the provisional identification of the main heavily modified
whether favourable climatic conditions in the last decade have been
sections four basic criteria were chosen that would also allow non-
supporting the recent positive development of the Black Sea.
Member States/non-Accession countries to follow the approach.
Guidance was given on the application of these criteria. Nonetheless,
Even if a large amount of data has been collected and quite a bit of
countries may have interpreted them differently, e.g. as regards the as-
research has been carried out, it is still not known in quantitative
sessment of significant physical alterations or the assessment of the
terms to what extent the Danube River nutrient loads have contributed
risk of reaching the good ecological status, which in almost all cases
to the deterioration of the Black Sea ecosystem, and to what extent
had to be based on expert judgement. There is clearly a need for
the recent improvements have been the result of the reduction of the
harmonisation and verification within the framework of the ICPDR.
Danube River nutrient loads.
A more detailed methodological reasoning for the provisional
identification of HMWB is provided in the national reports.
Furthermore, we do not exactly know the current Danube River nutri-
ent loads: data for the organic fraction of nitrogen are sparse or
A few countries encountered a lack of data and introduced an
lacking, data for total phosphorus have been found of limited reliabil-
additional category where a definitive decision on provisional
ity and the available data do not agree with respect to the loads of dis-
identification of HMWB was not possible. This category was defined
solved inorganic nitrogen.
as either `candidate for HMWB' or `probable provisionally identified
HMWB'. Information on this category is provided in the respective
Closing the existing data and knowledge gaps seems a logical next
national reports.
step. This includes a better understanding of the degradation of the
ecological status in the north-western shelf of the Black Sea, starting
As regards the bilateral harmonisation, some countries were not able
from the early 1970s and into the middle of the 1990s, and the
to finalise the bilateral agreement on some transboundary stretches.
subsequent improvements in recent years. Especially, the role of the
Such harmonisation has, for instance, taken place for the HMWB
nutrient loads from the Danube River as well as from the Romanian
stretch on the Danube shared by Bulgaria and Romania. In the case of
Black Sea coastal basins in this process needs to be better understood.
transboundary stretches between Croatia and Serbia and Montenegro,
as a first step it has been agreed between them that in principle the
The evaluation of hydromorphological alterations, in combination with
water bodies are provisionally identified HMWB. Hungary has
biological assessment, is new not only for the countries in the Danube
started its bilateral harmonisation with all its seven neighbouring
River Basin but also for many European countries. Biological
countries. In this context, bilaterally harmonised data was provided by
monitoring of rivers in the Danube River Basin has up to now focused
Hungary and the Slovak Republic.
mainly on the detection of impacts due to organic pollution. The
hydrological and morphological conditions have been surveyed in
Regarding invasive species data gaps exists in many Danubian
many countries, but the interrelationships between the
countries. Experts for neobiota have been asked to submit
hydromorphological conditions and the ecological status of rivers
information to the ICPDR referring on the basin-wide aspects.
have hardly been considered. Only a few countries have already
Characterisation of surface waters 141
4.9. Conclusions on surface waters
4.9.1. Surface water types and reference conditions
4.9.2. Significant point and diffuse sources of pollution
The development of surface water typologies and the definition of
The analysis of point sources of pollution is based on the ICPDR
their (near-)natural reference conditions is a new approach, which
Emission Inventory. Within the Upper Danube and Austrian Danube
requires a detailed scientific analysis of the geographical and
and partly in the Inn sub-catchment, the point source discharges are
physicochemical conditions of surface waters. In addition, it requires
low due to high elimination of organic pollution and nutrients
a validation with biological data for it to be biologically meaningful
especially in municipal and industrial WWTPs. Because the
as stipulated by the Directive. This is a difficult task and requires iter-
population is also connected to a high degree to municipal WWTPs
ative steps to arrive at a sound and practically useful system that
the potential for further changes is low.
serves as the basis for the ecological status assessment. The
development of sound surface water typologies takes several years
For all other sub-catchments, it can be assumed that the discharges
and the upstream countries having started earlier have provided
from municipal WWTPs will increase as the connection degree of the
guidance for the middle and lower Danube countries and shared their
population to WWTPs increases, unless this is counteracted by an
experiences. Therefore, similar approaches have been taken in
increase of the treatment efficiency of the existing and planned
Danube countries, but there has not been a unified or harmonised
municipal WWTPs.
approach in the development of the national typologies.
There is a great need to revise the list of significant point sources,
Since it would not have been possible for any single country to
since it can not be assumed that other sources do not exist. In
develop a typology for the Danube River as a whole, a harmonised ty-
addition, the criteria for significant point source pollution need to be
pology for the Danube River was developed with the help of
expanded to cover other substances relevant in the Danube river basin
international experts together with the countries concerned. The
district.
Danube typology has been developed in a combined approach
applying the abiotic criteria mentioned in Annex II WFD and
The quality of the ICPDR emission inventory, as well as of the status
validating these with biological data. The definition of its reference
of national information, has to be improved. In particular, information
conditions has been based on historical data.
on the percentage of population connected to sewers, and data on
concentrations of substances in the effluent of the municipal waste
Some of the national typologies have not yet been finalised, in partic-
water treatment plants needs to be completed. This will allow getting
ular the biological validation needs more time. Capacity building and
consistent overviews and realistic estimates of the emissions, and
sharing of experiences is now needed in the non-accession countries
consequently calculation of different scenarios for nutrient emissions.
for a sound development of their surface water typologies. In a next
step, the national typologies and reference conditions of the DRB
The data presented in this report shows that despite some inconsisten-
countries will need to be harmonised on the basin-wide level.
cies in the information, a large potential for further reduction of nitro-
Preparatory work in this respect has already started.
gen pollution from point sources exists in the Danube river basin, if
the efficiency of the existing WWTPs is increased to a level compara-
ble to those of Germany and Austria. For both countries a further
decrease of the point source discharges of N will not be possible,
because they have nearly reached the targets prescribed by the EU
Urban Waste-water Directive.
A further reduction of the point P discharges in the Danube can be
expected in the future, if the existing WWTPs in the lower Danube
countries reach a similar level of waste water treatment as in
Germany and Austria. In the upper catchments, the diffuse sources
from agriculture are more pronounced than in the lower part of the
basin. Therefore, the potential for nutrient reduction in this area
should be explored. Within the middle and lower Danube and the sub-
catchments in this region the focus should be on point sources.
Characterisation of surface waters 142
The following conclusions may be drawn from the existing data and
4.9.3. Impacts from organic pollution
information on pesticide use:
The analysis of impacts from organic pollution is based on data
≠ The current low use of agricultural pesticides in the countries of the Danube
collected in the frame of the TNMN. The TNMN is a monitoring
River Basin represents a unique opportunity to develop and promote more
programme for chemical and biological variables at 79 monitoring
sustainable agricultural systems before farmers become dependent again on
sites on the Danube and its major tributaries. An analytical quality
the use of agro-chemical products.
control system (for chemical determinants) is in place to ensure the
≠ Seven priority pesticides are not authorised in the Danube countries. Despite
comparability of results. Setting up the TNMN among the 13
this fact some of them continue to be hazardous due to old stockpiles and
countries in the basin in 1996, and now carrying out routine
residues in soils and sediments.
monitoring can be seen as a considerable achievement.
≠ The priority pesticides 2,4-D, Alachlor, Trifluralin, Atrazine and copper
compounds are heavily used pesticides in most of the Danube countries. They
The Danube shows an increase in organic pollution (expressed as
are mostly used in cereals, rapeseed and sunflower, maize and in orchards
BOD5 and COD-Cr) from upstream to downstream, reaching its
and vineyards.
maximum between Danube-Dunafoldvar (rkm 1560, below Budapest)
≠ Priority pesticides as well as other pesticides are frequently detected in
and Danube-Pristol/Novo Selo (rkm 834, just below the border of
surface and ground water.
Serbia and Montenegro, and Bulgaria). Here the target values are
Priority pesticides pose a serious hazard to the environment and human
frequently exceeded. In parallel, the dissolved oxygen concentrations
health. Most of them have already been regulated at the international and at
show a decrease from the upper to the lower Danube, showing also
the EU level.
clearly the influence of the two major reservoirs, Gabcikovo and the
≠ The selection of the most appropriate policy instruments for the DRB
Iron Gates. The biological impact assessment is mainly based on the
countries will depend on the establishment of a clear policy strategy for
Saprobic System to detect biodegradable organic pollution.
controlling pesticide pollution, together with clear policy objectives.
According to the Saprobic System, the Danube is classified as
≠ There is a need for organised information on pesticide use in a standardised
"moderately polluted" (Class II) to "critically polluted" (Class II-III).
format across all Danube countries to monitor future trends. Efforts should
be made to easily extract this information from other sources (i.e. FAO, EEA).
The tributaries are in part highly polluted. This can be seen from
highly elevated values for degradable organic matter (expressed as
BOD5) and for organic matter with low degradability (expressed by
COD-Cr). In some tributaries also the oxygen content is significantly
lower than in the main course of the Danube, e.g. in the Arges River.
The major cause of impacts from organic pollution is insufficient
treatment of waste-water from the major municipalities. In many
cases, waste-water treatment plants are missing or the treatment is
insufficient. Therefore, the building of waste-water treatment plants
will be a prime focus of the programme of measures, which needs to
be developed in the frame of the river basin management plan by the
end of 2009.
Additional steps should focus on the improvement of the Analytical
Quality Control System and the development of ecological
classification systems that respond to the requirements of the
Directive.
Characterisation of surface waters 143
4.9.4. Contamination with hazardous substances
Follow-up regarding hazardous substances should include:
Pollution loads of hazardous substances are significant although the
≠ improvement of data quality:
full extent cannot be evaluated to date. Currently, there are only few
≠ Ensuring equal analytical capabilities in all TNMN laboratories,
data available for hazardous substances such as heavy metals and
≠ Training of laboratory personnel (where necessary) in the analysis of
pesticides.
"new" priority substances,
≠ Implementing robust and sensitive analytical methods with detection
Cadmium and lead can be considered as the most serious inorganic
limits 3-10 times below the environmental quality standards set by the
micro-contaminants in the Danube River Basin. Especially critical is
European Commission.
cadmium, for which the TNMN target value is substantially exceeded
≠ national screenings for EU WFD priority substances,
in many locations downstream of rkm 1071 (values mostly 2-10 times
≠ joint longitudinal surveys focused ≠ among others ≠ on priority substances
higher that target value). The pollution of the lower Danube by
(e.g. the planned Joint Danube Survey II or the planned survey on the Sava),
cadmium and lead can be regarded as a significant impact.
≠ design of the monitoring programme for operational monitoring in line with
Annex V WFD.
p,p'-DDT is a substance of special concern in the lower Danube. Here
the very low TNMN target values are often exceeded in the order of
two magnitudes. This means that despite a high analytical uncertainty
4.9.5. Impacts from nutrients
the level of p,p'-DDT is significant and gives a strong indication of
Like many large rivers, the impact of the high transboundary river
potential risk of failure to reach the good status.
nutrient loads in the Danube River Basin is the most critical in the
receiving coastal waters of the Black Sea, however, pressures from
For Lindane the results of the TNMN classification are not so
the coastal river basins directly affecting the coastal waters of the
alarming. It is however, foreseen that the environmental quality
DRBD need to be considered. In addition, there are indications that
standard80 that will be set by the EU may be substantially lower than
the middle Danube (rkm 1600-1200) may be sensitive to
the TNMN target value. In this case, the risk of failure to reach the
eutrophication as well.
good status will be much higher and the situation will be similar to
that for p,p'-DDT. Some tributaries (SiÛ, SajÛ and Sava) show
The impacts from nutrient loads in the Danube River and its major
random occurrence of high concentrations of Atrazine. The elevated
tributaries is limited to some slow flowing and relatively shallow
concentration of Atrazine in the Sava triggered the alarm in the
reaches, such as the middle Danube in Hungary. Other sections
ICPDR Accident Emergency Warning System in 2003.
apparently are flowing too fast, are too deep or too turbid to develop
eutrophication problems. The impacts on the Danube Delta and the
During the Joint Danube Survey significant concentrations of
Black Sea are discussed below.
the EU WFD priority substances 4-iso-nonylphenol and
di[2-ethyl-hexyl]phthalate were found in the bottom sediments as
The impact of nutrient emissions can be significant in smaller water
well as in suspended solids. The values ranged from a few µg/kg up
bodies in areas with high emissions and/or low dilution capacities.
to more than 100 mg/kg, indicating the relevance of these compounds
Such impacts are often of a local nature, and they are discussed in na-
as an indicator of industrial pollution in the Danube River.
tional reports.
The strengthening of the TNMN in order to complete the basin-wide
database and optimise its consistency is an ongoing effort. The
collected data will be presented and analysed in a way that supports
the upcoming steps in the implementation of the WFD.
So far, the comparison of data collected under the umbrella of the
TNMN and data collected elsewhere has not been carried out system-
atically. It is strongly recommended to pay more attention to this
aspect, which is particularly relevant for data collected by marine
researchers in the transitional and coastal waters of the Danube River
District.
80 Decision No 2455/2001/EC of the European Parliament and of the Council of 20 November 2001 establishing the list of priority substances
in the field of water policy and amending Directive 2000/60/EC (Text with EEA relevance), OJ 2001 L 331/1.
Characterisation of surface waters 144
4.9.6. Impacts on the Danube Delta
4.9.7. Coastal waters and the wider marine environment
The Danube Delta has suffered significant impacts from anthropo-
of the Black Sea
genic pressures in the second half of the last century. For some
Since the early 1960s, noticeable and well documented alterations
impacts positive developments have been observed recently or may
have been observed at various trophic levels of the Black Sea
be expected in the near future. In the last decade the destruction of
ecosystem. Marine research carried out in the late 1990s81 indicated
floodplains and wetlands has stopped and reconstruction projects
that the changes of the ecosystem were the result of a combination of
have started to be implemented.
human interventions, occurring simultaneously in the Black Sea
drainage basin and in the marine environment: (a) the manipulation of
The fate of the Danube River and the Danube Delta are interlinked by
the hydrological regimes of the outflowing rivers, (b) the increasing
water masses flowing from the river branches to the Delta aquatic
discharge of nutrients from rivers and direct land-based sources, (c)
complexes. At present, these flows amount on average of just less
the introduction of exotic species (such as the jellyfish Mnemiopsis),
than 10 % of the Danube River discharge. The reduction of the
and (d) selective and excessive fishing.
Danube River concentrations of phosphorus may well have a positive
effect on the eutrophication of the Danube Delta, now or in the near
The Danube nutrient loads are an important factor responsible for the
future. The Danube Delta is strongly affected by Danube waters, but
deterioration of the Black Sea ecosystem. The ecosystem seems to
the opposite is not true: the Danube Delta has a negligible effect on
have responded directly and positively to the recent reduction in the
the Danube River nutrient loads.
nutrient loads from the Danube and from the Romanian coastal
basins. It thereby contributes to nutrient reduction in the Western
It is recommended to monitor on a regular basis the water quality and
Black Sea and signs of recovery have been observed in this area.
the aquatic ecology of the Danube Delta, as well as the progress of
However, nutrient loads are still significantly higher than in the
restoration projects. It is important to carefully monitor the future hy-
1960s. Jellyfish are still over-represented in the food-chain, and the
dromorphological and ecological changes in the Danube Delta.
fish stock is still out of balance. Nevertheless, from the point of view
of the ecological status of the Black Sea possibilities for further
reduction of the Danube River nutrient loads should be explored.
For reasons mentioned above, it is necessary to keep a close look at
the Black Sea ecosystem and at the Danube nutrient loads entering
the system. Experience from the past indicates that a possible
increasing nutrient load can cause renewed ecological problems. The
proper management of these loads will be a key issue in the next
steps of the implementation of the WFD.
81 LANCELOT et al. (2002).
Characterisation of surface waters 145
4.9.8. Hydromorphological alterations
Follow-up should be initiated regarding the following points:
The most important hydromorphological pressures are related to
≠ Methods for the assessment of significant hydromorphological alterations
hydropower use, navigation and flood defence measures.
need to be harmonised. A type-specific approach would be advisable.
Further research is needed on the link between hydromorphological pressures
In the upper parts of the Danube chains of hydropower plants and
and the response of the biota. Ecological classification systems should be
navigation sluices interrupt the continuity of the river with the effect
developed in a way to also assess hydromorphological degradation. Common
that only few free-flowing sections on the Danube remain, e.g. in the
methods would be needed (e.g. common sampling method, common
Austrian Wachau, a World Cultural Heritage Site. Also on the
approach for the analysis and interpretation of results, stressor specific mul-
tributaries many dams and weirs have been constructed. Resulting im-
timetric classification systems).
pacts especially affect the migratory fish species that cannot reach
≠ Future monitoring networks need to include sites that are "at risk" of failing
their spawning grounds, feeding or refuge grounds in other parts of
to reach the environmental objectives due to impacts from
the river-floodplain system.
hydromorphological pressures.
≠ Migration pathways are needed on many barriers along the Danube and its
Iron Gates I and II on the middle Danube shared by Serbia and
tributaries. Species concerned are e.g. Vimba vimba, Chondrostoma nasus,
Montenegro, and Romania have dams 60 and 30 m high and
Lota lota, Alosa pontica and A. caspia normanni as well as the sturgeons.
backwaters reaching 310 km upstream on the Danube. Also the
≠ Restoration of fish habitats should be carried out making best use of
tributaries are strongly affected by backwaters reaching 100 km
experience gained from previous restoration projects with similar measures
upstream on the Sava and 60 km upstream on the Tisza River, and
in other parts of the Danube basin.
also on many smaller tributaries. The Iron Gates have multiple effects
on the Danube ecosystem. Flow rates are severely reduced and water
levels considerably elevated (33 m at Iron Gate I during low water,
4.9.9. Important heavily modified surface waters
19 m during very large floods). The Iron Gates function in particular
For the provisional identification of the most important heavily
as sinks for nutrients and sediments with subsequent impacts on the
modified sections four basic criteria were chosen that would also
Lower Danube and the Black Sea. Also, the groundwater tables are
allow non-Member States/non-Accession countries to follow the
elevated considerably in the backwater areas endangering settlements,
approaches used by EU Member States. For large parts of the Danube
municipal and industrial facilities and agricultural activities,
River and numerous tributaries such heavily modified sections have
particularly in the Serbian lowlands.
been identified. The most dominant use is navigation on the Danube
River and flood protection on the tributaries. The main significant
Navigation occurs on nearly all parts of the Danube (except the
physical alterations are dams and weirs on the Danube River and
uppermost section above Kehlheim) and the lower parts of its major
bank reinforcements and fixations on the tributaries. These hydro-
tributaries. Construction and maintenance of the navigation channel,
morphological alterations with a significant impact on the rivers
sluices and harbours have significant negative effects on the aquatic
reflect the dominant uses of the heavily modified stretches in the
environment. Therefore, many stretches on the Danube have also been
Danube River Basin District.
provisionally identified as heavily modified water bodies. The Lower
Danube and many tributaries are also affected by hydromorphological
Future projects for the further development of navigation and
alterations based on flood defence measures.
hydropower in the Danube River Basin District as well as flood
protection measures should be considered with regard to their
ecological effects and their implications for the future identification
and designation of heavily modified water bodies.
Characterisation of surface waters 146
4.9.10. Invasive species
The transitional and coastal waters are all "at risk" or "possibly at risk"
Until now it is difficult to assess the possible pressures and impacts
to reach the environmental objectives, mainly due to nutrient
resulting from the invasion of alien species. Some scientific research
pollution. More information is needed regarding organic pollution
already exists, but it is difficult to sort out human from natural
and hazardous substances.
changes and it remains unclear how this issue should be addressed
with respect to the estimation of the risk of failure to reach the good
Based on the results of this risk assessment follow-up actions will be
status.
needed. The focus will be on the adaptation of existing monitoring
networks and programmes so they will be operational by the end of
The significance of neobiota in the Danube will presumably increase
2006. These will deliver data on both the national and the DRB scale.
in the coming years due to the fact that the Danube will become more
The data on the ecological and chemical status assessments from
and more important as a waterway and navigation contributes to the
surveillance, operational and investigative monitoring sites will add
spreading of alien species. However, it is important to mention that
to the knowledge on the current ecological and chemical status of the
currently there are no alien species, which can clearly be identified as
water bodies. Consequently, these assessments will verify the
a risk for reaching the good ecological status.
accuracy of the current risk estimations, which have been based only
on available information.
The overall relevance of alien species within the Danube River Basin
should be further discussed in the European-wide context.
Follow-up will have to focus in particular on transitional and coastal
waters, as failing to reach the good status of these waters due to
nutrients may result in costly measures basin-wide, e.g. obligatory
4.9.11. Risk of failure analysis
tertiary treatment of waste-water, or stringent measures to further
The Danube and its tributaries are to a large extent "at risk" or "possibly
reduce nutrient inputs from agricultural sources. A first important
at risk" to fail to reach the environmental objectives set out by the
step is to get a clear picture about the nutrient dependent relationships
WFD. Reasons for this risk in the upper Danube basin are mainly the
in the Black Sea ecosystem. The Memorandum of Understanding
hydromorphological alterations, which are also reflected in the fact
between the ICPDR and the ICPBS has already identified this as one
that several stretches have been provisionally identified as heavily
of its key objectives.
modified water bodies. From the Middle Danube region, currently
only a limited data set is available. In the Lower Danube region,
In addition, the follow-up will need to fill data gaps regarding those
hydromorpho-logical alterations, organic and nutrient pollution as
water bodies, which were classified as being "possibly at risk" and
well as pollution from hazardous substances play an important role.
those water bodies where no data is available. These water bodies will
be reviewed using any additional information. The availability of the
Regarding the lakes selected for the basin-wide overview in this report
monitoring data and therefore certain knowledge on the status
only Neusiedler See/Ferto-tÛ is "not at risk" of failing to reach the
assessed by relevant quality parameters will further enable the
environmental objectives. Lake Balaton is "possibly at risk" due to
preparation of the necessary measures to reach the WFD quality
hydromorphological alterations. Lacul Razim is "at risk" due to
objectives by 2015.
nutrient pollution and "possibly at risk" due to organic pollution,
hazardous substances and hydromorphological alterations. It is also
Overall, the pressure/impact analysis has to be seen as a continuous
provisionally identified as a heavily modified water body. For Ozero
process, which will result in the improvement of information on the
Yalpug there is no information available.
status of water bodies and for river basin management.
Characterisation of groundwaters 147
5. Characterisation of groundwaters
(Art. 5 and Annex II)
According to Article 2 of the EU Water Framework Directive (2000/60/EC) `Groundwater' means all water which is below the surface of the ground in the sat-
uration zone and in direct contact with the ground or subsoil. An `Aquifer' means a subsurface layer or layers of rock or other geological strata of sufficient
porosity and permeability to allow either a significant flow of groundwater or the abstraction of significant quantities of groundwater. Finally, a `Body of
groundwater' means a distinct volume of groundwater within an aquifer or aquifers.
Such groundwater bodies are subject to analyses and reviews as
Concerning water utilization the following regional trends on water
required under Article 5 and Annex II of the WFD. According to
use can be noted. First, several countries have experienced a consider-
Annex II:
able decrease in water use as a result of the process of economic
"Member States shall carry out an initial characterisation of all
transformation. Second, most of the decline has been observed in the
groundwater bodies to assess their uses and the degree to which they
agricultural sector. Third, whereas in the past, agriculture was the
are at risk of failing to meet the objectives for each groundwater body
largest water user, today water use in the industry sector has the
under Article 4. Member States may group groundwater bodies
largest share. Fourth, water withdrawal by the domestic sector has
together for the purposes of this initial characterisation. This
either remained unchanged or has experienced a slight increase as a
analysis may employ existing hydrological, geological, pedological,
result of increase in access to piped water supply82.
land use, discharge, abstraction and other data but shall identify:
≠ the location and boundaries of the groundwater body or bodies,
Groundwater used as drinking water resource plays a major role in
≠ the pressures to which the groundwater body or bodies are liable to be
the DRB countries. This is reflected by the fact that up to 95 % of the
subject including: ...
public water supply of some countries is extracted from groundwater
≠ the general character of the overlying strata in the catchment
resources. Additionally, the proportion of the population which is
area from which the groundwater body receives its recharge,
self-supplied ranges from 11 % to 43 % in most of the countries83.
≠ those groundwater bodies for which there are directly dependent
This implies that many people use groundwater from their own
surface water ecosystems or terrestrial ecosystems."
private wells for drinking water purposes.
According to paragraph 2.3 under Annex II for those bodies of
According to the reports of the WORLD BANK (2003a) and
groundwater which cross the boundary between two or more Member
ALM¡SSY & BUZ¡S (1999), the countries in the region depend
States further information on the impact of human activity on
mainly on groundwater sources to meet their drinking water needs,
groundwaters shall be collected and maintained where relevant.
with the exception of Bulgaria, Czech Republic, Moldova and
Romania. A conservative estimate is that about 60 % of the
Groundwater in the DRB is of major importance and is subject to a
population in the DRB depends on groundwater sources. Therefore,
variety of uses with the main focus on drinking water, industry,
the countries need to ensure that the groundwater is not overexploited
agriculture and spa and geothermal energy purposes.
and that the quality of groundwater is preserved.
A particular aspect reported by most countries is that shallow aquifers
Shared groundwater resources add another level of complexity. While
are at high risk of pollution in the short as well as long term as a
many aquifers lie under the floodplains of large rivers, others do not
result of uncontrolled use of fertilizers and chemicals as well as
correspond to surface watersheds, especially in the karstic regions of
untreated sewage and leaching from contaminated soils. In some
Slovenia, Croatia, and Serbia and Montenegro. In the karst,
cases, groundwater sources cannot be used without prior treatment.
groundwater flow is rapid and it is highly vulnerable to pollution.
82 UNDP/GEF (1999b).
83 UNDP/GEF (2004).
Characterisation of groundwaters 148
All countries within the DRB haved stated that the water quality of
This means although there are other groundwater bodies with an
many surface and groundwater bodies is not satisfactory84.
area larger than 4000 km2 and fully situated within one country of the
DRB they are dealt with at the national level as they are not
The main reasons for the pollution of the water sources are:
transboundary and not of basin wide importance.
≠ insufficient wastewater collection and treatment on municipal level,
≠ insufficient wastewater treatment at industrial enterprises,
The link between the content of the Roof Report and the national
≠ water pollution caused by intensive agriculture and livestock breeding,
reports is given by the national codes of the groundwater bodies.
≠ inappropriate waste disposal sites.
The importance of groundwater sources for associated ecosystems is
Existing and planned measures for pollution reduction concentrate on
dealt with in the national reports.
the most urgent objective to reduce the load from municipal
wastewater. Although the intensity of agriculture has been declining
since the early 1990ies (except for AT, DE) due to restructuring,
5.1. Location, boundaries and characterisation
future development might show an intensification of agricultural
of groundwater bodies
practices. Therefore, fertiliser and pesticide use will again be a threat
Data on the location, boundaries and characterisation of important
to the groundwater resources in the DRB85.
transboundary groundwater bodies were reported by eight countries.
Three countries stated that they do not share any important
The information provided in the inventory on the implementation of
transboundary groundwater body. For two countries data are currently
the WFD performed in 2003 by the ICPDR/UNDP shows that in all
not available.
of the responding eleven countries monitoring networks on water
quantity and water quality exist.
Currently information on 11 important transboundary groundwater
bodies with eight countries concerned (Germany, Austria, Slovak
The most important transboundary groundwater bodies
Republic, Hungary, Serbia and Montenegro, Bulgaria, Romania and
This report provides an overview of important transboundary ground-
Moldova) is available (see Map 15). One of the nominated important
water bodies in the Danube River Basin.
transboundary groundwater bodies is subject to trilateral meetings
and agreements but is yet agreed on bilateral level.
They are defined as follows:
≠ important due to the size of the groundwater body which means an area >
4000 km2 or
≠ important due to various criteria e.g. socio-economic importance, uses,
impacts, pressures interaction with aquatic eco-system. The criteria
need to be agreed bilaterally.
Danube River Basin District ≠ Important Transboundary Groundwater Bodies
MAP 15
84 UNDP/GEF (1999b).
85 UNDP/GEF (2004).
Characterisation of groundwaters 149
5.1.1. Important transboundary groundwater bodies
neighbouring countries grouped the groundwater bodies into common
in the Danube River Basin District
groups (e.g. HU/SK). The boxes indicate the number of nominated
Table 34 shows on the one hand where common borders between the
important transboundary groundwater bodies of groups of ground-
countries in the DRBD are shared and along which important
water bodies, if applicable. Furthermore it provides information on
transboundary groundwater bodies have been nominated. On the
the bilateral agreements. The latter is indicated by the bold frame of
other hand the number of nominated important transboundary
the boxes. Empty white cells refer to countries where no information
groundwater bodies is presented. In some cases the harmonisation of
on important transboundary groundwater bodies is available.
designated transboundary groundwater bodies was difficult due to the
Different numbers of nominated bodies in one box or a missing
different national methodologies that were used. In this case the
bilateral agreement require further clarification.
Matrix of common borders and number of nominated important transboundary groundwater bodies
or groups of groundwater bodies in the DRBD
TABLE 34
AT
BA
BG
CS
CZ
DE
HR
HU
MD
RO
SI
SK
UA
AT
0
0
1
1
0
0
0
0
0
0
BA
0
0
0
0
BG
0
0
2
2
CS
0
0
1
0
1
1
1
1
CZ
0
0
0
0
0
0
DE
1
1
0
0
HR
0
0
0
1
0
0
0
0
HU
0
0
1
1
0
0
2
2
0
0
4
4
0
0
MD
1
1
0
0
RO
2
2
1
1
2
2
1
1
0
0
SI
0
0
0
0
0
0
SK
0
0
0
0
4
4
0
0
UA
0
0
0
0
0
0
AT
AT has nominated a transboundary GW-body at the border to DE.
DE
1
1
BOLD FRAME: Transboundary GW-body reported as bilaterally agreed.
DE has nominated a transboundary GW-body at the border to AT.
Characterisation of groundwaters 150
Table 34 shows all the important transboundary groundwater bodies
water bodies or groups of groundwater bodies with their key
that have been nominated by the countries. Some of these have not
characteristics. The other groundwater bodies are dealt with in the
yet been bilaterally agreed. Table 35 gives a list of the currently
national reports.
nominated and bilaterally agreed important transboundary ground-
Nominated important transboundary groundwater bodies or groups of groundwater bodies in the DRBD
TABLE 35
Aquifer Characterisation
Overlying
Citeria for importance
Risk
Code
Size [km2]
Aquifer Type
Confined
Main Use
strate [m]
Quality
Quantity
1-DE-AT
5,900
K
Yes
SPA, CAL
100-1000
Intensive use
No
No
2-BG-RO
26,903
F, K
Yes
DRW, AGR, IND
0-600
> 4000 km2
No
No
3-RO-MD
21,626
P
Yes
DRW, AGR, IND
0-150
> 4000 km2
No/Yes*
No
4-RO-BG
6,356
K, F-P
Yes
DRW, AGR, IND
0-10
> 4000 km2
No/Yes*
No
5-RO-HU
6,553
P
Y/N*
DRW, IRR, IND
2-30
GW resource, DRW protection
No/Poss*
No/ Poss*
6-RO-HU
2,416
P
Y/N*
DRW, AGR, IRR
5-30
GW resource, DRW protection
No/Poss*
No
7-RO-CS-HU
28,608
P
Y/Y/N*
DRW, AGR, IND, IRR
0-125
> 4000 km2, GW use,
No: RO/
No: RO/ Yes
GW resource, DRW protection
Poss: CS/HU*
CS/HU*
8-SK-HU
3,353
P
No
DRW, IRR, AGR, IND
2-5
GW resource, DRW protection
Poss/Yes*
No/Yes*
9-SK-HU
2,666
P
Yes
DRW,IRR
2-10
GW resource
Yes/Poss*
No
10-SK-HU
1,069
K,F
Y/N*
DRW, OTH
0-500
DRW protection,
No
No
dependent ecosystem
11-SK-HU
3,601
F,K
Y/N*
DRW, SPA, CAL
0-2500
Thermal water resource
Poss
Poss
* not harmonised
DESCRIPTION
Size
Whole area of transboundary groundwater body covering all countries concerned in km2
Aquifer characterisation
Aquifer Type: Predom. P = porous/ K = karst/ F = fissured.
Multiple selection possible: Predominantly porous, karst, fissured and combinations are possible. Main type should be listed first.
Confined: [Yes / No]
Main use
DRW = drinking water / AGR = agriculture / IRR = irrigation / IND = Industry / SPA = balneology / CAL = caloric energy / OTH = other.
Multiple selections possible.
Overlying strata
Indicates a range of thickness (minimum and maximum in metres)
Criteria for importance
If size < 4 000 km2 criteria for importance of the GW body have to be named, they have to be bilaterally agreed upon.
Risk
Indicates whether a groundwater body is "at risk" of failing good status.
[Yes = "at risk" / No = "not at risk" / Poss = "possibly at risk" due to insufficient data/knowledge]
The detailed list can be found in Annex 12. Map 15 shows the nominated
important transboundary groundwater bodies, if GIS information was
available.
Characterisation of groundwaters 151
5.1.2. Summary description of the important transboundary
Groundwater use: For the majority of the important transboundary
groundwater bodies
groundwater bodies main uses of groundwater are drinking water
The following summary provides relevant information on important
purposes followed by the use for agriculture and industry. Six bodies
transboundary groundwater bodies and the impacts of human
show the coexistent main uses of drinking water purposes and
activities on groundwaters. The national reports will contain more
agriculture and five out of these six show them in combination with
detailed information on the respective groundwater bodies and
the main use for industry. However, in some of the groundwater
the detailed review of impact of human activity on groundwaters. The
bodies irrigation, spa and caloric energy are the main uses.
link between Roof Report and national reports is provided by the
national codes of the groundwater bodies.
Pressures and impacts: Intensive agriculture and inadequate sewage and
waste treatment are a major threat to the quality of the groundwaters.
Criteria for delineation: The most frequent method applied for the
The effects of diffuse sources as well as point sources on the water
delineation of the groundwater bodies is based on geological
quality are subject to further analysis in most of the countries. The
boundaries in combination with a hydrogeological approach. In some
mentioned pressures in combination with the high vulnerability of
countries other criteria like importance for water supply, groundwater
some aquifers require the development of groundwater protection
quality, water temperature or surface water catchment areas were
strategies. Groundwater quantity is affected by groundwater
additionally taken into account.
abstraction for drinking water supply or industrial and agricultural
purposes. The expected development of the future water demand has
Geological overview: Limestone, sandstone, gravel and boulders and
to be taken into account when identifying water exploitation and
permeable fluvial sediments are the main components of the aquifers
protection strategies.
of the important transboundary groundwater bodies. Due to the
different geological formations, the corresponding hydraulic
Criteria for selection as `important': The importance as groundwater
conductivity of the aquifers, and the varying permeability of the
resource and/or drinking water protection purposes are the most
overlying strata the aquifers are more or less protected. Geothermal
common criteria for the nomination (seven out of 11 bodies) of the
groundwater bodies in limestone formations are also reported.
groundwater bodies. The size-criterion which defines a transboundary
groundwater body with an area > 4000 km2 as important is the
The majority of the reported aquifers are porous aquifers (6 out
determining factor for four bodies. Intensive use, ecological criteria
of 11). One groundwater body is stated as a karst aquifer whereas the
and geothermal potential were also listed as relevant criteria for
rest is defined by a combination of karst, fissured and porous
defining the importance of a transboundary groundwater body.
characteristics. Four groundwater bodies are confined and two bodies
are not overlain by impervious or almost impervious formations. The
remaining five groundwater bodies show both variations as they are
situated in different horizons. The different kinds of the overlying
strata reflect the geological formation of the aquifers. High permeable
layers are also present as well as very impervious layers. While the
geothermal groundwater bodies are covered by overlying strata up to
2500 m the aquifers in the fluvial sediments have almost no overlying
strata. For 5 out of the 11 groundwater bodies the overlying strata
ranges only from 0 to 60 metres.
Different horizons of groundwater bodies play a major role for the
important transboundary groundwater bodies shared with Romania.
The groundwater bodies are defined separately within different strata
overlying each other in the vertical plane.
Characterisation of groundwaters 152
5.2. Risk of failure to reach the environmental objectives (overview)
5.2.1. Approach for the risk of failure analysis on groundwater
5.2.2. Results of the risk analysis on groundwater
The risk assessment is performed on national criteria both for quality
For many of the nominated important transboundary groundwater
and quantity. Hence the approaches are different. As a consequence
bodies the risk of failure assessment has not yet been harmonized.
the result of the risk assessment may differ for the national shares of
Four water bodies are definitely "not at risk" concerning the chemical
an important transboundary groundwater body. The different methods
status and this has been harmonized by the countries concerned.
for groundwater quality and groundwater quantity are summarized
Seven out of the 11 important transboundary groundwater bodies are
below.
"possibly at risk" due to insufficient information.
The main components of the methodologies for assessing the risk of
The situation is more uniform for the risk assessment of the quantity
failure to achieve good chemical status are the available monitoring
status. Six groundwater bodies are "not at risk" of failing to meet the
data on water quality, data on existing pressures and possible impacts,
objectives. Five groundwater bodies are "possibly at risk".
data on the overlying strata of the groundwater bodies and the
corresponding vulnerability of the aquifer. Derived from the available
For the reported important groundwater bodies no lower objectives
data the evaluation can be carried out e.g. in a stepwise approach by
were identified according to Article 4 and Annex II 2.4 and 2.5 with
using threshold values for each of the criteria and expert knowledge.
the exception of one country, which identified lower objectives for
However, the risk assessment methods are rather country specific and
three groundwater bodies due to possible effects on associated
range from using combinations of the above mentioned data sets to
terrestrial ecosystems and national protected areas.
focusing on interpreting water quality data.
The assessment of the risk of failure to achieve good quantitative
status concentrates on the evaluation of changes in groundwater
levels and estimating the available water resources taken into account
information on groundwater abstraction. Being "at risk" is mainly de-
fined by a threshold ratio of annual withdrawal rate and exploitable
groundwater amounts. Hydrogeological and mathematical models are
also used for assessing the risk by some countries.
Characterisation of groundwaters 153
5.3. Data gaps and uncertainties
5.4. Conclusions on groundwater
Although some general information has been collected on
The main uses of the identified important transboundary groundwater
transboundary aquifers e.g. in the frame of the UN/ECE Helsinki
bodies are drinking water supply, agriculture and industry. Some of
Convention Task Force on monitoring and assessment and at the EU
these groundwater bodies show multiple uses mostly combining use
level, the data collection for this report is the first time that data has
for drinking water, agriculture and industrial use. Some groundwater
ever been collected on groundwater in the Danube River Basin.
bodies are also used for spas and caloric energy.
Templates for reporting on groundwater bodies were prepared for a
harmonised data collection.
Intensive agriculture and inadequate waste and sewage treatment are a
major threat to the quality of the groundwater. These pressures in
Differences in the progress of WFD implementation in the Danubian
combination with the high vulnerability of some aquifers require the
countries have also become apparent in this part of the analysis.
development of groundwater protection strategies. Quantitative
Countries used a broad spectrum of different approaches for the
aspects of the groundwater resources are affected by intensive water
delineation of water bodies, their characterisation and for the
management activities.
assessment of the risk of failure to reach the good status. This entails
the need for intensive bi- and multilateral co-operation to reach the
Regarding the quantitative status of these transboundary groundwater
harmonisation of data sets for transboundary groundwater bodies.
bodies none were estimated as being "at risk" of failing the
environmental objectives. Six groundwater bodies are clearly "not at
Data gaps and inconsistencies have become apparent in the
risk". In three cases the data is insufficient and therefore additional
underlying data resulting in uncertainties in the interpretation of the
monitoring is needed. Regarding the qualitative status none of the 11
data. In addition, some countries have identified the need to expand
identified important transboundary groundwater bodies is estimated
the current monitoring networks to include monitoring stations along
unambiguously to be "at risk". However, for seven of these bodies the
the national borders, where transboundary groundwater bodies are
assessment of the national shares varies in their results. For one water
present. In some cases, countries have assessed the need to adapt their
body the available data or knowledge is insufficient and it is therefore
current monitoring programmes to collect better information on water
classified as "possibly at risk".
quality and quantity.
The present report is based on an initial collection of available
At the moment no harmonised system for coding the different layers
national information concerning important transboundary
of groundwater bodies is available. The aspect of different groundwa-
groundwater bodies. Further development may of course lead to
ter horizons needs further discussion and clarification.
changes of already defined important transboundary groundwater
bodies. Improved knowledge may also lead to the definition of
There is a need for further harmonisation of methods at the basin-
additional transboundary groundwater bodies.
wide level in particular as regards e.g. the procedure for the
assessment of the risk of failure to reach the environmental
objectives, both for groundwater quantity and quality. An analysis
would be needed to check for differences in the national approaches.
In addition, the interactions of groundwater with surface water or
directly dependent ecosystems would need further attention.

Mario Romulic, Croatia
154
6. Inventories of protected areas
(Art. 6 and Annex IV)
According to Article 6 WFD: "Member States shall ensure the establishment of a register or registers of all areas lying within each river basin district which
have been designated as requiring special protection under specific Community legislation for the protection of their surface water and groundwater or for
the conservation of habitats and species directly depending on water."
Annex IV, 1. WFD indicates the different types of protected areas that
6.1. Inventory of protected areas for species and habitat protection
shall be included:
Annex IV, 1. (v) WFD refers to Natura 2000 sites that have been
(i) areas designated for the abstraction of water intended for human
designated under the Habitats Directive (92/43/EEC) and Birds
consumption under Article 7 WFD;
Directive (79/409/EEC). The designation process is based on the
(ii) areas designated for the protection of economically significant aquatic
nomination of sites by the Member States. These are then subject to
species;
approval by the European Commission. The process of final
(iii) bodies of water designated as recreational waters, including areas
designation of Natura 2000 sites has not yet been completed.
designated as bathing waters under Bathing Water Directive (76/160/EEC);
Therefore, the selection of Natura 2000 sites is still preliminary.
(iv) nutrient-sensitive areas, including areas designated as vulnerable zones
under the Nitrates Directive (91/676/EEC) and areas designated as
Countries that are not EU Member States or EU Accession States
sensitive areas under the Urban Wastewater Directive (91/271/EEC); and
are not part of the Natura 2000 process. Therefore, it was important to
(v) areas designated for the protection of habitats or species where the
base this inventory on
maintenance or improvement of the status of water is an important factor
≠ Natura 2000 sites for EU Member States (preliminary nomination), and
in their protection, including relevant Natura 2000 sites designated under
≠ Areas protected under international conventions.
Directive 92/43/EEC and Directive 79/409/EEC.
International agreements include the Danube River Protection
The inventories referred to under (i) to (iv) have been set up
Convention, the UN/ECE Convention on transboundary water courses
nationally and are dealt with in the national reports. For (v) a basin-
and international lakes, the Ramsar Convention on Wetlands, the
wide inventory has been set up for important water-related protected
World Heritage Convention as well as others. Provisions in some of
areas for species and habitats protection (for details see Chapter 6.1).
these conventions are the basis for the designation of protected areas.
Deteriorations or damage of these protected areas and their
ecosystems can become subject to regulations of these conventions.
There are many classifications for protected areas; the globally
important one for international nature conservation is the IUCN
system with 6 categories; e.g. Category II defines the quality of the
best-known type of protected area: the national park. The IUCN
System also helps to compare areas protected under international law
with those protected under national law by assigning them to an
IUCN category.
Wetlands International maintains a comprehensive database, which
describes all globally existing 1,300 Ramsar sites ("wetlands of inter-
national importance"). Through its "Man and Biosphere Programme"
UNESCO has also set up a network of 391 reserves for the protection
of wetlands including 59 sites, which are wetlands of international
importance under the Ramsar Convention.
Inventories of protected areas 155
6.1.1. Approach for setting up the inventory
6.1.3. Establishment of the inventory with a core data set
The ICPDR has compiled a draft inventory of the most important
The ICPDR has set up a core data set with connections to Natura
water-related protected areas for species and habitats (Status: October
2000/Emerald and Ramsar inventories. The preliminary register
2003). As mentioned above, the final selection of protected areas can
includes the following information:
only take place after the European Natura 2000 network has been
1. name of protected area (incl. code, in future with the EU-wide
completed. Therefore, countries were asked to inform at least about
Natura 2000 code)
those protected areas of international importance, which shall be
2. type of protected area
included in the future WFD inventory of protected areas, i.e. national
3. assignment to a sub-basin (Danube tributaries with catchment > 4,000 km2)
parks, biosphere reserves, Ramsar sites and other important "water-
4. area in ha
related" national protected areas. Since the Natura 2000 nomination
5. protected habitats and species (where available, or at least a short site
is a very delicate political procedure of great consequence, countries
description)
have been very reluctant in nominating pSCIs (proposed Sites of
6. legal basis for designation of protected area (national, international).
Community Interest according to the EU Habitats' Directive).
Therefore, the present inventory provides only preliminary
Map 16 shows the more than 70 important water-related protected
information in an ongoing process, but nonetheless forms an
areas relevant on the basin-wide scale. These represent provisional
important basis for the elaboration of this inventory.
national designations. The final designation depends on the approval
by the European Commission.
The draft inventory is based on sites officially nominated to ICPDR
by the Danube countries and lists about 250 sites. Presumably, most
It should be noted that many other wetlands in the DRBD deserve
of the protected areas in this inventory will be part of the coherent
protection status. There are many examples of wetlands of
Natura 2000 network and will be included in the final inventory of
international importance, which have not received an official status as
protected areas.
a "Ramsar Sites" or as a protected area under European or national
legislation. The Middle and Lower Drava-Mura wetlands (Slovenia,
Croatia and Hungary) for example contain some nature reserves;
6.1.2. Definition of important water-related protected areas
some areas have been prepared for a nomination as a Natura 2000
on the basin-wide scale
area and a proposal for a transboundary Biosphere Reserve along the
The selection of protected areas for species and habitat protection
Drava and Mura rivers is under discussion.
for this inventory was based on the following criteria:
1. protected area of international ecological importance and integrity of the
selected habitat representing a typical Danube basin ecosystem (river
section ≠ lake ≠ fen/mire ≠ spring or groundwater). Such areas can be
small or large, even transboundary in nature (see Annex 13). Impounded
rivers are excluded, even if there are important protected areas according
to a national protection status and/or the presence of important bird
communities (e.g. Danube at Iron Gate, Lower Inn).
2. size: area > 1,000 ha (only a few areas < 1,000 ha are listed, which are part
of a complex of protected areas or if they have high ecological importance)
3. recognition as a protected area of basin-wide importance, e.g. areas
protected under RAMSAR and World Heritage Convention, UNESCO/MAB
and/or IUCN category II.
Danube River Basin District ≠ Important Water-related Protected Areas for Species and Habitat Protection
MAP 16
Inventories of protected areas 156
6.2. Data gaps and uncertainties
The development of an inventory of protected areas for species and
The data sets have not yet been completed for all of the sites in the
habitat protection (WFD Art. 6, Annex IV) is well under way. Many
register. The timetable for the completion of the inventory of
of them have already been designated as protected areas under EU
protected areas is based on the European Commission's progress in
law and under global conventions.The timetable for completion of the
the establishment of the Natura 2000 network.
inventory is based on the European Commission's progress in the
establishment of the Natura 2000 network.
Additional data on wetlands can be found in national wetland
inventories. Unfortunately, there are only few such inventories
At present, there are no protected areas along the Danube for the con-
currently available in the DRB countries.
servation of economically important species. Still, there are some
areas along the Danube, which should be explored with regard to
their potential as protected areas under the nature protection
6.3. Conclusions on protected areas
legislation.
80 % of the historical floodplain on the large rivers of the Danube
River Basin has been lost during the last 150 years. Some of the
There is also a need to elaborate an action plan for the sustainable use
remaining areas have either received protection status under different
of the sturgeon, and for restoration of fish paths on the Danube and
national or international legislation while others still remain
its tributaries. There are some international initiatives aiming at the
unprotected. Many of the Danube basin wetlands are under pressure
protection of sturgeons with e.g. Romania, Russia, Georgia and
through navigation, hydropower and agriculture as well as from new
Turkey. In 2001, the Black Sea Sturgeons Management Authority
infrastructure projects.
Group was established and a draft of a Regional Strategy for the
conservation and sustainable management of sturgeon populations of
The inventory of protected areas can give geographical, technical and
the Black Sea and the Danube River was elaborated in accordance
legal information on the situation, character and relevance of each
with CITES.
protected area in the Danube River Basin. This is important basic
information e.g. for preparing the River Basin Management Plan and
its Programme of Measures.
Wetlands in the Danube River Basin play an important role in
hydrological processes, in particular in flood prevention, recharging
of groundwater as well as for habitat and species diversity. The DRB
still contains a large variety of important wetlands.
157
7. Economic analysis
(Art. 5 and Annex III)
The Water Framework Directive (WFD) is one of the first environmental policy EC Directives, which explicitly integrates economic considerations into the
process of achieving its objectives. According to the requirements stipulated in Article 5 and Annex III of the Directive, an economic analysis of water uses
has to be carried out by 2004 on a river basin district scale. All data refers to the year 2000 and to the part of the countries lying in the Danube
River Basin if no other reference is given.
7.1. Economic analysis of water uses (overview)
7.1.1. Assessing the economic importance of water uses
This section is divided into three distinct parts complementary to the
According to Article 5 and Annex III of the WFD, an economic
requirements for the economic analysis due 2004:
analysis of water uses has to be carried out with the aim of assessing
≠ assessing the economic importance of water uses;
the importance of water use for the economy and assessing the
≠ projecting trends in key economic indicators and drivers up to 2015; and
socio-economic development of the river basin.
≠ assessing current levels of the recovery of the costs of water services.
Table 36 presents basic socio-economic data covering all eighteen
Severe difficulties appeared in the data gathering process as data
countries belonging to the Danube River Basin. As discussed above,
collected by national statistical institutions are very rarely collected at
the GDP and population figures presented are normalised using the
the required scale, i.e. on a river basin district. Two different options
population equivalent. In this case, a considerable difference in the
of normalisation have been used for re-calculating data presenting the
GDP per capita figures can be recorded that shows a significant
national situation on the Danube-level:
disparity in wealth. This big gap between the countries is reduced
≠ using the population equivalent; i.e. the share of population living in the DRB
when GDP per capita figures are expressed in Purchase Power
in each country; or
Parities (PPP).
≠ using the territorial/geographical equivalent; i.e. the share of the area being
within the DRB.
The former option is used for the normalisation process of Table 36,
Table 37 and Table 38 and the later one for Table 40 and Table 41, only in
cases when countries did not deliver data on the required scale.
Economic analysis 158
General socio-economic indicators (data source: Competent authorities in the DRB unless marked otherwise)
TABLE 36
GDP
GDP
Total population
GDP per capita
GDP per capita
(in bill national currency)
(in million EUR)
(million)
(in EUR per capita)
(in PPP EUR per capita)
Albania*
na
14
<0.01
1,390 na
Austria 2,732
198,611
7.7
25,795
25,521
Bosnia i Herzegovina*
na
3,493
2.9
1,204
na
Bulgaria 14
7,266
3.5
2,076
8,010
Croatia
99
12,942
3.1
4,175
7,460
Czech Republic****
520
15,247
2.8
5,461
13,226
Germany 557
285,075
9.4
30,321
29,215
Hungary 13,172
50,663
10.1
5,016
11,243
Italy** 780
403
0.02
20,225
22,457
Macedonia*** 1
19
<0.01
1,921
6,020
Moldova*
na
394
1.1
358
na
Poland**
1
187
0.04
4,672
9,230
Romania 776,445
38,908
21.7
1,795
5,264
Serbia and Montenegro*****
983
8,628
9.0
959
na
Slovak Republic
898
21,077
5.2
4,059
11,157
Slovenia 3,523
17,182
1.7
9,892
14,696
Switzerland** 1
739
0.02
37,258
na
Ukraine*** 9
1,840
2.7
686
3,706
*
2002; WORLD BANK (2003b).
**
EUROSTAT (2004b).
***
2000; VIENNA INSTITUTE FOR INTERNATIONAL ECONOMIC STUDIES (2003).
**** 2001
***** According to the 2002 census the population in Serbia and Montenegro without the provinces of Kosovo and Metohia is 7,668,000 inhabitants.
On the territory of Kosovo and Metohia the last census was in 1981. On the basis of this census and OEBS data the estimated population of
Kosovo and Metohia in the Danube river basin today is about 1,300,000 inhabitants.
Based on the size of the GDP per capita figures, the eighteen Danube
Data and further information concerning the socio-economic
countries can be divided into three clusters. The first cluster (GDP per
situation in the five countries which are not contracting parties of the
capita exceeding 20,000 EUR) composes of the three EU Member
ICPDR have not been collected since the national share of population
States Austria, Germany, Italy and in addition Switzerland; the second
and/or the share of the geographical area belonging to the DRB can
one of countries which joined the EU in May 2004; i.e. Czech Repub-
be neglected (i.e. less than 0.5 % of the national population lives in
lic, Hungary, Poland, Slovak Republic and Slovenia, and in addition
the Danube basin district in each country, while the geographical area
Croatia (GDP per capita between 2,000 EUR and 20,000 EUR). The
which is part of the Danube district is less than 0.5 % of the total
remaining countries, i.e. the two EU Accession countries Bulgaria
national area with the exception of Switzerland where this share is
and Romania, as well as Albania, Bosnia i Herzegovina, Macedonia,
around 4.3 %). Furthermore, all these areas are lying in the country's
Moldova, Serbia and Montenegro, and Ukraine constitute the third
mountainous regions without any significant economic development.
cluster based on GDP per capita figures (GDP per capita below
The situation in these five countries is therefore no more considered
2,000 EUR). The composition of these clusters, in particular concern-
in the following tables and discussions.
ing the second and third cluster, is not so straightforward when GDP
per capita figures expressed in PPP are considered.
Economic analysis 159
7.1.1.1. Characteristics of water services
Table 37 provides basic information regarding water services and
illustrates the differences in terms of the connection rates of the
population.
Water production, wastewater services and connection rates* (data source: Competent authorities in the DRB unless marked otherwise)
TABLE 37
Water supply production
Population
Population
Population
Total
Supply to
Total collected
connected to
connected to
connected to
water production
Total supply
households
wastewater
public water
public sewerage
wastewater treat-
(million m3)
(million m3)
(million m3)
(million m3)
supply (in %)
system (in %)
ment plant (in %)
Austria 2,066a
721b
na
1,024c
86.0c
87.0c
87.0c
Bosnia i Herzegovina
na
na
na
na
na
na
na
Bulgaria 4,174
3,760
168
410
99.0
67.9
42.9
Croatia 1,170
291
184
181
68.0
40.0
24.1e
Czech Republic
319
182
81c
1373
87.1
74.8
69.9
Germanyd
3,770
704
459
1,404
98.4
93.3
92.7
Hungary 18,878
817
388
530
92.0
51.0
30.0
Moldova
na
na
na
na
na
na
na
Romania 7,689
2,410
1,642
1,229
62.6
48.0
27.0
Serbia and Montenegrof
2,568
1,233
555
683
69g
33g
14
Slovak Republic
405
293
175
487
82.9
54.7
50.0
Slovenia
na
669
109
na
85
53
30
Ukraine
na
na
na
na
na
na
na
* The data for Austria, Romania, Slovak Republic and Slovenia have been reported on the national level. Only data of the columns one to four (total water production,
water supply production ≠ total and supply to households ≠ and total wastewater collected) have been normalised based on population equivalent.
The connection rates for these three countries are national figures.
a 1993/94
b 2003
c 2002
d 2001
e 2004
f 1997
g 1991
The figures are showing relatively high rates for the connection of the
population to public water supply. The rates are lower for the
connection on to the public sewerage system and to wastewater
treatment plant. The latter rate is low in Bulgaria, Hungary and
Romania and Croatia.
Economic analysis 160
Table 38 lists the total number of wastewater treatment plants
are of advanced technology as compared to the situation in the new
distinguishing between mechanical, biological and advanced
EU Member States and Bulgaria, Croatia, and Romania where biolog-
treatment plants. This table shows big differences considering that the
ical treatment plants are predominant.
majority of treatment plants (total capacity) in Austria and Germany
Wastewater treatment plants* (data source: Competent authorities in the DRB unless marked otherwise)
TABLE 38
Wastewater treatment plants
Mechanical treatment plants Biological treatment plants
Advanced treatment plants
Total number
Total capacity
Total number
Total capacity
Total number
Total capacity
Total number
Total capacity
(number)
(1000 p.e.)
(number)
(1000 p.e.)
(number)
(1000 p.e.)
(number)
(1000 p.e.)
Austriaa
596
17,405
0
0
83
1,298
513
16,106
Bosnia i Herzegovina
Na
na
na
Na
na
na
na
na
Bulgaria 18
2,842
6
156
11
2,627
1
59
Croatiad
30
2,180
14
1,300
16
881
0
0
Czech Republic
339
5,249
4
11
119
1,858
216
3,373
Germanyb
795
18,607
0
0
479
5,868
316
12,738
Hungary
515
12,184
23
2,300
356
6,989
136
2,894
Moldova
Na
na
na
Na
na
na
na
Na
Romaniac
328
9,552
99
2,023
224
6,580
6
949
Serbia and Montenegro
25
1,274
0
0
25
1,274
0
0
Slovak Republicc
327
na
21
na
291
na
15
43
Slovenia
100
1,199
6
321
80
419
14
458
Ukraine
Na
na
na
Na
na
na
na
Na
* Total capacity data are only available in 1000m3/ day in Hungary and Czech Republic. The conversion in population equivalent (p.e.) has been done according to the
international standard by applying the load of biologically degradable organic waste which has the five days oxygen demand (BOD5) of 60 grams and based on
experience that the contamination of the communal wastewater is about 350 g/m3 leading to a factor of 1m3/day equals to 5.83 p.e. The data for Austria, Romania,
Slovak Republic and Slovenia have been reported on the national level. All national data have been normalised based on population equivalent.
a 2003
b 2001
c 2002
d 2004
Table 37 and Table 38 illustrate the challenges the middle and
downstream Danube countries are currently facing. These countries
have to make further investments into pollution reduction and
environmental protection measures as required under the EC
directives.
A more detailed analysis of the population connected to wastewater
treatment plants in several of the Danube countries is shown in
Table 39. The data show the situation on the national level
distinguishing between the shares of the population connected to
primary, secondary and tertiary wastewater treatment facilities as well
as the total connection rate. The data show that the majority of the
population in Austria and Germany were connected to tertiary
wastewater treatment facilities. The wastewater of the majority of the
population connected to wastewater treatment plants in the Bulgaria,
Czech Republic and Hungary are treated in plants applying secondary
treatment technology and it was equally distributed between primary
and secondary treatment in Slovenia.
Economic analysis 161
Population connected to wastewater treatment plants ≠ data refers to whole country; data source: EUROSTAT (2004a)
TABLE 39
Total (in %)
Primary treatment (in %)
Secondary treatment (in %)
Tertiary treatment (in %)
Austria 86a
1b
17b
64b
Bosnia i Herzegovina
na
na
na
na
Bulgaria 38a
1a
37a
0c
Croatia na
na
na
na
Czech Republic
68a
na
62d
na
Germany 91b
1b
6b
83b
Hungary
32c
2c
24c
6c
Moldova
na
na
na
na
Romania na
na
na
na
Serbia and Montenegro
na
na
na
na
Slovak Republic
49b
na
na
na
Slovenia
30d
15d
15d
0d
Ukraine
na
na
na
na
a 2001
b 1998
c 2000
d 1999
Production of main economic sectors* (data source: Competent authorities in the DRB unless marked otherwise)
TABLE 40
Agriculture
Industry
Electricity Generation
Gross value added
Share of GDP
Gross value added
Share of GDP
Gross value added
Share of GDP
(in million national currency)
(in %)
(in million national currency)
(in %)
(in million national currency)
(in %)
Austriaa
4,502
2.1
60,151
28.7
4,302
2.1
Bosnia i Herzegovina
na
na
na
na
na
na
Bulgaria 1,346
10.7
3,478
27.6
na
na
Croatia 9,600
9.7
19,983
20.0
706
0.7
Czech Republicb
20,822
4
192,643
37
18,253
3.5
Germany 3,268
1.2
80,643
28.9
na
na
Hungary
490,900
3.7
3,196,700
24.3
412,400
3.1
Moldova
na
na
na
na
na
na
Romania 86,967,167
11.1
214,431,081
27.3
22,366,461
2.8
Serbia and Montenegro
142,000
14.5
284,000
28.3
45,000
4.5
Slovak Republic
35,643
3.6
230,816
25
32,558
3.5
Slovenia
102,684
2.9
1,084,840
30.3
100,138
2.8
Ukraine
na
na
na
na
na
na
* The data for AT, RO, SK and SI have been reported on the national level. All national data referring to gross value added have been normalised based on
territorial/geographical equivalent. However, the data presenting the share of the individual sector to GDP have not been changed; i.e. they are national shares.
a 2002
b 2001
Economic analysis 162
7.1.1.2. Characteristics of water uses
negligible in Czech Republic and Hungary. While the Czech
Differences in the economic structure of the Danube countries are
Republic, Croatia, Hungary, Romania, and Serbia and Montenegro
shown in Table 40. The main differences arise from the varied
are relying heavily on conventional thermal power, Bulgaria and the
importance of the agricultural sector. While in Bulgaria, Croatia and
Slovak Republic are reliant on nuclear power (the share of this
Romania around 10 percent of GDP is generated from agriculture,
technology is more than 50 % in the part of the country situated in
this share is between 1 and 3.7 percent in the remaining countries.
the DRB).
The share of industry and electricity generation is more consistent be-
tween the countries which reported these data.
Basic information relating to inland navigation in the Danube
countries is shown in Table 42. These data must be observed in the
Table 41 on the generation of electricity in the Danube countries shows
context of the political instability of the western Balkan region in the
big differences in the mix of technologies used. Austria has by far the
1990s. As a consequence of the recent conflict and instability in the
largest percentage of generated electricity based on hydropower
West Balkan region the inland navigation between upstream and
(almost two thirds of total electricity generated). The share of
downstream countries was impaired. It can be further recorded that
hydropower is also relatively high in Croatia, Romania and Serbia and
inland navigation is relevant only for some Danube countries as there
Montenegro (between 27 and 33 %) and more modest in Germany
is no commercial inland navigation in the countries on the fringe of
and the Slovak Republic. The contribution of hydropower is almost
the Danube River Basin.
Electricity generation in the DRB: total and electricity generation devided by origin*
(data refers to territory in DRB; data source: Competent authorities in the DRB unless marked otherwise)
TABLE 41
Electricity generated by origin
Total electricity
Total electricity
Hydropower
Conventional
Nuclear power
capacity (MW)
generated (1000 GWh)
(in %)
thermal power (in %)
(in %)
Austriaa
17,106
60
67.0
32.5
0.0
Bosnia i Herzegovina
na
na
na
na
na
Bulgaria na
22
6.8
10.9
82.3
Croatia 1,129
3
33.0
67.0
0.0
Czech Republica
4,000
11
5.5
53.3
41.3
Germany na
na
na
na
na
Hungary
7,222
35
0.5
57.5
40.7
Moldova
na
na
na
na
na
Romania 21,401
51
28.5
61.0
10.5
Serbia and Montenegro
8,816
33
33
67
0.0
Slovak Republic
8,194
31
18.6
18.6
62.8
Slovenia
2,336
12
28.1
36.9
34.9
Ukraine
na
na
na
na
na
* The first two columns (total electricity capacity and total electricity generated) have been normalised for Austria, ,Romania, Slovak Republic and Slovenia using the
geographical equivalent. However no normalisation procedure has been done for the columns showing the share of different generation technologies.
a 2002
Economic analysis 163
Inland navigation (data source: Competent authorities
7.1.2. Projecting trends in key economic indicators and drivers up
in the DRB unless marked otherwise)
TABLE 42
to 2015
Quantity
Number of harbours
Assessment of key economic variables is significant for developing
(1000 tons)
(number)
baseline scenario, particularly regarding the influence of these
Austria
10,976
4
variables on the pressures and consequently the water status up to the
Bosnia i Herzegovina
na
na
year 2015.
Bulgaria
1,846
9
Croatia 1,045
4
As a result, the future trends in water supply and demand are of
Czech Republic
-
-
central importance for undertaking baseline scenarios. The
Germanya
4,279
4
anticipated growth rates of the main economic sector must also be
Hungary
2,420
28b
taken into consideration.
Moldova
na
na
Romania 19,959
17
The analysis shows that quantitative forecasts regarding future trends
Serbia and Montenegro
3,796
na
in total water supply and demand are not available in the majority of
Slovak Republic
1,607
na
the Danube countries. Furthermore, qualitative predictions are
Slovenia
none
none
demonstrating that there is no general trend discernible. Some
Ukraine
na
na
differences in the trend forecasts can be recorded between Romania
a 2003
b 2001
and the Czech Republic. A small increase in water supply and water
demand is predicted in Romania, the opposite is expected in the latter
country. More detailed analyses of the future development of these
Other water uses have not been considered as economically
economic variables can be found in national reports (Part B). These
significant on the international, transboundary level currently.
analyses highlights the causes, rationales and underlying assumptions,
However, more detailed analyses of water uses, which are
such as changes in the connection rates, efficiency improvements in
economically significant on the national level, can be found in the
the water supply systems by reducing leakage rates, for these
national reports.
forecasts.
Similar problems with availability of data and information are
encountered in the analysis of the expected growth rates for main
economic sectors (Table 44). The forecasts of the overall growth rate as
well as the rates for the different economic sectors illustrate the
different economic situation of the countries. The growth rates of
countries with the highest GDP per capita figures are smaller than for
those with the lower GDP per capita figures. The former countries are
expecting growth rates in the range of 2 percent per annum as
compared with rates between 4 and around 9 percent.
Economic analysis 164
National trends in total water supply and demand up to 2015 (data source: Competent authorities in the DRB unless marked otherwise)
TABLE 43
Trends in
Total water supply (in percent)
Total water demand (in percent)
Austria constant
slightly
fluctuating
Bosnia i Herzegovina
na
na
Bulgaria
15.3 (2010)
na
Croatia slightly
increasing
na
Czech Republic
79.6 % (base year 1996 = 100 %); i.e. decreasing
70 % (base year 1996 = 100 %);
i.e. decreasing
Germany
constant
slightly decreasing
Hungary
has not been assessed
has not been assessed
Moldova
na
na
Romania
small increase
small increase
Serbia and Montenegro
na
na
Slovak Republic
110 (base year 2000 = 100)
128 (base year 2000 = 100)
Slovenia
na
na
Ukraine
na
na
National economic growth rates for main economic sectors (up to 2015)
(data source: Competent authorities in the DRB unless marked otherwise)
TABLE 44
Overall growth rate
Growth rates for the main economic sector
(in %)
agriculture (in %)
industry (in %)
electricity (in %)
Austria
2
na
na
na
Bosnia i Herzegovina
na
na
na
na
Bulgaria
until 2007: growth rate is expected to be between 5.1 and 5.5 % p.a.
Croatia
5
< 5
5
4.5
Czech Republic
2.5
1.6
2.31
Germany 2
0.5
1.7
1
Hungary
4
na
na
na
Moldova
na
na
na
na
Romania
until 2008: an increase of around 5 % p.a. (GDP)
Serbia and Montenegro
4
2.5
4.5
3
Slovak Republic
6
na
na
na
Slovenia
na
na
na
na
Ukraine
na
na
na
na
1 including electricity
Economic analysis 165
7.1.3. Assessing current levels of recovery of the costs of water
7.2. Data gaps and uncertainties
services
Several gaps and uncertainties in the process of data gathering have
The appraisal of costs recovery levels of water services is in
been encountered. In general, there are large gaps in the availability
accordance with Article 9 of the WFD. As a result of differing
of economic data in most of the DRB countries. Countries, such as
economic, financial and institutional conditions in the Danube
Bosnia i Herzegovina, and Serbia and Montenegro, are currently in
countries, the pricing systems also vary considerably among the
the process of establishing the necessary institutions for data
countries. In addition, Danube basin wide relevance for cost recovery
collection and verification, so that economic data should become
does not exist since often local communities have the responsibility
available in the future. Data from Moldova and Ukraine were not
for setting the price and the degree of cost recovery. The application
available. Additional efforts need to be undertaken in the cooperation
of economic and environmental principles into price setting and the
with these countries. Data from all countries would be needed as a
degree of application of cost recovery vary from one to another
prerequisite for a complete economic analysis of the Danube River
Danube country according to the specific legal and socioeconomic
Basin District. For the trend analysis key economic variables are
conditions. Furthermore, a number of influencing factors are to be
missing.
considered when comparing water prices, costs, or level of cost recov-
ery at the international level. The issue of cost recovery is therefore
The accuracy of the data and variables is not always satisfactory due
primarily an issue of national importance and will be dealt within Part
to several reasons. The data often is only available at the national
B of the WFD roof report 2004. However, every effort should be
level, therefore different levels of aggregation need to be used. In
undertaken in the future for compiling cost recovery levels for the
addition, the data is usually collected based on administrative units
Danube River Basin District.
and not on the basis of river basins or sub-basins. This means that the
data needs to be normalised. However, relevant information can get
lost in the normalisation process in particular where information of
7.1.4. Preparing for the cost-effectiveness analysis
high significance is in small basins as this information may not be
The cost-effectiveness analysis will not be dealt with in the Part A of
significant on the national level.
the WFD roof report. The WATECO guidance document recommends
making preparatory steps in 2004. However, it is not a real
requirement for reporting in 2004 and is not analysed on the Danube-
7.3. Conclusions on the economic analysis of water uses
wide level. Cost-effectiveness analysis is a future task and will be dis-
Following the publication of the national reports (Part B of the WFD
cussed in national reports (Part B).
Report 2004) an investigation of the national levels of recovery of the
costs of water services should be carried out aiming to get a rather
complete picture of these levels on the Danube River Basin District.
This national information will be a useful input for the future analysis
as required under the WFD, such as the cost-effectiveness analysis,
and on assessing the economic/financial impacts of proposed
programmes of measures.
166
8. Public information and consultation
The active involvement of the public is a core principle in sustainable water management. This basic fact was already recognised when the Danube River
Protection Convention (DRPC) was signed on 29 June 1994 in Sofia, Bulgaria. The DRPC has already foreseen the involvement of the organised public in the
framework of its implementation. To date, 10 organisations have taken this opportunity and have become observers to the ICPDR. These organisations
include NGOs, organisations representing private industry, and intergovernmental organisations.
Organisations with observer status in the ICPDR
8.1. Strategy for public participation in
river basin management 2003-2009
≠ Black Sea Commission (BSC)
Based on Article 14 of the WFD, the objectives of this strategy are:
≠ Danube Environmental Forum (DEF)
≠ To ensure public participation in the implementation of the WFD, especially
≠ Danube Commission
concerning the development of the Danube River Basin Management Plan.
≠ Global Water Partnership (GWP)
≠ To facilitate the establishment of effective structures and mechanisms for
≠ International Association for Danube Research (IAD)
public participation that will continue operating beyond the first cycle of river
≠ International Association of Water Supply Companies in the Danube River
basin management planning.
Catchment Area (IAWD)
≠ To provide guidance to national governments on how to comply with their
≠ International Hydrological Programme of the UNESCO (IHP)
obligations under the WFD by providing practical support and guidance in
≠ RAMSAR Convention on Wetlands
addressing public participation.
≠ Regional Environmental Center for Central and Eastern Europe (REC)
≠ To inform key stakeholders about the structures for public participation and
≠ World Wide Fund for Nature ≠ Danube-Carpathian Programme (WWF-DCP)
public involvement at the various levels.
The basic principles of the "Danube River Basin Strategy for Public
Participation in River Basin Management Planning 2003-2009" were
This cooperation, which grants observers the right to participate at
approved in June 2003.
ICPDR decision-making meetings and Expert Group meetings, has
proven to be successful in ensuring that different aspects and
One of the crucial elements of the "Danube River Basin Strategy
approaches could influence and shape the current water management
for Public Participation in River Basin Management Planning 2003-
in the Danube River Basin.
2009" was the recognition of having public participation organised
at various levels to assure meaningful inputs. Discussing the Danube
This approach of involving the public has even been enhanced by the
River Basin, these levels are:
requirements of the EU Water Framework Directive (WFD). Despite
≠ international or "roof" level (Danube River Basin District)
the fact that these requirements lay within the responsibility of the
≠ national level (the key "implementing" and management level)
EU Members States, the ICPDR ≠ being the co-ordination platform
≠ sub-basin level (transboundary or/and national)
for the implementation of the WFD on issues of basin-wide or
≠ local level.
multilateral concern - has taken this new challenge as a basis to
reviewing its ongoing practice. The ICPDR started an active process
All four levels are required to assure the success of any activity
towards defining a "Danube River Basin Strategy for Public
at any single level. The "roof " level provides the framework for
Participation in River Basin Management Planning 2003-2009" and
co-ordination throughout the river basin. There are differences
consequently developing an "ICPDR Operational Plan".
between the levels depending on stakeholdership, types of activities,
timetable of these activities, management and co-ordination needs.
Public information and consultation 167
8.2. ICPDR Operational Plan
8.2.1.2. Confidence building ≠ WFD brochure and WFD on the internet
As a next step, the activities at ICPDR level were developed in detail
So far, little information on the implementation of the WFD in the
and summarised in the "ICPDR Operational Plan". This plan as an
Danube River Basin District is available. It is therefore of major
overall framework and in particular the activities for 2004 were
importance to provide information about the WFD, its goals and the
adopted in December 2003.
possibilities of getting involved in its implementation.
The Operational Plan provides a description of the activities at the
One of the tools is the WFD brochure for the general public, available in
roof level, including a timetable and a workplan. The Operational
English as well as in the national languages, all following the same
Plan is seen as a planning tool, which is regularly adjusted to the
layout. The WFD brochure includes basic facts about the WFD and its
needs of the ICPDR.
implementation in the Danube River Basin, about the role of ICPDR
and national governments as well as the provisions for public
For the first time ever, 13 countries of one large river basin embarked
information and consultation. In addition, each "national brochure"
on the process in developing a coherent approach and to jointly
includes information of national importance.
develop tools for the public involvement.
The second important tool is the ICPDR Information System (www.icpdr.org)
The public participation activities of the ICPDR in 2004 are aimed at
with a special section on WFD implementation, providing access to
≠ raising awareness about water management in general and about the
all relevant documents. Links are available from the ICPDR Info
Danube River Basin in particular,
System to the homepages of the respective Danube Basin Countries ≠
≠ informing the public (including stakeholders and NGOs) about the WFD and
and vice versa. This network of links provides easy access to informa-
the possibilities to participate in the process of its implementation;
tion on the different levels.
≠ ensuring that organisational mechanisms for public participation are in
place (in line with the national processes);
8.2.1.3. Reaching the public ≠ developing a media network
≠ involving the appropriate stakeholder groups;
Transparent and direct information through dialogue is crucial for a
≠ developing a network of public participation experts throughout the Danube
successful cooperation. Updated information to the interested public
River Basin,
about ongoing activities in the frame of the implementation of the
≠ developing an effective media network to ensure the reach of a wider public.
WFD should raise awareness and stimulate people and organisations
to take on responsibility in the process of river basin management
planning.
8.2.1. Activities in 2004
With the assistance of the Danube Environmental Forum (DEF), the
8.2.1.1. Joining forces ≠ a Network of Public Participation Focal Points
ICPDR established a network of journalists (print media, electronic
In order to secure that public participation activities are carried out in
media, TV) interested in water management and serving as
a concerted way throughout all Danube countries, the ICPDR
multiplicator for WFD related issues throughout the basin.
developed a network of national public participation focal points.
These focal points ensure that activities carried out on the ICPDR
8.2.1.4. Knowing your partners ≠ a stakeholder analysis
level are in line with and complementing the national public
In December 2003 a stakeholder analysis was carried out. Based on
participation efforts.
the findings, a decision on stakeholder involvement will be made to
guarantee the successful implementation of the WFD.
Public information and consultation 168
8.2.2. Celebrating the Danube River Basin ≠ Danube Day
It is important that water management is not only discussed by a
circle of experts, but that the public is linked to the ongoing political
discussions/decisions, especially if their outcomes affect people's
daily life. Therefore, the ICPDR initiated the basin-wide celebration
of Danube Day providing a platform for the inhabitants to
demonstrate that they care for their river and that they take
responsibility for its protection for future generations.
Danube Day Logo:
Celebrated for the first time on 29 June 2004 ≠ at the 10th
Symbol of water movement and the connection of people.
Anniversary of the signing of the Danube River Protection
Convention ≠ the Danube Day should be institutionalised and become
a stable element in the schedules of ministries, NGOs and all other
organisations caring and working for the Danube River Basin.
Over 100 events and celebrations were held throughout the Danube
river basin ≠ all 13 Danube river countries contributed greatly to
The general character of the Danube Day activities is light-hearted
make Danube Day 2004 a success.
and celebratory and the Danube Day aims to:
≠ increase the awareness with citizens and stakeholders alike of sharing one
The International School Competition "Danube Art Master", also car-
river basin and depending on each other, stimulating "Danube solidarity"
ried out in all 13 Danube River Basin Countries, reported more than
("everybody lives downstream");
1000 contributions ≠ the young generation was truly inspired by the
≠ provide a platform for communication with the public on the Danube River
Danube.
Basin and ongoing water management processes, as required by the WFD;
≠ inspire and motivate actions to maintain and improve the status of the water
A Danube Day website was launched presenting information on activ-
related ecosystems in the Danube River Basin.;
ities in all the different Danube River Basin countries organised by
≠ promote the ICPDR and its contracting parties, and improve transparency
different partners and linked to national websites providing
and acceptance of integrated river basin management.
information on Danube Day activities (http://www.danubeday.org).
Looking back on this very successful first Danube Day, there is a
strong hope that the annual celebration of Danube Day will further
stimulate "Danube solidarity" and become a vital link between the
people sharing the river basin.
169
9. Key Conclusions and outlook
Some sections of the Danube River are still rather untouched ecosystems and, despite possible pollution problems, constitute a unique heritage to be
preserved. In addition, the Danube River Basin still hosts many species and habitats of outstanding ecological value and unique importance for
biodiversity. In particular the Danube Delta is of global significance. The future management of the river basin needs to ensure that the focus of measures
is not only the restoration of affected water bodies but equally important is the preservation of those few areas that are still ecologically intact.
The current analysis shows that in the last two decades, considerable
Overall, nutrient loads into the Danube basin have significantly
improvements in environmental conditions in the Danube basin have
decreased over the past 20 years, however, being still well above the
been made. Where investments, e.g. in wastewater treatment, have
levels of 1955. In the future this improvement in reduction of nutrient
taken place, the improvement of the water quality is visible. However,
pollution may be lost, because of an increase in diffuse pollution from
a major part of pollution reduction can be attributed to the decline of
agriculture. Impacts from nutrients can mainly be seen in the
industries and agricultural activities in the middle and lower parts of
receiving coastal waters of the Black Sea but also in many lakes and
the basin since 1989. In these areas investments for a sustainable
groundwater bodies throughout the basin. While in rivers nutrients
reduction of pollution levels has just started and will have to continue
generally cause fewer problems due to turbulent flow conditions,
for another 10 to 20 years.
some slow flowing river stretches such as the middle Danube,
impounded river sections, and lakes show effects of eutrophication.
In surface waters, the loads of organic pollution are still unacceptably
high in most of the Danube tributaries and in some parts of the
In order to ensure the further reduction or at least stand-still of
Danube River. The considerable discharge of untreated or
nutrient loads, the expected increase of diffuse sources needs to be
insufficiently treated wastewater from municipal, industrial and
compensated by the reduction of point source inputs. In addition to
agricultural point sources is wide-spread, in particular in the middle
the investment strategies already described for dealing with organic
and lower part of the basin. The indicators for impact from organic
pollution, the introduction of phosphate-free detergents throughout
pollution show that the water quality is significantly affected, the
the Danube basin appears to be a cost-effective and necessary
major cause being insufficient treatment of waste-water from munici-
measure. Introducing such an instrument in a mandatory way could
palities.
be undertaken at the EU level, however, options of voluntary
instruments are already being explored in the context of the ICPDR.
A significant reduction potential for organic pollution exists through
the application of best available techniques for wastewater treatment
As mentioned above, economic development in the middle and lower
facilities. Considerable efforts, in particular as regards financial
parts of the Danube region will inevitably increase diffuse nutrient in-
investment will be necessary to reduce organic pollution to acceptable
puts. It should be ensured that best environmental and agricultural
levels in some parts of the middle and lower basin. Financial
practices are being developed and applied in order to create a sustain-
programmes and initiatives from the EU and other international
able agriculture in the long term. In this respect, there is still room for
donors are already set up. The preparation of concrete projects and
reduction of nutrient loads in the upper part of the Danube basin. The
measures needs to be pursued without delay even well before 2009
potential of the reformed EU Common Agricultural Policy should be
since the successful resolution of this basic problem will be the first
fully explored in this regard.
essential step to implement the Water Framework Directive and other
relevant EU legislation. It will remain to be seen whether these load
reductions will be sufficient to achieve the "good ecological status",
which are linked to organic pressures.
Key Conclusions and outlook 170
Hundreds of hazardous substances are being used and released into the
Future infrastructure projects such as planned hydropower
Danube river basin. Pollution from hazardous substances is
developments and plans to expand navigation threaten the status of
significant although the full extent cannot be evaluated to date. There
the riverine ecosystem on the Danube and its tributaries further, in
are only few data available for some hazardous substances such as
particular, since some of these projects would affect the few
heavy metals and pesticides, which indicate the transboundary scale
remaining free-flowing sections of the Danube. It needs to be ensured
of the problem. Cadmium and lead can be considered as the most
that these future projects minimise environmental impacts in the
serious heavy metals exceeding the target values considerably in
Danube river basin and compensate inevitable environmental damage
many locations on the lower Danube. Also, pesticides show alarming
through appropriate mitigation measures.
concentrations in some tributaries and in the lower Danube. It will be
necessary to improve the data base on pressures and impacts from
The Danube River Basin contains a large number of wetlands offering
hazardous substances, e.g. through further development of the
unique habitats for a rich and diverse aquatic community. Many of
existing inventories such as the European Pollutant Emission Register
these areas have high protection status such as the large wetland com-
(EPER) to a comprehensive Pollutant Release and Transfer Register
plexes protected under international conventions, others still deserve
(PRTR). Despite the "knowledge gap" it is essential that measures for
to be designated as protected areas, but have not been granted such
the introduction of "best available techniques" and "best environmen-
status. 80 % of the historical floodplain on the large rivers has been
tal practices" are being developed without delay, otherwise it will be
lost during the last 150 years mainly from significant
impossible to achieve "good ecological" and "good chemical status".
hydromorphological alterations, and many already protected areas de-
As mentioned above, many requirements and guidelines for appropri-
teriorate due to new human interventions. Still today, many wetlands
ate measures exist in the European Union (e.g. the BAT reference
are under pressure from navigation, hydropower plants, intensive
documents under the IPPC Directive) and other international bodies,
agriculture and forestry as well as from new infrastructure projects.
however, the appropriate investments need to be secured on the basis
Wetland restoration can bring many benefits, in particular for flood
of a clear priority setting.
protection. As a first step, an inventory of the most important water-
related protected areas for species and habitat protection has been
The extent of the hydromorphological alterations in the Danube basin has
established for the Danube River Basin.
been significant over the past centuries. Such alterations include,
inter alia, the building of dams, weirs and sluices, the canalisation of
The Danube Delta has suffered significant impacts from anthropogenic
rivers and subsequent disconnection of their floodplains and old arms,
pressures in the last 50 years. These were caused in part by high nutri-
erosion (incision) of the river bed and lowering of water tables with
ent loads and heavy metals from the Danube. Nutrient inflow has led
consequently higher flood risks. Some of these changes are
to eutrophication of the delta arms and its lakes; elevated
irreversible, however, there is a potential for rehabilitation, which
concentrations of heavy metals occur especially in the delta lakes. In
should be explored to the fullest extent. This is particularly the case,
addition, severe hydromorphological alterations and intensive agricul-
where floodplains could be reconnected with the main river thereby
ture and forestry have led to the loss and deterioration of large areas
improving natural flood retention and enhancing fish migration to
of land formerly unused and interconnected within the delta. As a
their natural habitats. In addition, migration path-ways would be
consequence species and habitat diversity has declined. The large
needed on barriers on the Danube and most of its tributaries.
number of hydraulic structures on the Danube and its tributaries has
also considerably reduced the sediment transport thereby bringing the
Due to these significant hydromorphological changes large parts of
growth of the Danube Delta into the Black Sea in parts to a halt.
the Danube River and of numerous tributaries have been provisionally
identified as heavily modified water bodies on the basin-wide scale.
Although considerable restoration measures have been undertaken in
Dams and weirs on the Danube as well as bank reinforcements and
the last decade new canalisation projects are still being planned and
fixations on the tributaries put these stretches "at risk" of failing to
implemented. Sound environmental impact assessments need to be
reach the "good ecological status".
carried out and alternative solutions found in order to protect this
unique natural heritage of global importance.
Key Conclusions and outlook 171
The coastal waters and the larger marine environment of the Black Sea
Such an improved knowledge base would include, inter alia, the
have been strongly influenced by high nutrient loads from the inflow-
development of:
ing rivers especially in the period up to the mid 1980s. Since then a
≠ an improved emission inventory leading to a Pollutant Release and Transfer
significant reduction of nutrient input has taken place, but the nutrient
Register (PRTR) for the Danube river basin;
level is still significantly higher than in the 1960s. The effects of
an inventory of hydromorphological alterations and of HMWB;
reduced nutrient inputs are clearly visible particularly in the North-
≠ improved transboundary monitoring programmes, mainly for the purpose of
western Shelf of the Black Sea, which is shallow and therefore partic-
"surveillance monitoring" of the ecological and chemical status;
ularly susceptible to eutrophication. The marine ecosystem of the
≠ an inventory on the quality status of protected areas and, where appropriate
Black Sea is highly complex and strongly influenced not only from
wetlands;
high nutrient loads from the Danube and other Black Sea tributaries
≠ an inventory of transboundary groundwater bodies and their status.
but also from other pressures such as over-fishing and changes in the
food web.
In addition, a Strategic Plan has been developed for a common,
consistent and harmonised Geographical Information System (GIS) for the
Groundwater is mainly used for drinking water supply and for
Danube River Basin. It addresses organizational, technical and
agriculture. In some areas significant pressures result from over-
financial issues, defines a planning procedure, and explains strategies
abstraction, high nutrient levels infiltrating the groundwater as well as
and concepts for this important management tool. The aim is to facili-
from hazardous substances originating from inadequate waste
tate the movement and analysis of data in a structured and seamless
treatment. For these reasons a few important transboundary
manner.
groundwater bodies are estimated to be "at risk" to reach the environ-
mental objectives. Since many of the groundwater bodies are highly
Furthermore, the harmonisation of criteria and assessment methodologies
vulnerable special protection strategies are needed to ensure the
needs to be pursued. An improved analytical quality control system is
sustainable use and protection of groundwater.
needed. In particular, the harmonisation of elements of the ecological
quality assessment is essential, including the typology and reference
Finally, the economic aspects of implementing the Water Framework
conditions as well as the harmonisation of criteria for designating
Directive need to be strengthened. Currently, economic data are being
heavily modified water bodies, which would finally lead to carrying
collected based on administrative boundaries, which are not in
out a Danube intercalibration exercise in 2007/2008.
accordance with the hydrological boundaries of the river basins. It has
become apparent that this is a problem throughout Europe, not only in
Next steps are to integrate the results of the pressure and impact
the Danube River Basin. Best practices on assessing cost-
analysis with the results of the economic analysis of water uses in
effectiveness and introducing water pricing strategies should be
order to develop a coherent and integrated programme of measures
shared.
for the water bodies "at risk" of failing to reach the environmental
objectives.
This first analysis of the Danube River Basin District is based on
available data and is the best result that was possible within the given
Public participation should be carried out on different levels depending
time frame. It thereby reflects the current level of preparation of a
on the scale of the issues being addressed. In a large transboundary
harmonised and integrated river basin management analysis. The
river basin like the Danube there is an international dimension
starting point and the availability of data is vastly different throughout
to public information and consultation. An Operational Plan for
the Danube River Basin District. The extent, the quality and the
the international level has been agreed for 2004 and will be further
degree of harmonisation of the data will improve with future reviews
developed for the following years.
and updates of the characterisation and analysis, which will make
later assessments more comprehensive and robust. In order to achieve
this goal, the dedicated process needs to be set up to improve the data
base, in particular as regards data availability and comparability.
172
10. References
Legal references
Decision No 2455/2001/EC of the European Parliament and of the Council of 20 November 2001 establishing the list of priority substances in the field of water
policy and amending Directive 2000/60/EC (Text with EEA relevance), OJ 2001 L 331/1
Decision No 884/2004/EC of the European Parliament and of the Council of 29 April 2004 amending Decision No 1692/96/EC on Community guidelines for the
development of the trans-European transport network (Text with EEA relevance), OJ 2004 L 167/1
Directive 2000/60/EC of the European Parliament and of the Council of 23 October 2000 establishing a framework for Community action in the field of water policy,
OJ 2000 L 327/1
Convention Concerning the Protection of the World Cultural and Natural Heritage (UNESCO World Heritage Convention) ≠
http://whc.unesco.org/pg.cfm?cid=182 (October 28, 2004)
Convention on Cooperation for the Protection and Sustainable use of the Danube River (Danube River Protection Convention) ≠
http://www.icpdr.org/pls/danubis/danubis_db.dyn_navigator. show (October 28, 2004)
Convention on environmental impact assessment in a transboundary context (ESPOO-Convention) ≠
http://www.unece.org/env/eia/documents/conventiontextenglish.pdf (October 28, 2004)
Convention on International Trade in Endangered Species of Wild Fauna and Flora (CITES) ≠ http://www.cites.org/eng/disc/text.shtml#texttop (October 28, 2004)
Convention on Wetlands of International Importance especially as Waterfowl Habitat (Ramsar Convention) ≠ http://www.ramsar.org/key_conv_e.htm
(October 28, 2004)
Stockholm Convention on persistent organic pollutants (POPs Convention) ≠
http://www.pops.int/documents/convtext/convtext_en.pdf (October 28, 2004)
UN/ECE Convention on the Protection and Use of Transboundary Watercourses and International Lakes ≠
http://www.unece.org/env/water/pdf/watercon.pdf (October 28, 2004)
Council Directive 76/160/EEC of 8 December 1975 concerning the quality of bathing water, OJ 1976 L 31/1
Council Directive 76/464/EEC of 4 May 1976 on pollution caused by certain dangerous substances discharged into the aquatic environment of the Community, OJ
1976 L 129/23
Council Directive 79/117/EEC of 21 December 1978 prohibiting the placing on the market and use of plant protection products containing certain active
substances, OJ 1979 L 33/36
Council Directive 91/271/EEC of 21 May 1991 concerning urban waste-water treatment (UWWT-Directive), OJ 1991 L 135/40
Council Directive 91/414/EEC of 15 July 1991 concerning the placing of plant protection products on the market, OJ 1991 L 230/1
Council Directive 91/676/EEC of 12 December 1991 concerning the protection of waters against pollution caused by nitrates from agricultural sources,
OJ 1991 L 375/1
Council Directive 92/43/EEC of 21 May 1992 on the conservation of natural habitats and of wild fauna and flora, OJ 1992 L 206/7
Council Directive 96/61/EC of 24 September 1996 concerning integrated pollution prevention and control (IPPC-Directive), OJ 1996 L 257/26
References 173
Cited literature
ALM¡SSY, E. & BUZ¡S, Z. (1999): Vol. I. Inventory of Transboundary Groundwaters - UN/ECE Task Force on Monitoring & Assessment, Lelystad, 284 pp. ≠
http://www.iwac-riza.org/ WAC/IWACSite.nsf/7BAFC09E93A2EE9DC1256BB800476C12/$File/Task%20Force%20Vol%201.pdf (October 19, 2004).
BACH, M., HUBER, A., FREDE, H.-G., MOHAUPT, V. & ZULLEI-SEIBERT, N. (2000): Sch‰tzung der Eintr‰ge von Pflanzenschutzmitteln aus der Landwirtschaft in die
Oberfl‰chengew‰sser Deutschlands ≠ Berichte des Umweltbundesamtes, Erich Schmidt Verlag Berlin, Bd. 03/00, 293 pp.
BANNING, M. (1998): Auswirkung des Aufstaus grˆþerer Fl¸sse auf das Makrozoobenthos ≠ dargestellt am Beispiel der Donau ≠ Essener ÷kologische Schriften,
Westarp Wissenschaften, Bd. 9, p. 1-185.
BEHRENDT, H., CONSTANTINESCU, L.T., CVITANIC, I., DRUMEA, D., JABUCAR, D., JURAN, S., PATAKI, B., SCHREIBER, H., SNISHKO, S. & ZESSNER, M. (2003):
N‰hrstoffeintr‰ge und -frachten im Flusssystem der Donau Ergebnis einer Flussgebietsdifferenzierten Modellanalyse. ÷sterr. Wasser- und
Abfallwirtschaft 55, p. 183-189.
BEHRENDT, H., FERENCE, L., LAMPERT, C., SCHREIBER, H., VAN GILS, J. & ZESSNER, M. (2005): Changes of nutrient loads in the Danube in the last decades and
possible changes in the future ≠ a scenario analysis. Arch. Hydrobiol. Suppl. Large Rivers, (in print).
BEHRENDT, H., HUBER, P., KORNMILCH, M., OPITZ, D., SCHMOLL, O., SCHOLZ, G. & UEBE, R. (2000): Nutrient Emissions into river basins of Germany ≠
UBA-Texte 23/00, Federal Environmental Agency, Berlin, 288 pp.
BERNHART, H.H., G÷BEL, N., EISENHAUER, N., KLEY, M. & KRAUTER, G. (1987): Analyse des Fluþabschnittes Greifenstein/Wien ≠ Marchm¸ndung. ≠ Vorstudie i.A. der
Nationalparkplanung Donauauen, Karlsruhe, 74 pp und Anhang.
BIJ DE VAATE, A. & KLINK, A. (1995): Dikerogammarus villosus SOWINSKY (Crustacea: Gammaridae) - a new immigrant in the Dutch part of the Lower Rhine ≠
Lauterbornia 20, p. 51-54.
BRINK VAN DEN, F., PAFEN, B., OOSTERBROOEK, F. & VAN DER VELDE, G. (1993): Immigration of Echinogammarus ischnus STEBBING, 1906 (Crustacea,
Amphipoda) into the Netherlands via the Lower Rhine ≠ Bulletin Zoologisch Museum Universiteit van Amsterdam p. 167-170.
BRINK VAN DEN, F., VAN DER VELDE, G. & BIJ DE VAATE, A. (1989): A note on the immigration of Corophium curvispinum SARS, 1895 (Crustacea, Amphipoda)
into the Netherlands via the river Rhine ≠ Bulletin Zoologisch Museum Universiteit van Amsterdam 11, p. 211-213.
BRINK VAN DEN, F., VAN DER VELDE, G. & CAZEMIR, W. (1990): The faunistic composition of the freshwater section of the river Rhine in the Netherlands: present
state and changes since 1900 ≠ Limnologie Aktuell 1, p. 192-216.
BSC (2002): State of the Environment of the Black Sea, Pressures and Trends, 1996-2000 ≠ Commission on the Protection of the Black Sea Against Pollution, Istan-
bul, 59 pp. incl. Annexes. ≠ http://www.blacksea-commission.org/Downloads/SOE_English.pdf and
http:// www.blacksea-commission.org/Downloads/SOE_Annexes_English.pdf (November 11, 2004)
CS¡NYI, B. (1998-1999): Spreading invaders along the Danubian highway: first record of Corbicula fluminea (O.F. MÐLLER 1774) and C. fluminalis (O.F. MÐLLER
1774) in Hungary (Mollusca, Bivalvia) ≠ Fol. Hist.-nat. Mus. Matr., 23, p. 343-345.
daNUbs (2005): Nutrient Management in the Danube Basin and its Impact on the Black Sea ≠ Final Report ≠ Contract EVK1-CT-2000-00051,
5th EU Framework Programme, co-ordinated by the Institute for Water Quality and Waste Management, Vienna University of Technology, (in prep.) ≠
http://danubs.tuwien.ac.at/
ESSL, F. & RABITSCH, W. (2002): Neobiota in ÷sterreich ≠ Umweltbundesamt, Wien, 432 pp.
EUROSTAT (2004a), Key indicators ≠ Population connected to wastewater treatment plants ≠
http://europa.eu.int/comm/eurostat/newcronos/queen/display.do?screen=welcome&open=/yearlies_copy_221546607827/d_copy_874392991452/dd
_copy_251110364103/dda_copy_649289610368&language=de&product=YES&root=YES_copy_539019591709#/yearlies_copy_221546607827/d_
copy_874392991452/dd_copy_251110364103/dda_copy_649289610368 (July 21, 2004).
EUROSTAT (2004b), Key indicators on EU policy ≠ http://epp.eurostat.cec.eu.int/portal/page?_ pageid=1090,1&_dad=portal&_schema=PORTAL (October 7, 2004).
FAO (2004), Agricultural Statistics ≠ http://faostat.fao.org/faostat/collections?subset=agriculture (October 22, 2004).
FOECKLER, F. (1987): Das Vorkommen der Gammariden in Donauraum zwischen Geisling und Staubing. ≠ 26. Arbeitstagungen der IAD, Passau, 14.-18. Sept. 1987,
Wissenschaftliche Ðbersichtsreferate, M¸nchen, p. 103-116.
FONTES, R.-J. & SCH÷LL, F. (1994): Rhitopanopeus harrisii (GOULD, 1841) - eine neue Brackwasserart in deutschen Rheinabsnitt (Crustacea, Decapoda, Brachyura)
≠ Lauterbornia 15, p. 111-113.
GERMAN STATISTICAL YEARBOOK (1999 to 2001): Zahlen und Fakten ¸ber die Bundesrepublik Deutschland 1999, 2000, 2001. Statistisches Bundesamt, Wiesbaden.
CD-Rom-Ausgabe.
References 174
GUTI, G. & KERESZTESSY, K. (1998): Effects on long-term hydrological changes on fish communiteis in the Middle-Danube. ≠ Limnologische Berichte Donau 1997,
32. Konferenz der Internationale Arbeitsgemeinschaft Donauforschung der Societas Internationalis Limnologiae, Wien, p. 161-176.
HANISCH, K. & KORDINA, H. (2004): Flussbauliches Gesamtprojekt ˆstlich von Wien. Konzept zur Umweltvertr‰glichkeitserkl‰rung, Juni 2004 ≠ Kurzfassung. Studie
i.A. Wasserstrassendirektion und BM:VIT, 21 pp. ≠
http://www.donau.bmvit.gv.at/fileadmin/Image_Archive/ donau/kurzfacts/kurzfassung.pdf (October 22, 2004).
ICPDR (2001): Water Quality in the Danube River Basin, TNMN Yearbook 2001 ≠ International Commission for the Protection of the Danube River/Permanent
Secretariat, Vienna, 79 pp. incl. CD-ROM.
ICPDR (2002): Joint Danube Survey, Technical Report of the International Commission for the Protection of the Danube River, Vienna, 261 pp. incl. CD-ROM.
ICPDR (2004): A brief description of the Danube River Basin ≠ http://www.icpdr.org/pub/dpcu/brief. html (April 4, 2003).
IHD (1986): Die Donau und ihr Einzugsgebiet. Eine hydrologische Monographie (Teil 1, 2, 3), Regionale Zusammenarbeit der Donaul‰nder, Wien/M¸nchen.
ILLIES, J. (1978): Limnofauna Europaea, G. Fischer Verlag, Stuttgart, 532 pp.
JUNGWIRTH, M. (2003): Wasserkraftnutzung und ˆkologische Funktionsf‰higkeit von Flieþgew‰ssern ≠ in: FÐREDER, L. & ETTINGER, R., Tagungsband ÷kologie und
Wasserkraftnutzung, Innsbruck, p. 11-31.
KINZELBACH, R. (1991): Die Kˆrbchenmuscheln Corbicula fluminalis, C. fluminea and C. fluviatilis. - Mainzer Naturwiss. Archiv 29, p. 215-228.
KINZELBACH, R. (1995): Neozoans in European waters ≠ Exemplifying the worldwide process of invasion and species mixing ≠ Experientia 51, p. 526≠538.
KONOLD, W. & SCHÐTZ, W. (1996): Die Donau - Gef‰hrdungen eines internationalen Flusses. In: LOZAN, J. & KAUSCH, H. (Hrsg.): Warnsignale aus Fl¸ssen und
ƒstuaren ≠ Wissenschaftliche Fakten, Berlin, p. 28-38.
KOTH…, P. (1968): Hyapnia invalida (Polychaeta, Sedentaria) und Jaera istri (Isopoda) erstmals in der deutschen Donau ≠ Arch. Hydrobiol. Suppl. 34, p. 88-114.
KOVACECK, H., MANN, M. & ZAUNER, G. (1991): Fl‰chendeckende Biotopkartierung des aquatischen Lebensraumes im Auenbereich des zuk¸nftigen Nationalparks
Donauauen. ≠ unpublished study on behalf of Auland, Betriebsgesellschaft Marchfeldkanal, Nationalpark Donauauen, Wien, 49 pp.
LANCELOT, C., MARTIN, J.-M., PANIN, N. & ZAITSEV, Y. (2002): The North-western Black Sea: A Pilot Site to Understand the Complex Interaction Between Human
Activities and the Coastal Environment ≠ Estuarine Coastal and Shelf Science, Volume 54, p. 279-283.
MOOG, O. & JANECEK, B. (1991): River flow, substrate type and Hydrurus density as major determinants of benthic macroinvertebrate abundance, composition, and
distribution ≠ Verh. Internat. Verein. Limnol. 24, p. 1888-1896.
MOOG, O. & STUBAUER, I. (2003): Activity 1.1.2 "Adapting and implementing common approaches and methodologies for stress and impact analysis with particular
attention to hydromorphological conditions" ≠ Final report, UNDP-DRP, 79 pp.
OOSTERBERG, W., STARAS, M., BOGDAN, L., BUIJSE, A.D., CONSTANTINESCU, A., COOPS, H., HANGANU, J., IBELINGS, B.W., MENTING, G.A.M., NAVODARU, I. & TOROK,
L. (2000): Ecological gradients in the Danube Delta lakes, present state and man-induced changes ≠ Danube Delta National Institute for Research
and Development (DDNI), Tulcea, Romania, and Institute for Inland Water Management and Waste Water Treatment, Lelystad, The Netherlands, 169
pp. ≠ http://www.riza.nl/projecten/netherlands-romanian_cooperation/ products/
12_danube%20delta%20lakes.pdf (October 22, 2004).
REINARTZ, R. (2002): Sturgeons in the Danube River. Biology, Status, Conservation ≠ Literature study conducted on behalf of the International Association for
Danube Research (IAD), Landesfischereiverband Bayern e.V. and Bezirk Oberpfalz, 150 pp.
ROTT, E., PIPP, E., PFISTER, P., VAN DAM, H., ORTLER, K., BINDER N. & PALL, K. (1999): Indikationslisten f¸r Aufwuchsalgen in ˆsterreichischen Flieþgew‰ssern. Teil
2: Trophie-indikation sowie geochemische Pr‰ferenz; taxonomische und toxikologische Anmerkungen. - Bundesministerium f¸r Land- und
Forstwirtschaft, Wasserwirtschaftskataster, Wien, 248 pp.
SCHIMPF, H. & HARREITER, H. (2001): Feststoffhaushalt in den Stauhaltungen der ˆsterreichischen Donau ≠ ÷sterreichische Wasser- und Abfallwirtschaft 53
(11/12), p. 276-280.
SCHLEUTER, M. & SCHLEUTER, A. (1995) Jaera istri VEUILLE (Jaeiridae, Isopoda) aus der Donau erreicht ¸ber den Main-Donau-Kanal den Main ≠ Lauterbornia 21,
p. 177-178.
SCHLEUTER, M., SCHLEUTER, A., POTEL, S. & BANNING, M. (1994): Dikerogammarus haemobaphes EICHWALD 1841 (Gammaridae) aus der Donau erreicht ¸ber
den Main-Donau-Kanal den Main ≠ Lauterbornia 19, p. 155-159.
SCH÷LL, F., BECKER, C. & TITTIZER, T. (1995): Das Makrozoobenthos des schiffbaren Rheins von Basel bis Emmerich 1986-1995 ≠ Lauterbornia 21, p. 115-137.
SCHREIBER, H., BEHRENDT, H., CONSTANTINESCU, L., CVITANIC, I., DRUMEA, D., JABUCAR, D., JURAN, S., PATAKI, B., SNISHKO, S. & ZESSNER, M. (2003):
Harmonised Inventory of Point and Diffuse Emissions of Nitrogen and Phosphorus for a Transboundary River Basin, Final Report, Institute of Freshwa-
ter Ecology and Inland Fisheries, Berlin, 158 pp.
SCHREIBER, H., BEHRENDT, H., CONSTANTINESCU, L.T., CVITANIC, I. DRUMEA, D., JABUCAR, D., JURAN, S., PATAKI, B., SNISHKO, S. & ZESSNER, M. (2005): Point and
diffuse nutrient emissions and loads in the transboundary Danube river basin ≠ a modelling approach. Arch. Hydrobiol. Suppl. Large Rivers, (in
print).
References 175
STANCIK, A., JOVANOVÕC, S., SIKORA, A., ÐRGE, L. & MIKL”S, D. (1988): Hydrology of the River Danube ≠ Publishing House PrÌroda, Bratislava, 271 pp.
TITTIZER, T. & SCHLEUTER, A. (1989): Ðber die Auswirkungen wasserbaulicher Massnahmen auf die biologischen Verh‰ltnisse in den Bundeswasserstrassen ≠
Deutsche Gew‰sserkundliche Mitteilungen 33, p. 91-97.
TITTIZER, T. (1984): Die Auswirkungen wasserbaulicher Massnahmen auf den biologischen Zustand der Donau - Int. Arbeitsgemeinschaft Donauforschung, 24.
Arbeitstagung Szentendre, Tagungsbericht, p. 143-144.
TITTIZER, T. (1996a): Vorkommen und Ausbreitung aquatischer Neozoen (Makrozoobenthos) in den Bundeswasserstrasen, in: GEBHARDT, H.,
KINZELBACH, R. & SCHMIDT-FISCHER, S. (Hrsg.): Gebietsfremde Tierarten - Auswirkungen auf einheimische Arten, Lebensgemeinschaften und
Biotope - Situationsanalyse, Landsberg, p. 49-86.
TITTIZER, T. (1996b): Faunenaustausch zwischen Main und Donau ¸ber den Main-Donau-Kanal mit besonderer Ber¸cksichtigung der Neozoen. In: Faunen- und
Florenver‰nderungen durch Gew‰sserausbau - Neozoen und Neophyten. - UBA-Texte 74/96, p. 67-75.
TITTIZER, T., BANNING, M., LEUCHS, H., SCHLEUTER, M. & SCH÷LL, F. (1993): Faunenaustausch Rhein/Main - Altm¸hl/Donau. DGL-Jahrestg, Coburg,
pp. 383-387.
TITTIZER, T., LEUCHS, H. & BANNING, M. (1994): Das Makrozoobenthos der Donau im Abschnitt Kelheim - Johenstein (Donau.km 2414-2202). Limnologie Aktuell 2,
Gustav Fischer Verlag, Stuttgart, p. 173-188.
TOBIAS, W. (1972): Ist der Slammrˆhrenwurm Brachiura sowerbyi BEDDARD 1892 (Oligochaeta: Tubificidae) ein tropischer Einwanderer im Untermain? ≠ Natur
und Museum 102 (3), p. 93-107.
UNDP/GEF (1999a): Danube Water Quality Model simulations in support to the Transboundary Analysis and the Pollution Reduction Programme ≠ Jos van Gils, Delft
Hydraulics, Danube Pollution Reduction Programme, UNDP/GEF Assistance, Delft, The Netherlands, 204 pp.
UNDP/GEF (1999b): Danube River Basin Pollution Reduction Programme Report ≠ Rolf Niemeyer, GFA-Umwelt, Danube Pollution Reduction Programme, UNDP/GEF
Assistance, 280 pp.
UNDP/GEF (1999c): Transboundary Analysis Report ≠ Donald L. Graybill, Danube Pollution Reduction Programme, UNDP/GEF Assistance, 204 pp.
UNDP/GEF (1999d): Evaluation of Wetlands and Floodplain Areas in the Danube River Basin, Final Report, 1999 ≠ prepared by WWF, Danube Pollution Reduction
Programme, UNDP/GEF Assistance, 75 pp.
UNDP/GEF (2004): Inventory of Agricultural Pesticide Use in the Danube River Basin Countries. UNDP/GEF Danube Regional Project,
L. Neumeister & M. Redman, final report on project outputs 1.2 and 1.3, Vienna, 56 pp. + 13 annexes.
via donau, Manual on Danube Ports ≠ www.via-donau.org (October 19, 2004).
VIENNA INSTITUTE FOR INTERNATIONAL ECONOMIC STUDIES (2003): Countries in Transition 2003, wiiw Handbook of Statistics, Vienna, 515 pp.
WAIDBACHER, H. & HAIDVOGEL, G. (1998): Fish migration and fish bypass facilities in the Danube: past and present ≠ in: JUNGWIRTH, M., SCHMUTZ,
S. & WEISS, S. (Eds.): Fish migration and fish bypasses, Fishing News Books, Oxford, p. 85-98.
WITTMANN, K. (1995): Zur Einwanderung potamophiler Malacostraca in der oberen Donau: Limnomysis benedeni (Mysidaceae), Corophium curvispinum (Am-
phipoda) und Atyaephyra desmaresti (Decapoda). ≠ Lauterbornia 20, p. 77-85.
WORLD BANK (2003a): Water Resources Management in South Eastern Europe. Volume I, Issues and Directions ≠
http://lnweb18.worldbank.org/ECA/ECSSD.nsf/ECADocByUnid/8FF7BE 53619B4DA685256D1D006A06D8/$FILE/
VOLUME%20I.pdf (October 19, 2004), Volume II Country Water Notes and Water Fact Sheets ≠ http://lnweb18.worldbank.org/
ECA/ECSSD.nsf/ECADocByUnid/8FF7BE53619B4DA685256D1D006A06D8/$FILE/SEE_volume%20ii%20-%20final.pdf (October 19, 2004).
WORLD BANK (2003b): World Development Indicators ≠ http://www.worldbank.org/data/ quickreference/quickref.html (July 4, 2004).
WWF (2002): Waterway Transport on Europe's Lifeline, the Danube: Impacts, Threats and Opportunities. Part A: River Ecosystem, Vienna,
pp. 134 ≠ http://www.panda.org/downloads/freshwater/DanubeReport.pdf (October 19, 2004).
ZAITSEV, Y. & MAMAEV, V. (1997): Marine Biological Diversity in the Black Sea. A Study of Change and Decline ≠ Black Sea Environmental Series, Vol. 3, United
Nations Publications, New York, 207 pp.
Mario Romulic, Croatia
IMPRINT / ACKNOWLEDGEMENTS
Published by:
Text: Ursula Schmedtje
ICPDR ≠ International Commission for the Protection of the Danube River
Photographs: Mario Romuli¥c, Ulrich Schwarz, BMLFUW Austria,
Vienna International Center, DO412
Maps: Ulrich Schwarz
PO Box 500, 1400 Vienna, Austria
Number printed: 5000
Layout / Grafik: B¸ro X Wien, www.buerox.at
© ICPDR 2005

////Deutschland////÷sterreich////BosnaiHercegovina////Balgarija////Hrvatska////Cesk·republika////Magyarorsz·g////Moldova////Rom‚nia /////SrbijaiCrnaGora////Slovensko////Slovenija////UkraÔna
ICPDR ≠ International Commission for the Protection of the Danube River
Permanent Secretariat
Vienna International Centre, D0412
PO Box 500, 1400 Vienna, Austria
Phone: 0043-1-260 60 5738
Fax: 0043-1-260 60 5895
e-mail: icpdr@unvienna.org, www.icpdr.org