Introduction
The IAEA/UNDP/GEF project on the Nubian Sandstone Aquifer System (NSAS) has as its primary objective, the development of a four-country cooperative strategy for the rational management of this transboundary aquifer system. The NSAS in Egypt, Libya, Chad, and Sudan is a single, massive reservoir of high-quality groundwater, yet has very different characteristics in each country; and each country has different development objectives for the aquifer. The essential first step in developing management strategies for the system is to understand both the transboundary and local effects of recovering water from the aquifer under present rates of withdrawal as well as scenarios of development well into the future. This understanding is being gained through the development of a numerical model of the aquifer system.
The NSAS model had to meet several unique criteria. It had to be conceptually simple to accommodate limited information on aquifer hydrogeology and sparse observations of water levels. The model also had to provide realistic estimates of a very large aquifer spanning approximately two million square kilometres. And perhaps most importantly, the model had to earn the approval of national coordinators and technical experts from the four participating countries.
Model Configuration
The process of developing and calibrating the model included the participation of all four countries at every step, starting with a training workshop in modelling techniques conducted in Vienna in March 2009 and culminating with a final modelling meeting in Vienna in August 2009. Dr. Clifford Voss, a research hydrologist at the United States Geological Survey led the modelling effort in collaboration with Dr. Pradeep Aggarwal of the IAEA. Dr. Voss was assisted by Dr. Safaa Soliman, Associate Professor, Research Institute for Groundwater, Water Research Centre, Egypt.
The IAEA model relied extensively on data collected for the previous modelling work of the Centre for Environment and Development for the Arab Region and Europe (CEDARE), however the IAEA model took a fundamentally different approach. The CEDARE model represented the aquifer system as a two-dimensional model in two layers, in the north, with the confined Nubian Aquifer as the lower layer and the Post-Nubian Aquifer as the upper, unconfined upper layer, and in the south, only the unconfined Nubian Aquifer. This approach did not permit consideration of vertical flow in the system and the knowledge of the extent and physical characteristics of the confining unit separating the upper and lower was too limited to model the system accurately.
In contrast with the CEDARE model, the IAEA model is three dimensional and treats the entire aquifer system as a single homogeneous, but anisotropic unit. The nature of the anisotropy is high horizontal conductivity and low vertical conductivity. This produces the effect of relatively easy movement of water in the horizontal direction and limited movement of water in the vertical direction. Slow movement of water in the vertical direction is an effective way to simulate the presence of a confining unit in the absence of detailed information on the precise extent of the confining units themselves.
The IAEA model was constructed as a finite-difference model using the Modflow groundwater simulation code with an ArgusONE graphical-user interface. The grid cells are 20 km by 20 km in plan view. In the vertical dimension the network is 20 cells thick, with cell height depending on aquifer thickness. The geometry of the model was built using CEDARE data for basement topography and recent Shuttle Radar data for land surface topography. The regional extent of the NSAS in the IAEA model differs from that in the CEDARE model. The IAEA model has a greater extent by including: a southeastern lobe of the aquifer system in Sudan, including Khartoum, a small increase in southwest extent to oases in Chad, and increased extent to the west in Libya, to natural hydrogeologic aquifer boundaries.
Model Calibration
The model calibration process was innovative and took advantage of existing data, while overcoming some severe limitations in the availability of water level data. The basic premise in calibration was that over geologic time, the aquifer filled to land surface during wet periods and drained during dry periods. The most recent wet period ended with deglaciation about 10,000 years before present. There is general agreement among experts that the aquifer has not been recharged in any significant way since deglaciation. Properly calibrated, a 10,000-year simulation starting with water at land surface should result in aquifer water levels at modern elevations. Observations of modern water levels were taken from existing records from wells prior to the start of water production pumping in the 1960s and from elevations of oases and sabkhas, which are surface expressions of the aquifer’s water table.
The IAEA model was calibrated to present water levels by varying the horizontal and vertical hydraulic conductivities, and total storage consisting of the specific yield, and the compressive storage coefficient. Hydraulic conductivities represent the resistance of flow through the aquifer and the specific yield and storage coefficient represent the uptake and release of water from the aquifer material itself due to changes in pressure in the aquifer. Once the 10000-year aquifer response was calibrated, the model was further calibrated to historical water-level declines in three pumping centers of Libya and Egypt. This allowed separate determination of the specific yield and compressive storage components of the total storage. The porosity of the aquifer, which affects the velocity of flow through the system, was set at a fixed value for the entire system and any effects of spatial variation in porosity were accounted for in the hydraulic conductivity terms.
A unique strategy was available to calibrate aquifer porosity, which affects the velocity of flow through the system. This was done by using isotopic ages of groundwater. In the past, a number of studies have indicated that groundwater age in the NSAS was up to about 40,000 yrs as indicated by the presence of measurable carbon-14 activity in deep groundwater samples. However, using krypton isotopes (81Kr), groundwater recovered from production wells near oases in the western desert of Egypt has been estimated to vary in age from about 200 thousand to 1.5 million years. To resolve this discrepancy, three samples of groundwater from Sudan were collected and carbon-14 was analyzed by conventional methods used in the past – where a nearly 200 L of water is chemically treated to extract carbon – and by accelerator mass spectrometry (AMS) – where only one liter of water is required without any chemical treatment in the field. Results indicated large discrepancies between the conventional and AMS measurements. In particular, AMS measurements for a sample of groundwater indicated an age beyond the carbon-14 technique (~50,000 years) whereas the traditional, chemical extraction technique indicated an age of about 20,000 yrs. The lower age estimate is likely due to contamination with atmospheric CO2 during the sampling and extraction process. AMS measurements are much more reliable as they do not require chemical treatment of large samples. It was, therefore, concluded that existing carbon-14 data from the NSAS for deep wells (showing ages of 20,000 – 40,000 years) was unreliable and these samples likely had ages of greater than 50,000 years. Therefore, Krypton ages were considered to reflect real groundwater ages and used in the current model.
Preliminary Results and Anticipated Transboundary Impacts
The calibrated model was run for a period of three million years, with wet and dry periods simulated using approximate paleo-climate records. The three-dimensionality of the model permitted the use of “particle tracking”, or tracing the movement of individual water parcels through the modeled aquifer system. This enabled estimation of the age of water at any location and time during the simulation. By adjusting porosity, the model was calibrated to correctly predict the ages of dated water, while providing visualization of groundwater recharge and discharge locations and subsurface flowpaths.
Figure 1 shows the natural movement of groundwater prior to the start of pumping in the 1960s. Blue flow lines are those representing a travel time of less than 50 thousand years and red flow lines represent flow paths of about 2.5 million years. The results show that there is a groundwater divide roughly along the Chad, Libya border which indicates a strong inclination against transboundary movement of groundwater in that area. Flow paths along the Libya, Egypt border indicate a northward movement of groundwater with a low tendency for transboundary movement along that border. There is some apparent transboundary movement of groundwater from Chad to Sudan and toward Egypt from Sudan. However, this flow is relevant only at a time frame of hundreds of thousands years or greater and, therefore, is not relevant to analysing the transboundary effects, as discussed below.
The effects of pumping from production wells in various locations were simulated by using the fully-calibrated model. The model was run both with the calibrated parameter values and with a range of possible parameter values. Figure 2 shows flow paths in the vicinity of production wells after 200 years of pumping. The simulations were conduted for Kufra, Libya (Figure 2, top) and East Oweinat, Egypt (Figure 2, bottom) well fields. There is generally high drawdown in the immediate vicinity of production wells and little effect of pumping further away. As a result, no significant transboundary effects were observed in modelling simulations of 200 years of pumping at projected rates. The model results were consistent with observations of pumping effects that have been made in and around production well fields in Libya and Egypt.
The extremely short flow paths after 200 years of pumping indicate small capture zones and illustrate the great water-resource potential of this system. In locations where the aquifer is particularly thick, such as the Kufra region of Libya, large withdrawals of groundwater for tens or hundreds of years may be possible without significant regional impacts. In locations where the aquifer is relatively thin, such as southern Egypt and Sudan, sustained large withdrawals similarly may be less likely. High drawdown in local areas causes minimal regional or transboundary effects, but potentially severe localized effects. For example, well fields located in and around oases would result in decreases of water level in the oases if local surface waters are not supplemented with locally-pumped groundwater.
Finalization of the Model
Work is still underway with the IAEA model in three areas: Additional testing of the model by Dr. Voss, formal adoption of the model by the host countries, and preparation of the model for local use. Currently Dr. Voss is working with the model to check that the model results are robust. This is done by varying factors in the model, such as boundary conditions on the Mediterranean Sea, the connection of the Nile, and the aquifer in Sudan and observing the effects on the results. Once this work is completed, Dr. Voss will release the model and its results officially.
At the four-country meeting to discuss modelling results in August 2009 there was consensus among the member countries that the modelling approach was valid and the results were reasonable. Over the next several months the model will be reviewed by national experts and discussed in stakeholder forums at national meetings in Egypt, Libya, and Sudan. Chad will work on an individual basis with stakeholders and ministry personnel to discuss the model.
The final phase of modelling will be to turn the model over to the member countries for use in making practical management decisions. This may start with a hands-on workshop focused on using the model at a local scale. A key aspect of this will be to refine portions of the model with a finer-scale grid size in pumping areas and in areas with more detailed knowledge of hydrogeologic conditions. Finer scale modelling will permit, among other things, rational design of well fields to minimize environmental impacts of development.
Ultimately the IAEA model can serve as a framework on which to build a programme of data sharing and cooperative monitoring of the NSAS. The success in developing the model as a four-country effort was based on the shared participation of the countries and transparency in the modelling process. Continued participation by the four countries in sharing monitoring and production data, and in the planning process for new development of the aquifer can assure that all countries maintain awareness of the impact of development on both transboundary and local impacts of aquifer development.
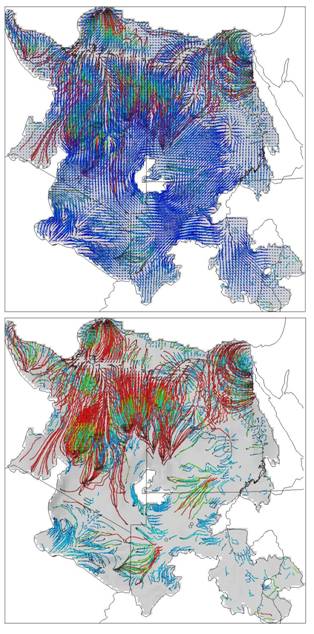
Figure 1. Flow paths showing natural water movement in the NSAS. Blue lines indicate paths on the order of 50 thousand years and red paths show movement of about 2.5 million years. The top figure shows all flow paths and the bottom figure shows only those paths greater than 50 thousand years.
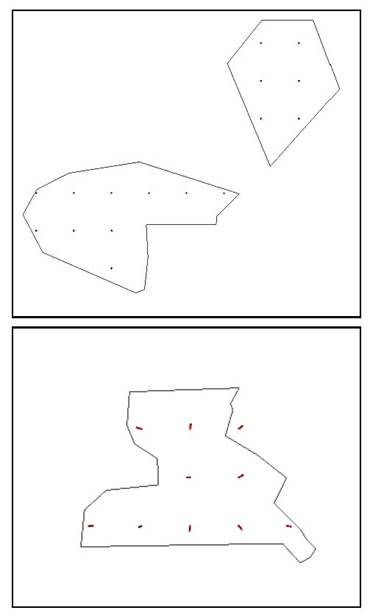
Figure 2. Flow paths resulting from a 200 year simulation of water pumping in the East Oweinat, Egypt well field (top) and the Kufra, Libya well field (bottom). Scale: flowpaths are spaced 200 meters apart.