
CERMES Technical Report No 11
Socio-economic profile of fisheries in the
Grenadine Islands
DAVID GILL, PATRICK McCONNEY AND ROBIN MAHON
Centre for Resource Management and Environmental Studies (CERMES)
University of the West Indies, Faculty of Pure and Applied Sciences,
Cave Hill Campus, Barbados
2007
ABSTRACT
Socio-economic profile of fisheries in the Grenadines
DAVID GILL, PATRICK McCONNEY AND ROBIN MAHON
For proper and effective management of fisheries, there is a need to understand not only their
biophysical environment but also their demographic and socio-economic environment and
dynamics. From June to August 2006, students from the Centre for Resource Management
and Environmental Studies (CERMES) embarked on a trans-boundary socio-economic and
livelihood assessment of fisheries in the Grenadines. The study was divided into two stages
and took place in the Vincentian islands of Bequia, Mustique, Canouan, Mayreau and Union
Island and the Grenadian islands of Petit Martinique and Carriacou. The goal of the first stage
was to create a basic demographic profile of the fishers and to gather data on their gear and
resource-use patterns. This was done through extensive interviews at all of the major fishing
villages in the Grenadines. During this stage 267 fishers were interviewed.
The second phase of this project aimed to create a more detailed socio-economic profile of
the fisheries. This stage involved acquiring more detail on temporal and spatial features of
fishing practices, information on the market orientation of the fishers, revenue, expenditures
and material style of life. Over 75% of the fishers interviewed in the study rely on fishing as
their major income source and less than half have an alternative livelihood. Due to lack of a
reliable source of income, many continue to fish well beyond retirement age. This suggests a
possible vulnerability within the fishing community, especially within the older population.
Shallow-shelf demersals are the most important species group and also the most
overexploited and thus the governments should look to encourage fishers into other fisheries
through market incentives, training and loans. The information from this study will help
resource managers better understand the social and economic factors that affect the fisheries
and may lead to more sustainable and informed decision making. Sectoral and regional
linkages need to be strengthened so as to ensure that the industry goes forward sustainably.
Keywords: demographic, fisheries, Grenadines, socio-economic
i
ACKNOWLEDGEMENTS
Thanks to all who supported me throughout this study:
To God for His goodness and mercy
To my supervisors Dr. McConney and Dr. Robin Mahon for their guidance and patience
To my family and friends for their support. To my team-mate Tanya. To Jean, Kim, Donna,
Kali & Diane for all your help
To the many fishers, fisheries officers and others in the Grenadines for their cooperation and
readiness to share their experiences without whose help, this study would not have been a
success
ii
CONTENTS
ACKNOWLEDGEMENTS ................................................................................................................................II
1
INTRODUCTION....................................................................................................................................... 1
1.1
SUSTAINABLE GRENADINES PROJECT (SUSGREN)................................................................................ 1
1.2
MARINE SPACE USE INFORMATION SYSTEM (MARSIS) ....................................................................... 1
1.3
PROJECT OBJECTIVES............................................................................................................................ 2
1.4
SOCIO-ECONOMIC MONITORING (SOCMON) AS RESEARCH APPROACH................................................. 2
1.5
REPORT OUTLINE.................................................................................................................................. 3
2
METHODOLOGY...................................................................................................................................... 3
2.1
PREPARATORY ACTIVITIES, PLANNING AND RECONNAISSANCE ............................................................ 3
2.2 ...................................................................................................................................................................... 3
2.3
FIELD DATA COLLECTION: SAMPLING METHODOLOGY ......................................................................... 4
2.3.1
Phase I: Rapid initial survey........................................................................................................... 6
2.3.2
Phase II: In-depth survey................................................................................................................ 6
2.4
ANALYSIS, INTERPRETATION AND VALIDATION.................................................................................... 6
3
RESULTS AND DISCUSSION: STUDY AREA ..................................................................................... 7
3.1
GEOGRAPHY......................................................................................................................................... 7
3.1.1
Natural threats: Hurricanes ........................................................................................................... 8
3.1.2
Society and economy....................................................................................................................... 8
3.1.3
Marine Protected and Conservation Areas .................................................................................... 9
3.2
ISLAND PROFILES.................................................................................................................................. 9
3.2.1
Bequia............................................................................................................................................. 9
3.2.2
Canouan........................................................................................................................................ 10
3.2.3
Carriacou...................................................................................................................................... 10
3.2.4
Mayreau........................................................................................................................................ 10
3.2.5
Mustique ....................................................................................................................................... 11
3.2.6
Petite Martinique .......................................................................................................................... 11
3.2.7
Union Island ................................................................................................................................. 11
3.3
FISHERIES INFRASTRUCTURE.............................................................................................................. 12
3.3.1
Canouan Fisheries Complex......................................................................................................... 12
3.3.2
Clifton Fisheries Complex, Union Island ..................................................................................... 12
3.3.3
Paget Farm Fishing Complex, Bequia.......................................................................................... 13
3.3.4
Lobster Storage Facilities, Bequia ............................................................................................... 13
3.3.5
Mustique Fishing Complex, Mustique .......................................................................................... 13
3.4
HISTORY AND DEVELOPMENT OF FISHING .......................................................................................... 13
3.4.1
Grenada and its Grenadines......................................................................................................... 13
3.4.2
St. Vincent and its Grenadines...................................................................................................... 14
3.5
CURRENT STATUS OF FISHING IN THE GRENADINES............................................................................ 15
3.5.1
Data limitations ............................................................................................................................ 15
3.5.2
Economic value............................................................................................................................. 15
3.5.3
Trading vessels ............................................................................................................................. 16
3.5.4
European Union ban and quality control ..................................................................................... 16
3.6
FISHERIES MANAGEMENT ................................................................................................................... 17
3.6.1
Fished species............................................................................................................................... 17
3.6.2
Legislation and current management measures ........................................................................... 17
3.6.3
Species and gear regulations........................................................................................................ 18
3.7
FISHING TECHNIQUES ......................................................................................................................... 19
3.7.1
Handlining .................................................................................................................................... 19
3.7.2
Traps............................................................................................................................................. 19
3.7.3
Trolling ......................................................................................................................................... 19
3.7.4
Seine net fishing............................................................................................................................ 19
3.7.5
Gill and trammel nets ................................................................................................................... 20
3.7.6
Longlining/Palang ........................................................................................................................ 20
3.7.7
Diving ........................................................................................................................................... 20
3.8
BOAT TYPES ....................................................................................................................................... 20
4
RAPID INITIAL SURVEY (PHASE I): RESULTS AND DISCUSSION ........................................... 20
iii
4.1
ALTERATIONS TO SAMPLING DESIGN .................................................................................................. 21
4.2
DEMOGRAPHIC INFORMATION ............................................................................................................ 21
4.3
DEPENDENCY ON FISHING .................................................................................................................. 22
4.4
BOAT OWNERSHIP .............................................................................................................................. 24
4.4.1
Boat ownership by island.............................................................................................................. 24
4.4.2
Boat ownership, dependency on fishing, and age ......................................................................... 24
4.5
OTHER OCCUPATIONS......................................................................................................................... 25
4.6
BOAT AND ENGINE TYPES ................................................................................................................... 27
4.7
COASTAL AND MARINE RESOURCE USE............................................................................................... 29
4.7.1
Fishing techniques ........................................................................................................................ 29
4.7.2
Fish groups targeted..................................................................................................................... 32
4.7.3
Areas fished .................................................................................................................................. 34
5
IN-DEPTH SURVEY (PHASE II): RESULTS AND DISCUSSION.................................................... 39
5.1
DEMOGRAPHIC INFORMATION ............................................................................................................ 39
5.1.1
Education...................................................................................................................................... 40
5.2
HOUSEHOLD COMPOSITION ................................................................................................................ 41
5.3
MATERIAL STYLE OF LIFE................................................................................................................... 41
5.4
OCCUPATIONS AND DEPENDENCY ...................................................................................................... 43
5.5
SHARE SYSTEMS ................................................................................................................................. 44
5.6
CLEANING AND SERVICING................................................................................................................. 44
5.7
COASTAL AND MARINE ACTIVITIES .................................................................................................... 45
5.7.1
Target species ............................................................................................................................... 45
5.7.2
Limitations .................................................................................................................................... 45
5.7.3
Fishing techniques ........................................................................................................................ 47
5.7.4
Fishing intensity............................................................................................................................ 48
5.7.5
Fishing grounds ............................................................................................................................ 49
5.8
FISH MARKETING................................................................................................................................ 50
5.8.1
Demand......................................................................................................................................... 50
5.8.2
Market information by species type .............................................................................................. 50
5.8.3
Market information by buyer ........................................................................................................ 52
5.9
MARKET ORIENTATION BY FISHER PREFERENCE (RELIABILITY, PRICE, CONVENIENCE) ...................... 52
5.9.1
Tourist sector................................................................................................................................ 53
5.10
PHYSICAL CAPITAL............................................................................................................................. 53
5.10.1
Boat and engine ....................................................................................................................... 53
5.10.2
Gear ......................................................................................................................................... 53
5.11
EXPENSES........................................................................................................................................... 54
5.11.1
Trip expenses ........................................................................................................................... 54
5.11.2
Recurrent expenses .................................................................................................................. 54
6
CONCLUSION AND RECOMMENDATIONS .................................................................................... 55
6.1
DEMOGRAPHICS AND STAKEHOLDER CHARACTERISTICS .................................................................... 55
6.2
RESOURCE USE PATTERNS .................................................................................................................. 55
6.2.1
Demersal fishery........................................................................................................................... 55
6.2.2
Reducing vulnerability.................................................................................................................. 55
6.3
MARKET ATTRIBUTES AND ORIENTATION........................................................................................... 56
6.4
MATERIAL STYLE OF LIFE................................................................................................................... 56
6.5
SECTORAL COORDINATION................................................................................................................. 56
6.6
REGIONAL COORDINATION ................................................................................................................. 57
7
REFERENCES.......................................................................................................................................... 58
8
APPENDICES ........................................................................................................................................... 61
Citation
Gill, D., P. McConney and R. Mahon. 2007. A socio-economic profile of fisheries in the
Grenadine Islands. CERMES Technical Report No. 11. 69pp.
iv
1 INTRODUCTION
Resource management involves balancing conservation with sustainable use (Bunce &
Pomeroy 2003). Resource users have an immense impact on the environment and are the
most vulnerable to its degradation. Managers therefore have to possess an understanding of
the resource use patterns and the socio-economic factors that act upon it (CFRM 2004).
Through interviews with members of the fishing community, this study seeks to create a
socio-economic profile of fishers in the Grenadines. Decision makers can combine
biophysical and socio-economic data to better understand the coastal environmental and the
human interactions and uses that affect it. This information will help to identify coastal areas
that may be at risk of overexploitation and to design appropriate conservation strategies that
will not threaten the livelihoods of the fishermen. It will also aid managers in recognising the
vulnerability of the fishermen to natural and anthropogenic shocks (e.g. hurricanes, market
fluctuations, increased oil prices etc) and to build resilience through informed decision
making. Stakeholder interaction and information gathering enhance local participation in
management and increase the chance of further participation in conservation activities
(Walters et al. 1998). Currently there are various on-going initiatives in the Grenadines to
which this project is supplementary.
1.1 Sustainable Grenadines Project (SusGren)
The goal of the Sustainable Grenadines Project (SusGren) is to assist in the protection of the
social and economic wellbeing of the Grenadine people through the integration of sustainable
development (CERMES 2005). SusGren seeks to build capacity through partnerships with
other civil society organisations and stakeholders providing them with tools to be more
actively involved in managing the resources that they depend heavily on. The information
from this study will help to create an understanding of the socio-economic characteristics of
fishers which is essential to aid SusGren in fulfilling its mandate of promoting sustainable
livelihoods. SusGren commenced this work by hosting a fisherfolk workshop in February
2006 where fishers from around the Grenadines were able to raise and discuss the major
issues affecting the industry (CERMES 2006).
1.2 Marine Space Use Information System (MarSIS)
MarSIS is a computerised Geographic Information System (GIS) which is being created to
amalgamate social, economic, cultural and biophysical resource information & policy to
assist resource managers in effective coastal management (Baldwin 2006). It will identify
critical habitats and areas of concern and conflict amongst marine resource users. This project
aims to combine scientific data with local ecological knowledge to fill information gaps,
promote participation and highlight policy decisions and concerns that should take
precedence. The process began at the planning and data scoping phase in June 2005-May
2006. During this process key informants were identified and support was obtained from the
governments of St. Vincent and the Grenadines and of Grenada. Information for the initial
data scoping was obtained through dialogue with various non-government organisations,
community leaders, key informants and observations at the sites of interest.
At present, data are being collected on all the major marine resource user groups in the
Grenadines. These include day tour operators, dive operators, ferries, and yacht charter
companies. Similar studies have been conducted with the water taxi operators in the
Grenadines (Cooke et al. 2005 and Lizama et al. 2006) and will be compiled with
information from this study to create a marine resource user profile. Key marine habitats,
conservation and management issues, resource use patterns and stakeholder information were
spatially analysed and represented on maps. Subsequent to the data collection, workshops
1
will be held to obtain feedback from stakeholders and government, to identify information
gaps and to plan the next stage of the project.
1.3 Project objectives
The purpose of this project is to acquire socio-economic information on fisheries in the
Grenadines for future use in fisheries and integrated coastal management decision-making.
Specifically, in connection with the SusGren and MarSIS initiatives, this includes the
objectives of collecting information on:
Demographics and stakeholder characteristics: creating a basic demographic profile of
fishers
Resource use patterns: acquiring information on the fishing practices (temporal and
spatial) of fishers in the Grenadines
Market attributes and orientation: gaining an understanding of the market orientation
of the fishers, prices received and patterns by island
Material style of life: acquiring basic information on the income, expenditure and
material style of life of the fishers
This information will provide insight on the location of fishers, what resources they have
available, fishing practices and usage and their perceptions on the resource. This will be made
available to interested parties (government, NGOs, etc) and the spatial socio-economic data
will be used to supplement the attribute data for the MarSIS database (see Section 1.2). The
report will also include recommendations that are suggested by the fishers to improve the
industry.
Although this study involves taking information from stakeholders, it will hopefully facilitate
the creation of a climate of participation amongst the fishers and promote linkages between
the conservation groups, government, scientific communities (e.g. university researchers) and
the fishers. Participatory research methods facilitate stakeholder involvement in the decision
making process by providing a means of input into information to be used for management
decisions. This process allows for community concerns to be aired and resolved and areas of
historical, social and cultural importance to be identified. Through education and
involvement, stakeholders can have a better understanding of the resource and their influence
on it and this process may help to increase support for and participation in management
(Bunce & Pomeroy 2003).
1.4 Socio-economic Monitoring (SocMon) as research approach
The benefits of incorporating local knowledge into resource management are immense.
Collection of data on locations of resources, spatial and temporal information and the use
patterns is an overwhelming task for small Fisheries Divisions in the Caribbean and therefore
they must also rely on the resource users to acquire this information (Walters et al. 1998).
Spatial & temporal information is required to assess the current space-use patterns in the
Grenadines and to develop comprehensive management plans for the area.
A socio-economic assessment is a means to understanding the social, cultural, economic and
political conditions of individuals, groups, communities and organisations (Bunce &
Pomeroy 2003). Fishers play a very important role in coastal resource management as they
directly impact and rely on the sea.
SocMon is a set of guidelines for creating a socio-economic monitoring program at Caribbean
coastal management sites (Bunce & Pomeroy 2003). Using a list of established socio-
economic variables, SocMon allows researchers and managers to help select and prioritise
which variables to include in their analysis, based on the goals and objectives of their project.
2
1.5 Report outline
The next chapter on methodology precedes a description of the study area. The results of
rapid and in-depth surveys are discussed in the fourth chapter. Finally there are conclusions
with recommendations on priority next steps. References are listed and four appendices
provide information on fishes caught and fishing vessels along with copies of the two survey
instruments used.
2 METHODOLOGY
2.1 Preparatory activities, planning and reconnaissance
A modification of the SocMon Caribbean methodology (Bunce & Pomeroy 2003) was
applied in this study. A flow chart outlining the major steps of the process is in Figure 2.1.
Rese
R
ar
ese ch
ar
go
ch
al
go s
al and
a
obj
nd
ect
obj
iv
ect es
iv
Da
D ta scop
ta sc
ing
i
&
&
Second
Seco
ar
nd y
ar da
y
ta
t
a
re
r conn
con ai
a ssan
ss
ce
an
ce
anal
ana ys
y is
Stak
St eho
ak
l
eho der
der
Ident
Iden ificat
i
i
cat on of
n
maj
o
maj r
r
Ident
en ifi
f ca
i ti
t on o
on f
identi
n fic
fi ati
t on
issu
iss es
e and
a
con
nd
cer
con
ns
cer
info
f rm
r a
m tion
o gaps
De
D term
r ination of SocMo
M n vari
r ables
e
De
D te
t rm
r ination of
f
samplin
sam
g d
plin
e
g d si
s gn
Field d
Fiel
a
d d ta
t c
a o
c llecti
lle
o
cti n
Final a
Fina n
l a al
a ys
y is & r
is & e
r port
por i
t ng
Figure 2.1 Flow chart outlining the major phases of the study
During the months of January to June, Ms. Kimberly Baldwin of the Centre for Resource
Management and Environmental Studies (CERMES) conducted an initial scoping of the
marine resource users of the Grenadines (Baldwin 2006). This involved secondary data
collection, interviews with key informants and other stakeholders and general observation of
the study area. Concurrently, secondary data assessment and scoping was also conducted and
the data were compiled so as to identify the information gaps required to complete the
MarSIS database (see Section 1.2). Based on the gaps identified, the objectives of this study
3
were created and the SocMon variables that were utilised in this study were selected. The list
of SocMon Caribbean variables can be found in Table 2.1 in which the ones chosen for this
study are highlighted.
Table 2.1 List of variables in the SocMon Caribbean methodology with selected variables highlighted in
grey
Var. no.
Community or secondary source
Var. no.
Household or individual survey
K1
Study area
S1
Age
K2
Population
S2
Gender
K3 Number
of
households
S3
Ethnicity
K4 Migration
rate
S4
Education
K5 Age
S5
Religion
K6 Gender
S6 Language
K7 Education
S7
Occupation
K8 Literacy
S8 Household
size
K9 Ethnicity
S9
Household income
K10 Religion
S10
Household activities
K11
Language
S11
Household goods and services
K12
Occupation
S12
Types of household uses
K13
Community infrastructure
S13
Household market orientation
K14
Coastal and marine activities
S14
Household uses
K15
Goods/services from marine activities
S15
Non-market and non-use values
K16
Types of use of good/service
S16
Perceptions of resource conditions
K17
Value of goods and services
S17
Perceived threats
K18
Goods/services market orientation
S18
Awareness of rules and regulations
K19
Use patterns
S19
Compliance
K20
Levels and types of impact
S20
Enforcement
K21
Level of use by outsiders
S21
Participation in decision-making
K22
Household use
S22
Membership in stakeholder organisations
K23
Stakeholders
S23
Perceived coastal management problems
K24
Tourist profile
S24
Perceived coastal management solutions
K25
Management body
S25
Perceived community problems
K26
Management plan
S26
Successes in coastal management
K27
Enabling legislation
S27
Challenges in coastal management
K28
Management resources
S28
Material style of life
K29
Formal tenure and rules
[New]
Boat painting and engine servicing
K30
Informal tenure, rules, customs and
[New]
Boat cleaning
traditions
K31 Stakeholder
participation
K32
Community and stakeholder organisations
It must be noted however that this study did not employ the entire SocMon Caribbean
methodology as it was planned as an assessment rather than with the intention of monitoring.
To get an idea of some of the possible environmental impacts of fishing (mainly marine
pollution) and to gather data to be compared with the water taxi study conducted by Lizama
et al. (2005), two new variables were created. To examine these variables, fishers were
questioned on their boat and engine cleaning/maintenance practices.
2.2 Field data collection: Sampling methodology
The study took place between the months of June and August 2006 on 7 of the inhabited
islands of the Vincentian and Grenada Grenadines (see Table 2.2). The design of the
questionnaires followed the methods outlined in the SocMon Caribbean methodology (Bunce
& Pomeroy 2003) and some of the content was adapted from questionnaires created by
4
McConney (2005), Cooke et al. (2005) and Lizama et al. (2005) that were used for other
resource users in the Grenadines.
Table 2.2 Fishing communities/villages in each island that were surveyed during the data collection phase
Island Fishing
Village
St. Vincent and the Grenadines
Port Elizabeth, Lower Bay, La Pompe,
Bequia
Friendship Bay
Paget Farm
Mustique
Mustique Fishing Camp
Grand Bay,Charles Bay
Canouan
Canouan Fisheries Complex
Mayreau
Saline Bay, SaltWhistle Bay
Union Island
Clifton, Ashton
Grenada
Petite Martinique
Sanchez
Hillsborough, Belmont, Windward,
Carriacou
L'Esterre, Paradise Bay, Harvey Vale
The sampling design was a census, similar to the one that was used by Cooke et al. (2005)
and Lizama et al. (2005) where each community was intensely surveyed until no new
respondents were encountered. At the start of the data collection, however, it was evident that
it would be virtually impossible to conduct a census of all the fishers in the Grenadines given
the time and the resources available, and the following limitations: (1) the study took place
out of lobster season, and subsequently, fishers were either engaged in other occupations or
out of the island; (2) some of the fishers were dispersed throughout the islands which would
require a much greater sampling effort and time to interview each household on the island;
and (3) this study focused on persons who depended on fishing for their livelihoods, as
opposed to recreational fishers.
To overcome these limitations, the sampling design of Phase I was restructured from a census
to a saturation sample, where all persons located in and around the major fishing villages and
markets were surveyed, until the interviewers encountered few to no new fishers. Therefore,
the 267 fishers that were identified in the rapid initial survey (Phase I) are in fact an
underestimation in census terms. However this is an adequate sample, estimated at 10-20% of
all fishers based on key informant and secondary data. Because of the methods, limitations
and biases listed above it cannot be claimed that the study sample is statistically
representative, but it is likely that results obtained from it reflect population characteristics to
a large extent.
5
2.2.1 Phase I: Rapid initial survey
This stage involved visiting the major fishing communities and interviewing all the fishers
encountered in the area, totalling 267 fishers. A simple, one page questionnaire (see
Appendix 1) was used to collect:
� Demographic information on the fisher
� Type of fishery he/she is involved in
� Boat and equipment characteristics
� Spatial information on fishing practices
The survey took approximately 3-5 minutes to complete, depending on the details given by
the respondent. In very small, compact fishing villages (e.g. Mustique Fishing Camp,
Mustique), sampling was completed in one day and almost 100% of the fishers in the area
were surveyed. Sampling in large fishing communities such as Paget Farm, Bequia ranged
from 2-4 days to ensure that all available fishers were interviewed.
2.2.2 Phase II: In-depth survey
After the initial survey was conducted on each island, the second survey was constructed and
tested on select fishers in the field (n=3). The sampling design of this survey was to use the
initial survey as a sampling frame and re-interview 25-33% of the fisher respondents on each
island visited in the first stage, but without rejecting any new fishers that were encountered
(see Figure 2.2). Another aim was to attempt to involve each type of fisher in the study by
purposely ensuring that the less common types of fishers were included. However, due to the
multiplicity of the types of fishing practiced, it was difficult to distinguish a fisher by a
particular fishing technique. Also as the survey depended on the willingness of individuals to
participate and their level of interest, not all of the data could be collected in each interview.
The surveys conducted in Phase II (see Appendix 2) encountered 64 fishers, most of whom
were encountered during Phase I. The interview took an estimated 15-45 minutes to complete
depending on the detail given by the respondent.
40%
35%
d
30%
e
w
i
e
25%
t
e
r
v
n
s
i
er
Initial Survey
20%
In Depth
i
sh
f
f
15%
t
o
r
cen
e
10%
P
5%
0%
Bequia
Canouan
Carriacou
Mayreau
Mustique
Petite
Union Island
Martinique
Island
Figure 2.2 Proportions of fishers interviewed by island during the initial and in-depth survey
2.3 Analysis, interpretation and validation
After the data were collected, the key informants identified in Baldwin 2006 (mainly fisheries
officers) were consulted to validate the information for their respective islands. The data were
compiled and analysed in Microsoft Excel 2003 and Statistical Package for Social Sciences
(SPSS) version 11.
6


During the month of October, community meetings (comprising of mainly fishers) were held
in each island. The goals of these meetings were to: 1) present information to the community
on MarSIS and the results of this study, 2) conduct a simple fishery resource mapping
exercise and 3) to validate some of the major results of the study.
3 RESULTS AND DISCUSSION: STUDY AREA
A major part of any SocMon study is the characterisation of the study area. This provides a
critical background to the physical, social, economic and cultural conditions that affect the
community under examination. Information in this section comprises both secondary data and
results from discussions with key informants and fishers.
3.1 Geography
The Grenadine islands lie on a shallow bank located between the islands of St. Vincent and
Grenada (see Figure 3.1). Islands north of the boundary belong to St. Vincent and south of
the boundary belong to Grenada. Most of these low lying islands were formed by volcanic
activity associated with Grenada (ECLAC 2004) which created an archipelago consisting of
over 30 islands (CCA/IRF 1991).
o
15
MARTINIQUE
CARIBBEAN
SEA
ST. LUCIA
ST. VINCENT
BARBADOS
ES
E
IN
D
A
EN
E
R
E G
E
TH
T
ATLANTIC
GRENADA
OCEAN
TOBAGO
TRINIDAD
o
10
o
VENEZUELA
60
Boundary
Figure 3.1 Map of the Grenadine Islands showing the study site
The Grenadines are older and more geologically complex than the St. Vincent mainland and
the shallow bank hosts a multitude of reef systems, mangroves and seagrass beds which
provide habitat for a wide diversity of plant and animal species. Three quarters of the
Grenada Bank is less than 50 m deep allowing for extensive bottom habitat for coral reef
formation (CCA/IRF 1991) and a productive fishing area. Shallow reefs host species such as
echinoderms, hard and soft corals, crustaceans, sponges and a wide variety of reef fish (Price
& Govindarajulu 1998, Comley et al. 2002). All of these combine with the wide open spaces
to create a spectacular picturesque land and seascape that attracts visitors from all around the
world.
The many islets and bays in the Grenadines allow for mangrove ecosystems and sea grass
beds. These act as nurseries for many commercially important species. In Tyrell Bay,
7
Carriacou, the Oyster Bed mangrove hosts thousands of oysters which filter feed on the roots
on the red mangrove trees and act as a natural harbour to boats during storms. Seagrass beds
in islands such as the Tobago Cays and Union Island support a wide diversity of species
including rays, turtles, starfish, squid and juvenile fish.
The Grenadines experience very low rainfall (sometimes as low as 460mm) compared to
1700mm on the St. Vincent mainland (Culzac-Wilson 2003). This impacts on the availability
of water to the local population that relies in part on storing rain water. This has also led to a
greater dependency on the sea for food and income than on the land (Jardine & Straker 2003).
3.1.1 Natural threats: Hurricanes
The Grenadines are located below 13o north, placing them just below the main hurricane belt.
However in the last half century, occasional hurricanes such as Hurricane Janet, Allen, Ivan,
and Emily have caused severe damage to infrastructure and the natural environment. These
hurricanes also severely impacted the boating, fishing and yachting industry on which the
Grenadines rely heavily (Cooke et al. 2005). In 1982, Hurricane Allen devastated the fishery
sector in the Vincentian Grenadines (Mohammed & Rennie 2003). The recent 2004
Hurricane Ivan affected mainland Grenada and its Grenadines to the point that restoration
efforts have not yet been completed. After the hurricane, news reports out of Grenada stated
that 90% of the houses in Grenada were damaged. Some of the reefs in the southern
Grenadines (e.g. leeward side of Sandy Island, Carriacou) suffered extensive damage which
may take decades to recover. Fishers (especially those in the Southern Grenadines) stated that
Hurricane Ivan has drastically reduced their catch (mainly lobsters and demersals) and have
severely altered the bottom habitat.
3.1.2 Society and economy
The population density on most of the Grenadine islands is relatively low and communities
are spread apart in towns and/or rural villages. Many of these rural villages are hubs for
fishing activities. Around 1991, reports stated that the majority of the male population in the
Vincentian Grenadines were fishers or actively involved in a related sector and it is the main
income earner for many households (CCA/IRF 1991). This creates vulnerability among a
large section of the population as they depend heavily on one industry. Some of the fishers
combat this by diversifying their income through other occupations such as: water-taxiing,
construction, transportation of goods between islands and small-scale agriculture (Cooke et
al. 2005).
The Vincentian and Grenada economies have been historically driven by agriculture. In the
Grenadines, marine resources play a vital role in food security, sustaining livelihoods and in
the cultural and social activities. As the land in the Grenadines is not very productive for
agriculture (Jardine & Straker 2003), many made their living from fishing as it was one of the
few options for employment, especially after the second World War (Mohammed et al.
2003). For example, in the 1960s, the conch fishery became the most significant economic
activity on Union Island.
Tourism has been the driving force for the economy of many Caribbean islands and has been
increasingly becoming part of the Grenadine economy (Statistical Office 2001). In 1985, St.
Vincent & the Grenadines saw a change where the majority of tourist arrivals shifted from
the mainland to the Grenadines (CCA/IRF 1991). Due to the attraction of the Tobago Cays,
many flock from around the world to this anchorage. It is estimated that 84% of yachters
visiting the Vincentian Grenadines make a stopover in the Tobago Cays (ECLAC 2004).
Tourism has significantly impacted the people of the Grenadines. In the 1990s, the tourism
boom from resorts on Petite St. Vincent and Palm Island attracted many away from fishing in
8
the southern Grenadines into job opportunities such as construction (Chakallal et al. 1994). It
has brought foreign exchange, employment and additional revenue from tourist taxes and
expenditure (ECLAC 2004). However, tourism has also brought loss of amenities and
negative environmental impacts such as reef and sea grass damage from anchors and sewage.
Verbal reports of tourists spearfishing illegally within the Tobago Cays were common and
this poses a significant threat to the effectiveness of the marine protected area (MPA). Not
many of the fishers are involved in or work within the tourism sector. The main interaction
between fishers and the tourism sector in the Grenadines is the sale of catch, especially
lobster. Here fishers receive a much better price in restaurants, hotels and to tourists directly.
With an expected increase in tourism arrivals, the market for fish is expected to increase
consequently over the years.
3.1.3 Marine Protected and Conservation Areas
Within the Grenadines there are nine marine conservation areas (Kirby-Straker 2003) all of
which are in the Vincentian Grenadines. The Sandy Island/Oyster Bed Mangrove area is a
proposed marine park in the Grenada Grenadines which is currently operating informally.
Out of the nine marine conservation areas, the Tobago Cays marine park is the only marine
protected area in the Grenadines where fishing is completely prohibited within the
boundaries. However one of the traditional fishing camps is located within its MPA on Petit
Tabac and it appears that the fishers were not consulted when the park was being established.
Fishers frequent this area to access the rich fishing areas within the Tobago Cays and it is a
known turtle fishing site. Some of the fishers seem resentful towards the establishment of this
park and there is also concern over the rumoured establishment of another park in the east
coast of Canouan. It is unclear whether or not fishers still utilise the camp in the Tobago
Cays. Many believe that enforcement is lacking and that fishing occurs regularly within the
park by locals and visitors.
3.2 Island profiles
3.2.1 Bequia
At 8.1 km2 (SusGren 2005) Bequia is the most northerly and largest of the Vincentian
Grenadine islands (see Figure 3.1). As with all of the Grenadine islands, Bequia was
originally inhabited by the Arawaks and then later Caribs before the first European settlement
in the early 18th century (Bequia Tourism Association 2006). After the Vincentian
Grenadines were handed over to the British, many rich and poor settlers came and set up
plantations on the island. By 1828, sugar production peaked and soon crashed afterwards and
thus many of the wealthy settlers left the island (Bequia Tourism Association 2006).
Boat building and sea faring are a rich part of Bequia's heritage. As the islands are totally
dependent on trade, maritime activities were not new to Bequians (Bequia Tourism
Association 2006). Admiralty Bay was the main port on this island, with imports of many
supplies and exports of sugar, lime, molasses and cotton. The island's boat building industry
was supported by the abundance of white cedar trees which are excellent for boat
construction which is still used to this day (Belmar 2006). Many of the island's first settlers
were seamen and carpenters and by the 1900s, Bequia led the Grenadines in boat and ship
building and whaling (Bequia Tourism Association 2006).
Bequia hosts an annual fishing competition on Fisherman's Day where many of the artisanal
fishers from around the Grenadines compete for prizes. This event which is organised by the
Rotary Club, promotes the importance of the fishing industry within the Grenadines and it is
attended by locals and visitors alike. In July 2006, 46 fishers (19 boats) from around the
9
islands participated in a competition. At this competition around 530.7 kg of fish were caught
and immediately sold due to the large demand of fish. This was a complete opposite to what
is usually seen on normal fishing days were the fishers were complaining of lack of demand
and market to sell their catch. This event can be repeated elsewhere promote the fishing
industry in other fishing communities.
3.2.2 Canouan
"Cannoun", which is Carib for turtle is located in the middle of the Grenadine archipelago
(Miller Publishing Company. 2004a). At 7.8 km2 (SusGren 2005), a large portion of
Canouan is owned and managed by foreign owners. Eight hundred of the 1830 acres is owned
by Italian investors (Canouan Resource Development Limited) and utilised in the tourism
sector (Miller Publishing Company 2004a).
Recently there were announcements of proposals for a marine conservation area on the
Atlantic side of the island. Some see this more as an attempt to place more restrictions on the
movement of locals on the island which will have a negative impact on the livelihoods of
fishers, than a genuine conservation initiative.
3.2.3 Carriacou
Carriacou is the largest of the Grenadine islands (33.7 km2 (SusGren 2005)). The name
Carriacou is Carib for "land of the reefs" (Price & Govindarajulu 1998) and this island has a
assortment of sea grass beds, reefs and mangroves, each hosting a great diversity of plant and
animal species. One of the island's major mangrove systems, Tyrell Bay, is an important bay
for seine fishers. The Tyrell Bay marina currently under construction may have a great
impact on mangroves and reefs in the area thus affecting the fishery. Many of the fishers
recognise this area as an important nursery area for many commercially important species
such as robins, jacks, snapper and barracuda. There is also concern over the Environmental
Impact Assessment (EIA) process of this project and locals believe that their views were not
taken into consideration and that this project would subsequently negatively impact their
livelihoods.
On this island, there appeared to be more job diversity than on the other smaller islands (e.g.
agriculture, larger construction and services sector, trade, etc.). The major settlements on
Carriacou coincide with the major fishing villages. Here many of the Scottish and Irish were
concentrated and it is now made up of mostly fishers. The houses in this area seem to be in
very good condition indicating a reasonably high standard of living. In Hillsborough there is
a resident fisheries officer with the mandate of supervising fisheries in Carriacou and Petite
Martinique. The fish market in Hillsborough appeared to be very active at the time of the
survey with fishers selling their catch relatively easy. Although the island is large, there is
only one major gas station on the island and fishers have to travel into Hillsborough to
purchase fuel. The government is planning to build a fisheries complex in Hillsborough that
will be able to process the landings of the fishers with a focus of meeting the international
Hazard Analysis Critical Control Point (HACCP) standards.
3.2.4 Mayreau
Mayreau is the smallest of all the Grenadine islands (2.6 km2 (SusGren 2005)). The island
consists of one main village with a small close-kit community of around 170 persons. In the
north, Saltwhistle Bay is a calm leeward bay which is a major stop for yachters travelling to
the Tobago Cays. On the island there is one major hotel and a few guest houses and
restaurants. Fishers here have few options to sell on the island so many rely on trading
10
vessels. Hurricane Ivan caused a bit of damages to homes and one fisher was encountered
who after 2 years is still rebuilding his home.
3.2.5 Mustique
Mustique, the only inhabited private island in the Northern Grenadines, is 5.2 km2 (SusGren
2005). In 1968, the Mustique Company was formed and was developed with the goal of
enhancing tourism on the island (Miller Publishing Company 2004b). Persons who purchase
property on the island buy shares and become part of the company. Locals however live in
specific designated areas in gated communities and access to the island is regulated. Workers
who do not live on the island use ferries to come from St. Vincent.
3.2.6 Petite Martinique
Petite Martinique is a small volcanic dome located 4.5 km to the east of Carriacou (Price &
Govindarajulu 1998). The island has a population of about 800 and is supported by
unregulated marine trade, fishing and boat building (Price & Govindarajulu 1998). Many
Scottish and Irish shipwrights and sailors arrived in Petite Martinique after emancipation and
helped to establish the fishing industry on the island (Logan 2001). Even now, fishing is the
main economic activity on Petite Martinique (Logan 2001). One fisher on the island stated
that there are no real resources for agriculture or infrastructure for tourism and thus fishing is
the only major option for persons entering the workforce. The island which is only 2.3 km2
(SusGren 2005) contributes 15% of Grenada's fish landings (Food and Agriculture
Organization 2000) and the majority of trading vessels in the Grenadines are based off this
island. Fishers are able to sell directly to the trading vessels most of which export to
Martinique. The island has an ice machine which is heavily used by the longline fishers and
is much cheaper than ice sold in the some of the other islands. As with Winward, Carriacou,
the homes on the island indicate a relatively good standard of living amongst fishers. Many
fishers leave island for extended periods of time to engage in the longline fishery based in
Grenada which exports to the Unites States.
Petite Martinique is the only island with an active fishing cooperative. Here gear and
concessions are sold and the facilities are expanding with locker facilities and a boat docking
site. As the co-op was operating at a loss under the government's control, the cooperative was
leased to the current president of the co-op. Although many fishers in the Grenadines see
cooperatives as beneficial, participation in the Petit Martinique co-op is low (i.e. only 15
members on an island with an estimated 150-200 fishers). Even with a very low fee of EC $5
per month, fishers are not paying their monthly dues. Due to a lack of funds, the cooperative
store is leased to the current president who also stated that the co-op has a considerable
amount of debt.
3.2.7 Union Island
Union Island is one of the largest of the Vincentian Grenadine islands (8.3km2 (SusGren
2005)) and is located on the southwest edge of the Grenada bank (Price & Price 1998).
Fishing was the major economic driver around the mid twentieth century (Mohammed et al.
2003) and presently Tourism is becoming a significant contributor to the economy of Union
Island. Flights bring tourists to transfer to the nearby private Palm Island and Petite St.
Vincent.
The island, similar to Carriacou has a network of sea grass beds, mangroves and coral reefs.
The two main fishing villages in Union Island are in Ashton and Clifton. These are also the
sites for two large lagoon ecosystems (Price & Price 1998). Clifton is the tourism centre of
the island with most the major hotels, restaurants, airport and other amenities. Many yachts
11
frequent Clifton Harbour and the island has the highest population of watertaxi operators
(Cooke et al. 2005).
Ashton is a more community based, rural fishing town that is located in the south of the
island. Union Island has had a history of unsustainable large scale developments and
environmentally unfriendly planning. In Clifton, the development of the airport resulted in
the levelling of Red Island (a protected area), destruction of a mangrove, and the reduction in
current flow within the lagoon, causing an increase in pollution retention time (Price & Price
1998). In Ashton, the lagoon hosts a multiplicity of ecosystems: coral reefs, seagrass beds,
salt marshes, mangroves, etc. Frigate Island which lie on the boundary of the lagoon was
designated a marine conservation area by the 1986 Fisheries Act (Price & Price 1998).
However, in spite of all of this, the 300 bertha marina was scheduled to be built along with a
50 acre golf course and a large condominium complex (Price & Price 1998). This
immediately reduced the current flow in the lagoon and thus a reduction in water quality by
increased suspended sediment, increased chlorophyll concentration due to nutrient build-up,
and consequently reduced coral reef and seagrass health and live cover (Goreau & Sammons
2003). Fishers have stated that this has negatively impacted on fish populations in the area
and subsequently reduced their catch rates.
3.3 Fisheries Infrastructure
3.3.1 Canouan Fisheries Complex
The Canouan fisheries complex was constructed by the Japanese government. Similar to the
complex in Mustique, this complex consists of sleeping quarters, storage and locker facilities,
refrigerators for cold storage and other infrastructure such as compressor (scuba tank refills)
and desalination equipment. Almost all the fishers that utilise this complex are from Paget
Farm, Bequia and pay approximately EC $35 per week in rent. A large portion of the fish is
sold to the government and stored at the facilities. This fish is then sold primarily to
restaurants and hotels on the island. Locals purchase fish at a small stall in Charlestown and
not many locals were observed going the fishing complex. Competition among fishers was
stated to be one of the main reasons why they choose to leave Bequia.
3.3.2 Clifton Fisheries Complex, Union Island
In 1994, the Japanese built a fishery complex in Clifton similar to the facility in Bequia.
Many suspect that the Japanese government is using these contributions as an incentive for
voting to lift the ban on whaling (see information on whaling in Section 3.4.2). Although this
facility would be more than adequate to cope with landings, the operational costs were too
high for the government and thus the facility is not utilised. As a result, fishers in Union
Island complain of not having enough amenities available to them. As the complex is not in
use, there are no real storage facilities available, especially for fishers with large catches. The
intention of the facility was to have storage racks where fishers can keep catch and lockers
for gear. Water scarcity is also a problem in Union Island. This impacts on the cost and
availability of ice to the fishermen, especially since the ice machine in the fishing complex is
not in operation. One fisher reported that the cost of ice in Union Island is times the amount
sold in St. Vincent. The island also lacks a gas station and fishers purchase gas from the
Anchorage Yacht Club and a local market retailer usually at a higher than normal price. A
representative of the government stated that once St. Vincent & the Grenadines receive the
license again to sell to the European Union, they will re-open the complex. Offers to lease it
to a private operator failed due to the high overhead costs of the facility.
12
3.3.3 Paget Farm Fishing Complex, Bequia
Paget Farm is the most active fishing village in Bequia. In 1994 the Japanese built a large
fishing complex in Paget Farm with facilities for storage and cleaning, ice machine, offices
and a research lab. There is also a built-in desalination plant which is necessary to operate
such a large facility in a water scarce island. Despite all of this, the complex was not utilised
due to high operational cost. The facilities have only been recently opened and leased to a
local company called Grenadine Seafood Distributors. The company estimates the monthly
overhead costs for the facilities at EC $7,000 for utilities and EC $7,000 for rent. The
company is currently investigating the use of solar technology for electricity to reduce some
of these costs. There are also plans to use the desalination plant to help supply some of the
Paget Farm community with potable water. The company was expecting around $1,000-
$2,000 in fish per day (primarily demersals) which will be aimed at the export market.
3.3.4 Lobster Storage Facilities, Bequia
Due to concern over the European Union ban on the importation of fish from St. Vincent &
the Grenadines, a live lobster pool was built next to the docks in Paget Farm. This was to
keep the lobsters alive as long as possible, reducing the chance of tissue decay. It is
approximately 450 cubic feet and is maintained and operated by a local fisher. A major
Barbadian importer purchases lobster from the fisher which are subsequently transported and
sold in Barbados at restaurants and hotels. The Grenadine Seafood Distributors were also
developing plans to create their own live lobster pools for facilitating export.
3.3.5 Mustique Fishing Complex, Mustique
The Mustique Company owns and operates the fishing complex on the western side of the
island. Fishers here have living quarters, cold storage, cleaning area, cooking area a haul up
site. Rent at the facility is free; however, the fishers have to pay for utilities. Most of the
fishers here are older Bequian fishers from Paget Farm. The company buys from fishers and
sells to tourists, private houses. Some tourists come to buy fish for consumption and to use as
bait for game fishing (e.g. robins, jacks).
3.4 History and development of fishing
3.4.1 Grenada and its Grenadines
Prior to the 1950s, the main fisheries in Grenada and its Grenadines were the flying fish and
offshore pelagic fishery, beach seining and handlining for demersals (Mohammed & Rennie
2003). There was also a significant amount game fishing associated with tourism. It was in
the 1940s that researchers started to notice the decline in demersals fish stocks in the
Leeward Islands and began to encourage a shift towards offshore pelagics and deep slope
species (Mohammed & Rennie 2003). After World War II, there was an influx of inboard
gasoline engines at lower costs and these were used on double enders, whalers and pirogues.
During this time as well, there were price controls instated on fish to ensure affordability,
even when landings were low (Mohammed & Rennie 2003).
Demersals remained the most important species group in the second half of the last century
and the influence of fish pots and the mechanisation of the pelagic fleets on the mainland
began to spread to the smaller islands. Sloops from the mainland were used with handline and
troll lines to fish for demersals in the Grenada and Vincentian Grenadines. Up to the 1970s,
traditional fishing gear and small scale fisheries still dominated Grenada its Grenadines. Row
boats were used to fish for demersals near to shore and it is expected that this was also
practiced in the Grenadine islands as well. There was also a trend towards younger boat
13
owners buying motorised boats and older fishers using the traditional row boats and double
enders.
The Artisanal Fisheries Development Project was established in 1982 as an effort by the
government to expand the fisheries sector. The goal of this US$2.7 million project was also
to increase employment, reduce fish imports, expansion of fish markets, duty-free prices on
fishing equipment and a marketing mechanism for sale of produce (Mohammed & Rennie
2003). With the donations of vessels from Cuba and other linkages, longlining skills and gear
were transferred to Grenadians. There was also a significant change of the use of flying fish
from human consumption to becoming primarily a bait fish. By the 1990s, the processing and
export market was well established with yellowfin tuna, swordfish and sailfish being some of
the major export species. With the increase in infrastructure and market for offshore pelagics,
the decline in the demersal fishery and government incentives that fishers in the Grenadines
began to switch to longlining (Mohammed & Rennie 2003). Even today, many of the Petite
Martinique fishers spend most of their time on longlining vessels based in Grenada.
3.4.2 St. Vincent and its Grenadines
There is the clear distinction between fisheries of the St. Vincent mainland and those of the
Grenadines. The Vincentian fisheries focus on inshore and offshore pelagics, with the
occasional humpback whaling whereas Grenadine fisheries target mainly inshore and deep
slope demersals, lobsters, conch and whales (Mohammed et al. 2003).
Due to the size of the fishery and its unreliability, the market for fish and shellfish did not
develop till after the 1940s. In addition, as the industry was not developed and most fished at
the subsistence level, the majority of the population got their source of protein from salted
cod imported from Newfoundland (Mohammed et al. 2003). Trade was limited by the
availability transport and distance, only a few islands like Canouan exported to the
"mainland" (i.e. the island of St. Vincent) and some exported turtle shell to Trinidad.
Nearing the middle of the last century, Canouan began to "process" fish by salting demersals.
In the 1940s (similar to Grenada), a price control was placed on fish.
After World War II, there was an influx of persons entering the fishing industry due to a lack
of other opportunities (Mohammed et al. 2003). The trade relationship between Martinique
and the Grenadines began around the 1950s. In the period of 1955-1958 about 227 t of fish
were traded and this new market led to an increased interest in the industry. Increasing
regional demand for species such as conch in Trinidad and Grenada led to the development of
the conch fishery in Union Island in the 1960s. By the 1970s as catch and effort increased,
all of the conch exports were diverted to Martinique and signs of overexploitation became
evident. As time progressed, Bequia became the major exporter of demersals and lobster to
Martinique. Canouan exported iced and salted fish to St. Vincent and Grenada and iced fish
less frequently to Dominica and St. Lucia.
In the 1960s there was an effort by the government, the Food and Agriculture Organization
(FAO) and the United Nations Development Program (UNDP) to advance the industry.
Efforts were made to offer duty-free concessions on gear, timber and engines were made but
were not successful. Another program was initiated to guarantee prices to French Antilles'
companies for the sale of fish but this also was not successful.
In the 1980s, a combination of Hurricane Allen, rising fuel prices, high cost of engines and
scarcity of spare parts caused a severe decline in the Grenadine fishery. Indications of
overexploitation of many species also became evident in the 1980s. Low abundance in
shallows and smaller sized lobsters increased fishing effort (scuba and faster boats) and
deeper fishing for demersals all testified that species were being overfished especially in the
14
shallower waters. It was recognised by managers that demersals on deeper banks and offshore
pelagics could withstand increased effort (Mohammed & Rennie 2003).
Whaling began as the most important fishery in the Grenadines (Mohammed et al. 2003).
There was a significant number of whalers from the Eastern United States that settled in the
Grenadines. In the 1870s, William Wallace Jr. started the first whaling station in Friendship
Bay (Bequia Tourism Association 2006). Another whaling station was subsequently set up by
Joseph Ollivierre on Petit Nevis (Whale and Dolphin Conservation n.d). The landing of a
whale is a significant community event and the majority of the whale meat is distributed
amongst the locals and little of the whale by-products are wasted. Whale oil became the
fourth most valuable export of the country (Bequia Tourism Association 2006). Between the
1890s-1925, it was estimated that 25,000 to 500000 imperial gallons of whale oil produced
from the six St. Vincent and Grenadine stations (Whale and Dolphin Conservation n.d).
Bones and some of the other by products (e.g. baleen) are used in furniture and in home and
building d�cor. Even to this day, whaling in the Grenadines is still conducted using the same
techniques that were used when the fishery first began there. Fishers travel out to sea in a
small double-ender (previously a dug out canoe) with a small crew and would use harpoons
to strike and capture the whales. The majority of whales targeted are humpbacks which
migrate south during the Northern Hemisphere winter (see Appendix 3).
In 1987, the International Whaling Commission (IWC) recognised the aboriginal, subsistence
use of humpback whales by Bequians (Whale and Dolphin Conservation n.d). Schedule
paragraph 13(4) of the International Whaling Commission regulations allows for the "taking
of [ ] humpbacks by Bequians of St. Vincent and the Grenadines, but only when the meat and
products of such whales are to be used exclusively for local consumption in the St. Vincent
and the Grenadines" (Whale and Dolphin Conservation n.d). Currently there is a quota of 3
whales and the harvesting of sucking calves and females with sucking calves is forbidden.
However, it was noted that calves were landed in 1992, 1993, 1998 and 1999 and escorts
were killed as they attacked the boat attempting to defend the other whale (Whale and
Dolphin Conservation n.d).
3.5 Current status of fishing in the Grenadines
3.5.1 Data limitations
As the Grenadines are many small, dispersed islands with very little government
administrative infrastructure, obtaining current and accurate data on landings is very
challenging. It is not unexpected to see that most of the fisheries statistics and information are
for the mainland and very little is documented separately for the Grenadines. It was also
noted that the catches for inshore and reef species were vastly underrepresented in Grenada
fisheries statistics as some of the important landing sites are not recorded (Mohammed and
Rennie 2003). Similar data gaps exist in the Vincentian Grenadines as well (Chakallal et al.
1994)
3.5.2 Economic value
According to a recent FAO report, it is estimated that 1,120 tons is landed in St. Vincent and
the Grenadines each year (Food and Agriculture Organisation 2002a). In 2000, exports from
fishing in St. Vincent & the Grenadines was valued at US $961 000 (Food and Agriculture
Organisation 2000a). In Grenada and the Grenada Grenadines, the export of tuna to the U.S.
market contributes US $3.5 million of foreign exchange to the economy (Food and
Agriculture Organisation 2000a). Fishing contributes 2% to the Gross Domestic Product
(GDP) in St. Vincent & the Grenadines and 1.5-2% in Grenada (Food and Agriculture
Organisation 2000a, 2002a). This however does not reflect the value of fisheries to the people
15
of the Grenadines as the total GDP include industry and agriculture on the St. Vincent and
Grenada mainland where the majority of the population lies. The proportion of each species
group landed in St. Vincent and the Grenadines are as shown in Table 3.1.
Table 3.1 Composition of average annual total landings in St. Vincent & the Grenadines by species group
Species Group
Percentage (%) of Total Annual
Landings
Shellf
ish 5
Demersals 10
Small Coastal (inshore) pelagics
45
Offshore pelagics
35
Other species
5
(Source: Jardine & Straker 2003)
The market for fish in the Grenadines is small and the majority of the fisheries are small-scale
using small fiberglassed boats and/or wooden crafts with one or two gasoline powered
outboard engines (Chakallal et al. 1994). Through observation it is evident that this is still
characteristic of the fishery. Overall demersals species are the most important with
handlining being the preferred fishing technique (Mohammed & Rennie 2003). In 2005,
demersals constituted 94% of the total landings in Carriacou (Statistical Division 2006).
There is no fisherfolk organisation for the fishers in the Vincentian Grenadines, Petite
Martinique in the Grenada Grenadines being the only island with a fishing cooperative.
3.5.3 Trading vessels
Fish trading vessels visit bays around the Grenadines and fishers sell their catch directly to
their boats (Jardine & Straker. 2003). In the period of 1996-2000, 118.6 tons or 13.1% of the
average annual landings in St Vincent & the Grenadines went directly to trading vessels. In
Petite Martinique, 98% of all the fish caught are exported to Martinique (Logan 2001) mostly
by trading vessels. This is supported by previous studies which reported that the majority of
the finfish from the Grenada Grenadines were exported to Martinique (Chakallal et al. 1994).
Currently, there are a total of 7 trading vessels operating in the Grenadines, most of which
operate out of Petite Martinique and Carriacou. The trading vessels are usually sloops with a
mast and are around 12-20 metres in length and driven by a >120hp engine (Chakallal et al.
1994). These vessels usually spend most of their time in Grenadines and 3-5 days to travel
and unload their stock. Martinique is one of the major buyers of fish from the Grenada
Grenadines with estimates of receiving 85% of all finfish exported to this island in 1990
(Chakallal et al. 1994). At around that time as well, 539.8 mt or 70% of total (Vincentian and
Grenada Grenadines) landed catch were exported to Martinique (Chakallal et al. 1994).
During the study, it was observed that the trading vessels accept mainly demersal species as
well as offshore pelagics. On some of the trading vessels, it was observed that species such as
Doctorfish and Ocean Surgeon (Acanthuridae sp.) were not accepted, neither was any fish
less than 9 inches in fork length (to ensure compliance to the European Union standards).
However, the fork length of each fish was estimated rather than measured.
3.5.4 European Union ban and quality control
In 1999, the European Union began to put restrictions in place on the imported fish into its
territories (Logan 2001). These included setting up standards of handling and procession that
had to be met and to promote better fishing practices (e.g. rejection of juvenile fish). This
resulted in a ban the importation of fish from St. Vincent & the Grenadines. Since then, the
16
Vincentian government has begun to improve the conditions within the fish markets to meet
the international standards. This includes encouraging the use of ice on vessels and in
vending stalls, acquisition of devices for monitoring bacteria, heavy metals, etc from the
Japanese and European Union and the training of fisheries staff in quality control and
assurance (Food and Agriculture Organisation 2002a). It is not clear when the next round of
inspections will take place so as to assess the new operating and processing conditions.
According to the Fisheries Division Officer for the Grenada Grenadines, the government has
successfully implemented quality control and assurance practices within the fishing industry.
With the threat of losing access to this vital market, the government was motivated to put the
necessary measures in place to meet the new standards. This was a coordinated effort with the
local government, fishers and the private vessels where the Grenada government provided
free training for the private trading vessel staff and fishers to reach the widely recognised
HACCP standards.
3.6 Fisheries management
3.6.1 Fished species
Around the Caribbean, overfishing has depleted many of the fish stocks, particularly conch,
lobster and reef species (Jardine & Straker. 2003). Other factors that are impacting on fish
stocks include habitat loss due to development (Price &Price 1998) and the unregulated and
illegal fishing from local and foreign vessels (Jardine & Straker. 2003). Demersal fisheries
have been the most targeted species group on the Grenada bank for many years and nearshore
species have been overfished in both countries (Food and Agriculture Organization 2002b).
As the fishing industry in the Grenadines is multispecies and lacks sufficient landing and
effort data, it is difficult to determine the sustainable yield of each species or species group
(Chakallal et al. 1994). However, available scientific data (Food and Agriculture
Organization 2000b) as well as anecdotal reports all indicate that demersals have been
harvested beyond sustainable yield for many years. Eighty-seven percent of Vincentian
Grenadine fishers interviewed in Chakallal et al. (1994) stated that they caught less fish then
(1994) than 5 years ago (1989). Reasons given were increased fishing effort, yacht pollution
and exploitation by SCUBA divers. In response to this, both governments have been
promoting the exploitation of the deep slope demersal and offshore pelagic fishery
(Mohammed & Rennie 2003, Finlay 1999, Food and Agriculture Organisation 2002b).
Around the region, the Caribbean spiny lobster (Panulirus argus) has been fully or over-
exploited (McConney 2003a). This is the most highly priced species in both the Vincentian
and Grenada Grenadines. Observations by fishers have indicated that the year after Hurricane
Ivan was one of the best and the subsequent year was one of the worse lobster fishing
seasons. Some believe that the stock was severely overfished after Ivan and is yet to recover.
In the 1980s, the export of conch declined and this was subsequently linked to overfishing
(Mohammed et al. 2003). The West Indian Sea Urchin (Tripneustes ventricosus) was
harvested in Grenada and its Grenadines so heavily in the early 1990s that the fishery had to
be closed in 1995 (Finlay 1999). Evidence suggests that destructive fishing practices,
increased effort and habitat loss have also led to the demise of this important fishery
(Fisheries Global Information System 2001).
3.6.2 Legislation and current management measures
3.6.3 A vessel licensing and registration program in St. Vincent & the Grenadines is
believed to be 85% complete (Jardine & Straker 2003). However from observation,
most of the vessels in the Grenadines were not registered. The table below shows the
17
relevant legislation as it relates to fisheries in Grenada and St. Vincent & the
Grenadines.
Table 3.2. Grenada and St. Vincent & the Grenadines legislation relevant to fishing
St. Vincent & the Grenadines
Grenada
Grenada Territorial and Marine
Maritime Areas Act (1983)
Boundaries Act (1989)
Fishing Vessel Safety Regulations
Fisheries Act (1986)
(1990)
Fishing Regulations, 1987 (Amended
Fisheries Regulations #24 (1996)
1991)
Grenada Fisheries Act (1986,
Fish Processing Regulations (2000)
amended 1999)
High Seas Fishing Act (2001)
Source: (Kirby-Straker 2003, Food and Agriculture Organization 2000b)
3.6.4 Species and gear regulations
Most of the fishers interviewed during the study seem to be aware of the seasons and the
legislation relating to their target species. These regulations include size restrictions on
lobsters, conch and turtles (Kirby-Straker 2003). Lobsters are located on the shallow shelf
and the deep reef and thus are targeted using traps, gill nets and diving (free and scuba) by
hand or with the use of a small wire loop (McConney 2003a). Berried lobsters (females with
eggs) and the capture of lobster other than by means of traps, loops or hand is illegal (Kirby-
Straker 2003).Mesh sizes for seine nets are to be no smaller than 1 inch and � inch for
"balahoo nets" and Grenada fishers are required to register their seine net. Tangle (trammel)
nets are prohibited and spear guns are prohibited for use in conservation areas. The taking of
turtle eggs, handing of nests and corals are also forbidden. Table 3.3 shows the closed
seasons for the various species groups in St. Vincent & the Grenadines and Grenada.
18
Table 3.3. Closed seasons for species groups under management in St. Vincent & the Grenadines and
Grenada
Month
Species Group J
F
M A
M J
J
A S O N D
Lobster
Sea Turtle
Sea Urchin
Whales
Grenada closed season
St. Vincent & the Grenadines closed season
Source: Kirby-Straker 2003
3.7 Fishing techniques
3.7.1 Handlining
Handliing for demersals is by far the most widely practiced fishing technique in the
Grenadines (Chakallal et al. 1994). The major target species are parrotfish, hinds and
groupers on the shallow shelf and groupers and snappers on the deep slope (Food and
Agriculture Organisation 2000a). Wooden bow and stern vessels are used within this fishery
which is focused on the shallow shelf and deep slope area (see Appendix 2). This technique
involves the use of a long monofilament line, weights and bait. The average landings are
between 11. 4 -31.8 kg and are usually fished 5-6 days per week (Chakallal et al. 1994) with
a crew of 2-6 fishers.
3.7.2 Traps
Traps or "pots" utilise hexagonal wire mesh on wooden frames and are set on shallow reefs
or on deeper slopes (Chakallal et al. 1994). Soak time can range from 3-7 days and a large
variety of demersals are caught. This fishery is exploited all year round and increases in May
�August which is likely due to the closure of the lobster season (Table 3.3). Many fishers
have to replace or purchase new traps every year due to corrosion, damage, misplacement or
theft. Specialised traps are used for lobsters during the season. Many persons enter the fishery
specifically during this open season and many of the other fishers switch to this species.
3.7.3 Trolling
Trolling or "towing" involves the use of one or more long monofilament lines with various
hooks and bait (Chakallal et al. 1994). Small multi-purpose vessels are driven with the line
towing behind and targets large offshore pelagic species such as tuna, wahoo and bill fish
(Food and Agriculture Organization 2002b). This is also a common fishing technique for
recreational fishers and small inshore pelagics are the bait of choice for fishery. This can be
done solitarily or with a small crew. Some of these species are caught incidentally (e.g.
barracuda) by shallow shelf and deep slope fishers (Food and Agriculture Organization
2002a).
3.7.4 Seine net fishing
The inshore seine fishery is very important in the Grenadines. It is the most favoured fish for
consumption in St. Vincent & the Grenadines (Jardine & Straker 2003) and is caught using
wooden double ender boats (see Appendix 4). Boats surround schools in bays using a large
19
net of irregular mesh sizes which have floats and weights so as to span the water column
(McConney 2003b). Divers beat the water to scare the fish into the net which is slowly
brought to a close. For instances where the net is attached to a stationary object onshore, the
net is drawn slowly ashore (Chakallal et al. 1994).
3.7.5 Gill and trammel nets
Gill nets are small nets that are used to target schools of pelagic species (Chakallal et al.
1994). They are made of small monofilament nylon which is hardly visible to the fish.
Trammel nets which are now illegal in both Grenada and St. Vincent & the Grenadines are
similar to gill nets but consist of three panels (McConney 2003b). These nets have a float and
lead line which keeps it on the bottom and are soaked for about 18-24 hours. These nets are
also utilised in the lobster fishery as nets left for an extended period of time contain decaying
fish which attracts lobsters (McConney 2003b). This entanglement net is very unselective and
catches many unwanted species leading to large quantities of by-catch which is detrimental to
the marine ecosystem.
3.7.6 Longlining/Palang
Longlining or multi-hook fishery varies from the home made palang to mechanised
longlining with hydraulic pulley systems. Many of the Southern Grenadine fishers are
involved in the Grenada commercial longline fishery on the larger sloop vessels (e.g. sloops)
The smaller vessels in the other islands use home made multihook (300-400) palang gear.
Surface or "floating" palang is set high in the water column and this gear targets offshore
pelagic species. Bottom or "sinking "palang targets demersals and are sometimes placed
vertically along shelf slopes or along the edge of banks (Chakallal et al. 1994).
3.7.7 Diving
Spear guns are used extensively all around the Grenadines, particularly by younger fishers.
Free diving fishers can go to depths of 60-80 feet and they target conch, lobster and
demersals. Scuba diving fishers fish much deeper (e.g. 150 feet) which at many times is much
deeper than the regulations stipulate for non-commercial divers. Many of these SCUBA
divers do not have any formal training in SCUBA diving. The average crew size for spear
fishers is 5-6 fishers (Chakallal et al. 1994) and fishers use a small wire noose to trap lobsters
and short poles to carry fish.
3.8 Boat types
In the Grenadines, the most common boat type is the small wooden bow and stern. Boats are
not specific and are used in many types of fishery (Chakallal et al. 1994). Details on the boats
can be seen in Appendix 4.
4 RAPID INITIAL SURVEY (PHASE I): RESULTS AND DISCUSSION
The rapid initial survey was carried out to acquire a basic, broad picture of the resource use
and the socio-economic status of fishers in the Grenadine fisheries. Below are the results of
this survey.
Table 4.1 shows the distribution of fishers by island, each island's estimated population, and
also the proportion of the populations that were interviewed in this initial stage of the study.
20
Table 4.1. Sampling distribution of fishers interviewed and the island populations in the Grenadines
* Population
Proportion of
Estimated
Number of
Island
Estimates
Population
Fisher
Respondents
(2005)
Interviewed
Population
Bequia 90 4420 2.0%
Mustique
20 1290 1.6% **800
Canouan 16 1830 0.9%
(1982 records)
Mayreau 22 170 12.9%
Union Island
32 1900 1.7%
30 600 5.0%
Petit Martinique
**191
(1988 records)
Carriacou 57 8000 0.7%
Total
267 18,210 1.5%
991
(Source: *SusGren 2005; ** Source: Chakallal et al. 1994)
From previous studies (Chakallal et al. 1994, Baldwin 2006) and through general
observation, it was clear that the fishers were unequally distributed throughout the
Grenadines. Islands such as Bequia and Carriacou contain larger proportions of fishers
because of: (1) larger populations, (2) their highly active and concentrated fishing villages
and (3) strong historical fishing traditions. Most of the fishers in the Mustique and Canouan
fishing camps were not native to the islands but were mainly Bequians from Paget Farm. The
men stated that increased competition in the fishery as well as proximity to fishing grounds
are the two main reasons for residing at these camps.
4.1 Alterations to sampling design
Although it has been reported that more than 80% of adult males in the Grenadines are
fishermen (CCA/IRF 1991), many fishers stated that this is an overestimation as it is unlikely
that all of these men are dependent on fishing for some aspect their livelihoods. This was
verified after many conversations with key informants and fishers who gave a drastically
lower estimation of the fishing population on their respective islands. For example in
Mayreau it was speculated that all male residents are reliant on fishing, however the fishers
themselves identified a much lower number (15-20 fishers), which was comparable to those
encountered in this study.
4.2 Demographic information
Out of the 267 fishers that were interviewed in the initial phase of this study, only one was
female. The average age of the fishers was 43 years (median age = 42) and Figure 4.1
presents the percent frequency within the identified age groups. The graph follows a normal
distribution with a slight skew to the left. It must be noted that 8.3% (n=22) of the fishers
were beyond the age of 65, which is an age that is normally associated with retirement. The
youngest mean age on any island was 36 years which was observed in Petite Martinique,
while the oldest mean age of 46 years was among the fishers observed in Bequia. The
average number of years spent fishing was 21, and thus fishers in the Grenadines begin to
fish at an approximate, average age of 22 years.
21
25%
20%
15%
r
equency
f
10%
Percent
5%
0%
11-20
21-30
31-40
41-50
51-60
61-70
71-80
81-90
Age group
Figure 4.1 Age distribution of fishers interviewed in the Grenadines
4.3 Dependency on fishing
Sixty-four percent of the fishers interviewed stated that they are solely dependent on fishing,
that is, 100% of their annual income comes from fishing. An additional 23% make half or
more of their income from fishing, leaving only 12% making more income from other
occupations.
There is a strong correlation between age and sole dependency (i.e. 100% of income) on
fishing. The results of a Mann-Whitney, non-parametric test show that the difference between
the mean age of fishers who are solely dependent (45.46 years) is significantly different from
the mean age of fishers who are not (37.53 years) (Z=-4.118, n=254, p=0.000). A bar graph
was created in Figure 4.2 to look at the dependency on fishing within the different age
groups. It demonstrates a positive relationship which shows that older fishers are relying
more on fishing. It also implies that younger fishers have more diversified sources of income.
These results present a very considerable vulnerability within the Grenadines fisheries where
older fishers are evidently more dependent on fishing. This could be due to a mix of the
following factors, inter alia : (1) the older generation were traditionally more dependent on
fishing as there were fewer options in the past, (2) with the gradual growth in the economy
and job market, younger fishers have more opportunities and are just using fishing to top up
other work, and (3) as fishers get older, they are unable to adopt new skills to pursue other
trades and thus, remain or turn to fishing. To identify which factors cause this relationship
would require more extensive socio-economic research which is beyond the scope of this
study. It is unclear how much of the older population on these islands is reliant on fishing but
it seems to be one of the very few options available to them. This is a possible cause for
concern as the older fishers who may not have national insurance, pension or welfare, remain
in fishing as their only means of income generation.
22
100%
90%
80%
70%
ers
i
sh
60%
f
f
100%
o
>1/2
n
50%
1/2
ortio
40%
<1/2
Prop
30%
20%
10%
0%
11-20
21-30
31-40
41-50
51-60
61-70
71-80
81-90
Age Groups
Figure 4.2 Dependency on fishing by age group
Figure 4.3 compares dependency on fishing among Grenadines islands. It shows that Bequia,
Petite Martinique and Union Island have a larger proportion of fishers that are heavily
dependent on fishing. All of these islands have strong historical fishing traditions (Bequia
Tourism Association 2006, Logan 2001, Mohammed et al. 2003). This highlights a possible
vulnerability as a decline in the fishery would have a greater impact on fishers in these three
islands.
It was also observed that the fishers at the Canouan and Mustique Fishing camps are on
average 4 to 10 years older than the overall average and 75% and 80% of them are solely
dependent on fishing. This is expected as fishers who take the trouble to leave home to reside
at fishing camps are likely be more dependent on fishing.
Mayreau and Carriacou fishers are less dependent on fishing and are likely to have more
alternative sources of income. This may be due to, among others: the large size of Carriacou,
which presents greater opportunities for businesses and agriculture; and the opposing small
size of Mayreau may result in a greater need for multi-occupationality within the community
(that is, fishing is one of the many frequently chosen occupations). Contrastingly, Petite
Martinique is a small island with fishers who depend heavily on this sector which may be due
to historical and cultural influences. To accurately determine the factors that generate the
observed level of dependency, a more in-depth study would be required.
23
100%
90%
80%
s 70%
sher 60%
fi
100%
>1/2
50%
ion of
1/2
ort 40%
<1/2
rop 30%
P
20%
10%
0%
Bequia
Canouan
Carriacou
Mayreau
Petite
St.Vincent
Union
Martinique
Island
Home island
Figure 4.3 Dependency on fishing by home island
4.4 Boat ownership
Overall, 46% of the fishers interviewed during Phase I were boat owners and 54% either fish
from shore or work as crew.
4.4.1 Boat ownership by island
Results show that Bequia has the largest ratio of crew members/shore fishers to boat owners.
It can be speculated that this is due to a lack of initial capital to purchase a boat, along with a
strong cohesion that was observed within the community which facilitates the sharing of
resources such as boats and gear. This strong co-operation among fishers was again observed
in Mustique where equipment and materials are also shared. Canouan and Union Island have
more number of boat owners as fishers tend to operate on an individual basis (i.e. less crew)
and on these islands and there is a lower density of fishers.
The average number of crew in all the islands is 4 with Bequia and Mustique having an
average of approximately 1 more crew member than the other islands. To determine average
number of crew for each type of fishing would require a larger survey effort.
4.4.2 Boat ownership, dependency on fishing, and age
The levels of dependency on fishing of boat owners and crew were plotted as pie charts in
Figure 4.4 and they clearly demonstrate that boat owners are more heavily dependent on
fishing while crew members and shore fishers have other sources of income. To test the
relationship between ownership and dependency, a Chi-squared statistical analysis was
performed and fishers were divided into sole dependents (i.e. 100% of their income from
fishing) and those with other occupations. The results show that dependency on fishing is
likely to be influencing boat ownership (2=10.875, n=262, p=0.001) or vice versa. A Mann
Whitney test also showed there to be a statistical difference (Z=-0.510, n=261, p=0.000)
between the age of boat owners (47.50 years) and non-owners (38.24 years). That is, those
fishers who are solely dependent on fishing, or choose to focus on fishing, are more likely to
purchase vessels.
24
12%
14%
6%
15%
<1/2
6%
1/2
>1/2
55%
100%
18%
74%
Crew Members/ Shore Fishers
Boat Owners
Figure 4.4 Proportion of income from fishing for crew members/shore fishers and boat owners
The average age of boat owners (47.50 years) was significantly higher than that of crew/shore
fishers (38.24 years) according to a Wilcoxon Signed Rank statistical test (Z=-4.076, n=262,
p=0.000). Older fishers are more experienced and may have accumulated the capital and time
necessary to purchase their own fishing vessel or younger fishers prefer not to put large
investments into fishing.
These two results illustrate a positive
relationship between age, likelihood of
owning a fishing vessel and dependency
g
boat
on fishing. This is illustrated in the
n
a
diagram found in Figure 4.5.
shi
ng
Fi
ni
on
ow
y
enc
nd
l
i
hood of
pe
e
ke
D
Li
Age
Figure 4.5 Diagram showing dependency on fishing and boat ownership increasing with age
4.5 Other occupations
Although most of the persons interviewed (79%) stated that their primary occupation was
fishing, there were 30 other occupations identified that part-time fishers use to supplement
their income. These were grouped into the categories seen in Figure 4.6.
25
FISHING
Skilled
Tourism
labour
Arts, crafts
Carpentry
INCOME
Taxi driver
Construction
Water taxi
Painting
Vending
Labourer
Tour and
Masonry
Chartering boats
Other
Public Sector
Maritime and Trade
Bar Owner
Ambulance worker
Boat building
Gardening
Airport maintenance
Sailing/Cargo
Kitchen helper
Working at ports
Sales Clerk
Farming
Domestic work
Figure 4.6 Diagram showing the main income earning activities identified by fishers in the Grenadines
Other
19%
Public Sector
4%
Skilled labour
49%
Maritime and
trade
15%
Tourism
13%
Figure 4.7 Main occupations of part-time fishers in the Grenadines (n=54)
The pie chart in Figure 4.7 shows the primary occupations of part-time fishers and clearly
shows that the majority of fishers turn to skilled labour to supplement their income. Very few
fishers are also employed in the public sector and relatively small proportions are involved in
tourism (13%) and marine and trade related occupations (15%). The may be due to the lack
of compatibility between these occupations (e.g. skills not transferable) or simply due to lack
of availability and/or interest.
26
4.6 Boat and engine types
The predominant boat types observed and recorded were wooden and fibreglassed coated,
bow and stern boats (Figure 4.8). Less common were pirogues, sloops , modified speed boats
and "bertrams" (cabin cruisers). There were six longlining vessels which were only
encountered in the south, particularly in the Grenada Grenadines. The majority of boats
(except for longliners and double-enders) are multi-purpose, i.e. are used in more than one
type of fishery and target a variety of species (Chakallal et al. 1994).
Forty horsepower Yamaha engines were the preferred engines of fishers surveyed. Petite
Martinique and Carriacou have the most powerful engines, averaging 75.9 HP and 66.3 HP
respectively (overall average = 60 HP). This may be the result of subsidised costs due to
government support through duty free concessions in the Grenada Grenadines.
The average boat length is 19.6 feet (5.9 m) with the largest boats situated in Petite
Martinique (23.0 feet/ 7.0 m) and Carriacou (22.2 feet/6.7 m) while the smallest boats were
located in Mayreau (17.3 feet/5.2 m) and Union Island (17.6 feet/5.3 m). This may be a
reflection of a greater intensity of longline fishing which is taking place in the Grenada
Grenadines or the government support within the industry. There was a weak positive
relationship between boat length and total horsepower (R2= 0.532) which is seen in Figure
4.9.
27
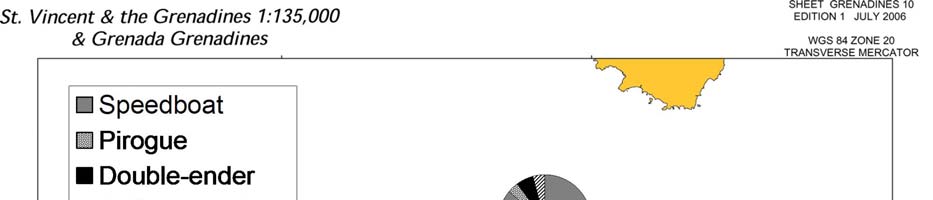
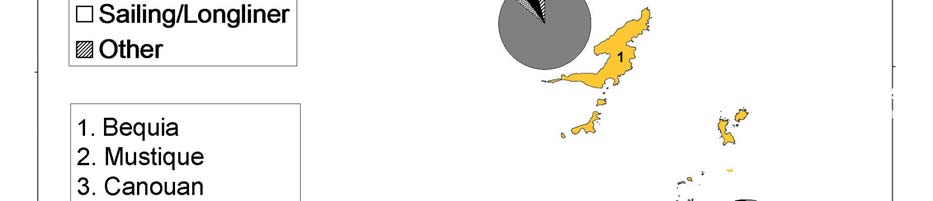
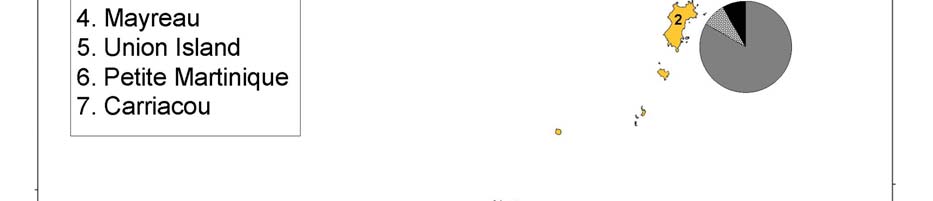


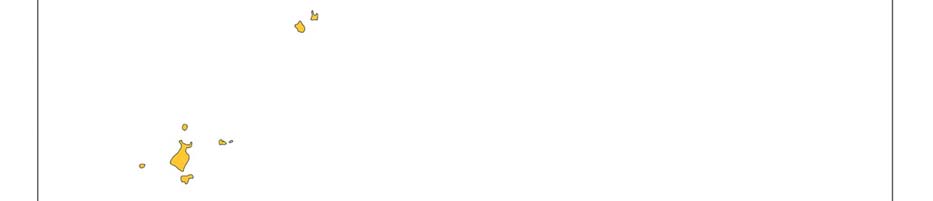
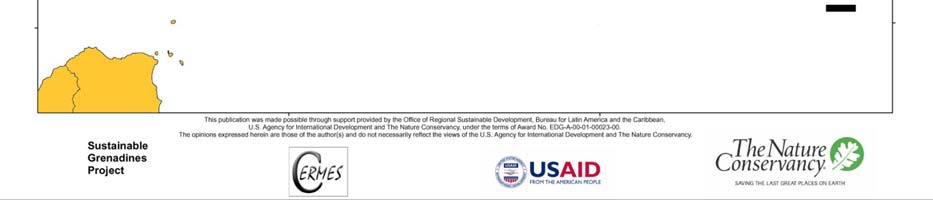
Figure 4.8 Map showing the distribution of boat types in each island surveyed
28
400
y = 5.3608x - 43.602
350
300
250
200
sepower
Hor 150
100
50
0
0
10
20
30
40
50
60
Boat length
Figure 4.9 Linear relationship between boat length and engine horse power
4.7 Coastal and marine resource use
4.7.1 Fishing techniques
In each island, handlining was the predominant type of fishing practiced, except for Petite
Martinique where spear fishing was the most common (see Figure 4.10). In terms of percent
frequency within the age groups, handlining exhibits the same distribution as the overall age
frequency distribution throughout the Grenadines (see Figure 4.11). This illustrates that
handlining is more frequently practiced among all the age groups. Previous studies have also
shown that this fishing technique and trap fishing are the two most common methods in the
Grenadines (Chakallal et al. 1994).
Traps are also widely used in all islands, especially in Carriacou, Mustique and Mayreau.
Spear fishing and/or scuba diving, with the exception of Petite Martinique, is more
commonly practiced in the Northern Grenadines (see Figure 4.10). The distribution of the
fishing techniques observed in Petite Martinique maybe not be representative of the actual
fisher population due to the absence of longline fishers during the time of the survey who,
according to key informants, spend the majority of their time out to sea or in Grenada.
A significant result is the obvious skew of spear fishing and scuba diving towards the
younger age groups between the ages of 20-40 years (see Figure 4.11). This may be due to
the large amount of risk, effort and fitness required to free/scuba dive and also because these
are not the most traditional forms of fishing that older fishers may be more familiar with.
29
Bequia
Canouan
25
35
30
20
y
y
c
25
c
n
n
ue 15
ue
eq
20
e
q
t
Fr
t
Fr
15
10
c
en
c
en
Per
Per 10
5
5
0
0
Handline Traps
Spear
Scuba Gill nets Beach
Trolling Trammel SL/FP
BL/SP
Handline Traps
Spear
Scuba Gill nets Beach
Trolling Trammel SL/FP
BL/SP
Seine
Seine
Type of Fishing
Type of Fishing
Carriacou
Mayreau
35
35
30
30
y 25c
y 25
n
c
n
ue
ue
20
e
q
20
e
q
t Fr 15
t
Fr 15
cen
c
en
Per 10
Per 10
5
5
0
0
Handline Traps
Spear
Scuba Gill nets Beach
Trolling Trammel SL/FP
BL/SP
Handline Traps
Spear
Scuba Gill nets Beach
Trolling Trammel SL/FP
BL/SP
Seine
Seine
Type of Fishing
Type of Fishing
Mustique
Petite Martinique
30
35
25
30
y
y
c
25
c
n 20
n
ue
ue
e
q
20
e
q
15
t Fr
t
Fr 15
cen
c
en
10
Per
Per 10
5
5
0
0
Handline Traps
Spear
Scuba Gill nets Beach
Trolling Trammel SL/FP
BL/SP
Handline Traps
Spear
Scuba Gill nets Beach
Trolling Trammel SL/FP
BL/SP
Seine
Seine
Type of Fishing
Type of Fishing
Union Island
Total
50
35
45
30
40
y
y
c 35
25
c
n
n
ue 30
ue
eq
20
e
q
25
t Fr
t
Fr 15
20
c
en
c
en
15
Per
Per 10
10
5
5
0
0
Handline Traps
Spear
Scuba Gill nets Beach
Trolling Trammel SL/FP
BL/SP
Handline Traps
Spear
Scuba Gill nets Beach
Trolling Trammel SL/FP
BL/SP
Seine
Seine
Type of Fishing
Type of Fishing
Figure 4.10 Percent frequency of each type of fishing by island (SL/FP- Surface longlining/floating
palang, BL/SP- Bottom longlining/sinking palang)
30
Gill nets were not reported to be used often however this may be due to a misunderstanding
as gill nets were mistaken by many for trammel nets. Therefore the data may not give an
accurate account of these two types of fishing. Beach seining is not commonly practiced in
many islands, but is focused mainly in Bequia, Carriacou and Mayreau.
Handline
Spear
25
35
30
20
25
cy
c
y
e
n 15
e
n
20
equ
equ
Fr
Fr15
10
ercent
e
r
c
ent
P
P10
5
5
0
0
11-20
21-30
31-40
41-50
51-60
61-70
71-80
81-90
11-20
21-30
31-40
41-50
51-60
61-70
71-80
81-90
Age Groups
Age Groups
Scuba
35
30
25
c
y
e
n
20
equ
Fr
15
e
r
c
ent
P10
5
0
11-20
21-30
31-40
41-50
51-60
61-70
71-80
81-90
Age Groups
Figure 4.11 Types of fishing by age group
Lobster is an important target species due to its high ex-vessel price. From discussions with
key informants within the St. Vincent & the Grenadines Fisheries Division, it is likely that
the amount of lobster fishers was underestimated in this study. This is because a large number
of fishers enter the fishery only for this species and this study was not conducted during the
open season between September and April. Traps were encouraged by the St. Vincent & the
Grenadines Fisheries Division so as to reduce death and injury by scuba divers going beyond
the recommend limits. One fisher has stated that up to 30 fishers each year suffered from
decompression sickness and had to be airlifted to Barbados for treatment in the
decompression chamber. However, this is a costly and difficult exercise as the fishers have to
pay over EC $300 for airfare alone plus treatment and accommodation for the victim and an
accompanying friend/relative. The frequency of scuba diving injuries in the Grenadines is
due to the lack of proper training and the disregard for the recognised safety regulations.
Fishers state that they knowingly go beyond safe dive limits so as to increase their catch per
dive and have done repeat dives to 150 feet (45.5m).
Offshore pelagics are more important to the Southern Grenadines (see Figure 4.10). This
again is due to the Grenadian government's encouragement of longline fishing on all of its
31
islands. It was also noted that trolling for this fish group is dominated by older fishers in
smaller vessels where 43% are above the age of 50. However, as previously mentioned, it is
believed that the proportion of fishers targeting these species is much higher than recorded
due to the absence of longline fishers from the islands at the time of this study.
4.7.2 Fish groups targeted
As is illustrated in Figure 4.12, the majority of fishers interviewed on each island are
targeting demersals. These are commonly caught using handline and spear which are the two
most popular fishing techniques used. This supported the results of a baseline study
conducted in the 1990s, where deep-water demersals were found to be the most important
species group for 75% of Vincentian Grenadine fishers (Chakallal et al. 1994). This also
supports reports of overexploitation of some demersal species such as red hind in the
Vincentian and Grenada Grenadines (Caribbean Regional Fisheries Mechanism 2004, Finlay
1999). The Fisheries Officer for Carriacou and Petit Martinique stated that the government
encouraged fishers to enter the longline fishery to reduce the fishing effort on the
overexploited bank demersal species. This appears to be successful as informants on islands
such as Petite Martinique stated that a large majority of the fishers are becoming involved in
the longline fishery. It is not clear at the moment if this has reduced fishing pressure on the
demersals and studies will have to be performed with regards to the status of this species
group.
All of the fishers who target whales and porpoises are from Bequia and this group is the least
pursued species in the Grenadines. Sea turtles were reported to be rarely targeted as well but
this could be due to fishers being unwilling to share this information in fear of the
consequences of being identified as fishing a conserved species.
32
Bequia
Canouan
45
45
40
40
35
35
c
y
30
c
y 30
uen
uen
25
25
20
20
ent Freq
ent Freq
15
e
rc
15
e
rc
P
P
10
10
5
5
0
0
Inshore
Demersal
Conch
Lobster
Turtles
Whales &
Offshore
Inshore
Demersal
Conch
Lobster
Turtles
Whales &
Offshore
pelagics
Purpoises
Pelagics
pelagics
Purpoises
Pelagics
Species Group
Species Group
Carriacou
Mayreau
45
50
40
45
35
40
cy
35
30
c
y
uen
uen 30
25
25
20
ent Freq
ent Freq 20
15
e
rc
e
rc
P
15
P
10
10
5
5
0
0
Inshore
Demersal
Conch
Lobster
Turtles
Whales &
Offshore
Inshore
Demersal
Conch
Lobster
Turtles
Whales &
Offshore
pelagics
Purpoises
Pelagics
pelagics
Purpoises
Pelagics
Species Group
Species Group
Mustique
Petite Martinique
50
50
45
45
40
40
35
35
c
y
c
y
uen 30
uen 30
25
25
ent Freq 20
ent Freq 20
erc
e
rc
15
15
P
P
10
10
5
5
0
0
Inshore
Demersal
Conch
Lobster
Turtles
Whales &
Offshore
Inshore
Demersal
Conch
Lobster
Turtles
Whales &
Offshore
pelagics
Purpoises
Pelagics
pelagics
Purpoises
Pelagics
Species Group
Species Group
Union Island
Total
40
45
35
40
35
30
c
y
c
y
30
25
uen
uen
25
20
20
ent Freq 15
ent Freq
e
rc
15
e
rc
P
P
10
10
5
5
0
0
Inshore
Demersal
Conch
Lobster
Turtles
Whales &
Offshore
Inshore
Demersal
Conch
Lobster
Turtles
Whales &
Offshore
pelagics
Purpoises
Pelagics
pelagics
Purpoises
Pelagics
Species Group
Species Group
Figure 4.12 Proportion of fishers targeting each fish group by island
33
4.7.3 Areas fished
Fishing areas by island of operation
The majority of fishers interviewed fished around the islands closest to their base of
operations, as is shown in the matrix diagram in Figure 4.13.
� Approximately half of the fishers operating from Bequia fish around the island of
Bequia, Petit Nevis, Isle de Quatre, Mustique, Savan, Pillories, Balliceaux and
Batowia (see Figure 4.14). These findings confirm previous results which determined
that Bequians are the most mobile fishers of the Grenadines (Chakallal et al. 1994).
� The majority of the fishers operating out of Canouan (42%) remain close to the island
while some (13.2%) venture towards Mayreau. This is logical as most of these fishers
left their home island of Bequia to camp at the Canouan Fisheries complex.
� � of the fishers operating out of Mustique, all of whom are from Bequia, fish near
Mustique (see Figure 4.15). This again makes sense because they would remain at the
Mustique fishing camp for long periods of time. Out of all the fishing villages, the
Musique fishers travel the least, or remain closest to their base of operations.
� Half of the fishers from operating out of Carriacou fish close to home (see Figure
4.16).
� Approximately half of the Mayreau fishermen stay near Mayreau and Canouan
� Petite Martinique fishers remain close to home (33.9%) and also fish further south in
Grenada (19.4%). This is due to the longline fishing that is practiced on this island.
� Union island fishers that were interviewed exhibit quite an even distribution of fishing
throughout the Grenadines (except for St. Vincent) with the majority (25.8%) fish
closer to Union Island.
Source of fishers
� The majority of fishers (longliners) who go offshore to other islands in the Eastern
Caribbean are from Union Island. This however may not be an accurate representation
of the distribution of longliners but due to the interviewing of a crew members from
one boat during the study. It was also difficult to interview those longliners who
would fish here from PM because they are based in Grenada.
� The majority of fishers in Grenadian waters operate out of the islands from their own
territory, Carriacou and Petit Martinique.
� There were only 3 fishermen encountered (two from Bequia and one from Petite
Martinique) that fish around St. Vincent.
� The Tobago Cays is visited by fishermen from Bequia, Canouan, Petite Martinique
and Union Island. Although there were only 10 fishermen who mentioned fishing off
of the Cays, the exact locations of this practice are not known. In the recent past, there
was an established fishing camp on Petite Tabac and thus some fishers are returning
to these islands to fish. This could have implications for the conservation efforts
taking place within the Tobago Cays Marine Park.
� Carriacou, Canouan and Mustique, Savan, Pillories, Balliceaux, Battowia, All Awash
are the most intensely fished areas. This may be due to the fact that most of the fishers
in our sample were from Carriacou and Bequia.
� St. Vincent, Tobago Cays and the Eastern Caribbean (e.g. St. Lucia, Barbados,
Martinique, etc) are the least intensely fished areas. The Tobago Cays are not fished
34
as intensely because it is a marine park. It is expected that due to the large investment
required to enter the longlining industry (larger boats, expensive gear, fuel, etc), few
fishers are venturing beyond the Grenada Bank.
Fishing Grounds
s,
i
e
l
l
l
and
de
l
or
A
o
uan
Is
Pil
ia,
m
Can
an
vis, Isle
an,
t
ow
tit
e
Pe
& Pal
ent
ys
q
ue
i
bbe
.
N
Sav
Bat
a
ent
a
nd
r
t
ini
ck
t
. Vinc
a
a
nc
a, P
e
an &
o C
n
Car
eau
o
stique,
liceaux,
yr
l
R
u
ion Isl
r
r
i
acou
anou
a
obag
n
a
enad
St. Vi
Bequi
Quatr
M
Bal
Awash
C
M
T
Sai
U
Petit S
Petit M
C
Gr
Easter
Bequia
erations
p
Mustique
Base of O
Canouan
Mayreau
Union
Petit
Martinique
Carriacou
Legend
1-10%
10-20%
20-40%
40-60%
60-100%
Figure 4.13 Matrix diagram showing the distribution of fishing locations of fishers from each island of
operation
Figures 4.14 - 4.16 show the "destinations" (i.e. fishing grounds) of fishers from each island.
The fishing grounds were grouped (circles) and delimited by proximity and the 20 m
bathymetry contour line.
35
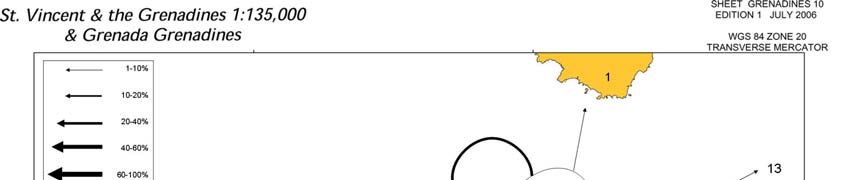
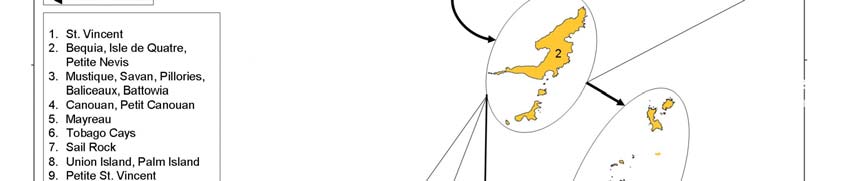
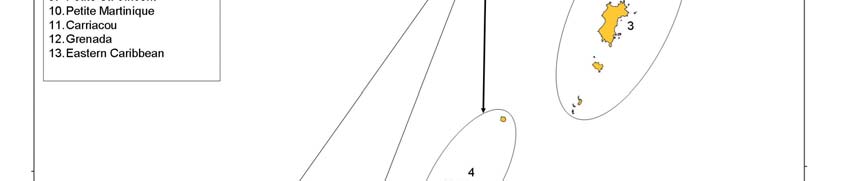


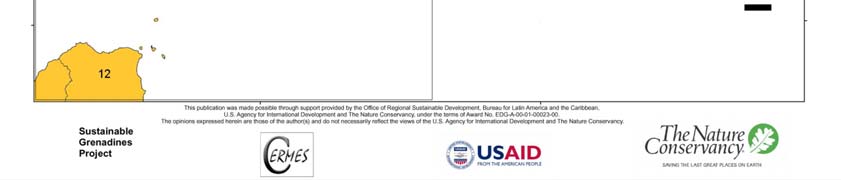
Figure 4.14 Map illustrating the location and intensity of fishing around the Grenadines by fishers based in
Bequia
36
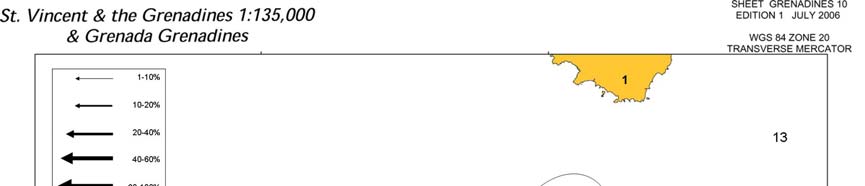


Figure 4.15 Map illustrating the location and intensity of fishing around the Grenadines by fishers based in
Mustique
37

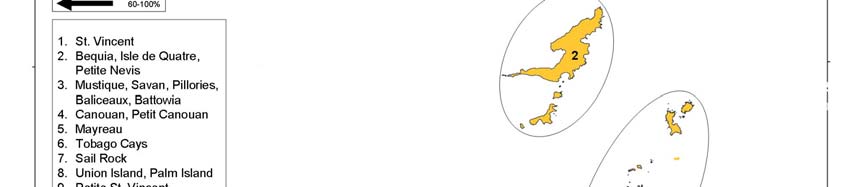


Figure 4.16 Map illustrating the location and intensity of fishing around the Grenadines by fishers based in
Carriacou.
38
5 IN-DEPTH SURVEY (PHASE II): RESULTS AND DISCUSSION
This survey involved 64 fishers and was designed to give a more in-depth look into the socio-
economic characteristics of the fishers.
5.1 Demographic information
Similar to the results of the initial survey, the age distribution of interviewed fishers was
approximately normal (Figure 5.1). The average age of fishers was 45 years, who have fished for
an average of 23 years. All of the age groups except the 11-20 and 81-90 were encountered in
this phase (Figure 5.1) and all of the respondents were male. The predominant religion found in
this study was Roman Catholic followed by Anglican and Pentecostal (Figure 5.2). Roman
Catholics dominated
35%
islands such as
Mayreau and Petite
30%
Martinique where all
of the respondents
25%
were members of that
ncy
e
religious group.
20%
Sixteen percent of the
Frequ
interviewees stated
15%
that they were not
Percent
part of any religious
10%
group. Almost � of
the respondents were
5%
Afro/Negro/Black
with Mixed and East
0%
Indian making up the
21-30
31-40
41-50
51-60
61-70
71-80
Age Groups
remainder (Figure
5.3).
Figure 5.1 Age distribution of fishers sampled during the in-depth survey
35%
30%
25%
uency
q 20%
e
15%
r
cent Fr
e 10%
P
5%
0%
l
n
n
e
y
olic
a
t
a
a
i
s
t
t
i
s
t
nal
ma
h
-
d
c
os
non
n
n
io
apt
Ro
nglic
e
v
e
lt
i-
at
B
Cat
A
nt
v
e
u
n
e
Se
Ad
m
P
omi
den
Religion
Figure 5.2 Percent frequency of the types of religion of the interviewed fishers
39
Mixed
25%
East Indian
2%
Black
73%
Figure 5.3 Ethnicity of fishers interviewed in the in-depth survey
5.1.1 Education
The majority of fishers have obtained up to primary education with only 32% reporting
secondary or post-secondary education (Figure 5.4). In Bequia there was some difficulty in
assessing the level of education of the fishers. It appears that a large number of the fishers
attended a government `primary' school until they were 15 years old and it is unclear if the
curriculum contained teaching that would be considered secondary level. Therefore the education
data from Bequia was excluded from the analysis where a large portion of interviewees left
school at this age. It most be noted however that the only fisher in this survey to attend a
technical learning institution was from Bequia.
Post-
Secondary
2%
Secondary
30%
Primary
68%
Figure 5.4 Level of education of fishers surveyed in the Grenadines
Secondary education is not available on every island (e.g. not in Mayreau, Petite Martinique) and
parents have to send their children to school by boat to other islands. One Petite Martinique
fisher described the great financial burden of having to send his children to Carriacou each day
by boat so that they can attend secondary school. Most of the secondary schools in the
Grenadines were recently established which would have made it more difficult for fishers thirty
40
years ago to obtain secondary education. Some also said that due to financial problems within the
household, they were required to enter the workforce (i.e. fishing) at a young age. One of the
fishers stated that even now fishers lack access to tertiary education. He believes that this lack of
access is a limitation to fishers being able to better sustain themselves with regards to fishing and
to manage their money effectively.
5.2 Household composition
One third of the fishers surveyed were married
and 58% were either single or had a common-law
Common-law
partner (Figure 5.5). For the fishers who
14%
provided information (n=14) on dependents in
the household (even though it was not asked in
Divorced
the survey), the number of dependents was on
8%
average 5.6 and ranged from 2-9 children. Eighty
Single
45%
percent of the fishers were the head of their
households and on average there was 1 other
person in the house who also had a regular
source of income. Only 9 of the 64 respondents
stated that they lived in a household with another
fisher.
Married
33%
Figure 5.5 Marital status of fishers interviewed in the in-depth survey
5.3 Material style of life
Fifty-five percent of the interviewees owned the
Rented
house they lived in (Figure 5.6) and half owned
10%
the land that their house is upon. All houses
have galvanised roofs and majority of the outer
Family/friends
35%
structures are concrete walls (58%) (Figure 5.7).
The predominant flooring type is cement (55%)
followed by wood (Figure 5.8). Information was
collected on select household items during the
interview. Figure 5.9 shows the percent of
respondents possessing various household
Owned
items.
55%
Figure 5.6 Ownership of households of fishers interviewed
41
Tile
3%
Wood
37%
bare wood
40%
Concrete
cement
58%
55%
bare
Concrete/wood
wood/cement
5%
2%
Figure 5.7 Wall material of the households of the fishers Figure 5.8 Flooring material of the households
100%
90%
y
80%
e
nc
70%
u
60%
eq
50%
t
Fr
40%
c
e
n
30%
20%
Per
10%
0%
ty
e
TV
e
er
ator
VD
trici
chine
put
Vehicl
lephone
Stov
R/D
Elec
dger
Te
VC
Com
Refri
ashing Ma
W
Household items
Figure 5.9 Percent frequency of household items of fishers interviewed during the in-depth survey
Almost all of the fishers had a stove and over 70% had electricity, television, telephone and
refrigerator (Figure 5.9). Vehicles were not practical as the islands were small and many used or
shared boats and vehicles as their means of transport. Most of the fishers with vehicles were
found in Carriacou and Bequia (the largest of the islands). As a result of the water scarcity on
many of the islands, washing machines were not frequently used, especially in the Vincentian
Grenadines. Computers were also not very popular household items and almost all were found in
the Grenada Grenadines (Figure 5.10). Overall, from the data collected, the fishers in the
Grenadines appear to have a quite comfortable standard of living.
42
100%
90%
80%
70%
s
60%
i
s
her
F
Grenada Grenadines
50%
of
St.Vincent Grenadines
40%
ercentP 30%
20%
10%
0%
ne
D
ter
tricity
hicle
TV
ove
hi
rator
DV
pu
ec
Ve
ac
El
Telephone
St
g M
fridge
Com
in
VCR/
Re
ash
W
Household materials
Figure 5.10 Percent frequency of household items owned by fishers in the Grenada Grenadines vs. the
Vincentian Grenadines
5.4 Occupations and dependency
Seventy percent of the respondents stated that they earned all of their money from fishing (see
Table 5.1). This was similar to the findings in Phase I. Only 11% of the fishers had a primary
occupation other than fishing, 4.7% of these other occupations were marine based.
Table 5.1. Table showing the primary occupations and its proportion of the annual income of the individual
fishers in this study
Proportion of
Primary Occupation
Percent of Respondents
Income
Fishing
100% 70.3%
Fishing
1/2 3.1%
>1/2 15.6%
Total
89.1%
Maritime and Trade
Boat repairs, maintenance
>1/2
1.6%
Sailing >1/2
1.6%
Shipping >1/2
1.6%
Total
4.7%
Skilled Labourer
Carpentry <1/2
1.6%
Labourer 1/2
1.6%
Total
3.1%
Tourism
Vending: t-shirts
>1/2
1.6%
Total
1.6%
Other
Bar operation
>1/2
1.6%
Total
1.6%
43
Fifty-nine percent of the fishing households have a fisher that is solely dependent on fishing and
is the main income provider. As most of the spouses and partners of the respondents stayed at
home, fishing is the sole income source for many households in this study. Seventy-five percent
have a marine/tourism based occupation as a main income earner for the households (i.e. fishing,
sailing, boat building, t-shirt vending). Twenty-eight percent of the interviewees had more than
one other job but only 1 respondent reported three jobs. Some of these included construction,
gardening, sailing, water-taxiing, mechanics and chartering. This highlights a major vulnerability
as many of the fishers are not taking part in any other jobs other than fishing.
Fifty-eight percent of the persons interviewed were boat owners and 40% crew members (2%
were not identified). As seen in the Phase I, a greater proportion of boat owners were solely
dependent on fishing than crew/shore fishers and thus it appears that more crew members/shore
fishers have other jobs as their primary occupation.
5.5 Share systems
The most common share system that was encountered was all the fishers get an equal share with
a share going to the boat and a half or whole share going to the engine (after fuel expenses). This
is consistent with the findings of Chakallal (1994). Only a few crew members expressed
dissatisfaction with the share system on their boat or that owners are taking advantage of them.
Some of the other share arrangements encountered were: (1) owner gets 1/3 of crew's catch
(after expenses), (2) crew pay $2/kg for the "boat keeper" (person who stays on board the boat
during spear/scuba diving), (3) � of earnings to the gear (seine net), � of earnings distributed
among owner and crew.
5.6 Cleaning and servicing
To get an idea of some of the possible environmental impacts of fishing (mainly marine
pollution), fishers were questioned on their boat and engine cleaning/maintenance practices.
Boat cleaning
Most of the fishers usually bring their boats on the docks after selling their catch to empty gear
and clean the boat after each trip. Very few fishers do not clean after each trip but in less
frequent intervals (e.g. every weekend). For those who fish from areas without docks, the
cleaning is performed in the nearshore. The most common cleaning agent is a liquid
soap/detergent commonly called "squeezy" (due to being dispensed from soft plastic bottles).
Some of the fishers use disinfectants and bleach along with the liquid soap. This is mixed with
seawater or freshwater to rinse the boat of fish offal and debris.
Engine Servicing
Almost all the respondents service their engines themselves and the majority do it at least once
every month (62%). There was no standard method of engine servicing used by all boat owners.
This ranged from using the basic water repellent lubricants such as WD-40 to spray on the
engine to checking and replacing spark plugs and cleaning filters. It is not clear if these methods
are sufficient to ensure the proper maintenance and running of the engines. Most of the engines
are repaired and serviced professionally only when absolutely necessary.
Boat Painting
Fifty-nine percent of the respondents paint their boats every year or more frequently. Most
fishers chose to clean their boat once a year during the "off season" (i.e. out of lobster season).
This process usually involves sanding to remove old paint and algae, the removal and repair of
44
fibreglass and finally the repainting of the boat. It appears that this process is performed on the
docks or at the nearest haul out site. The most common paint that is used is a marine, anti-fouling
paint which is toxic in nature. There have been some initial efforts to by SusGren to introduce
and encourage the use of other less toxic paints but have not been fully implemented at the time
of this study.
5.7 Coastal and marine activities
5.7.1 Target species
Figure 5.11 shows the percentage of respondents which target the different fish groups. As seen
in phase I, demersals are the species of choice, followed by lobsters and offshore pelagics. Only
two turtle fishers and one whaler were interviewed during this stage.
45%
40%
35%
30%
uency 25%
20%
nt Freq
rce 15%
Pe 10%
5%
0%
Demersal
Lobster
Offshore
Conch
Inshore
Turtles
Whales &
Pelagics
pelagics
Purpoises
Species Group
Figure 5.11 Percent frequency of fishers (interviewed in Phase II) targeting the various species groups
5.7.2 Limitations
Figure 5.12 shows the average catch for each species group. However, fishers expressed great
difficulty in determining their average catch. Fishers would state what a "good fishing day's
catch" and a "bad fishing day's catch" would be and then an estimation between that figure
would be created. As such, this data was not combined with other variables to be used in further
analysis such as: total landings, average annual catch, average catch by fishing ground and
average gross earnings per species. An expected bias would be that fishers would understate their
catch so as to give an opinion of less earnings. The opposite was also observed where fishers
drastically overstated their catch, possibly to give a better impression of their fishing skills.
Information that was obviously misleading or was completely contrary with the information from
key informants was discarded (i.e. data from 2 in depth surveys). However, to ensure that the
average values were not entirely inaccurate, an average weekly wage of a typical fisher was
created and compared to other data collected in the concurrent livelihood study. Gross weekly
earnings for a typical fisher were calculated using the following formula:
45
Estimated Weekly Earnings =
Avg. Catch x Avg. Price Received X Avg. Fishing trips per week
Avg. Crew
Using this equation, the average demersals fisher would make EC $500 per week. This is
significantly lower than the average weekly catch earnings found in the livelihood study
conducted by Staskiewicz in 2006 (EC $943.86). However, the average daily catch for
demersals fall within the range (18-45 kg) given in a previous study (Chakallal et al. 1994).
450
400
350
300
250
a
tch (kg)
e C 200
a
g
v
er 150
A
100
50
0
Conch
Demersals
Inshore pelagics
Lobster
Offshore pelagics
Species Group
Figure 5.12 Average catch of fishers in the Grenadines by species group
The average fishing trip (in hours) given for each species group was measured from the time of
leaving the mooring/dock to the time of landing (Figure 5.13). This was a rough estimate and
trips reported for some target species were relatively similar (e.g. demersals) and while others
varied greatly in duration (e.g. offshore pelagics). Again it was difficult to isolate the hours
fished by type of fishing as fishers used more than one technique to capture the same species on
a single trip. To gather this information would have made the interview process too complicated
as the fishers had already showed difficulty in giving adequate detail for the current survey.
Figure 5.13 shows the average hours fished for each species group.
46
30
25
d
20
f
i
she
s
15
age hour
er 10
v
A
5
0
Conch
Demersals
Inshore
Lobster
Offshore
Turtle
whale
pelagics
pelagics
Species group
Figure 5.13 . Average hours of fishing for each type of species
5.7.3 Fishing techniques
Conch is fished by free/scuba diving and thus the fishing effort is limited by the amount of air in
the tank and/or by the dive limits of the human body. The average catch was 47 kg and is usually
fished for 2-3 hours.
Demersals are fished using a variety of fishing techniques. These are (in order of usage):
handlining, spear fishing with/without tanks, traps and sinking palang/bottom longlining. This
resulted in a range of catch sizes and effort. Trap fishers would usually fish only 3-4 times a
week for about 2-3 hours whereas handliners could sometimes fish up to 9 hours a day, 6 days a
week. The most common catch and effort would be 14-23 kg and fishers would leave around 5-6
am and return around 11am-12pm.
Inshore pelagics are fished for an average of 2.4 hours and an average catch of 406 kg was
calculated. However, it must be noted that other fishers disagreed with this number stating that it
is too large (no alternate was given). These were caught using the seine nets close to shore or
attached to the beach. This would require a crew of at least 4-6 persons in order to manage the
gear. It must be noted that these species are also caught in smaller quantities by cast net by most
fishers to be used as bait.
Offshore pelagics were caught in boats ranging from small 17 foot (5.2 m) cigarette boats to
larger 30 foot (9.1 m)sloops. Most of the smaller boats used the floating, homemade palang or
tow a floating handline whereas the larger boats would tend towards the more widely used
standard longline gear with multiple hooks, reels and perhaps hydraulics. The average time of
fishing ranged from 3 hours (towing) to one week trips on longlining ships. During the
community workshops, fishers (mostly small boat fishers) noted that the average catch for
inshore pelagics appeared to be too large. As these two groups were clumped together, the catch
values may be skewed by the few larger vessels that would catch thousands of pounds on each
trip (average =1083 kg) and overshadow the catch data of the smaller vessels (average = 63 kg).
Towing was by far the most preferred technique for catching this species group.
47
Over half of the lobster fishers interviewed used traps followed by 32% using scuba. As stated
earlier, the Vincentian government has been promoting the use of traps to reduce the amount of
dive injuries from lobster fishing with scuba usually caught using a loop to hook around the
lobster to catch it. Other techniques not as commonly used were freediving, trammel net and gill
nets. Gill nets are left for an extended period of time on the reef and it traps fish which die and
rot in the net. This scent attracts the lobsters and they climb and get entangled in the net trying to
reach the fish.
Turtles are caught either in the water by divers with spear or as they come to nest on the beach.
One fisher reported that the location of a fishing camp in Petit Tabac, Tobago Cays was a good
location for capturing nesting females. Usually 1 to 3 turtles are caught at a time each estimated
at 68 kg. It was stated by a fisher that turtles are shot with the spear and left in the water
wounded for sometimes over a week until the fishers are ready to leave the camp and head back
to the home dock.
Whaling has been a controversial issue and during this study only one whale fisher was
encountered. His estimates were that an average trip would last about 12 hours and that a normal
sized whale would be about 60-70 tons. These are caught using the traditional harpoon in a small
double-ender boat.
5.7.4 Fishing intensity
Overall, the average number of fishing trips per week was 5 and virtually all the fishers fish only
once a day. All except 4 fishers stated that they fish 6 days a week and almost never on Sundays.
Fishers also would not fish if weather conditions seem to be inappropriate (e.g. storms) or when
the "tide is hard", indicating a strong current. This would prevent mainly handliners and divers
from remaining over a fishing spot for a long duration and fishers say that fish would hide under
rocks and crevices with strong currents, thus reducing catch success.
Due to the multiplicity of the types of fishing employed, it was difficult to determine the average
fishing intensity by type. However, from informal interviews with the fishers, it seems as if the
trap fishing averages about 3-4 trips per week, handlining, spear, scuba, bottomlining, towing,
palang and seine about 6 days a week and surface longlining from 1-3 trips (this varies with
length of trip which can be up to 2 weeks).
As combining all the fishing trips per week over the year did not reveal any significant trends,
the 4 graphs below were created only to show some of the most common temporal fishing
patterns (Figure 5.14).
The lobster season seems to be the most significant factor that affects monthly fishing intensity
of artisan fishers in the Grenadines. Graph A is common for a part-time fisher or a lobster trap
fisher. During the lobster season, (September to April) this fisher would go 3 times a week to set
the traps for lobsters, leaving 1-3 days soak time before returning to haul the traps. During the
off-season (May to August), the fisher will resort to using handline or spear to generate income.
During this time the fisher will fish more intensely to generate more income as demersals do not
generate as much profit per kilogram as lobster (Figure 5.15). Graph B shows the typical part
time fisher (who usually has another occupation) who only fishes during the lobster season using
traps. Many seem to enter the fishery only during lobster season as this species has the highest
value per kilogram. Graph C represents the most common type of fisher encountered which is a
the typical full time fisher who fishes from Monday to Saturday and does handlining, spear,
trolling, etc for species groups such as demersals, pelagics, etc. During the lobster season this
fisher will use traps, scuba or free dive for lobsters on some days and continue to fish for other
48
species on other days. Graph D shows the trap fisher and/or part time fisher. This fisher will
usually target demersals and lobster (when in season) and is normally a crew member or a shore
fisher.
During the lobster season, both owners and crew/shore fishers fish on average 5 times week but
during the off-season, boat owners fish about one more trip a week. It is difficult to confirm that
this is due to boat owners fishing more or if it is due to the type of fishing (e.g. trap fishers go out
3 times a week, handliners, scuba divers go out 6 days a week).
Demersals, conch, offshore and inshore pelagics were generally fished all year round. One major
seine fisher from St. Vincent would fish for offshore pelagics during February to May to
coincide with the high point of that season (Mohammed & Rennie 2003). Whales, turtles and
lobsters were fished during their open season and no fishers said that they fished these species at
any other time. Again, this may not be entirely accurate as there were some reports of out of
season fishing and the fishers might have been fearful of being reported to the authorities.
7
7
A B
6
6
5
5
4
4
3
3
2
No. trips per week
2
No. trips per week
1
1
0
0
J
F
M
A
M
J
J
A
S
O
N
D
J
F
M
A
M
J
J
A
S
O
N
D
Month
Month
7
7
6
6
k 5
5
C D
wee
week
4
e
r
4
p
3
r
ips
ips per 3
No. t 2
2
No. tr
1
1
0
0
J
F
M
A
M
J
J
A
S
O
N
D
J
F
M
A
M
J
J
A
S
O
N
D
Month
Month
Figure 5.14 The four most common fishing intensity patterns for a normal year
5.7.5 Fishing grounds
There were no real patterns or trends when associating fishing grounds with particular species
groups. Data on the spatial fishing practices was gathered during Phase I which reported on the
fishing grounds used by fishers on each island, but they cannot be separated by target species.
Anecdotal information was given by the fishers on some of the "good" fishing ground. For
example, Sail Rock was said to be a prime location for offshore pelagics and off the bank reefs
off of Mustique, Carriacou were good location for demersals species. This information will be
collected in detail during mapping exercises to be conducted by Kimberly Baldwin of CERMES.
49
5.8 Fish marketing
5.8.1 Demand
There was a visible difference in the demand for fish at the landing sites in Carriacou and those
in the St. Vincent side (e.g. Bequia and Union Island). During an observation one morning at the
Hillsborough fish market, persons were seen "claiming the fish" even before the fishers got to
the market. Some fishers sold all of their catch within minutes of reaching the market. However
in Union Island, the fishers were complaining that their catch would often spoil because of lack
of demand and storage facilities. One fisher told of a case where a fisher brought in 136-181
kilograms of dolphinfish (Coryphaena hippurus) and was forced to beg a restaurant owner to
store the fish as there weren't enough buyers for the catch. Fishers in Mayreau have
demonstrated a great reliance on the trading vessels due to a lack of demand onshore. Cultural
events such as the Fishermans' Day competition in Bequia (see Section 3.2.1) significantly
attracted a large crowd with a high demand for fish. Large crowds of locals and tourists would
gather around the boats to purchase fish even before the fisher can weigh his catch.
5.8.2 Market information by species type
Figure 5.15 shows the range and the average price received per kg of the different species. Some
of the values seem to be overestimated or underestimated, for example, fishers who sold
demersals to the same
25.00
trading vessel stated
they received EC $5,
$9 and $10 per kg.
20.00
)
Despite this, the
C
E
($
average price of
l
b
15.00
demersals seemed to
be consistent with
ved per
those given by key
cei 10.00
informants.
r
e
r
i
ce
P
5.00
5.8.3
0.00
Conch
Demersal
Inshore
Lobster
Offshore
Turtle
whale
pelagics
pelagics
Species Group
Figure 5.15 Range and average price received per kg for the various fish groups
The average price for conch is EC $17.60 per kg (Figure 5.15). It must be noted that fishers
disagreed with the maximum price given for conch ($33 EC), stating that it was too high. Only a
few fishers (10.9%) were encountered that actively fish this species. Conch is mostly sold locally
and sometimes sold to other islands to be exported regionally.
50
The average price for demersals is EC $11.79 per kg and is the most popular fish group caught
and sold. More than half of it is sold to trading vessels followed by approximately � selling their
catch on shore (Figure 5.16). Fishers get a higher price for demersals on shore (EC $13.20- 15.40
per kg) than on the trading vessels (EC $10 per kg). Snapper receives a higher price (EC $11 per
kg) than other species on the trading vessels. Very few stated that they sell to tourists, even to
local restaurants. However this may not be the case as it was observed that quite a few restaurant
workers greet the vessels on
1-1
1- 0
1 %
0
shore and take the fish back to
Demersals
the restaurants.
10-20
2 %
The average price for inshore
20-40
4 %
pelagics is EC $7.60 per kg.
Inshore pelagics are sold on
40-60
6 %
shore all over the Grenadines.
60-100
-10 %
These seem not to be popular
Local
o
fishers
fish for tourists and are mainly
Un
U kn
k ow
n
n
ow
sold on the local market. Some
fishers take these fish back to
Shore
Trading ve
g v ssels
St. Vincent where they are sold
(locals & ve
v nd
e
ors)
in the market for about EC
$6.60 per kg. This species group
Export market
o
is also sold to longline vessels
Hotels
for use as bait.
Restauran
a ts
t
Tourists/
Yachters
Figure 5.16 Customer preference of demersal fishers in the Grenadines
Lobster, although is the second most traded species on the market, holds the highest sale value.
The average price for lobster is EC $24.65 per kg. However, this is not consistent for the entire
season as it is often sold at EC $22 per kg at the beginning of the season and sometimes up to EC
$30.80 per kg at the end when landings become scarce. Some fishers therefore do not enter the
fishery till later in the season when profits are higher. Lobster is sold to tourists and yachtees at a
higher price (up to EC $44 per kg). Almost half of the respondents say they sell lobster to be
exported to Barbados and/or Trinidad (Figure 5.17) at around EC $22-$26.40 per kg. Other
export countries include the United States and Martinique. Few of the respondents stated that
they sell directly to tourists on shore or to yachts. Many restaurants and businesses (e.g.
Mustique Company) buy the fish to sell to tourists.
Almost half of the respondents stated that they sell offshore pelagics on shore or to the
government. In Grenada, this is then exported to the U.S.. Some are also exported to Barbados.
Very few are sold to the trading vessels and the average price of offshore pelagics is EC $13.39
per kg.
All of the respondents who stated that they fish turtles were from Bequia. The average price of
turtles is EC $11.00 per kg. The turtles are sold to local residents and there seemed to be no cases
of turtles being sold for export or to tourists.
51
As with turtles, all the whale meat is sold locally in Bequia at EC $11.00 per kg. This is a
community event where locals would come from all over the island to purchase meat from a
landed whale.
1-10%
Lobster
10-20
2 %
20-40
4 %
40-60
6 %
60-100%
Local fishers
Un
U kn
k ow
n
n
ow
Shor
S
e
hor
Tra
Tr d
a ing
in
Exporters
o
(l
( oca
oc l
a s &
s
& ve
v ndor
e
s
ndor )
s
ve
v ssels
Expo
x
rt market
Hotel
e s
Tour
T
is
our ts
is /
ts
Purc
u hasing
Yachters
companies
Restauran
a ts
Figure 5.17 Customer preference of lobster fishers in the Grenadines
5.8.4 Market information by buyer
Almost 50% of the respondents sell their fish to trading vessels for export and all the fishers
interviewed in Mayreau sell to trading vessels. This shows that trading vessels play a vital role in
sustaining the livelihoods of fishers in the Grenadines. About half of the fishers also land their
fish on shore either in their base island or in other islands. One third of the respondents sell to a
purchasing group (i.e. Canouan Fisheries, Mustique company, government, vendors in
Kingstown). These seem to be chosen because of their proximity; that is, namely all the fishers in
Mustique sell to the Mustique company and fishers who sell fish to the St. Vincent vendors are
from the northern Grenadines.
Fishers in Bequia seemed to have chosen to sell to many different buyers. Here they sell on
shore, export, tourists, restaurant, hotels, vendors in St. Vincent and sell on many other islands.
However this may be just because more fishers were sampled in this island and would have to be
confirmed in future studies. In Bequia, about 60% of the respondents sold their lobsters to a local
fisher who arranges for the lobster to be exported to Barbados. Here 70% of the fishers sell to
trading vessels. In the southern Grenadines (Canouan, Carriacou, Petite Martinique, Mayreau,
Union Island), most fishers sold their catch on shore.
5.9 Market orientation by fisher preference (reliability, price, convenience)
The majority of fishers said they prefer to sell to trading vessels because they are reliable buyers
and it was the leading buyer of fish. None said it was because of price and few said it was
because they were convenient. Most of the ones who said it was convenient were from
Carriacou. These were the trading vessels located on the north-eastern side of the island in
52
Winward close to shore where the fishers would return and dock. Prices received from trading
vessels have increased over the years. In 1994, the average purchase price received for demersals
was $7-8 per kg (Chakallal et al. 1994) and is now $10 per kg. Inshore pelagics were $3-4 per kg
and is now about $7.59 per kg. Most of the fishers sell on shore because it is more reliable (i.e.
regular buyers), even though there seemed to be less of a demand for fish in the Vincentian
Grenadines on shore.
Few stated that price was a driving factor for selling fish to a specific buyer. Out of all the
locations, restaurants were the choice location for price received (n=6) followed by the Canouan
Fisheries (n=4). Some saw the export market (not including the trading vessels) as being reliable
(n=13) and very few sold it there because of price (n=3). Most Mustique fishers sell to the
Mustique Company because it is convenient and restaurants are seen to be convenient as well.
5.9.1 Tourist sector
On all of the islands, only a small amount of fishers sold their catch directly to tourists, hotels or
yachts. However, as the tourist season coincides with the lobster season, which increases the
amount of potential buyers in the islands. During lobster season, the demand increases
drastically. Restaurants, hotels, locals, tourists and importers from the region all purchase from
the fishers at this time.
Fishers in Mustique benefit directly from the tourist industry through the Mustique Company,
who appears to buy a large portion of their fish. It was also observed on this island that tourists
would come directly to the fishing village and purchase fish for consumption or bait for game
fishing. Fishers in Union Island and Mayreau were the only ones observed selling to yachts
which are most likely those found in the Tobago Cays. However, it is likely that quite a good
portion of fishers from other islands surrounding the Cays sell to the tourists as well. Water taxi
operators buy the fish from them and sell at higher prices to persons on yachts. One fisher saw
this as a threat and thought the exorbitant prices would drive the tourists away from buying local
fish.
5.10 Physical capital
During the assessment of the physical capital of the fisher, most of the fishers were able to give
reasonably sure values of their boats and engines. However, the estimation of the value of gear
was not as accurate and many had to guess what their gear was valued. All of the following
values did not account for depreciation and therefore the initial cost of the gear was used.
5.10.1 Boat and engine
The average boat cost was about EC $14,000 and the average engine cost was approximately
EC$10,500. In the Grenada Grenadines, a few fishers were able to purchase engines duty free
from islands such as St. Marteen. This could explain the larger boats and engines that are found
in the area.
5.10.2 Gear
As stated earlier, it was difficult to assess the average gear better than a gross estimation as many
gear items (ropes, safety equipment, traps) were not quoted. Handliners had the lowest gear costs
(approximately EC $40-$100) compared to longliners and those with expensive gear. Palang nets
for demersals and offshore pelagics was rather expensive and could cost up to EC $1,000. This is
a very high risk investment as some of the more experienced fishers stated that they have lost
entire palang nets on one fishing trip. Seine nets are also extremely expensive and one fisher
estimated the cost of his net at EC $35,000. The average scuba diver owned his own regulator,
53
Buoyancy Control Device (BCD), spear gun, mask and fins and would usually rent scuba tanks
for about EC $10 per tank. This gear was valued around EC $2,000-$3,000. The cost of traps
depended on the materials and the maker. However, most fishers stated that they cost about EC
$450-600 per trap and many voiced their concern at the high costs of the chicken mesh wire and
the theft of traps by other fishers. One fisher in Mayreau said that he had to stop using fish traps
because of the theft and switched to other types of fishing. Along with the cost of traps is the
costs of buoys, ropes, etc. which could add another EC $50-$100 to the cost of each trap. Fishers
owned a range of 11 up to 30 traps and stated that because of natural damage and theft that they
would have to make/purchase new traps each year.
VHF radios were extremely expensive due to the requirement to purchase a license, which was
stated by one fisher to be EC $1000. This could significantly reduce the availability of this
important safety gear to the lower income fishers. Most fishers use cellular phones too as a
backup means of communication, some going as far as using two cellular phones, one with each
service provider. These phones would cost about EC $60-$200 each. Fishers were complaining
of the rising cost of gear (e.g. increase in the cost of a spear gun by over EC $100 in a few
years). They also complained about not enough competition in the fishing supply industry and
merchants are making high profits on gear. This should be investigated so as to ensure that
fishers are not being taken advantage of.
5.11 Expenses
5.11.1 Trip expenses
The responses for the trip expenses appeared to be relatively consistent. The average amount of
fuel used by the smaller crafts that remain within the Grenadines is 10.2 gallons. When the cost
of oil is added, the cost of fuel was on average EC $118.39 per trip. For fishers travelling outside
of the Grenadines (longliners), the average fuel used was 214 gallons, costing EC $2,214 (oil
included). Fishers complained of the rising costs of gas and oil and it ranged from EC $9.50 -$12
per gallon. Some fishers argued that fish are sold at the same price but the effort and the costs of
fishing differ with type (e.g. demersal trap fisher using less gas than a demersals handlining
fisher).
The average gear cost per trip is EC $57.30 and this would include items such as ice, scuba tanks
and scuba gear. Ice was very expensive as water is scarce. In the Vincentian Grenadines, ice is
sold in very small containers whereas in Petite Martinique it can be bought in large quantities at
a much cheaper rate due to the presence of an ice machine on the island. The average food cost
per trip is EC $40.50. Fishers would take a small lunch for the trip that was prepared at home.
Bait was usually caught by cast nets the day before and rarely would purchase it from other
fishers. Longliners however would regularly purchase over EC $50 in bait for each trip from
seine net fishers.
5.11.2 Recurrent expenses
Estimates of annual repairs and gear costs were both dependent on the memory of the fisher and
were estimated from recent major expenses. From repainting costs to buying more hooks, these
expenses would vary greatly and many fishers do not keep account of smaller purchases and thus
descriptive statistics such as averages will not be very accurate. An estimation based on the
normal costs of repainting the boat and engine servicing alone (using the given costs of
materials) is around EC $2,000 per year while the average of the figures given by the fishers
(estimates of yearly expenses) was EC $1,847. Boats are repainted and fiberglassed usually once
or twice a year and engines are serviced professionally when needed.
54
Gear purchases are more consistent and could have possibly been more accurate than repair
costs. The average gear cost was estimated at EC $1,817. Most of the fishers caught their own
bait and rarely was this item bought. Some of the more common other gear that was used was
scuba tank and gear rentals, and ice. Repairs to gear often takes the form of purchasing new parts
such as more fishing lines, new spears for the spear gun and new hooks. The gear costs of
handlining, trolling and spear fishers were lower than those of palang, scuba and longliners.
Most fishers seem to repair their own net which is a very important skill to reduce costs. Many
fishers attempt to service their engines and repaint/fiberglass the boat themselves as well, rather
than getting it done professionally. Again, if the fishers possess the skills to do these effectively,
this can significantly reduce expenses incurred. Also, proper maintenance of gear is another
method that can help fishers save money.
6 CONCLUSION AND RECOMMENDATIONS
The information collected during this study and discussed in the previous three chapters
highlights some issues that should be of high priority for managers of Grenadines fisheries and
other stakeholders or interested parties to address.
6.1 Demographics and stakeholder characteristics
Older fishers depend more heavily on fishing whilst younger fishers appear to have more
options. This puts the older fishing generation at considerable risk. The lack of pension schemes
for fishers makes it difficult for them to exit the fishery and many have stated that they have to
continue fishing as there is no other source of income for them at their age. There were also
cases of fishers saying that they were too old for other lines of work and were forced to enter the
fishery to generate income. These fishers usually go towards the demersal/handlining industry
which is showing signs of a continual decline in catch due to overexploitation of the resource. If
a pension scheme was established for fishers, this would protect the livelihoods of these older
men many of whom fish until their health fades.
6.2 Resource use patterns
6.2.1 Demersal fishery
The demersal fishery is clearly the most important and also a severely overexploited fishery in
the Grenadines (Food and Agriculture Organization 2002b). Resource managers should design
and implement monitoring programs that gather data on the ecological status of stocks and the
effort and landings by the fishers in the Grenadines for fishery assessment purposes.
Rigorous stock assessments need to be carried out to assess whether the less targeted species can
be sustainably harvested. Once this is completed, effort should be put into exposing fishers to
and training them for other types of fishing that target less exploited species. Although there
have been attempts by fisheries managers to do this, some fishers believe that more effort should
be placed into accomplishing this objective, especially in the Vincentian Grenadines. Major
hurdles of entering a new fishery include training in the fishing techniques, the starting capital to
purchase boat and equipment, and the availability of appropriate fishing gear. This however have
been more successful in the Grenada Grenadines.
6.2.2 Reducing vulnerability
Safety at sea is an issue that many fisheries managers around the world have to grapple with and
a considerable number of fishers appear not to use all the necessary safety equipment. Also many
of the fishers SCUBA dive without having had professional training and this has resulted in
many suffering from dive related injuries. With proper training, fishers would be more equipped
55
to protect themselves and others as they carry out their operations. Insurance is another important
issue that needs to be addressed by the fishers and government. Many of the fishers who do not
have (life) insurance have dependents and spouses who rely solely on them for income.
Building the resilience of fishers within the industry is also vital and basic steps can be taken to
ensure that fishers possess the knowledge and skills to protect their livelihoods. For example, the
Vincentian government recognised the vulnerability of fishers to hurricanes and published an
informational booklet on "Hurricane Tips for Fishers" which provides fishers with instructions
on how to secure their boat and gear before a natural disaster. Also in 2005, the Ministry of
Fisheries in Grenada provided monetary contributions to fishers who received losses to their boat
and gear (Government of Grenada 2005).
6.3 Market attributes and orientation
Exports to Martinique represent a large proportion of sales of Grenadine fishers and are thus a
major income source for fishers. It is therefore imperative that the government of St. Vincent &
the Grenadines work to ensure that they improve the infrastructure of the markets so as to meet
the European Union standards. However, caution must be exercised as this may encourage more
to rely on the overfished demersal stocks. With information on which fish stocks that could be
sustainably harvested, marketing options can be researched at the local, regional and
international level so as to create a demand for a less exploited species. In the Vincentian
Grenadines, a large proportion of fishers believe that supply exceeds demand in the local market.
Many fishers complain that they are unable to sell all of their catch which leads to the spoiling of
fish in some cases, and that the earnings from a day of fishing are too little. The marketing of
offshore pelagics from the Vincentian Grenadines is a potential option with sustainable
harvesting being one of the key fundamentals of the fishery and marketing planning.
6.4 Material style of life
Fishers in the Vincentian Grenadines would often complain of barely being able to survive
financially due to lack of government support. Despite this, fishers in all of the islands appear to
have a reasonably good standard of living. In the Grenada Grenadines the standard of living
appears to be even higher. This may be due to the additional support received from the
government or to the fact that more economic activity occurs in islands such as Carriacou and
not a reflection of the fishing industry.
6.5 Sectoral coordination
Fishing is one of the most important economic, social and cultural drivers in the Grenadines and
plays a vital role in maintaining food security. It is therefore imperative that decision makers
pay close attention to the management of this integral sector. Many fishers in the Vincentian
Grenadines believe that governments are not concerned with the problems facing the fishing
industry. With the increase in fuel prices and other rising costs, many fishers are pleading for
assistance through the subsidising of fishing costs, increased price received for fish and the
improvement or access to facilities and amenities. Projects such as the building of the fishery
complexes by the Japanese were not done in consultation with the fishers and are now scarcely
used and are an economic burden for the sector. This could have been avoided if management
and planning were inclusive and transparent to the fishers as well as to other civil society
organisations and the facilities were constructed to meet the current needs of the fishers.
Education and raising awareness within the fishing community is imperative for their
involvement in conservation efforts and so they can participate in planning from an informed
position. Fishers have already expressed interest in learning organisation skills, conservation and
56
management (CERMES 2006) and education would help raise awareness to promote more
sustainable fishing practices (e.g. no anchoring on reefs). More consultation and collaboration
between MPA managers and the fishers where the latter are able to participate in the planning,
objectives and management of the MPAs would drastically increase the effectiveness of parks in
meeting the needs of the community and compliance by the resource users to the regulations.
With the establishment of more fishing cooperatives or other organisations, fishers can formally
cooperate to promote and protect their interests and have a representative body to communicate
with government and other bodies.
6.6 Regional coordination
Due to the transboundary nature of the fisheries, management decisions and policies created by
one government will not materialise in a vacuum, but will have some impact on those of the
other government. Therefore, bilateral coordination and the sharing of information and
management tools would drastically improve the effectiveness of management decisions. Many
of the efforts of the Grenada government to improve the fishery were well executed and these
can be replicated by the Vincentian government. Policy makers in both governments should
examine how fishers exploit the resource, what tools they have available to them and the threats
and opportunities that affect their livelihoods. This is important to reducing the vulnerability of
the fishermen to natural and anthropogenic shocks (e.g. hurricanes, loss of boats, increased oil
prices, etc.) and to ensure that the industry moves forward sustainably.
57
7 REFERENCES
Baldwin, K. 2006. Summary report for the Data Scoping of the Grenadine Bank Marine Space
Use Information System (MarSIS). 14pp.
Bellmar, H. 2006. Personal Communication. Port Elizabeth, Bequia, St. Vincent and the
Grenadines. 23rd May 2006.
Bequia Tourism Association. 2006. Bequia History. http://www.bequiatourism.com (accessed 18
August 2006).
Bunce, L., P. Townsley, R. Pomeroy and R. Pollnac. 2000. Socio-economic Manual for Coral
Reef Management. Australian Institute of Marine Science. 252pp.
Bunce, L. and R. Pomeroy. 2003. Socio-economic Monitoring Guidelines for Coastal Managers
in the Caribbean: SocMon Caribbean. Global Coral Reef Monitoring Network. 88pp.
Caribbean Conservation Association. 1991. St. Vincent and the Grenadines country
environmental profile. Island Resources Foundation. St. Vincent. 222 pp.
CERMES. 2005. Sustainable Integrated Development and Biodiversity Conservation in the
Grenadine Islands. Centre for Resource Management and Environmental Studies
(CERMES), University of the West Indies, Cave Hill Campus, Barbados.
http://cermes.cavehill.uwi.edu/susgrenadinesnew.html (accessed 13 June 2006).
CERMES. 2006. Report of the Fisherfolk Planning Workshop on February 15-16, 2006,
Mayreau, St. Vincent and the Grenadines. 14pp.
Chakallal, Y., R. Mahon, R. Ryan and H. Oxenford. 1994. Fish Exporting in the Grenadine
Islands: Activities of Trading Vessels and Supplying Fishers. CARICOM Fishery Research
Document No. 17. 84pp.
Comley, J., M. Mason, K. Cordice and P. Raines. 2002. Tobago Cays Marine Biodiversity
Conservation Project Summary Report. Coral Cay Conservation Ltd. 18pp.
Cooke, A , R. Mahon and P. McConney 2005. A livelihood Analysis of the Watertaxi Operators
in the Grenadines. Centre for Natural Resource Management and Environmental Studies
(CERMES), University of the West Indies, Cave Hill Campus, Barbados. 45pp.
CRFM. 2004. Report Of The Reef And Slope Fish Resource Working Group (RSWG) in Report
of the first Annual Caribbean Regional Fisheries Mechanism (CRFM) Scientific Meeting 22
� 30 June 2004, Belize City, Belize. CRFM Fishery Report No. 11. 103pp.
Culzac-Wilson, L. 2003. St. Vincent and the Grenadines: Report to the Regional Consultation
on SIDS Specific Issues. 101pp.
ECLAC. 2004. Yachting in the Eastern Caribbean. Economic Commission for Latin America
and the Caribbean (ECLAC) Technical Report LC/CAR/R.75. 286 pp.
Finlay, J. 1999. Assessment and Analysis of Fisheries, Marine and Coastal Areas. National
Biodiversity Strategy and Action Plan for Grenada, Carriacou and Petit Martinique. 94pp.
Fisheries Division. n.d. Hurricane Hints for Fishers & Boat Owners. Fisheries Division, Ministry
of Agriculture and Fisheries, St. Vincent and the Grenadines.
FIGIS. 2001. Fisheries Global Information System (FIGIS) Country Profile Fact Sheet: St.
Vincent and the Grenadines. http://www.fao.org/figis/servlet/static?dom=country
&xml=fims_vc.xml (accessed 21 September 2006).
58
Food and Agriculture Organisation. 2000a. Fishery Country Profile: Grenada.
http://www.fao.org/fi/fcp/en/GRD/profile.htm (accessed 16 June 2006).
Food and Agriculture Organization. 2000b. Information on Fisheries Management in Grenada.
http://www.fao.org/fi/fcp/en/GRD/body.htm (accessed 18 August 2006).
Food and Agriculture Organisation. 2002a. Fishery Country Profile: St. Vincent and the
Grenadines. < http://www.fao.org/fi/fcp/en/ VCT/profile.htm> (accessed 14 June 2006)
Food and Agriculture Organization. 2002b. Information on Fisheries Management in St. Vincent
and the Grenadines. http://www.fao.org/fi/fcp/en/VCT/BODY.HTM. (accessed 18 August
2006).
Goreau, T. and N. Sammons. 2003. Water Quality in Ashton Harbour, Union Island, St. Vincent
& the Grenadines: Environmental Impacts of Marina and Recommendations for Ecosystem
and Fisheries Restoration.
Global Coral Reef Alliance.
http://www.globalcoral.org/Water%20Quality%20in%20Ashton%20Harbour.htm (accessed
18 August 2006).
Government of Grenada. 2005. The Ministry of Agriculture, Grenada.
http://agriculture.gov.gd/newsitem.aspx?nid=1030 (accessed 18 August 2006)
Jardine, C. and L. Straker. 2003. Fisheries Data Information Document, St. Vincent and the
Grenadines. Fisheries Division, Ministry of Agriculture, Forestry and Fisheries, in St.
Vincent and the Grenadines. 52pp.
Kirby-Straker, R. 2003. Fisheries Resources & Regulations in St. Vincent and the Grenadines.
Fisheries Division, Ministry of Agriculture and Fisheries, St. Vincent and the Grenadines.
Lizama, D., P. McConney and R. Mahon 2005. Assessing Sustainable "Green Boat" Practices of
Water Taxi Operators in the Grenadines. Centre for Natural Resource Management and
Environmental Studies (CERMES), University of the West Indies, Cave Hill Campus,
Barbados. 43pp.
Logan, D. 2001. The Socio-Cultural History of Petite Martinique: A Fishing Island Community.
Petite Martinique, Grenada. 120pp.
McConney, P. 2003a. Grenada Case Study: The Lobster Fishery at Sateurs. Caribbean Coastal
Co-management Project. Caribbean Conservation Association, Barbados. 60pp.
McConney, P. 2003b. Legislation of Beach Seine Traditional Rules at Gouyave. Caribbean
Coastal Co-management Project. Caribbean Conservation Association, Barbados. 64pp.
Miller Publishing Company. 2004a. Ins and Outs of St. Vincent and the Grenadines: History of
Canouan. http://www.insandoutssvg.com/article.aspx?articleid=73&zone=History (accessed
21 September 2006).
Miller Publishing Company. 2004b. Ins and Outs of St. Vincent and the Grenadines: History of
Mustique. http://www.insandoutssvg.com/article.aspx?articleid=81&zone=History
(accessed 21 September 2006).
Mohammed, E. and J. Rennie, 2003. Grenada and the Grenadines: Reconstructed Fisheries Catch
and Fisheries Effort, 1942-2001. Fisheries Centre Research Reports (2003). 11(6). 67-93pp.
59
Mohammed, E., L. Straker, and C. Jardine. 2003. St. Vincent and the Grenadines: Reconstructed
Fisheries Catch and Fisheries Effort, 1942-2001. Fisheries Centre Research Reports (2003).
11(6). 95-116pp.
Perez, A. 2003. Assessment of socio-economic conditions at Placencia, Hopkins and Monkey
River in Belize. Caribbean Coastal Co-management Project. Centre for Natural Resource
Management and Environmental Studies, University of the West Indies, Cave Hill Campus,
Barbados. 30pp.
Price, S. and P. Price.1998. Paradise Lost. A Post-mortem of the Ashton Lagoon, Union Island,
St. Vincent and the Grenadines. 30pp.
Price W. & Govindarajulu P. 1998. Nearshore Marine Resources of Carriacou, Petite Martinique
& Outlying Islands; Status, Concerns, & Recommendations. Prepared for the Government
of Grenada Physical Planning Unit. 113pp.
Statistical Division. 2006. Grenada Fish Landings. Statistical Division, Ministry of Agriculture,
Grenada.
Statistical Office. 2001. St. Vincent and the Grenadines Population and Housing Census Report
2001. Central Planning Division, Ministry of Finance, Planning and Development,
Kingstown, St. Vincent and the Grenadines. 131pp.
Sustainable Grenadines Project. 2005. Sustainable Integrated Development and Biodiversity
Conservation in the Grenadine Islands � Overview. Clifton, Union Island, St. Vincent and
the Grenadines. 7 pp.
Villareal, L.V.; Kelleher, V. (ed.); Tietze, U. (ed.). 2004. Guidelines on the collection of
demographic and socio-economic information on fishing communities for use in coastal and
aquatic resources management. FAO Fisheries Technical Paper. No. 439. Rome, FAO.
120p.
Walters, J.S., J. Maragos, S. Siar, and A.T. White. 1998. Participatory Coastal Resource
Assessment: A Handbook for Community Workers and Coastal Resource Managers.
Silliman University, Centre for Excellence in Coastal Resource Management. 228 pp.
Whale and Dolphin Conservation. n.d. Humpback Whaling in St Vincent and the
Grenadines.http://www.wdcs.org/dan/publishing.nsf/allweb/77C0710457C0872E802568F1
00334D1D (accessed 21 September 2006).
60
8 APPENDICES
Appendix 1: Rapid assessment survey
Rapid Assessment/Inventory Survey
Location: ___________________
Respondent #:________________
Date: ________________
Respondent Information & Fishing Practices
1. a) Respondent name:_______________________ b)
M
F
2. a) Age: ________ b) Address: ________________________________
3. a) Is fishing your primary occupation?
Y
N
b) Do you get most of your income from fishing?
Y
N
c) What percentage of your income is from fishing? _______%
4. How long have you been fishing (years)? _______
Boat Information
5. Name of Boat:___________________ Registration Number:____________
6. a) Name of Owner:____________________
b)
M
F
7. Average number of crew working on boat: __________
8. Name and sex of other crew:
__________________________________ __________________________________
__________________________________ __________________________________
9. What gear is used on the boat?
__________________________________________________________________
10. Length of Boat: _______
11. Type of Boat (wood, fibreglass, pirogue, cigarette, flatstern, other):
__________________________________.
12. # of engines: ____ Brand: _____________________ Horsepower ________
Brand: _____________________ Horsepower ________
13. Where do you operate from? ______________________________________
14. What kind of fishing do you do? What islands do you mostly fish around?
15. a) Do you know of any places where fish gather to breed?
Y N
b) What kind of fish? __________________________________________
c) Location/s _________________________________________________
16. Will you be willing to take part in a more in depth interview? Y N
Contact Info: ____________________________________________________
61
Appendix 2: In-depth survey
Detailed Interview for Collecting
Socio-economic data on Grenadine Fisheries
The purpose of this study is to gather detailed socio-economic information on fishing in the
Grenadines. This looks at how you fish, sell your fish, fishing expenses and other aspects of your
livelihood. Information on individuals will not be shared or reported.
1. Respondent #:_______________ Location_______________ Date__________
Resource Use Patterns: This looks at the different types of fishing that you do and where
and when you fish.
2. Are you a: boat owner captain crew member solo fisher
3. How many fishing trips do you make per week?
J F M A M J J A S O N D
4. This table looks at how you would normally fish.
Species Group Average Average lbs Where species
Gear Used What months
hours
caught per
are caught
fished
trip
(island)
per trip
1.
2.
3.
4.
5.
6.
62
Goods and Services: This section will look at how you are able to sell fish and on average
what you get for your fish. It also looks at some of the expenses of your fishing trips.
5. How and where do you sell your fish? How much do you get for the fish?
Location Species
Gro
Quantity of
up
catch so
Price
ld
Received Most About
Few
per lb
Half
1
1
2
3
4
2
1
2
3
4
3
1
2
3
4
4
1
2
3
4
6. Reasons for selling to different merchants:
Location
Reliable Price Convenience Other reason(s)
buyers
1
2
3
4
7. How many boats do you own? ______
63
8. What fishing gear do you own?
__________________________________________________________________-
__________________________________________________________________
9. What was the initial cost of the :
boat $__________
engine $___________
gear $____________
10. What are the average costs of the following (per trip):
Item
Amount
Cost
Fuel and oil
Gear
Bait
Food
11. How often do you service engine? __________ Bottom Paint? __________
12. Cleaning of Boats: Where? _______________ With? _____________ How Often?
___________
13. What are some of your other fishing costs? (e.g. insurance, repairs)
Repairs
$_________ per mth yr
Insurance
$_________ per mth yr
Gear
$_________ per mth yr
Other:_____________
$_________ per mth yr
Other:_____________
$_________ per mth yr
14. If you have a share system in place (for crew), how is the money distributed?
______________________________________________________________
Demographic Information: This is some personal information that will help us to know
more about the fishers.
What is your marital status?
64
Single Married Common
law Divorced Other:___________
15. What was the last school you went to?
Primary Secondary Post
Secondary
Professional/ Vocational/ Training
16. Ethnicity:
African/Negro/Black
Carib
East Indian
Mixed White/Caucasian Other: _____________
17. What is your religion?
Anglican Pentecostal Seven- day Adventist Roman Catholic Jehovah Witness
Methodist Other:_________________
18. What are your four main sources of income in the past year? (Ranked and give proportion)
1. _____________________________
________ %
2. _____________________________
________ %
3. _____________________________
________ %
4. _____________________________
________ %
19. Are you the main provider for the household? Y
N
20. This table looks at who lives in your house and their occupations:
Household Members (in
Age Gender Primary
occupation Secondary
relation to household
occupation
head)
Material style of life: This section looks at some aspects of your quality of life..
21. Do you own land? Y
N
22. Is your house you live in:
Your own
rented family
/friends
65
23. Type of roof:
galvanized
shingle
24. Type of outside structural walls:
concrete wood
25. Type of Floor covering:
Tile cement bare wood dirt vinyl
carpet
26. Does your household have:
electricity vehicle TV telephone stove washing machine refrigerator
VCR/DVD computer
66
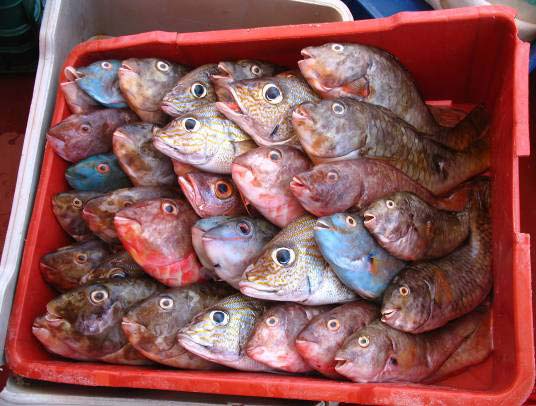
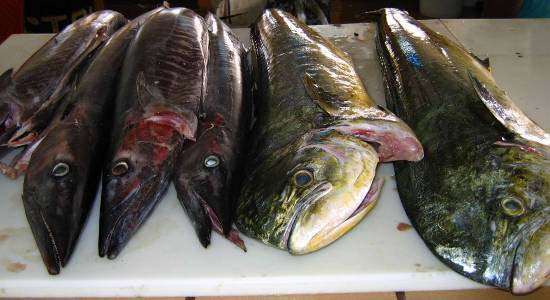
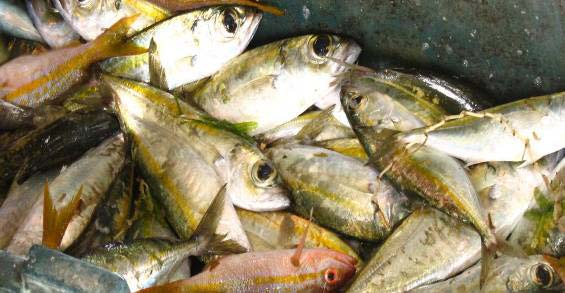
Appendix 3: Species groups
Demersals
Major species:
Hinds,groupers,
butterfish (Serranidae),
snappers (Lutjanidae.),
parrotfish (Scaridae)
Description/
bottom dwelling; found
Habitat:
on shallow shelf, and the
deep slope
Fishing method/ handline, bottom
Gear used:
longlining (sinking
palang), traps, spear gun
(free diving and scuba)
Seasonality:
All year
Offshore pelagics
Major species:
dolphinfish (Coryphaena
hippurus),yellowfin tuna
(Thunnus albacares)
kingfish (Scomberomorus
cavalla), barracuda
Description/
migratory species; found
Habitat:
miles offshore
Fishing method/ towing, surface longlining
Gear used:
(floating palang)
Seasonality:
All year, mostly January
to May/June
Inshore pelagics
Major species:
Robins (Decapterus sp.),
jacks (Carangidae)
Description/
pelagic; found along the
Habitat:
coastline
Fishing method/
beach seine, cast net
Gear used:
Seasonality:
All year
67
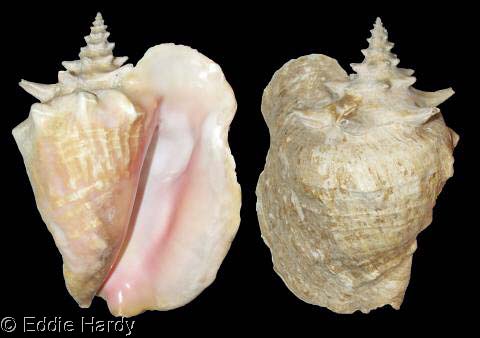
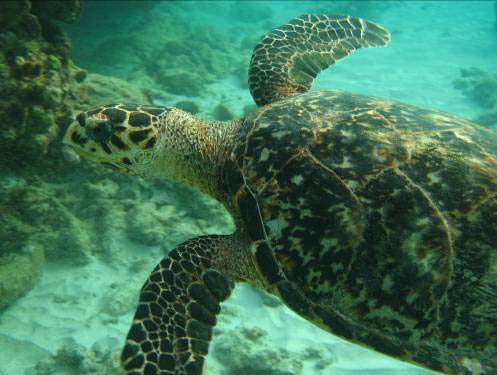
Lobster
Major species:
Caribbean spiny lobster
(Palinuris argus)
Description/
benthic; found in reef
Habitat:
crevices on shallow shelf
Fishing method/
scuba and free diving
Gear used:
using wire nooses
("jigs"), traps, gillnets
Seasonality:
September-April
Conch
Major species:
Queen conch (Strombus
gigas), milk conch
(Strombus costatus).
Description/
benthic; found mainly in
Habitat:
sea grass beds
Fishing method/
scuba and free diving
Gear used:
Seasonality:
All year (opportunistic)
Turtles
Major species:
hawksbill turtle
(Eretmochelys imbricata),
green turtle (Chelonia
mydas)
Description/
pelagic and migratory;
Habitat:
Green turtles found on
seagrass beds, hawksbills
on reef
Fishing method/
spear, onshore while
Gear used:
nesting
Seasonality:
Whales and Porpoises
Major species:
humpback whale, pilot
whales
Description/
pelagic and migratory;
Habitat:
migrates from the north
during the winter months
Fishing method/
traditional harpoon in a
Gear used:
small double ender boat
Seasonality:
February - April
Image Source: http://www.adfg.state.ak.us/pubs/notebook/marine/hbwhale.gif
68
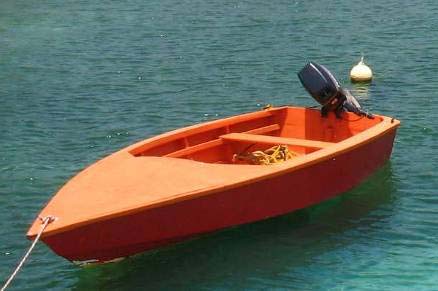
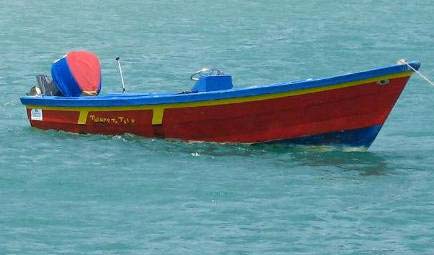
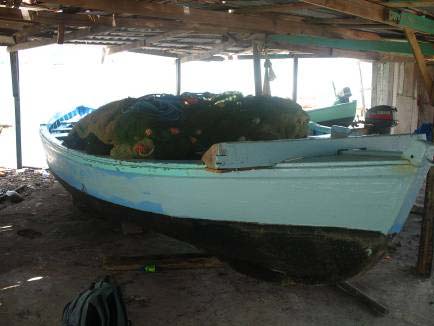
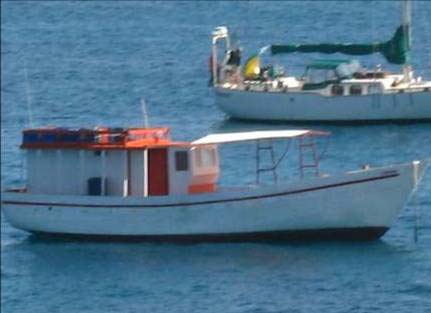
Appendix 4: Boat types
Bow and Stern (Cigarette/Speedboat)
Description:
Pointed bow and flat stern
Length range:
11-27ft
Width range:
3-7ft
Horsepower range: 14-115hp
Type of fishing:
Handline, trolling, floating
and sinking palang, traps,
spear (scuba and
barewind)
Pirogue
Description:
Higher bow than the
speedboat
Length range:
19-30ft
Width range:
4-10ft
Horsepower range: 40-85hp
Type of fishing:
Trolling & demersals
fishery
Double-ender
Description:
Two bows, canoe-shaped
Length range:
10-29ft
Width range:
4-8ft
Horsepower range: 6-48hp (Mainly oars)
Type of fishing:
Beach seine fishery
Sloop/Longliner
Description:
Most have mechanical
equipment for hauling
lines on board
Length range:
34.7-48.5ft
Width range:
9.7-15.9ft
Horsepower range: 90-190hp (inboard diesel
engine)
Type of fishing:
Surface longlining for
tuna, trolling, and bottom
longlining
69