|
1
|
- Dr. Antanas Sigitas ŠILEIKA
- Water Management Institute
- Sigitas@water.omnitel.net
- 2004 09 14
|
|
2
|
|
|
3
|
|
|
4
|
|
|
5
|
|
|
6
|
|
|
7
|
|
|
8
|
|
|
9
|
|
|
10
|
- Phosphorus concentration dropped down below eutrophication level 0,05
mg/l;
- Ammonium nitrogen concentration now is below permitted limit 0,39 mg/l;
- Meantime concentration of nitrate nitrogen increased and still is higher
than before 1990 in agricultural rivers.
|
|
11
|
|
|
12
|
|
|
13
|
|
|
14
|
|
|
15
|
|
|
16
|
|
|
17
|
|
|
18
|
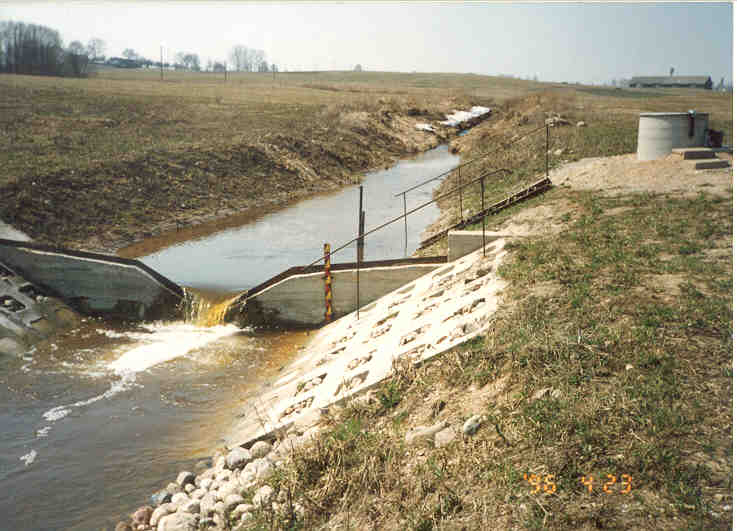
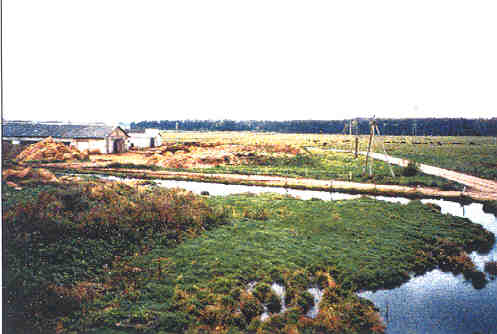
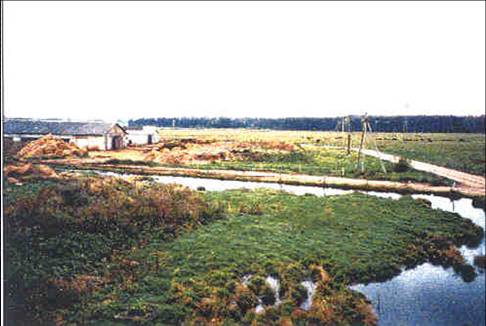
- Thompson weirs are used for flow measurements in streams. Water level is
registered automatically by limnigraphs;
- The river water samples are taken manually every day. Joint weekly
samples are analysed in spring and joint monthly sample at another time
of the year;
- The concentration of nutrients and average monthly values of the river
water flow are used for calculation of nutrient losses;
- Tipping buckets are used for drainage flow measurements.
|
|
19
|
|
|
20
|
|
|
21
|
|
|
22
|
- The highest N losses (15.3 kg N ha-1) determines more
intensive agricultural activity in Graisupis (71.5 kg N ha-1
of fertilisers; 54% of arable land; 0.87 LU ha-1);
- Close to the sea (Lyzena) are bigger water discharges in winter but due
to low N content in soil (32.9 kg N ha-1 of fertilisers, 74%
of grassland) the annual N losses are very small (5.7 kg N ha-1);
- The highest P losses (0.318 kg P ha-1) determine Vardas hilly
relief and clay soil;
- Bigger specific water runoff
(0.08 l s-1 ha-1) and light soils (sandy loam) determine
comparatively high N losses (11.9 kg N ha-1) despite low
farming activity (39.4 kg N ha-1 of fertilisers, 45% of
grassland) in Vardas watershed.
|
|
23
|
|
|
24
|
|
|
25
|
|
|
26
|
|
|
27
|
|
|
28
|
|
|
29
|
|
|
30
|
|
|
31
|
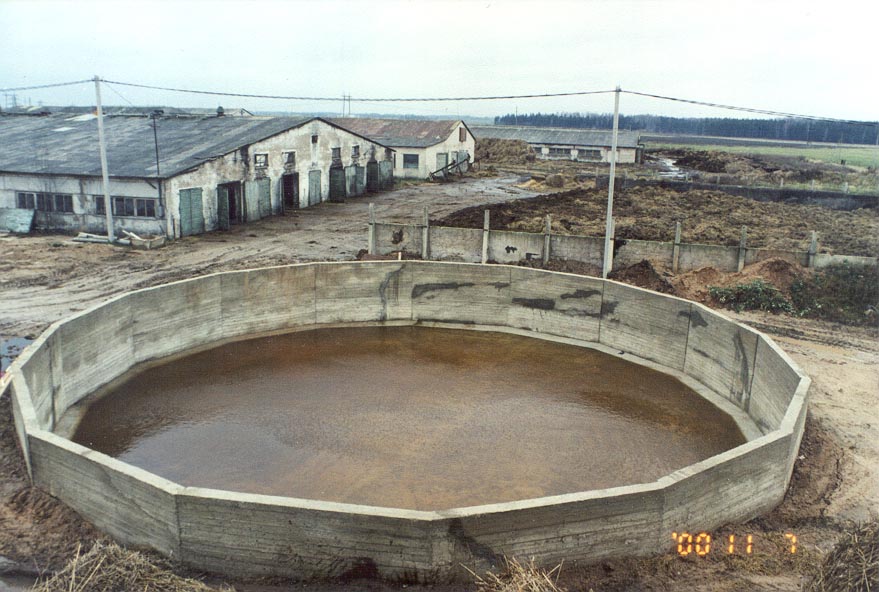
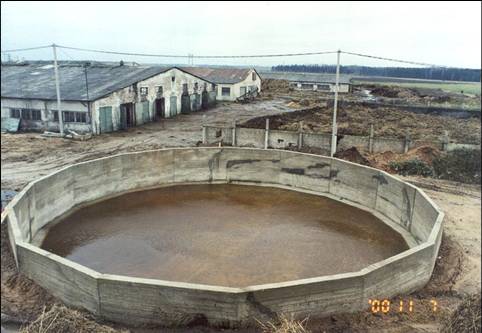
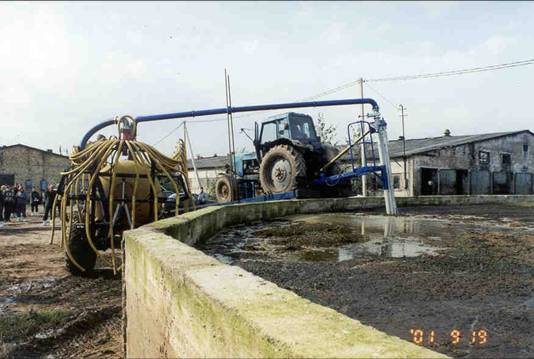
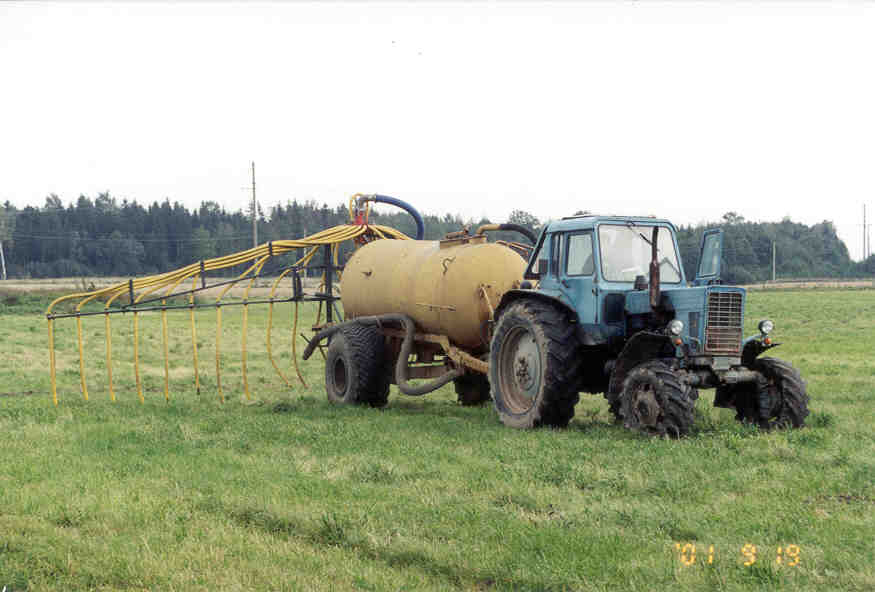
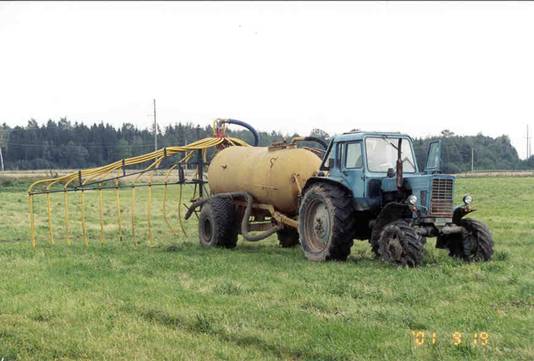
- To establish manure storages on large farms with more than 300 AU as
well as on newly established farms having over 150 AU within a 4-year
period after entering the EU
- All the rest farms with more than 10 AU endangering the environment with
nitrates will also have to reconstruct their barns later.
|
|
32
|
|
|
33
|
|
|
34
|
|
|
35
|
|
|
36
|
|
|
37
|
|
|
38
|
|
|
39
|
|
|
40
|
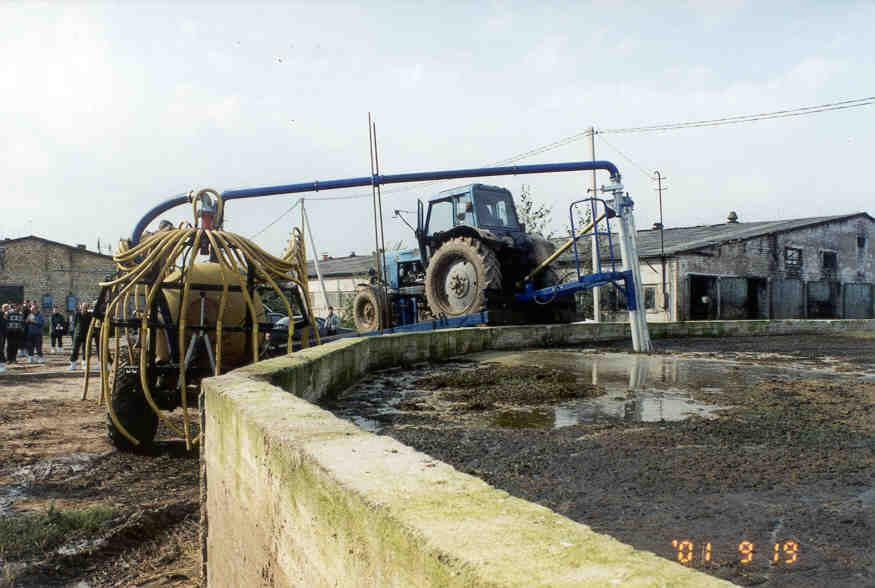
- Number of farms – Ctl 1450 and Pig 49
- Manure pads need – Ctl 446.5 thou m2
- Slurry reservoirs need – Ctl 472.7 thou m3 and Pig 39.8 thou
m3
- Manure pads construction cost– Ctl
22.5 M EUR
- Slurry reservoirs cost – Ctl 50.8 M EUR
and Pig 4.6 M EUR
- Total cost – 78.0 M EUR
|
|
41
|
|
|
42
|
|

 Notes
Notes